Embed Size (px)
Citation preview

Changing Climate, Changing Watersheds
Watershed ManagementCouncil Networker
Watershed ManagementCouncil Networker
Advancing the art & science of watershed management
Spring 2005
This spectacular “blue marble” image is the most detailed true-color image of the entire Earth to date. Using
a collection of satellite-based observations, scientists and visualizers stitched together months of observations
of the land surface, oceans, sea ice, and clouds into a seamless, true-color mosaic of every square kilometer
(.386 square mile) of our planet. These images are freely available to educators, scientists, museums, and the
public. This record includes preview images and links to full resolution versions up to 21,600 pixels across.
*Credit* NASA Goddard Space Flight Center Image by Reto Stöckli (land surface, shallow water, clouds).
Enhancements by Robert Simmon (ocean color, compositing, 3D globes, animation). Data and technical
support: MODIS Land Group; MODIS Science Data Support Team; MODIS Atmosphere Group; MODIS
Ocean Group Additional data: USGS EROS Data Center (topography); USGS Terrestrial Remote Sensing
Flagstaff Field Center (Antarctica); Defense Meteorological Satellite Program (city lights).
WATERSHED MANAGEMENT COUNCILNETWORKER
A publication of the Watershed Management Council
c/o EcoHydraulics Research Center University of Idaho – Boise
322 E. Front Street, Suite 340 Boise, Idaho 83702
www.watershed.org
BOARD OF DIRECTORSBob Nuzum, President [email protected] Bruce McGurk, President-elect [email protected] Bergman, Secretary [email protected] K.-Henry, Treasurer……[email protected]
MEMBERS AT LARGENeil Berg [email protected] Coats [email protected] Cobourn [email protected] Gould [email protected] Neuman [email protected] Slaughter [email protected] Wellborn [email protected]
NEWSLETTER AND WEBSITENETWORKER Guest Editor (Your name can be here!)Michael Furniss, Webmaster: [email protected]
MEETING DATESThe WMC Board of Directors meets quarterly, electronically or in person. All WMC members are welcome to attend. Contact a board member to arrange to attend a meeting or discuss any ideas or issues for the Council.
MEMBERSHIPDues are $30 per year. Please use the membership application form on the back page of this issue to join, or join at www.watershed.org (we accept PayPal). For inquiries or subscription questions call or e-mail Sheila Trick at 208-364-6186, [email protected].
SUBMISSIONS WELCOMEThe WMC Networker welcomes all submissions. All copyrights remain with the authors. Email or disk versions are appreciated. Please keep formatting to a minimum. Send submissions to WMC President Bob Nuzum at [email protected], to Chuck Slaughter, Networker Editor at [email protected], or to WMC Coordinator Sheila Trick at [email protected].
President’s Column
Advancing the Art and Science of Watershed Management. To assist us in this goal the Watershed Management Council held its 10th Biennial Conference at the Double Tree Hotel in San Diego, California, from November 15 through 19, 2004.
For those of you who have not logged on to our new web site please do so. The site has been restructured by Mike Furniss to provide the information WMC members said they wanted to see. Just log on to www.watershed.org, to post items of interest, check out discussion rooms and new watershed positions, review past Networkers and Conference Proceedings, and help us make this a truly interactive tool for exchanging watershed information.
Remember, the Watershed Management Council office is located in the Idaho Water Center in Boise, Idaho. The WMC is indebted to the University of Idaho for making this office space available. WMC Coordinator Sheila Trick can be reached by phone at (208) 364-6186, by fax at (208) 332-4425 or by e-mail at [email protected]. Or, you can reach me at (925) 688-8028 or by e-mail at [email protected].
I would like to suggest several other web sites that you can visit that will provide valuable and up-to-date information on water quality, water supply, drought impacts and watershed management:
a) www.google.com -- Sign up for receiving daily Google Alerts on watershed management, fisheries management, grazing management, etc.
b) www.bcwaternews.com -- Sign up for receiving weekly up-dates on regional water and watershed issues along the Pacific Coast (put out by Brown and Caldwell).
c) www.stewardshipcouncil.org -- Or call Lisa Whitman @ (650) 286-5150 for information on PG&E Land Stewardship Council activities in California (44,000 acres of PG&E land that may be managed and/or sold to other entities).
d) www.cbbulletin.com -- Tribal interests, federal and state resource agencies, Bonneville Power Interests, university involvement and a host of political representatives, private entities and environmental groups interested in the Columbia River Watershed Basin.
In the last quarter the Council adopted a two-year budget, renewed our contract with the University of Idaho, invited a number of interested people to join the Council and is now considering a northern California field trip for this fall.
Bob Nuzum

INTRODUCTION Over the last decade, a broad consensus has developed among climate and earth scientists on the main issues of global climate change1. There is now general agreement that 1) the earth’s atmosphere and oceans are warming; 2) the primary cause of the warming is anthropogenic greenhouse gases; and 3) the consequences for natural systems and human civilization over the next century will fall somewhere between serious and catastrophic. The Earth is now absorbing on average 0.85 W/m2 more solar radiation than it is emitting back to space. Even if all greenhouse gas emissions ceased today, the Earth would continue to gain another 0.6 oC in average temperature2. As watershed managers and scientists, we have to ask: what will be the impacts of climate change on our watersheds and the benefits they provide? What kinds of management decisions will we face as a consequence of the warming trend? In this issue, we offer four articles that address specific aspects of these questions. Dan Cayan and his colleagues at USGS/Scripps show how the warming trend in the Sierra Nevada is affecting the timing of snowmelt and the future water supply for California and northern Nevada. Donald MacKenzie and his colleagues at the Pacific Wildland Fire Sciences Laboratory address the issue of fire frequency and magnitude in the west, and how it is likely to be affected by global warming. Joan Florsheim and Michael Dettinger address potential geomorphic impacts associated with a combined sea level rise and changes in flooding in the Central Valley, and scientists from the U.C. Davis Tahoe Research Group report on the causes and likely consequences of the warming trend in Lake Tahoe. These articles barely scratch the surface of the problem. Our hope is that the readers of The Networker will be stimulated to explore further, using the references cited, and the virtually limitless resources available on the Internet. Robert Coats, Guest Editor 1Oreskes, N. Science 2004. The scientific consensus on climate change. Science 306:1686. 2Hansen, J. et al. 2005. Earth’s energy imbalance: confirmation and implications. Science 308:1431-1435
RECENT CHANGES TOWARDS EARLIER SPRINGS: EARLY SIGNS OF CLIMATE WARMING IN WESTERN NORTH AMERICA? Daniel Cayan, Michael Dettinger, Iris Stewart and Noah Knowles U.S. Geological Survey, Scripps Institution of Oceanography, La Jolla CA 92093 The shift toward earlier spring onsets By several different measures, in recent decades there has been a shift toward earlier spring onset over western North America. Warmer winters and springs (Dettinger and Cayan 1995; Cayan et al. 2001), trends for more precipitation to fall as rain rather than snow (Knowles et al., in review), an advance in the timing of snowmelt and snowmelt-driven streamflow (Roos, 1987; 1991; Dettinger and Cayan, 1995; Cayan et al., 2001; Regonda et al 2005; Stewart et al. 2005), less spring snowpack (Mote 2003; Mote et al. 2005), and earlier spring plant “Greenup” (Cayan et al. 2001) have been observed. Figure 1a shows that spring temperature has warmed by 1-3˚C over most of the western region since 1950, and Figure 1b (from Stewart et. al. 2005) shows that many of the snowmelt watersheds in Alaska, western Canada and the western conterminous United States have shifted toward earlier spring flows, while a few have shifted to later. Trends are strongest in mid-elevation areas of the interior Northwest, western Canada, and coastal Alaska. The months in which the largest changes in streamflow contributions have been seen are March and April in the western contiguous U. S. and April and May in Canada and Alaska. The largest trends found at stream gages in the western contiguous U. S. are March and April, while largest trends at gages in Canada and Alaska were found in April and May. Part of the long-term regional change in streamflow timing can be attributed to the long, slow natural climatic variations typical of the Pacific Basin.
Changing Climate, Changing Watersheds

4 WMC Networker Spring 2005
Figure 1. Trends in (a) spring temperature and (b) date of center of mass of annual flow (CT) for snowmelt (main panel) and non-snowmelt dominated gages (inset). The shading indicates magnitude of the trend expressed as the change [days] in timing over the 1948-2000 period. Larger symbols indicate statistically significant trends at the 90% confidence level. _______________________________
Variations currently are indexed in terms of an ocean-index called the Pacific Decadal Oscillation (PDO; Mantua et al. 1997). The PDO, which varies on multi-decade time’s scales, is associated with multi-decade swings in temperature across the West. The 1976-77 PDO shift to warmer winters and springs in the eastern North Pacific and western North America (following a 1940’s to 1976 cooler period) is consistent with the observed advance toward earlier spring snowmelt over the region. However, the PDO shifted back to its cool phase in 1999 and remained in this cool phase until at least 2002. This reversal did not slow the trends towards warmer temperatures or earlier flows in most of western North America, except for a comparatively small area in the Pacific Northwest and southwestern Canada, which historically have been most strongly connected to the PDO (Stewart et al. 2005).
These findings (together with others presented in Stewart et al. 2005) indicate that the PDO is not sufficient to fully explain the observed temperature and snowmelt-streamflow timing trends in the West. In the Pacific Northwest, where PDO is most climatically influential on several time scales, the PDO’s contribution to recent warming trends has been the largest. But, elsewhere, the PDO explains less than half of the warming influences and snowmelt responses. However, disentangling the natural climatic fluctuations from other possible causes of recent trends remains a challenge. Thus, continued attention to the trends described here and their continuing (or possibly diverging) relations to PDO will be necessary.
Climate model projections
Looking forward, though, in the near future, western North America’s climate is projected to experience a new form of climate change, due to increasing concentrations of greenhouse gases in the global atmosphere from burning of fossil fuels and other human activities. If the changes occur, they presumably will be added onto the same kinds of large inter-annual and longer-term climate variations that have characterized the recent and distant pasts. The projected changes include much-discussed warming trends, as well as important changes in precipitation, extreme weather and other climatic conditions, all of which may be expected to affect the mountainous West, including for example, Sierra Nevada rivers, watersheds, landscapes, and ecosystems. Simulated temperatures in climate-model grid cells over Northern California begin to warm notably by about the 1970s in response to acceleration in the rate of greenhouse-gas buildup in the atmosphere then, and are projected to warm by about +3ºC during the 21st Century (Fig. 2a). The temperatures shown here were simulated by the coupled global atmosphere-ocean-ice-land Parallel Climate Model (PCM; http://www.ced.ucar.edu/pcm) in response to historical and projected “business-as-usual” (BAU) future concentrations of greenhouse gases and sulfate aerosols in the atmosphere (as part of the DOE-funded Accelerated Climate Prediction Initiative Pilot Study). The model yields global-warming projections that are near the cooler end of the spectrum of projections made by modern climate models (Dettinger 2005), and thus represent changes that are relatively conservative. Projections of precipitation change over Northern California are small in this model, amounting in the simulation shown (Fig. 2b) to no more than about a 10% increase. Notably, though, other projections by the same model with only slightly different initial conditions yield small decreases rather than increases. Thus we interpret the precipitation change in the projection examined here
(a)
(b)

as “small” without placing much confidence in the direction of the change. Even more generally, there is essentially no consensus among current climate models as to how precipitation might change over California in response to global warming, although projections of small precipitation changes like those shown here are most common (Dettinger 2005). In light of these precipitation-change uncertainties, we focus below on the watershed responses that depend least upon the eventual precipitation changes.
Fig. 2. Simulated annual mean temperatures (a) and precipitation (b) in Parallel-Climate Model grid cells over northern California, from 1900-2100, where the historical simulation is forced with observed historical radiative forcings and the business-as-usual future simulation is forced with greenhouse-gas increases that are extensions of historical growth rates. Straight lines are linear-regression fits.
Potential changes in the western hydroclimate
River-basin responses to such climate variations and trends in the Sierra Nevada have been analyzed by simulating streamflow, snowpack, soil moisture, and water-balance responses to the daily climate variations spanning a 200-year period from the PCM’s historical and 21st Century BAU simulations. Watershed responses
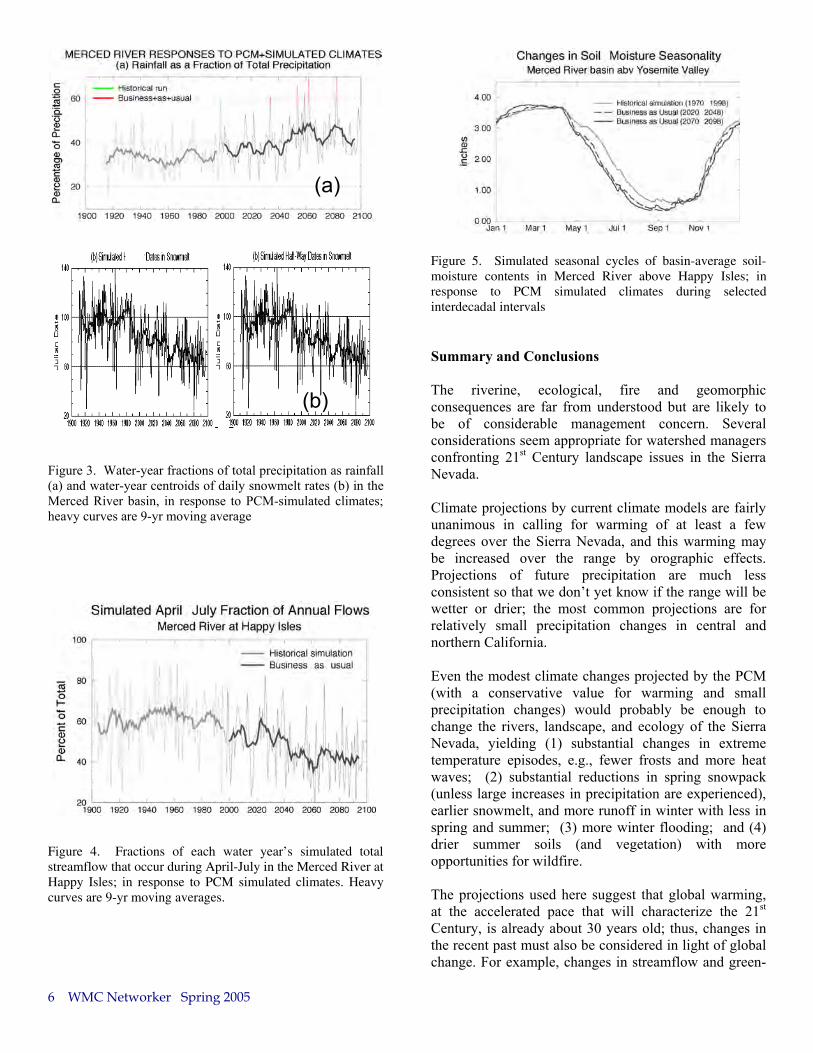
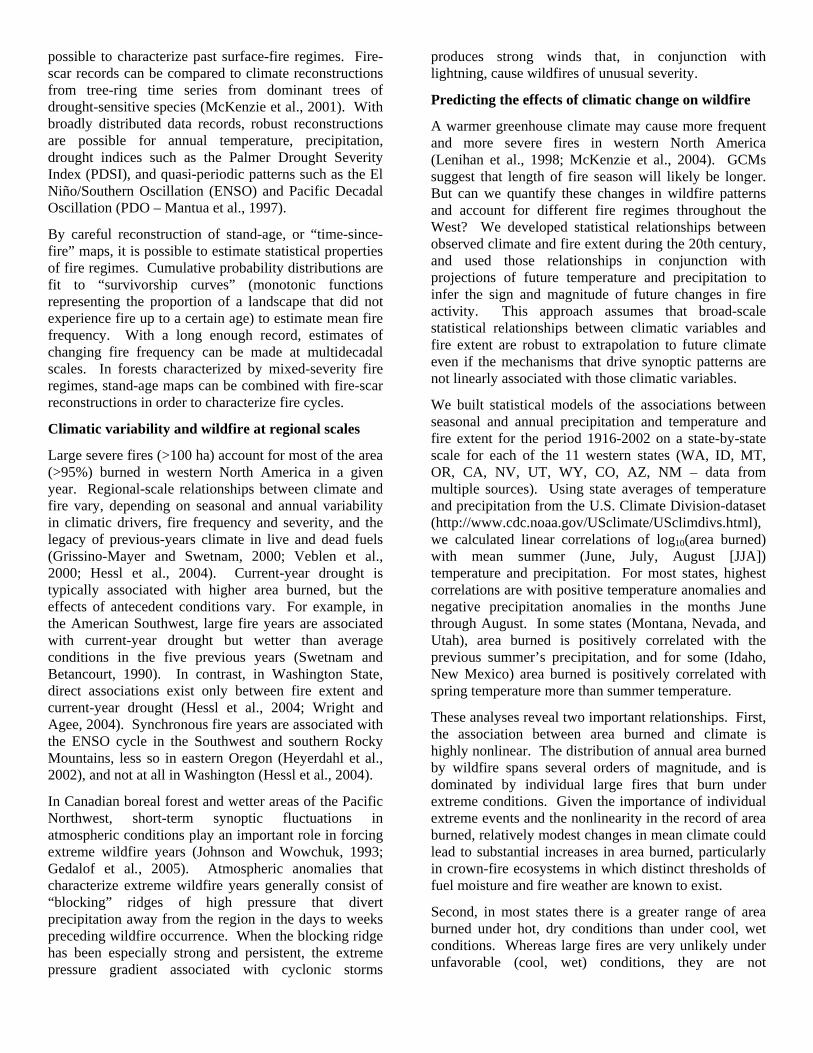
were simulated with spatially detailed, physically based watershed models of several Sierra Nevada river basins, but are discussed here in terms of results from a model of the Merced River above Happy Isles Bridge at the head of Yosemite Valley. The historical simulations yield stationary climate and hydrologic variations until the 1970’s when temperatures begin to warm noticeably. This warming results in a greater fraction of simulated Sierra Nevada precipitation falling as rain rather than snow (Fig. 3a), earlier snowmelt (Fig. 3b), and earlier streamflow peaks. The projected future climate variations continue those trends through the 21st Century with a hastening of snowmelt and streamflow within the seasonal cycle by almost a month (see also Stewart et al 2004). By the end of the century, 30% less water arrives in important reservoirs during the critical April-July snowmelt-runoff season (Fig. 4; see also Knowles and Cayan 2004). These reductions in snowpack are projected to occur in response to the warming climate under most climate scenarios (see e.g. Knowles and Cayan 2002), unless substantially more winter precipitation falls; even in that case, although enough additional snowpack could form to yield a healthy spring snowmelt, the snow covered areas still would be substantially reduced. In any event, the earlier runoff comes partly in the form of increased winter floods so that the changes would pose challenges to reservoir managers and could result in significant geomorphic and ecologic responses along Sierra Nevada Rivers. With snowmelt and runoff occurring earlier in the year, soil moisture reservoirs dry out earlier and, by summer, are more severely depleted (Fig. 5). By about 2030, the projected hydroclimatic trends in these simulations begin to rise noticeably above the realistically simulated natural climatic and hydrologic variability.
Hydrologic simulations of other river basins, hydrologic simulations at the scale of the entire Sierra Nevada, and projections of wildfire-start statistics under the resulting hydro climatic conditions indicate that the results from the simulations of the Merced River basin considered here are representative of the kinds of hydrologic changes that will be widespread in the range. Thus it appears likely that continued (or accelerated) warming trends would affect hazards and ecosystems significantly and throughout the range.
(b)
(a)
6 WMC Networker Spring 2005
Figure 3. Water-year fractions of total precipitation as rainfall (a) and water-year centroids of daily snowmelt rates (b) in the Merced River basin, in response to PCM-simulated climates; heavy curves are 9-yr moving average
Figure 4. Fractions of each water year’s simulated total streamflow that occur during April-July in the Merced River at Happy Isles; in response to PCM simulated climates. Heavy curves are 9-yr moving averages.
Figure 5. Simulated seasonal cycles of basin-average soil-moisture contents in Merced River above Happy Isles; in response to PCM simulated climates during selected interdecadal intervals
Summary and Conclusions
The riverine, ecological, fire and geomorphic consequences are far from understood but are likely to be of considerable management concern. Several considerations seem appropriate for watershed managers confronting 21st Century landscape issues in the Sierra Nevada.
Climate projections by current climate models are fairly unanimous in calling for warming of at least a few degrees over the Sierra Nevada, and this warming may be increased over the range by orographic effects. Projections of future precipitation are much less consistent so that we don’t yet know if the range will be wetter or drier; the most common projections are for relatively small precipitation changes in central and northern California.
Even the modest climate changes projected by the PCM (with a conservative value for warming and small precipitation changes) would probably be enough to change the rivers, landscape, and ecology of the Sierra Nevada, yielding (1) substantial changes in extreme temperature episodes, e.g., fewer frosts and more heat waves; (2) substantial reductions in spring snowpack (unless large increases in precipitation are experienced), earlier snowmelt, and more runoff in winter with less in spring and summer; (3) more winter flooding; and (4) drier summer soils (and vegetation) with more opportunities for wildfire.
The projections used here suggest that global warming, at the accelerated pace that will characterize the 21st
Century, is already about 30 years old; thus, changes in the recent past must also be considered in light of global change. For example, changes in streamflow and green-
(a)
(b)
(b)

up timing are already known to be widespread across most of the western states.
In light of the potential for large consequences, but recognizing the large current uncertainties, policies that promote flexibility and resilience in the face of climate changes seem prudent; policies that accommodate potential warming-induced impacts should be the first priority.
Continuations of trends toward earlier snowmelt and snowfed streamflow will increasingly challenge many water-resource management systems by modifying time-honored assumptions about the predictability and seasonal deliveries of snowmelt and runoff. Rivers where associated flood risks may change for the worse or where cool-season storage cannot accommodate lost snowpack reserves will likely be most impacted. Earlier streamflow may impinge on the flood-protection stages of reservoir operations so that less streamflow can be captured safely in key reservoirs. Almost everywhere in western North America, a 10-50% decrease in the spring-summer streamflow fractions will accentuate the typical seasonal summer drought with important consequences for warm-season supplies, ecosystems, and wildfire risks.
Together, these potential adverse consequences of the current trends heighten needs for continued and even enhanced monitoring of western snowmelt and runoff conditions and for incisive basin-specific assessments of the impacts to water supplies. An understanding of which basins will be most impacted and what those impacts will be would provide a timely warning of future changes, and assess vulnerabilities of western water supplies and flood protection. Efforts to monitor such changes may be at least as important as efforts to predict them.
References
Cayan, D. R., Kammerdiener, S.A., Dettinger, M.D., Caprio, J.M., and Peterson, D.H. 2001. Changes in the onset of spring in the western United States. Bull. Am. Met. Soc, 82:399-415.
Dettinger, M.D. 2005. From climate-change spaghetti to climate-change distributions for 21st Century California. San Francisco Estuary and Watershed Science 3(1), http://repositories.cdlib.org/jmie/sfews/vol3/iss1/art4 .
Dettinger, M. D., and D. R. Cayan. 1995. Large-scale atmospheric forcing of recent trends toward early snowmelt runoff in California. J. Climate 8:606-623.
Dettinger, M.D., D.R. Cayan, M. K. Meyer, and A. E. Jeton. 2004. Simulated hydrologic responses to climate variations and change in the Merced, Carson, and American River Basins, Sierra Nevada, California, 1900-2099. Climate Change 62:283-317.
Knowles, N., D.R. Cayan. 2002. Potential effects of global warming on the Sacramento/San Joaquin watershed and the San Francisco estuary. Geophysical Research Letters 29(18): 1891.
Knowles, N., and D. Cayan. 2004. Elevational dependence of projected hydrologic changes in the San Francisco estuary and watershed. Climatic Change 62:319-336.
Knowles, N., Dettinger, M., and Cayan, D., in review, Trends in snowfall versus rainfall for the Western United States: submitted to Journal of Climate, 20 p.
Mantua, N. J, S. R. Hare, Y. Zhang, J. M. Wallace, and R. C. Francis. 1997. A Pacific interdecadal climate oscillation with impacts on salmon production. Bull. Am. Met. Soc. 78:1069-1079.
Mote, P.W., 2003: Trends in snow water equivalent in the Pacific Northwest and their climatic causes. Geophys. Res. Lett., 30(12), 1601.
Mote, P.W., Hamlet, A.F., Clark, M. P., and D. P. Lettenmaier. 2005. Declining mountain snowpack in western North America. Bull. Am. Met. Soc., 86:39–49.
Regonda, S., B. Rajagopalan, M.P. Clark, and J. Pitlick. 2005. Seasonal cycle shifts in hydroclimatology over the western United States. J. Climate 18:372-384.
Roos, M. 1987. Possible Changes in California Snowmelt Patterns. Proc., 4th Pacific Climate Workshop, Pacific Grove, California, 22-31.
Roos, M. 1991. A Trend of Decreasing Snowmelt Runoff in Northern California, Proc., 59th Western Snow Conference, Juneau, Alaska, 29-36.
Stewart, I.T., D.R. Cayan, and M.D. Dettinger. 2004. Changes in snowmelt runoff timing in western North America under a “Business as Usual” climate change scenario. Clim. Change 62:217-232.
Stewart, I., Cayan, D., and Dettinger, M. 2005. Changes towards earlier streamflow timing across western North America. Journal of Climate 18:1136-1155.
8 WMC Networker Spring 2005
WILDFIRE IN THE WEST: A LOOK INTO A GREENHOUSE WORLD Donald McKenzie, David L. Peterson Pacific Northwest Research Station, Pacific Wildland Fire Sciences Laboratory, USDA Forest Service, Philip Mote JISAO/SMA Climate Impacts Group, University of Washington Ze'ev Gedalof Department of Geography, University of Guelph
Fire disturbance in Western North America
Vegetation dynamics, disturbance, climate, and their interactions are key ingredients in predicting the future condition of ecosystems and landscapes and the vulnerability of species and populations to climatic change (e.g., Schmoldt et al., 1999). Wildfire presents a particular challenge for conservation because it is stochastic in nature and is highly variable temporally and spatially (Agee, 1998; Lertzman et al., 1998). Historical fire regimes varied widely across North America before fire exclusion (including suppression) began in the early 20th century. Fire return intervals of 2-20 years in dry forests and grasslands of the Southwest existed prior to 1900. Low-severity fire regimes were typical in arid and semiarid forests, and fires normally occurred frequently enough that only understory trees were killed and an open-canopy savanna was maintained. These systems have been altered by fire exclusion, such that the canopy is now often closed, fuel loadings are higher and more contiguous and fire-return intervals are longer.
High-severity fire regimes are typical in sub-alpine forests and in low-elevation forests with high precipitation and high biomass; fires occur infrequently and often involve crown fuels and high tree mortality. These systems have been less affected by 20th-century fire exclusion. Mixed-severity fire regimes are typical in montane forests with intermediate precipitation and moderately high fuel accumulations; fire behavior varies from low to high intensity, often causing a mosaic of ground and crown fire with patchy distribution of tree mortality. Fire severity also varies in non-forested ecosystems, from light surface fires in dry woodlands that cause little mortality in woody species to stand-replacing fires in chaparral and shrub ecosystems.
The relative influence of climate and fuels on fire behavior and effects varies regionally and sub-regionally across the western United States (McKenzie et al., 2000). In wet forests and sub-alpine forests with high fuel accumulations, climatic conditions are usually limiting and fuels are rarely limiting (Bessie and Johnson, 1995). Prolonged drought of one or more years
combined with extreme fire weather (high temperature, high wind, low relative humidity) is required to carry fire. In drier forests, ignition and fire behavior at small spatial scales were historically limited by fuels. Large fires typically required extreme fire weather governed by specific types of synoptic climatology (Gedalof et al., 2005).
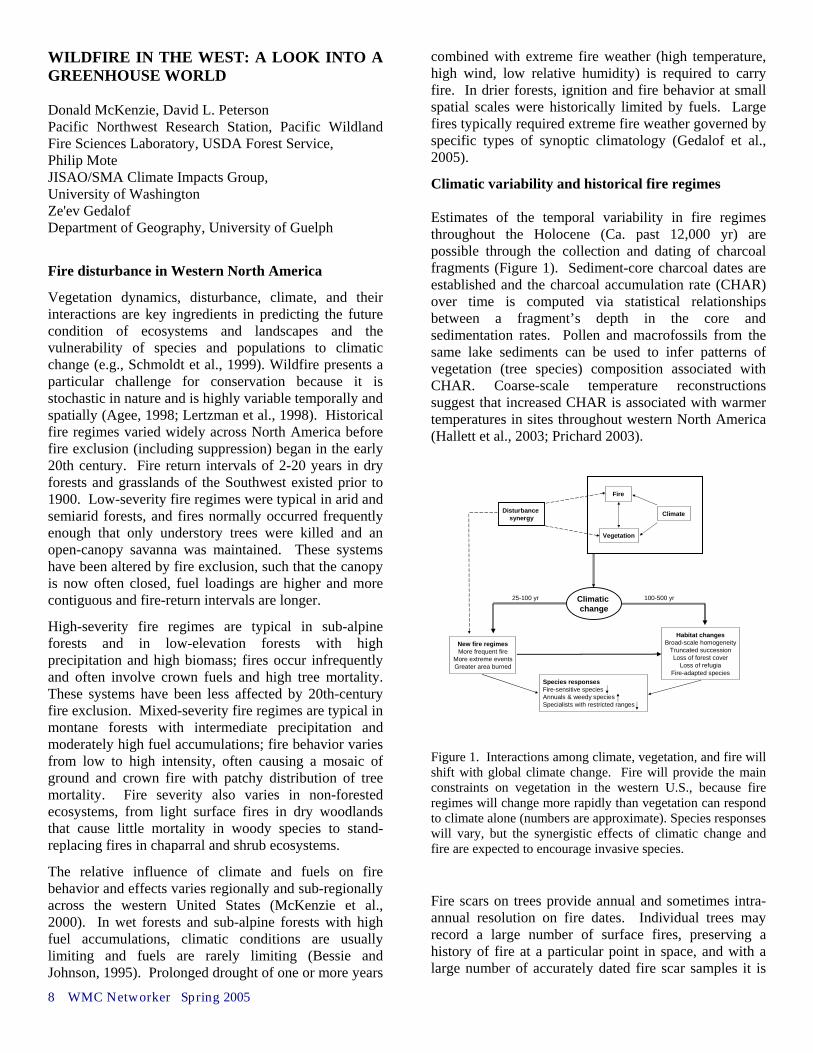
Climatic variability and historical fire regimes Estimates of the temporal variability in fire regimes throughout the Holocene (Ca. past 12,000 yr) are possible through the collection and dating of charcoal fragments (Figure 1). Sediment-core charcoal dates are established and the charcoal accumulation rate (CHAR) over time is computed via statistical relationships between a fragment’s depth in the core and sedimentation rates. Pollen and macrofossils from the same lake sediments can be used to infer patterns of vegetation (tree species) composition associated with CHAR. Coarse-scale temperature reconstructions suggest that increased CHAR is associated with warmer temperatures in sites throughout western North America (Hallett et al., 2003; Prichard 2003).
Climatic change
Disturbance synergy
25-100 yr 100-500 yr
Habitat changesBroad-scale homogeneity
Truncated successionLoss of forest cover
Loss of refugiaFire-adapted species
New fire regimesMore frequent fire
More extreme eventsGreater area burned
Species responsesFire-sensitive speciesAnnuals & weedy speciesSpecialists with restricted ranges
Climate
Vegetation
Fire
Figure 1. Interactions among climate, vegetation, and fire will shift with global climate change. Fire will provide the main constraints on vegetation in the western U.S., because fire regimes will change more rapidly than vegetation can respond to climate alone (numbers are approximate). Species responses will vary, but the synergistic effects of climatic change and fire are expected to encourage invasive species.
Fire scars on trees provide annual and sometimes intra-annual resolution on fire dates. Individual trees may record a large number of surface fires, preserving a history of fire at a particular point in space, and with a large number of accurately dated fire scar samples it is
possible to characterize past surface-fire regimes. Fire-scar records can be compared to climate reconstructions from tree-ring time series from dominant trees of drought-sensitive species (McKenzie et al., 2001). With broadly distributed data records, robust reconstructions are possible for annual temperature, precipitation, drought indices such as the Palmer Drought Severity Index (PDSI), and quasi-periodic patterns such as the El Niño/Southern Oscillation (ENSO) and Pacific Decadal Oscillation (PDO – Mantua et al., 1997).
By careful reconstruction of stand-age, or “time-since-fire” maps, it is possible to estimate statistical properties of fire regimes. Cumulative probability distributions are fit to “survivorship curves” (monotonic functions representing the proportion of a landscape that did not experience fire up to a certain age) to estimate mean fire frequency. With a long enough record, estimates of changing fire frequency can be made at multidecadal scales. In forests characterized by mixed-severity fire regimes, stand-age maps can be combined with fire-scar reconstructions in order to characterize fire cycles.
Climatic variability and wildfire at regional scales
Large severe fires (>100 ha) account for most of the area (>95%) burned in western North America in a given year. Regional-scale relationships between climate and fire vary, depending on seasonal and annual variability in climatic drivers, fire frequency and severity, and the legacy of previous-years climate in live and dead fuels (Grissino-Mayer and Swetnam, 2000; Veblen et al., 2000; Hessl et al., 2004). Current-year drought is typically associated with higher area burned, but the effects of antecedent conditions vary. For example, in the American Southwest, large fire years are associated with current-year drought but wetter than average conditions in the five previous years (Swetnam and Betancourt, 1990). In contrast, in Washington State, direct associations exist only between fire extent and current-year drought (Hessl et al., 2004; Wright and Agee, 2004). Synchronous fire years are associated with the ENSO cycle in the Southwest and southern Rocky Mountains, less so in eastern Oregon (Heyerdahl et al., 2002), and not at all in Washington (Hessl et al., 2004).
In Canadian boreal forest and wetter areas of the Pacific Northwest, short-term synoptic fluctuations in atmospheric conditions play an important role in forcing extreme wildfire years (Johnson and Wowchuk, 1993; Gedalof et al., 2005). Atmospheric anomalies that characterize extreme wildfire years generally consist of “blocking” ridges of high pressure that divert precipitation away from the region in the days to weeks preceding wildfire occurrence. When the blocking ridge has been especially strong and persistent, the extreme pressure gradient associated with cyclonic storms
produces strong winds that, in conjunction with lightning, cause wildfires of unusual severity.
Predicting the effects of climatic change on wildfire
A warmer greenhouse climate may cause more frequent and more severe fires in western North America (Lenihan et al., 1998; McKenzie et al., 2004). GCMs suggest that length of fire season will likely be longer. But can we quantify these changes in wildfire patterns and account for different fire regimes throughout the West? We developed statistical relationships between observed climate and fire extent during the 20th century, and used those relationships in conjunction with projections of future temperature and precipitation to infer the sign and magnitude of future changes in fire activity. This approach assumes that broad-scale statistical relationships between climatic variables and fire extent are robust to extrapolation to future climate even if the mechanisms that drive synoptic patterns are not linearly associated with those climatic variables.
We built statistical models of the associations between seasonal and annual precipitation and temperature and fire extent for the period 1916-2002 on a state-by-state scale for each of the 11 western states (WA, ID, MT, OR, CA, NV, UT, WY, CO, AZ, NM – data from multiple sources). Using state averages of temperature and precipitation from the U.S. Climate Division-dataset (http://www.cdc.noaa.gov/USclimate/USclimdivs.html), we calculated linear correlations of log10(area burned) with mean summer (June, July, August [JJA]) temperature and precipitation. For most states, highest correlations are with positive temperature anomalies and negative precipitation anomalies in the months June through August. In some states (Montana, Nevada, and Utah), area burned is positively correlated with the previous summer’s precipitation, and for some (Idaho, New Mexico) area burned is positively correlated with spring temperature more than summer temperature.
These analyses reveal two important relationships. First, the association between area burned and climate is highly nonlinear. The distribution of annual area burned by wildfire spans several orders of magnitude, and is dominated by individual large fires that burn under extreme conditions. Given the importance of individual extreme events and the nonlinearity in the record of area burned, relatively modest changes in mean climate could lead to substantial increases in area burned, particularly in crown-fire ecosystems in which distinct thresholds of fuel moisture and fire weather are known to exist.
Second, in most states there is a greater range of area burned under hot, dry conditions than under cool, wet conditions. Whereas large fires are very unlikely under unfavorable (cool, wet) conditions, they are not

10 WMC Networker Spring 2005
inevitable under favorable conditions. This difference in response is due to the specific sequence of events required to cause large fires: although drought appears to be an important precondition for large fires, these fires will not occur unless the drought is accompanied by a source of ignition (usually lightning), and a mechanism for rapid spread (strong winds).
To determine the dependence of area burned on climate, we performed multiple regression of log10(area burned) on JJA temperature and precipitation for each of the 11 states. We developed contours of log10(area burned) against JJA temperature and precipitation anomalies for the Western states, and examined slopes of the contours to determine the relative influence of climatic variables and sensitivity to changes in these variables.
Years with largest area burned usually had summers that were warmer and drier than average. Montana is the most sensitive, with a 50-fold increase in predicted mean area burned from the least favorable to most favorable year, whereas California is the least sensitive. A sharp increase in mean area burned was predicted for increased temperature in AZ, NM, UT, WY, and decreased precipitation (ID, MT, WY).
We used these regressions with new climate statistics for 2070-2100 represented by output from the Parallel Climate Model (PCM), with socioeconomic scenario B2, of the U.S. National Center for Atmospheric Research. PCM-B2 projects changes in JJA climate for the West in the period 2070-2100 relative to 1970-2000 of +1.6°C for temperature and +11% for precipitation, both relatively conservative for the range of GCMs in use. We combined the regression analysis with the projected changes in JJA temperature and precipitation according to the PCM-B2 scenario.
This method projects an increase in the mean area burned by a factor of 1.4 to 5 for all states but California and Nevada, with the largest increases in New Mexico and Utah. Summer temperature is the dominant driver of area burned, likely operating via sustained drought and associated increases in flammability of fuels.
Despite the limitations of this approach, it appears that area burned in most Western states will increase by at least 100% by the end of this century. Our analysis reveals state-to-state variations in the sensitivity of fire to climate. At one extreme, fire in Montana, Wyoming, and New Mexico is acutely sensitive, especially to temperature changes, and may respond dramatically to global warming. At the other extreme, fire in California and Nevada is relatively insensitive to changes in summer climate, and area burned in these states might not respond strongly to altered climate.
Implications for resource management --Effects on fire sensitive species
These results have several implications for fire-sensitive species. First, warmer drier summers will produce more frequent, more extensive fires in forest ecosystems, likely reducing the extent and connectivity of late-successional habitat. Increased fire extent and severity would increase the risk of mortality in isolated stands of older forests that have survived past disturbances. This change would threaten the viability of species restricted to habitat in open-canopy mature forest (northern spotted owl, Strix occidentalis subsp. caurina; northern goshawk, Accipiter gentilis), and in dense, multistory closed-canopy forest (flammulated owl, Otus flammeolus), whereas species dependent on early-successional habitat (e.g., northern pocket gopher, Thomomys talpoides) would increase.
Second, reduced snowpack and earlier snowmelt in mountains will extend the period of moisture deficits in water-limited systems, increasing stress on plants and making them more vulnerable to multiple disturbances. In the Intermountain West, long periods of low precipitation deplete soil moisture, causing water stress in trees, and susceptibility to beetle species (especially Dendroctonus spp.). An outbreak of beetles in stressed trees can spread to healthy trees, causing mortality over thousands of hectares. Areas with high mortality accumulate woody fuels, which greatly increases the hazard of a stand-replacing fire and subsequent beetle attack. Accelerating this cascade of spatial and temporal patterns of disturbance would make it difficult to achieve conservation goals for plant and animal species associated with mature forests.
Third, fire return intervals are likely to be shorter in savanna, shrublands, and chaparral, increasing vulnerability to weedy or annual species adapted to frequent fire. In Southwestern chaparral and Intermountain West shrublands, shorter fire return intervals facilitate invasion by exotic annuals whose continuous cover provides positive feedback for yet more frequent and widespread fires (Keeley and Fotheringham, 2003). In addition to significant loss of shrub ecosystems, habitat would be lost for obligate sagebrush (Artemisia spp.) species such as the sage grouse (Centrocercus spp.) and some passerine birds.
Fourth, significant alteration of fire regimes may pose a threat to rare taxa adapted to specific habitats. For example, amphibian declines are of particular concern to the conservation community, though direct relationships with climatic change have been difficult to identify. More frequent or widespread fires could produce significant loss of amphibian habitat through reduction in large woody debris, particularly in advanced decay

classes, thereby compromising viability of some species.
On the other hand, in ecosystems whose fire regimes have recently been altered by fire exclusion, climatic change may accelerate restoration of historic fire regimes, thereby reducing threats to some vulnerable species. For example, species that are adapted to stand replacing fires, such as the black-backed woodpecker (Picoides arcticus), may increase under altered fire regimes.
A biosocial challenge for conservation
Species currently at risk that are restricted to isolated undisturbed habitats are already living on borrowed time, even if current fire regimes were to be maintained. Anticipating changing hazards in dynamic ecosystems responding to climatic change will be a formidable task for resource managers. Also, there may be surprises in the response of natural resources given the complexity of ecosystem processes and the stochastic nature of ecological disturbance. Our understanding of the effects of climatic variability, particularly temperature and drought, on fire occurrence provides some predictability about the potential for large and severe fires.
If longer or more severe fire seasons are indeed an outcome of a greenhouse climate, the probability of losing local populations of species that depend on older forests will increase. Options for suitable post-fire habitat have been reduced by timber extraction, agriculture, and human settlements, creating the potential for “bottlenecks” in space and time, particularly for species that have narrow habitat requirements, restricted distributions, or low mobility. At any particular location, say a national forest or national park, there may be few options for providing sufficient habitat to mitigate these bottlenecks.
Conservation of taxa that live in late-successional forest and riparian habitat has been a management priority for the past two decades, but this emphasis is often incompatible with increased use of fire and mechanical thinning for ecosystem restoration (Cissel et al., 1999). For example, fuel treatments and natural fires that remove a portion of the overstory, understory, and surface fuels reduce the risk of subsequent crown fire, but also preclude habitats required for some plant and animal species. Public distrust of motivations for conducting fuel treatments and agency frustration with appeals and litigation create a challenging biosocial context for decision making. Reasoned discussions among decision makers, public land managers, and stakeholders are needed to develop resource management strategies that mitigate risk to ecosystems and sensitive species.
Acknowledgments
Research was funded by the USDA Forest Service, Pacific Northwest Research Station, and the Joint Institute for the Study of the Atmosphere and Ocean (JISAO) under NOAA Cooperative Agreement NA178RG11232.
References
Agee, J.K. 1998. The landscape ecology of western fire regimes. Northwest Science 72:24-34. Bessie, W.C. and E.A. Johnson. 1995. The relative importance of fuels and weather on fire behavior in subalpine forests. Ecology 76:747-762. Cissel, J.H., F.J. Swanson, and P.J. Weisberg. 1999. Landscape management using historical fire regimes: Blue River, OR. Ecological Applications 9:1217-1231. Gedalof, Z., D.L. Peterson, and N. Mantua. 2005. Atmospheric and climatic controls on severe wildfire years in the northwestern United States. In press. Grissino-Mayer, H.D., and T.W. Swetnam. 2000. Century-scale climatic forcing of fire regimes in the American Southwest. Holocene 10:213-220. Hallett, D.J., D.S. Lepofsky, R.W. Mathewes, and K.P. Lertzman. 2003. 11000 years of fire history and climate change in the mountain hemlock rain forests of southwestern British Columbia based on sedimentary charcoal. Canadian Journal of Forest Research 33:292-312. Hessl, A.E., D. McKenzie, and R. Schellhaas. 2003. Drought and Pacific Decadal Oscillation affect fire occurrence in the inland Pacific Northwest. Ecological Applications 14:425-442. Heyerdahl, E.K., L.B. Brubaker, J.K. Agee. 2002. Annual and decadal climate forcing of historical fire regimes in the interior Pacific Northwest, USA. The Holocene 12:597-604. Johnson, E.A., and D.R. Wowchuk. 1993. Wildfires in the southern Canadian Rocky Mountains and their relationships to mid-tropospheric anomalies. Canadian Journal of Forest Research 23:1213-1222. Keeley, J.E., and C.J. Fotheringham. 2003. Impact of past, present, and future fire regimes on North American Mediterranean shrublands. Pages 218-262 in T.T. Veblen, W.L. Baker, G. Montenegro, and T.W. Swetnam, editors. Fire and climatic change in temperate

12 WMC Networker Spring 2005
ecosystems of the Western Americas. Springer-Verlag, New York, NY.
Lertzman, K., J. Fall, and B. Dorner. 1998. Three kinds of heterogeneity in fire regimes: at the crossroads of fire history and landscape ecology. Northwest Science 72: 4-23.
Mantua, N.J., S.R. Hare, Y. Zhang, J.M. Wallace, and R.C. Francis. 1997. A Pacific interdecadal climate oscillation with impacts on salmon production. Bulletin of the American Meteorological Society 78:1069-1079.
McKenzie, D., D.L. Peterson, and J.K. Agee. 2000. Fire frequency in the Columbia River Basin: building regional models from fire history data. Ecological Applications 10:1497-1516.
McKenzie, D., A. Hessl, and D.L. Peterson. 2001. Recent growth in conifer species of western North America: assessing the spatial patterns of radial growth trends. Canadian Journal of Forest Research 31:526-538.
McKenzie, D., Z. Gedalof, P. Mote, and D.L. Peterson. 2004. Climatic change, wildfire, and conservation. Conservation Biology 18:890-902
Prichard, S.J. 2003. Spatial and temporal dynamics of fire and forest succession in a mountain watershed, North Cascades National Park. Ph.D. Dissertation, University of Washington, Seattle, WA.
Schmoldt, D.L., D.L. Peterson, R.E. Keane, J.M. Lenihan, D. McKenzie, D.R. Weise, and D.V. Sandberg. 1999. Assessing the effects of fire disturbance on ecosystems: a scientific agenda for research and management. USDA Forest Service General Technical Report PNW-GTR-455. Pacific Northwest Research Station, Portland, OR.
Swetnam, T.W. and J.L. Betancourt. 1990. Fire-Southern Oscillation relations in the southwestern United States. Science 249:1017-1020.
Veblen, T.T., T. Kitzberger, and J. Donnegan. 2000. Climatic and human influences on fire regimes in ponderosa pine forests in the Colorado Front Range. Ecological Applications 10:1178-1195.
Wright, C., and J.K. Agee. 2003. Fire and vegetation history in the East Cascade Mountains, Washington. Ecological Applications 14:443-459.
Online Collaboration for Watershed Management: WMC has a new website
Watershed Management Council has a new interactive and database-driven website at http://www.watershed.org.,allowing members of the WMC to post and exchange news, links, photos, messages, and discussion.
If you are a member of the Watershed Management Council, a full-access user account has been created for you. This account will allow you to add to and modify the content of the WMC site, and access content added by other members. Members previously received an email providing the login information. If you did not get it, or lost track of it, send a note to [email protected] and we will set you up. Once you successfully login the screen will change, you will see more, and you will have full access to watershed.org.
With full access you can:
* Change your password, change how your homepage looks. * Submit news, links, events, and other items to share with peers * Keep up-to-date with the latest watershed management news. * Browse the photos of other users of watershed.org * Set up your own photo albums for others to view and refer to * Vote in online WMC polls * Send messages to other members * Schedule virtual meetings with the Live Discussion feature * Browse extensive links to watershed information * Search archived WMC publications
If you need help logging into or using the site, please contact [email protected] for assistance.

INFLUENCE OF 19TH AND 20TH CENTURY LANDSCAPE MODIFICATIONS ON LIKELY GEOMORPHIC RESPONSES TO CLIMATE CHANGE IN SAN FRANCISCO BAY-DELTA AND WATERSHED Joan Florsheim1 and Michael Dettinger2, 1University of California, Davis; [email protected] 2U.S. Geological Survey Scripps Institute of Oceanography; [email protected] Introduction Geomorphic processes in the Sacramento-San Joaquin River and San Francisco Bay-Delta watershed (Fig. 1) responded, on a variety of time scales, to the warm climates and coincident sea-level rise of the Holocene (the past ~10K years). Within this watershed, lowland river floodplains and Delta fresh-water wetlands adjusted to accommodate large, natural upstream watershed hydrologic changes and downstream sea level fluctuations. During the past two centuries, though, the natural geomorphic systems have been extensively modified by human activities. Now, human induced climate changes are projected that may increase magnitude, frequency, and variability of winter floods and, thus, releases from dams that regulate flow in the major tributaries draining the Sierra Nevada and the Northern California Coast Ranges. Moreover, sea level rise is expected to accelerate in response to future global warming (IPCC, 2001). Thus, geomorphic processes in the Bay-Delta watershed may soon face new challenges associated with anthropogenic climate changes affecting both the upstream watershed hydrology and the downstream sea level that provide the large-scale boundary conditions for geomorphic change.
Fig 1. Sacramento-San Joaquin River and San Francisco Bay-Delta systems location map.
From our developing understanding of Holocene climate-induced physical changes in the Bay-Delta (Malamud-Roam et al., in review) and other lowland systems (e.g. Blum and Tornqvist, 2000; Brown, 2002; Aalto, et al, 2003), we can infer that currently projected climate changes (in response to anthropogenic changes in the global environment; Dettinger, 2005) probably would be sufficient to significantly affect geomorphic processes and in turn, floodplain and Delta wetland ecology. In this article, we outline some of the ways that geomorphic processes in lowland river systems may respond to future climate variations and change, with particular attention to the likely influence of 19th and 20th Century modifications of the Central Valley landscape on geomorphic responses. River flow and the sediment budget During the past two centuries, humans have built pervasive structural controls on floods and geomorphic responses to floods, and have dramatically changed sediment supplies throughout the Central Valley. Structure and function of floodplains and freshwater tidal marshes have been modified by dams and other structures that regulate flow and sediment transport from the highest elevation river reaches downstream to, and into, the tidal zone. Flows in most of the large tributaries draining the Sierra Nevada have been modified by dam construction. Hydrographs from streamflow gaging stations upstream and downstream of Camanche Dam on the Mokelumne River (Fig. 2) illustrate typical impacts of a dam on natural river flows. In 1997, the high magnitude flood peak was reduced by the presence of the dam while the duration of bankfull flow (about 140 m3/s) was increased. In 2001, a drought resulted in relatively small reservoir releases throughout the year. The upstream gaging station (at Mokelumne Hill) is itself downstream of several large dams, reflected in the nearly constant dry season releases during both 1997 and 2001. Releasing bankfull flows for extended periods increases the period when the tractive forces of the river are sufficient to erode and transport sediment and thus these sustained bankfull releases could lead to increased duration of bed and bank erosion processes. Increased duration of bankfull flows also prolongs bank saturation, making banks more susceptible to erosion once the flow stage does drop. At the opposite end of the flow spectrum, prolonged dry-season flow reductions associated with dam (and diversion) operations are likely to impact riparian ecology and also may render banks more susceptible to erosion as the groundwater table drops. Moreover, longer drier seasons could lead to increased wildfire

14 WMC Networker Spring 2005
frequency that burns hillside vegetation and that potentially increases sediment supply to rivers. Current projections of near-term climate change generally do not give much guidance as to whether droughts will become more or less common (Dettinger, 2005), but they do unanimously suggest that dry-season flows will decline due, in large part, to earlier snowmelt and runoff from the mountain watersheds. Furthermore, the trend towards earlier snowmelt and runoff is projected to take, in part, the form of increased flood magnitudes and frequencies (Dettinger et al., 2004). Thus, 21st Century warming of the region may aggravate several of the changes that dams and diversions already impose on the region’s geomorphic systems.
Fig 2. River flow regulation upstream (solid) and downstream (dashed) of Camanche Dam on the highly regulated Mokelumne River. Changes in magnitude, duration, and timing of reservoir releases during the high-magnitude 1997 flood and the 2001 drought. In addition to modifying flow regimes throughout most of the watershed, humans have also changed land surfaces far and wide, and through these changes also have extensively (though inadvertently) modified the sediment budget of the Sacramento-San Joaquin River and San Francisco Bay-Delta watershed. Near the beginning of the last century, vast quantities of sediment were mobilized by hydraulic mining and other land uses and caused dramatic geomorphic changes in the Bay-Delta system (Gilbert, 1917), sending a pulse of sediment down the rivers and into the estuary. Then, during the 20th century, the upstream sources of sediment were markedly reduced by the end of hydraulic mining, the passage from the system of much of the large volume of sediment already in transit from the hydraulic-mining era, the progressive development of upstream reservoir storage, stream-channel aggregate extraction, and
channel dredging for levee maintenance. Geomorphic responses to future climate changes will transpire in the context of these human activities and the controls that each still exerts on sediment sources, sinks, and transport in the system. Particularly, future geomorphic responses will depend on the presence (or absence) of remnants of the hydraulic-mining era sediments at critical points in the system, the relative dearth of sediment sources to supply future lowland geomorphic responses and recoveries, and the potential for accelerated channel incision and bank erosion into formerly stable alluvial deposits. Climate-driven upstream and downstream geomorphic forcing factors Climate drives watershed hydrology, which in turn plays a dominant role in downstream geomorphic processes. Current climate-change projections for California suggest that the total volume of snowmelt runoff that may be shifted from spring and added to winter flows may be as much as (or more than) 5maf/yr (Knowles and Cayan, 2004), a volume roughly equal to the reservoir storage that is set aside each year for the management of floods by the major foothill reservoirs of the Sierra Nevada. Changes in timing of reservoir releases to accommodate this shift could either add to the magnitude of winter flood peaks or add to their durations. These alternatives would have differing geomorphic consequences. At the downstream end of the fluvial system, sea-level fluctuation is the major forcing factor affecting geomorphic processes. The combination of upstream and downstream forcing factors governs the avulsion1 threshold, where avulsion is the natural dynamic processes by which multiple channel anastomosing fluvial systems break levees, create crevasse splay deposits, and switch channel location and where the threshold in question is the flow level at which avulsion begins. In lowland rivers, the avulsion threshold is exceeded when flow discharge increases to the level where natural or human constructed levees are breached. Sea level rise, either as a simple continuation of historical trends or in response to global warming, increases the probability of avulsion because it results in
1 Avulsion is the natural dynamic processes by which multiple channel, or “anastomosing” fluvial systems break levees, create crevasse splay deposits, and switch channel location (a crevasse splay is a fan shaped sand or silt deposit formed on the floodplain where flow and sediment from the main channel is transported through the levee break).

overall decreases in along-channel slope and coincident increases in cross-valley slope associated with the aggradation., In lowland alluvial valleys, increases in cross valley slope occur on reaches that sit at higher elevations above the surrounding floodplain. This results from sediment deposition occurring in the channel and floodplain along an active channel belt, locally raising elevation higher than the elevation of adjacent relatively inactive portions of the valley bottom. Any increases in flood magnitudes associated with climate change could raise river stages enough to breach natural (or human constructed) levees, and allowing erosion and deposition of crevasse splay and channel complex sediment into lower elevation areas. River and delta levee break thresholds A review of historical geomorphic responses to floods illustrates the dominance of structural controls in the lowland parts of the present-day Sacramento-San Joaquin watershed. Levees concentrate flow into single channels and isolate floodplains from sediment and nutrient exchanges with adjacent river channels, banks, and floodplains. Flood basin wetlands, first described by Gilbert (1917), and multiple-channel floodplain systems were progressively developed into flood-bypass channels as levees confined channels and isolated floodplains (Florsheim and Mount, 2003). In the Delta, construction of levees that led to subsidence, along with alteration of sediment and flow regimes, invasions by alien species, contamination by pollutants, and other changes transformed the ecology. Projected increases in wintertime flows accompanying already-large floods could increase overbank flood extents, erosion, and sedimentation, or alternatively could increase the depth and strength of confined flows and thereby increase the risk of levee failures. Earlier, winter runoff released from reservoirs as a relatively constant addition to winter base flows would increase the duration of bankfull or possibly "levee-full" flows, leading to bank and levee failures through increased saturation and seepage erosion. The history of levee breaks since 1850 (Fig. 3) illustrates the important role of past floods in precipitating the breaches and shows that the numbers of breaks has not declined through time despite historical management practices. However, quite a few breaks in the Delta have occurred during dry seasons (e.g. 1980 and 2004) as a result of high tides, wind waves, or the inherent structural weakness in some of the levees (Florsheim and Dettinger, 2004; Fig. 3).
Fig 3. Sacramento and San Joaquin Rivers, tributary, and Delta levee breaks since 1850. Both river and Delta levee breaks are coincident with significant storms that occurred in the late 1800’s, the early 1900’s, 1937-8; the mid-1950’s and about every decade since then. Some breaks occur during smaller floods, or for reasons not related to storm hydrology, e.g. the recent Jones Tract Delta levee break in June 2004. The history of levee breaks shown in Fig. 3 shows that the existing infrastructure is primarily effective in controlling relatively low to moderate floods, so that levee breaks along the lowland Central Valley rivers and within the Delta are still quite common during decadal and more frequent floods, and are not even completely lacking during prolonged drier periods (Florsheim and Dettinger, 2004). Projections of an additional sea level rise of 20-80 cm during the 21st century would compound the vulnerability of subsided Delta Islands to levee failure (described in Mount and Twiss, 2005) and increase upstream backwater flooding. If floods of magnitudes associated with increased channel erosion or levee breaks are exceeded with greater frequency as a result of future climate changes, future geomorphic responses will reflect the 19th and 20th Century structural changes, along with any reservoir-management changes undertaken to accommodate those flood changes. In this scenario, 19th and 20th Century structures pose major risks and threats to environment and structures. Whereas the natural geomorphic system was dynamic and adjusted to the climate variations of the Holocene creating ever changing patterns over the long-term throughout vast lowland areas, today, people struggle and engineer to moderate processes and confine the geomorphic system to control floods and accommodate development. In combination with the well documented, persistent and detrimental ecological effects of human activities isolating ecologically important floodplains from their intermittent sources of

16 WMC Networker Spring 2005
flood-borne nutrients and sediment, subsidence of Delta islands, and wide-scale land use conversions, the pervasive modification of the Bay-Delta watershed may actually have weakened the engineered capacity of the system to accommodate and prosper in the face of future climate variations and changes.
Conclusions
Geomorphic processes in 21st Century California operate in a landscape dominated by levees and dams. Thus, a critical question is: How have human activities influenced the way that climate variation and change will affect geomorphic processes in the lowland portion of the Bay Delta watershed? Based on review of currently available data, the survivability of existing infrastructure and decisions about timing, magnitude and duration of flow releases from upstream reservoirs appear likely to determine the nature of geomorphic responses to future climate variation and change. Based on this review, we suggest that 19th and 20th century modifications may have made the lowland portion of the Bay-Delta watershed more vulnerable to climate variations and changes than it was under natural conditions.
Acknowledgement
This article was supported by USGS-UC Davis Cooperative Agreement 03WRAG0005, and is adapted from a poster presented at the Fall 2004 American Geophysical Union Meeting:
Florsheim, J.L. and Dettinger, M.D., 2004. Influence of anthropogenic alterations on geomorphic response to climate variation and change in San Francisco Bay, Delta, and Watershed, Eos Trans. AGU, 85(47), Fall Meet. Suppl., Abstract H51A-1108.
References
Aalto, R., Maurice-Bourgoin, M., Dunne, T., Montgomery, D.R., Nittrouer, C.A., and Guyot, J.L.. 2003. Episodic sediment accumulation on Amazonian floodplains influenced by El Nino/Southern Oscillation, Letters to Nature 425:493-497.
Blum, M.D. and Tornqvist, T.E. 2000. Fluvial response to climate and sea-level change: a review and look forward. Sedimentology 47(Supp):1-48.
Brown, A.G. 2002. Learning from the past: palaeohydrology and palaeoecology. Freshwater Biology 47(4):817-829.
Dettinger, M.D. 2005. From climate-change spaghetti to climate-change distributions for 21st century California. San Francisco Estuary and Watershed Science 3(1). http://repositories.cdlib.org/jmie/sfews/vol3/iss1/art4/.
Dettinger, M.D., Cayan, D.R., Meyer, M.K., and Jeton, A.E.. 2004. Simulated hydrologic responses to climate variations and change in the Merced, Carson, and American River basins, Sierra Nevada, California, 1900-2099. Climatic Change 62:283-317.
Florsheim, J.L., and Mount, J.F.. 2003. Changes in lowland floodplain sedimentation processes: pre-disturbance to post-rehabilitation, Cosumnes River, California, Geomorph. 56:305-323.
Florsheim, J.L., and Mount, J.F. 2002. Restoration of floodplain topography by sand splay complex formation in response to intentional levee breaches, lower Cosumnes River, California. Geomorphology 44(1-2):67-94.
Gilbert, G.K. 1917. Hydraulic Mining in the Sierra Nevada. U.S. Geol. Surv. Prof. Pap. 105, 154 pp.
IPCC. 2001. IPCC Third Assessment Report - Climate Change 2001: Impacts, Adaptation, and Vulnerability. http://www.ipcc.ch/
Knowles, N., and Cayan, D. 2004. Elevational dependence of projected hydrologic changes in the San Francisco estuary and watershed. Climatic Change 62:319-336.
Malamud-Roam, F., Ingram, Hughes, M., and Florsheim, J., in review, Holocene paleoclimate records from a large California estuary systems and its watershed—Linking watershed climate and bay conditions: submitted to Quaternary Science Reviews.
Mount, J., and Twiss, R. 2005. Subsidence, sea-level rise, and seismicity in the Sacramento-San Joaquin Delta. San Francisco Estuary and Watershed Science, 3(1),http://repositories.cdlib.org/jmie/sfews/vol3/iss1/art5/.

LAKE TAHOE IS GETTING WARMER
Robert Coats, Hydroikos Ltd., San Rafael, California; [email protected] Perez-Losada, University of Girona, Spain Geoffrey Schladow, Department of Civil and Environmental Engineering, UC Davis Robert Richards, Department of Environmental Science and Policy, UC Davis Charles Goldman, Department of Environmental Science and Policy, UC Davis
Introduction
At the 2002 Sierra Nevada Science Symposium at Lake Tahoe, hydrologist Michael Dettinger presented data and modeling results showing that a warming trend in the northern Sierras is not just a hypothetical possibility, but a phenomenon that began in earnest in the early 1970s (Dettinger, et al., 2004; Cayan et al., this issue). Gazing out at the lake during lunch break, it occurred to us that if the trend is real, it should be obvious in the record of deep water temperature in the lake, where the lake’s large volume—156 km3—and thermal inertia would filter out the seasonal fluctuations and “noise”.
Lake Tahoe is world-famous for its astounding deep blue color and clarity. But the clarity has been declining since the early 1960s, at an average rate of about 0.25 m yr-1, due to accelerated input of fine sediment and nutrients. Because of public concerns about the loss of clarity, the lake has been studied intensively since the 1960s. The research program of the UC Davis Tahoe Research Group has included weekly to monthly temperature profiles in the Lake, and those data provided the basis of our project to investigate the warming of Lake Tahoe. Our goals were 1) to test the hypothesis that the lake is getting warmer; 2) to relate the temperature trend to the driving climatic variables, through statistical analysis and modeling; 3) to identify possible ecological consequences of the warming trend.
The warming of large lakes has been recognized elsewhere in the world, including Lake Zurich (Livingstone, 2003), Lake Maggiore in Italy (Ambrosetti and Barbani, 1999), Lake Mendota in Wisconsin (Robertson and Ragotzkie, 1990, Lake Washington in Seattle (Arhonditsis et al., 2004), Lake Tanganyika (Verberg et al., 2003) and Lake Malawi (Vollmer et al., 2005). The warming trends in these (and other) lakes have caused increases in thermal stability and modified the lakes’ primary productivity and biogeochemical cycling. Lake Tahoe, at 500 m depth the third deepest
lake in North America, and the 11th deepest lake in the world, is a good addition to the record of lake warming around the world.
Methods
The temperature record at Tahoe extends from late 1969 to the present. Deep water temperature (>100 m) is measured with reversing thermometers, that can be read to 0.01 oC. Over the years, a variety of electronic and analog instruments have been used to measure temperature in the upper 100 m. Temperature is measured at intervals of about 10 days in the upper 100 m, and monthly intervals in deeper water. The data set that we used comprises >7300 individual measurements.
To prepare a data set for statistical analysis, we interpolated daily values for depths of 0, 10, 20, 30, 50, 100, 200, 300, and 400 m. We then interpolated temperature for each day at 1 m intervals to depth of 400 m, and calculated the daily depth and volume-averaged temperature, the total heat content of the lake, and two measures of lake thermal stability: the Schmidt stability and Birge work (Idso, 1973). For plotting and time series analysis, we smoothed the data either with a 4-yr running average, or by removing the average seasonal cycle.
Maximum and minimum daily air temperature at Tahoe City are available for 1914-present. We were also fortunate to have a large climatic data set (including hourly values for wind, solar and longwave radiation, as well as temperature) created by “downscaling” the data from a 1 degree grid scale to a 3 km grid scale for the Tahoe Basin, using the Fifth Generation Mesoscale Model (MM5) of the National Center for Atmospheric Research (NCAR) (Grell et al, 1994; Anderson et al., 2002). For statistical analysis, we obtained indices of the El Nino-Southern Oscillation (ENSO) (Wolter and Timlin, 1998) and the Pacific Decadal Oscillation (Mantua et al., 1997). These regional climatic indices have been found to be statistically-related to lake warming in previous studies (Arhonditsis, et al., 2004).
The significance of apparent time trends in lake temperature and stability, maximum and minimum air temperature, and short and long-wave radiation were tested with statistical methods that take account of autocorrelation in a time series. Persistence in a time series can lead one to conclude that a time trend exists when in fact it is not statistically significant (von Storch, 1999).
Since lake temperature lags behind the climatic variables, we shifted the latter forward in time so that the
18 WMC Networker Spring 2005
annual maxima and minima of the lake temperature and explanatory climatic variables were more-or-less aligned. We then used step-wise multiple regression identify the climatic variables most closely related to the average lake temperature, at monthly and annual time scales.
Statistical analysis can show correlations between explanatory and independent variables, but correlation does not prove causation. To show that the measured trends in climatic variables can reasonable explain the trend in lake temperature, we used a one-dimensional, process-based, deterministic lake simulation model, known as the Dynamic Lake Model (DLM) (Hamilton and Schladow, 1997; McCord and Schladow, 1998). The lake is modeled by a series of horizontal layers of uniform properties. The DLM was previously calibrated and verified for Lake Tahoe, for a 2-yr period (Perez-Losada, 2001). In this exercise, the only adjustment to model parameters was a reduction in average daily wind speed of 38 percent. This was found to improve the fit of the model, and is consistent with statistical comparison of the 2-yr record of wind at Tahoe City with the MM5 wind.
Results and discussion
When we plotted the temperature at 400 m vs. time, a warming trend, especially since the mid-1970s, was obvious. Figure 1 shows the plot, with vertical lines to indicate the dates of documented mixing to at least 400 m. Note that deep mixing occurred 3 times in the early 70s as the lake cooled, but only 4 times since then.
Temperature at 400 m in Lake Tahoe
4.04.24.44.64.85.05.25.4
70 74 78 82 86 90 94 98 02
,erutarepmeT
oC
Figure 1. Temperature at 400 m in Lake Tahoe. Vertical lines indicate dates of mixing to at least 400 m depth.
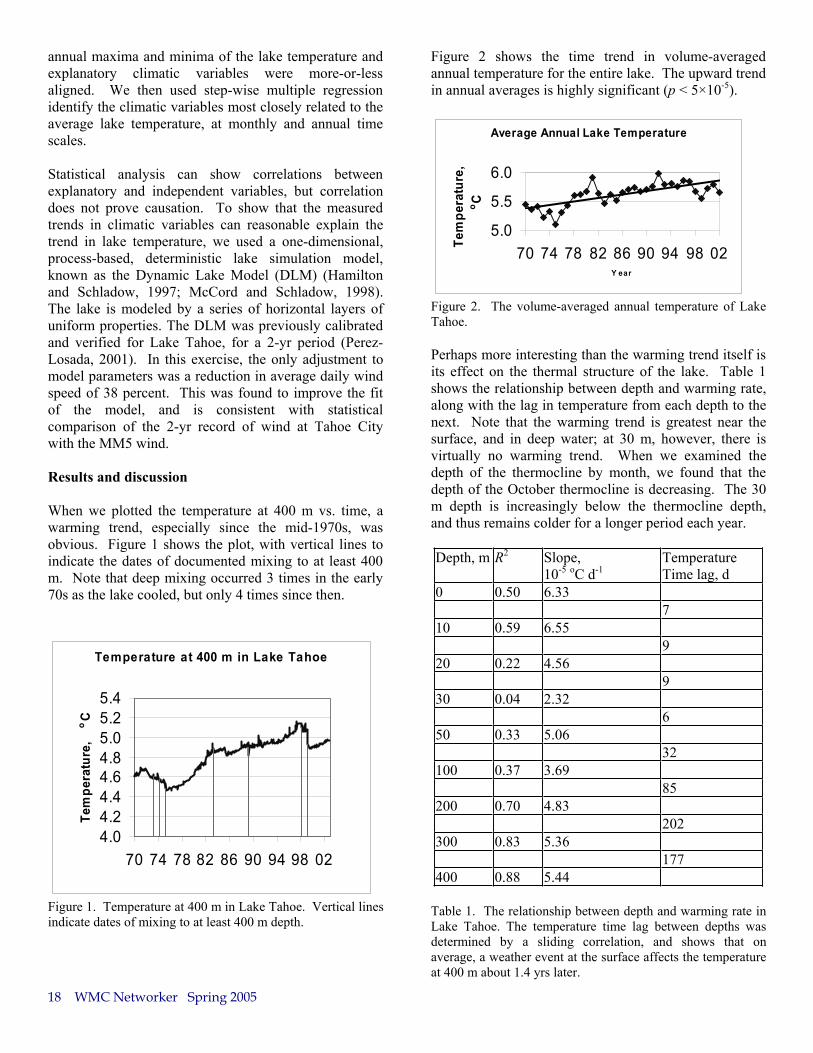
Figure 2 shows the time trend in volume-averaged annual temperature for the entire lake. The upward trend in annual averages is highly significant (p < 5×10⁻⁵).
Average Annual Lake Temperature
5.0
5.5
6.0
70 74 78 82 86 90 94 98 02Y ear
,erutarepmeT
o C
Figure 2. The volume-averaged annual temperature of Lake Tahoe.
Perhaps more interesting than the warming trend itself is its effect on the thermal structure of the lake. Table 1 shows the relationship between depth and warming rate, along with the lag in temperature from each depth to the next. Note that the warming trend is greatest near the surface, and in deep water; at 30 m, however, there is virtually no warming trend. When we examined the depth of the thermocline by month, we found that the depth of the October thermocline is decreasing. The 30 m depth is increasingly below the thermocline depth, and thus remains colder for a longer period each year.
Depth, m R2 Slope, 10-5 oC d-1
Temperature Time lag, d
0 0.50 6.33 7 10 0.59 6.55 9 20 0.22 4.56 9 30 0.04 2.32 6 50 0.33 5.06 32 100 0.37 3.69 85 200 0.70 4.83 202 300 0.83 5.36 177 400 0.88 5.44
Table 1. The relationship between depth and warming rate in Lake Tahoe. The temperature time lag between depths was determined by a sliding correlation, and shows that on average, a weather event at the surface affects the temperature at 400 m about 1.4 yrs later.

A warming lake is an increasingly stable lake. This is because 1) the warming rate is highest at the surface, so the vertical gradient in water density increases over time; and 2) the decrease in density with temperature is non-linear. The quantitative measures of lake stability--the Schmidt stability, Birge work and Total Work--are all increasing. This indicates that the lake is becoming more resistant to deep mixing.
What is driving the upward trend in lake temperature and stability? Figure 3 shows the maximum and minimum daily air temperature at Tahoe City (with seasonal trend removed). Over the time period 1914-2002, the upward trend in minimum (nighttime) temperature is highly significant (p < 5×10-12), but the trend in daytime temperature is not. This is consistent with the theory of a greenhouse effect; CO2 (among other gases) admits short-wave radiation, but blocks the emission of long-wave radiation to the night sky. Considered over the period of our lake data, however, the upward trends in both minimum and maximum daily air temperature are significant.
-4-202468
1012141618
1914 1934 1954 1974 1994Year
,erutarepm eT ri
Ao C
Maximum Daily
Minimum Daily
Figure 3. Annual averages of maximum and minimum daily air temperature at Tahoe City, 1914-2002.
The multiple regression model explained 34 percent of the variance in average monthly lake temperature, and 74 percent of the variance in average annual lake temperature. At the monthly time scale, the significant climatic variables included maximum and minimum air temperature (coefficients for both +), the ENSO Index (+), the PDO Index (+), short-wave radiation (+), wind (-), and the interaction terms of wind with both max and min air temperature and with short-wave radiation (all -). At the annual time scale (that is, using annual averages of lake temperature and the explanatory variables), the coefficients for air temperature, ENSO Index and PDO Index were again +, but for min temperature × wind and
short-wave radiation × wind interaction terms, the coefficients were negative. Although downward long-wave radiation showed a slight but significant upward trend, it did not contribute significantly to explaining the variance in lake temperature, given the other variables.
To test the ability of the climatic variables to drive the increase in lake temperature, we ran the DLM with the MM5 data, including time trends, with only the air temperature trend removed, with only the long-wave radiation trend removed, and with both trends removed. Table 2 shows the results, which indicate that the warming trend in the lake is largely attributable to the upward trend in air temperature and to a lesser extent to the upward trend in long-wave radiation. Note that without either the trend in air temperature and downward long-wave radiation, the model shows that the lake would have cooled slightly over the 30-yr analysis period.
Input Assumption 30-yr t, oCBoth detrended -0.08
Air temp. only detrended 0.17
LW radiation only detrended 0.38
No detrending 0.44
Measured 0.52
Table 2. 30-yr change in average volume-weighted temperature of Lake Tahoe, with and without long-term upward trends in air temperature and long-wave radiation. Input data are from the MM5 results; rates of change are from the fitted slopes.
The increasing thermal stability of the lake suggested that the maximum mixing depth should be decreasing over time. To test this hypothesis, we ran the DLM with and without the time trends in the MM5 data. Figure 4 shows the maximum mixing depth, measured and modeled. The results indicate that without the upward trends in air temperature and downward long-wave radiation, the lake would be mixing more frequently to the bottom.

20 WMC Networker Spring 2005
0100200300400500
1972 1976 1980 1984 1988 1992 1996m ,htpe
D
Measured Modeled, MM5 Modeled with Detrended MM5
Figure 4. Measured and modeled annual maximum depth of mixing in Lake Tahoe. The time trend in air temperature and downward long-wave radiation was removed from the input data in the “detrended” case.
Ecological implications
A half-degree increase in average lake temperature over a third of a century may seem insignificant, but through its effect on the lake’s thermal stability, the warming trend may have profound effects on the clarity and ecology of the lake. Fine (< 20 µm) inorganic sediment has been shown to play an important role in reducing the clarity of the lake. This impact is greatest in years following heavy stream runoff, and is prolonged by an absence of deep-water mixing events (Jassby, 1999). Following mixing, the fine sediment is dispersed throughout the volume of the lake, and clarity is increased. Reduced mixing may thus prolong the periods of reduced clarity that follow heavy runoff. The changing thermal regime may also affect the “insertion depth” of inflowing sediment-laden spring runoff, which is determined by the relative density of the lake and stream water.
Second, the increased stability may reduce the regeneration of nutrients from deep water. In Lake Tahoe, deep mixing events in March are associated with increased primary productivity in May (Jassby et al., 1992). A decrease in deep mixing might thus increase the importance of external loading relative to internal loading, and shift the timing of the annual peak in primary productivity.
Third, the increased stability and decreased thermocline depth may affect the feeding behavior and population structure of zooplankton. During the summer, the thermocline provides a thermal refugium for some zooplankton. When surface temperatures reach 15 oC,the thermocline becomes an effective barrier that protects cladocerans and copepods from predation by the introduced mysid shrimp (Richards et al., 1991). A greater thermal gradient associated with warming of the
lake might increase the strength of this barrier. The partial recovery of the populations of the cladocerans Bosmina and Daphnia, which were devastated by the 1963-65 introduction of Mysis relicta (Richards et al., 1975) coincides with the warming trend in the lake since the mid-1970s. It also coincides, however, with increasing primary productivity and changes in phytoplankton species composition, and we do yet not have the data necessary to sort out the relative importance of these factors.
Fourth, and perhaps most importantly, the increased stability may ultimately interact with increasing primary productivity to reduce the dissolved oxygen concentration (DO) in deep water. Long-term data on the DO conditions at the sediment-water interface in Lake Tahoe are lacking. Reduced mixing combined with continued influx of nutrients from runoff and atmospheric deposition (Jassby et al., 1995), however, may ultimately cause hypoxia at the sediment surface in deep water, triggering a release of soluble reactive phosphorus. Then when a deep mixing event finally occurs, the released phosphorus would be dispersed into the photic zone, stimulating an unprecedented algal bloom. The time it will take to reach such a threshold will depend on the future rate of climate change as well as the success of on-going efforts to reduce the anthropogenic flux of nutrients to the lake.
References
Ambrosetti, W., and L. Barbanti. 1999. Deep water warming in lakes: An indicator of climatic change. J. Limnol. 58: 1-9.
Anderson, M. L., Z. Q. Chen, M. L. Kavvas, and A. Feldman. 2002. Coupling HEC-HMS with atmospheric models for prediction of watershed runoff. Jour. Hydrol. Eng. 7: 312-318.
Arhonditsis, G. B., M. T. Brett, C. L. DeGasperi, and D. E. Schindler. 2004. Effects of climatic variability on the thermal properties of Lake Washington. Limnol. Oceanogr. 49: 256-270.
Dettinger, M., D. R. Cayan, N. Knowles, A. Westerling, and M. K. Tyree. 2004. Recent projections of 21st century climate change and watershed responses in the Sierra Nevada. In Murphy, Dennis, and P. A. Stine, eds. Proc. of the Sierra Nevada Science Symposium. U.S. Forest Service Pacific Southwest Res. Sta. GTR-193. pp. 43-46. Albany CA.

Grell, G., J. Dudhia, and D. Stauffer. 1994. A description of the fifth-generation Penn State/NCAR mesoscale model (MM5). National Center for Atmospheric Research, Boulder, CO.
Hamilton, D. P., and S. G. Schladow. 1997. Prediction of water quality in lakes and reservoirs. Part I. Model description. Ecol. Model. 96: 91-110.
Idso, S. B. 1973. On the concept of lake stability. Limnol Oceanogr. 18: 681-683.
Jassby, A. D., C. R. Goldman, and T. M. Powell. 1992. Trend, seasonality, cycle, and irregular fluctuations in primary productivity at Lake Tahoe, California-Nevada, USA. Hydrobiolgia 246: 195-203.
Jassby, A. D., C. R. Goldman, J. E. Reuter, and R. C. Richards. 1999. Origins and scale dependence of temporal variability in the transparency of Lake Tahoe, California-Nevada. Limnol. Oceanog. 44: 282-294.
Livingstone, D. M. 2003. Impact of secular climate change on the thermal structure of a large temperate central European lake. Climate change 57: 205-225.
Mantua, N. J., S. R. Hare, Y. Zhang, J. M. Wallace, and R. C. Francis. 1997. A Pacific interdecadal climate oscillation with impacts on salmon production. Bull. Am. Meteorological Soc. 78: 1069-1079.
McCord, S. A. a. S. G. S. 1998. Numerical simulations of degassing scenarios for CO2-rich Lake Nyos, Cameroon. Jour Geophys. Res. B: Solid Earth 103(B6): 12355-12364.
Perez-Losada, J. 2001. A Deterministic Model for Lake Clarity: Application to Management of Lake Tahoe, (California-Nevada), USA. Pages 231. Universitat de Girona, Girona, Spain.
Richards, R. C., C. R. Goldman, T. C. Trantz, and R. Wickwire. 1975. Where have all the Daphnia gone? The decline of a major Cladoceran in Lake Tahoe, California-Nevada. Verh. Internat. Verein. Limnol. 19: 835-842.
Richards, R. C., C. R. Goldman, E. Byron, and C. Levitan. 1991. The mysids and lake trout of Lake Tahoe: A 25-year history of changes in the fertility, plankton, and fishery of an alpine lake. Am. Fish. Soc. Symp. 9: 30-38.
Robertson, D. M., and R. A. Ragotzkie. 1990. Changes in the thermal structure of moderate to large sized lakes
in response to changes in air temperature. Aquatic Sciences 52: 360-380.
Verburg, P., R. E. Hecky, and H. Kling. 2003. Ecological consequences of a century of warming in Lake Tanganyika. Science 301: 505-507.
Vollmer, M. K., H. A. Bootsma, R. E. Heckey, G Patterson, J. D. Halfman, J. M. Edmond, D. H. Eccles, and R. F. Weiss. 2005. Deep-water warming trend in Lake Malawi, East Africa. Limnol. Oceanogr. 50: 727-732.
von Storch, H. 1999. Misuses of statistical analysis in climate research. Pages 11-26 in a. A. N. H. von Storch, ed. Analysis of Climate Variability. Springer-Verlag, New York.
Wolter, K., and M. S. Timlin. 1998. Measuring the strength of ENSO--how does 1997/98 rank? Weather 53: 315-324.
WATERSHEDS, VINES AND WINES
WATERSHED MANAGEMENT COUNCIL
2005 FALL FIELD TOUR
The Watershed Management Council 2005 Fall Field Tour will be held in mid-October, 2005, in the California wine country. Dennis Bowker, of Stewardship Watershed Consultants, will lead us in exploring the interactions among expanding vineyards, irrigation, changing land use, and watershed management issues in the Napa Valley. While October 15 is the target date, at press time that had not been finalized. (Oct 14-16)
Contact Sheila Trick at 208-364-6168, [email protected], or watch the WMC web page www.watershed.org for current information and registration.
This will be a great trip -- join us!

22 WMC Networker Spring 2005
HELP OUT WITH CLIMATE CHANGE RESEARCH-- HERE’S HOW:
A research group in England, with funding from the Natural Environment Research Council, has set up a program that harnesses the idle computing capacity of home and office computers around the world to solve otherwise intractable climate modeling problems. Because there is uncertainty about many of the parameters, and coefficients used in General Circulation Models (GCMs), the only way to quantify the overall uncertainty and sensitivity to initial conditions in global warming predictions is to run thousands of combinations of the variables, and examine the statistical distribution of the results. Currently over 95,000 computers are part of the network, and more are joining daily. Participants have simulated over four million model years and donated over 8,000 years of computing time, making the network easily the world's largest climate modeling experiment, and comfortably exceeding the processing capacity of the world's largest supercomputers.
It is fun, and easy to join. Just go to www.climateprediction.net, set up an account, download the interface software (BOINC), and set your preferences. The central computer will send your machine an assignment, and when it is finished, up-load the results. As the model runs, the results in ½-hourly time steps will be displayed as a screen-saver. You will need a computer that runs at 800 mhz or faster. Explorer seems to work better with this site than Netscape.
The results of the first experiment published recently in Nature (1) show that greenhouse gases could cause global temperatures to rise by more than double the maximum warming so far considered likely by the Inter-Governmental Panel on Climate Change (IPCC). Average temperatures could eventually rise by up to 11°C - even if carbon dioxide levels in the atmosphere are limited to twice those found before the industrial revolution. Such levels are expected to be reached around the middle of this century unless deep cuts are made in greenhouse gas emissions.
Chief Scientist for climateprediction.net, David Stainforth, from Oxford University said: “Our experiment shows that increased levels of greenhouse gases could have a much greater impact on climate than previously thought.”
Climateprediction.net project coordinator, Dr. David Frame, said: “the possibility of such high responses has profound implications. If the real world response were anywhere near the upper end of our range, even today’s levels of greenhouse gases could already be dangerously high.”
(1) Stainforth, D.A., T. Aina, C. Christensen, M. Collins, N. Faull, D. J. Frame, J. A. Kettleborough, S. Knight, A. Martin, J. M. Murphy, C. Piani, D. Sexton, L. A. Smith, R. A. Spicer, A. J. Thorpe & M. R. Allen, Uncertainty in predictions of the climate response to rising levels of greenhouse gases, Nature, 433, pp.403-406, January 2005
AN OFFER FROM THE CENTER FOR WATERSHED PROTECTION: http://www.cwp.org/
The Rapid Watershed Planning Handbook is a comprehensive, practical manual that provides an excellent guide to creating an effective watershed plan quickly and cheaply. Geared towards watershed planning professionals, Rapid Watershed Planning contains everything needed to develop a cost-effective watershed plan, including management options, analysis tools, and case studies of real-world watershed plans. It also includes practical techniques for crafting an effective plan as well as guidance on plan mapping, monitoring, and modeling techniques. PRICE: $40.00
Better Site Design: A Handbook for Changing Development Rules in Your Community covers everything from basic engineering principles to actual vs. perceived barriers to implementing better site designs, the handbook outlines 22 guidelines for better developments and provides detailed rationale for each principle. Better Site Design also examines current practices in local communities, details the economic and environmental benefits of better site designs, and presents case studies from across the country. It includes a sample Codes & Ordinances Worksheet. PRICE: $35.00
The Practice of Watershed Protection on CD-ROM takes the classic hardcover copy and makes it an easy-to-use CD-ROM. Easily share watershed insights with colleagues, keep frequently-referenced articles on your desktop, and incorporate critical research data into your own projects. Even better, all electronic articles are in universal .PDF format with a small file size for easy sharing. The Practice is a comprehensive reference that contains 150 articles on all aspects of watershed
Watershed News

protection and represents a broad interdisciplinary approach to restoring and maintaining watershed health. Indexed for easy reference and with thought-provoking introductory material by Tom Schueler, this massive volume is an invaluable reference for anyone interested in the whys and how’s of watershed protection practices. (Regularly $25.00)
NEW WATERSHED MAPPING TOOLS AT FRAP
In case you haven’t yet heard, the California Department of Forestry FRAP (Fire and Resources Protection Program) has recently introduced a new set of Watershed Mapping Tools. The site includes watershed data (and the ability to download data by watershed) and an interactive mapping tool allowing the user to visualize and explore data on a watershed basis.
http://frap.cdf.ca.gov/watersheds/index.html
The purpose of this website is to provide information relevant to watershed assessment and planning for a wide range of audiences, e.g. watershed groups, landowners, and public agencies.
FRAP Watershed Program and Project Elementsprovides detailed information and links on the work FRAP is doing to support watershed programs and activities.
Data provides access to FRAP-developed and other spatial and tabular data sets relevant for watershed assessment and planning. Data may be accessed by theme or by watershed.
Visualization Tools provides access to FRAP's on-line GIS tools for identifying CALWATER watershed units and identifying watersheds with listed salmonid species.
NEW EPA ON-LINE TRAINING MODULE
A new on-line distance-learning training module called "Growth and Water Resources" has recently been posted on EPA's Watershed Academy Web. The URL is: http://www.epa.gov/watertrain/smartgrowth/
This training module explains how changes in land use affect water resources, and presents national data on trends in development patterns and activities on land that have become increasingly significant challenges for achieving water quality standards. Developed by EPA's Office of Wetlands, Oceans and Watersheds, the module
describes a combination of approaches to accommodate future growth in a way that benefits the economy and the environment and will help us meet out water resource goals.
Institutions for Sustainable Watershed Management: Reconciling Physical and Management Ecology in the Asia-Pacific. American Water Resource Association (AWRA) Summer Specialty Conference. June 27-29, 2005, Honolulu, Hawaii. Contact: Jason K. Levy, [email protected]; www.awra.org/meetings/Hawaii2005/index.html
Northern Reseach Basins 15th Annual International Symposium and Workshop. Conference Theme: “Links between human activities and high latitude hydrologic systems”.Aug. 2- Sept. 2, 2005, Luleå to Kvikkjokk, SwedenSee: http://aqua.tvrl.lth.se/NRB_2005.html
GIS for Watershed Analysis; Intermediate (18August), Advanced (19 August). 18-19 August, 2005, at UCDavis. UC Davis Extension. Contact 800-752-0881,or www.extension.ucdavis.edu/landuse.
American Fisheries Society 135th Annual Meeting. September 11-15, 2005, Anchorage, Alaska. Contact Betsy Fritz at 301-897-8616, ext. 212; [email protected]
Watershed Management Council Fall 2005 Field Trip: Watersheds, Vines and Wines. October25, 2005 (tentative date), Napa Valley, California. Contact Sheila Trick, 208-364-6186, [email protected].
AWRA 2005 Annual Water Resources Conference. November 6-10, 2005, Seattle, Washington. Contact: Pete Sturtevant, [email protected];www.awra.org/meetings/Seattle2005
Upcoming Meetings

24 WMC Networker Spring 2005
MEMBERSHIP ENROLLMENT
Name __________________________________________
Address ________________________________________
City, State, Zip __________________________________
Affiliation ______________________________________
Phone # ______________________________________
Email __________________________________________
$20 Student
$30 Regular Member ___________________________
$50 Institutional _______________________________
$40 Outside the U.S. ___________________________
$250 Donor
_______ Years @ $_______/ year = $__________
Membership dues are for 1 calendar year. Nonprofit institutional members receive 5 copies of each newsletter. The WMC is a nonprofit organization. All members receive subscriptions to WMC publications, discounts on conference fees, and full voting rights. Enroll online at www.watershed.org, or mail this form with your check to:
Sheila Trick, Coordinator Watershed Management Council
c/o University of Idaho-Boise Center for Ecohydraulics Research
322 E. Front St., Suite 340 Boise, Idaho 83702
What’s inside… President’s Column……………………………………..…2 Changing Climate, Changing Watersheds ..........................3 Recent changes towards earlier springs…………………...3 Wildfire in the West……………………………….………8 Online Collaboration for WMC………………………….12 Influence of 19th and 20th Century Landscape Modifications…………………………………………….13 Lake Tahoe is Getting Warmer………….….…………....17 Watershed News…………………………………………22 Upcoming Meetings……………………………………...23
Climate Change is Real
“There will always be uncertainty in understanding a system as complex as the world’s climate. However, there is now strong evidence that significant global warming is occurring. The evidence comes from direct measurements of rising surface air temperature and subsurface ocean temperatures, and from phenomena such as increases in average global sea levels, retreating glaciers, and changes to many physical and biological systems. It is likely that most of the warming in recent decades can be attributed to human activites. This warming has already led to changes in the Earth’s climate.”
From the Joint Statement of the National Academies of Science of the G-8 nations, plus Brazil, China and India, June 2005.
Watershed Management Council c/o University of Idaho-Boise
College of Engineering 322 E. Front Street, Suite 340
Boise, Idaho 83702
ADDRESS CORRECTION REQUESTED