Embed Size (px)
Citation preview
Smart Structures and Systems, Vol. 6, No. 5-6 (2010) 619-639 619
Wireless sensor networks for underground railway applications: case studies in Prague and London
Peter J. Bennett1, Kenichi Soga1*, Ian Wassell2, Paul Fidler1, Keita Abe3, Yusuke Kobayashi3 and Martin Vanicek4
1Department of Engineering, University of Cambridge, Trumpington Street, Cambridge CB2 1PZ, UK2Computer Laboratory, University of Cambridge, William Gates Building,
15 JJ Thomson Avenue, Cambridge CB3 0FD, UK3Japan Railway Technical Research Institute, Japan
4Czech Technical University in Prague, Zikova 4, 166 36, Prague 6, Czech Republic
(Received October 14, 2009, Accepted April 1, 2010)
Abstract. There is increasing interest in using structural monitoring as a cost effective way of managingrisks once an area of concern has been identified. However, it is challenging to deploy an effective, reliable,large-scale, long-term and real-time monitoring system in an underground railway environment (subway /metro). The use of wireless sensor technology allows for rapid deployment of a monitoring scheme and thushas significant potential benefits as the time available for access is often severely limited. This paper identifiesthe critical factors that should be considered in the design of a wireless sensor network, including theavailability of electrical power and communications networks. Various issues facing underground deploymentof wireless sensor networks will also be discussed, in particular for two field case studies involving networksdeployed for structural monitoring in the Prague Metro and the London Underground. The paper describes thenetwork design, the radio propagation, the network topology as well as the practical issues involved indeploying a wireless sensor network in these two tunnels.
Keywords: tunnel; wireless sensor network; monitoring.
1. Introduction
There is increasing demand in cities for space. This applies to the underground environment just
as much as above ground, with more buried infrastructure required, deeper piles needed for tall
buildings, deeper basements being constructed and even other transportation tunnels being built.
This underground congestion has implications for underground railways (metros or subways) as it
can change the loading on existing structures. These changing loads combined with the deterioration
of these structures due to aging and natural variations mean that there are changing demands being
placed on the structures of underground railways.
Monitoring is progressively being seen as a cost effective way to minimise identified risks and is
increasingly deployed underground. It is challenging to deploy an effective, reliable, large-scale,
long-term and real-time monitoring system in an underground railway environment. There exists a
*Corresponding Author, Professor, E-mail: [email protected]
620 Peter J. Bennett et al.
number of potential hurdles to be overcome such as the underground environment that can be damp
and even corrosive. Such an environment can impact reliability, which is a major concern for
systems that are ‘safety critical’. There are also limits on the availability of electrical power and
communications. The time available to deploy these systems is severely limited as well, normally
being restricted to non-operating (engineering) hours. Installing the cables required to transmit both
the power and data for the sensors can take a significant proportion of the overall installation time
available. This is especially true in tunnels where the clearance between the tunnel lining and the
trains may be limited and hence particular care has to be taken to keep the cables close to the walls.
The use of wireless sensor technology, which transmits the sensor data using radio, allows a rapid
deployment due to elimination of some of the cabling and thus has significant potential benefits.
Combined with microelectromechanical systems (MEMs) sensors, which can be cheaper and have the
advantage of using less power, there is the opportunity for significant overall cost savings (for example,
accelerometer (Lynch et al. 2006), acoustic emission (Glaser et al. 2007), Inclinometer (Yu et al. 2009)).
Although advantages of WSNs for conditioning monitoring of infrastructure have been identified,
deployment of WSNs in real environment remains to be challenging (Barrenetxea et al. 2008, Hoult et
al. 2009a, Stajano et al. 2010). Current research investigating the use of WSNs for structural health
monitoring (SHM) has focused mainly on bridges and acceleration monitoring e.g., Lynch et al. (2006),
Glaser et al. (2007), Kim et al. (2007), Grosse (2008) and Whelan and Janoyan (2009). Very few groups,
to our knowledge, have deployed WSNs with the goal of using them for long-term monitoring. Among
those few are Feltrin et al. (2007) and here again the main parameter being measured is vibration.
While such research has helped to advance the state-of-the-art in WSN monitoring, the tunnel
environment provides unique challenges (Akyildiz and Stuntebeck 2006, Bennett et al. 2009). Initial
work was undertaken into the use of WSNs for monitoring in the London Underground as part of
the Cambridge-MIT Institute project (Cheekiralla 2004). However, this work was limited both in
terms of scale and time. The other past work includes detection of collapses in coal mines by
sensing the removal of sensors in the collapsed area (Li and Liu 2007) and a wireless seismic array
is under development at the Deep Underground Science and Engineering Laboratory (DUSEL)
(Glaser and Parkkila 2009). There is also a larger body of work on radio propagation underground,
with particular emphasis on telecommunication applications, but also applicable for WSNs (for examples,
see proceedings of the international workshop and conference Wireless Communications in Underground
and Confined Areas (Fares et al. 2005, Wu and Wassell 2009).
The current research seeks to determine what the issues are with using WSNs for SHM in an
underground environment. This paper identifies various issues facing underground deployment of a
wireless sensor network, based on two field case studies involving networks deployed for structural
monitoring in the Prague Metro and the London Underground. The paper describes the network
design and the radio propagation as well as the practical issues involved in deploying a WSN in
these two tunnels.
2. Field trial sites
2.1 Prague Metro
First opened in 1974, the Prague Metro has three lines and consists of approximately 50 km of
tracks, running mostly underground and 54 stations. In August 2002, the Metro suffered from the
flooding that occurred across much of Central Europe. Fig. 1 shows the extent of flooding that

Wireless sensor networks for underground railway applications: case studies in Prague and London 621
occurred on the Prague Metro. Nineteen stations were flooded and several building movements
have been attributed to this event. The long term effects of the damages caused by the flooding
are a major concern to the underground operator. In this study, an area of concern was identified
in a section approximately 350 m from Nadrazi Holesovice station of Line C, towards Vltavska
station, where cracks were visible in the lining. A wireless sensor network was designed to
monitor this location and a control section further up the same tunnel, which had no signs of
damage. The tunnel was constructed using the ‘Prague’ ring tunnelling method with a lining
consisting of 200 mm thick reinforced concrete segments with an internal diameter of 5.1 m. The
tunnel depth in this location is approximately 12.6 m. Further details of the site can be found in
(Vanicek 2008).
2.2 London Underground
London currently has one of the most extensive networks and some of the oldest sections of
underground tunnels in the world. London Underground Ltd. has 392 km of railway lines. Approximately
35% of the network (140 km) is underground tunnels and many of them are 75-100 years old. One
of the significant areas of concern is a 200 metre section of expanded concrete tunnel on the Jubilee
Line, where concrete spalling has been occurring at the radial joints of the precast tunnel lining
panels. The cause of the spalling is high contact stresses, combined with a poor out-of-circular build
which occurred as a result of difficulties encountered during construction in the mid 1970’s (Lyons
1979). In the area being studied the tunnel has a depth of approximately 35 m and is mostly in the
top portion of the Lambeth Group strata, although the crown rises into the London Clay as shown
in Fig. 2, which shows a geological section of the test site. As with most London Underground
tunnels the tunnel diameter is quite small with an internal diameter of only 3810 mm and a 168 mm
thick lining and the clearance between the linings and the trains is very small, which provides
Fig. 1 Flooding on Prague Metro (Vanicek 2008)

622 Peter J. Bennett et al.
additional challenges in sensor deployment. Further details of the site can be found in (Bennett et
al. 2009, Cheung et al. 2009).
3. Wireless sensor network hardware
The radio modules used in both trials were MICAz boards made by Crossbow, operating at 2.4
GHz and using the XMesh routing protocol also produced by Crossbow. This allows sensor motes
to automatically form a ‘mesh’ network, in which motes can relay the messages from other motes.
Interface boards were developed for the sensors required, i.e., crackmeters and inclinometers
(Stajano et al. 2010, Hoult et al. 2009b). Low cost and low power sensors were used to extend the
life of the batteries used to power the sensor motes.
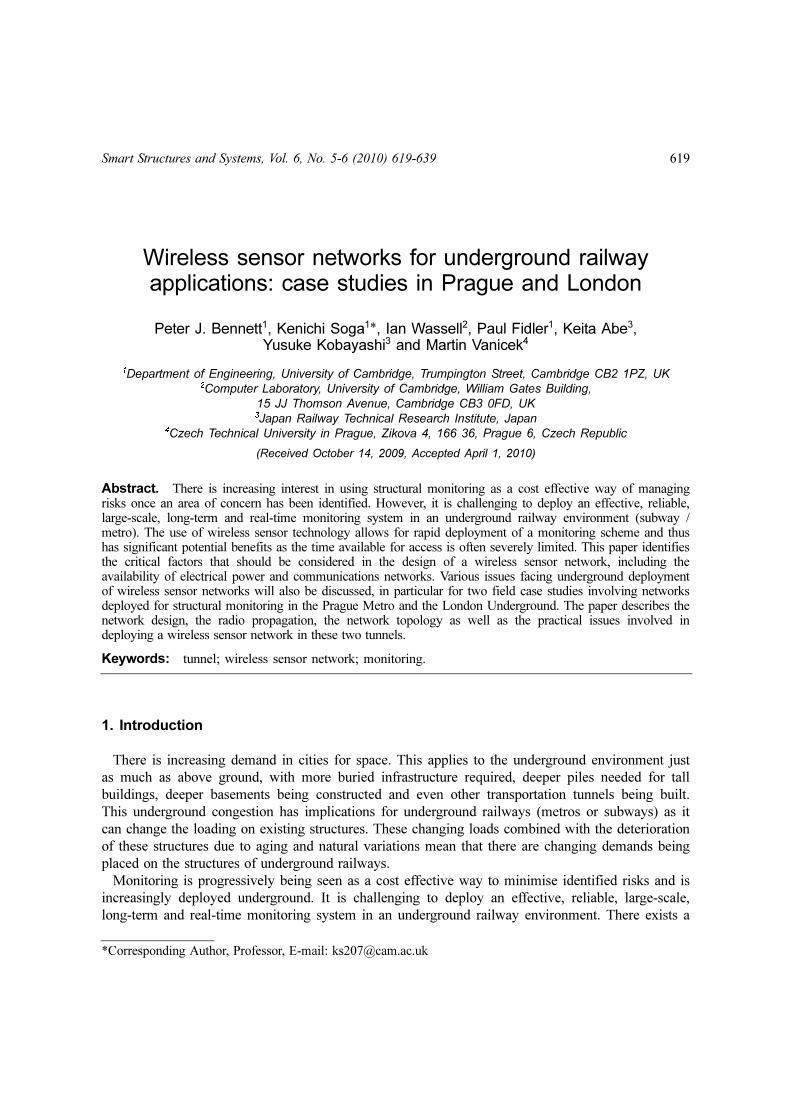
The crackmeter module, as shown in Fig. 3, incorporates two linear potentiometric displacement
transducers (LPDTs), one across the joint/crack under observation and one as a control, and two
relative humidity and temperature sensors (one internal, one external to the protective box that the
sensor node is placed in). The overall dimensions of the protective box are 145 mm × 220 mm × 50
mm; the 2 dBi / 5 dBi antenna extends a further 58 mm / 215 mm from the side. The smaller 2 dBi
antennas were used in London, where clearance was more of an issue, and the 5 dBi antennas were
used in Prague to provide longer radio communication range. In both sites, the antennas are located
approximately 25 mm from the tunnel wall, i.e., half the thickness of the protective box.
The LPDTs have a total range of 12 mm and they act as a potential divider, with the output
voltage varying linearly with displacement across the centre of this range. This output voltage is
measured by a 10-bit ADC on the CPU of the MICAz giving a resolution of 0.012 mm. Both LPDTs are
then mounted on a single circuit board, which is secured to the tunnel lining using drilled concrete
anchors. The LPDTs are spring loaded and pressed against an angled plate that is also secured to
the lining on the other side of the crack / joint. The cost of each LPDT is approximately $60. The
relative humidity and temperature sensors come as a single unit: the Sensirion SHT11. The readings
from all of the sensors are transmitted in the same data packet.
Fig. 2 Geological section in WSN area in London
Wireless sensor networks for underground railway applications: case studies in Prague and London 623
Fig. 3 Crackmeter module
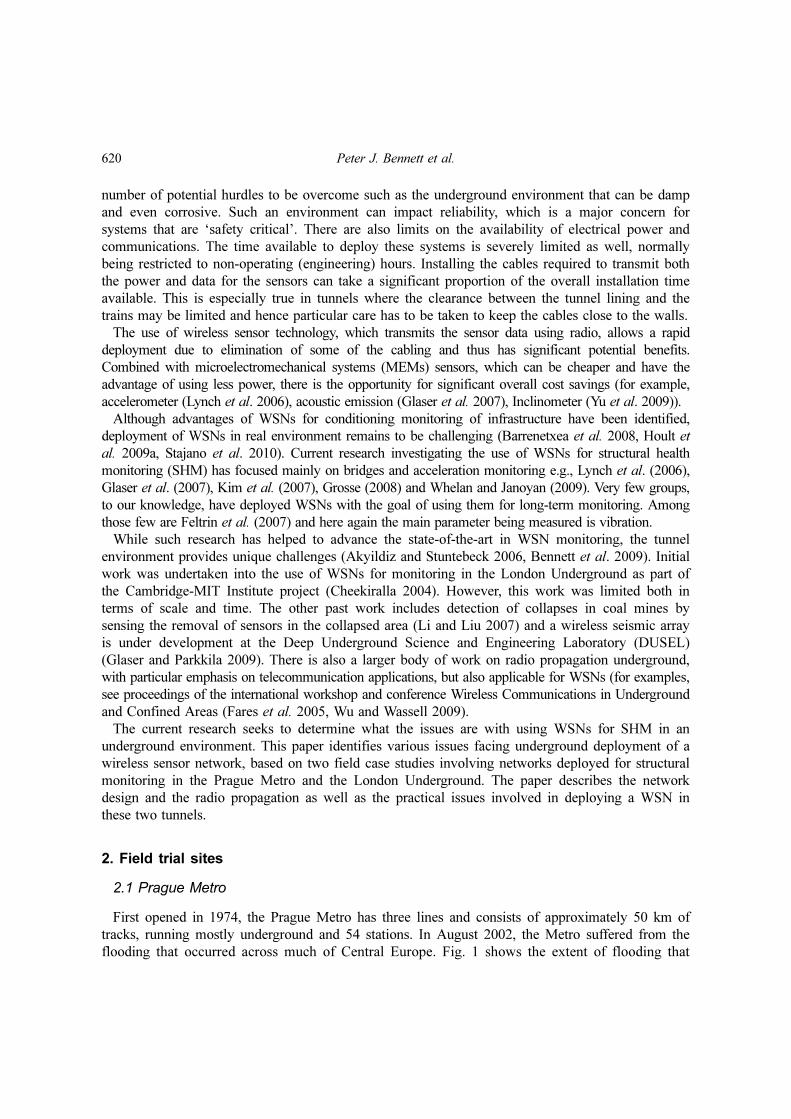
Fig. 4 Inclinometer module

624 Peter J. Bennett et al.
The inclinometer module, as shown in Fig. 4, also contains two Sensirion digital humidity and
temperature sensors, monitoring the internal and external environment. The inclinometer sensor is a
MEMS device (a VTI Technologies SCA103T-D04). It has a resolution of 0.001o with a ±15o range
and costs approximately $60. To achieve this resolution the analogue output from the chip is measured
by a 16-bit ADC external to the MICAz. An additional 9V battery is used only for the inclinometer
and ADC, which are only powered briefly when taking a measurement. The overall dimensions of
the installed module in its protective box are 90 mm × 145 mm × 50 mm; again the 2 dBi / 5 dBi antenna
extends a further 58 mm / 215 mm from the side.
Additional modules were installed as relays and have the same form factor as the inclinometer
module, but do not have sensors inside, only the radio module. For both the Prague and London
networks the messages are received at a Gateway, the Crossbow MIB600, which in turn is linked
via Ethernet cable to a single-board computer with a GPRS modem. All the measurement readings
are time stamped to permit the data to be entered in the correct order into the database, enabling
comparison between measurements made at different sensors. The data is transmitted via a modem
and the Internet to a server at the University of Cambridge where it is stored as both text files and
in a database. The readings are then displayed on a web page.
4. Network design
4.1 Radio propagation inside tunnels
In the London Underground and the Prague Metro, accurate measurements have been made of the
received signal power with different transmission variables, for example, antenna position (both on
the same side, on opposite sides or both in the centre of the tunnel), lining material and operating
frequency. Rather than presenting the results in terms of the received power, the concept of
propagation path loss (PL) is used to characterise the quality of the radio channel, since it is a
dimensionless quantity that is independent of transmit power or antenna gain. That is, the greater
the value of PL is, the worse the channel is and the greater the attenuation is. The PL can be related
to the received signal power (PRx) in dBm as follows
(1)
where PTx(dBm) is the transmit power in dBm, PPL is the PL (in dB), LC is the total cable loss (in dB), and
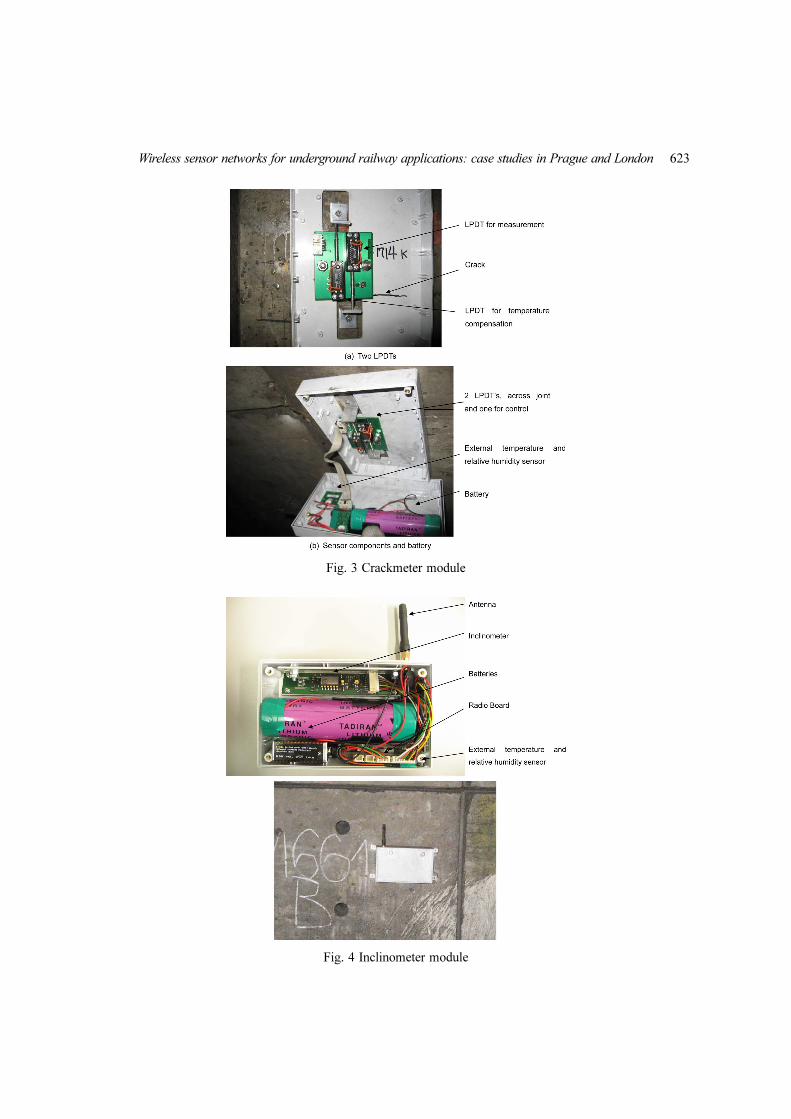
GANT is the overall antenna gain (in dBi). Fig. 5 shows the measured PL in the Bond Street London
Underground tunnel with antennas located on the same side of the tunnel (Wu et al. 2009). This
measurement was taken at a frequency of 2.45 GHz, with the transmit antenna spaced at 20 mm from
the tunnel wall and the receive antenna at 110 mm from the tunnel wall. A radio receiver is specified to
yield a particular data packet loss rate at a certain receiver input power level. However, if the received
signal power is below the minimum sensitivity level of the receiver, then data packets will be lost at the
receiver. The manufacturer usually specifies the minimum receiver sensitivity level, but if possible, it is
also advisable to confirm it by measurement.
A line is drawn on Fig. 5 showing the maximum PL that can be tolerated for a specified receiver
minimum sensitivity level, antenna gain and transmit power. Re-arranging Eq. (1) gives
(2)
PRx dBm( ) PTx dBm( ) GANT LC– PPL–+=
PPL PTx dBm( ) GANT LC– PRx dBm( )–+=
Wireless sensor networks for underground railway applications: case studies in Prague and London 625
where for example: PTx(dBm) = -9 dBm; PRx (min.) = -90 dBm; GANT = 4 dBi (i.e., 2 × 2 dBi), and
LC = 0 dB, yielding a maximum tolerable PL for correct data transmission, PPL (max.) = 85 dB. In this
example it is assumed that the antennas are directly connected to the Radio Frequency (RF) connector
on the radio modules, i.e., the cable loss is zero, LC = 0 dB.
In addition to the gradual increase in PL with antenna separation observed in Fig. 5, there are
local rapid variations in the received signal power owing to multi-path ‘fading’. At close antenna
separations (region (a) in Fig. 5), losing a data packet is very unlikely since the PL is much less
than the maximum tolerable PL, i.e., the probability of a fade being sufficiently deep to increase the
PL to a value in excess of the maximum tolerable PL is very low in this region.
At greater antenna separations (the shaded area (b) in Fig. 5), there is a much greater chance that
the PL will exceed that of the maximum tolerable PL. Consequently the probability of losing data
packets will rise. At even greater antenna separations (region (c) in Fig. 5), the PL is always greater
than the maximum tolerable PL. Hence, no successful transmission of data packets is possible.
At both sites a simple initial survey of the radio propagation environment was performed prior to
installation using two MICAz modules, one programmed to transmit repeatedly and the other
programmed to blink when the message is received. The transmitter was fixed to the tunnel lining
while the receiver was moved away from the transmitter (while maintaining a position close to the
tunnel wall) to investigate the effect of antenna separation on the loss of data packets. Based on
these measurements and from the results shown in Fig. 5, the distance between wireless modules for
both installations was chosen conservatively to be less than 20 m in order to guarantee a high
probability of correct data transmission between the wireless modules.
From consideration of Eq. (2), it can be seen that increasing the antenna gain will raise the
maximum level of PL that can be tolerated, i.e., it will increase the communication range. Alternatively,
if it is necessary to maintain a particular range between a pair of modules, then increasing the
antenna gain will improve the data packet loss rate (i.e., reduce the number of lost packets).
Although impractical, the best PL performance was obtained with transmitter and receiver
antennas in the centre of the tunnel. Placing the antennas on the same side of the tunnel was
Fig. 5 Radio propagation in London Underground tunnel (Bond Street) - antennas on the same side of tunnel
626 Peter J. Bennett et al.
marginally advantageous over placing them on opposite sides of the tunnel. One significant reason
why the maximum antenna separation is so much greater when both antennas are located in the
centre of the tunnel is owing to the modification of the transmission radiation pattern of an antenna
when it is placed close to a wall. The distance the antenna can be mounted away from the wall is
constrained by the required clearance between the tunnel lining and the train, and is only ~50 mm
in this section of tunnel. The issue of clearance is a particular problem in the London Underground
since the tunnel diameters are very small, but even in the Prague Metro the distance the sensors
could protrude was limited to a similar value so they could be placed at any point around the tunnel.
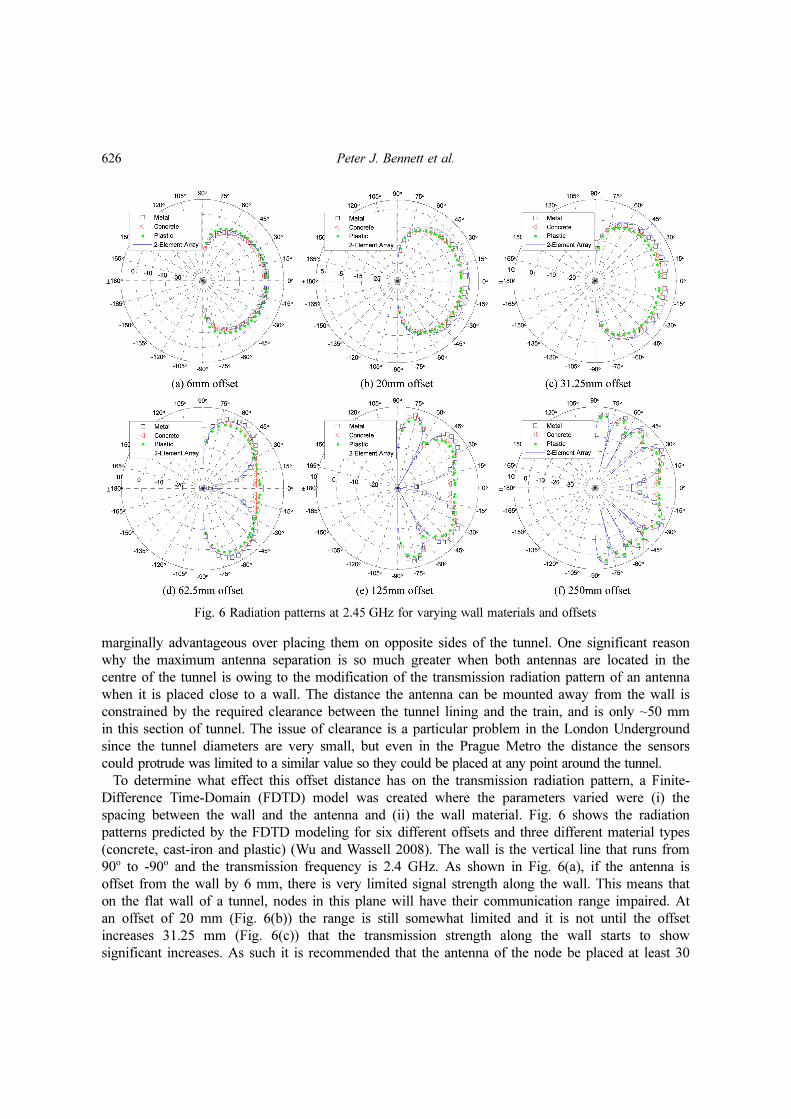
To determine what effect this offset distance has on the transmission radiation pattern, a Finite-
Difference Time-Domain (FDTD) model was created where the parameters varied were (i) the
spacing between the wall and the antenna and (ii) the wall material. Fig. 6 shows the radiation
patterns predicted by the FDTD modeling for six different offsets and three different material types
(concrete, cast-iron and plastic) (Wu and Wassell 2008). The wall is the vertical line that runs from
90o to -90o and the transmission frequency is 2.4 GHz. As shown in Fig. 6(a), if the antenna is
offset from the wall by 6 mm, there is very limited signal strength along the wall. This means that
on the flat wall of a tunnel, nodes in this plane will have their communication range impaired. At
an offset of 20 mm (Fig. 6(b)) the range is still somewhat limited and it is not until the offset
increases 31.25 mm (Fig. 6(c)) that the transmission strength along the wall starts to show
significant increases. As such it is recommended that the antenna of the node be placed at least 30
Fig. 6 Radiation patterns at 2.45 GHz for varying wall materials and offsets

Wireless sensor networks for underground railway applications: case studies in Prague and London 627
mm away from the wall if transmission range along the wall is critical.
For metal structures, if the node is placed 125 to 250 mm away from the wall, the radiation
pattern becomes significantly non-uniform. There are lobes that form between which the transmission
strength falls dramatically. Whilst the transmission strength along the wall continues to be quite
high, if the proposed WSN is to have nodes placed out of the plane of the wall, consideration must
be given to where they will be located. Further details of transmission patterns close to walls can be
found in (Wu et al. 2009, Wu and Wassell 2008).
4.2 Network geometry
The network design adopted for the Prague Metro is shown in Fig. 7. The WSN was installed in
September 2008. A total of 28 motes were installed; 10 inclinometer motes, 2 crackmeter motes and
16 relay motes. From each sensor mote, a data packet was sent every 3 minutes. A mobile phone
network is available to users in the stations, meaning that the computer and modem can be situated
in the mouth of the tunnel in the vicinity of the station. Access to the WSN installation site was
from a special train that has platforms at different levels allowing work to be conducted at varying
Fig. 7 Wireless sensor network installation in Prague Metro
628 Peter J. Bennett et al.
heights in the tunnel. This means placing sensors at the same height along the tunnel could be
achieved with relative ease by moving the train down the tunnel. Electrical power is available in the
tunnel with junction boxes situated every ~50 m. The computer/modem and MIB600 gateway are
both powered from nearby junction boxes. The two areas of concern are linked by relays spaced by
20 m, allowing a network that uses extensive hopping to be tested.
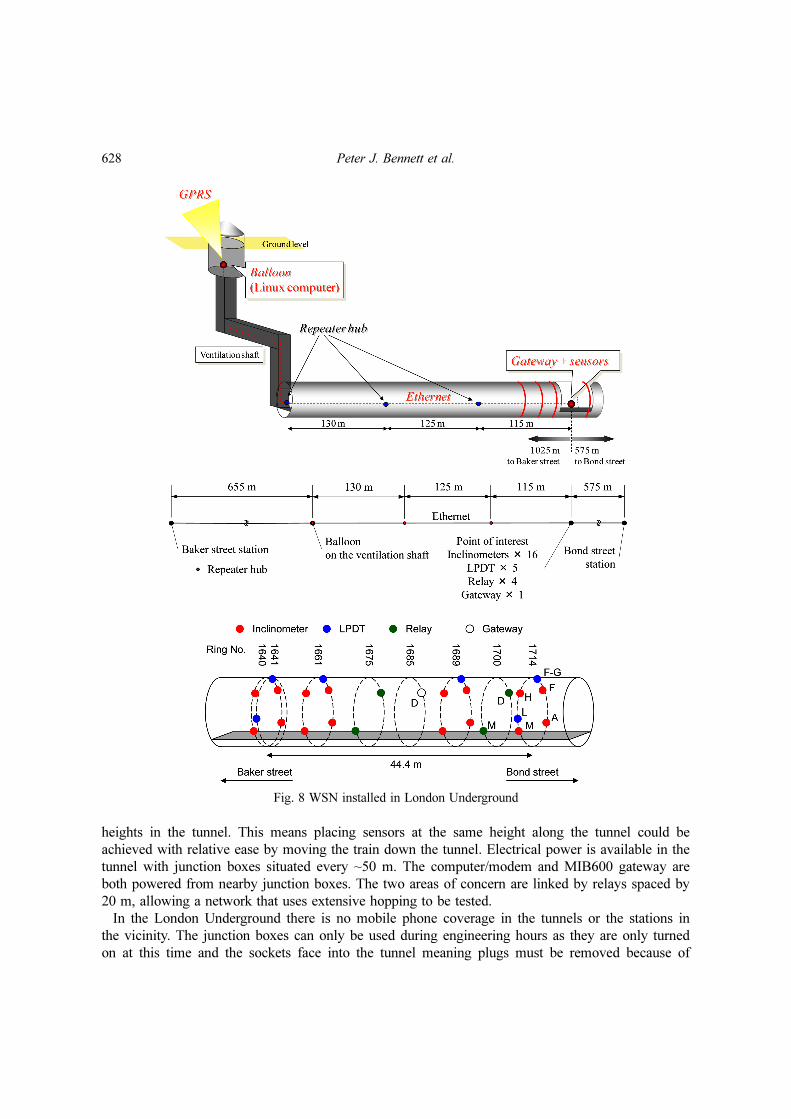
In the London Underground there is no mobile phone coverage in the tunnels or the stations in
the vicinity. The junction boxes can only be used during engineering hours as they are only turned
on at this time and the sockets face into the tunnel meaning plugs must be removed because of
Fig. 8 WSN installed in London Underground
Wireless sensor networks for underground railway applications: case studies in Prague and London 629
clearance issues when trains are running. Because the clearance is so tight no personnel are allowed
in the tunnels when trains are moving and access must be from scaffold towers erected each night.
The network designed to fit these constraints is shown in Fig. 8. A total of 25 motes were installed;
16 inclinometer motes, 5 crackmeter motes and 4 relay motes. From each sensor mote, a data
packet is sent every 3 minutes.
The computer and mobile phone modem are located at the top of the closest vent shaft where
there is mobile phone coverage and an electrical supply. These are connected to the MIB600
gateway using an Ethernet cable with relays which are all also powered by a DC supply from the
top of the vent shaft. Using Ethernet cable rather than wireless relays allowed for faster installation
for transmission along the tunnel where the cabling could be laid in the existing cable trays. This
hybrid system therefore uses wireless for communications around the circumference of the tunnel in
the area of interest where there are no cable trays, thus making the use of wireless modules a better
choice. The WSN was installed in July 2008.
5. Network performance
5.1 System reliability and robustness
There are two main areas of concern when it comes to reliability/robustness of WSN systems:
hardware and radio connectivity. The Prague and London Underground deployments have both
suffered from hardware failures related to the gateways. The connection between the computer and
the MIB600 has been identified as a weak link in both gateway systems. In the case of the Prague
Metro a failure of the USB to Ethernet connection resulted in the gateway not logging data for
several months until this hardware was replaced. In the London Underground a similar failure of the
MIB600/Ethernet connection also resulted in interrupted data logging. The solution in both cases is
the installation of a redundant gateway, which would be a prudent solution in any WSN system
given the importance of the gateway.
Both networks also have experienced connectivity issues. The Crossbow software at each node
(including relays) creates and transmits data packets, which contain information about the network
connectivity. The time interval to send data packets was set to be 180 sec. Hence ideally the total
number of data packet that the Gateway receives is 13,440 (480 data/day × 28 motes) for the
Prague Metro WSN and 12,000 (480 data/day × 25 motes) for the London Underground WSN. An
indicator for the connection quality is the ratio of the number of packet that are dropped (i.e. not
transmitted) to the total expected number of packet transmitted. In this study, the data loss percentage is
defined by the following equation:
(3)
where Ri is the data loss percentage for mote i, Ei is expected value of the number of data packet from
mote i and Ni is the measured number of data packet from mote i. Ei is introduced by the time interval
for transmitting data set on the motes ∆t and a specific time volume during the investigation i.e., Ei = T/
∆t. The number of data packet from the motes is counted at the gateway, so the loss by traveling across
several motes to reach to the gateway is also included in this ratio.
Fig. 9(a) shows the time history of the data loss ratio of motes having mote identification numbers
8209 and 8213, installed at the ring cluster 2 (control ring) in the Prague Metro WSN. The other
Ri %( ) Ei Ni–( ) 100/Ei×=

630 Peter J. Bennett et al.
motes in the Prague Metro WSN showed similar time history trends. The data loss percentage
during engineering hours is between 10 and 30%, whereas that during traffic hours is between 25
and 35% (note that the data missing between November 2008 and February 2009 is related to the
gateway connection problem as discussed before). Fig. 9(b) shows the time history of the data loss
percentage of motes having mote identification numbers 16562 and 16593, installed at the ring 1640
in the London Underground WSN during engineering hours (1:00am to 4:30am) and traffic hours
(4:30am to 1:00am). The data loss percentage during engineering hours is between 0 and 10% and
that during traffic hours is between 20 are 30%. The other motes in the London Underground WSN
showed similar time history trends. Passing of trains during traffic hours influenced the transmission
between motes, which increased the number of the lost data packets.
The difference in the data loss between the two networks is possibly related to communication
distance and the number of hops. Fig. 10 shows the hop number versus distance to the gateway.
In the Prague Metro WSN (Fig. 10(a)), the maximum communication distance is 170 m. The
maximum distance for the one hop cases is 110 m, which corresponds well to the results of the
radio propagation measurements shown in Fig. 5. For the mote placed at the maximum
communication distance, three hops were necessary. In the London Underground WSN (Fig.
10(b)), the maximum communication distance is 27.5 m, which is much smaller than the Prague
Metro WSN. The majority of the data packets travelled to the gateway by a single hop. Even the
Fig. 9 Time history of data loss ratio during engineering hours and traffic hours
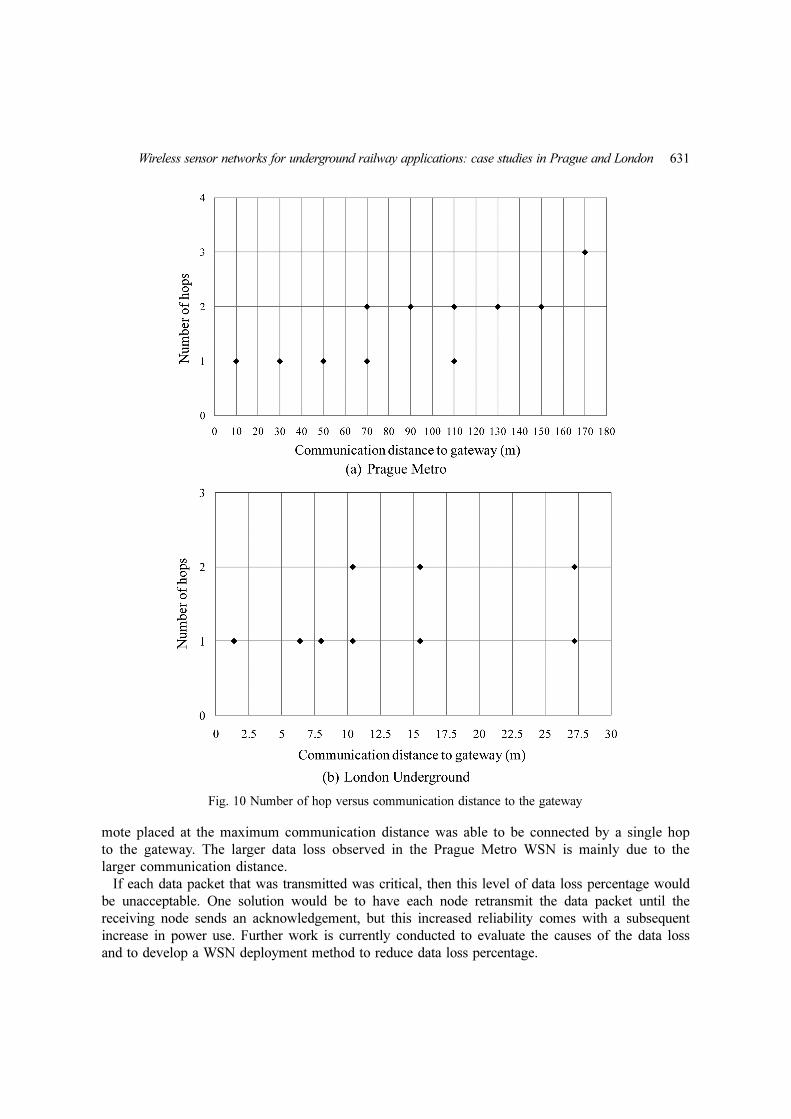
Wireless sensor networks for underground railway applications: case studies in Prague and London 631
mote placed at the maximum communication distance was able to be connected by a single hop
to the gateway. The larger data loss observed in the Prague Metro WSN is mainly due to the
larger communication distance.
If each data packet that was transmitted was critical, then this level of data loss percentage would
be unacceptable. One solution would be to have each node retransmit the data packet until the
receiving node sends an acknowledgement, but this increased reliability comes with a subsequent
increase in power use. Further work is currently conducted to evaluate the causes of the data loss
and to develop a WSN deployment method to reduce data loss percentage.
Fig. 10 Number of hop versus communication distance to the gateway
632 Peter J. Bennett et al.
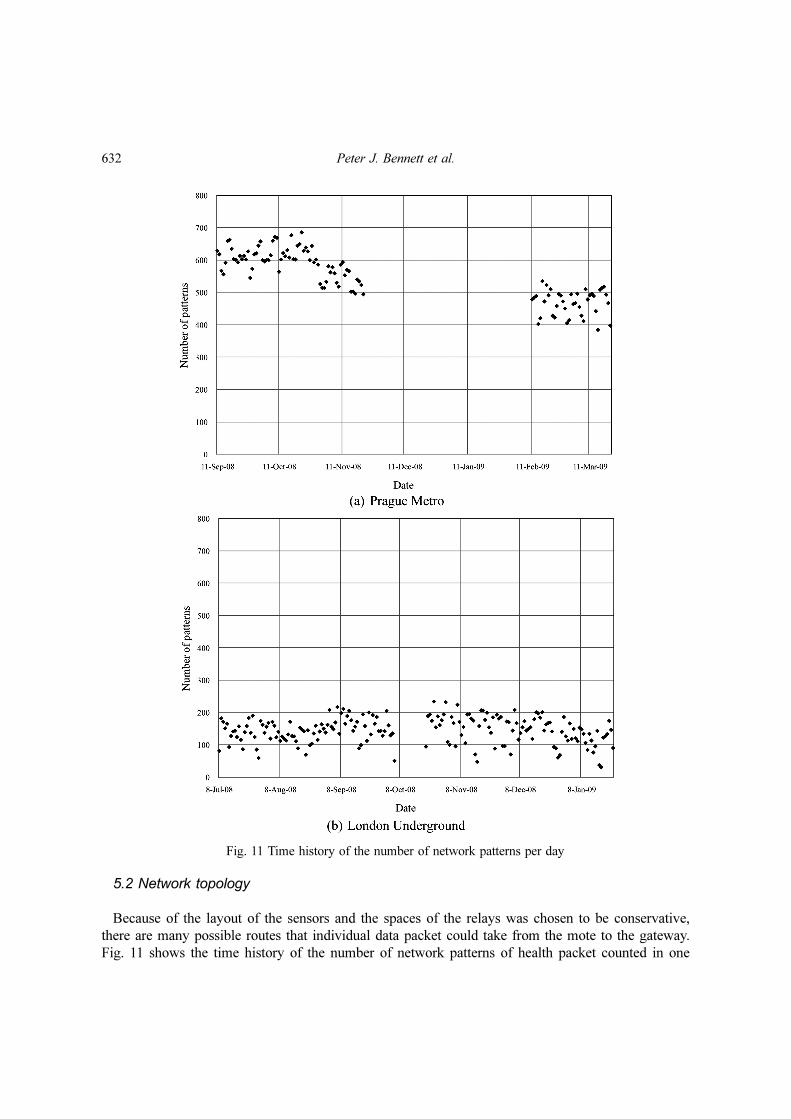
5.2 Network topology
Because of the layout of the sensors and the spaces of the relays was chosen to be conservative,
there are many possible routes that individual data packet could take from the mote to the gateway.
Fig. 11 shows the time history of the number of network patterns of health packet counted in one
Fig. 11 Time history of the number of network patterns per day

Wireless sensor networks for underground railway applications: case studies in Prague and London 633
day. The number of network pattern is between 50 and 200 for the London Underground WSN and
between 400 and 700 for the Prague Metro WSN. The smaller number for the London WSN is due
to a smaller network with less number of relay routes. For the Prague Metro WSN, it is interesting
to note that the number decreased with time. The reason for this requires further investigation, but
the decrease in battery power with time may have contributed to the removal of the network
patterns that have long transmission distance.
As the sensor/relay spacing is conservative, relay motes are not always likely to be used, with
some sensors being more likely to contact sensors closer to the gateway. The health packet from a
mote has both a parent mote ID and a mote ID. From this information, it is possible to compute the
probability of each link between motes. The probability of the link from mote i to mote j is
introduced using the following equation
(4)
where is the possibility of the link from mote i to mote j. is the number of health packets
transmitted from mote i to mote j. ni is the total number of the motes which transmitted health packets
to mote i.
Fig. 12 shows all the communication links. The thick solid arrows are the links with a probability
of above 50%, whereas the thin solid arrows are the links with a probability between 10% and 50%.
The thin dotted arrows are the links with a probability below 10%; that is, there are many other links
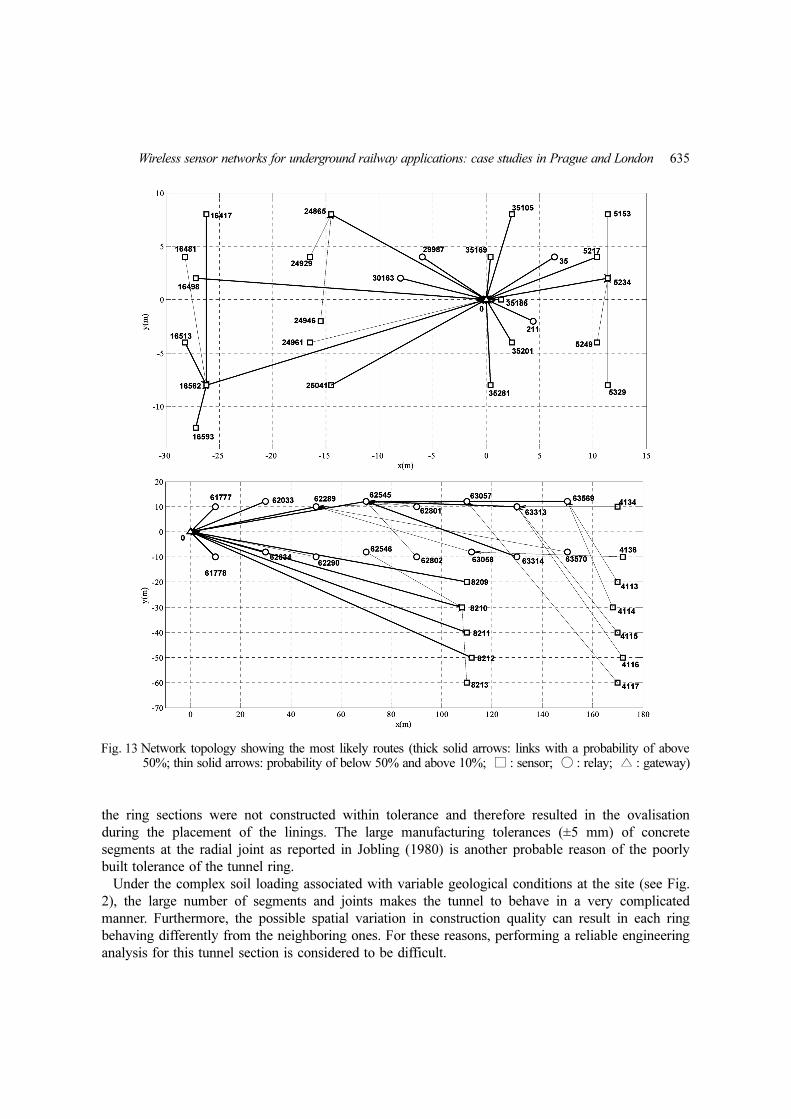
from these motes. Fig. 13 shows the most likely routes. Both figures illustrate that the communication
between motes is quite busy and complicated. Both networks show that a large number of relay
motes provides different possibilities for routing. In the case of the London Underground WSN,
there is less number of relay motes and therefore some sensor motes are used for relaying the data.
The sensor motes of the two rings located away from the gateway (Ring 1640 and Ring 1714 in
Fig. 8) tend to send the data to one of the sensor motes and then the selected mote transmits the
data to the gateway. It also appears that the present network protocol makes sensor motes to
communicate directly to the gateway if possible, which may influence the data loss percentage
when the communication distance is large. As shown in the Prague Metro WSN case, the data are
hopped to the gateway only when sensor motes cannot communicate directly to the gateway.
The large number of changes does have the advantage that it helps even out the number of data
packet individual sensor has to relay. If one sensor were to have to relay a large amount of data
packets, its battery would go flat first. Hence, a more balanced network can go longer between battery
changes. The optimisation of WSN network that provides redundancy and prolongs the lifetime
requires further investigation (Hirai and Soga 2010).
5.3 Preliminary monitoring results
The WSN in the Prague Metro has not measured any movement of the tunnel lining. However,
the results from the London Underground WSN do indicate movements of the tunnel lining, which
will be discussed more in detail here.
The concrete lining ring at the London Underground WSN site consists of 20 segments plus 2
wedge blocks at knee level as shown in Fig. 14. The tunnel was constructed between 1973 and
1979 using conventional Greathead tunnelling shields. Most of the excavation was carried out
Pi j→ Ni j→ Ni k→
k 1=
ni
∑=
Pi j→ Ni j→

634 Peter J. Bennett et al.
manually and by mechanical excavators in some cases. The tunnel lining construction was completed by
first installing 168 mm thick concrete segments in position. They were then pushed by two wedge-
key segments at knee level, and locked in compression against the ground.
Lyons (1979) reports that the major difficulty during the construction was the loss of ground
above the shoulder level due to the low cohesion of the surrounding soil. As the Greathead shield
method involves overcutting of the tunnel with the gaps filled by grout subsequently, it is likely that
Fig. 12. WSN network topology with all communication links (thick solid arrows: links with a probability ofabove 50%; thin solid arrows: probability of below 50% and above 10%; thin dotted arrows: probability ofbelow 10%; □ : sensor; ○ : relay; △ : gateway)
Wireless sensor networks for underground railway applications: case studies in Prague and London 635
the ring sections were not constructed within tolerance and therefore resulted in the ovalisation
during the placement of the linings. The large manufacturing tolerances (±5 mm) of concrete
segments at the radial joint as reported in Jobling (1980) is another probable reason of the poorly
built tolerance of the tunnel ring.
Under the complex soil loading associated with variable geological conditions at the site (see Fig.
2), the large number of segments and joints makes the tunnel to behave in a very complicated
manner. Furthermore, the possible spatial variation in construction quality can result in each ring
behaving differently from the neighboring ones. For these reasons, performing a reliable engineering
analysis for this tunnel section is considered to be difficult.
Fig. 13 Network topology showing the most likely routes (thick solid arrows: links with a probability of above50%; thin solid arrows: probability of below 50% and above 10%; □ : sensor; ○ : relay; △ : gateway)

636 Peter J. Bennett et al.
In order to assess the risk of lining movements, the tunnel maintenance contractor installed
various instrumentation at joints (including this WSN system), which have already spalled or might
be susceptible to spalling based on the surveyed joint orientations. In addition heavy steel strapping
has been designed. If further monitored movements occur which are approaching a predetermined
critical trigger level, it has been decided that the pre-fabricated strapping will be quickly installed.
The results for six months from ring 1714, the ring showing the largest movement, are shown in
Fig. 15. The data shows the change in the readings from the sensors since they were insta1led. The
position of the sensors is shown in Fig. 8. A positive trend on the crackmeters means that the crack
/ joint is opening / widening at the surface. A positive trend from the inclinometers indicates that
the top of the inclinometer is moving away from the centre of the tunnel. The data from both the
inclinometers and crackmeters is a good fit to a linear trend, but monitoring over a longer period
will be required to check for annual fluctuations. Assuming a linear fit, the raw data from the
inclinometers gives a standard error of 0.003º. The noise on the crackmeter is comparable with the
resolution of the 10-bit ADC on the MicaZ (0.012 mm), so the readings appear ‘stepped’. However,
the trend still appears to be good fit to a linear trend.
Fig. 14 Expanded concrete tunnel on the Jubilee Line between Baker Street and Bond Street stations
Fig. 15 Results from monitoring on the London Underground (Bennett et al. 2009)
Wireless sensor networks for underground railway applications: case studies in Prague and London 637
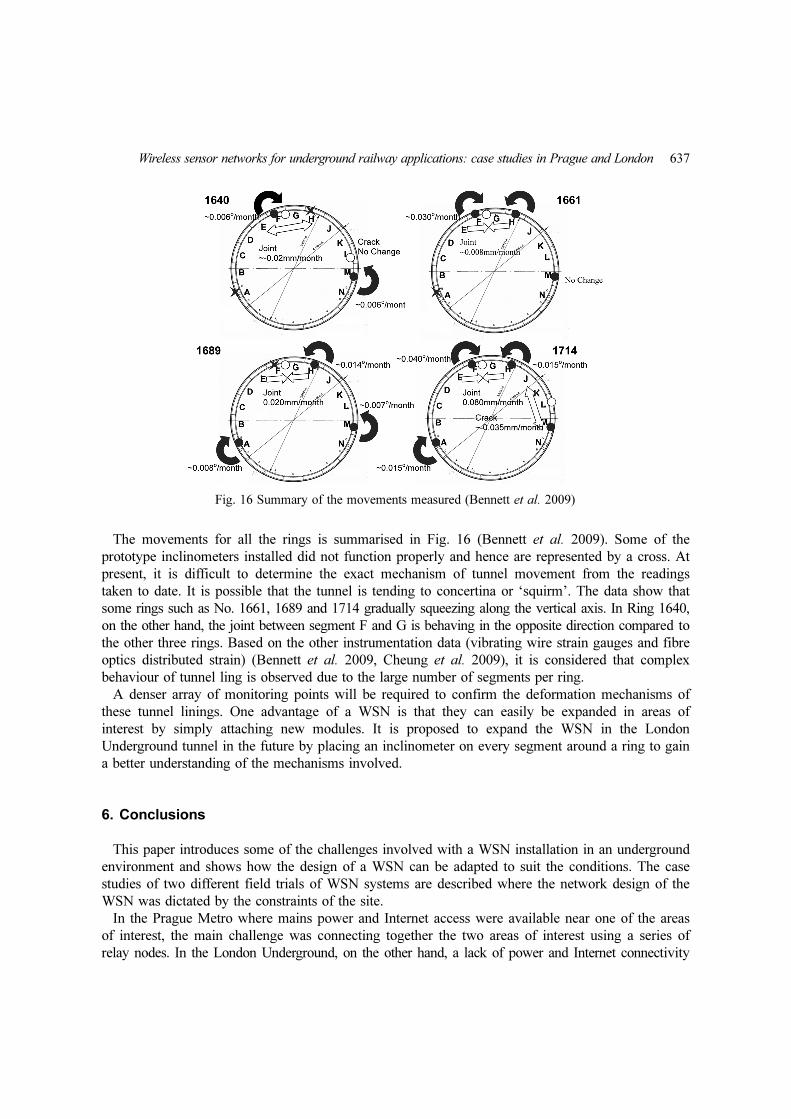
The movements for all the rings is summarised in Fig. 16 (Bennett et al. 2009). Some of the
prototype inclinometers installed did not function properly and hence are represented by a cross. At
present, it is difficult to determine the exact mechanism of tunnel movement from the readings
taken to date. It is possible that the tunnel is tending to concertina or ‘squirm’. The data show that
some rings such as No. 1661, 1689 and 1714 gradually squeezing along the vertical axis. In Ring 1640,
on the other hand, the joint between segment F and G is behaving in the opposite direction compared to
the other three rings. Based on the other instrumentation data (vibrating wire strain gauges and fibre
optics distributed strain) (Bennett et al. 2009, Cheung et al. 2009), it is considered that complex
behaviour of tunnel ling is observed due to the large number of segments per ring.
A denser array of monitoring points will be required to confirm the deformation mechanisms of
these tunnel linings. One advantage of a WSN is that they can easily be expanded in areas of
interest by simply attaching new modules. It is proposed to expand the WSN in the London
Underground tunnel in the future by placing an inclinometer on every segment around a ring to gain
a better understanding of the mechanisms involved.
6. Conclusions
This paper introduces some of the challenges involved with a WSN installation in an underground
environment and shows how the design of a WSN can be adapted to suit the conditions. The case
studies of two different field trials of WSN systems are described where the network design of the
WSN was dictated by the constraints of the site.
In the Prague Metro where mains power and Internet access were available near one of the areas
of interest, the main challenge was connecting together the two areas of interest using a series of
relay nodes. In the London Underground, on the other hand, a lack of power and Internet connectivity
Fig. 16 Summary of the movements measured (Bennett et al. 2009)
638 Peter J. Bennett et al.
meant that the gateway had to be split into two pieces, one near the area of interest and one with
access to power and the Internet, that were separated by hundreds of metres.
In both cases radio connectivity was potentially an issue that was averted by using the results of
radio propagation testing to inform the network design. One of the key stumbling blocks in the way
of commercial uptake of these systems is reliability. Several failures during the field trials have
highlighted the need for robust systems.
A trial WSN installed in London Underground tunnel measured the response of four rings in an
area where lining deformation has been occurring. The trends were found to be similar, even though
the magnitudes differed as the sensors could not be collocated and the movement of the lining is
complex with both radial and longitudinal rotations. The trial demonstrates the feasibility and
advantages of wireless sensing in the underground environment, but further investigation is needed
to evaluate its long-term performance.
Acknowledgements
The authors would like to thank the EPSRC for their financial support of this research (EP/
E003338/1 “Micro-Measurement and Monitoring System for Ageing Underground Infrastructures
(Underground M3)”) as well as Dr. Neil Hoult of Cambridge University, Peter Wright of Tubelines,
Jim Moriarty of LUL, and Daniel Jirasko and Jan Zalesky of CTU in Prague.
References
Akyildiz, I.F. and Stuntebeck, E.P. (2006), “Wireless underground sensor networks: Research challenges”, AdHoc Networks, 4(6), 669-686.
Barrenetxea, G., Ingelrest, F., Schaefer, G. and Vetterli, M. (2008), “The hitchhiker’s guide to successful wirelesssensor network deployments”, Proceedings of the 6th ACM Conference on Embedded Networked SensorSystems, Raleigh, NC, USA, November.
Bennett, P.J., Kobayashi, Y., Soga, K. and Wright. P. (2009), “Wireless sensor network for monitoring ofunderground tunnel”, Proceedings of the ICE - Geotechnical Engineering.
Cheekiralla, S.M. (2004), Development of a Wireless Sensing Unit for Tunnel Monitoring, Master’s thesis,Massachusetts Institute of Technology, Cambridge, MA, USA.
Cheung, L.L.K., Soga, K., Bennett, P.J., Kobayashi, Y., Amatya, B. and Wright, P. (2009), “Optical fibre strainmeasurement for tunnel lining monitoring”, Proceedings of the ICE - Geotechnical Engineering.
Fares, S.A., Denidni, T. and Affes, S. (2005), “Effects of rayleigh fading and poisson time path arrival on OFDMsmart antennas for WLAN underground communications”, Proceedings of the First International Workshop onWireless Communications in Underground and Confined Areas IWWCUCA'2005, Val-d'Or, Quebec, Canada.
Feltrin, G., Meyer, J. and Bischoff, R. (2007), “Wireless sensor networks for long term monitoring of civilstructures”, Proceedings of the 2nd International Conference on Experimental Vibration Analysis for CivilEngineering Structures, Porto, Portugal, October.
Glaser, S.D., Li, H., Wang, M.L., Ou, J. and Lynch, J.P. (2007), “Sensor technology innovation for theadvancement of structural health monitoring: A strategic program plan of US-China research for the nextdecade”, Smart Struct. Syst., 3(2), 221-244.
Glaser, S.D. and Parkkila, T. (2009), “Sensor networks in the real world”, ERCIM News, 76, 16-17.Grosse, C. (2008), “Monitoring of structures using wireless sensors and acoustic emission techniques”, Proceedings
of the International Conference on Challenges for Civil Construction, Porto, Portugal.Hirai, C. and Soga, K. (2010), “An experimental model of relay deployment planning tool for a wireless sensor

Wireless sensor networks for underground railway applications: case studies in Prague and London 639
network system to monitor civil engineering structures”, Proceedings of the Ninth IASTED InternationalConference on Parallel and Distributed Computing and Networks (PDCN 2010), Innsbruck, Austria, February.
Hoult, N.A., Bennett, P.J., Stoianov, I., Fidler, P., Maksimovi, ., Middleton, C., Graham, N. and Soga, K.(2009a), “Wireless sensor networks: creating ‘Smart Infrastructure’”, Proceedings of the Institution of CivilEngineers, Civil Engineering, 162(3), 136-143.
Hoult, N.A., Fidler, P., Hill, P. and Middleton, C.R. (2009b), “long-term wireless structural health monitoring ofthe ferriby road bridge”, J. Bridge Eng., 15(2), 153-159.
Jobling, D.G. (1980), Development of Lining Systems for London Transport Tunnels, Internal reference fromTube Lines Limited.
Kim, S., Pakzad, S., Culler, D., Demmel, J., Fenves, G., Glaser, S. and Turon, M. (2007), “Health monitoring ofcivil infrastructures using wireless sensor networks”, Proceedings of the 6th IPSN, Cambridge, Massachusetts,USA, April.
Li, M. and Liu, Y. (2007), “Underground structure monitoring with wireless sensor networks”, Proceedings ofthe Sixth International Symposium on Information Processing in Sensor Networks (IPSN’07), Cambridge,Massachusetts, USA, April.
Lynch, J.P., Wang, Y., Loh, K.J., Yi, J.H. and Yun, C.B. (2006), “Performance monitoring of the GeumdangBridge using a dense network of high-resolution wireless sensors”, Smart Mater. Struct., 15(6), 1561-1575.
Lyons, A.C. (1979), “The Jubilee Line 2. Construction from baker street to bond street exclusive and fromadmiralty arch to aldwych”, Proceedings of the Institution of Civil Engineers, Part 1, 66(3), 375-394.
Stajano, F., Hoult, N.A., Wassell, I., Bennett, P.J., Middleton, C. and Soga, K. (2010), “Smart bridges, smarttunnels: transforming wireless sensor networks from research prototypes into robust engineering infrastructure”,Ad Hoc Networks, 10.1016/j.adhoc.2010.04.002.
Vanicek, I. (2008), Ageing of Underground Structures - Prague Metro, CVUT v Praze, Fakulta stavebni, 168pp.Whelan, M.J. and Janoyan, K.D. (2009), “Design of a robust, high-rate wireless sensor network for static and
dynamic structural monitoring”, J. Intel. Mat. Syst. Str., 20(7), 849-863. Wu, Y., Lin M. and Wassell, I.J. (2009), “Modified 2D finite-difference time-domain based tunnel path loss
prediction for wireless sensor network applications”, J. Commun., 4(4), 214-223.Wu, Y. and Wassell, I.J. (2009), “Introduction to the segmented finite-difference time-domain method”, IEEE T.
Magn., 45(3), 1364-1367.Wu, Y. and Wassell, I.J. (2008), “Investigation of close-to-wall wireless sensor deployment using 2D finite-
difference time-domain modelling”, Proceedings of the 2nd International Conference on Wireless Communication inUnderground and Confined Areas, Val-d’or, Québec, Canada, August.
Yu, Y., Ou, J., Zhang, J., Zhang, C. and Li, L. (2009), “Development of wireless MEMS inclination sensorsystem for swing monitoring of large-scale hook structures”, IEEE T. Ind. Electron., 56(4), 1072-1078.
C