Embed Size (px)
Citation preview

Winter 2018: assessment of the likely impact of declaring the Wishlist runway capacity
Peter Straka
Contents
Model validation
Methodology
Results of assessment of impact on following metrics:
Departure taxi out time
Departure runway holding delay
Arrival ground delay
Arrival taxi in time
Findings
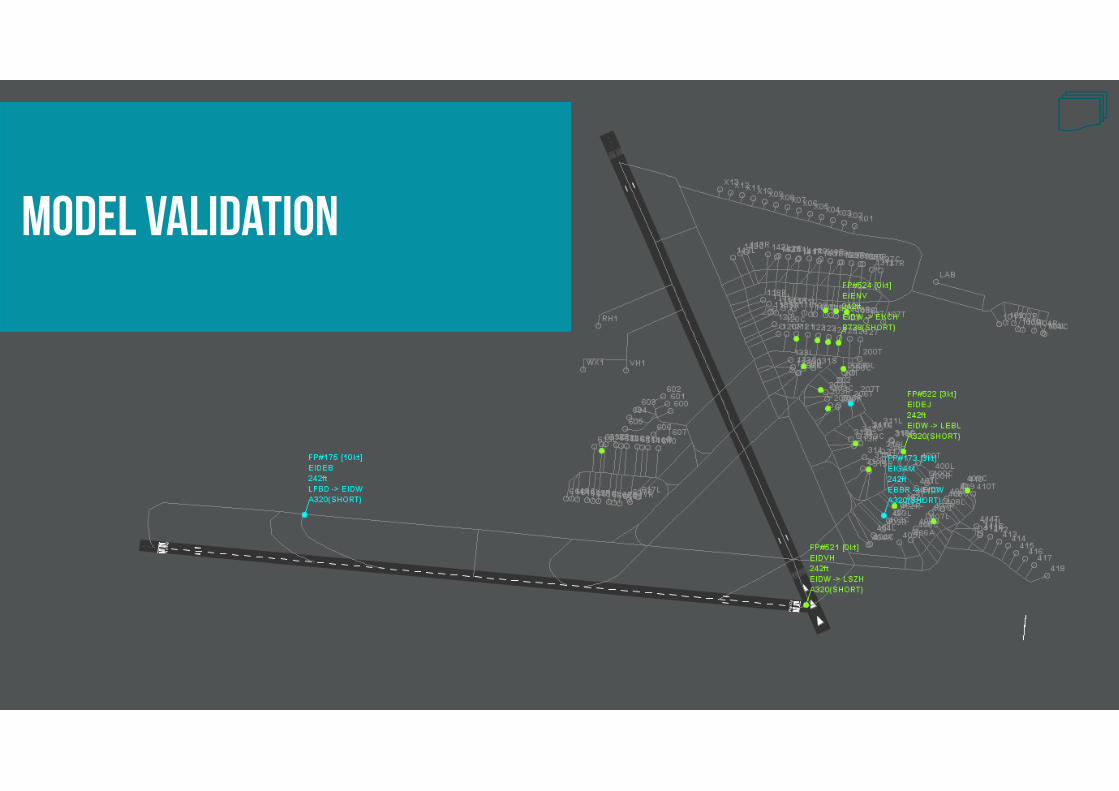
Model validation
Model description
• Based on the model developed in support of the S18 coordination
• Updated to reflect winter operating conditions
• Calibrated against a single day of operations (17 Nov 2017)
• Dual ops not simulated – assumed all traffic operates from RWY 28
• Run from actual block times to take into account all types of delays
• Comparison against a set of airside metrics provided
Calibration of Departure performance
0
5
10
15
20
25
30
35
04:0
0
04:3
0
05:0
0
05:3
0
06:0
0
06:3
0
07:0
0
07:3
0
08:0
0
08:3
0
09:0
0
09:3
0
10:0
0
10:3
0
11:0
0
11:3
0
12:0
0
12:3
0
13:0
0
13:3
0
14:0
0
14:3
0
15:0
0
15:3
0
16:0
0
16:3
0
17:0
0
17:3
0
18:0
0
18:3
0
19:0
0
19:3
0
20:0
0
20:3
0
21:0
0
21:3
0
22:0
0
22:3
0
23:0
0
23:3
0
00:0
0
Min
ute
s
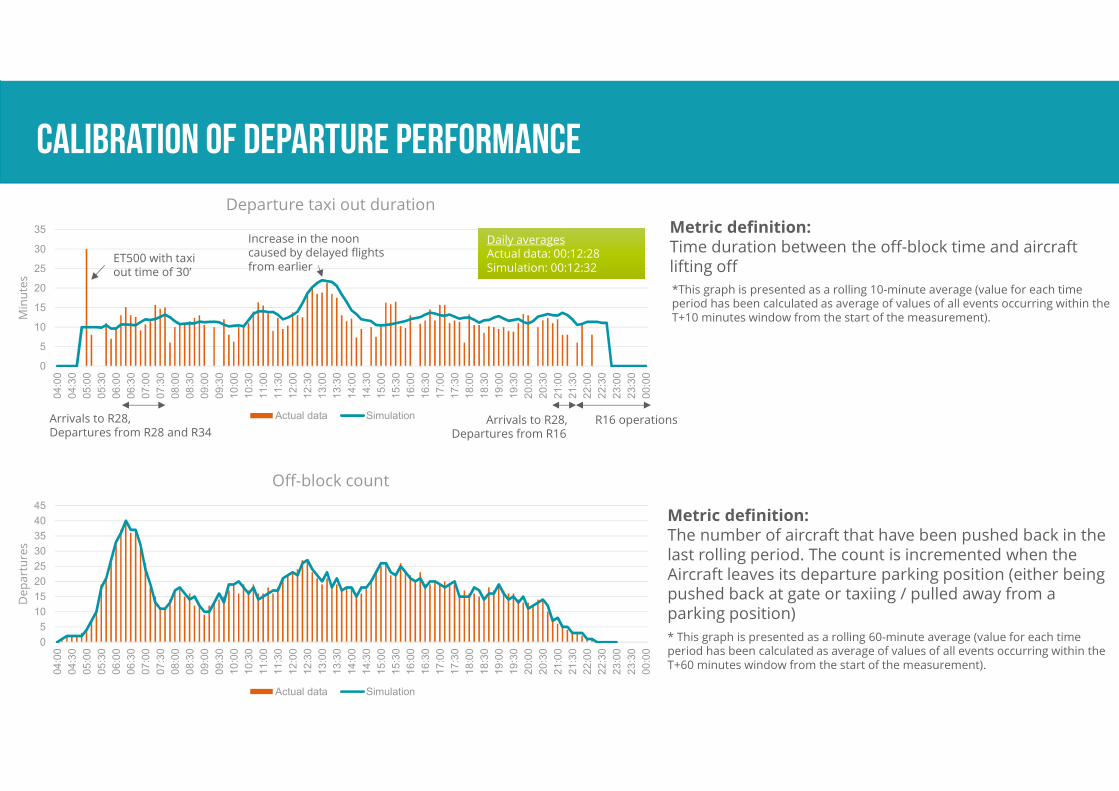
Departure taxi out duration
Actual data Simulation
0
5
10
15
20
25
30
35
40
45
04:0
0
04:3
0
05:0
0
05:3
0
06:0
0
06:3
0
07:0
0
07:3
0
08:0
0
08:3
0
09:0
0
09:3
0
10:0
0
10:3
0
11:0
0
11:3
0
12:0
0
12:3
0
13:0
0
13:3
0
14:0
0
14:3
0
15:0
0
15:3
0
16:0
0
16:3
0
17:0
0
17:3
0
18:0
0
18:3
0
19:0
0
19:3
0
20:0
0
20:3
0
21:0
0
21:3
0
22:0
0
22:3
0
23:0
0
23:3
0
00:0
0
De
pa
rtu
res
Off-block count
Actual data Simulation
*This graph is presented as a rolling 10-minute average (value for each time period has been calculated as average of values of all events occurring within the T+10 minutes window from the start of the measurement).
* This graph is presented as a rolling 60-minute average (value for each time period has been calculated as average of values of all events occurring within the T+60 minutes window from the start of the measurement).
Metric definition:Time duration between the off-block time and aircraft lifting off
Metric definition:The number of aircraft that have been pushed back in the last rolling period. The count is incremented when the Aircraft leaves its departure parking position (either being pushed back at gate or taxiing / pulled away from a parking position)
ET500 with taxi out time of 30’
Increase in the noon caused by delayed flights from earlier
Arrivals to R28,Departures from R16
Daily averagesActual data: 00:12:28Simulation: 00:12:32
Daily averagesActual data: 00:12:28Simulation: 00:12:32
R16 operationsArrivals to R28,Departures from R28 and R34
Calibration of arrival performance
0
5
10
15
20
25
04:0
0
04:3
0
05:0
0
05:3
0
06:0
0
06:3
0
07:0
0
07:3
0
08:0
0
08:3
0
09:0
0
09:3
0
10:0
0
10:3
0
11:0
0
11:3
0
12:0
0
12:3
0
13:0
0
13:3
0
14:0
0
14:3
0
15:0
0
15:3
0
16:0
0
16:3
0
17:0
0
17:3
0
18:0
0
18:3
0
19:0
0
19:3
0
20:0
0
20:3
0
21:0
0
21:3
0
22:0
0
22:3
0
23:0
0
23:3
0
00:0
0
Min
ute
s
Arrival taxi in duration
Actual data Simulation
0
5
10
15
20
25
30
04:0
0
04:3
0
05:0
0
05:3
0
06:0
0
06:3
0
07:0
0
07:3
0
08:0
0
08:3
0
09:0
0
09:3
0
10:0
0
10:3
0
11:0
0
11:3
0
12:0
0
12:3
0
13:0
0
13:3
0
14:0
0
14:3
0
15:0
0
15:3
0
16:0
0
16:3
0
17:0
0
17:3
0
18:0
0
18:3
0
19:0
0
19:3
0
20:0
0
20:3
0
21:0
0
21:3
0
22:0
0
22:3
0
23:0
0
23:3
0
00:0
0
Arr
iva
ls
In-block count
Actual data Simulation
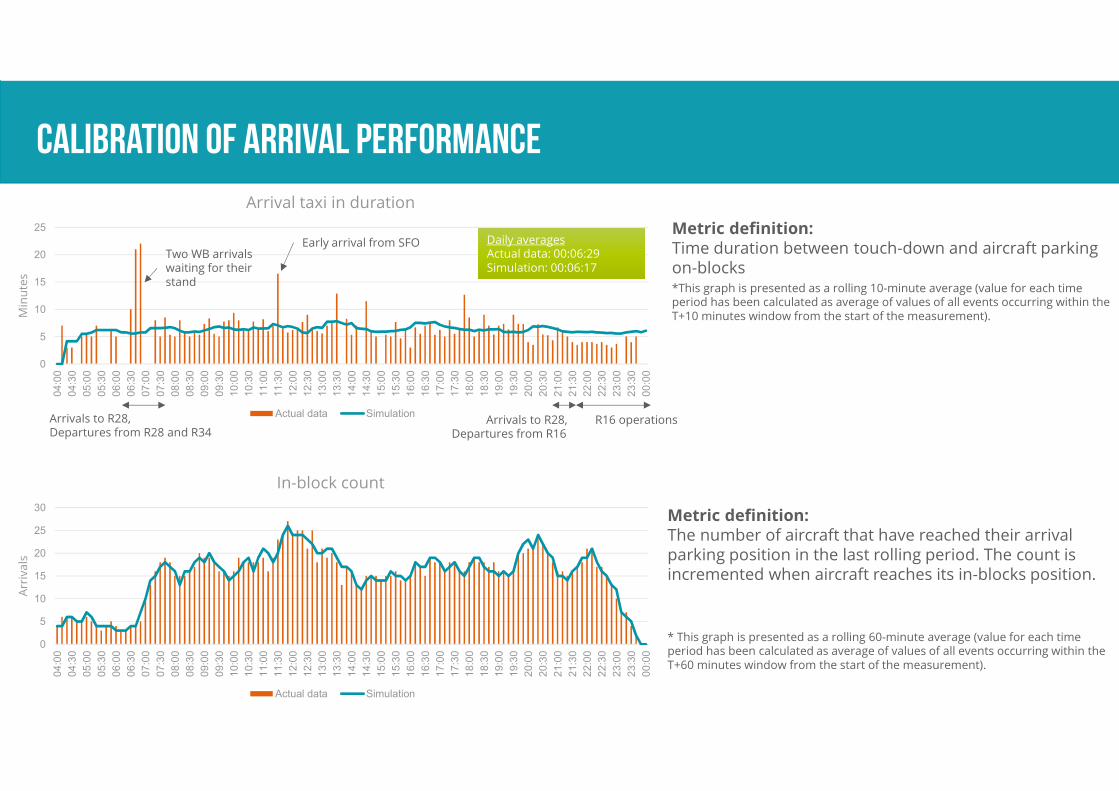
*This graph is presented as a rolling 10-minute average (value for each time period has been calculated as average of values of all events occurring within the T+10 minutes window from the start of the measurement).
* This graph is presented as a rolling 60-minute average (value for each time period has been calculated as average of values of all events occurring within the T+60 minutes window from the start of the measurement).
Metric definition:Time duration between touch-down and aircraft parking on-blocks
Metric definition:The number of aircraft that have reached their arrival parking position in the last rolling period. The count is incremented when aircraft reaches its in-blocks position.
Two WB arrivals waiting for their stand
Early arrival from SFO Daily averagesActual data: 00:06:29Simulation: 00:06:17
Daily averagesActual data: 00:06:29Simulation: 00:06:17
Arrivals to R28,Departures from R28 and R34
Arrivals to R28,Departures from R16
R16 operations

Calibration of runway performance
0
5
10
15
20
25
30
35
40
45
04:0
005:0
006:0
007:0
008:0
009:0
010:0
011:0
012:0
013:0
014:0
015:0
016:0
017:0
018:0
019:0
020:0
021:0
022:0
023:0
000:0
0
De
pa
rtu
res
Lift-off count
Actual data Simulation
0
5
10
15
20
25
30
04:0
005:0
006:0
007:0
008:0
009:0
010:0
011:0
012:0
013:0
014:0
015:0
016:0
017:0
018:0
019:0
020:0
021:0
022:0
023:0
000:0
0
Arr
iva
ls
Touch-down count
Actual data Simulation
0
5
10
15
20
25
30
35
40
45
50
04:0
0
04:3
0
05:0
0
05:3
0
06:0
0
06:3
0
07:0
0
07:3
0
08:0
0
08:3
0
09:0
0
09:3
0
10:0
0
10:3
0
11:0
0
11:3
0
12:0
0
12:3
0
13:0
0
13:3
0
14:0
0
14:3
0
15:0
0
15:3
0
16:0
0
16:3
0
17:0
0
17:3
0
18:0
0
18:3
0
19:0
0
19:3
0
20:0
0
20:3
0
21:0
0
21:3
0
22:0
0
22:3
0
23:0
0
23:3
0
00:0
0
Mo
ve
me
nts
Runway throughput (A+D)
Actual data Simulation
* All graphs are presented as a rolling 60-minute average (value for each time period has been calculated as average of values of all events occurring within the T+60 minutes window from the start of the measurement).
Metric definition:
Lift-off count: The number of aircraft that have lifted off in the last rolling period. The count is incremented when the aircraft passes over the opposite end of runway.
Touch-down count: The number of aircraft that have touched down in the last rolling period.
Runway throughput: Sum of all aircraft touching down and lifting-off in the last rolling period.
Dual ops allow higher departure throughput
Peak throughputActual data: 39 Simulation: 37
Peak throughputActual data: 39 Simulation: 37
Peak throughputActual data: 25 Simulation: 25
Peak throughputActual data: 25 Simulation: 25
Peak throughputActual data: 47 Simulation: 47
Peak throughputActual data: 47 Simulation: 47
Result of model validation exercise
• As the metrics calculated through the FTS model closely match the real-world data,
both in terms of the magnitude and the shape of profile throughout the day, the
model can be considered as a satisfactorily representation of reality for the
purpose of evaluating the impact of proposed changes in flight schedules
• The model is considered to be valid if it is a sufficiently accurate representation of
the corresponding real-world problem from the perspective of the intended uses of
the model. "Valid" for a simulation does not mean the same as “indistinguishable
from the real-world system”, even though in this case there is a close match.

W18 - Methodology
Photo source: http://www.daa.ie/media-centre/image-library/

Task description
• The purpose of this comparison is to assess the likely effect of either:
• declaring an increased runway capacity, as per the wishlist, or
• maintaining the Winter 2017 capacity limits
• In both cases it is presumed that the Winter 2018 schedule of increased
demand materialises as expected.
• The same number of movements are modelled in both cases, the difference
being the limits to which they are coordinated. This difference is therefore a
best current information estimate of the effect of a decision to increase the
runway limits on a busy Winter 2018 day.

Fast time simulationsFast time simulations
Data collectionData collection
Approach and key changes against S18 model
• Runway occupancy times have been updated taking
into account slightly longer ROT in winter months
• Rule-based stand allocation driven by historic data
• Towing implemented to manage demand for Code E stands
• No changes to the airfield layout (taxiways, stands)
• No changes to operating procedures
• Departure-departure separation kept at minimum of 84 seconds
• Arrival-arrival separation kept at minimum of 3.5 NM
• A-D-A separation kept at 5.5 NM
• No A-CDM assumptions have been included
HeliosHelios
daadaa
IAAIAA
AirlinesAirlines
ConsultationConsultation
Data provisionData provision
Update of existing model with new data and assumptions
Update of existing model with new data and assumptions
W18 flight schedule coordinated by
wishlist W18 declaration
W18 flight schedule coordinated by
wishlist W18 declaration
W18 flight schedule coordinated by
existing W17 declaration
W18 flight schedule coordinated by
existing W17 declaration
Help inform CAR decisionHelp inform CAR decision
Results reviewed by the CC
Results reviewed by the CC
Feedback received
Winter 2018 flight schedule
• The flight schedule used for modelling of both scenarios:
• Is based on 17th of November 2017 flight schedule (which was already 95th
percentile busy day before the new services were added)
• Contains total of 617 flights (307 arrivals and 310 departures)
• Contains 31 new services (18 new departures and 13 new arrivals)
• Contains flights that arrived the day before the design day and departed on the
design day
• Contains flights that arrived on the design day and departed after the design day
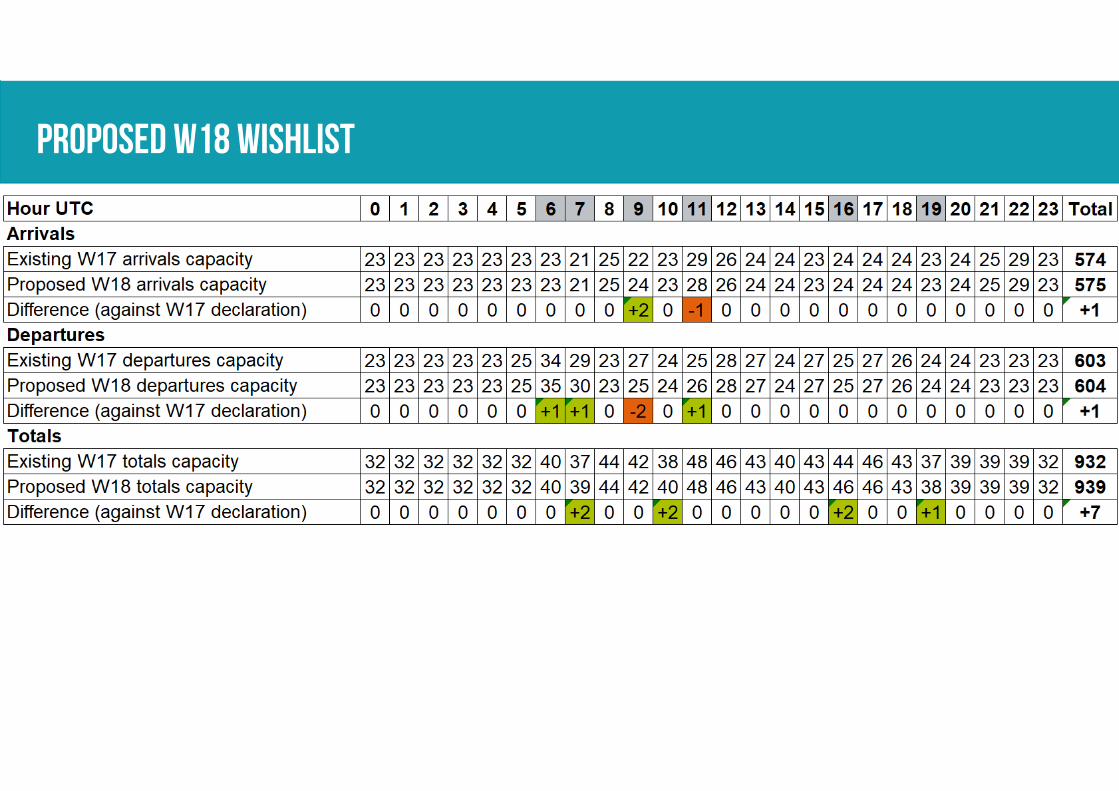
Proposed w18 wishlist
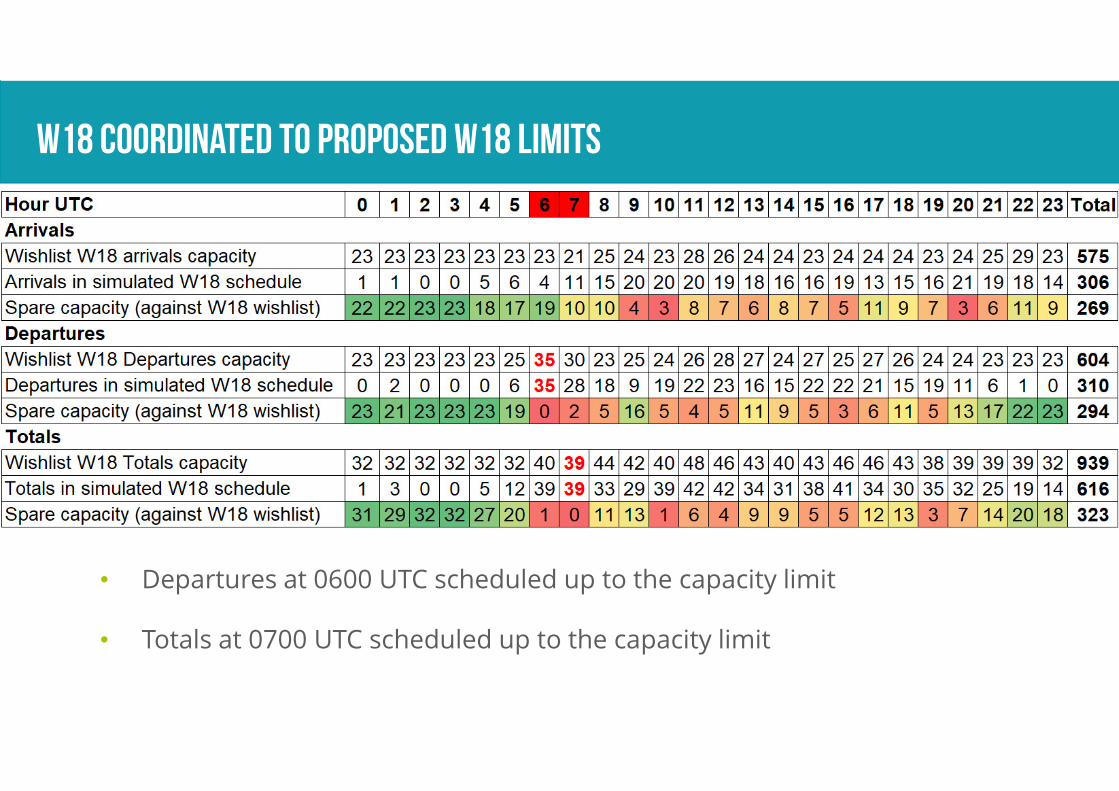
W18 coordinated to proposed W18 limits
• Departures at 0600 UTC scheduled up to the capacity limit
• Totals at 0700 UTC scheduled up to the capacity limit
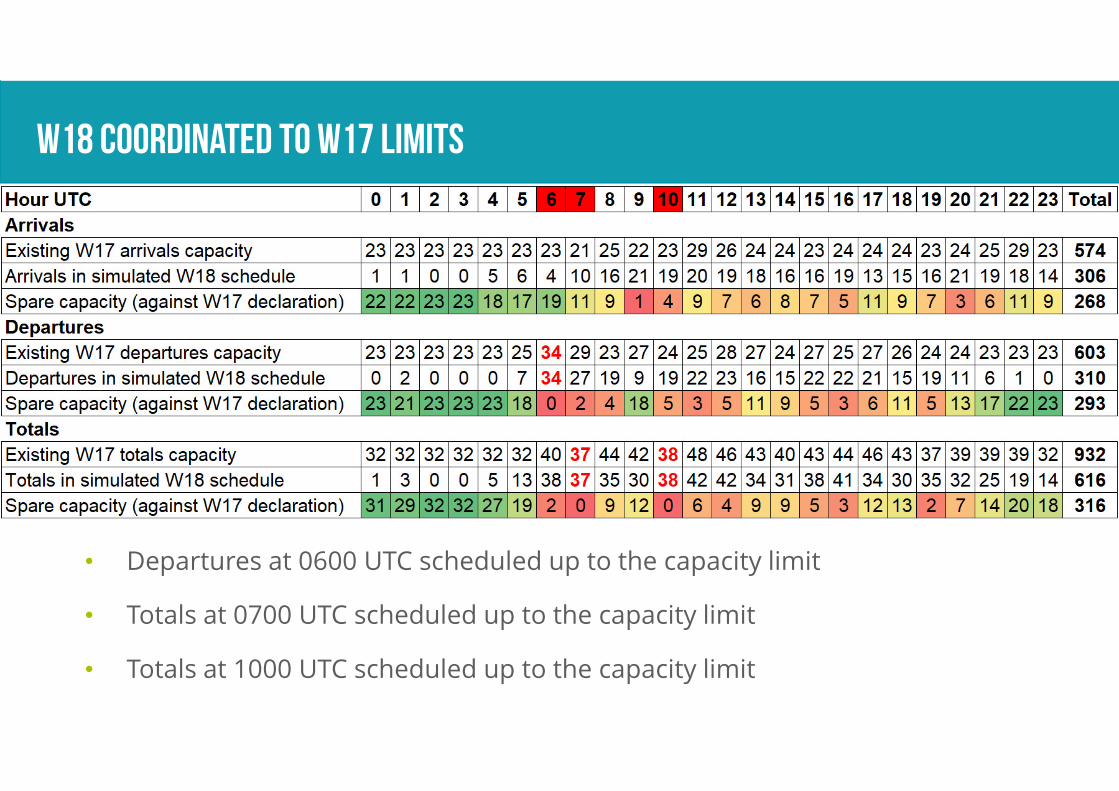
W18 coordinated to W17 limits
• Departures at 0600 UTC scheduled up to the capacity limit
• Totals at 0700 UTC scheduled up to the capacity limit
• Totals at 1000 UTC scheduled up to the capacity limit
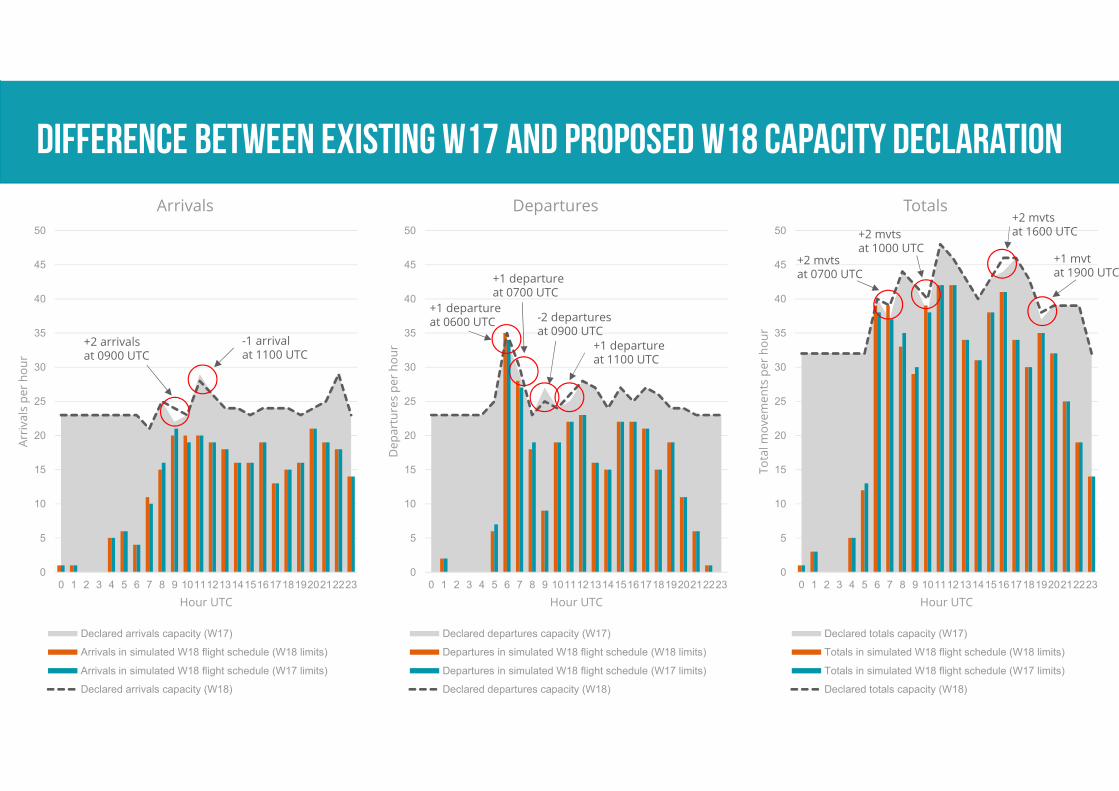
Difference between existing W17 and proposed W18 capacity declaration
0
5
10
15
20
25
30
35
40
45
50
0 1 2 3 4 5 6 7 8 9 1011121314151617181920212223
Arr
iva
ls p
er
ho
ur
Hour UTC
Arrivals
Declared arrivals capacity (W17)
Arrivals in simulated W18 flight schedule (W18 limits)
Arrivals in simulated W18 flight schedule (W17 limits)
Declared arrivals capacity (W18)
0
5
10
15
20
25
30
35
40
45
50
0 1 2 3 4 5 6 7 8 9 1011121314151617181920212223
De
pa
rtu
res
pe
r h
ou
r
Hour UTC
Departures
Declared departures capacity (W17)
Departures in simulated W18 flight schedule (W18 limits)
Departures in simulated W18 flight schedule (W17 limits)
Declared departures capacity (W18)
0
5
10
15
20
25
30
35
40
45
50
0 1 2 3 4 5 6 7 8 9 1011121314151617181920212223
To
tal m
ove
me
nts
pe
r h
ou
r
Hour UTC
Totals
Declared totals capacity (W17)
Totals in simulated W18 flight schedule (W18 limits)
Totals in simulated W18 flight schedule (W17 limits)
Declared totals capacity (W18)
+2 arrivals at 0900 UTC
-1 arrival at 1100 UTC
+1 departure at 0600 UTC
+1 departure at 0700 UTC
+1 departure at 1100 UTC
-2 departures at 0900 UTC
+2 mvtsat 0700 UTC
+2 mvtsat 1000 UTC
+2 mvtsat 1600 UTC
+1 mvtat 1900 UTC
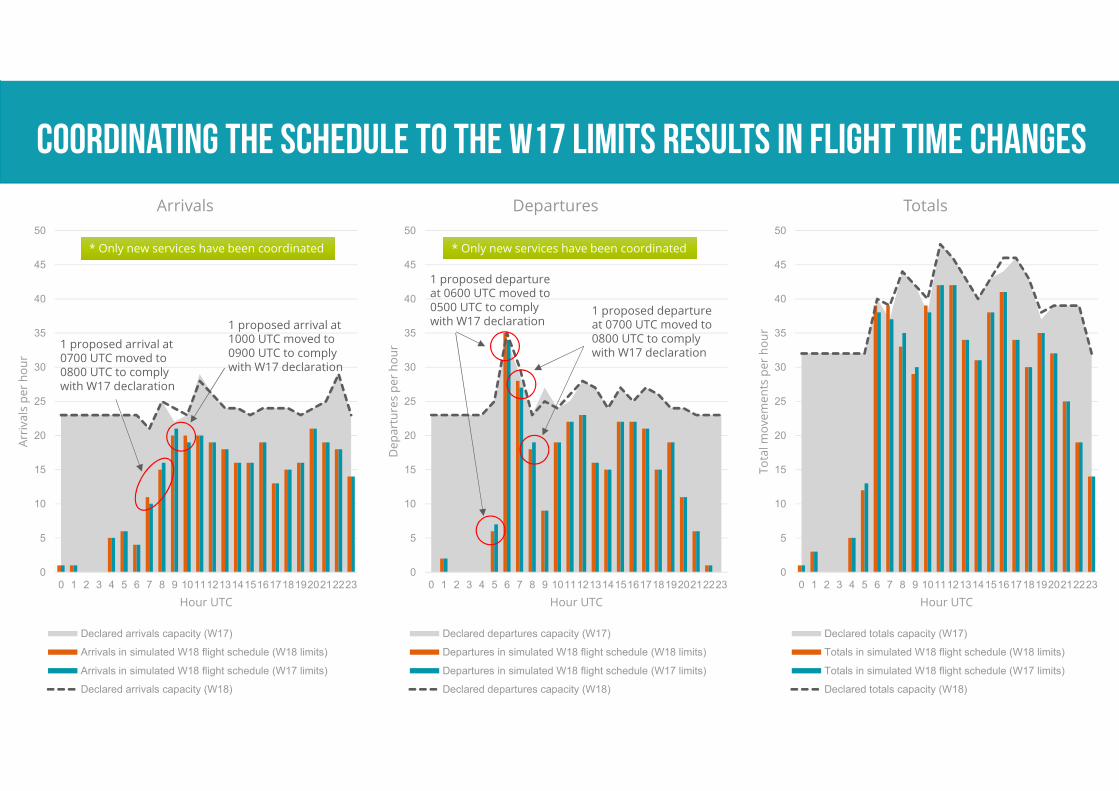
Coordinating the schedule to the W17 limits results in flight time changes
0
5
10
15
20
25
30
35
40
45
50
0 1 2 3 4 5 6 7 8 9 1011121314151617181920212223
Arr
iva
ls p
er
ho
ur
Hour UTC
Arrivals
Declared arrivals capacity (W17)
Arrivals in simulated W18 flight schedule (W18 limits)
Arrivals in simulated W18 flight schedule (W17 limits)
Declared arrivals capacity (W18)
0
5
10
15
20
25
30
35
40
45
50
0 1 2 3 4 5 6 7 8 9 1011121314151617181920212223
De
pa
rtu
res
pe
r h
ou
r
Hour UTC
Departures
Declared departures capacity (W17)
Departures in simulated W18 flight schedule (W18 limits)
Departures in simulated W18 flight schedule (W17 limits)
Declared departures capacity (W18)
0
5
10
15
20
25
30
35
40
45
50
0 1 2 3 4 5 6 7 8 9 1011121314151617181920212223
To
tal m
ove
me
nts
pe
r h
ou
r
Hour UTC
Totals
Declared totals capacity (W17)
Totals in simulated W18 flight schedule (W18 limits)
Totals in simulated W18 flight schedule (W17 limits)
Declared totals capacity (W18)
1 proposed arrival at 0700 UTC moved to 0800 UTC to comply with W17 declaration
1 proposed arrival at 1000 UTC moved to 0900 UTC to comply with W17 declaration
1 proposed departure at 0600 UTC moved to 0500 UTC to comply with W17 declaration
1 proposed departure at 0700 UTC moved to 0800 UTC to comply with W17 declaration
* Only new services have been coordinated* Only new services have been coordinated * Only new services have been coordinated* Only new services have been coordinated

results (Runway 28)
00:00:00
00:05:00
00:10:00
00:15:00
00:20:00
00:25:00
05:0
0:0
0
05:2
0:0
0
05:4
0:0
0
06:0
0:0
0
06:2
0:0
0
06:4
0:0
0
07:0
0:0
0
07:2
0:0
0
07:4
0:0
0
08:0
0:0
0
08:2
0:0
0
08:4
0:0
0
09:0
0:0
0
09:2
0:0
0
09:4
0:0
0
10:0
0:0
0
10:2
0:0
0
10:4
0:0
0
11:0
0:0
0
11:2
0:0
0
11:4
0:0
0
12:0
0:0
0
12:2
0:0
0
12:4
0:0
0
13:0
0:0
0
13:2
0:0
0
13:4
0:0
0
14:0
0:0
0
14:2
0:0
0
14:4
0:0
0
15:0
0:0
0
15:2
0:0
0
15:4
0:0
0
16:0
0:0
0
16:2
0:0
0
16:4
0:0
0
17:0
0:0
0
17:2
0:0
0
17:4
0:0
0
18:0
0:0
0
18:2
0:0
0
18:4
0:0
0
19:0
0:0
0
19:2
0:0
0
19:4
0:0
0
20:0
0:0
0
20:2
0:0
0
20:4
0:0
0
21:0
0:0
0
21:2
0:0
0
21:4
0:0
0
22:0
0:0
0
22:2
0:0
0
22:4
0:0
0
23:0
0:0
0
23:2
0:0
0
23:4
0:0
0
De
pa
rtu
re t
ax
i o
ut
du
rati
on
(h
h:m
m:s
s)
Time UTC
W18 coordinated by existing W17 limits W18 coordinated by proposed W18 limits
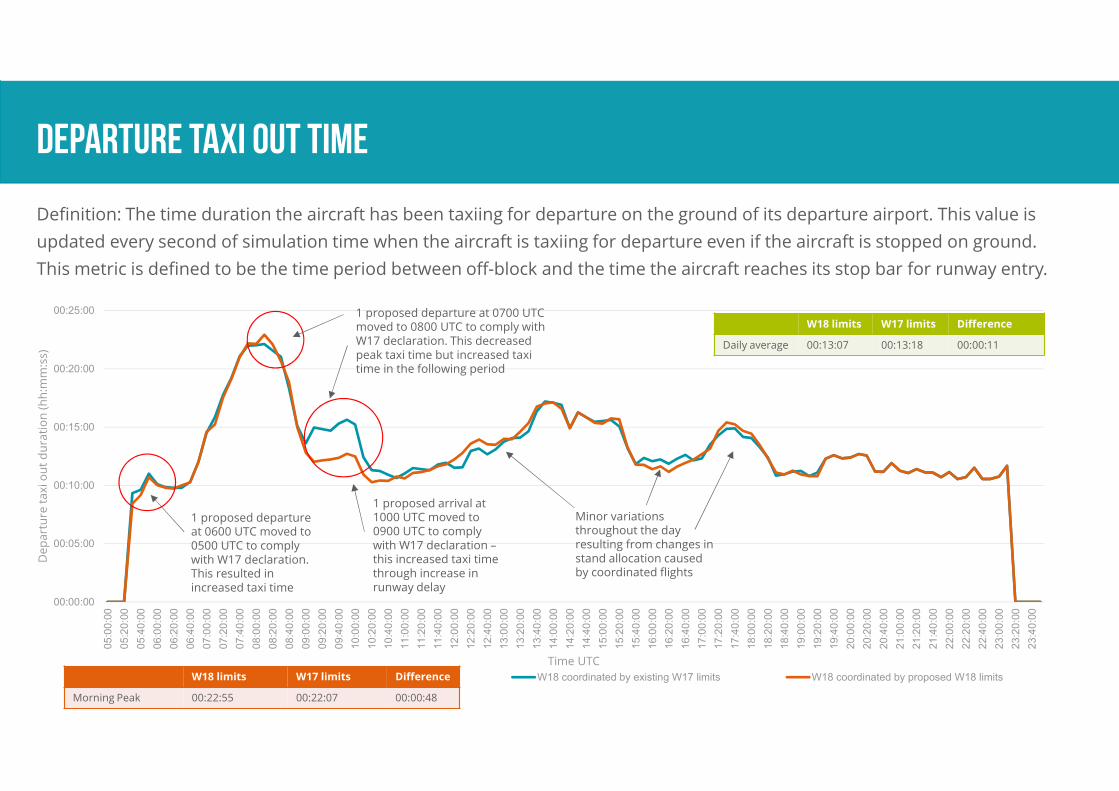
Departure taxi out time
W18 limits W17 limits Difference
Morning Peak 00:22:55 00:22:07 00:00:48
W18 limits W17 limits Difference
Daily average 00:13:07 00:13:18 00:00:11
Definition: The time duration the aircraft has been taxiing for departure on the ground of its departure airport. This value is
updated every second of simulation time when the aircraft is taxiing for departure even if the aircraft is stopped on ground.
This metric is defined to be the time period between off-block and the time the aircraft reaches its stop bar for runway entry.
1 proposed departure at 0600 UTC moved to 0500 UTC to comply with W17 declaration. This resulted in increased taxi time
1 proposed departure at 0700 UTC moved to 0800 UTC to comply with W17 declaration. This decreased peak taxi time but increased taxi time in the following period
Minor variations throughout the day resulting from changes in stand allocation caused by coordinated flights
1 proposed arrival at 1000 UTC moved to 0900 UTC to comply with W17 declaration –this increased taxi time through increase in runway delay
00:00:00
00:05:00
00:10:00
00:15:00
00:20:00
00:25:00
05:0
0:0
005:3
0:0
006:0
0:0
006:3
0:0
007:0
0:0
007:3
0:0
008:0
0:0
008:3
0:0
009:0
0:0
009:3
0:0
010:0
0:0
010:3
0:0
011:0
0:0
011:3
0:0
012:0
0:0
012:3
0:0
013:0
0:0
013:3
0:0
014:0
0:0
014:3
0:0
015:0
0:0
015:3
0:0
016:0
0:0
016:3
0:0
017:0
0:0
017:3
0:0
018:0
0:0
018:3
0:0
019:0
0:0
019:3
0:0
020:0
0:0
020:3
0:0
021:0
0:0
021:3
0:0
022:0
0:0
022:3
0:0
023:0
0:0
023:3
0:0
0
Ru
nw
ay d
ela
y (
hh
:mm
:ss)
Time UTC
W18 coordinated by existing W17 limits W18 coordinated by proposed W18 limits
00:00:00
00:05:00
00:10:00
00:15:00
00:20:00
00:25:00
05:0
0:0
005:3
0:0
006:0
0:0
006:3
0:0
007:0
0:0
007:3
0:0
008:0
0:0
008:3
0:0
009:0
0:0
009:3
0:0
010:0
0:0
010:3
0:0
011:0
0:0
011:3
0:0
012:0
0:0
012:3
0:0
013:0
0:0
013:3
0:0
014:0
0:0
014:3
0:0
015:0
0:0
015:3
0:0
016:0
0:0
016:3
0:0
017:0
0:0
017:3
0:0
018:0
0:0
018:3
0:0
019:0
0:0
019:3
0:0
020:0
0:0
020:3
0:0
021:0
0:0
021:3
0:0
022:0
0:0
022:3
0:0
023:0
0:0
023:3
0:0
0
De
pa
rtu
re g
rou
nd
de
lay (
hh
:mm
:ss)
Time UTC
W18 coordinated by existing W17 limits W18 coordinated by proposed W18 limits
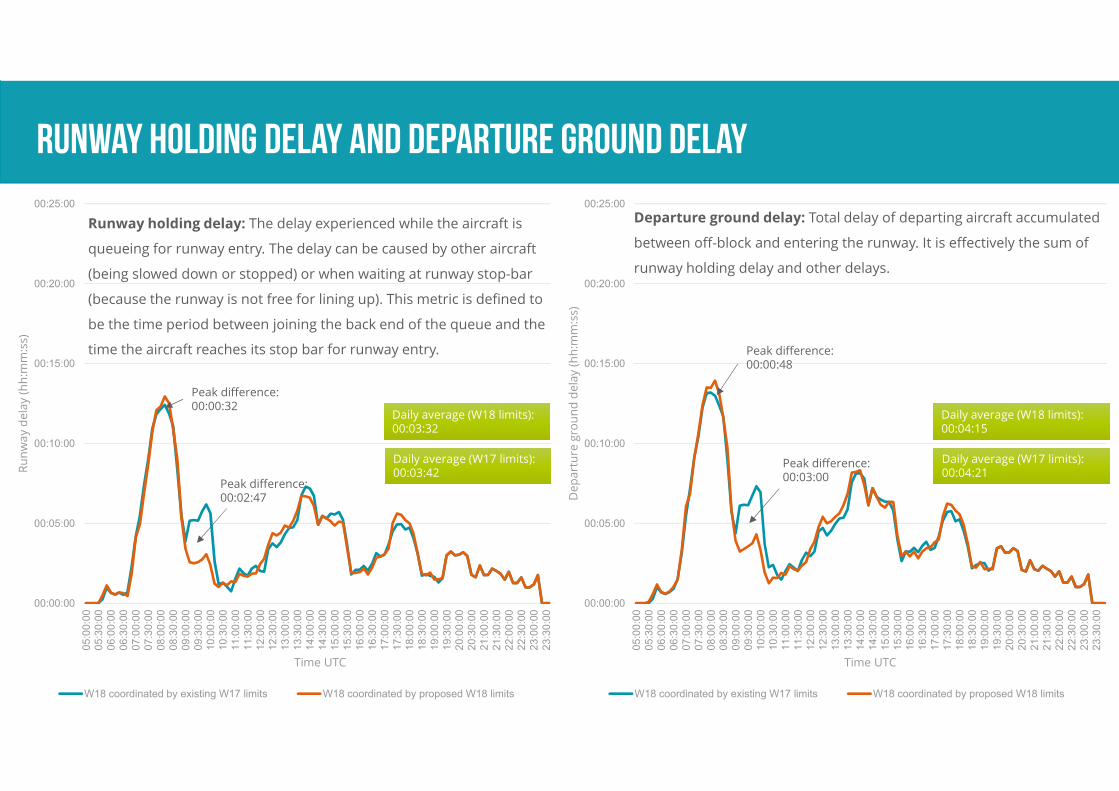
Daily average (W18 limits):00:04:15Daily average (W18 limits):00:04:15
Daily average (W17 limits): 00:04:21Daily average (W17 limits): 00:04:21
Runway holding delay and departure ground delay
Runway holding delay: The delay experienced while the aircraft is
queueing for runway entry. The delay can be caused by other aircraft
(being slowed down or stopped) or when waiting at runway stop-bar
(because the runway is not free for lining up). This metric is defined to
be the time period between joining the back end of the queue and the
time the aircraft reaches its stop bar for runway entry.
Departure ground delay: Total delay of departing aircraft accumulated
between off-block and entering the runway. It is effectively the sum of
runway holding delay and other delays.
Peak difference: 00:02:47
Daily average (W18 limits):00:03:32Daily average (W18 limits):00:03:32
Peak difference: 00:00:32
Peak difference:00:03:00
Peak difference: 00:00:48
Daily average (W17 limits): 00:03:42Daily average (W17 limits): 00:03:42
00:00:00
00:05:00
00:10:00
00:15:00
00:20:00
00:25:00
05:0
0:0
005:3
0:0
006:0
0:0
006:3
0:0
007:0
0:0
007:3
0:0
008:0
0:0
008:3
0:0
009:0
0:0
009:3
0:0
010:0
0:0
010:3
0:0
011:0
0:0
011:3
0:0
012:0
0:0
012:3
0:0
013:0
0:0
013:3
0:0
014:0
0:0
014:3
0:0
015:0
0:0
015:3
0:0
016:0
0:0
016:3
0:0
017:0
0:0
017:3
0:0
018:0
0:0
018:3
0:0
019:0
0:0
019:3
0:0
020:0
0:0
020:3
0:0
021:0
0:0
021:3
0:0
022:0
0:0
022:3
0:0
023:0
0:0
023:3
0:0
0
Arr
iva
l ta
xi in
du
rati
on
(h
h:m
m:s
s)
Time UTC
W18 coordinated by existing W17 limits W18 coordinated by proposed W18 limits
00:00:00
00:05:00
00:10:00
00:15:00
00:20:00
00:25:00
05:0
0:0
005:3
0:0
006:0
0:0
006:3
0:0
007:0
0:0
007:3
0:0
008:0
0:0
008:3
0:0
009:0
0:0
009:3
0:0
010:0
0:0
010:3
0:0
011:0
0:0
011:3
0:0
012:0
0:0
012:3
0:0
013:0
0:0
013:3
0:0
014:0
0:0
014:3
0:0
015:0
0:0
015:3
0:0
016:0
0:0
016:3
0:0
017:0
0:0
017:3
0:0
018:0
0:0
018:3
0:0
019:0
0:0
019:3
0:0
020:0
0:0
020:3
0:0
021:0
0:0
021:3
0:0
022:0
0:0
022:3
0:0
023:0
0:0
023:3
0:0
0
Arr
iva
l g
rou
nd
de
lay (
hh
:mm
:ss)
Time UTC
W18 coordinated by existing W17 limits W18 coordinated by proposed W18 limits
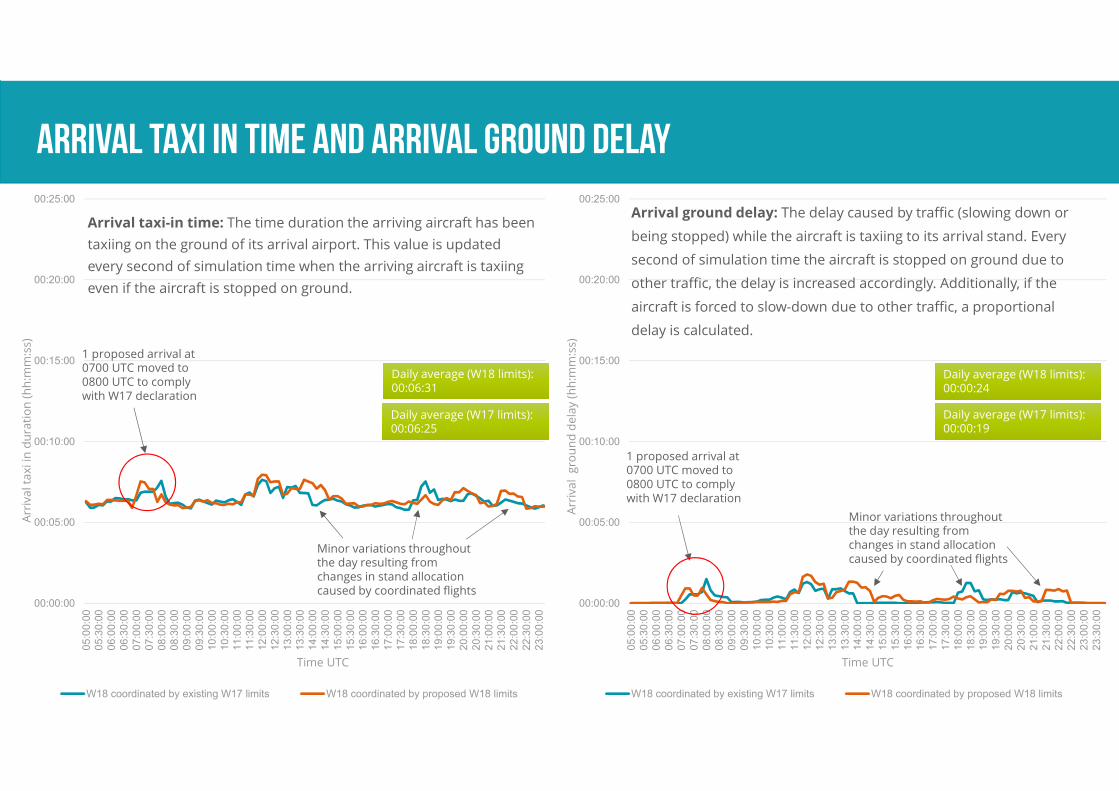
Arrival taxi in time and arrival ground delay
Arrival taxi-in time: The time duration the arriving aircraft has been
taxiing on the ground of its arrival airport. This value is updated
every second of simulation time when the arriving aircraft is taxiing
even if the aircraft is stopped on ground.
Arrival ground delay: The delay caused by traffic (slowing down or
being stopped) while the aircraft is taxiing to its arrival stand. Every
second of simulation time the aircraft is stopped on ground due to
other traffic, the delay is increased accordingly. Additionally, if the
aircraft is forced to slow-down due to other traffic, a proportional
delay is calculated.
Daily average (W18 limits): 00:00:24Daily average (W18 limits): 00:00:24
Daily average (W17 limits): 00:00:19Daily average (W17 limits): 00:00:19
1 proposed arrival at 0700 UTC moved to 0800 UTC to comply with W17 declaration
1 proposed arrival at 0700 UTC moved to 0800 UTC to comply with W17 declaration
Minor variations throughout the day resulting from changes in stand allocation caused by coordinated flights
Minor variations throughout the day resulting from changes in stand allocation caused by coordinated flights
Daily average (W18 limits): 00:06:31Daily average (W18 limits): 00:06:31
Daily average (W17 limits): 00:06:25Daily average (W17 limits): 00:06:25

Findings
Photo source: http://www.daa.ie/media-centre/image-library/
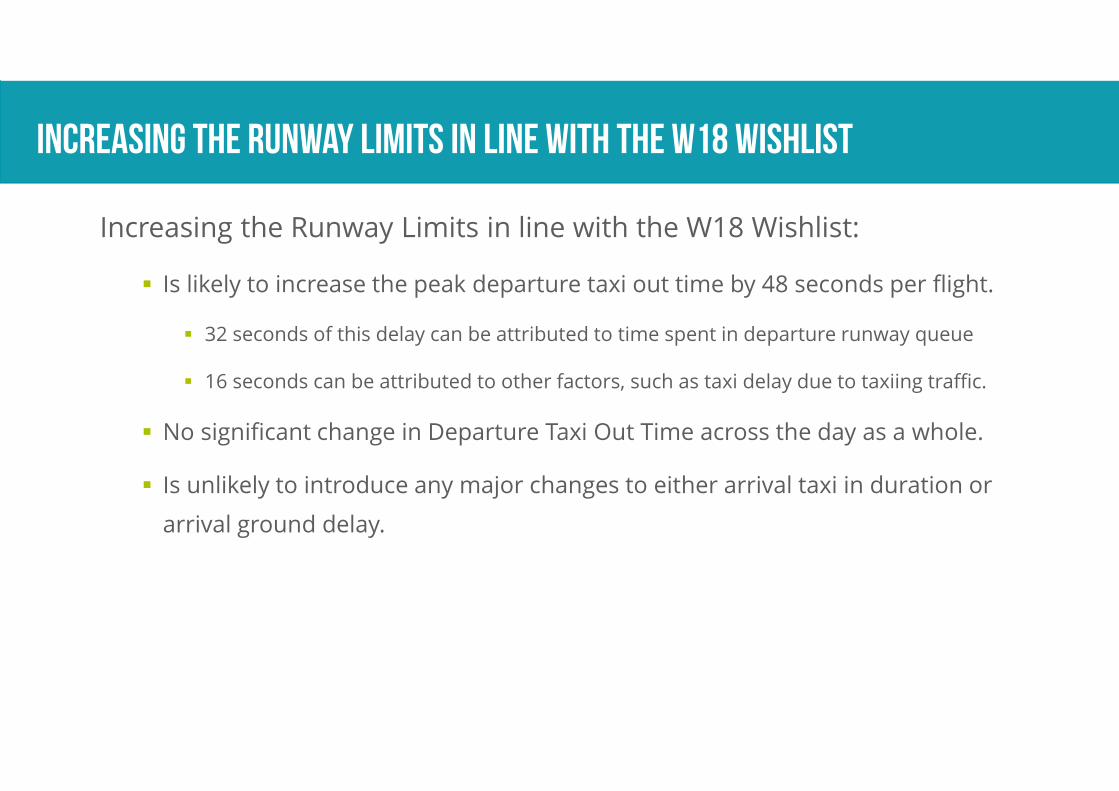
Increasing the Runway Limits in line with the W18 Wishlist
Increasing the Runway Limits in line with the W18 Wishlist:
Is likely to increase the peak departure taxi out time by 48 seconds per flight.
32 seconds of this delay can be attributed to time spent in departure runway queue
16 seconds can be attributed to other factors, such as taxi delay due to taxiing traffic.
No significant change in Departure Taxi Out Time across the day as a whole.
Is unlikely to introduce any major changes to either arrival taxi in duration or
arrival ground delay.
Maintaining the Runway Limits in line with the W17 declaration
Maintaining the Runway Limits in line with the W17 declaration:
Is likely to lead to redistribution of delays from the peak morning wave to
previous and following hours.
Is likely to keep the existing peak departure taxi out time (and associated runway
/ground delays) at the existing levels (peak just above 22 minutes).
However, due to the need to move 1 proposed departure from 0700 UTC hour to
0800 UTC hour and due to the need to move 1 proposed arrival from 1000 UTC
hour to 0900 UTC hour it is likely that the period between 0800 UTC and 1000
UTC will experience an increase in departure taxi out time.
Is unlikely to introduce any major changes to either arrival taxi in duration or
arrival ground delay.

.29 Hercules WayAerospace Boulevard I AeroParkFarnborough I HampshireGU14 6UU I UK Tel: +44 1252 451 651www.askhelios.com
.29 Hercules WayAerospace Boulevard I AeroParkFarnborough I HampshireGU14 6UU I UK Tel: +44 1252 451 651www.askhelios.com
Peter Straka
Senior consultant