Embed Size (px)
Citation preview

TEST REPORT
[FLOWBELOW AERO, INC.]
FLOWBELOW AERO, INC
TRACTOR AEROKITTM
3.16 0.15 2.13% gal/1000 miles MPG
MVT SOLUTIONS CERTIFIED™ FUEL ECONOMY TEST
DECEMBER 2020

1
Fuel Economy Test: FlowBelow Aero, Inc.
1.0: INTRODUCTION Mesilla Valley Transportation Solutions (MVTS) certifies the fuel savings from this product are as described in this report. Note: this report was designed for carriers and providing information relevant to their needs. Therefore, the format varies from traditional fuel economy and technical reports. The report Summary provides the reader a quick synopsis of the product’s fuel savings. Following the Summary is the body of the report and further details on the subjects. This fuel economy test was performed using MVTS proprietary fuel economy test methods. These test methods were developed from race car engineering and advanced vehicle test methods, which the Mesilla Valley Transportation (fleet) has relied on since 2012 to identify substantial fuel savings. The MVTS methods provide highly accurate and reliable answers on real-world fuel savings in comparison to other test methods, which enables carriers to make the best decisions for their company. Contact MVTS with any questions regarding the product or test. As part of an MVTS CertifiedTM test, MVTS supports product inquiries, which we encourage carriers to utilize. Note: blue text indicates a link to the topic. Click to follow. Alt + returns the reader to the initial location.
2.0: TEST SUMMARY The FlowBelow Tractor AeroKit showed a fuel savings of 3.16 gal/1000 miles (2.13%). Testing was conducted on a Freightliner Cascadia day cab tractor with a 48-foot refrigerated trailer. Results are shown below in Table 1.
Table 1: Fuel Economy Test Results
Gal/1000 miles MPG Percent
3.16 0.15 2.13%
Fuel Economy Improvement
Tractor AeroKit

2
Fuel Economy Test: FlowBelow Aero, Inc.
Contents 1.0: Introduction ............................................................................................................ 1
2.0: Test Summary ....................................................................................................... 1
3.0: Test Procedure ...................................................................................................... 4
3.1: Test Vehicles ...................................................................................................... 4
3.1a: Run 1: Baseline (No Aerodynamic Technologies) ....................................... 7
3.1b: Run 2: Trailer Wheel Covers (Test #1) ........................................................ 8
3.1c: Run 3: Trailer Wheel Covers (Test #2) ........................................................ 8
3.1d: Run 4: Re-Baseline ..................................................................................... 8
3.1e: Run 5: Wheel Covers Tractor and Trailer Installed ...................................... 9
3.1f: Run 6: Tractor AeroKit (Center and Rear Fairings Installed) ..................... 10
3.2: Vehicle Fuel Economy Test Equipment ........................................................... 11
4.0: Test Results ........................................................................................................ 12
4.1: Units of Measurement ...................................................................................... 14
4.2: Weather Conditions Summary ......................................................................... 14
4.3: Measurement Accuracy ................................................................................... 15
5.0: Conclusion ........................................................................................................... 16
6.0: Appendix ............................................................................................................. 17
6.1: Modified (i.e. Test) Truck/Trailer Vehicle Details .............................................. 17
6.2: Compare Truck/Trailer Vehicle Details ............................................................. 19
6.3: Test Route........................................................................................................ 21
6.4: Savings Calculations ........................................................................................ 22
6.4a: Fuel Savings Calculations ......................................................................... 22
6.4b: Financial Savings Calculations .................................................................. 22
6.5: Weather Conditions .......................................................................................... 23
6.6: Product Details ................................................................................................. 24
6.7: Test Personnel ................................................................................................. 24
6.7a: MVT Solutions ........................................................................................... 24
6.7b: Drivers ....................................................................................................... 24
6.7c: FlowBelow Aero, Inc. ................................................................................. 24
6.8: MVT Solutions Contact Info ............................................................................. 24

3
Fuel Economy Test: FlowBelow Aero, Inc.
Figures Figure 1: Test Vehicle ..................................................................................................... 5
Figure 2: Compare Vehicle .............................................................................................. 5 Figure 3: Baseline Tractor Configuration (Without Wheel Covers) .................................. 7 Figure 4: Baseline Trailer Configuration (Without Covers) .............................................. 7 Figure 5: Trailer Wheel Covers Configuration ................................................................. 8 Figure 6: Truck and Trailer Wheel Covers Installed ........................................................ 9
Figure 7: AeroKit Tractor Configuration ......................................................................... 10 Figure 8: Aerodynamic Sensors .................................................................................... 11 Figure 9: Data Acquisition System ................................................................................ 11 Figure 10: Fuel Flow Meter ........................................................................................... 11 Figure 11: Tire Temp. Sensor ....................................................................................... 11
Figure 12: Fuel Savings (gal/1000 miles) ...................................................................... 12 Figure 13: Fuel Savings (%) .......................................................................................... 13
Figure 14: Tractor AeroKit Fuel Consumption Bell Curve .............................................. 15 Figure 15: Vehicle Info, Test Vehicle ............................................................................. 17
Figure 16: Tire Info, Test Vehicle .................................................................................. 18 Figure 17: Vehicle Info, Compare Vehicle ..................................................................... 19
Figure 18: Tire Info, Compare Vehicle........................................................................... 20 Figure 19: Pecos Test Track ......................................................................................... 21
Tables
Table 1: Fuel Economy Test Results............................................................................... 1
Table 2: Test Runs .......................................................................................................... 6 Table 3: Test Results with Accuracy ............................................................................. 12
Table 4: Weather Data, December 2, 2020 ................................................................... 23
4
Fuel Economy Test: FlowBelow Aero, Inc.
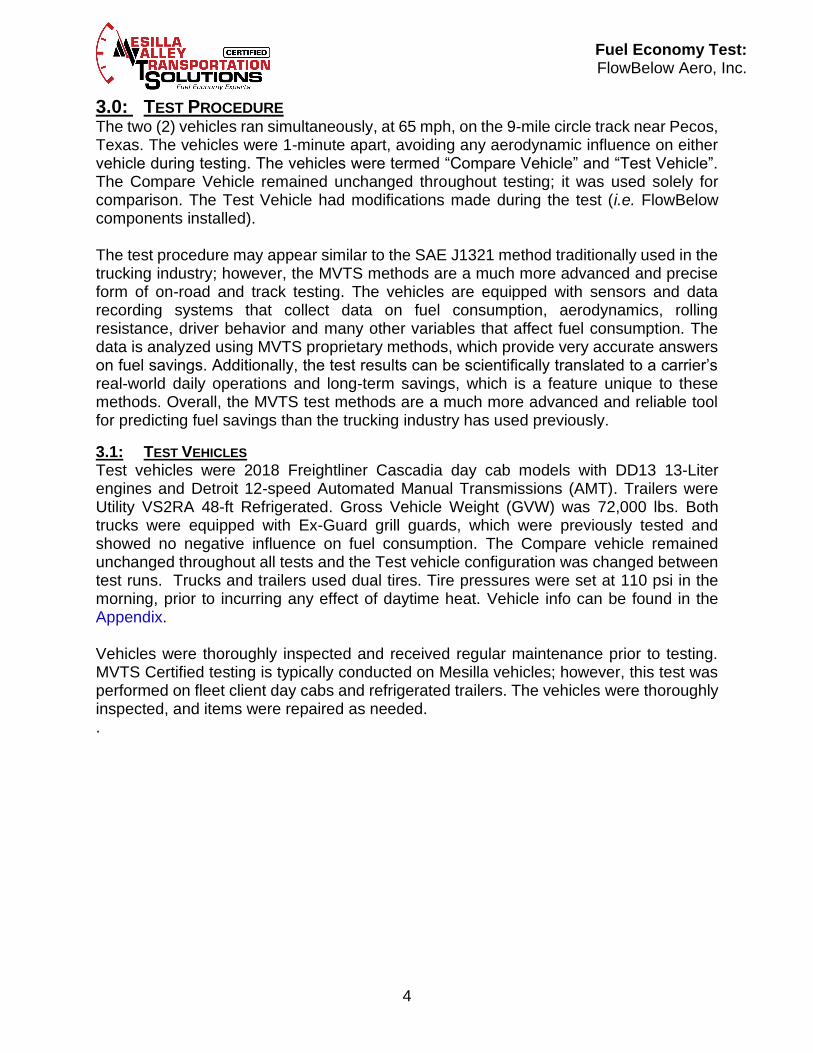
3.0: TEST PROCEDURE The two (2) vehicles ran simultaneously, at 65 mph, on the 9-mile circle track near Pecos, Texas. The vehicles were 1-minute apart, avoiding any aerodynamic influence on either vehicle during testing. The vehicles were termed “Compare Vehicle” and “Test Vehicle”. The Compare Vehicle remained unchanged throughout testing; it was used solely for comparison. The Test Vehicle had modifications made during the test (i.e. FlowBelow components installed). The test procedure may appear similar to the SAE J1321 method traditionally used in the trucking industry; however, the MVTS methods are a much more advanced and precise form of on-road and track testing. The vehicles are equipped with sensors and data recording systems that collect data on fuel consumption, aerodynamics, rolling resistance, driver behavior and many other variables that affect fuel consumption. The data is analyzed using MVTS proprietary methods, which provide very accurate answers on fuel savings. Additionally, the test results can be scientifically translated to a carrier’s real-world daily operations and long-term savings, which is a feature unique to these methods. Overall, the MVTS test methods are a much more advanced and reliable tool for predicting fuel savings than the trucking industry has used previously.
3.1: TEST VEHICLES Test vehicles were 2018 Freightliner Cascadia day cab models with DD13 13-Liter engines and Detroit 12-speed Automated Manual Transmissions (AMT). Trailers were Utility VS2RA 48-ft Refrigerated. Gross Vehicle Weight (GVW) was 72,000 lbs. Both trucks were equipped with Ex-Guard grill guards, which were previously tested and showed no negative influence on fuel consumption. The Compare vehicle remained unchanged throughout all tests and the Test vehicle configuration was changed between test runs. Trucks and trailers used dual tires. Tire pressures were set at 110 psi in the morning, prior to incurring any effect of daytime heat. Vehicle info can be found in the Appendix. Vehicles were thoroughly inspected and received regular maintenance prior to testing. MVTS Certified testing is typically conducted on Mesilla vehicles; however, this test was performed on fleet client day cabs and refrigerated trailers. The vehicles were thoroughly inspected, and items were repaired as needed. .
5
Fuel Economy Test: FlowBelow Aero, Inc.
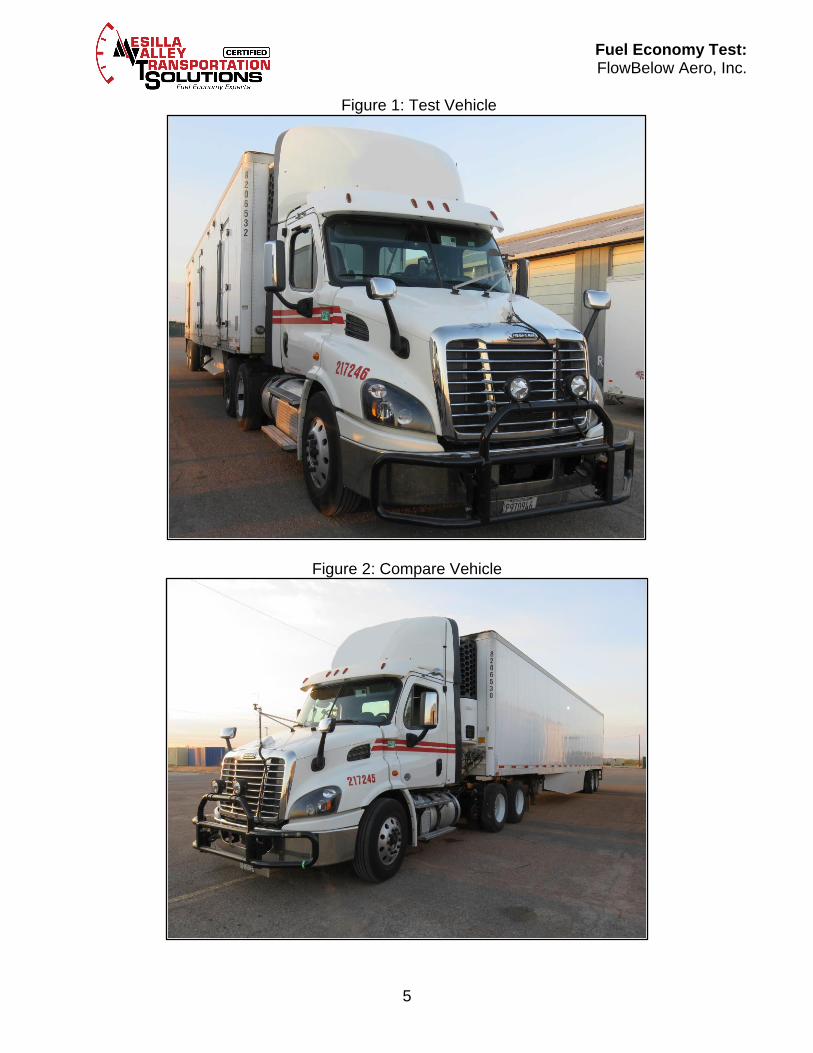
Figure 1: Test Vehicle
Figure 2: Compare Vehicle

6
Fuel Economy Test: FlowBelow Aero, Inc.
As shown below, six (6) runs were completed (Table 2), which will be explained in greater detail following the table. Runs 3 and 6 were used to provide test results for the Tractor AeroKit. Run 3 was used instead of the ‘Baseline’ of Run 4 since Run 5 and 6 also included trailer wheel covers. Comparing to Run 3 subtracted the trailer wheel cover fuel savings, which isolated the Tractor AeroKit components only. For completeness, all runs will be explained in this report.
Table 2: Test Runs
Run Run Description Start End
1 Baseline 8:15 AM 10:10 AM
2Trailer Wheel Covers
(Test #1)10:26 AM 12:05 PM
3Trailer Wheel Covers
(Test#2)12:33 PM 2:12 PM
4 Re-Baseline 2:12 PM 3:26 PM
5Wheel Covers Truck and Trailer
(Added Tractor Wheel Covers)4:36 PM 6:15 PM
6Tractor AeroKit
(added Center and Rear Pieces)6:47 PM 8:26 PM
7
Fuel Economy Test: FlowBelow Aero, Inc.
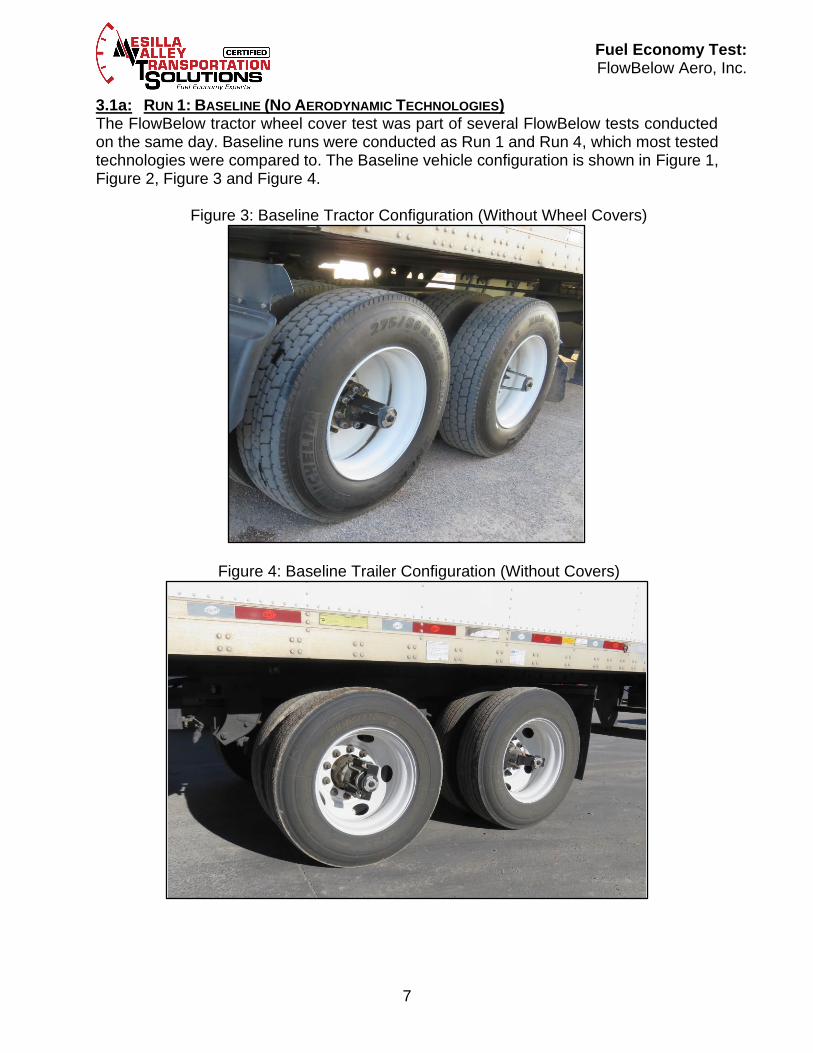
3.1a: RUN 1: BASELINE (NO AERODYNAMIC TECHNOLOGIES) The FlowBelow tractor wheel cover test was part of several FlowBelow tests conducted on the same day. Baseline runs were conducted as Run 1 and Run 4, which most tested technologies were compared to. The Baseline vehicle configuration is shown in Figure 1, Figure 2, Figure 3 and Figure 4.
Figure 3: Baseline Tractor Configuration (Without Wheel Covers)
Figure 4: Baseline Trailer Configuration (Without Covers)

8
Fuel Economy Test: FlowBelow Aero, Inc.
3.1b: RUN 2: TRAILER WHEEL COVERS (TEST #1) Run 2 consisted of installing the FlowBelow wheel covers on the trailer (Figure 5). Run 2 and 1 were compared to provide the results for Test #1 of the FlowBelow trailer wheel covers.
Figure 5: Trailer Wheel Covers Configuration
3.1c: RUN 3: TRAILER WHEEL COVERS (TEST #2) Run 3 was a repeat of Run 2, which was conducted to verify the trailer wheel cover values (Figure 5). No product technologies were changed. Run 3 and 4 were compared to provide results for Test #2.
3.1d: RUN 4: RE-BASELINE The baseline test was repeated in Run 4 and the trailer wheel covers were removed. This served as the second Baseline run in which Run 3 was compared (Figure 1, Figure 2, Figure 3, Figure 4).

9
Fuel Economy Test: FlowBelow Aero, Inc.
3.1e: RUN 5: WHEEL COVERS TRACTOR AND TRAILER INSTALLED Run 5 consisted of installing FlowBelow wheel covers on the tractor and trailer (Figure 6). Comparing Run 5 and 4 provided fuel savings values for the tractor and trailer wheel covers combined. Comparing Run 4 and 3 provided values for the tractor wheel covers only, since that was the only installation difference between those two runs.
Figure 6: Truck and Trailer Wheel Covers Installed

10
Fuel Economy Test: FlowBelow Aero, Inc.
3.1f: RUN 6: TRACTOR AEROKIT (CENTER AND REAR FAIRINGS INSTALLED) Run 6 tested the FlowBelow Tractor AeroKit. The AeroKit included the Center Fairing [A], Rear Fairing [B], Wheel Covers [C], mud flaps and brackets [D]. Since wheel covers were already installed, only the Center and Rear Fairings required installation for Run 6, along with the mud flaps and brackets (Figure 7). Run 6 was compared to Run 3 to provide the FlowBelow AeroKit results, which accounted for the tractor wheel covers and did not include the trailer wheel covers.
Figure 7: AeroKit Tractor Configuration
D
A B C

11
Fuel Economy Test: FlowBelow Aero, Inc.
3.2: VEHICLE FUEL ECONOMY TEST EQUIPMENT MVT Solutions fuel economy testing utilizes a data acquisition system and sensors specifically for this testing. This style of testing is derived from race car engineering where reliable sensor data is critical to understanding vehicle modifications. MVTS test sensors include:
• Data acquisition system (records sensor data)
• Fuel flow meter (accurate to 0.2%)
• Fuel temperature sensor
• Tire temperature sensor (infrared, mounted on left-front drive tire)
• Ground/road temperature sensor (infrared, mounted ahead of left-front drive tire)
• Wind speed air pressure sensor (truck hood)
• Wind direction sensor (truck hood)
• Ambient air temperature sensor (truck hood)
• Ambient air pressure sensor (truck cab)
• High Precision GPS (latitude, longitude, altitude, time) Click this link to see a video of MVTS sensors and testing: How We Test
Figure 8: Aerodynamic Sensors
Figure 9: Data Acquisition System
Figure 10: Fuel Flow Meter
Figure 11: Tire Temp. Sensor
12
Fuel Economy Test: FlowBelow Aero, Inc.
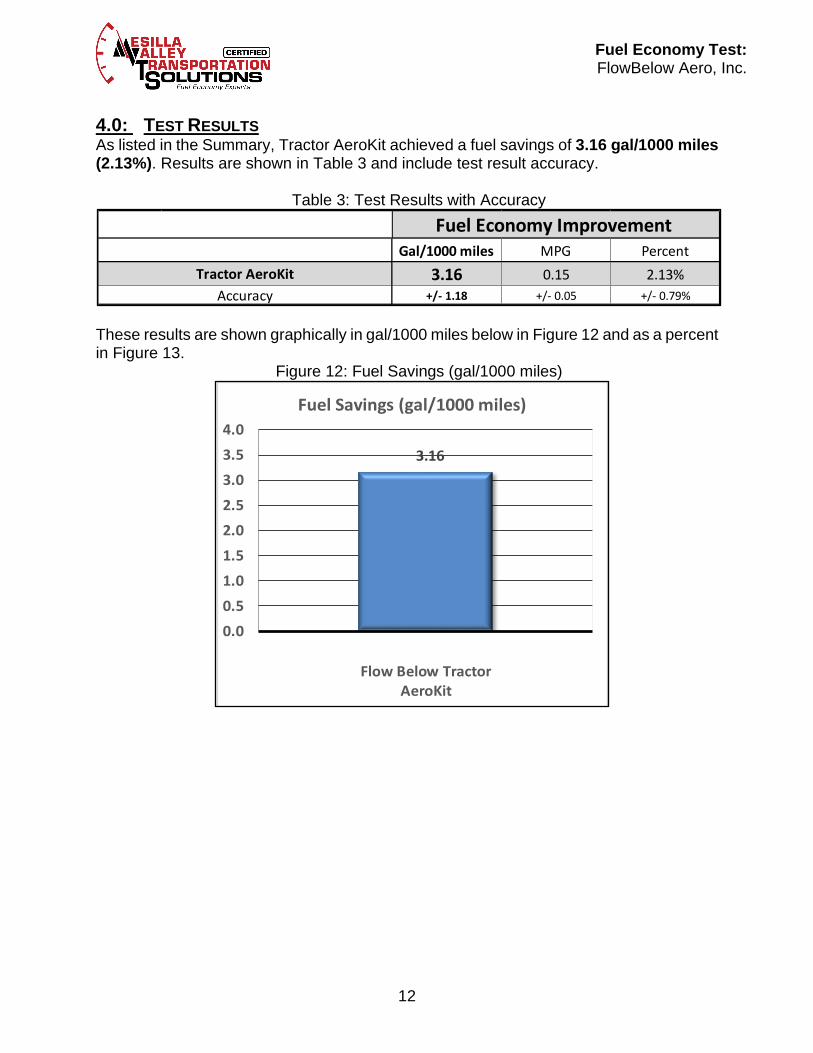
4.0: TEST RESULTS As listed in the Summary, Tractor AeroKit achieved a fuel savings of 3.16 gal/1000 miles (2.13%). Results are shown in Table 3 and include test result accuracy.
Table 3: Test Results with Accuracy
These results are shown graphically in gal/1000 miles below in Figure 12 and as a percent in Figure 13.
Figure 12: Fuel Savings (gal/1000 miles)
Gal/1000 miles MPG Percent
3.16 0.15 2.13%
+/- 1.18 +/- 0.05 +/- 0.79%
Fuel Economy Improvement
Tractor AeroKit
Accuracy
3.16
0.0
0.5
1.0
1.5
2.0
2.5
3.0
3.5
4.0
Flow Below TractorAeroKit
Fuel Savings (gal/1000 miles)

13
Fuel Economy Test: FlowBelow Aero, Inc.
Figure 13: Fuel Savings (%)
2.13%
0.0%
0.5%
1.0%
1.5%
2.0%
2.5%
3.0%
Flow Below TractorAeroKit
Fuel Savings (%)
14
Fuel Economy Test: FlowBelow Aero, Inc.
4.1: UNITS OF MEASUREMENT The reader may not be familiar with units of gal/1000 miles (gallons per 1000 miles) since it is not traditionally used in the trucking industry. The following paragraphs briefly explain the reasons for these units and how they help carriers better calculate fuel savings. Units of gal/1000 miles more reliably calculate fuel savings when compared to other units such as miles-per-gallon (MPG) and percent (%). Those units are prone to error from changing variables such as vehicle baseline fuel economy, load, driver behavior, and duty cycle. For example, gal/1000 miles values are not affected by load for an aerodynamic product. Any empty Class-8 unit at 34,000 lbs. will save the same fuel in gal/1000 miles as one loaded to 80,000 lbs. However, when viewed in percent (%) or MPG the values change with load. This causes a carrier to experience varied results in real-world operation and difficulty predicting the financial benefits of the product unless units of gal/1000 miles are used. Units of gal/1000 miles are the most reliable units of measurement for aerodynamic fuel savings due to their scientific and mathematical relationship to fuel consumption. Further detail is beyond the scope of this report and the reader is encouraged to contact MVT Solutions if more information is desired.
4.2: WEATHER CONDITIONS SUMMARY Temperatures ranged from 34.0°F to 46.0°F. Winds ranged from 12 mph to 25 mph and gust conditions were omitted from the test results based on consistency of test data. It should be noted that the MVTS test methods account for these variables and their effects on fuel savings. Therefore, the range in climate conditions did not impede the test results shown in this report. Complete weather data can be found in the Appendix.

15
Fuel Economy Test: FlowBelow Aero, Inc.
4.3: MEASUREMENT ACCURACY The accuracy of fuel economy measurements is critical in determining the trustworthiness of test results. Historically, this has been a major difficulty in the trucking industry with fuel economy testing, which has led to confusion and misleading results. The MVTS test methods overcome this issue by achieving better accuracy, which is one of the ways it provides more reliable test results. Accuracy for all the tests was calculated using a 95% confidence interval, a common standard for testing measurement. 95% confidence interval indicates that if the test was repeated 100 times, values would fall within the range in 95 out of the 100 tests (i.e. the reader would be 95% confident the value would be within that range). Figure 14 below, shows the statistical bell curves of the Tractor AeroKit. The Baseline test and the Tractor AeroKit test clearly show two separate bell curves, indicating the test had valid accuracy and results were reliable. The graph shows the arrow pointing to the left illustrating less fuel used (i.e. fuel saved). The distance between the peaks of the bell curves is the test result average, which was a fuel savings of 3.16 gal/1000 miles. Minimum and maximum values were calculated as the test result plus or minus the accuracy values (3.16 +/- 1.18) which were 1.98 and 4.34 gal/1000 miles respectively.
Figure 14: Tractor AeroKit Fuel Consumption Bell Curve
-4.0 -3.5 -3.0 -2.5 -2.0 -1.5 -1.0 -0.5 0.0 0.5 1.0
Fuel Consumption (gal/1000mi)
Fuel Consumption Results (gal/1000mi)
Baseline
Tractor AeroKit
Improvement: 3.16
Max: 4.34
Min: 1.98
16
Fuel Economy Test: FlowBelow Aero, Inc.
5.0: CONCLUSION MVTS testing proved the fuel savings of the FlowBelow Tractor AeroKit with answers that were clear and precise. The FlowBelow Tractor AeroKit showed fuel savings of 3.16 gal/1000 miles (2.13%). These are valuable fuel savings for any carrier. The added advantage of the FlowBelow AeroKit is that it installs on the tractor, therefore providing a one to one (1:1) purchase to usage ratio, unlike trailer aerodynamic technologies that typically require ratios from 1.5 to 6 depending on the fleet’s tractor to trailer ratio. An additional benefit of the AeroKit is the ability for Owner-Operators (O/O) to install this technology on their tractors as opposed to trailer technologies that the O/O cannot control the usage of. The test values shown can be used to estimate a carrier’s savings in real-world operations. More precision can be obtained by using a carrier’s vehicle and duty cycle information. Contact MVT Solutions for assistance or more information.

17
Fuel Economy Test: FlowBelow Aero, Inc.
6.0: APPENDIX
6.1: MODIFIED (I.E. TEST) TRUCK/TRAILER VEHICLE DETAILS
Figure 15: Vehicle Info, Test Vehicle
Date
Company
Location
Test Route
TRUCK ID: Veh. B
Brand
Year
Model
Engine
VIN
Mileage (miles):
Transmission
Rear Gear
Fuel Load
Fuel Type & Batch
Axle Weights
Total weight
TRAILER ID: 8206532
Model
VIN
Year
Model
Size
Trailer Gap (inches)
Add-ons
Transtex skirts
48-ft
47.5 inches
1UY VS2487 GU4274 20
2015
Refrigerated
Photo/Video/Audio folder name:
Utility VS2RA
11,720 29,360 30,980
72,060
Full at start of test
No. 2 Diesel
Detroit 12 Speed AMT
N/A
3AKJGBDV8JSKB0291
284,806
Freightliner
2018
Cascadia Day Cab
Detroit DD13
Pecos 9-mile Test Track
December 2, 2020
Fleet Client
Pecos, Texas
18
Fuel Economy Test: FlowBelow Aero, Inc.
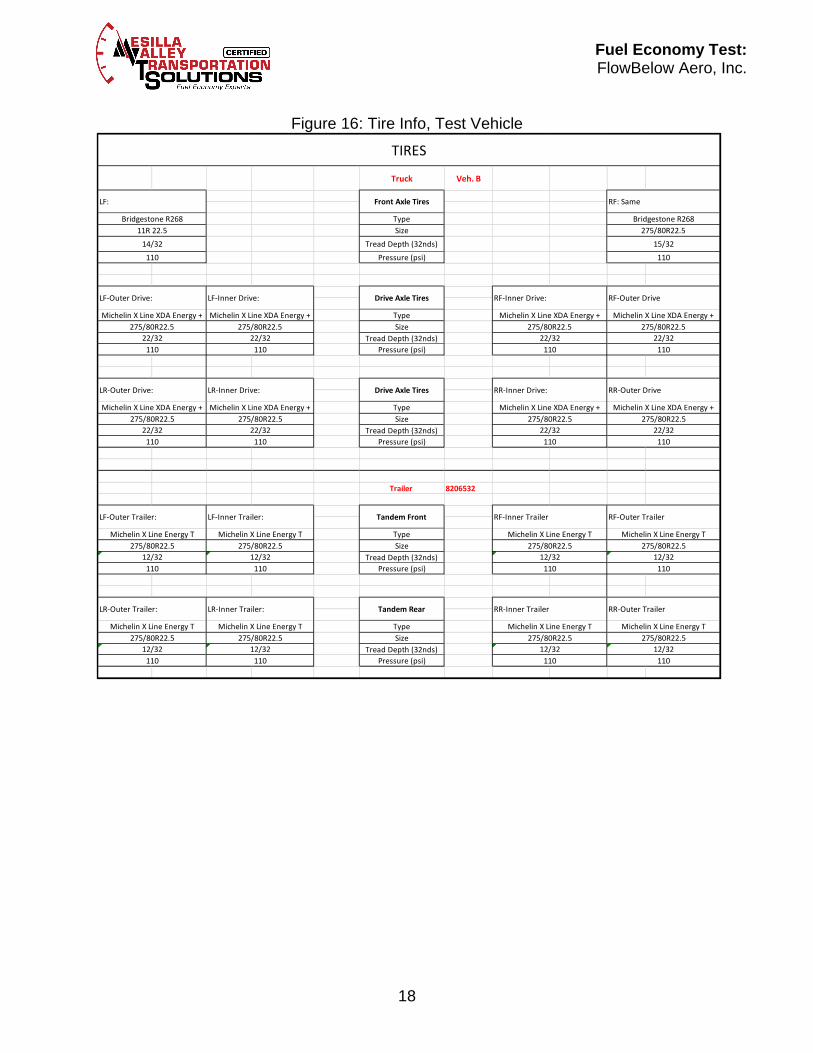
Figure 16: Tire Info, Test Vehicle
Truck Veh. B
Type
Size
Tread Depth (32nds)
Pressure (psi)
Type
Size
Tread Depth (32nds)
Pressure (psi)
Type
Size
Tread Depth (32nds)
Pressure (psi)
Trailer 8206532
Type
Size
Tread Depth (32nds)
Pressure (psi)
Type
Size
Tread Depth (32nds)
Pressure (psi)
Michelin X Line Energy T Michelin X Line Energy T Michelin X Line Energy T Michelin X Line Energy T
275/80R22.5 275/80R22.5 275/80R22.5 275/80R22.5
12/32 12/32 12/32 12/32
110 110 110 110
275/80R22.5 275/80R22.5 275/80R22.5 275/80R22.5
12/32 12/32 12/32 12/32
110 110 110 110
LR-Outer Trailer: LR-Inner Trailer: Tandem Rear RR-Inner Trailer RR-Outer Trailer
RF-Outer Trailer
Michelin X Line Energy T Michelin X Line Energy T Michelin X Line Energy T Michelin X Line Energy T
LF-Outer Trailer: LF-Inner Trailer: Tandem Front RF-Inner Trailer
110 110 110 110
275/80R22.5 275/80R22.5
22/32 22/32 22/32 22/32
Drive Axle Tires RR-Inner Drive: RR-Outer Drive
Michelin X Line XDA Energy + Michelin X Line XDA Energy + Michelin X Line XDA Energy + Michelin X Line XDA Energy +
275/80R22.5 275/80R22.5
LR-Outer Drive: LR-Inner Drive:
110 110 110 110
275/80R22.5 275/80R22.5 275/80R22.5 275/80R22.5
22/32 22/32 22/32 22/32
RF-Outer Drive
Michelin X Line XDA Energy + Michelin X Line XDA Energy + Michelin X Line XDA Energy + Michelin X Line XDA Energy +
110 110
LF-Outer Drive: LF-Inner Drive: Drive Axle Tires RF-Inner Drive:
Bridgestone R268 Bridgestone R268
11R 22.5 275/80R22.5
14/32 15/32
TIRES
LF: Front Axle Tires RF: Same

19
Fuel Economy Test: FlowBelow Aero, Inc.
6.2: COMPARE TRUCK/TRAILER VEHICLE DETAILS
Figure 17: Vehicle Info, Compare Vehicle
Date
Company
Location
Test Route
TRUCK ID: Veh. C
Brand
Year
Model
Engine
VIN
Mileage (miles):
Transmission
Rear Gear
Fuel Load
Fuel Type & Batch
Axle Weights
Total weight
TRAILER ID: 8206530
Model
VIN
Year
Model
Size
Trailer Gap (inches)
Add-ons
Transtex skirts
Refrigerated
47.5 inches
1UY VS2480 GU4274 22
2015
48-ft
Photo/Video/Audio folder name:
Utility VS2RA
11,720 29,360 30,980
72,060
Full at start of test
No. 2 Diesel
Detroit 12 Speed AMT
N/A
3AKJHTDV1MSMU3246
719
Freightliner
2021
Cascadia Day Cab
Detroit DD13
Pecos 9-mile Test Track
December 2, 2020
Fleet Client
Pecos, Texas

20
Fuel Economy Test: FlowBelow Aero, Inc.
Figure 18: Tire Info, Compare Vehicle
Truck Veh. C
Type
Size
Tread Depth (32nds)
Pressure (psi)
Type
Size
Tread Depth (32nds)
Pressure (psi)
Type
Size
Tread Depth (32nds)
Pressure (psi)
Trailer 8206530
Type
Size
Tread Depth (32nds)
Pressure (psi)
Type
Size
Tread Depth (32nds)
Pressure (psi)
295/75R22.5 295/75R22.5 275/80R22.5 295/75R22.5
11/32 11/32 11/32 11/32
110 110 110 110
LR-Outer Trailer: LR-Inner Trailer: Tandem Rear RR-Inner Trailer RR-Outer Trailer
11/32
110 110 110 110
11/32 11/32 11/32
Bridgestone Ecopia R123 Bridgestone Ecopia R123 Bridgestone Ecopia R123 Bridgestone Ecopia R123
RF-Outer Trailer
Bridgestone Ecopia R123 Bridgestone Ecopia R123 Bridgestone Ecopia R123 Bridgestone Ecopia R123
LF-Outer Trailer: LF-Inner Trailer: Tandem Front RF-Inner Trailer
295/75R22.5 295/75R22.5 295/75R22.5 295/75R22.5
110 110 110 110
275/80R22.5 275/80R22.5
22/32 22/32 22/32 22/32
Drive Axle Tires RR-Inner Drive: RR-Outer Drive
Michelin X Line XDA Energy + Michelin X Line XDA Energy + Michelin X Line XDA Energy + Michelin X Line XDA Energy +
275/80R22.5 275/80R22.5
LR-Outer Drive: LR-Inner Drive:
110 110 110 110
275/80R22.5 275/80R22.5 275/80R22.5 275/80R22.5
22/32 22/32 22/32 22/32
RF-Outer Drive
Michelin X Line XDA Energy + Michelin X Line XDA Energy + Michelin X Line XDA Energy + Michelin X Line XDA Energy +
110 110
LF-Outer Drive: LF-Inner Drive: Drive Axle Tires RF-Inner Drive:
Bridgestone R283a Bridgestone R283a
295/75R22.5 295/75R22.5
17/32 17/32
TIRES
LF: Front Axle Tires RF: Same
21
Fuel Economy Test: FlowBelow Aero, Inc.
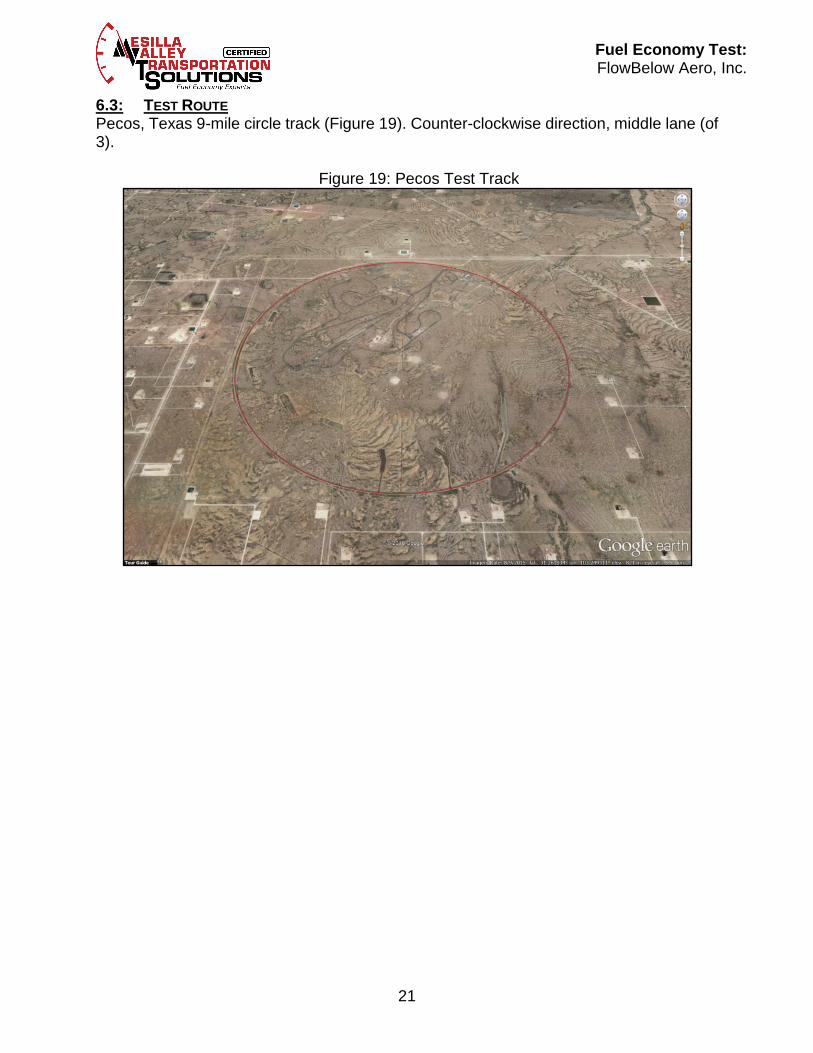
6.3: TEST ROUTE Pecos, Texas 9-mile circle track (Figure 19). Counter-clockwise direction, middle lane (of 3).
Figure 19: Pecos Test Track

22
Fuel Economy Test: FlowBelow Aero, Inc.
6.4: SAVINGS CALCULATIONS Below is a brief outline of how to use the test results to calculate savings. For more detail or assistance contact MVT Solutions.
6.4a: Fuel Savings Calculations Fuel savings resulting from this test can be calculated as follows: Test result (gal/1000 miles) x Thousands of miles travelled per year, per vehicle Example: Tractor AeroKit fuel savings = 3.16 gal/1000 miles. If a vehicle travels 125,000 miles per year, fuel savings are: 3.16 x 125 = 395 gallons saved annually
6.4b: FINANCIAL SAVINGS CALCULATIONS Financial calculations can be made by multiplying the fuel saved by the fuel price. Using the U.S. average retail price of diesel fuel in 2019, $3.056 /gal: 395 gallons/year x $3.056 /gal = $1207 /year in fuel savings To continue calculating the net financial savings requires input of the product investment, fleet trailer-to-truck ratio and other pertinent variables unique to each carrier. Contact MVTS for assistance if required.
23
Fuel Economy Test: FlowBelow Aero, Inc.
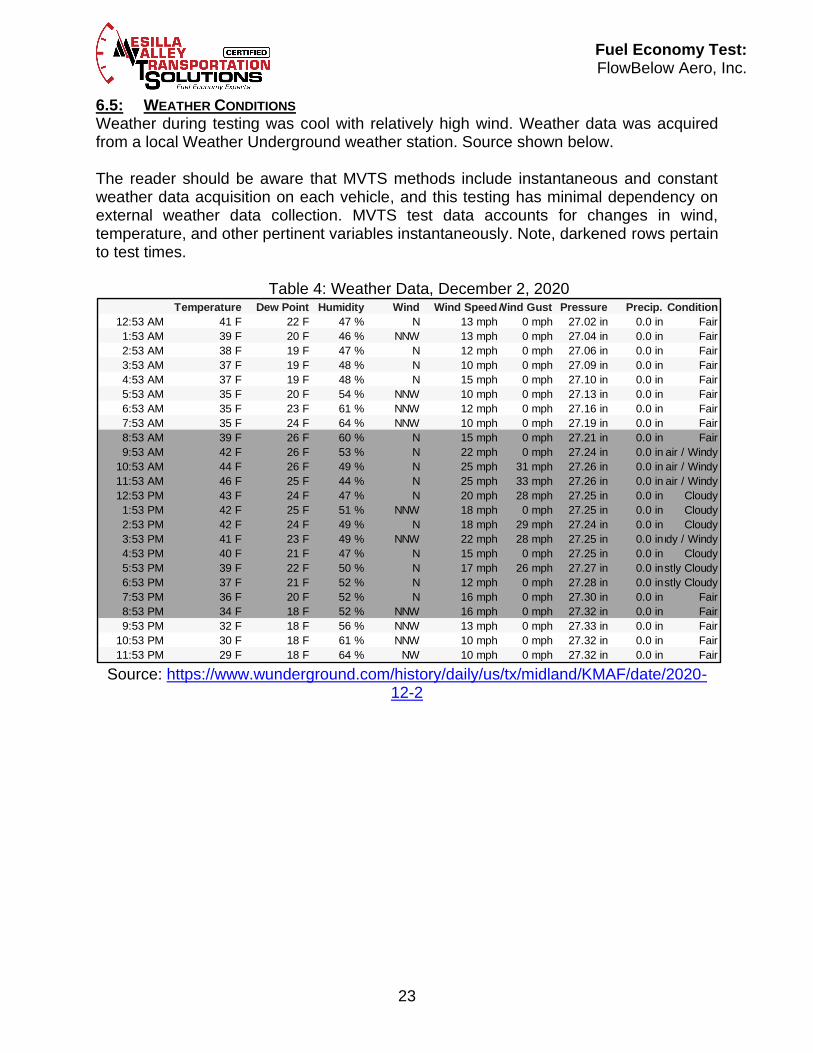
6.5: WEATHER CONDITIONS Weather during testing was cool with relatively high wind. Weather data was acquired from a local Weather Underground weather station. Source shown below. The reader should be aware that MVTS methods include instantaneous and constant weather data acquisition on each vehicle, and this testing has minimal dependency on external weather data collection. MVTS test data accounts for changes in wind, temperature, and other pertinent variables instantaneously. Note, darkened rows pertain to test times.
Table 4: Weather Data, December 2, 2020
Source: https://www.wunderground.com/history/daily/us/tx/midland/KMAF/date/2020-
12-2
Temperature Dew Point Humidity Wind Wind SpeedWind Gust Pressure Precip. Condition
12:53 AM 41 F 22 F 47 % N 13 mph 0 mph 27.02 in 0.0 in Fair
1:53 AM 39 F 20 F 46 % NNW 13 mph 0 mph 27.04 in 0.0 in Fair
2:53 AM 38 F 19 F 47 % N 12 mph 0 mph 27.06 in 0.0 in Fair
3:53 AM 37 F 19 F 48 % N 10 mph 0 mph 27.09 in 0.0 in Fair
4:53 AM 37 F 19 F 48 % N 15 mph 0 mph 27.10 in 0.0 in Fair
5:53 AM 35 F 20 F 54 % NNW 10 mph 0 mph 27.13 in 0.0 in Fair
6:53 AM 35 F 23 F 61 % NNW 12 mph 0 mph 27.16 in 0.0 in Fair
7:53 AM 35 F 24 F 64 % NNW 10 mph 0 mph 27.19 in 0.0 in Fair
8:53 AM 39 F 26 F 60 % N 15 mph 0 mph 27.21 in 0.0 in Fair
9:53 AM 42 F 26 F 53 % N 22 mph 0 mph 27.24 in 0.0 inFair / Windy
10:53 AM 44 F 26 F 49 % N 25 mph 31 mph 27.26 in 0.0 inFair / Windy
11:53 AM 46 F 25 F 44 % N 25 mph 33 mph 27.26 in 0.0 inFair / Windy
12:53 PM 43 F 24 F 47 % N 20 mph 28 mph 27.25 in 0.0 in Cloudy
1:53 PM 42 F 25 F 51 % NNW 18 mph 0 mph 27.25 in 0.0 in Cloudy
2:53 PM 42 F 24 F 49 % N 18 mph 29 mph 27.24 in 0.0 in Cloudy
3:53 PM 41 F 23 F 49 % NNW 22 mph 28 mph 27.25 in 0.0 inCloudy / Windy
4:53 PM 40 F 21 F 47 % N 15 mph 0 mph 27.25 in 0.0 in Cloudy
5:53 PM 39 F 22 F 50 % N 17 mph 26 mph 27.27 in 0.0 inMostly Cloudy
6:53 PM 37 F 21 F 52 % N 12 mph 0 mph 27.28 in 0.0 inMostly Cloudy
7:53 PM 36 F 20 F 52 % N 16 mph 0 mph 27.30 in 0.0 in Fair
8:53 PM 34 F 18 F 52 % NNW 16 mph 0 mph 27.32 in 0.0 in Fair
9:53 PM 32 F 18 F 56 % NNW 13 mph 0 mph 27.33 in 0.0 in Fair
10:53 PM 30 F 18 F 61 % NNW 10 mph 0 mph 27.32 in 0.0 in Fair
11:53 PM 29 F 18 F 64 % NW 10 mph 0 mph 27.32 in 0.0 in Fair

24
Fuel Economy Test: FlowBelow Aero, Inc.
6.6: PRODUCT DETAILS
• FlowBelow Tractor AeroKit
6.7: TEST PERSONNEL
6.7a: MVT SOLUTIONS
• Daryl Bear, Lead Engineer & COO
• Jacob Schwartz, Test Engineer
6.7b: DRIVERS
• Allan Dahringer
• Carlos Aragon
• Jack Burchell
• Seth Knight
6.7c: FLOWBELOW AERO, INC.
• Josh Butler, President
6.8: MVT SOLUTIONS CONTACT INFO Daryl Bear, Lead Engineer & COO
[email protected] 317-603-9325 Jacob Schwartz, Test Engineer [email protected] Sam Raley, Test Engineer (author of report) [email protected] Website: www.m-v-t-s.com