Embed Size (px)
Citation preview

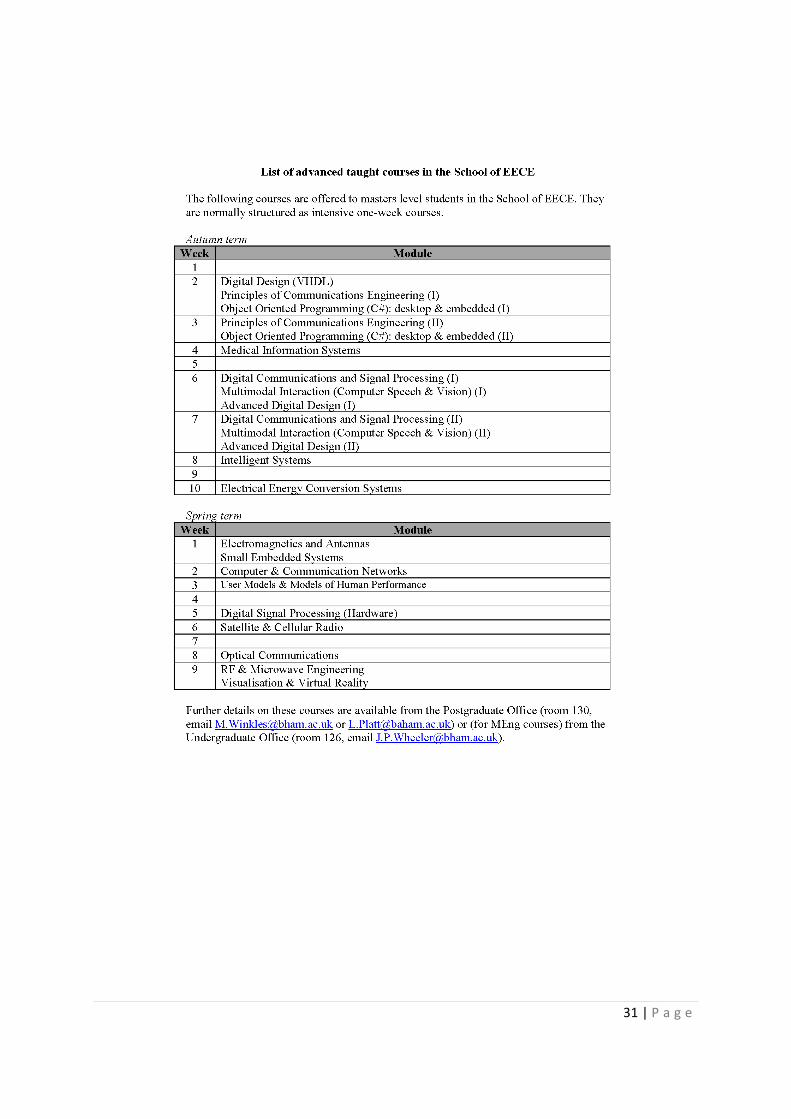
SCHOOL OF ELECTRONIC, ELECTRICAL AND COMPUTER ENGINEERING
Wind Turbine
Condition Monitoring System
3 Month PhD Progress Report
By
Mani Entezami
Supervisors
Dr. Stuart Hillmansen
Dr. Clive Roberts
11 January 2010

1 | P a g e
Abstract
The most significant difficulties in generating electrical energy using fossil-fuel resources are
their high cost and scarcity. Thus, renewable energy, which is achieved using natural
resources, is one of the most imperative aspects for solving the energy crisis. Solar, wind,
geothermal and tidal energy are examples of sustainable and renewable energy resources
as they are unlikely to deplete. Presently, wind energy is the most developed of these
renewable technologies due to the vast number of wind turbines used across the world as
well as the many projects currently being planned.
The cost of a wind turbine in comparison to a diesel generator is extremely higher.
Furthermore, regular maintenance can be up to 2% of the total price of a turbine. However,
occasional malfunction of specific parts (such as blades, gearbox, tower, braking system
etc.) can result to high expenses and in some situations, such as failure of a blade or tower,
causes catastrophic damage, jeopardising the whole investment and certainty of wind
energy.
Checking the system components, either by human-based resources or intelligent systems,
helps to prevent and lower the number of major breakdowns. Therefore, different condition
monitoring systems have been applied to wind turbines, providing an interesting
opportunity for a wide research area to develop in the field of wind turbine structural health
monitoring and onsite condition monitoring systems. Evaluating critical system component
conditions will lead to improved recognition of faulty parts and will facilitate the reduction
in time and cost within maintenance.
Using a variety of different sensors for turbine components and having a proper supervisory
control and data acquisition system (SCADA), an advanced condition monitoring system can
be implemented. Analysing sensor data, implementing fault detection algorithms and using
advanced signal processing will result in an improved prediction of the possible
malfunctions that may occur.
Novel Integrated condition MOnitoring system for wind turbines (NIMO) is a European
project aiming to advance current state-of-the-art wind turbine condition monitoring
systems, search for improved techniques to eliminate catastrophic failures and minimise the
requirements of corrective maintenance.
2 | P a g e
Table of Contents
ABSTRACT ................................................................................................................................................................ 1
TABLE OF CONTENTS ............................................................................................................................................... 2
1 INTRODUCTION .............................................................................................................................................. 3
1.1 WIND .............................................................................................................................................................. 3
1.2 WIND TURBINES................................................................................................................................................. 3
1.3 REPORT OVERVIEW ............................................................................................................................................ 5
2 CONDITION MONITORING AND FAULT DIAGNOSIS SYSTEMS .......................................................................... 5
2.1 CONDITION MONITORING SYSTEM ......................................................................................................................... 5
2.2 DIGITAL SIGNAL PROCESSING ................................................................................................................................ 6
2.3 FAULT DETECTION AND ISOLATION ......................................................................................................................... 7
2.4 NON DESTRUCTIVE TESTING AND ACOUSTIC EMISSION ............................................................................................... 8
2.5 SCADA ........................................................................................................................................................... 8
3 CONTROL SYSTEMS AND FAULT DETECTION MECHANISMS ............................................................................ 9
3.1 CONTROL SYSTEMS ............................................................................................................................................. 9
3.2 FAULT DETECTION MECHANISMS......................................................................................................................... 11
4 WIND TURBINES CONDITION MONITORING SYSTEMS................................................................................... 13
4.1 INTRODUCTION ................................................................................................................................................ 13
4.2 BACKGROUND ................................................................................................................................................. 14
4.3 FAULT AND FAULT DETECTION IN WIND TURBINES................................................................................................... 15
4.3.1 Components Fault and Fault detection Methodologies.......................................................................... 16
4.4 CMS UNITS FUNCTIONALITY AND TECHNOLOGIES ................................................................................................... 17
4.4.1 Data acquisition ..................................................................................................................................... 17
4.4.2 Data processing and analysis ................................................................................................................. 18
4.4.3 Databases ............................................................................................................................................... 18
4.4.4 Process Unit ............................................................................................................................................ 18
4.4.5 Communication networks ....................................................................................................................... 19
4.5 CURRENT PROBLEM .......................................................................................................................................... 19
5 FUTURE WORK .............................................................................................................................................. 20
5.1 INTRODUCTION ................................................................................................................................................ 20
5.2 NIMO ........................................................................................................................................................... 20
5.2.1 Methodology .......................................................................................................................................... 20
5.2.1.1 Acoustic emission sensors ............................................................................................................. 21
5.2.1.2 Vibration sensors .......................................................................................................................... 22
5.2.2 Work packages ....................................................................................................................................... 22
5.3 LITERATURE REVIEWS ........................................................................................................................................ 23
5.4 MODELLING .................................................................................................................................................... 23
5.5 PROJECT SCHEDULE ........................................................................................................................................... 24
6 WEB PAGE .................................................................................................................................................... 25
7 REFERENCES .................................................................................................................................................. 26
APPENDIX A: RISK ASSESSMENT FORM ............................................................................................................. 28
APPENDIX B: TRAINING NEEDS ......................................................................................................................... 29

3 | P a g e
1 Introduction
This report considers wind turbine condition monitoring systems (CMS) and includes a
detailed description of the basic concepts of the system and wind energy to wind turbine
fault detection processes, which can be found within this chapter.
1.1 Wind
Wind is the movement of air mass from a high pressure area to a low pressure area and is
mainly caused by differences in temperature within the atmosphere. A high difference in
pressure results in an increased wind velocity Climate changes, location, region and height
are all factors which have a significant effect on wind speed and direction. [1]
The Kinetic energy (a flow per unit volume) of the wind is calculated using the following
equation:
𝐸𝐾 =1
2𝜌𝑉2 (1.1)
‘ρ' is the density of the air and ‘V’ is the wind speed (𝑚 𝑠 ). The energy of the wind flowing
through a specific area ‘A’ (m²) where the flow rate is ‘AV’ is calculated by:
𝑃𝑉 =1
2𝜌𝐴𝑉3 (1.2)
‘A’ represents the rotor swept area in a wind turbine. [1]
1.2 Wind turbines
A wind turbine is a rotating mechanical device that converts the wind kinetic energy to
practical mechanical energy, resulting in the production of electricity. Rotary part can be
either vertical (figure 1.1a) or horizontal (figure 1.1b), which classifies the two different
types of turbines.
Figure 1.1
The main advantage of vertical-axis wind turbines is that the gearbox and transmission
systems are placed at ground level. Another advantage is their ability to capture the wind

4 | P a g e
without considering wind direction. However, maintenance of these turbines is not
straightforward as removing the rotor is often required. In addition, the captured energy is
not efficient and large areas are compulsory for those turbines situated on land as guy-wire
is necessary for supporting the structure.
Alternatively, the most recent wind turbines used are horizontal-axis based with two or
three blades. Having the rotor positioned on the top of the tower creates a more efficient
system as more wind energy is produced. These turbines also have a nacelle, which held up
by the tower and contains the gearbox and generator. A yaw system, which is turning the
nacelle and rotor to face the wind, enables the turbine to capture the highest amount of
energy. Additionally, some wind turbine blades have moveable blade tips, which are used as
air brakes. Figure 1.2 demonstrates the components involved in a three bladed horizontal-
axis wind turbine. [1]
Figure 1.2
Here are brief descriptions of wind turbine components: [2]
Blades: capture the wind energy, which are made of advanced composite materials,
normally, Fibre Reinforced Plastics.
Rotor: the blades and hub combined is known as the rotor.
Pitch: control the direction of the blades to face the wind.
Brake: disk-based brake that stops the blades during emergencies.
Low-speed shaft: a shaft that is rotated by the rotor.
Gearbox: increases the speed of the low-speed shaft to a suitable value that is
required in electricity generators.
Generator: a device that converts the mechanical energy to electrical energy. The
output power of a wind turbine generator is fluctuating according to the wind speed.

5 | P a g e
Controller: starts and stops the turbine in specific wind speeds to enable safety.
Anemometer: measures the wind speed and conveys them to controller.
Wind Vane: calculates the wind direction and cooperates with the yaw system.
Nacelle: a large cover on the top the tower to protect the mechanical transmission
system.
High-speed shaft: drives the generator.
Yaw drive: allows the rotor to face the wind as wind direction changes.
Yaw motor: moves the yaw drive.
Tower: made from steel lattice or tubular steel. As the wind speed increases with
height, taller towers capture more energy and generate more electricity...
1.3 Report Overview
In this chapter, the basic definitions of wind and wind turbines are mentioned.
Chapter two is an overview on condition monitoring system (CMS) and its methodology and
related algorithm, which leads to fault detection and isolation (FDI) in the system. This also
includes the basic concepts of supervisory control and data acquisition (SCADA) that
provides the remote monitoring and data collecting system.
In chapter three, a brief description of a system and a control system plus approaches in
fault detection can be seen.
Within the forth chapter, a background of the importance of the CMS in wind turbine
industry and a summary of the current existing technologies can be found. Moreover,
current fault detection mechanism and in the end the main problem are brought up.
Finally, chapter five states the future work and project plans on state-of-the-art in CMS and
failures prediction systems.
2 Condition Monitoring and Fault Diagnosis Systems
2.1 Condition Monitoring System
Condition Monitoring System (CMS) is a tool used in machine maintenance and is becoming a long term service package for components. CMS provides information on what the condition of a component is and can also predict an impending failure within the system. Recently, CMS of a machining process in industry is being considered significantly. This includes: service and maintenance; inspection; measuring and evaluating the machine conditions and estimating the remaining service life. Machining process is extensively utilised within the turbine industry and includes operations such as rotating, milling, drilling and grinding. For example, it is considered to be state-of-the-art for rotary machinery to be equipped with vibration based condition monitoring. Monitoring process involves sensor measurements to determine the condition of the process. Analysing measured signals, detecting a process anomaly and detecting faults are necessary factors of the monitoring
6 | P a g e
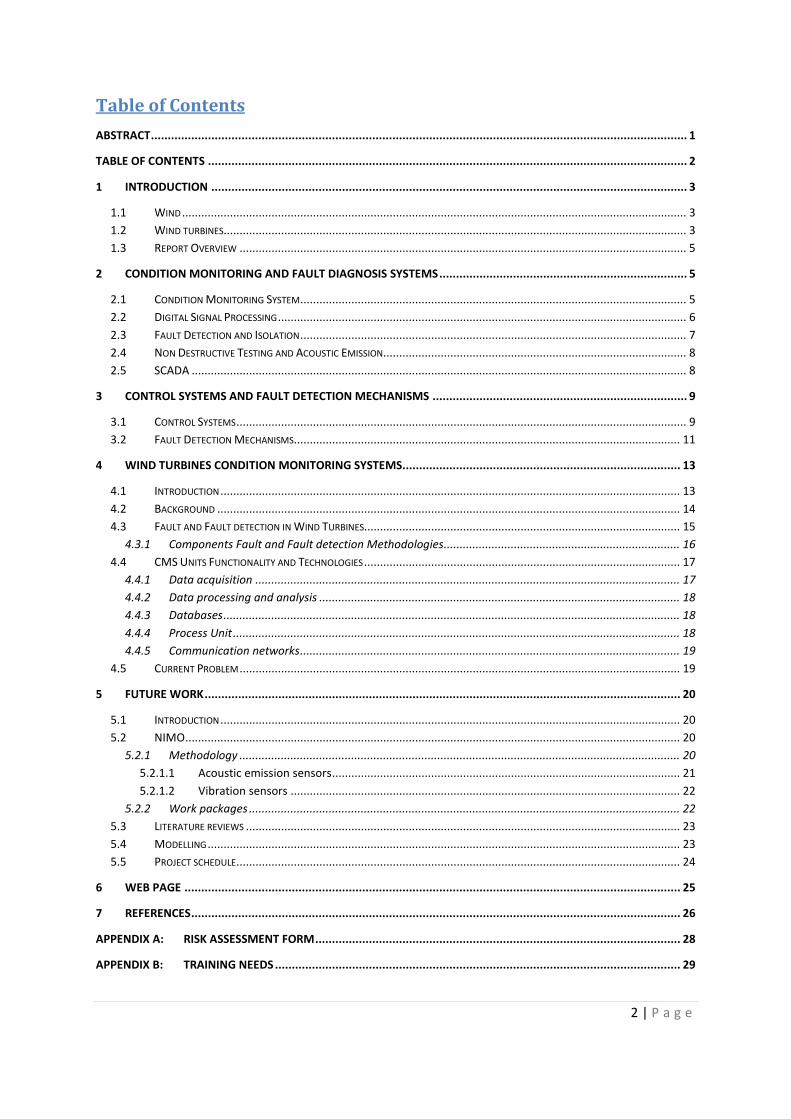
process. Within the control part, regulating of the processes are considered, which requires process variables and a model of the system for various techniques. [3]
Figure 2.1: A sample structure of a CMS.
Here are some the most remarkable advantages of having a CMS:
Prevention of component breakdown.
Reducing the cost of the maintenance.
Remote supervisory and diagnosis.
Improve the availability time (capacity factor).
Provides more information for better support.
The collection of data, communicating, transferring, analysing and finally displaying the information on operator screens is extremely important and can be seen in a supervisory control system known as SCADA. [4]
2.2 Digital Signal Processing
Representing the signals in digital form and using the digital signal processors to analyse,
modify and derive information from these signals are the basic concepts of digital signal
processing (DSP). There are various reasons for processing signals, there reasons include:
detecting and removing noise from signals; obtaining the spectrum of the data; and
transferring the data to other formats so that they are more compatible. Here are some
advantages of DSP: [5]
Reliable Accuracy: It is determined by the number of data bits.
Excellent reproducibility: Copying and reproducing a recorded digital signal
several times without destroying the quality of the original signal.
Perfect flexibility: Mostly reprogrammable which can be carried out without
altering the hardware.
Superior performance: Implementing complex filters algorithms is practical.
7 | P a g e
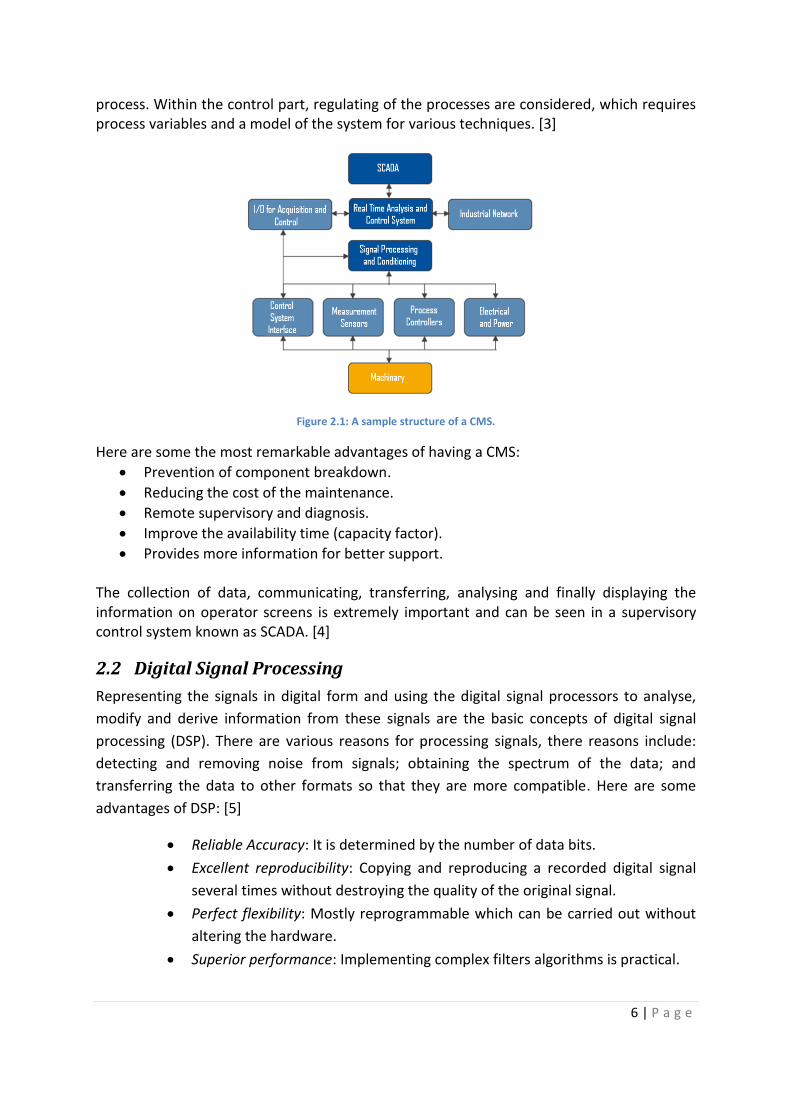
2.3 Fault Detection and Isolation
Fault refers to a mistake, especially that which they are to be blamed. In terms of the
engineering world, more technically, it is an unpermitted anomaly or deviation of any
system parameters from an acceptable condition. Detecting the fault kind, determining size
and time of occurrence and determining location in a system are factors involved in fault
detection and isolation (FDI). In fault detection and diagnosis systems (FDD) the following
tasks must be followed: [6]
1) Fault Detection: Indicates that an error is occurring in the system.
2) Fault Isolation: Determines the exact location (component) of the failure.
3) Fault identification: Extracts the characteristics of the fault such as
seriousness and significance.
Two major methods within the FDD are model free and mathematical based models.
Examples of model free methods include the following:
Physical Redundancy: In this approach, sensors are installed for measuring the same physical quantity. Therefore differences between the measurements can be indicated as a sensor fault. One of the disadvantages of this method is that it leads to additional hardware, costs and weights.
Checking limits: In this method, measurements are compared by a computer.
Whenever the measurement exceeds the threshold, a fault has occurred. There are
two limits regarding this method. The first limitation is served per-warning and the
second is activating the emergency reaction. Two significant drawbacks of this
method are:
Since the plant variables may vary widely due to normal input
variations, the test thresholds need to be set quite conservatively.
A fault in a single component could affect the other variables,
resulting in isolation of the component extremely difficult.
Logical reasoning: Detecting faults by evaluating the symptoms based on hardware
or software. This includes of trees of logical conditions in the system.
In mathematical based methods, mathematical descriptions of the system are implemented
in the form of various equations or similar transformed representations. Analytical
redundancy is being relied upon for most of the model based FDD methods. Measurements
from sensors and results from models can be extended to the comparison of two generated
quantities, obtained from different sources that comprise of the same behaviour. The
differences in results are called residuals and indicate faults within the system. Relying on
parameter estimation has been considered as a successful method. [6]
8 | P a g e
2.4 Non Destructive Testing and Acoustic Emission
Non destructive (NDT) is an evaluation of the properties of a system component without
damaging or causing any adjustment within the system. The purpose of the NDT is to:
detect flaws; measure geometric characteristics; determine material structure or
composition; and characterise physical, electrical or thermal properties. Some common
standards NDI disciplines are Liquid Penetration, Magnetic Particle, Eddy Current, Ultrasonic
and Radiography. [7]
Acoustic emissions (AE) are commonly defined as the release of elastic energy that produces
the transient elastic waves within materials which they begin to fail. [3]
2.5 SCADA
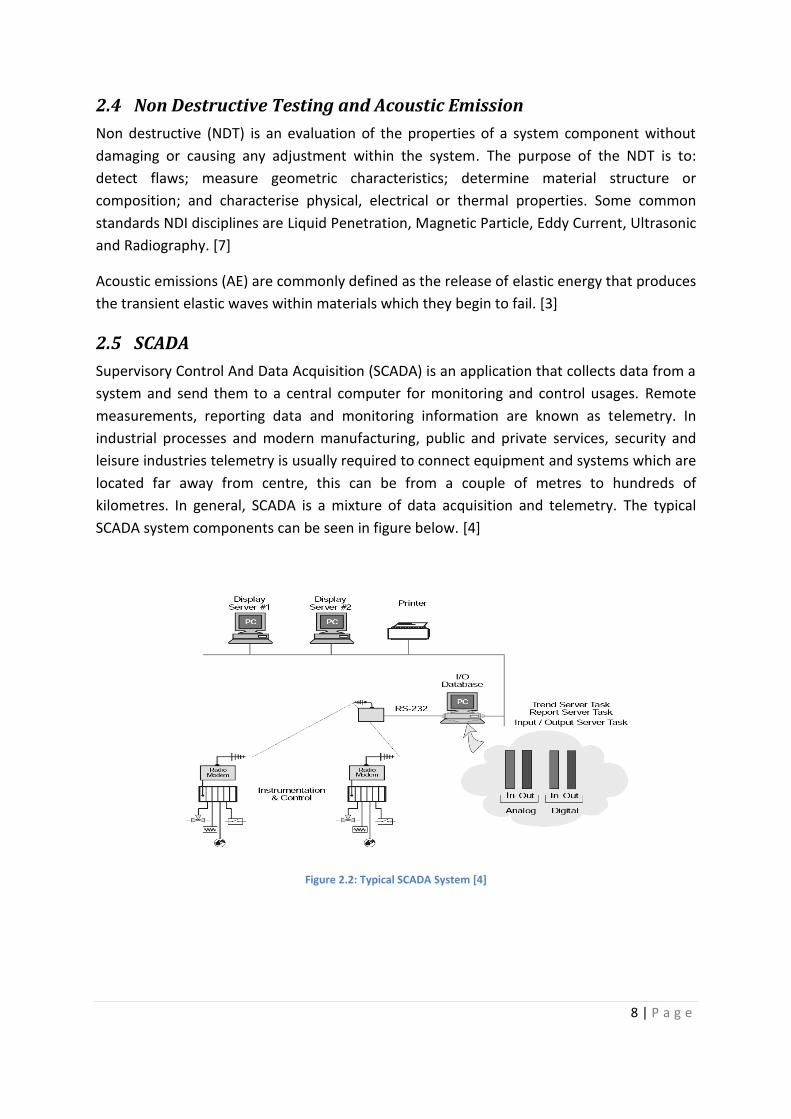
Supervisory Control And Data Acquisition (SCADA) is an application that collects data from a
system and send them to a central computer for monitoring and control usages. Remote
measurements, reporting data and monitoring information are known as telemetry. In
industrial processes and modern manufacturing, public and private services, security and
leisure industries telemetry is usually required to connect equipment and systems which are
located far away from centre, this can be from a couple of metres to hundreds of
kilometres. In general, SCADA is a mixture of data acquisition and telemetry. The typical
SCADA system components can be seen in figure below. [4]
Figure 2.2: Typical SCADA System [4]
9 | P a g e
SCADA systems are comprised of two major parts: Hardware and Software.
SCADA Hardware:
A SCADA system is made of a number of remote terminal units (RTU) that collecting
data and sending them back to the main station. Different communication systems
can be used for data transitions.
The RTU provides an interface to the analogue and digital sensors located at each
site.
The communications system supports the path for communication between the
centre and the remote sites. This system can be wire, fibre optic, radio, telephone
line, GPRS and even satellite.
The main station (or centre) collects data from the different RTUs and drives an
interface to display information and control the remote sites. [4]
SCADA Software:
SCADA software can be separated into two types: open source or proprietary.
Proprietary software is developed by companies to communicate to the specific
hardware. The key problem with this system is the overwhelming reliance on the
supplier of the system. Interoperability being brought to the system is the main
reason that has gained popularity for open source software systems. The ability of
inter-operating is to mix different manufacturers’ equipment on one system. SCADA
software has some important features. The key features that can be mentioned:
User interface; Graphics displays; Alarms; RTU interface; Database; Networking and
communication; and Server and Client distributed processing. [4]
3 Control Systems and Fault detection Mechanisms
3.1 Control Systems
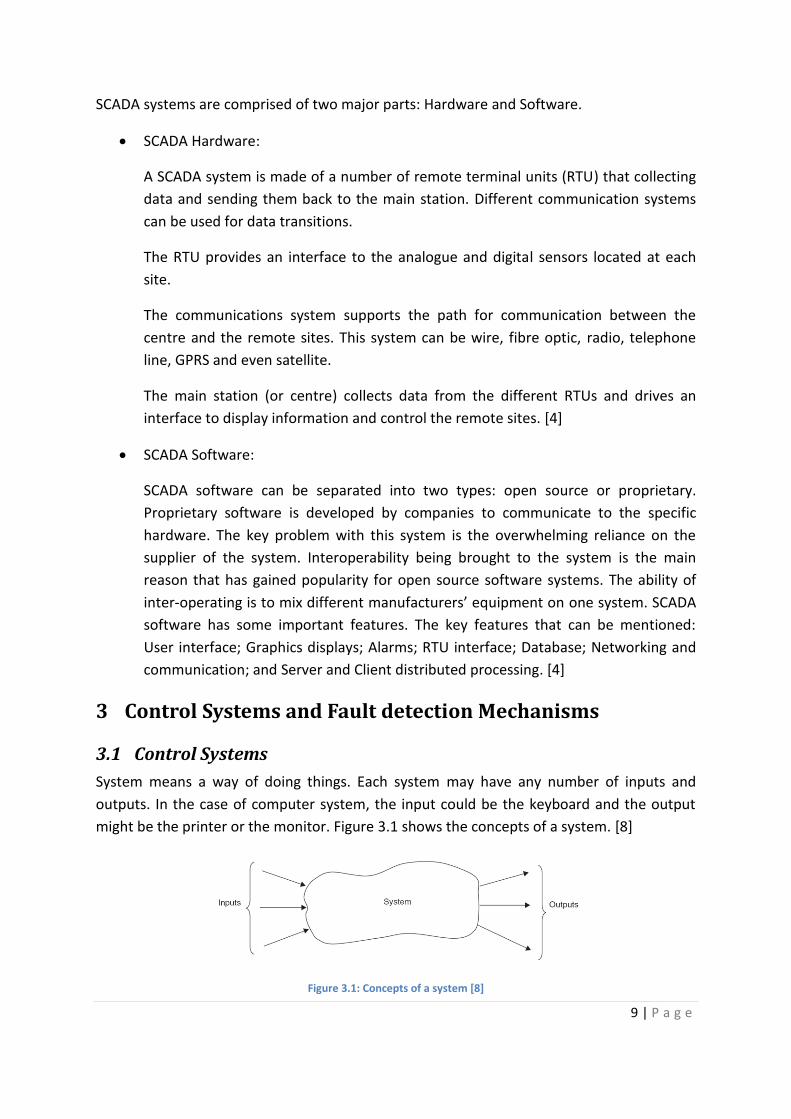
System means a way of doing things. Each system may have any number of inputs and
outputs. In the case of computer system, the input could be the keyboard and the output
might be the printer or the monitor. Figure 3.1 shows the concepts of a system. [8]
Figure 3.1: Concepts of a system [8]
10 | P a g e
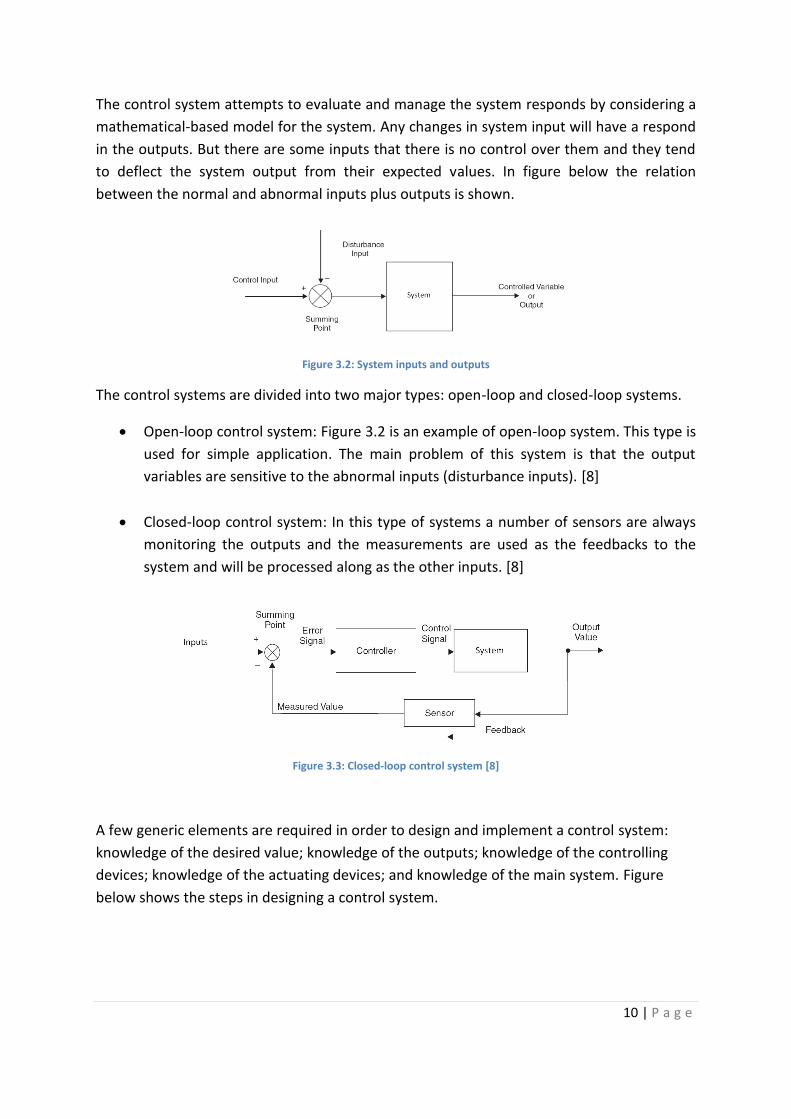
The control system attempts to evaluate and manage the system responds by considering a
mathematical-based model for the system. Any changes in system input will have a respond
in the outputs. But there are some inputs that there is no control over them and they tend
to deflect the system output from their expected values. In figure below the relation
between the normal and abnormal inputs plus outputs is shown.
Figure 3.2: System inputs and outputs
The control systems are divided into two major types: open-loop and closed-loop systems.
Open-loop control system: Figure 3.2 is an example of open-loop system. This type is
used for simple application. The main problem of this system is that the output
variables are sensitive to the abnormal inputs (disturbance inputs). [8]
Closed-loop control system: In this type of systems a number of sensors are always
monitoring the outputs and the measurements are used as the feedbacks to the
system and will be processed along as the other inputs. [8]
Figure 3.3: Closed-loop control system [8]
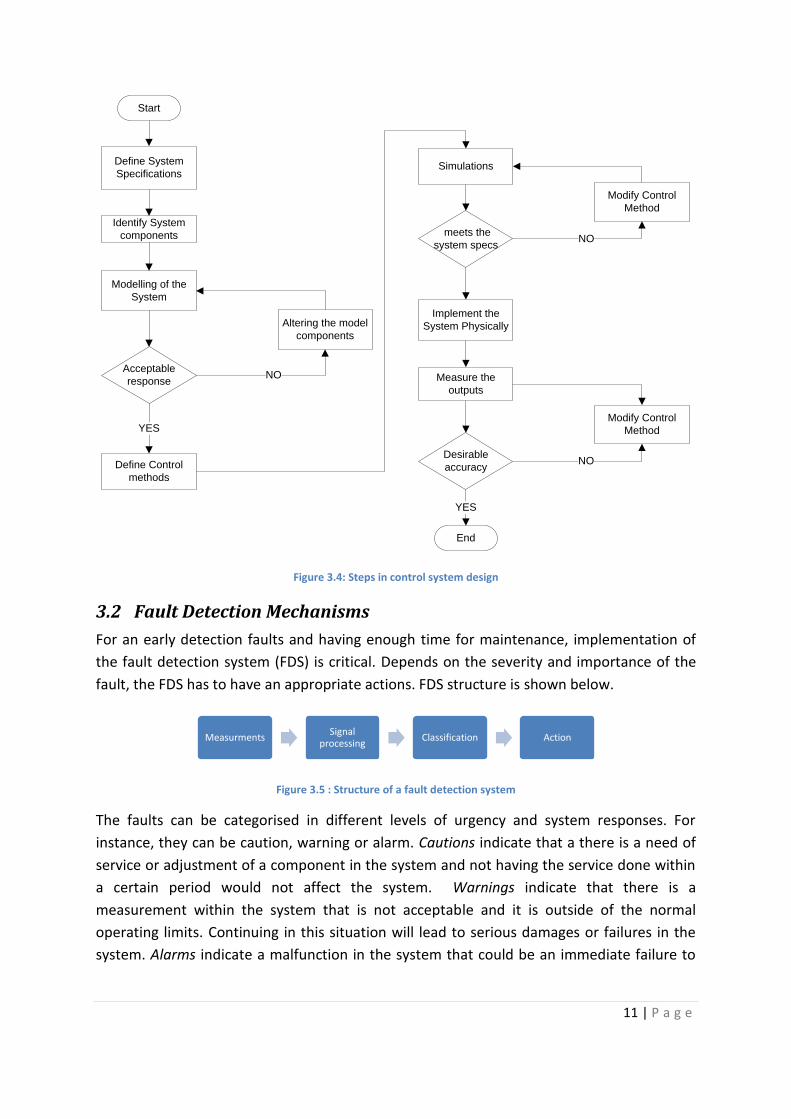
A few generic elements are required in order to design and implement a control system:
knowledge of the desired value; knowledge of the outputs; knowledge of the controlling
devices; knowledge of the actuating devices; and knowledge of the main system. Figure
below shows the steps in designing a control system.
11 | P a g e
Start
Define System
Specifications
Identify System
components
Modelling of the
System
Acceptable
response
Altering the model
components
NO
Define Control
methods
YES
Simulations
meets the
system specs
Modify Control
Method
NO
Implement the
System Physically
Measure the
outputs
Desirable
accuracy
Modify Control
Method
NO
End
YES
Figure 3.4: Steps in control system design
3.2 Fault Detection Mechanisms
For an early detection faults and having enough time for maintenance, implementation of
the fault detection system (FDS) is critical. Depends on the severity and importance of the
fault, the FDS has to have an appropriate actions. FDS structure is shown below.
Figure 3.5 : Structure of a fault detection system
The faults can be categorised in different levels of urgency and system responses. For
instance, they can be caution, warning or alarm. Cautions indicate that a there is a need of
service or adjustment of a component in the system and not having the service done within
a certain period would not affect the system. Warnings indicate that there is a
measurement within the system that is not acceptable and it is outside of the normal
operating limits. Continuing in this situation will lead to serious damages or failures in the
system. Alarms indicate a malfunction in the system that could be an immediate failure to
MeasurmentsSignal
processingClassification Action
12 | P a g e
Process
Unknown Input Fault
Inputs
Parameter Identification
Measured signal
Identified error
Residuals
Nominal Parameter _
Estimated parameters
Process
Unknown Input Fault
Inputs
Observer(Kalman filters)
Outputs
Residuals
_
the system and also danger to the personnel. Instantaneously shutting downs or
disconnecting the power sources are the most common action in emergency situations.
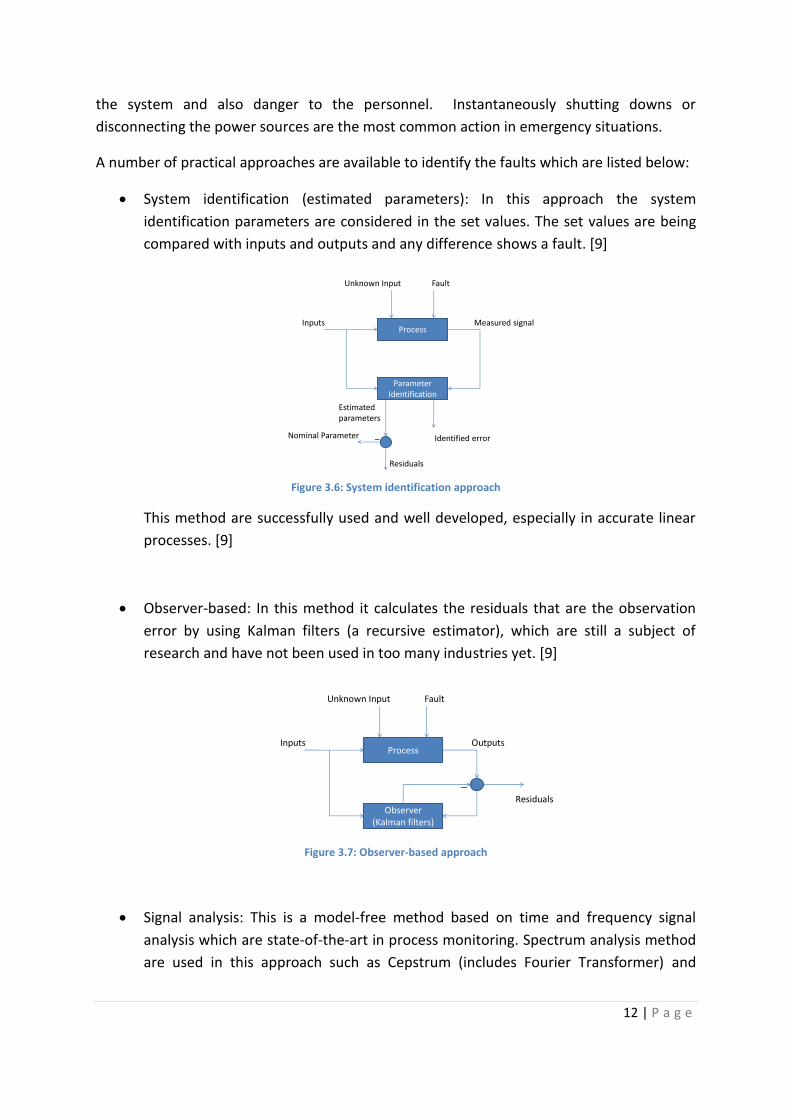
A number of practical approaches are available to identify the faults which are listed below:
System identification (estimated parameters): In this approach the system
identification parameters are considered in the set values. The set values are being
compared with inputs and outputs and any difference shows a fault. [9]
Figure 3.6: System identification approach
This method are successfully used and well developed, especially in accurate linear
processes. [9]
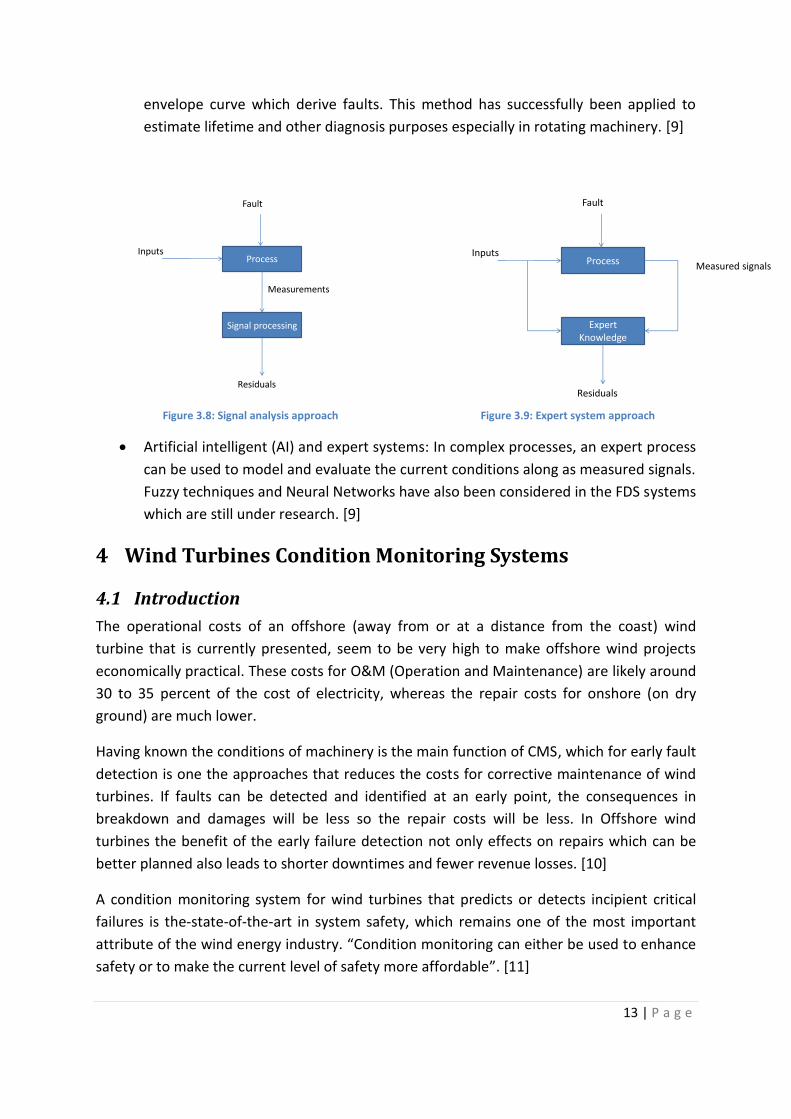
Observer-based: In this method it calculates the residuals that are the observation
error by using Kalman filters (a recursive estimator), which are still a subject of
research and have not been used in too many industries yet. [9]
Figure 3.7: Observer-based approach
Signal analysis: This is a model-free method based on time and frequency signal
analysis which are state-of-the-art in process monitoring. Spectrum analysis method
are used in this approach such as Cepstrum (includes Fourier Transformer) and
13 | P a g e
Process
Fault
Inputs
Expert Knowledge
Measured signals
Residuals
Process
Fault
Inputs
Signal processing
Measurements
Residuals
envelope curve which derive faults. This method has successfully been applied to
estimate lifetime and other diagnosis purposes especially in rotating machinery. [9]
Figure 3.8: Signal analysis approach Figure 3.9: Expert system approach
Artificial intelligent (AI) and expert systems: In complex processes, an expert process
can be used to model and evaluate the current conditions along as measured signals.
Fuzzy techniques and Neural Networks have also been considered in the FDS systems
which are still under research. [9]
4 Wind Turbines Condition Monitoring Systems
4.1 Introduction
The operational costs of an offshore (away from or at a distance from the coast) wind
turbine that is currently presented, seem to be very high to make offshore wind projects
economically practical. These costs for O&M (Operation and Maintenance) are likely around
30 to 35 percent of the cost of electricity, whereas the repair costs for onshore (on dry
ground) are much lower.
Having known the conditions of machinery is the main function of CMS, which for early fault
detection is one the approaches that reduces the costs for corrective maintenance of wind
turbines. If faults can be detected and identified at an early point, the consequences in
breakdown and damages will be less so the repair costs will be less. In Offshore wind
turbines the benefit of the early failure detection not only effects on repairs which can be
better planned also leads to shorter downtimes and fewer revenue losses. [10]
A condition monitoring system for wind turbines that predicts or detects incipient critical
failures is the-state-of-the-art in system safety, which remains one of the most important
attribute of the wind energy industry. “Condition monitoring can either be used to enhance
safety or to make the current level of safety more affordable”. [11]

14 | P a g e
4.2 Background
Since 1980, progresses in aerodynamics, fundamental dynamics and micrometeorology (The
study of weather conditions on a small scale) have been making a 5% annual enhancement
in the wind energy industry. Existing research methods are producing more powerful, lighter
and more efficient wind turbine components especially outsized tower and blades. The
annual turbine energy output has improved extremely and the weights of the wind turbines
plus the noise that they produce have been decreased within the last few years. Figure 1
shows the size and the power progress since mid 80s. [12]
Figure 4.1: Increase in rotor diameter and tower height over the last few decades.
In spite of the fact that recent wind turbines include high technical standards, there are still
research areas for more development, particularly megawatt-size turbines and maintenance
methods. Analysis of wind farm maintenance costs has shown that up to 40% of the cost can
be related to unexpected failures of wind turbine components which will lead to
unscheduled corrective maintenance actions. Unscheduled corrective maintenance is the
most costly type of maintenance and it is always aspired to have these corrective activities
reduced by wind farm operators. In figure below the consequences of the lack of proper
monitoring system on oil temperature in gearbox can be seen.
Figure 4.2 : Catastrophic failure of a wind turbine in Texas due to high oil temperature
15 | P a g e
The purpose of wind turbines condition monitoring systems has considerably developed in
the last decade. Because of financial limits in wind turbines industry, the relatively little
production wounded and the negligible effects on the electricity network, the applications
remain limited to some trial projects.
Within the last few years, wind turbine manufacturers and operators have strongly been
trying to develop an advanced condition monitoring systems in order to evaluate the
structural condition of wind turbines as well as the operational state which will lead to
achieve a significant enhancement in the efficiency of preventing the failures and less time
maintenance. [12]
4.3 Fault and Fault detection in Wind Turbines
Fault is defined as the termination of the capability of an object to complete a function.
When a failure occurs inside the wind turbine, e.g. high oil temperature in gearbox, the
control unit logs the failure directly or registers the consequences of the fault, and responds
referring to the type of the malfunction. Sometimes, in order to avoid safety hazards or
main system breakdowns, the turbine has to be shut down. Often they are restarted
because of wrong failure detection, which could be caused by noise within the system, and
therefore these faults are not considered as crucial problems. If the failure is serious, a
visual inspection has to be made which can be carried out by the operators or by authorised
personnel. Finally whenever a major failure has happened, a report is documented. This
describes the failure reasons, parts involved, and downtime associated with the fault. Here
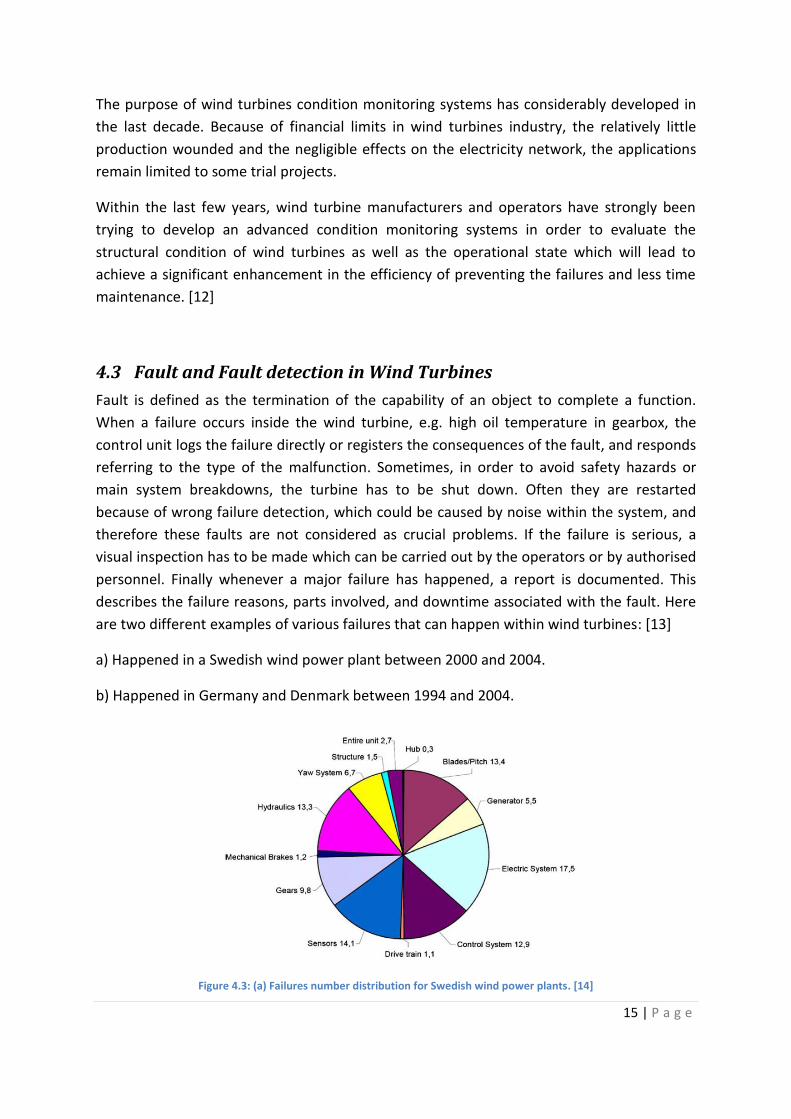
are two different examples of various failures that can happen within wind turbines: [13]
a) Happened in a Swedish wind power plant between 2000 and 2004.
b) Happened in Germany and Denmark between 1994 and 2004.
Figure 4.3: (a) Failures number distribution for Swedish wind power plants. [14]

16 | P a g e
Figure 4.4: (b) Failure rates for Danish and German wind power plants. [15]
4.3.1 Components Fault and Fault detection Methodologies
Here are some of the most common faults that can occur within the system and the current
methodology for the inspection:
Rotors: Wind turbine rotors are prone to acquire creep and corrosion fatigue, which
can be observed as cracks and delaminations in the blades. Moreover, dirt, ice, bird
collisions, dampness or manufacturing defects can cause the rotor blades being
imbalance and having asymmetric aerodynamic. The roughness in blades will result
in loss in energy efficiency which could be caused by erosion, ice, dirt and etc.
Shearography1, radiography2, eddy current3, strain gauges4 and thermography5 are
the techniques that are employed by manufacturer in different situation. For
instance, stain gauges has failed to detect the address the problems as it can be
affected effects by cross-talk and temperature variations. Moreover, in eddy current
inspection for a small shear size, it can take several hours under very difficult
working conditions for the human resources. [12] [16]
Gearbox: Gear tooth damages, high speed and low speed shafts faults are the most
common failures in wind turbine gearbox. Typically, vibration measurement and
spectrum analysis are chosen for gearbox monitoring. But these methods are not
1 Shearography is an optical Non-Destructive Testing (NDT) approach that offers rapid and precise information within
different materials. 2 Radiography is an NDT method that uses X-rays to cross materials to view inside objects.
3 Eddy Current is an electric current induced within a conductor when the conductor either moves through a non-uniform
magnetic field or is in a region where there is a change in the level of magnetic energy induced vertically to the surface of an area. 4 Strain gauge is a tool that uses to measure the strain of an object.
5 Thermography is a method that uses infrared imaging to have an electromagnetic-spectrum of an object for highly
detailed analysis.
17 | P a g e
able to detect the faults properly therefore Acoustic Emission (AE), which can detect
the stress on the surface that has been made by rubbing action in faulty
components, has recently been considering for early fault detections. [16]
Generator: Stator, bearing and the rotor inside the generator are subject to failures.
Mostly, the faults in generators can be detected by current measurement and Fast
Fourier Transformer (FFT)/Spectrum analysis. [16]
Pitch mechanism, Yaw system and Electrical system faults are also can effect on
system efficiency and even breakdown. FFT spectrum analysis and Machine Current
Signature Analysis (MCSA) are used as fault detection systems. [9]
4.4 CMS Units Functionality and Technologies
The base unit of a CMS should provide a number of functions. Analogue or pulse signals from sensors must be converted to digital information, which some of these conversions might need filtering. Digitalised and filtered values will be analysed for CMS purposes and finally must be saved in data bases for additional evaluation. Moreover, an assured communication between the data acquisition and a remote central server / operator must be considered.
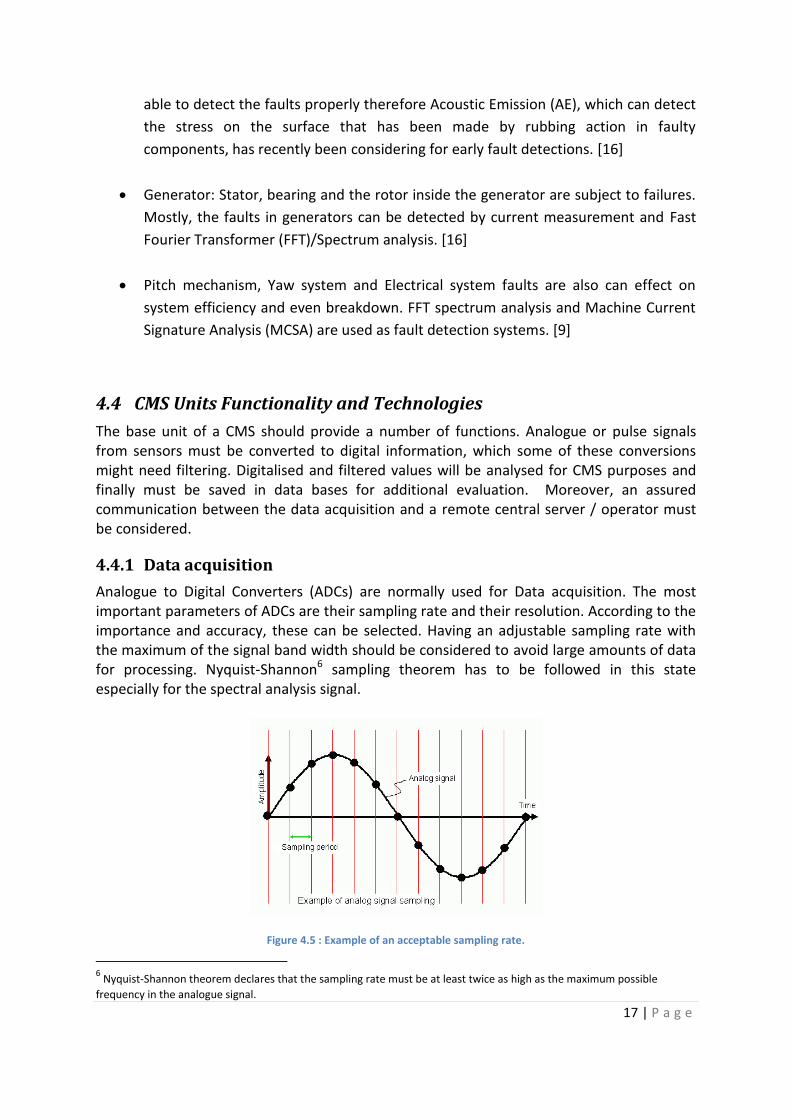
4.4.1 Data acquisition
Analogue to Digital Converters (ADCs) are normally used for Data acquisition. The most important parameters of ADCs are their sampling rate and their resolution. According to the importance and accuracy, these can be selected. Having an adjustable sampling rate with the maximum of the signal band width should be considered to avoid large amounts of data for processing. Nyquist-Shannon6 sampling theorem has to be followed in this state especially for the spectral analysis signal.
Figure 4.5 : Example of an acceptable sampling rate.
6 Nyquist-Shannon theorem declares that the sampling rate must be at least twice as high as the maximum possible
frequency in the analogue signal.
18 | P a g e
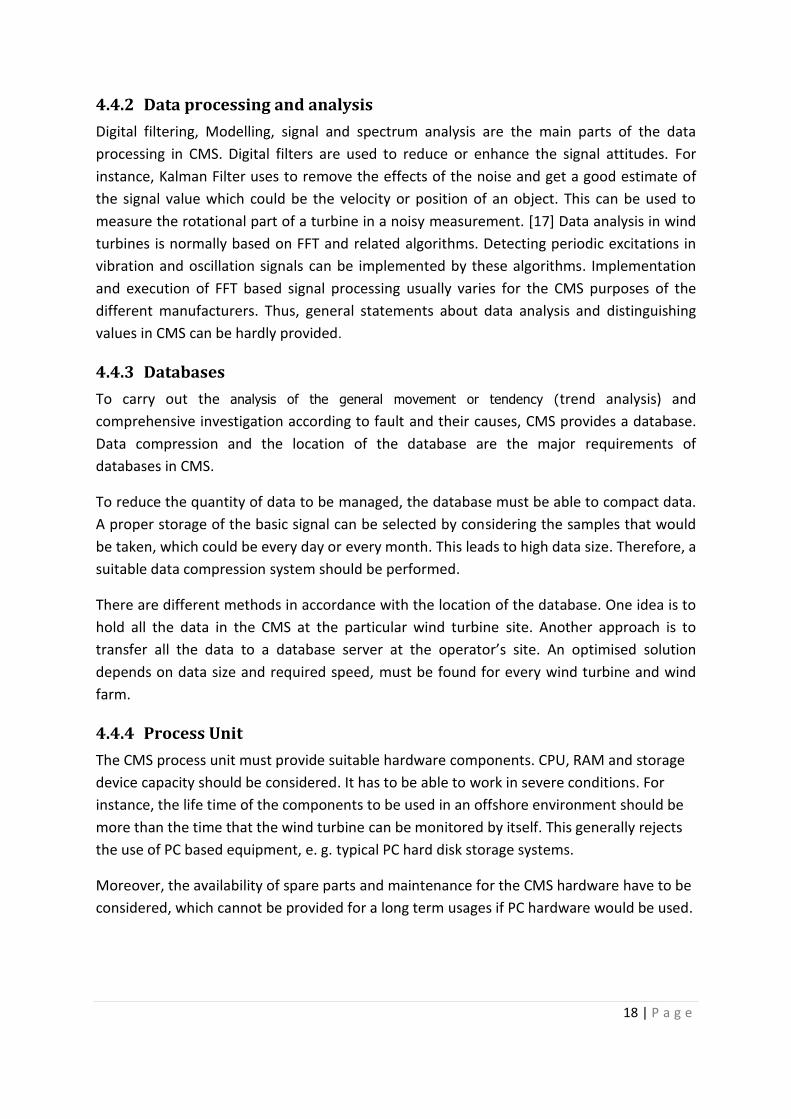
4.4.2 Data processing and analysis
Digital filtering, Modelling, signal and spectrum analysis are the main parts of the data
processing in CMS. Digital filters are used to reduce or enhance the signal attitudes. For
instance, Kalman Filter uses to remove the effects of the noise and get a good estimate of
the signal value which could be the velocity or position of an object. This can be used to
measure the rotational part of a turbine in a noisy measurement. [17] Data analysis in wind
turbines is normally based on FFT and related algorithms. Detecting periodic excitations in
vibration and oscillation signals can be implemented by these algorithms. Implementation
and execution of FFT based signal processing usually varies for the CMS purposes of the
different manufacturers. Thus, general statements about data analysis and distinguishing
values in CMS can be hardly provided.
4.4.3 Databases
To carry out the analysis of the general movement or tendency (trend analysis) and
comprehensive investigation according to fault and their causes, CMS provides a database.
Data compression and the location of the database are the major requirements of
databases in CMS.
To reduce the quantity of data to be managed, the database must be able to compact data.
A proper storage of the basic signal can be selected by considering the samples that would
be taken, which could be every day or every month. This leads to high data size. Therefore, a
suitable data compression system should be performed.
There are different methods in accordance with the location of the database. One idea is to
hold all the data in the CMS at the particular wind turbine site. Another approach is to
transfer all the data to a database server at the operator’s site. An optimised solution
depends on data size and required speed, must be found for every wind turbine and wind
farm.
4.4.4 Process Unit
The CMS process unit must provide suitable hardware components. CPU, RAM and storage
device capacity should be considered. It has to be able to work in severe conditions. For
instance, the life time of the components to be used in an offshore environment should be
more than the time that the wind turbine can be monitored by itself. This generally rejects
the use of PC based equipment, e. g. typical PC hard disk storage systems.
Moreover, the availability of spare parts and maintenance for the CMS hardware have to be
considered, which cannot be provided for a long term usages if PC hardware would be used.
19 | P a g e
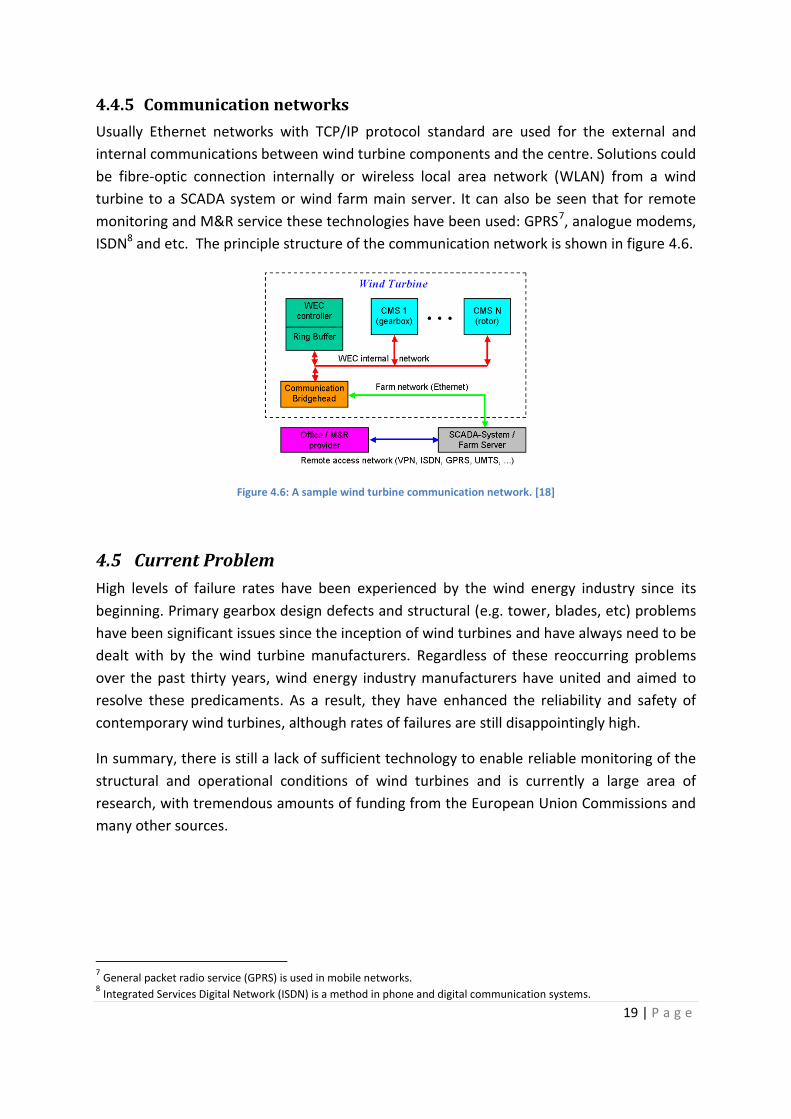
4.4.5 Communication networks
Usually Ethernet networks with TCP/IP protocol standard are used for the external and
internal communications between wind turbine components and the centre. Solutions could
be fibre-optic connection internally or wireless local area network (WLAN) from a wind
turbine to a SCADA system or wind farm main server. It can also be seen that for remote
monitoring and M&R service these technologies have been used: GPRS7, analogue modems,
ISDN8 and etc. The principle structure of the communication network is shown in figure 4.6.
Figure 4.6: A sample wind turbine communication network. [18]
4.5 Current Problem
High levels of failure rates have been experienced by the wind energy industry since its
beginning. Primary gearbox design defects and structural (e.g. tower, blades, etc) problems
have been significant issues since the inception of wind turbines and have always need to be
dealt with by the wind turbine manufacturers. Regardless of these reoccurring problems
over the past thirty years, wind energy industry manufacturers have united and aimed to
resolve these predicaments. As a result, they have enhanced the reliability and safety of
contemporary wind turbines, although rates of failures are still disappointingly high.
In summary, there is still a lack of sufficient technology to enable reliable monitoring of the
structural and operational conditions of wind turbines and is currently a large area of
research, with tremendous amounts of funding from the European Union Commissions and
many other sources.
7 General packet radio service (GPRS) is used in mobile networks.
8 Integrated Services Digital Network (ISDN) is a method in phone and digital communication systems.
20 | P a g e
5 Future Work
5.1 Introduction
This work begins with a wide research, cooperation within the industry, plus sharing of
information and experiences in order to obtain detailed features of the trial products that
will be designed to fulfil the requirements set by the wind energy industry to enhance the
operational reliability of wind turbines. This involves collecting real samples from wind
turbines and wind farms, as well as modelling and analysing the system. Afterwards,
specifying a suitable CMS and FDI for structural and operational turbine parts will be carried
out. Subsequently, laboratory based simulations and evaluations will also be conducted in
order to provide a trial demonstration under customary conditions.
5.2 NIMO
Development and Demonstration of a Novel Integrated Condition Monitoring System for
Wind Turbines (NIMO) seeks to largely eliminate catastrophic failures and minimise the
need for corrective maintenance by developing and successfully implementing an integrated
condition monitoring system for the continuous evaluation of wind turbines. NIMO will
advance existing state-of-the-art condition monitoring technology used in wind turbines by
delivering an advanced system which will be able to reliably evaluate the condition of critical
structural components, rotating parts and braking mechanisms.
NIMO is a cooperation between the following organisations: TWI Ltd., Alfa Products and
Technologies, Lambdatest Ltd., Technology and Quality Control Centre M. Kotouzas Inc., TSC
Inspection Systems Ltd., ACCIONA ENERGIA S.A., Envirocoustics ABEE, A. Silva Matos
Energia, Feldman Enterprises Ltd., Novas Energias do Ocidente S.A., TERNA S.A., Centre for
Renewable Energy Sources, The University of Birmingham, Instituto de Soldadura e
Qualidade, University of Castilla-La Mancha. The Project is partly funded project by the
European Commission (EC) under the Seventh Framework Programme (FP7). [12]
The implementation of the NIMO project aims to significantly reduce of the number of
inspection times compared to existing state-of-the-art inspection techniques. In addition,
corrective maintenance will also be minimised and will, therefore, lead to a considerable
reduction of the whole operational costs. The successful implementation of the NIMO
integrated condition monitoring system will also provide the European wind power industry
with reliable energy and remain a world leader in the field of renewable energy production.
[12]
5.2.1 Methodology
In the NIMO project, acoustic emission and high-frequency vibration analysis sensors for the
evaluation of the vital structural components such as the turbine blades, tower and
foundation will be employed. These will be applied along with oil temperature sensors, oil
21 | P a g e
particle counters, current and pressure sensors to evaluate the general operational
condition of the gearbox, generator bearing, yaw and braking mechanism, generator
currents sensors and electric power output measurements, which will lead to the complete
measurement of the wind turbine condition through the modular designed application of a
single monitoring system. Besides, by combining and analysing the data collected through
the different sensors, it will be possible to quantify and address the faults by the system and
consequently, will enable the wind farm operators to update the maintenance schedule.
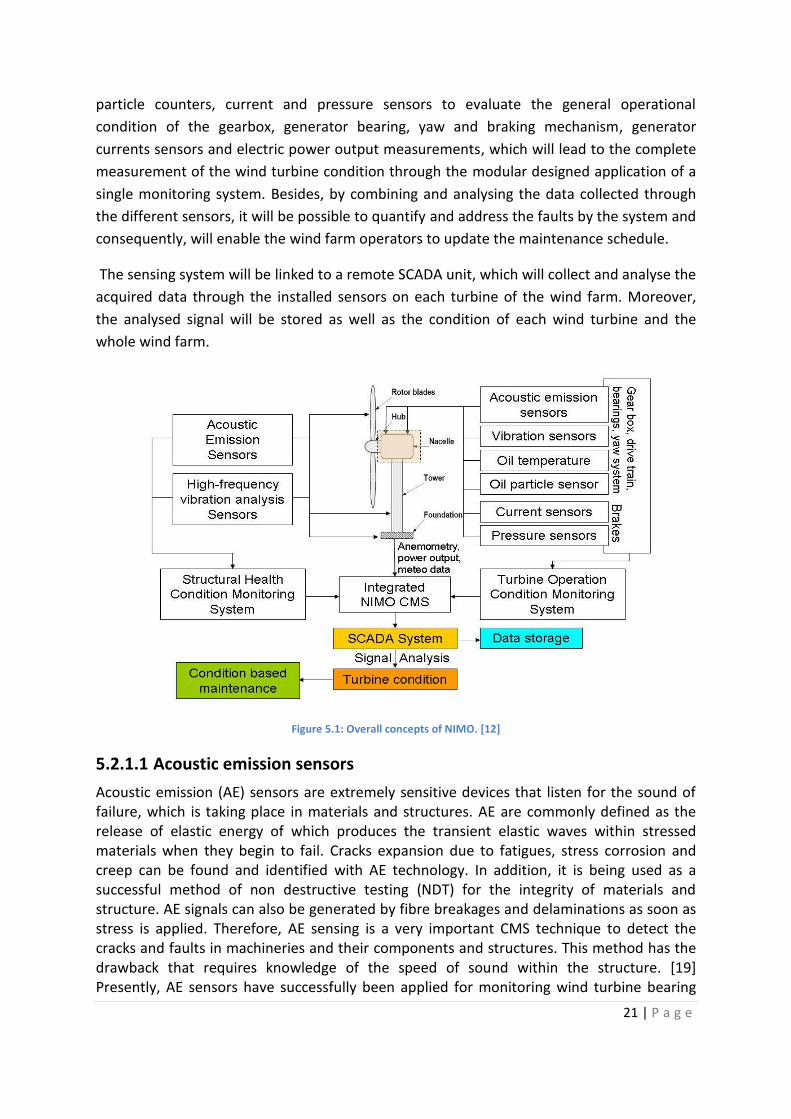
The sensing system will be linked to a remote SCADA unit, which will collect and analyse the
acquired data through the installed sensors on each turbine of the wind farm. Moreover,
the analysed signal will be stored as well as the condition of each wind turbine and the
whole wind farm.
Figure 5.1: Overall concepts of NIMO. [12]
5.2.1.1 Acoustic emission sensors
Acoustic emission (AE) sensors are extremely sensitive devices that listen for the sound of failure, which is taking place in materials and structures. AE are commonly defined as the release of elastic energy of which produces the transient elastic waves within stressed materials when they begin to fail. Cracks expansion due to fatigues, stress corrosion and creep can be found and identified with AE technology. In addition, it is being used as a successful method of non destructive testing (NDT) for the integrity of materials and structure. AE signals can also be generated by fibre breakages and delaminations as soon as stress is applied. Therefore, AE sensing is a very important CMS technique to detect the cracks and faults in machineries and their components and structures. This method has the drawback that requires knowledge of the speed of sound within the structure. [19] Presently, AE sensors have successfully been applied for monitoring wind turbine bearing
22 | P a g e
and gearboxes. They are attached to the component by flexible glue with low attenuation. [9] Within the NIMO project, acoustic emission modules will be evaluating the condition of wind turbine blades and hub for any defect or damage. [12]
5.2.1.2 Vibration sensors
Vibration analysis is the most well-known tools used for CMS, especially for rotary
machinery. Depends on the frequency range, different sensor types are used: [9]
Low frequency: e.g. position transducers
Middle frequency: e.g. velocity sensors
High frequency: e.g. accelerometers
Very high frequencies: e.g. acoustic vibrations
In case of the wind turbine, vibration measurements are applied to evaluate the condition
of bearings and gear wheels rotating at upper frequencies. For this purpose piezo-electric9
vibration (high frequency acceleration) sensors are ideal. These sensors are able to measure
the entire mechanical vibrations in a frequency range up to tens of kilo hertz. [18]
NIMO project will be using the high frequency vibration analysis modules to monitor the
wind turbine tower and foundation condition. This will arise in monitoring the vibration
spectra of the structures. [12]
5.2.2 Work packages
The NIMO project is divided in six work packages: [12]
WORKPACKAGE-A: Sample procurement and system specification. WORKPACKAGE-B: Integration of structural CMS. WORKPACKAGE-C: Integration of turbine operation CMS. WORKPACKAGE-D: System integration and evaluation under laboratory conditions. WORKPACKAGE-E: Instrumentation of wind turbines and simulated trials. WORKPACKAGE-F: NIMO CMS field trials and demonstration under actual conditions. WORKPACKAGE-G: Dissemination and Exploitation of Knowledge. WORKPACKAGE-H: Development of training procedures and contribution to standards.
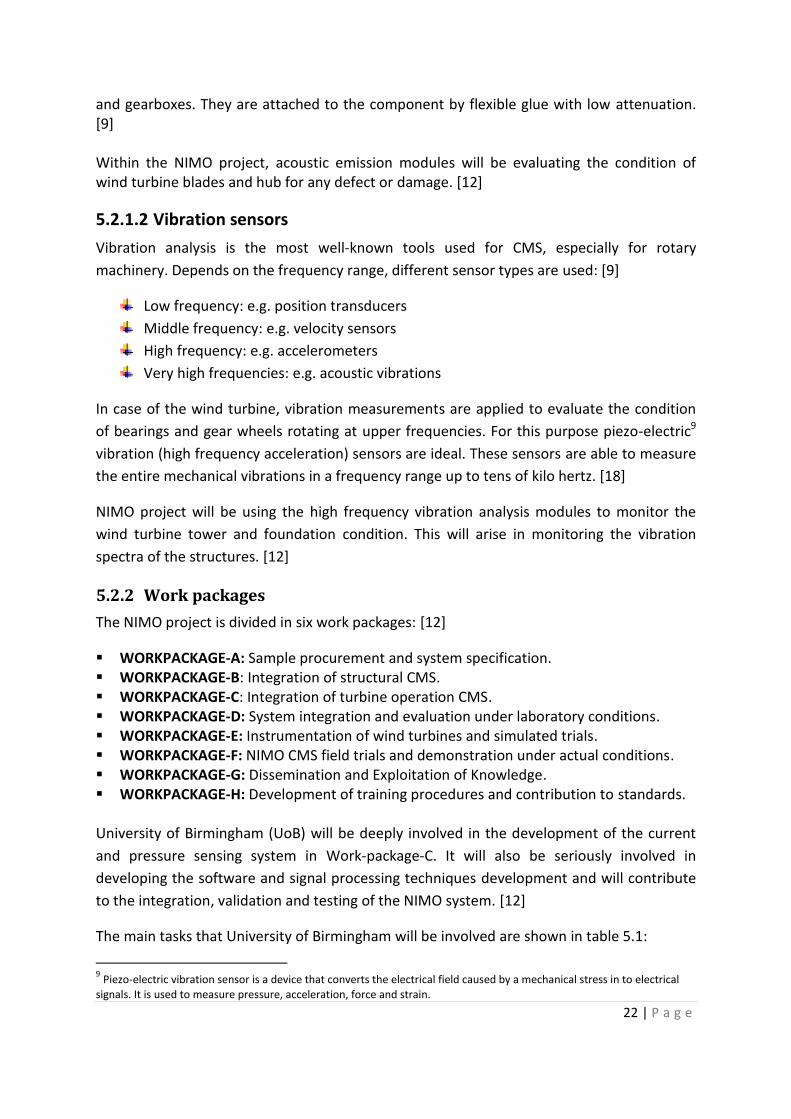
University of Birmingham (UoB) will be deeply involved in the development of the current
and pressure sensing system in Work-package-C. It will also be seriously involved in
developing the software and signal processing techniques development and will contribute
to the integration, validation and testing of the NIMO system. [12]
The main tasks that University of Birmingham will be involved are shown in table 5.1:
9 Piezo-electric vibration sensor is a device that converts the electrical field caused by a mechanical stress in to electrical
signals. It is used to measure pressure, acceleration, force and strain.
23 | P a g e
Table 5.1: UoB and NIMO
5.3 Literature reviews
For the purpose of state-of-the-art condition monitoring and fault detection in wind
turbines, a vast and deep research and overview of background work and current
technologies must be considered. By reviewing the literatures that have been published,
ideas of a well-designed CMS and FDI for wind turbines could be achieved, which are heavily
involved with signal processing and software programming. IEEE, IET, Science Direct,
Engineering Village website and also many articles, project thesis’s, published books by
worldwide websites and high-ranked universities are the reasonable and superior sources in
this subject. Moreover, cooperation with industry and related manufacturers is necessary,
which will be extremely involved. There are number of useful articles and papers that have
already been considered for this report and many others will need to be reviewed for this
project. References mentioned in the end of this report are the example of these sources.
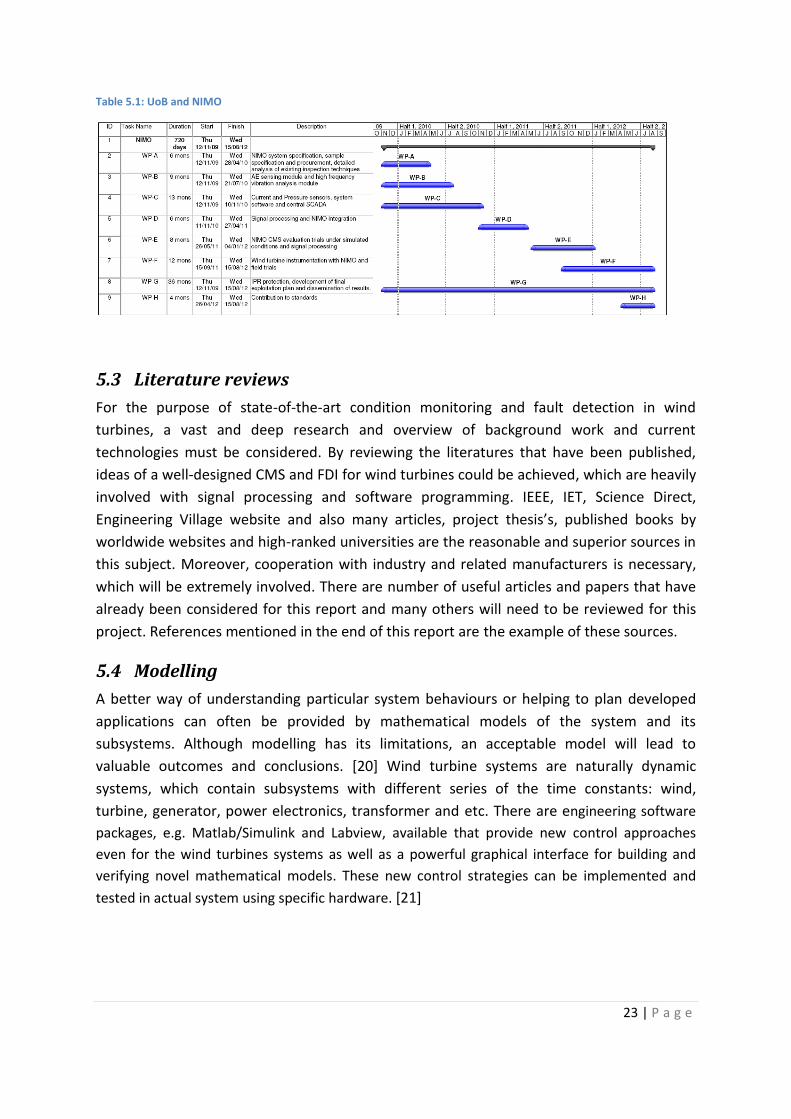
5.4 Modelling
A better way of understanding particular system behaviours or helping to plan developed
applications can often be provided by mathematical models of the system and its
subsystems. Although modelling has its limitations, an acceptable model will lead to
valuable outcomes and conclusions. [20] Wind turbine systems are naturally dynamic
systems, which contain subsystems with different series of the time constants: wind,
turbine, generator, power electronics, transformer and etc. There are engineering software
packages, e.g. Matlab/Simulink and Labview, available that provide new control approaches
even for the wind turbines systems as well as a powerful graphical interface for building and
verifying novel mathematical models. These new control strategies can be implemented and
tested in actual system using specific hardware. [21]
24 | P a g e
Figure 5.2: Labview and wind turbine, supported by NI. [22]
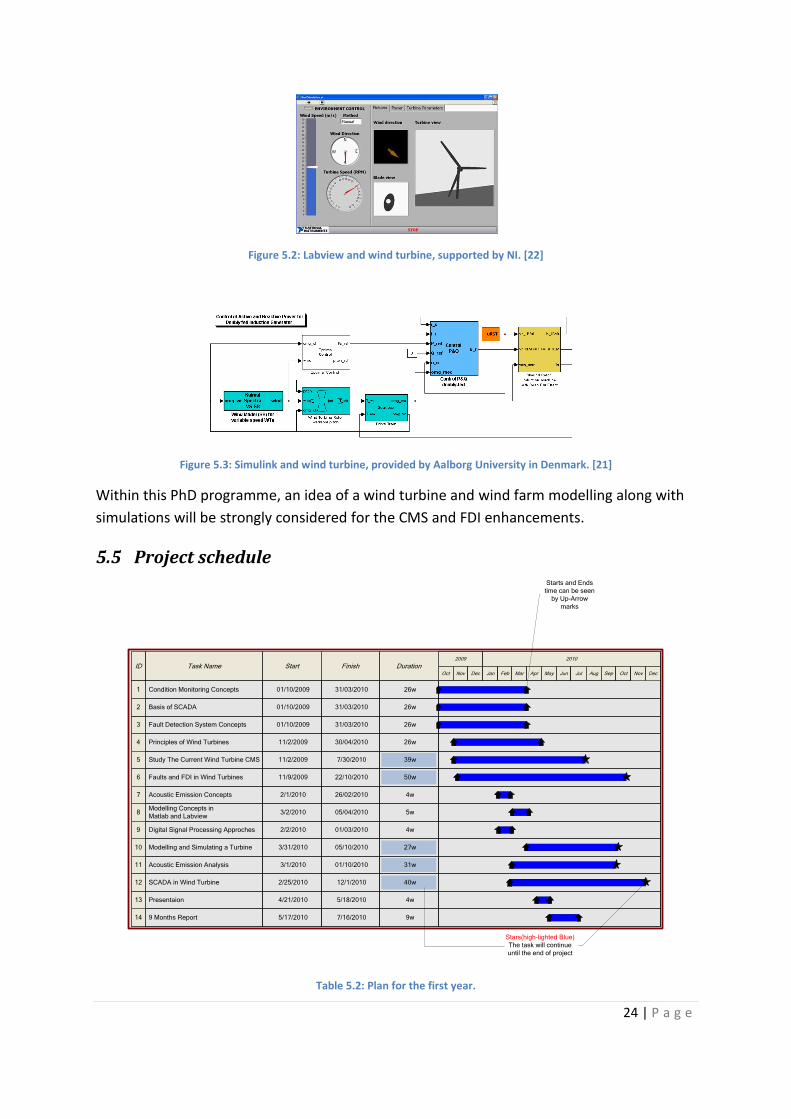
Figure 5.3: Simulink and wind turbine, provided by Aalborg University in Denmark. [21]
Within this PhD programme, an idea of a wind turbine and wind farm modelling along with
simulations will be strongly considered for the CMS and FDI enhancements.
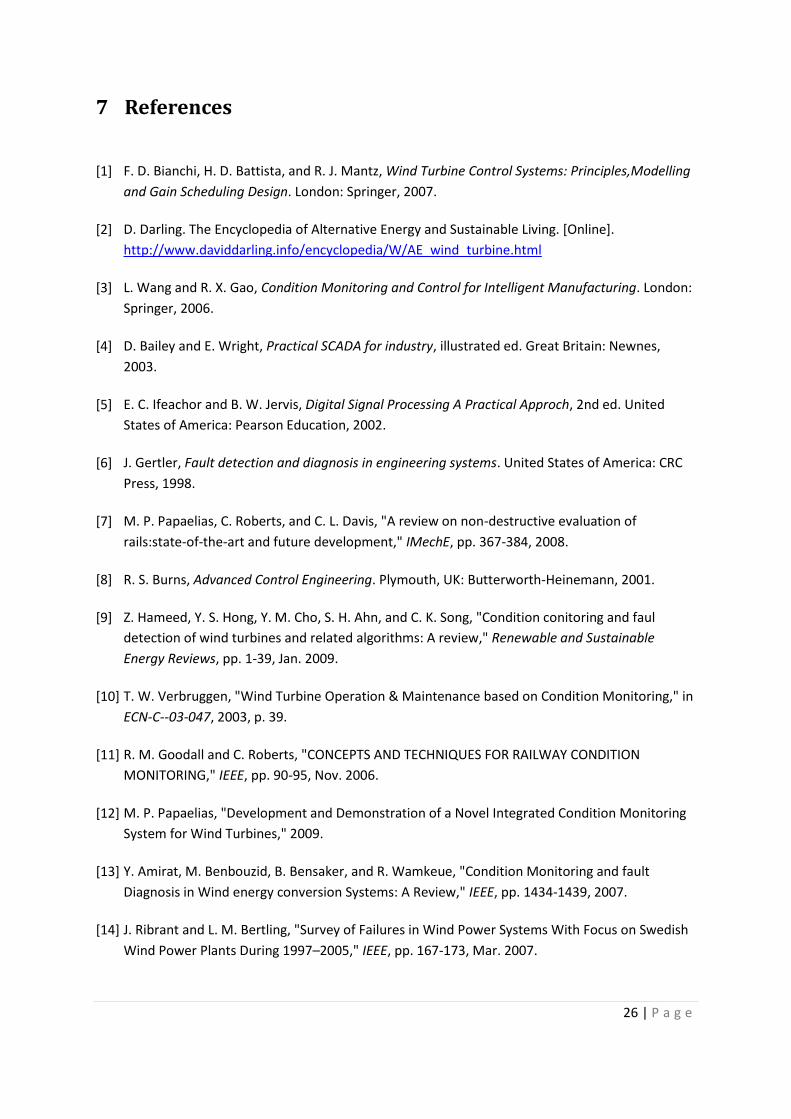
5.5 Project schedule
ID Task Name Start Finish Duration2009 2010
Oct Nov Dec Jan Feb Mar Apr May Jun Jul Aug Sep Oct
1 26w31/03/201001/10/2009Condition Monitoring Concepts
3 26w31/03/201001/10/2009Fault Detection System Concepts
4 26w30/04/201011/2/2009Principles of Wind Turbines
5 39w7/30/201011/2/2009Study The Current Wind Turbine CMS
8 5w05/04/20103/2/2010Modelling Concepts in
Matlab and Labview
10 27w05/10/20103/31/2010Modelling and Simulating a Turbine
4w26/02/20102/1/2010Acoustic Emission Concepts
11
4w01/03/20102/2/2010Digital Signal Processing Approches
31w01/10/20103/1/2010Acoustic Emission Analysis
9w7/16/20105/17/20109 Months Report14
40w12/1/20102/25/2010SCADA in Wind Turbine
2 26w31/03/201001/10/2009Basis of SCADA
6 50w22/10/201011/9/2009Faults and FDI in Wind Turbines
7
9
13 4w5/18/20104/21/2010Presentaion
12
Nov Dec
Stars(high-lighted Blue)
The task will continue
until the end of project
Starts and Ends
time can be seen
by Up-Arrow
marks
Table 5.2: Plan for the first year.

25 | P a g e
6 Web Page
26 | P a g e
7 References
[1] F. D. Bianchi, H. D. Battista, and R. J. Mantz, Wind Turbine Control Systems: Principles,Modelling
and Gain Scheduling Design. London: Springer, 2007.
[2] D. Darling. The Encyclopedia of Alternative Energy and Sustainable Living. [Online].
http://www.daviddarling.info/encyclopedia/W/AE_wind_turbine.html
[3] L. Wang and R. X. Gao, Condition Monitoring and Control for Intelligent Manufacturing. London:
Springer, 2006.
[4] D. Bailey and E. Wright, Practical SCADA for industry, illustrated ed. Great Britain: Newnes,
2003.
[5] E. C. Ifeachor and B. W. Jervis, Digital Signal Processing A Practical Approch, 2nd ed. United
States of America: Pearson Education, 2002.
[6] J. Gertler, Fault detection and diagnosis in engineering systems. United States of America: CRC
Press, 1998.
[7] M. P. Papaelias, C. Roberts, and C. L. Davis, "A review on non-destructive evaluation of
rails:state-of-the-art and future development," IMechE, pp. 367-384, 2008.
[8] R. S. Burns, Advanced Control Engineering. Plymouth, UK: Butterworth-Heinemann, 2001.
[9] Z. Hameed, Y. S. Hong, Y. M. Cho, S. H. Ahn, and C. K. Song, "Condition conitoring and faul
detection of wind turbines and related algorithms: A review," Renewable and Sustainable
Energy Reviews, pp. 1-39, Jan. 2009.
[10] T. W. Verbruggen, "Wind Turbine Operation & Maintenance based on Condition Monitoring," in
ECN-C--03-047, 2003, p. 39.
[11] R. M. Goodall and C. Roberts, "CONCEPTS AND TECHNIQUES FOR RAILWAY CONDITION
MONITORING," IEEE, pp. 90-95, Nov. 2006.
[12] M. P. Papaelias, "Development and Demonstration of a Novel Integrated Condition Monitoring
System for Wind Turbines," 2009.
[13] Y. Amirat, M. Benbouzid, B. Bensaker, and R. Wamkeue, "Condition Monitoring and fault
Diagnosis in Wind energy conversion Systems: A Review," IEEE, pp. 1434-1439, 2007.
[14] J. Ribrant and L. M. Bertling, "Survey of Failures in Wind Power Systems With Focus on Swedish
Wind Power Plants During 1997–2005," IEEE, pp. 167-173, Mar. 2007.

27 | P a g e
[15] P. J. Tavner, J. Xiang, and F. Spinato, "Reliability Analysis for Wind Turbines," Wind Energ, pp. 1-
18, Jul. 2006.
[16] B. Lu, Y. Li, X. Wu, and Z. Yang, "A review of recent advances in wind turbine condition
monitoring and fault diagnosis," IEEE, pp. 1-7, Jun. 2009.
[17] H. Vihriala, "Control of variable speed wind turbines," PhD Thesis, Tempere University,
Tampere, Finland, 2002.
[18] WP7 Partners, "Condition Monitoring for Wind Turbines," EC Commission, Kassel,Germany,
Public report, 2007.
[19] P. J. Wells, W. A. Wright, and S. J. Roberts, "Acoustic emission in aerospace structures," IEEE, pp.
1-5, Aug. 1999.
[20] F. R. Giordano, W. P. Fox, S. B. Horton, and M. D. Weir, First Course in Mathematical Modeling.
Belmont, CA, United States of America: Cengage Learning, 2008.
[21] F. Iov, A. D. Hansen, P. Soerensen, and F. Blaabjerg, "Wind Turbine Blockset in Matlab/Simulink.
General Overview and Description of the Model," Aalborg University Danish Energy Agency
Project 8789179463, 2004.
[22] National Instruments. [Online]. http://zone.ni.com/devzone/cda/epd/p/id/6161#0requirements

28 | P a g e
Appendix A: Risk assessment form

29 | P a g e
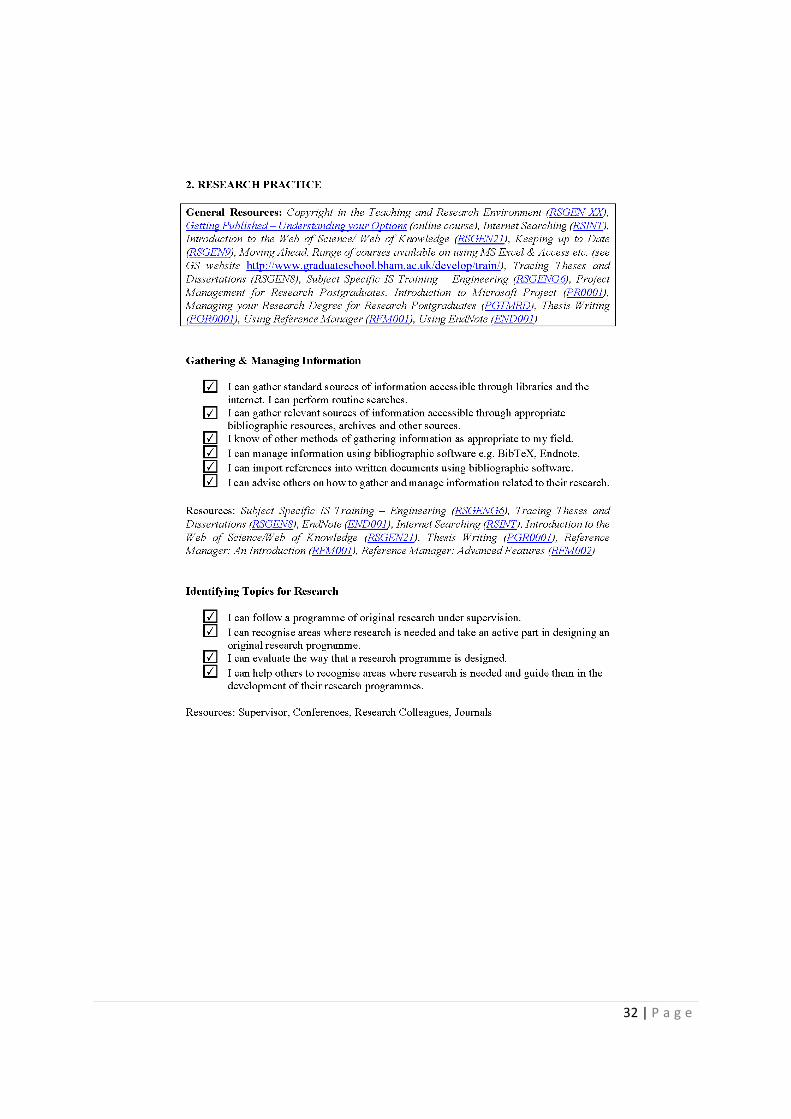
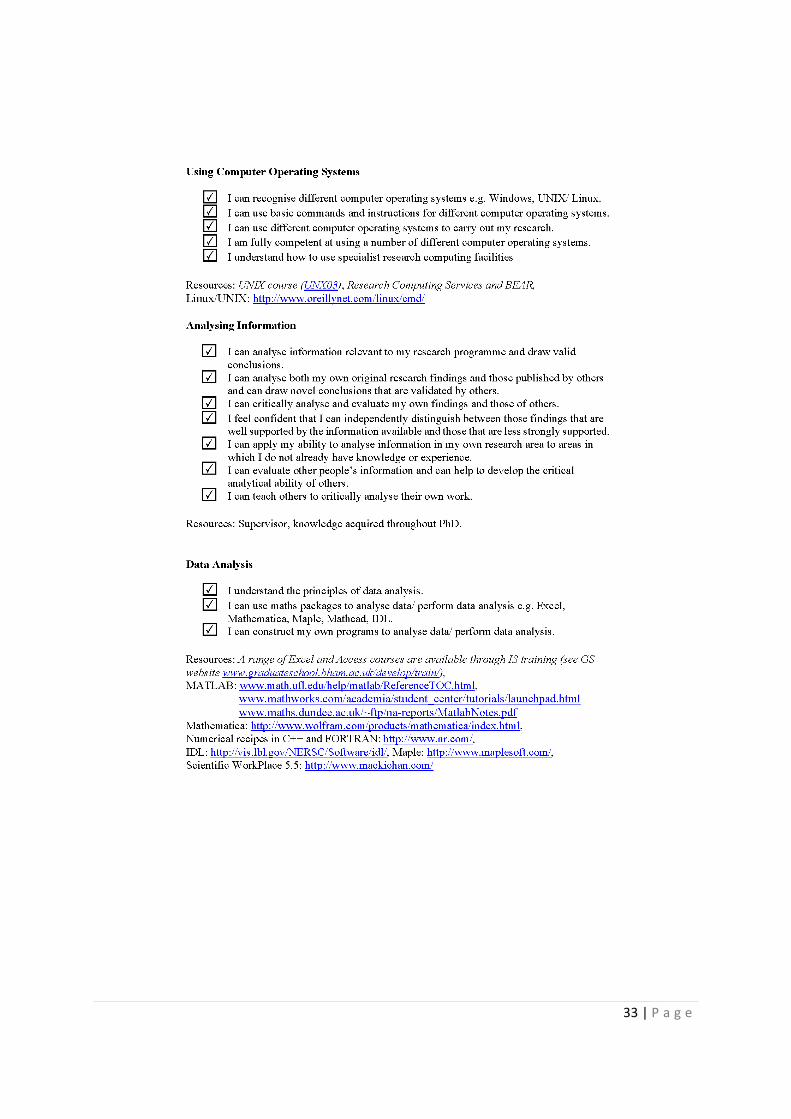
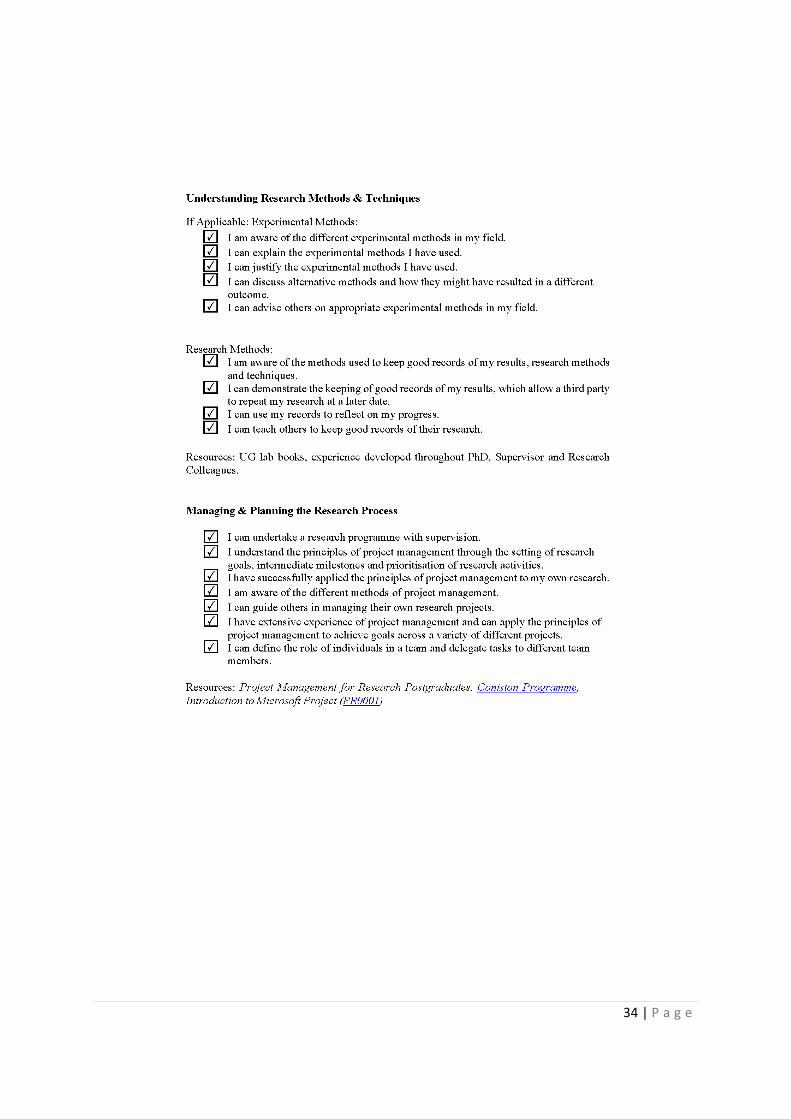
Appendix B: Training Needs

30 | P a g e
31 | P a g e
32 | P a g e
33 | P a g e
34 | P a g e
35 | P a g e
36 | P a g e
37 | P a g e
38 | P a g e

39 | P a g e

40 | P a g e
PERSONAL DEVELOPMENT PLAN
RECORD OF TRAINING
SCHOOL OF ELECTRONIC ELECTRICAL AND COMPUTER ENGINEERING
Training plan for this year
Planned activities Dates
Microsoft Project 27/01/2010
Matlab – Simulink (Advanced) Online/Book
Labview 8
Online/Book
Record of training since the start of the PhD
Training attended Dates
Post Graduate Teaching Assistant
Importing and Exporting Data
Excel as Database
21/10/2009
16/11/2009
19/11/2009
Analysing Data
Presenting, Analysing and Charting Research Data
Word 2007 – Advanced Feature
26/11/2009
03/12/2009
11/12/2009
Name: Mani Entezami