Embed Size (px)
Citation preview

Department of Electrical and Computer Engineering
Centre for Smart Grid and Sustainable Power systems
On Line Condition Monitoring of Wind
Turbine Generators
Abdulwahed Almokhtar Salem
This thesis is presented for the
Degree of Doctor of
Philosophy
Of
Curtin University
August 2016

P a g e | I
Contents
Contents ............................................................................................................................................... I
List of Figures............................................................................................................................. IV
List of Tables ............................................................................................................................ VII
Abbreviations ............................................................................................................................. IX
Declaration .................................................................................................................................. XI
Acknowledgements ............................................................................................................... XII
Dedication ................................................................................................................................. XIII
Abstract ........................................................................................................................................... 1
Chpater 1 Introduction ........................................................................................................... 3
1.1 Background ........................................................................................................................... 4
1.2 Contribution and Research Objectives..................................................................... 8
1.3 Thesis Organisation ........................................................................................................... 9
Chapter 2 Condition Monitoring of Wind Turbines Failure and Diagnoses .... 11
2.1 Introduction ....................................................................................................................... 12
2.2 Power Characteristics of a Wind Turbine............................................................ 13
2.3 Wind Turbine Function and Structure .................................................................. 14
2.3.1 Tower ........................................................................................................................... 14
2.3.2 Strength and Stiffness Design........................................................................... 15
2.4 Condition Monitoring System (CMS) ..................................................................... 17
2.4.1 Condition Based Maintenance (CBM)........................................................... 18
2.4.2 Wind Turbine Reliability .................................................................................... 18
2.5 Fault Diagnosis ................................................................................................................. 19
2.6 Wind Turbine Generators (WTGs) .......................................................................... 19
2.7 Wind Turbine Gearbox ................................................................................................. 22
2.8.1 Impact of Varying Load Conditions on WT Gearboxes ........................ 26
P a g e | II
2.8.2 Diagnose Fatigues within the Wind Turbine Gearbox and Rotor
(Blades) .................................................................................................................................. 29
2.8.3 Gearbox Tooth Failure Impact on the Wind Turbine Performance
.................................................................................................................................................... 30
2.9 Lubrication Oil Monitoring ......................................................................................... 31
2.10 Wind Turbine Blades .................................................................................................. 35
2.10.1 Surface Roughness .............................................................................................. 40
2.10.2 Lightning Protection .......................................................................................... 43
2.10.3 Ice Accumulations and De-icing ................................................................... 44
2.10.4 Heavy rain ............................................................................................................... 46
Chapter 3 Signal Processing Techniques for Condition Monitoring.............. 47
3. 1 Introduction ...................................................................................................................... 48
3.2 Fourier Transform (FT)................................................................................................ 48
3.2.1 Spectral Averaging-based FT ............................................................................ 50
3.2.2 Discreet Fourier Transform (DFT) ................................................................ 50
3.2.3 Order Analysis-based FFT .................................................................................. 52
3.3 Wavelet Analysis Technique ...................................................................................... 53
3.3.1 Wavelet and Fourier Transform Correlation ............................................ 60
Chpater 4 Experim-ental Test Rig Setup ..................................................................... 64
4.1 Introduction ....................................................................................................................... 65
4.2 Wind Turbine Test Rig Components ...................................................................... 66
4.2.1 The Drivetrain.......................................................................................................... 66
4.2.2 Coupling and Gearbox .......................................................................................... 67
4.2.3 Bearings ...................................................................................................................... 70
4.2.4 Shaft .............................................................................................................................. 70
4.2.5 The hub ....................................................................................................................... 70
4.2.6 Mechanical Brakes ................................................................................................. 71
P a g e | III
4.2.7 Signal Conditioning and Transducers .......................................................... 71
4.2.8 Accelerometers ....................................................................................................... 71
4.2.9 Torque Transducer................................................................................................ 73
Chpater 5 Results and Discussion .................................................................................. 75
5.1 Case Study: Wind Turbine Drivetrain Stresses Based on Narrow Band
Wavelets ...................................................................................................................................... 76
5.1.1 Introduction .............................................................................................................. 76
5.1.2 Results and Discussion ........................................................................................ 76
5.1.3 Conclusion ................................................................................................................. 85
5.2 Case Study 2: Impact of Gearbox Oil Contamination on the Performance
of the Wind Turbine Drivetrain ....................................................................................... 86
5.2.1 Introduction .............................................................................................................. 86
5.2.2 Results and Discussion ........................................................................................ 86
5.2.3 Conclusion ................................................................................................................. 93
5.3 Case Study 3: Monitoring the Impact of Gearbox Teeth Failure on the
Performance of the Wind Turbine. ................................................................................. 95
5.4 Case Study 4: Gear Eccentricity ............................................................................. 106
5.5 Fuzzy Logic Model ........................................................................................................ 111
5.6 Condition Monitoring and Asset Management Decision-based WTOC
....................................................................................................................................................... 121
Chapter 6 Conclusion and Future Work ................................................................... 126
6.1 Conclusion........................................................................................................................ 127
6.2 Future Work .................................................................................................................... 129
References ............................................................................................................................... 130
Appendix A ................................................................................................................................... 152

P a g e | IV
List of Figures
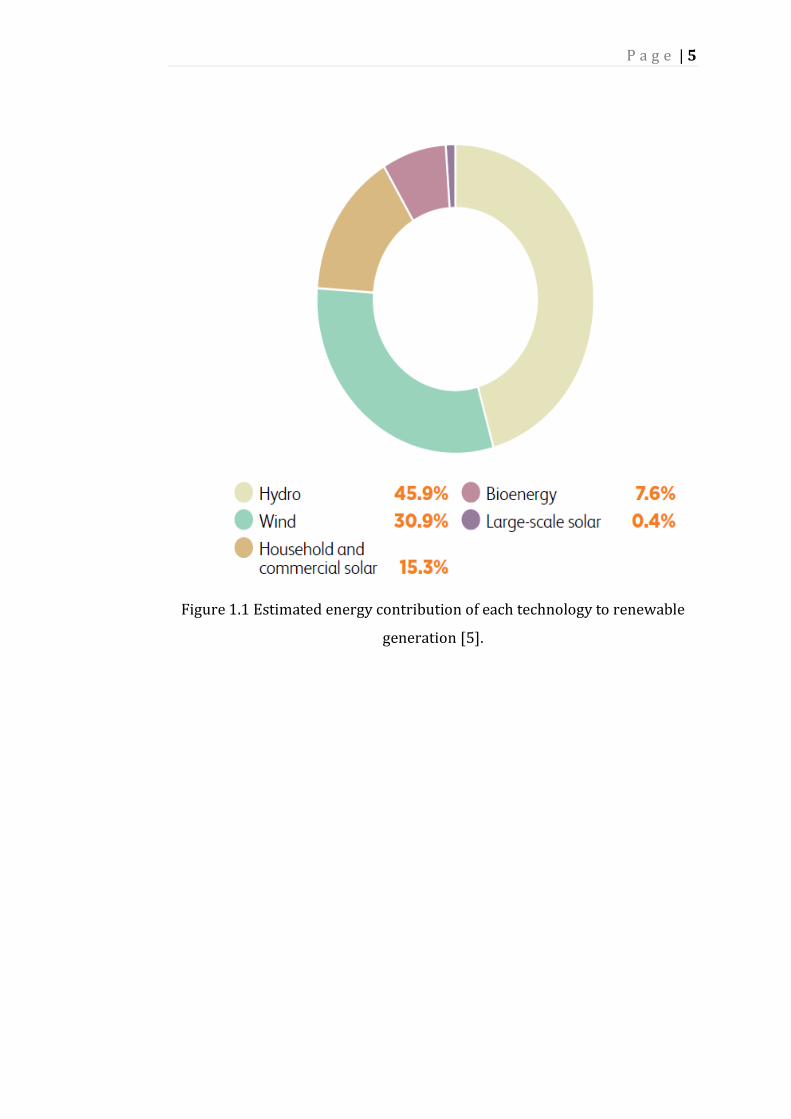
Figure 1.1 Estimated energy contribution of each technology to renewable
generation ......................................................................................................................................... 5
Figure 1.2 Construction development in wind turbine sizes ................................... 7
Figure 1.3 Wind Turbine Components ................................................................................. 8
Figure 2.1 Functional chain and conversion stages of a wind energy
conversion convertor. ............................................................................................................... 12
Figure 2.2 Qualitative turbine mechanical power versus wind speed curve. 13
Figure 2.3 Steel tubular tower with installations of a large wind turbine . ..... 16
Figure 2.4 Main monitoring tasks ....................................................................................... 18
Figure2.5 Categorisation of commonly used generators in large wind
turbines ............................................................................................................................................ 20
Figure 2.6 Different wind turbine generator structures and their connections
(a) Squirrel-Cage Induction Generator (b) Synchronous Generators (c)
Doubly-Fed Induction Generator. ........................................................................................ 22
Figure 2.7 Wind turbine gearbox ......................................................................................... 23
Figure 2.8 Gearbox Structure ................................................................................................. 25
Figure 2.9 (a) Gearbox fault detection using: vibration analysis and (b) oil
debris ................................................................................................................................................ 28
Figure 2.10 Downtime per Failure/year .......................................................................... 29
Figure 2.11 Aging sequence of the gearbox teeth under incorrect lubricant . 33
Figure 2.12 Power curves for turbines with variable blade lengths ................. 35
Figure 2.13 Expected maintenance costs for the different maintenance
strategies as a function of the inspection in the case study (one blade)]. ........ 37
Figure 2.14 A sketch illustrating some of the common damage types found on
a wind turbine blade .................................................................................................................. 38
Figure 2.15 Damage type 5 (laminate failure in compression) & type 7 (gel-
coat cracking) at the bottom of the leading edge. ........................................................ 39
Figure 2.16 Damage type 2 (adhesive joint failure between skins) at the
leading edge. .................................................................................................................................. 39
Figure 2.17 Damage type 1 (main spar flange/adhesive layer debonding) and
type 4 (delamination by buckling load). ........................................................................... 40

P a g e | V
Figure 2.18 Effect of dust for various operation periods on the power curve
of turbine. ........................................................................................................................................ 42
Figure 2.19 Lightning protection of a rotor blade. ...................................................... 44
Figure 2.20 Electrical heating system for rotor blade de-icing ............................. 45
Figure 2.21 Effect of heavy rain on WT power curve (Energiewerkstatt). ...... 46
Figure 3.1 A periodic signal .................................................................................................... 49
Figure 3.2 Fourier coefficients .............................................................................................. 49
Figure 3.3 An example of a synthesised synchronous system ............................... 53
Figure 3.4 Frequency range includes the details and approximation
coefficients ...................................................................................................................................... 55
Figure 3.5 Discreet wavelet transform of x(t) signal.................................................. 56
Figure 3.6 Wavelet transform mother function principle. ....................................... 58
Figure 3.7 Wavelet transform functions: Daubechies family (db), the Coiflets
family (coif) and the Symlet family (sym). ...................................................................... 59
Figure 4.1 Test rig configuration.......................................................................................... 65
Figure 4.2 Wind turbine drive train arrangements .................................................... 66
Figure 4.3 (a) Multi-stage representation of the gearbox. (b) Equivalent
dynamic model.............................................................................................................................. 67
Figure 4.4 Accelerometer model AC133 (A). ISOTRON (ENDEVCO model
2258A-10) accelerometer (B). .............................................................................................. 72
Figure 4.5 Torque transducer (FUTEK model TRS605) -left. Signal
conditioner and IN board -right. .......................................................................................... 73
Figure 4.6 Schematic diagram of the test rig setup for wind turbine. ................ 74
Figure 5.1 Torque signal under normal operating conditions (healthy
conditions) ...................................................................................................................................... 77
Figure 5.2 Torque signal under stressed shaft .............................................................. 79
Figure 5.3 Vibration signal under normal operating conditions. ......................... 81
Figure 5.4 Sensors signals under critical faulty operating conditions............... 82
Figure 5.5 Signals conducted with extra speed under normal operating
conditions. ....................................................................................................................................... 83
Figure 5.6 Signals conducted with extra speed under faulty operating
conditions. ....................................................................................................................................... 85
P a g e | VI
Figure 5.7 (a) New oil ATF MHP, (b) New oil ATF MHP after contamination.
All under normal operating conditions............................................................................. 88
Figure 5.8 (a) New oil after contamination and under load variations, (b)
Power spectrum of the signal (a), (c) Spectral map .................................................... 89
Figure 5.9 (a) New oil before contamination and under load variations, (b)
Power spectrum of the signal (a), (c) Spectral map .................................................... 90
Figure 5.10 Power spectrum of contaminated ATF MHP oil under load
variations ......................................................................................................................................... 91
Figure 5.11 (a) Torque signal with contaminated oil at high speed under load
variations, (b) Torque signal with contaminated oil at low speed and normal
operating conditions, (c) Torque signal with contaminated oil at low speed
and under load variations ....................................................................................................... 92
Figure 5.12 Thermal images of the gearbox under different lubricant
conditions ........................................................................................................................................ 93
Figure 5.13 Gear in healthy condition before fault is applied ................................ 95
Figure 5.14 Gears conditions, (a). Healthy Gear (b) Teeth wear (c) Tooth
removed. .......................................................................................................................................... 96
Figure 5.15 Gear in faulty condition after tooth is chipped .................................... 98
Figure 5.16 Gear in faulty condition after tooth is removed .................................. 99
Figure 5.17 Broken tooth fault. (a) Vibration signal, (b) Faulty signal filtered,
and (c) Power spectrum of the faulty signal................................................................ 101
Figure 5.18 Gearbox dynamic arrangements .............................................................. 102
Figure 5.19 Data of the removed tooth. (a) Faulty vibration signal, (b)
Filtered signal, (c) Power spectrum of the filtered signal..................................... 103
Figure 5.20 Torque signal under faulty conditions .................................................. 107
Figure 5.21 Torque signal under healthy conditions .............................................. 108
Figure 5.22 Vibration signal under faulty conditions ............................................. 109
Figure 5.23 Vibration signal under healthy conditions.......................................... 110
Figure 5.24 Fuzzy logic model inputs. (a) Vibration and (b) Time, (c) FLC
output variables of the faulty condition case (when the drivetrain is under
stress), (d) Rules, and (e) Surfaces................................................................................... 114
P a g e | VII
Figure 5.25 Fuzzy logic model inputs. (a) Vibration amplitude, (b) Time, (c)
FLC output variables of the gearbox faulty tooth condition case, (d) Rules,
and (e) Surfaces ......................................................................................................................... 116
Figure 5.26 FLC input variables. (a) Vibration amplitude, (b) Time based on
each level, (c) Output MF of the case, (d) Rules, and (e) Surfaces .................... 119
Figure 5.27 Asset management and decision-making based WTOC................ 122
Figure A.1 Accelerometer model AC133 ....................................................................... 152
Figure A.2 Torque transducer (FUTEK model TRS605) ........................................ 157
Figure A.3 Torque transducer electrical block diagram. ....................................... 158
Figure A.4 Digital tachometer (Digitech QM1448) ................................................... 159
Figure 0.5 thermal imager Fluke Ti20 ………………………………………….……….172
List of Tables
Table 1.1 Renewable energy generation 2014, Australia .......................................... 6
Table 2.1 Typical condition monitoring techniques for the wind turbine
gearbox ............................................................................................................................................ 34
Table 2.2 Effect of roughness on performance for (about) 25% thick airfoil. 41
Table 3.1. Prominent areas of application of the wavelet transform. ................ 54
Table 3.2 Special applications in fault detection and analysis of the wind
turbine gearbox. ........................................................................................................................... 62
Table 5.1 Oil types and specifications................................................................................ 86
Table 5.2 Outline of the gearbox shaft speed (input/output) and number of
gear teeth. ..................................................................................................................................... 102
Table 5.3 Summary of all case studies, along with recommended asset
management decision ............................................................................................................. 120
Table 5.4 Classification of the assets management. ................................................. 124
Table 5.5 Summary of asset management and decision-making. ..................... 124
Table 5.6 Major Component out power failure, typical downtimes................. 125
Table 5.7 wind turbine (5MW) components replacement cost ........................ 125
Table A.1 Accelerometer model AC133 specification ............................................. 153
Table A.2 Accelerometer model AC133 specification (continue) ..................... 154
Table A.3 Typical oil properties......................................................................................... 155

P a g e | VIII
Table A.4 Typical oil properties......................................................................................... 156

P a g e | IX
Abbreviations
HAWTs Horizontal –axis wind turbines
IEA International energy association
IEC International Electrotechnical Commission
CM Condition monitoring
CMSs Condition monitoring systems
CM WTs Condition monitoring of Wind turbines
WECSs Wind turbine conversion systems
WRSG Wound- rotor Synchronous generators
DFIG Doubly fed induction generator
OCMSs on line condition monitoring systems
SCIGs Squirrel cage induction generators
IPS Instantaneous power spectrum
MCW Morlet continuous wavelet
DWT Discrete wavelet transform
STATCOM Static synchronous compensator
DWT Discrete wavelet transform
CWT Continuous wavelet transform
IMs Induction machines
CMFDS Condition monitoring fault diagnoses scheme
HSS High speed stage

P a g e | X
LSS Low speed stage
COT Computed order tracking
AMFM Amplitude modulation and frequency modulation
MED Minimum entropy deconvolution.
FFT Fast Fourier transform
TSA Time signal averaging
ISOVG International Standards Organisation Viscosity Grade

P a g e | XI
Declaration
I certify that
All the work has been done in this thesis is my own
work unless acknowledged.
The outcome of this thesis has not been submitted to
any other institute for any academic degree.
Signature: ………………………………………….
Date: ……………………………………

P a g e | XII
Acknowledgements
The completion of a PhD thesis is a challenging undertaking, and without
the guidance, support and suggestions I have received, it would not have been
achievable. I would like to express my most sincere appreciation to all the people
who helped me attain my goal.
I would like to thank my supervisor, Associate Professor Ahmed Abu-
siada, and Co-Supervisor, Professor Syed Islam, Electrical Engineering
Department, for their support and encouragement, which motivated me to finish
this work.
I would like to thank Associate Professor, Ian Howard, Mechanical
Engineering Department, for his visits to the power laboratory and his valuable
suggestions regarding the test rig setup.
I would also like to thank all the power laboratory technicians for their
help during the research period.
Finally, I would like to thank my wife, for her patience in my absence and
her continuous encouragement and support. I am so grateful for my children,
‟Raghd, Haroon and Roaa,” and I look forward to making up for any lost time
upon completion of my study.

P a g e | XIII
Dedication
To my parents, Almokhtar and Elshikha, for their endless love
and support throughout my life, and to my dearest wife and children,
for their support and patient of my absence during the course of my
study.
P a g e | XIV
Journal Papers
I. A. Salem, A. Abu-Siada, and S. Islam, "Condition Monitoring
Techniques of the Wind Turbines Gearbox and Rotor," International
Journal of Electrical Energy, vol. 2, pp. 53-56, 2014.
II. Salem, Abdulwahed, A. Abu-Siada, and S. Islam. "Application of Order
Analysis to Diagnose Fatigue within Wind Turbine Gearbox."
Technology and Economics of Smart Grids and Sustainable Energy
2.1:3, (2017).
III. Salem, Abdulwahed, Ahmed Abu-Siada, and Syed Islam. "Improved
condition monitoring technique for wind turbine gearbox and shaft
stress detection." IET Science, Measurement & Technology (2017).
IV. A. Salem, A. Abu-siada, and S. Islam, "Improved Condition Monitoring
Technique to Detect Incipient Mechanical Faults of Wind Turbine
Drivetrain," IEEE Transactions on Energy Conversion, special issue on
Modeling and Advanced Control of Wind Turbines/Wind Farms, 2016.
(Extended abstract accepted)
V. A. Salem, A. Abu-Siada, and S. Islam, "Impact of Gearbox Oil
Contamination on the Performance of the Wind Turbine Drivetrain,"
International Journal on Renewable Energies and Power Quality, vol.
14, pp. 230-234, 2016.

P a g e | XV
Conference Papers
I. A. Salem, A. Abu-Siada, and S. Islam, "Condition Monitoring
Techniques of the Wind Turbines Gearbox and Rotor," presented at
the International Journal of Electrical Energy, Paris, 2014. (Selected
for the journal).
II. A. Salem, A. Abu-Siada, and S. Islam, "Impact of Gearbox Oil
Contamination on the Performance of the Wind Turbine Drivetrain,"
presented at the International Conference on Renewable Energies and
Power Quality, Madrid, 2016. (selected for the journal)

P a g e | 1
Abstract
Condition monitoring (CM) has been widely used to detect mechanical
and electrical faults of wind turbine (WT) in order to avoid any potential
catastrophic failures, reduce operation and maintenance costs, and enhance
the reliability and availability of the equipment. Although several studies
concerning wind turbine condition monitoring can be found in the
literatures, it is still a challenge to adopt a reliable and cost effective
technique to protect wind turbines from severe mechanical stress due to the
harsh weather conditions they are exposed. Although statistical studies show
that gearbox failure rate is low, the resulting downtime and cost for
replacement or repair is substantial. For these reasons and due to the global
significant increase in wind energy conversion systems (WECS), a reliable
and cost effective condition monitoring technique is essential to maintain the
availability and improve the reliability of wind turbines (WTs).
In order to investigate the fault detection accuracy of the common
signal processing techniques, this study employs an improved technique to
monitor and compare the condition of the wind turbine gearbox based on
gearbox vibration and shaft torque signatures. Based on Practical
Measurement, and conducted on a test rig that emulates real wind turbine
operation, a system was developed to analyse the behaviour of a wind
turbine under various mechanical fault levels. Shaft torque and mechanical
vibration signals were detected using high resolution sensors and analysed
using two signal processing techniques: 1) wavelet and 2) order analyses.
The impact of chosen fault levels on the wind turbine drivetrain was also
investigated.
Both signal processing techniques were then compared, based on
their sensitivity to detect incipient fault conditions. In the test rig, the model
based control technique was applied using voltage slider, whereby a current
was injected through the induction generator stator terminals to control the
torque. This emulated real fault conditions on the wind turbine blades,
including ice accumulation, wind share, and gust wind. The applied technique

P a g e | 2
successfully and effectively improved detection accuracy when monitoring
drivetrain mechanical stress, including gearbox and shaft.
This thesis also compares two different types of lubrication oil, which are
tested during the monitoring process of fault detection, as well as several
lubrication oil contamination scenarios that are applied on the test rig
gearbox. The results show that oil viscosity and purity have a significant
impact. In order to further clarify the conditions of the wind turbine, in terms
of healthy or faulty, a fuzzy logic model was introduced to the case studies in
this thesis. Based on the condition of the wind turbine, a reliable asset
management decision was also proposed.

P a g e | 3
Chpater 1 Introduction

P a g e | 4
1.1 Background
Due to the day-to-day increase in load demand, and the harmful
environmental impact of fossil fuel-based electricity generation, the global
trend is currently focusing on generating electricity from clean renewable
resources such as wind.
From as early as the 19th century, small capacity wind turbines were
developed in some European countries, including Germany, Denmark, and
Belgium. The most common wind turbine type, during that time, was a
turbine with two blades [1].
Due to recent degradation and cost increase of conventional fossil
fuel, along with the global trend to decrease the greenhouse effect, clean
energy production from renewable sources has been given much
consideration over the last few decades. Most notably, there has been a rapid
increase in wind energy conversion system (WECS), which means that
various condition monitoring and fault diagnosis techniques have been
developed to detect incipient mechanical and electrical faults and mitigate
any catastrophic failures to wind turbines.
Improvement to the mechanical strain of wind turbines is achieved by
applying direct control to the induction generator electromagnetic torque
[2]. Failure of specific wind turbine components, such as blades, gearbox,
breaking system and tower, may lead to a catastrophic failure jeopardising
the whole investment [3, 4]. Many techniques have been published in the
literature that monitor the wind turbine. Condition monitoring of the
drivetrain is essential to explore incipient faults, allowing effective
maintenance and reliability improvement. Various gearbox failures have
been investigated in the literature [4].
Over the last three decades in Australia, renewable energy generation
has grown rapidly. Based on the Clean Energy Australia report published in
2014, wind energy represents about 31% of the total renewable energy
generations as shown in Figure 1.1 and Table 1 [2].
P a g e | 5
Figure 1.1 Estimated energy contribution of each technology to renewable
generation [5].

P a g e | 6
Table 1.1 Renewable energy generation 2014, Australia [5].
Technology Generation
(GWh)
Percent of
renewable
generation
Percent of total
generation
Equivalent
number of
households
powered
over
course of
the year
Hydro 14,555 45.9% 6.19% 2,049,900
Wind 9777 30.9% 4.16% 1,377,000
Household and
commercial solar
<100 kW
4834 15.3% 2.06% 680,900
Bioenergy 2400 7.6% 1.02% 338,000
Large-scale
solar5
118 0.4% 0.05% 16,700
Geothermal 0.50 0.002% 0.00% 70
Marine 0.04 0% 0.00% 6
TOTAL 31,684 100% 13.47% 4,462,600
Wind turbine has become a vital renewable energy source worldwide
because of its harmless environmental impact and low cost when compared
with other renewable energy technologies of the same capacity [6]. Figure
1.2 shows the historical development of wind turbines between 1980, where
the tower height was just 15m and turbine capacity was a few kilowatts, and
2020, where tower height is expected to be more than 200m with a wind
turbine capacity of up to 20 MW [7].

P a g e | 7
Figure 1.2 Construction development in wind turbine sizes [7].
Late models of wind turbine come in two configurations, depending
on the rotor operating principles: 1) horizontal –axis wind turbines (HAWTs)
and 2) vertical –axis wind turbines (VAWTs). HAWTs with a three blade
configuration are more common [8]. A turbine’s optimum performance relies
on the blade taper angle and the height of the turbine on the tower.
There is a constant need for the reduction of operational and
maintenance costs of Wind Energy Conversion Systems (WECSs). This
motivates utilities and wind turbine stakeholders to adopt various condition
monitoring techniques to detect incipient faults and to facilitate a proactive
response, avoiding any catastrophic failure to the turbine, minimising
downtime, and maximising productivity. Occasional malfunction of specific
parts (such as blades, gearbox, tower, braking system, etc.) can result not
only in high repairing / replacement expenses, but may also lead to a
catastrophic failure that endangers the surrounding environment. For these
reasons, adopting a reliable condition monitoring technique to detect
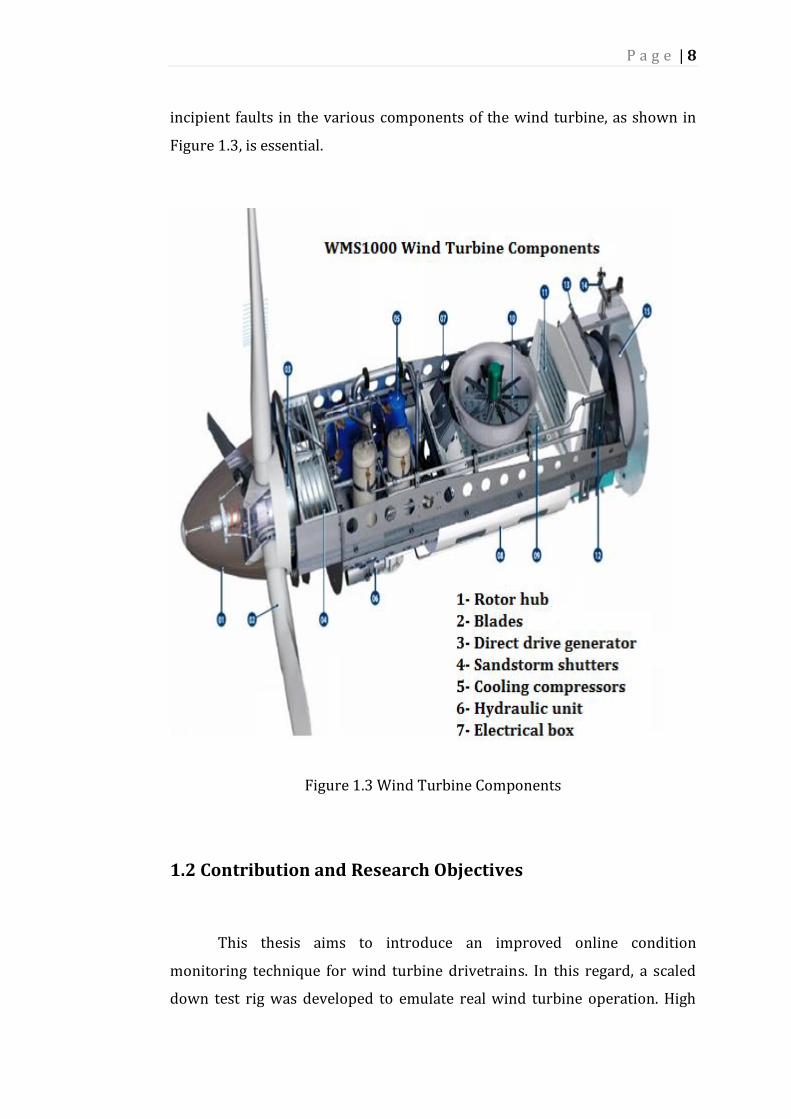
P a g e | 8
incipient faults in the various components of the wind turbine, as shown in
Figure 1.3, is essential.
Figure 1.3 Wind Turbine Components
1.2 Contribution and Research Objectives
This thesis aims to introduce an improved online condition
monitoring technique for wind turbine drivetrains. In this regard, a scaled
down test rig was developed to emulate real wind turbine operation. High

P a g e | 9
resolution sensors were used to capture the drivetrain vibrations and torque
signatures during normal and faulty operating conditions. The captured
signals were analysed using signal processing techniques in order to identify
and quantify incipient faults in real time. The key objectives of this research
are to:
1. Carry out an extensive literature review for determining which state-
of-the-art techniques are available for wind turbine condition
monitoring and to identify the most common electrical and
mechanical faults that wind energy conversion systems may exhibit.
2. Develop a prototype test rig model to investigate the effect of various
mechanical and electrical faults on the measured vibration and torque
signatures for real time fault detection.
3. Employ an online signal processing technique for fault detection and
for analysis of wind turbine mechanical type faults.
4. Propose effective mitigation techniques for the investigated faults and
provide a reliable asset management decision based on the wind
turbine operating condition.
1.3 Thesis Organisation
Chapter -1
This chapter provides an overview of wind turbine components, the
scope of the work, and the main objectives of the thesis.
Chapter -2
An extensive literature review in Chapter 2 reveals the various
condition monitoring techniques currently used in wind turbine systems.
The chapter also describes the crucial components of a wind turbine.
Chapter -3
In this chapter, the commonly used signal processing and analysis
techniques — such as Fourier transform, Wavelet and order analysis -— for

P a g e | 10
machinery condition monitoring systems are introduced. The advantages
and limitations of each signal processing technique are also highlighted and
discussed.
Chapter -4
This chapter details the components of the test rig and explains how
various faults are implemented to mimic real wind turbine faults.
Chapter -5
Chapter 5 presents the main outcomes of the laboratory-based setup
measurements. The results are analysed and compared during normal
operating conditions and during various faults.
Chapter -6
In this final chapter, the main conclusion drawn from this research
work is summarised. This is followed by recommendations for future work.

P a g e | 11
Chapter 2 Condition
Monitoring of Wind
Turbines Failure and
Diagnoses
P a g e | 12
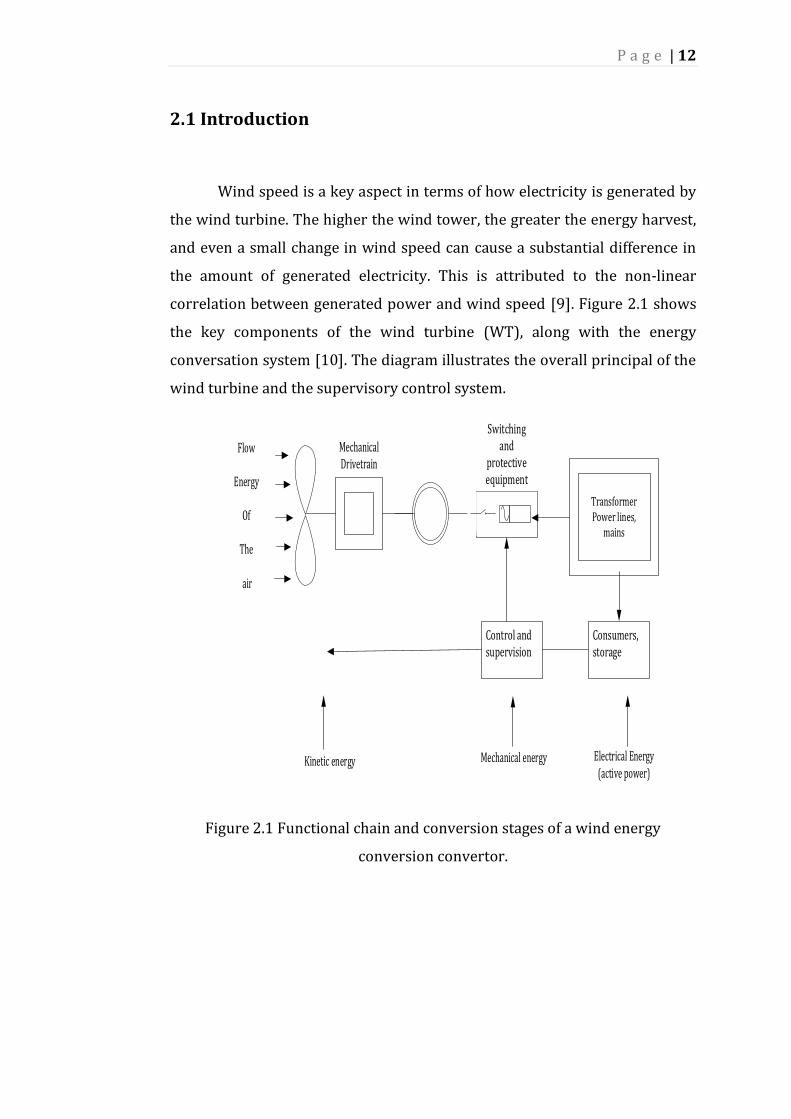
2.1 Introduction
Wind speed is a key aspect in terms of how electricity is generated by
the wind turbine. The higher the wind tower, the greater the energy harvest,
and even a small change in wind speed can cause a substantial difference in
the amount of generated electricity. This is attributed to the non-linear
correlation between generated power and wind speed [9]. Figure 2.1 shows
the key components of the wind turbine (WT), along with the energy
conversation system [10]. The diagram illustrates the overall principal of the
wind turbine and the supervisory control system.
Figure 2.1 Functional chain and conversion stages of a wind energy
conversion convertor.
Mechanical Drivetrain
Flow
Energy
Of
The
air
Electrical Energy (active power)
Kinetic energy Mechanical energy

P a g e | 13
2.2 Power Characteristics of a Wind Turbine
The International Energy Association (IEA) in collaboration with the
International Electrotechnical Commission (IEC) recommend improvements
to a wind turbine’s power curve based on the formal standard (IEC61400-12
) of measurement [7].
The conventional power curve, correlating to the mechanical power
𝑃𝑀 generated by wind speed 𝑣𝑤 (as shown in Figure 2.4), is characterised by
three wind speeds, namely: 1) cut-in wind speed, 2) rated wind speed, and 3)
cut-out wind speed [8]. These speeds are defined below:
Cut-in wind speed: is measured from the
commencement of the turbine’s operation until it starts to deliver
power.
Rated wind speed: is the speed corresponding to rated
output power.
Cut-out wind speed: is the highest level of wind speed at
which a turbine should operate, and when a turbine should be
stopped to protect it from severe wind damage.
Figure 2.2 Qualitative turbine mechanical power versus wind speed curve[8].
P a g e | 14
The WT at the cut-in stage captures a wind speed that allows blade
movement. When the wind speed increases, a variable speed controller is
required, while the captured power at the rated stage is controlled by the
blades’ aerodynamic system. This procedure of action requires different
mechanism steps to achieve passive stall, active stall and pitch control [11].
2.3 Wind Turbine Function and Structure
2.3.1 Tower
A high tower is a key element in wind turbine structure and represents about
20% of the overall cost of the WT structure [12]. The output power of the
WT’s generator rotor increases with the height of the tower, and is also
dependent on the proper location of the WT. For example, at inland sites, due
to harsh weather conditions (dust accumulation, Birds wastes), where the
degree of surface roughness is high, wind speeds increase slowly with the
height of the tower. This is compared to shore-based locations, where surface
roughness is low and wind speed is also low.
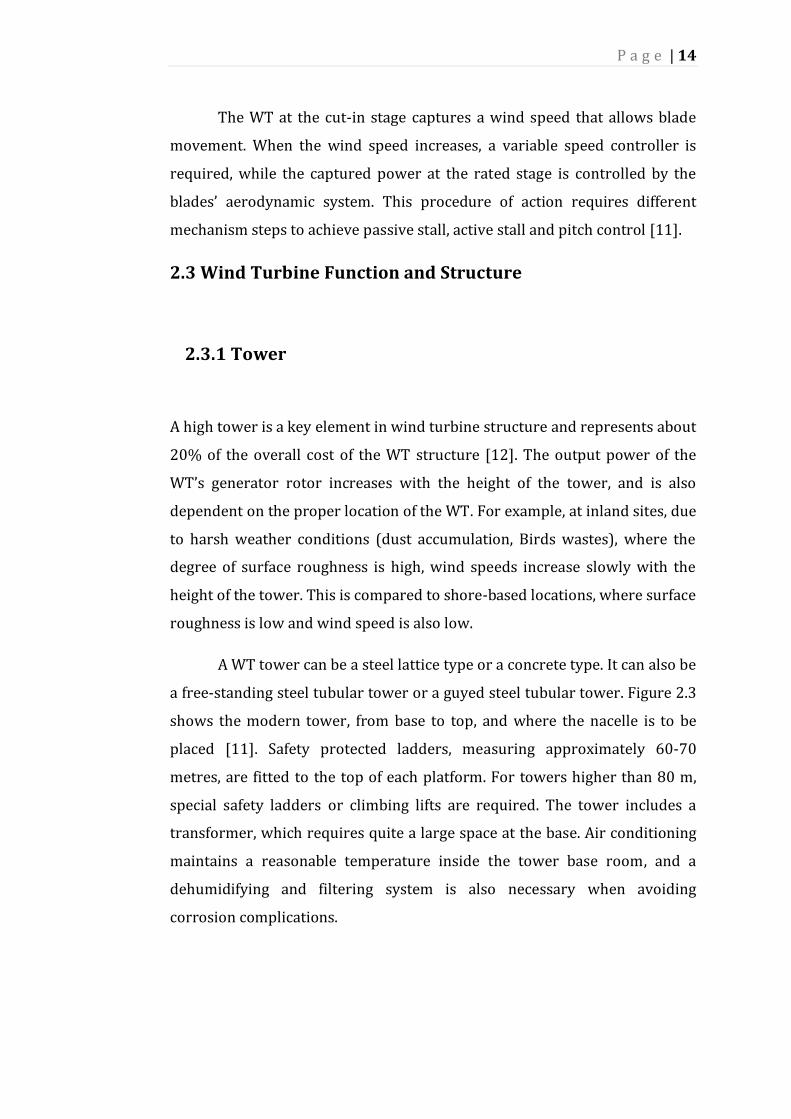
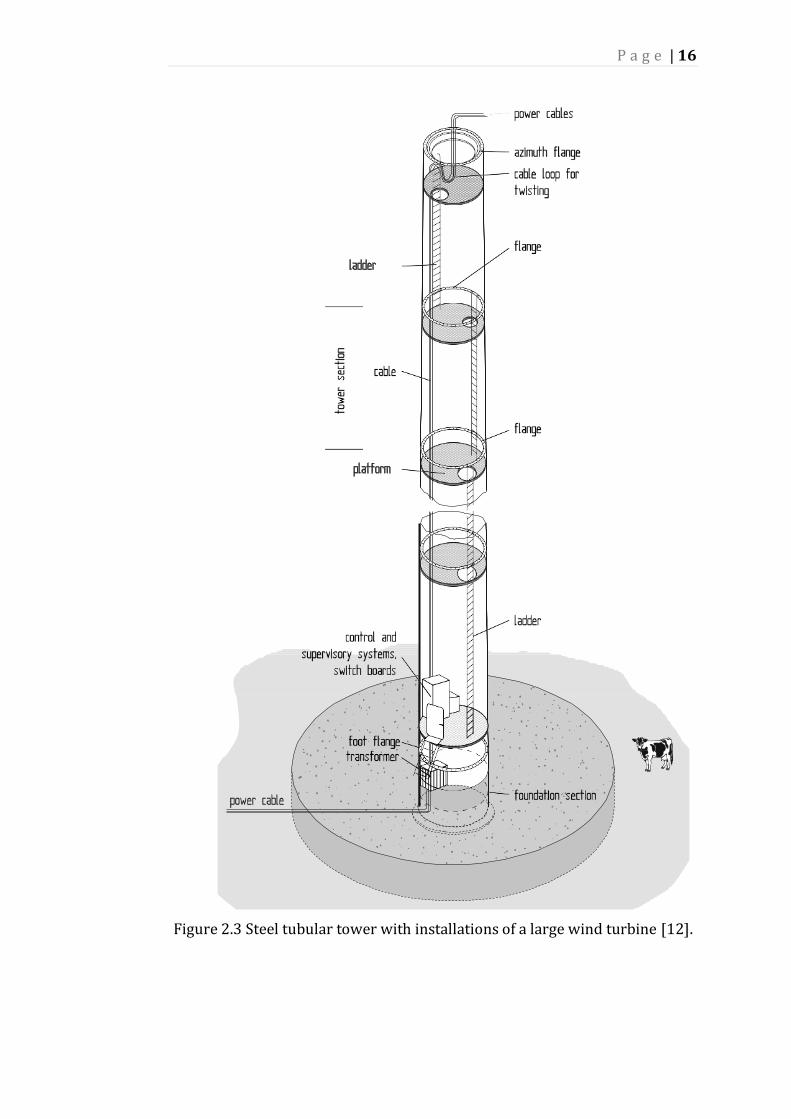
A WT tower can be a steel lattice type or a concrete type. It can also be
a free-standing steel tubular tower or a guyed steel tubular tower. Figure 2.3
shows the modern tower, from base to top, and where the nacelle is to be
placed [11]. Safety protected ladders, measuring approximately 60-70
metres, are fitted to the top of each platform. For towers higher than 80 m,
special safety ladders or climbing lifts are required. The tower includes a
transformer, which requires quite a large space at the base. Air conditioning
maintains a reasonable temperature inside the tower base room, and a
dehumidifying and filtering system is also necessary when avoiding
corrosion complications.

P a g e | 15
2.3.2 Strength and Stiffness Design
In the design stage of the tower, it is essential to calculate tower
stiffness and strength to ensure the tower’s fatigue strength can withstand
massive wind speeds that fluctuate throughout the operational life of the
wind turbine (20-30 years).
2.3.2.1 Breaking strength
The static load of the tower is determined by the tower-head weight,
the tower’s material weight, and the aerodynamic rotor thrust. In load cases,
which required the breaking strength for the tower to be tested, the tower’s
highest bending moment was determined with rotors ‘’without blade pitch
control (stall-controlled turbines) or when the worst rotor blade position’’
was demanded [11].
2.3.2.2 Stiffness
The stiffness calculation is based on the first specific natural bending
frequency and with respect to other frequencies, such as torsion frequency,
that relate to the yaw system dynamics of the wind turbine as a whole.
2.3.2.3 Fatigue Strength
The propulsive force that the WT rotor faces during operation, and as
a result of the wind speed variation, has a significant impact on the fatigue
lifespan of the tower and, in particular, the slender towers. Purely static
stress analysis is commonly required by the building authorities for
conventional buildings, but is not appropriate for the tower design of a wind
turbine [12].
P a g e | 16
Figure 2.3 Steel tubular tower with installations of a large wind turbine [12].

P a g e | 17
2.4 Condition Monitoring System (CMS)
To avoid any catastrophic failure to the WT, it is essential to adopt a
reliable condition monitoring technique, which ensures timely and proper
maintenance. The Condition Monitoring Fault Diagnoses Scheme (CMFDS)
gives the operator time and opportunity to prepare the necessary parts prior
to the cut-down stage of the machine. The main components of a WT’s Online
Condition Monitoring System (OCMS) include data acquisition, sensors, fault
detection and a diagnosis approach [13]. According to [14], there are two
types of condition monitoring techniques currently used in the industry: 1)
continuous and 2) periodic. The first scheme continuously monitors the
machine and activates all necessary alarms whenever a fault occurs. This
method however is expensive and may lead to the mix-up of raw data and
noise signals, which can in turn lead to an incorrect diagnosis.
Although several publications can be found in the literatures
proposing several methodologies for OCMSs [15-19], investigation is still
under way as modern wind turbines become more equipped with a variety of
condition monitoring systems (including main and sub-main fault diagnosis
systems [20-22].
According to [23], a number of tasks are essential for a successful
CMS:
1. Transduction measurement (sensing of primary variables).
2. Data acquisition.
3. Processing and identifying measured data.
4. Fault diagnostics and decision making.
Figure 2.4 shows the main monitoring tasks of which a CMS
comprises.

P a g e | 18
Figure 2.4 Main monitoring tasks [23]
2.4.1 Condition Based Maintenance (CBM)
A Condition Based Maintenance (CBM) approach employs high quality
vibration sensors, temperature sensors and torque transducers in order to
monitor the condition of the turbine’s health and allow a proper
maintenance plan to be put in place if any of the measured parameters
exceed the pre-known threshold limits. By using a CBM programme, the
failure cause is eliminated at an early stage and the unit’s productivity,
reliability and availability is enhanced.
2.4.2 Wind Turbine Reliability
The journey of WT reliability starts at the manufacturing stage and
continues throughout the operational life span of the turbine. Improved
reliability of the asset can be achieved by avoiding unreliable suppliers,
cheap spares (bearings), careless transportation, and wear and tear to the
machine.
Condition monitoring alone does not improve reliability. A pro-active
approach must be taken to identify the the cause of the failure, resulting in
Operational
strategy
Plant Transduction Data
acquisition
Processing Diagnostics
P a g e | 19
improved safety, the prevention of catastrophic failures, and a future
maintenance plan that is based on a reliable, condition-based program.
2.5 Fault Diagnosis
Fault diagnoses and the detection of the failure mode is a fundamental
aspect of any successful maintenance procedure. Different failures modes
require different detection techniques and diagnoses strategies to eliminate
any potential failures, sustain the maintenance budget and avoid any
expensive downtime. A gearbox failure, due to lack of proper CM for wind
turbine 3 years of age, has been reported to cost $426,000 (Canadian dollars
,2004) [24]. Despite the variety of diagnoses techniques currently used by
industry, further research is required to improve the quality of measuring
sensors, data acquisition, and data analyses.
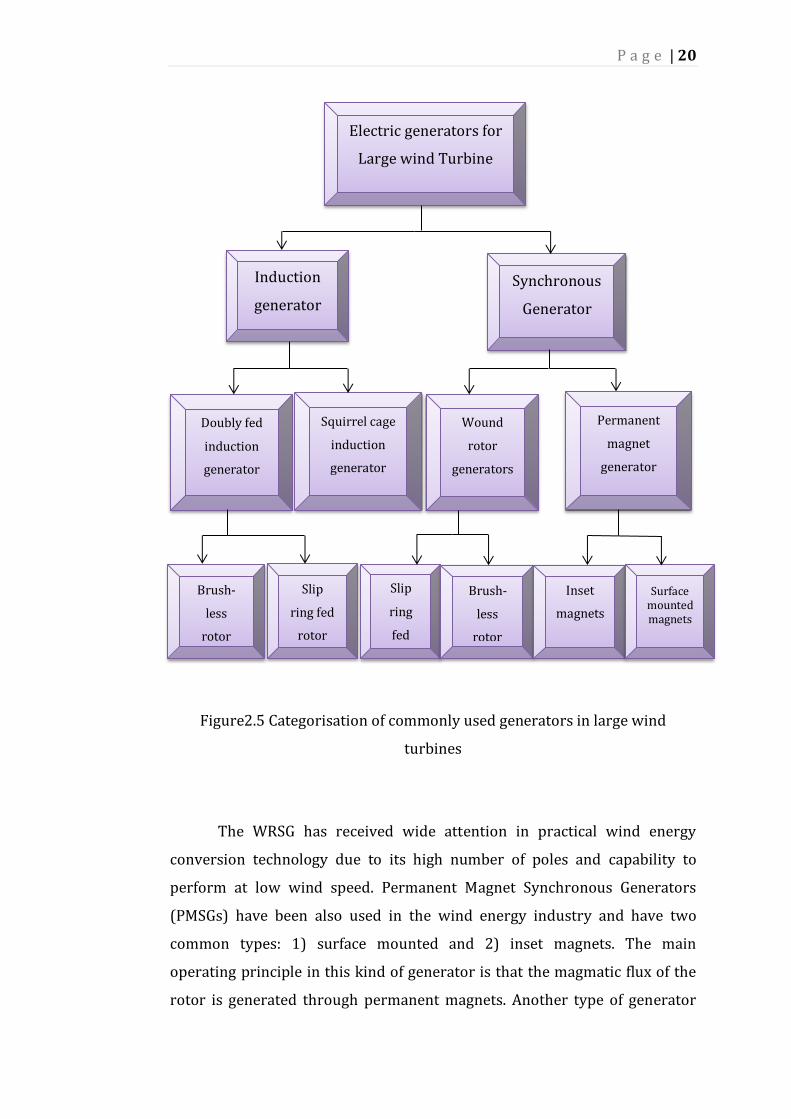
2.6 Wind Turbine Generators (WTGs)
An assessment of wind energy conversion system technology
demonstrates the need to moderate the generator’s configuration in order to
accommodate life requirements [8]. A categorisation of commonly used wind
turbine generators (especially the larger sizes) is shown in Figure 2.5.
According to the structure and operating fundamentals of a wind turbine
generator, they are divided into two main types: 1) Induction Generators
(IGs) and 2) Synchronous Generators (SGs). The Wound Rotor Synchronous
Generator (WRSG) is shared between the (IGs) and (SGs) and fed through a
slip ring or a brushless electromagnetic field exciter. A Doubly Fed Induction
Generator (DFIG) is the most common generator within the wind turbine
generator industry [25].
P a g e | 20
Figure2.5 Categorisation of commonly used generators in large wind
turbines
The WRSG has received wide attention in practical wind energy
conversion technology due to its high number of poles and capability to
perform at low wind speed. Permanent Magnet Synchronous Generators
(PMSGs) have been also used in the wind energy industry and have two
common types: 1) surface mounted and 2) inset magnets. The main
operating principle in this kind of generator is that the magmatic flux of the
rotor is generated through permanent magnets. Another type of generator
Electric generators for
Large wind Turbine
Induction
generator
Synchronous
Generator
Doubly fed
induction
generator
Wound
rotor
generators
Permanent
magnet
generator
Squirrel cage
induction
generator
Slip
ring fed
rotor
Brush-
less
rotor
Slip
ring
fed
Brush-
less
rotor
Inset
magnets
Surface mounted magnets
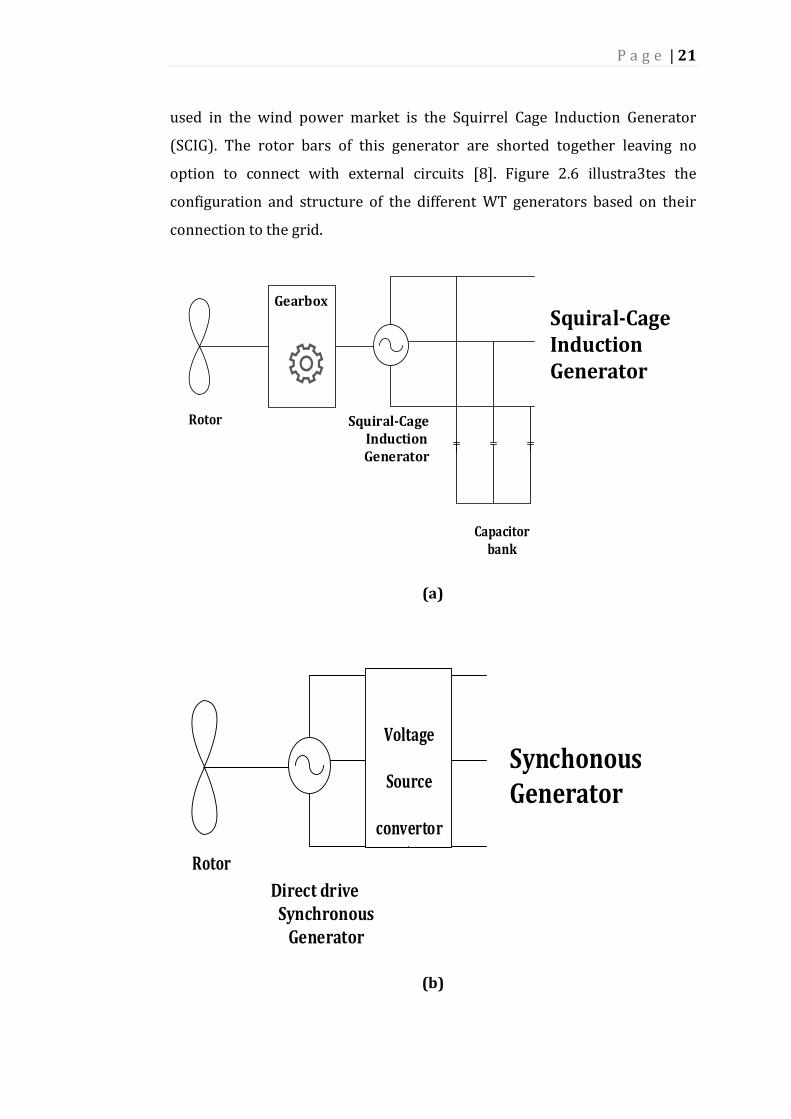
P a g e | 21
used in the wind power market is the Squirrel Cage Induction Generator
(SCIG). The rotor bars of this generator are shorted together leaving no
option to connect with external circuits [8]. Figure 2.6 illustra3tes the
configuration and structure of the different WT generators based on their
connection to the grid.
(a)
(b)
Capacitor bank
Rotor
Rotor
Voltage
Source
convertor
P a g e | 22
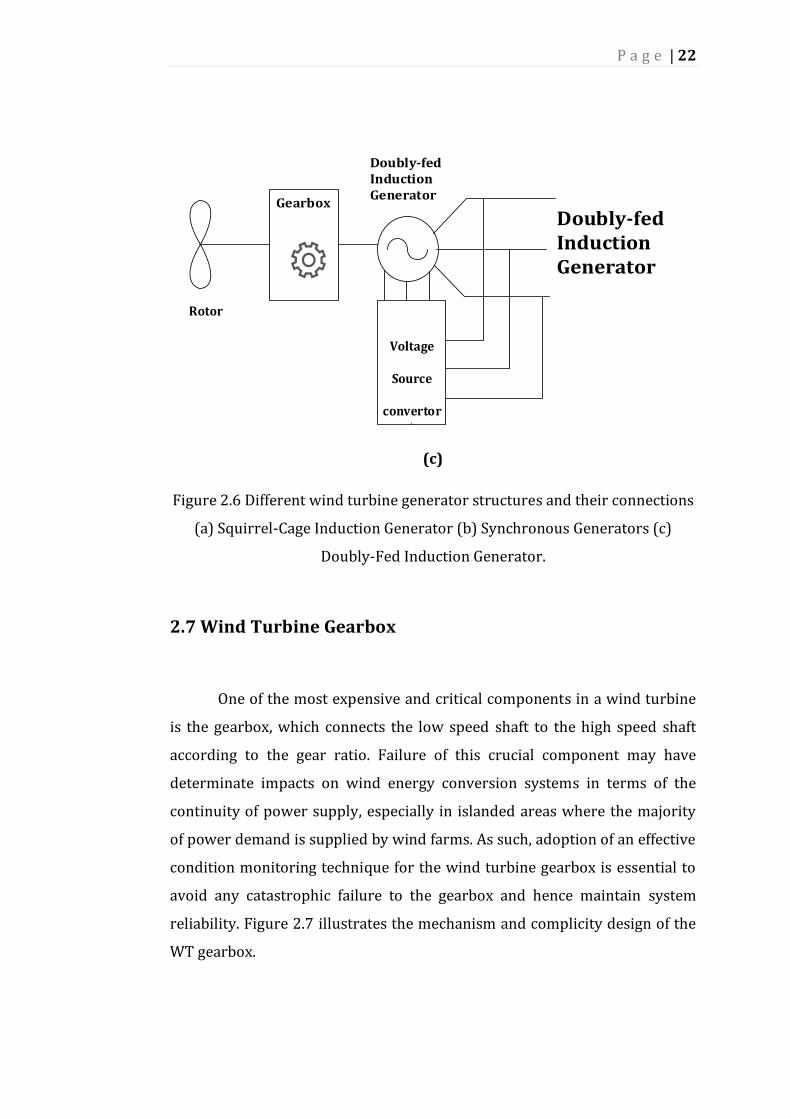
(c)
Figure 2.6 Different wind turbine generator structures and their connections
(a) Squirrel-Cage Induction Generator (b) Synchronous Generators (c)
Doubly-Fed Induction Generator.
2.7 Wind Turbine Gearbox
One of the most expensive and critical components in a wind turbine
is the gearbox, which connects the low speed shaft to the high speed shaft
according to the gear ratio. Failure of this crucial component may have
determinate impacts on wind energy conversion systems in terms of the
continuity of power supply, especially in islanded areas where the majority
of power demand is supplied by wind farms. As such, adoption of an effective
condition monitoring technique for the wind turbine gearbox is essential to
avoid any catastrophic failure to the gearbox and hence maintain system
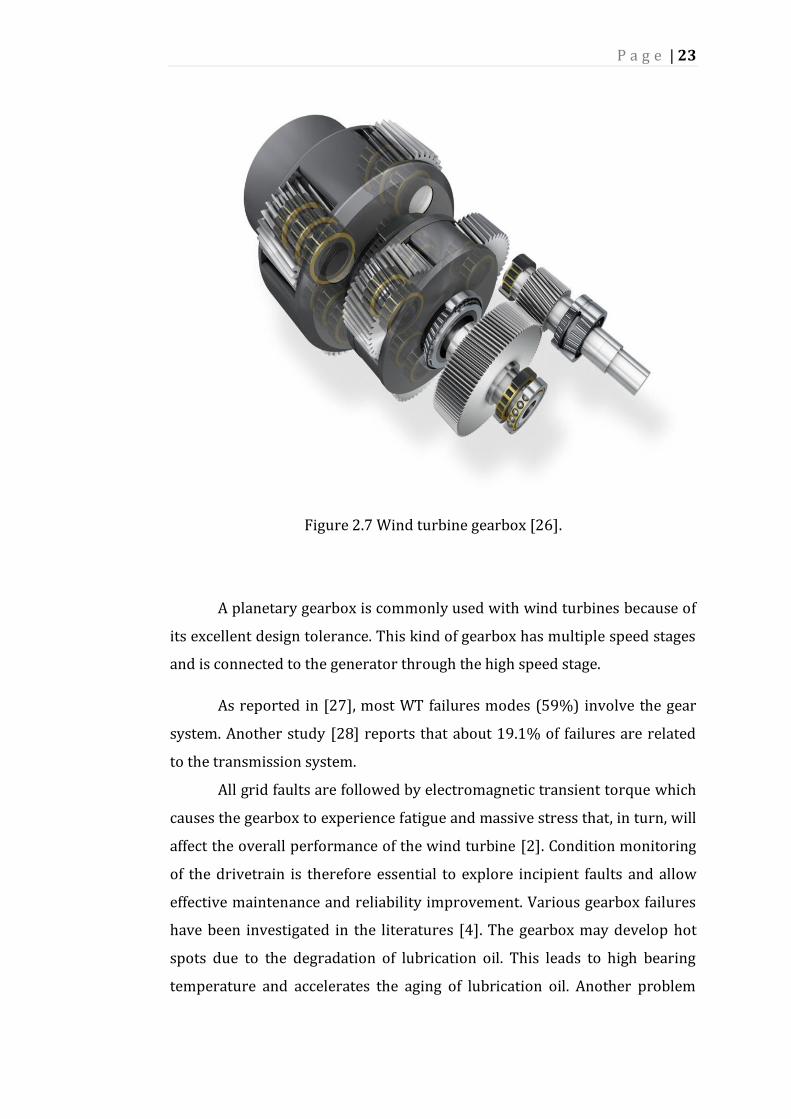
reliability. Figure 2.7 illustrates the mechanism and complicity design of the
WT gearbox.
Rotor
Voltage
Source
convertor
P a g e | 23
Figure 2.7 Wind turbine gearbox [26].
A planetary gearbox is commonly used with wind turbines because of
its excellent design tolerance. This kind of gearbox has multiple speed stages
and is connected to the generator through the high speed stage.
As reported in [27], most WT failures modes (59%) involve the gear
system. Another study [28] reports that about 19.1% of failures are related
to the transmission system.
All grid faults are followed by electromagnetic transient torque which
causes the gearbox to experience fatigue and massive stress that, in turn, will
affect the overall performance of the wind turbine [2]. Condition monitoring
of the drivetrain is therefore essential to explore incipient faults and allow
effective maintenance and reliability improvement. Various gearbox failures
have been investigated in the literatures [4]. The gearbox may develop hot
spots due to the degradation of lubrication oil. This leads to high bearing
temperature and accelerates the aging of lubrication oil. Another problem

P a g e | 24
facing the gearbox is that, when a wind gust hits the rotor blades, blade
movement can cause a temporary misalignment between the two shafts
connected through the gearbox. This misalignment can produce damage to
the bearing loads and reduce the lifetime of the wind turbine [29, 30].
Vibration measurements (of both the gearbox and bearings) return
data that enables the calculation of the wind turbine’s mechanical
characteristics. Sensors attached to the rotational components of the wind
turbine can estimate the acceleration level of various rotational spots, which
can assist in identifying any incipient mechanical failure [16]. Spectral
analysis is a way to analyse the vibration data based on Fourier transform.
By analysing the spectrums, the health condition of rotating components can
be identified and quantified. According to [31], wavelet and Fourier
transformation are the most common signal processing techniques used to
analyse vibration and torque signals.
Wang et al. [32] utilises the wavelet method for fault diagnosis of a
gearbox under fluctuating loads. Cibulka et al [33] investigate the bearing
faults in a single stage gearbox, attached to an induction machine, by
monitoring the stator current. Yuan and Lilong [34] analyse the vibration
signal obtained from both a healthy and a damaged gearbox, using the
variable amplitude Fourier series, and compare the outcomes with the
wavelet analysis method. In [35], harmonic wavelet-based data filtering is
used to enhance time frequency features for multiple sensor signals. Molins
et al [2] illustrate that by controlling the terminal voltage of an induction
generator, through the compensation of a reactive current using a static
synchronous compensator, the electromagnetic torque stress on the
generator rotor shaft will be mitigated.
P a g e | 25
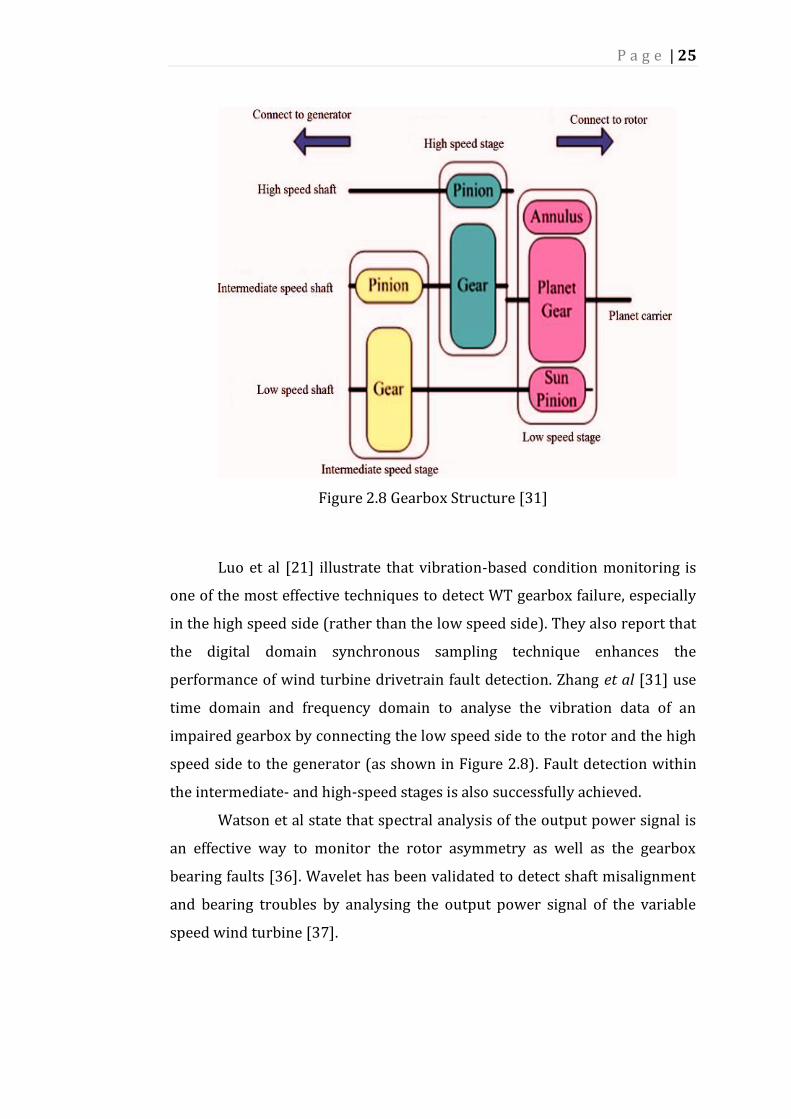
Figure 2.8 Gearbox Structure [31]
Luo et al [21] illustrate that vibration-based condition monitoring is
one of the most effective techniques to detect WT gearbox failure, especially
in the high speed side (rather than the low speed side). They also report that
the digital domain synchronous sampling technique enhances the
performance of wind turbine drivetrain fault detection. Zhang et al [31] use
time domain and frequency domain to analyse the vibration data of an
impaired gearbox by connecting the low speed side to the rotor and the high
speed side to the generator (as shown in Figure 2.8). Fault detection within
the intermediate- and high-speed stages is also successfully achieved.
Watson et al state that spectral analysis of the output power signal is
an effective way to monitor the rotor asymmetry as well as the gearbox
bearing faults [36]. Wavelet has been validated to detect shaft misalignment
and bearing troubles by analysing the output power signal of the variable
speed wind turbine [37].
P a g e | 26
2.8.1 Impact of Varying Load Conditions on WT Gearboxes
Condition monitoring of wind turbine gearboxes is complicated and
faces major challenges due to the very complicated structure of the gearbox
and the type of signals that can be observed from its rotating components.
Signal processing techniques under load variations require advanced
features in order to analyse such signals. A number of studies focus on the
effect of load variations on condition monitoring techniques. For example, in
[38], the Instantaneous Power Spectrum (IPS) is used to detect gear damage
under load variations conditions. In [39] investigates the planetary gearbox
under non-stationary operating conditions. Acceleration signal harmonics of
gear mesh frequency are analysed using the FFT spectrum after applying a
band-pass filter to the signal under varying loads [40].
A test rig experimental set-up was used in [14, 32] to highlight the
impact of the load variations when carrying out the condition monitoring
procedure. The Wavelet technique, based on Morlet continuous wavelet and
parametrical modelling analysis approaches, was used to analyse the
measured signals[41, 42].
Discrete Wavelet Transform (DWT) is known by its ability to extract
most of the signal’s features in both time and frequency domains [43]. The
exceptional advantage of the wavelet application is that its frequency
bandwidths vary in time, making it an appropriate method to study non-
stationary signals [44, 45]. Harmonic wavelet-based data filtering is used for
enhanced time frequency features, allowing analysis of multiple sensor
signals when identifying and quantifying wind turbine gearbox faults [35]. As
mentioned earlier in this thesis, 59% of wind turbine failures are attributed
to the gearbox. Consequently, industrial gear failure and fault diagnosis is
often addressed by researchers [46, 47]. Authors of [48, 49] categorise the
common gear failures into two main types of stresses: 1) contact stress and
2) root bending stress. The first type causes gear pitting, and the second type
causes tooth crack or tooth damage. Both types can lead to premature gear
P a g e | 27
wear and failure. In [50], a method for gearbox fault detection through the
analysis of the sideband frequency without a tachometer signal is introduced.
Tang and Luo [35] demonstrate that vibration-based condition monitoring is
an effective technique in recognising gearbox faults, particularly in the high
speed stage (compared to the low speed stage), and this is ascribed to the
potential ‘’sensitivity of the accelerometers to high frequency vibration’’.
Many authors confirm that the ‘’digital domain synchronous sampling’’
procedure improves monitoring of the wind turbine drivetrain.
Authors in [51] introduce a method for wind turbine mechanical
stress reduction. Gearbox bearings along with oil quality and the lubrication
system – are recognised as a crucial part of the gearbox with the highest link
to gearbox failure [30]. Combet and Gelman [52] investigate the sideband
ratio features. These features are less affected by a load variation that may
result in a passive effect on the gearbox. Instead they produce a non-linear
transmission path, as well as disturbance to the vibration signal, to identify
the health condition of the gearbox [53].
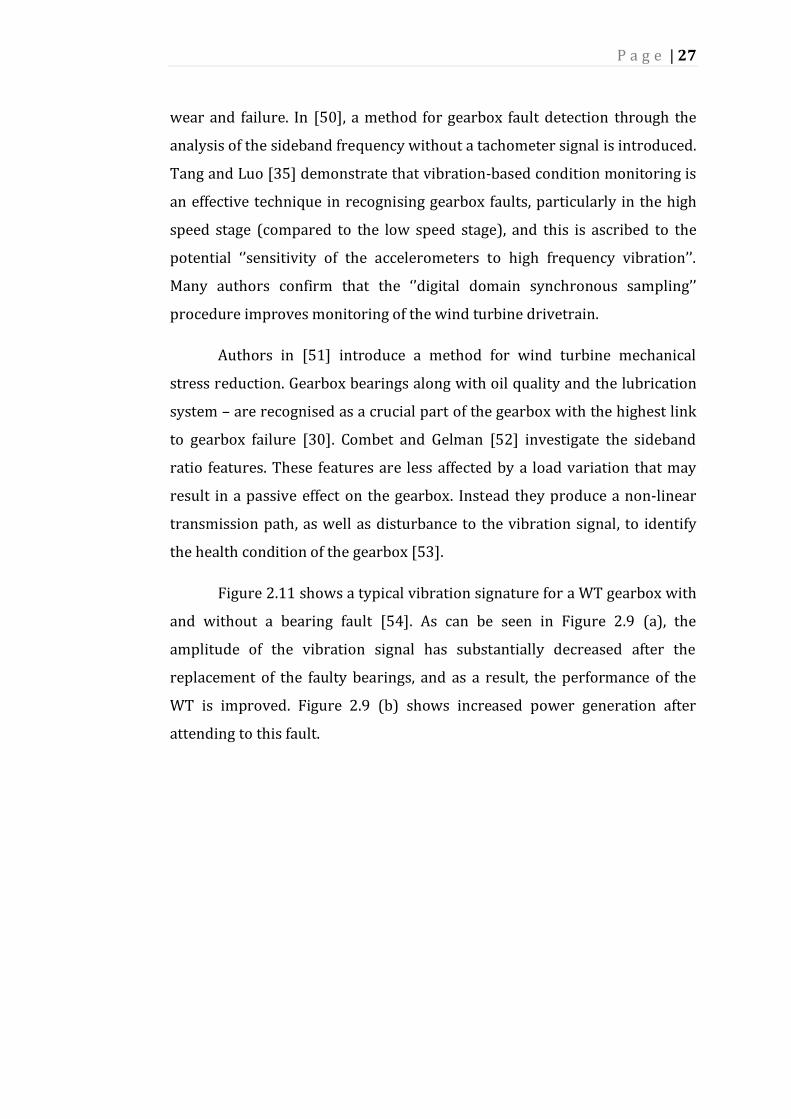
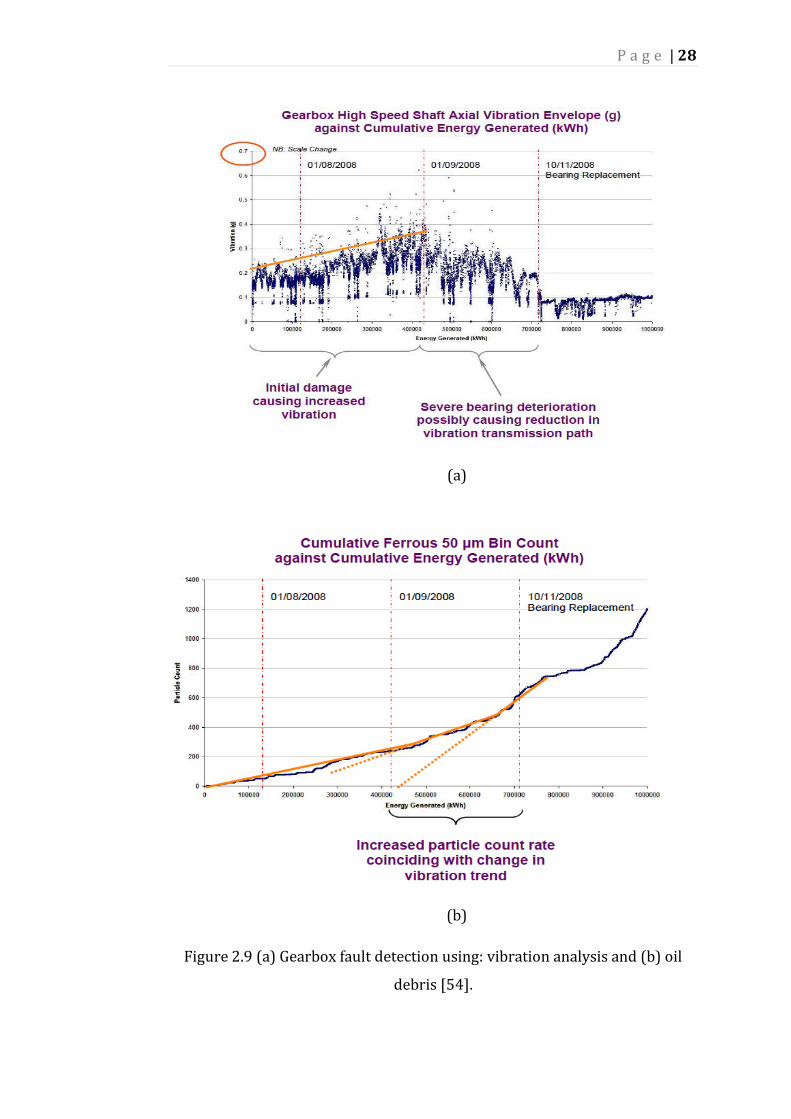
Figure 2.11 shows a typical vibration signature for a WT gearbox with
and without a bearing fault [54]. As can be seen in Figure 2.9 (a), the
amplitude of the vibration signal has substantially decreased after the
replacement of the faulty bearings, and as a result, the performance of the
WT is improved. Figure 2.9 (b) shows increased power generation after
attending to this fault.
P a g e | 28
(a)
(b)
Figure 2.9 (a) Gearbox fault detection using: vibration analysis and (b) oil
debris [54].
P a g e | 29
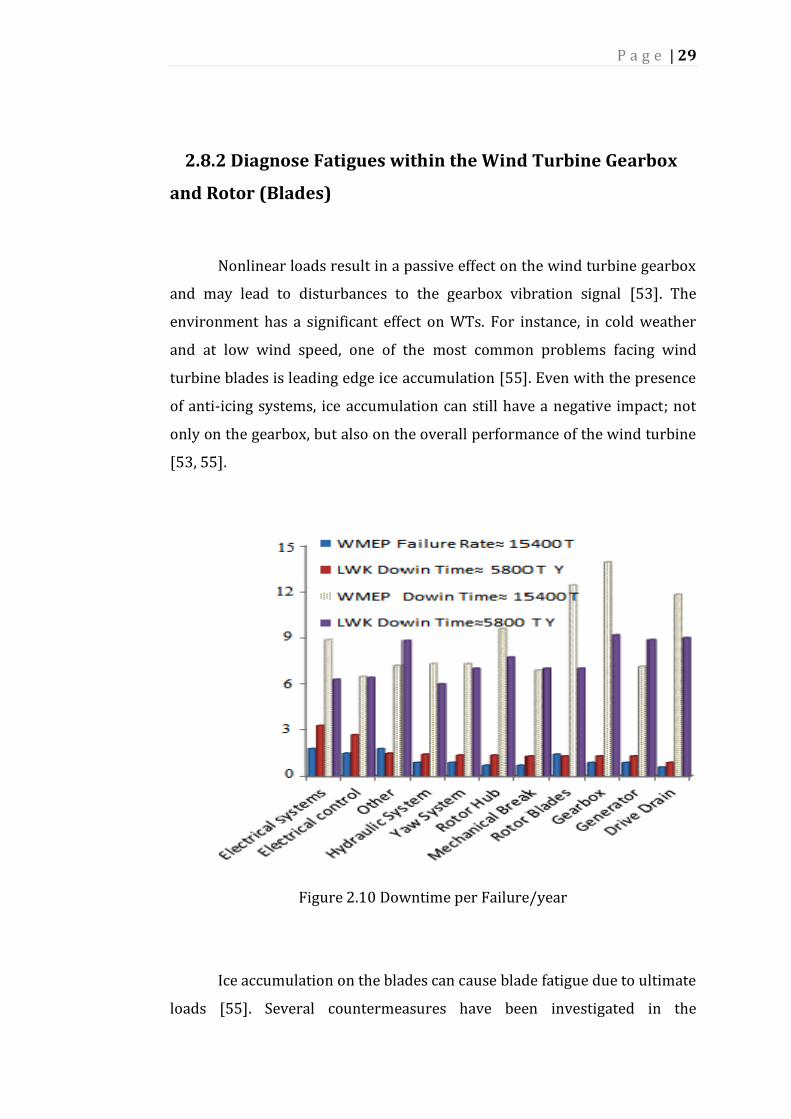
2.8.2 Diagnose Fatigues within the Wind Turbine Gearbox
and Rotor (Blades)
Nonlinear loads result in a passive effect on the wind turbine gearbox
and may lead to disturbances to the gearbox vibration signal [53]. The
environment has a significant effect on WTs. For instance, in cold weather
and at low wind speed, one of the most common problems facing wind
turbine blades is leading edge ice accumulation [55]. Even with the presence
of anti-icing systems, ice accumulation can still have a negative impact; not
only on the gearbox, but also on the overall performance of the wind turbine
[53, 55].
Figure 2.10 Downtime per Failure/year
Ice accumulation on the blades can cause blade fatigue due to ultimate
loads [55]. Several countermeasures have been investigated in the
P a g e | 30
literatures, including the countless shapes of leading edge icing, trailing edge
icing and blade surface icing. Paring down blade problems will lead to the
reduction of the blade size [55]. Two types of vibration affect the blades: 1)
flabwise and 2) edgewise. The last mode has significant negative effect on
wind machines as a result of the violent vibrations [56]. Figure 2.10
illustrates the failure modes of WECS according to a statistical survey
conducted over 13 years ago [57].
2.8.3 Gearbox Tooth Failure Impact on the Wind Turbine
Performance
Condition monitoring (CM) of the rotating machinery, and the
vibration analysis technique, have been validated by many researchers, as
well as those from within the practical field. Power spectrum, adaptive noise
cancellation, time-series analysis, and time-domain averaging have all been
used to diagnose failure within rotating machinery. The developed
techniques are however not fully matured yet, especially in detecting gear
teeth cracking and cylinder wear in reciprocating engines [58, 59].
As we have seen, gearbox failure is a common issue within drive train
CM of the WT, and researchers have extensively discussed this [15-19].
Gearbox failure has massive impact on the productivity and availability of the
WT and can result in long down time periods [30]. Oil lubrication
degradation can also affect the performance of the gearbox and raise its
temperature to a critical value [60]. According to a number of studies
concerning planetary gearboxes and the damaged gears of wind turbines
(based on vibration signals collected from the fitted sensors on the ring gear,
and whether a local damage gear goes into mesh), the received signal can be
demonstrated as ‘amplitude modulation and frequency modulation (AMFM)
with the gear meshing frequency (or its multiples) as the signal carrier
frequency and the characteristic frequency of the damaged gear (or its
multiples) as the modulating frequency’ [61-66].

P a g e | 31
Mandic et al [67], propose a technique based on load reduction of
variable speed WTs to minimise the mechanical stress on the gearbox
mechanisms. Another study [68], investigates a way to enhance the detection
of a faulty gear tooth (cracked or chipped) by using an autoregressive model
and the Minimum Entropy Deconvolution (MED) based filtering technique.
Wang et al [69], apply wavelet transform to analyse a helicopter gearbox
vibration signal and detect the gear faults.
Tang et al, [35] show that non-stationary signals, along with the
harmonics generated from WT gearbox operation, are difficult to maintain
within a direct harmonic-based method such as Fourier transform. Other
studies, [70-73], prove that the harmonic wavelet technique is the most
suitable and capable signal processing technique for analysing associated
vibration harmonics. This is due to the wavelet’s capability to combine the
advantages of short-time Fourier transform and also continuous wavelet
transform. Wang and McFadden [46] propose a spectrogram application
(based on the calculation of the time frequency distribution) in order to
achieve an early detection of gear failures. Mallat [74] and Donoho [75]
propose and develop a de-noising technique (based on wavelet transform) to
eliminate the noise from the signal and achieve an effective fault detection
technique.
2.9 Lubrication Oil Monitoring
Lubricant oil monitoring of the wind turbine gearbox is essential
when maintaining a high performance gearbox. Different factors can affect
lubrication oil and thus the performance of the WT.
Due to high thermal and mechanical stresses, gearbox lubrication oil
is subject to degradation including corrosion, and water and particle
contamination that affects the performance of the gearbox and hence the
overall performance of the WECS [76]. In addition, a deterioration in oil
quality can lead to the prediction of gear health condition and misalignments.
P a g e | 32
A combination of vibration and debris analysis provides an effective
condition monitoring technique for the oil [77]. Other studies investigate the
capabilities of acoustic emission, vibration, and spectrometric analysis of
lubrication oil when detecting the gearbox aging life cycle. Impulse vibration
signals and acoustic emission techniques have been successfully used to
monitor the condition of the gearbox oil [69, 78-83].
Power spectral analysis using, Fast Fourier Transform (FFT), is used
in [84-86] to extract the features of the measured gearbox vibration signal.
Oil degradation leads to high thermal stress, within the WT gearbox, that
increases bearing temperature and accelerates oil aging [3]. Peng et al [87],
investigate the effect of contaminated lubricant using wear debris and
vibration techniques to extend the life cycle of the wind turbine. Authors of
[88, 89] show that oil quality can be assessed through the measurement of
parameters such as its level of oxidation, acidity, viscosity, water content,
temperature and dissolved particles.
Figure 2.11 demonstrates the aging life cycle of the wind turbine’s
gearbox teeth and how different factors (e.g. viscosity, water, oxidation and
temperature) can cause scuffing and tooth thickness damage. Top quality oil
will improve gearbox defence, extend oil life, increase efficiency, and
improve seal capability as well as the output efficiency of the wind turbine.

P a g e | 33
Figure 2.11 Aging sequence of the gearbox teeth under incorrect
lubricant[90].
Table 2.1 summarises the advantages and limitations of some of the most
effective CM techniques used when monitoring the wind turbine gearbox.

P a g e | 34
Table 2.1 Typical condition monitoring techniques for the wind turbine
gearbox [21].
Condition Monitoring Effective Technique Used
for Gearbox
Vibration
Gearbox
Bearing
Shaft
Reliable Standradized
Direct measurement of
rotor load
Direct characterization of bearing condition
Torque
Rotor
Gear
Oil/Debris analysis
Bearing
Temperature
Bearing
Acoustic emission
Bearing
Gear
Stator
Current/Power
Bearing
Gear
Standardized (IEEE 841)
Able to detect early-stage fault
Good for low-speed operation
High signal-to-noise ratio
Frequency range far from load perturbation
No additional sensors needed
Inexpensive Non-intrusive Easy to implement
Expensive
Intrusive
Subject to sensor failures
Limited efficiency with low speed rotation
Expensive
Intrusive
Limited to bearing with closed-loop oil supply system
Expensive for online operation
Embedded temperature detector required
Other factors may cause same temperature rise
Expensive
Very high sampling rate
Displacement based rather than force based
Difficult to detect incipient faults
Sometimes low signal-to-noise ratio
P a g e | 35
2.10 Wind Turbine Blades
Turbine blades are the most visible part of the wind turbine. This
component plays a vital role in producing energy by transferring the wind’s
kinetic energy to a rotating mechanical energy [8]. Ciang et al illustrate that
the turbine blades are subject to mechanical faults with a probability of
about 70% [91].
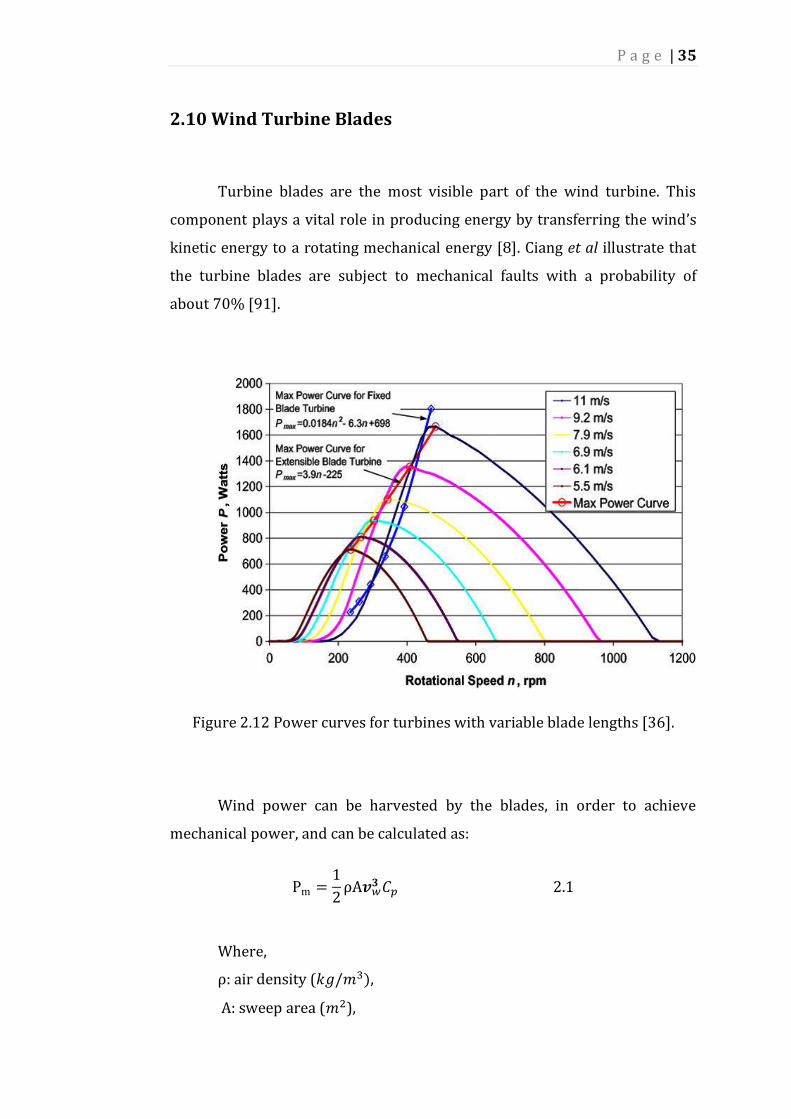
Figure 2.12 Power curves for turbines with variable blade lengths [36].
Wind power can be harvested by the blades, in order to achieve
mechanical power, and can be calculated as:
Pm =1
2ρA𝒗𝑤
𝟑 𝐶𝑝 2.1
Where,
ρ: air density (𝑘𝑔/𝑚3),
A: sweep area (𝑚2),

P a g e | 36
𝐶𝑝: power coefficient of the blade, and
𝑣𝑤: wind speed (m/s).
The maximum theoretical value for 𝐶𝑝 is 0.6, while the practical value
is between 0.4 to 0.5 (based on tip loss, profile loss and loss due to slow
rotation). The tip speed ratio (λ), is given by:
𝜆 =𝑢
𝑣𝑤=
𝐷
2.𝛺
𝑣𝑤 2.2
Where,
𝐷 : outer diameter of the rotor (m), and
𝛺: angular velocity of the rotor (rad/s).
As a result of the rotational speed of the rotor, the torque (𝑇) can be
obtained according to the equation below:
𝑇 =𝐶𝑝(𝜆)
𝜆.𝐷
2.
ρ
2𝐴𝑣𝑤
2 2.3
Modern wind turbine blades are generally made from fibre reinforced
plastics mixed with other materials such as plastic foam and wood. These
materials have the advantages of low cost and high mechanical strength [33,
34]. The wind turbine rotor should withstand a 108 stress cycle in 20 years of
its estimated life, taking into account both creep and corrosion [15]. Rotor
imbalance, which produces large stress and operational instability, affects
the blade performance.
If moisture attacks the blade’s surface, cyclical freezing may increase
the growth of any existing cracks. Icing, surface roughness and other faults
may also occur, while transportation has a negative effect on the blade’s
performance [15]. Maki et al illustrate that taller towers enhance the output
power by increasing the amount of wind captured by the swept area of the
rotor and as per the equation below:
P a g e | 37
𝑣 = 𝑣𝑟𝑒𝑓 (𝐻𝑢𝑏𝐻𝑡
𝐻𝑟𝑒𝑓)0.34
(2.4)
Where,
𝑣: wind speed at the hub (m/s),
𝑣𝑟𝑒𝑓 : reference wind speed at the reference hub height, and
𝐻𝑟𝑒𝑓 : reference hub height (m).
A power coefficient of 0.34 is suitable for neutrally stable air above
human inhabited areas [6]. Sharma et al [92] investigate the impact of a
variable blade’s length on wind turbine performance. Results show that
variable-length blades can capture almost twice that of the fixed-length
blades (as shown in Figure 2.12). Besnard and Lina [93] report on different
condition monitoring strategies for wind turbine blades, which include visual
inspection, ultrasonic or thermography techniques, and online condition
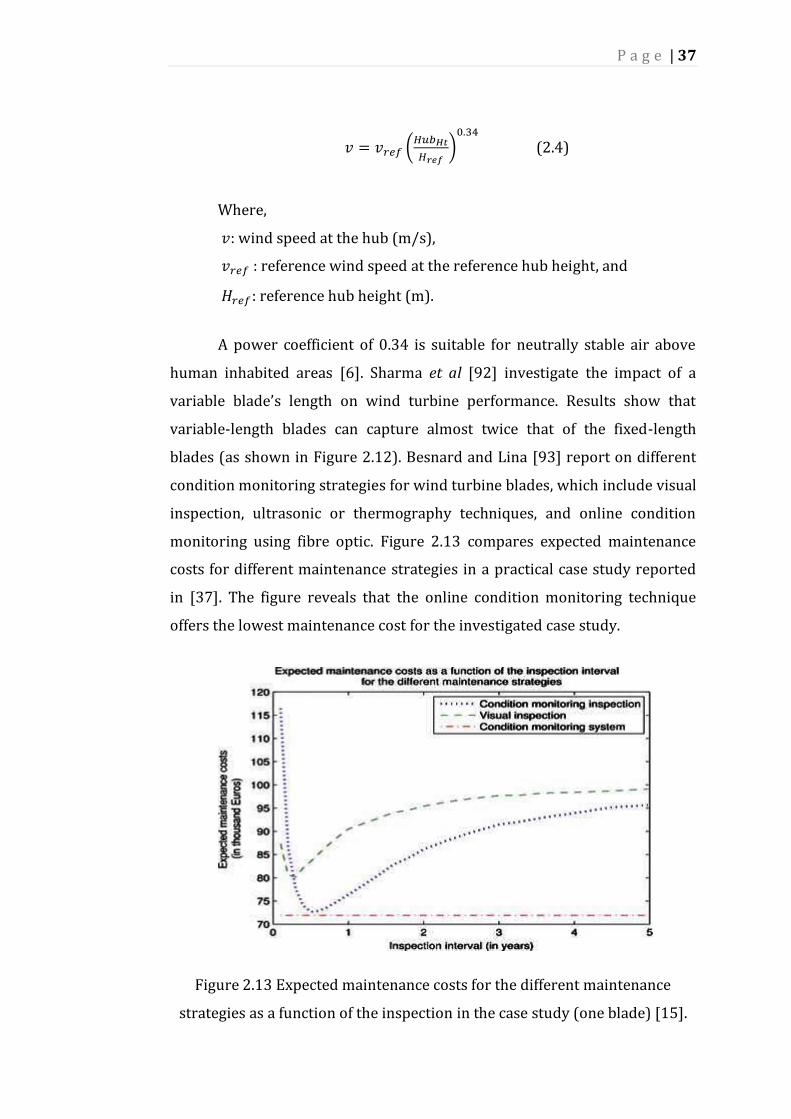
monitoring using fibre optic. Figure 2.13 compares expected maintenance
costs for different maintenance strategies in a practical case study reported
in [37]. The figure reveals that the online condition monitoring technique
offers the lowest maintenance cost for the investigated case study.
Figure 2.13 Expected maintenance costs for the different maintenance
strategies as a function of the inspection in the case study (one blade) [15].
P a g e | 38
Schubel et al [94] compares different methods of monitoring large
wind turbine blades, including the dielectric, acoustic, ultrasonic, and fibre
optic methods. The implementation of these methods face some difficulties.
This is especially true for the dielectric sensor method, as the sensor’s size
may affect the resin mechanical performance [95-98].
Factors that influence the output power of the wind turbine [23] are
the condition of the blades, dust accumulation, wind share and wind
shadowing. Thiringer and Linders examine a wind turbine with a fixed pitch
angle by controlling rotor progress [99]. Wu and Lai [100] estimate the
fatigue life for a small composite sandwich wind turbine blade by calculating
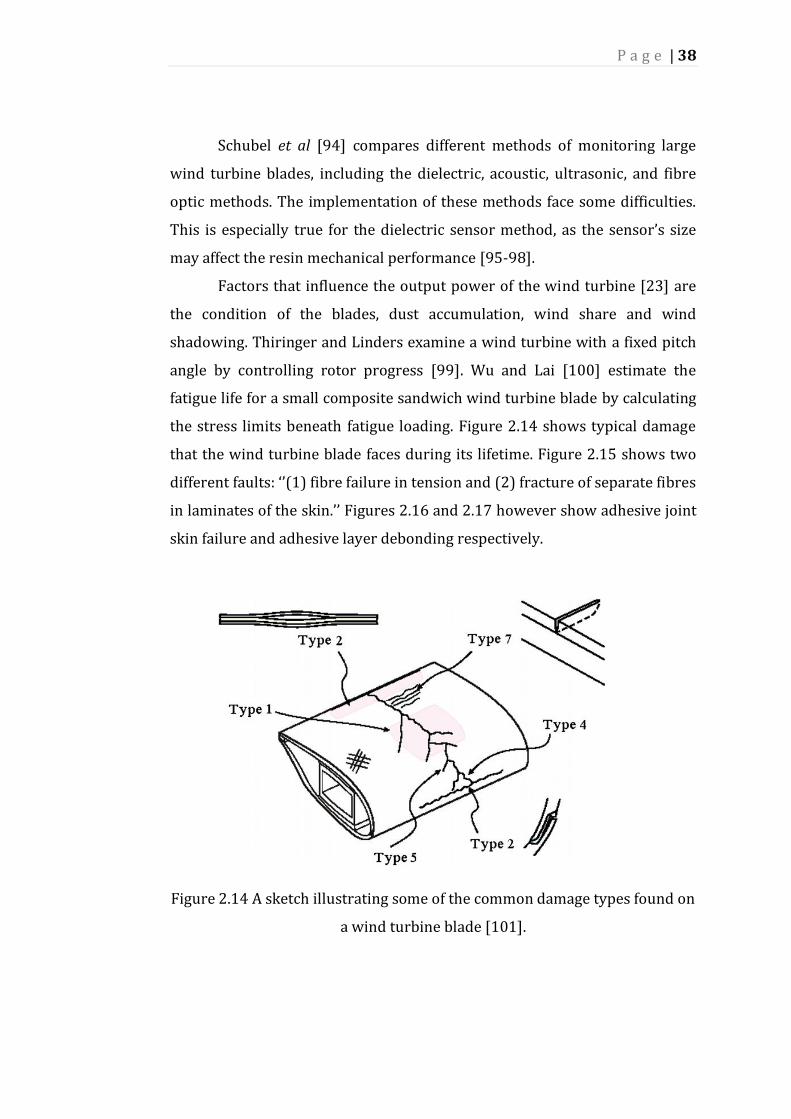
the stress limits beneath fatigue loading. Figure 2.14 shows typical damage
that the wind turbine blade faces during its lifetime. Figure 2.15 shows two
different faults: ‘’(1) fibre failure in tension and (2) fracture of separate fibres
in laminates of the skin.’’ Figures 2.16 and 2.17 however show adhesive joint
skin failure and adhesive layer debonding respectively.
Figure 2.14 A sketch illustrating some of the common damage types found on
a wind turbine blade [101].
P a g e | 39
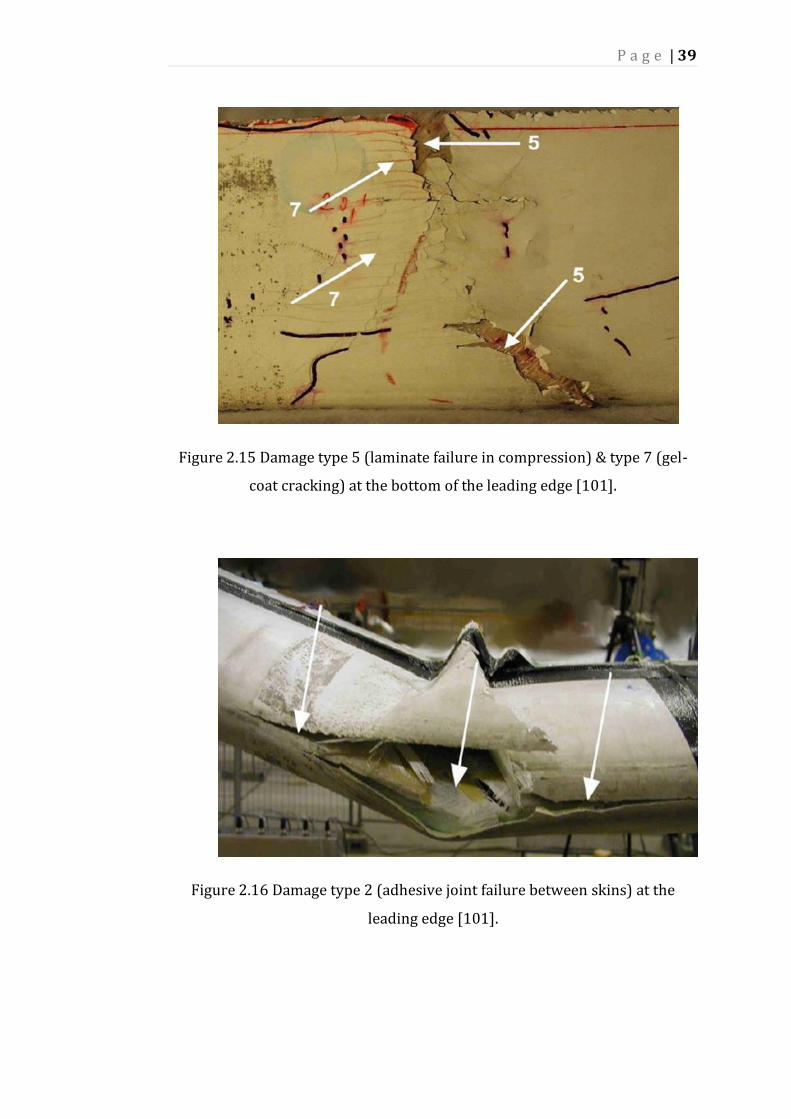
Figure 2.15 Damage type 5 (laminate failure in compression) & type 7 (gel-
coat cracking) at the bottom of the leading edge [101].
Figure 2.16 Damage type 2 (adhesive joint failure between skins) at the
leading edge [101].

P a g e | 40
Figure 2.17 Damage type 1 (main spar flange/adhesive layer debonding) and
type 4 (delamination by buckling load) [101].
2.10.1 Surface Roughness
When a surface is smooth it means air will flow much easier than over
a rough surface. A rough surface slows down the wind speed as a result of
friction stress.
Dust and pollution can affect the output efficiency of wind power,
reducing it to about 40% below its normal output in a clean environment.
Surface roughness has significant impact on the efficiency of the blade’s
leading edge and may cause trailing edge turbulence [101].
Wind turbines operate for most of their lifetime in unstable weather
conditions. As a result, forces on the blades vary, causing constructional
responses, blade flapping, wind shear and twisted flow. A variation in blade
flapping is the most common reason behind changes to the angle of attack on
WT blades [102]. According to [103], and based on various measurements,
the output efficiency of wind turbine blades is affected by the airfoil
thickness. A thickness of 25%, with less roughness sensitivity, is the best
specification for the blades. This is because a thicker airfoil has a high ‘’lift-to-

P a g e | 41
drag’’ ratio. Table 2 demonstrates different airfoil thicknesses and the effect
of roughness on the performance of the WT blades.
Table 2.2 Effect of roughness on performance for (about) 25%
thick airfoils [111].
Configuration clean "rough"
airfoil L/D-
max
cl-max L/D-
max
cl-max
Re= 3.0e6
DU
91-W2-250 (1)
127.6
1.37
61.8
1.16
NACA 63421-425
(1)
120 1.277 39 0.803*
AH 93-W-257 (2) 120.7 1.41 55 1.04
S 814(1) 114.1 1.408 61.4 1.357**
Re= 1.6e6
FFA-W3-241 (3) 81 1.37 48.5 1.16***
Ris0-A1-24 (3) 89 1.36 57 1.17***
(1) Delft (2) Stuttgart (3) Ris0
* at kink in lift curve
** grit roughness at upper surface x/c=0.02 and lower
surface x/c= 0.10
*** ZZ-tape at x/c= 0.05 upper surface and at x/c= 0.10 on lower
surface.
P a g e | 42
In [104], authors discuss the impact of clean and roughness
conditions on the airfoil blades using a numerical simulation method. They
find that both the drag coefficient and lift coefficient of an airfoil are affected
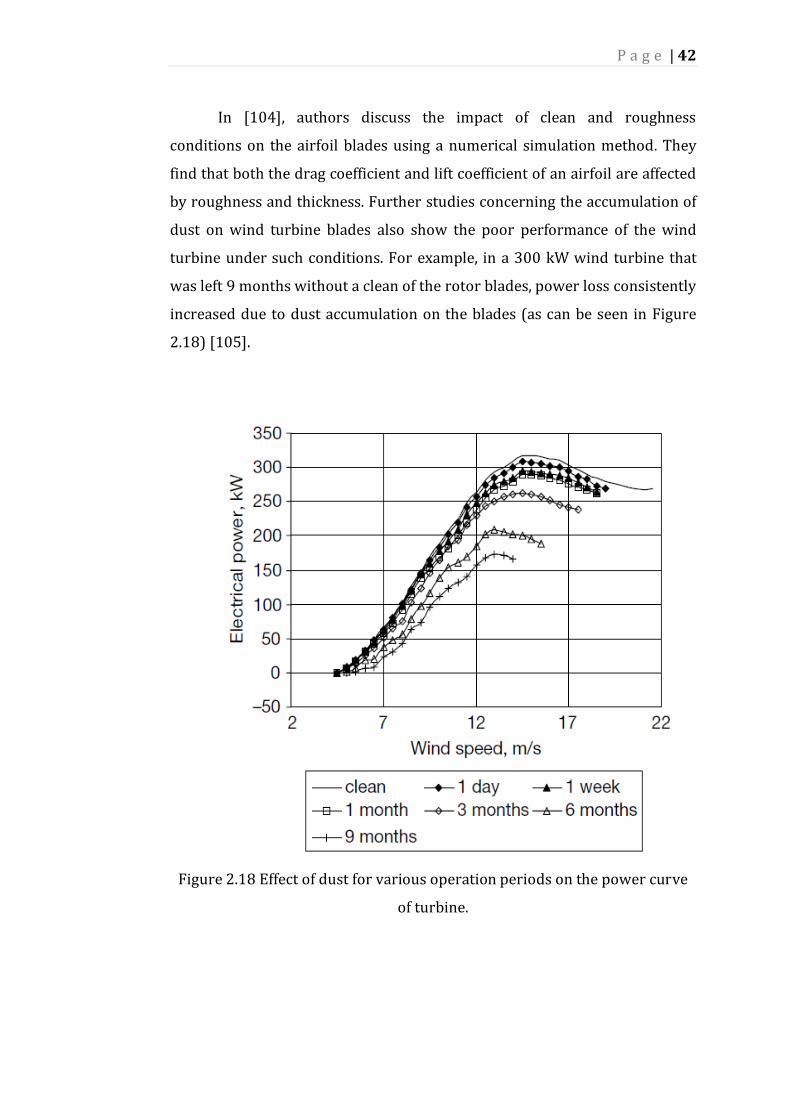
by roughness and thickness. Further studies concerning the accumulation of
dust on wind turbine blades also show the poor performance of the wind
turbine under such conditions. For example, in a 300 kW wind turbine that
was left 9 months without a clean of the rotor blades, power loss consistently
increased due to dust accumulation on the blades (as can be seen in Figure
2.18) [105].
Figure 2.18 Effect of dust for various operation periods on the power curve
of turbine.

P a g e | 43
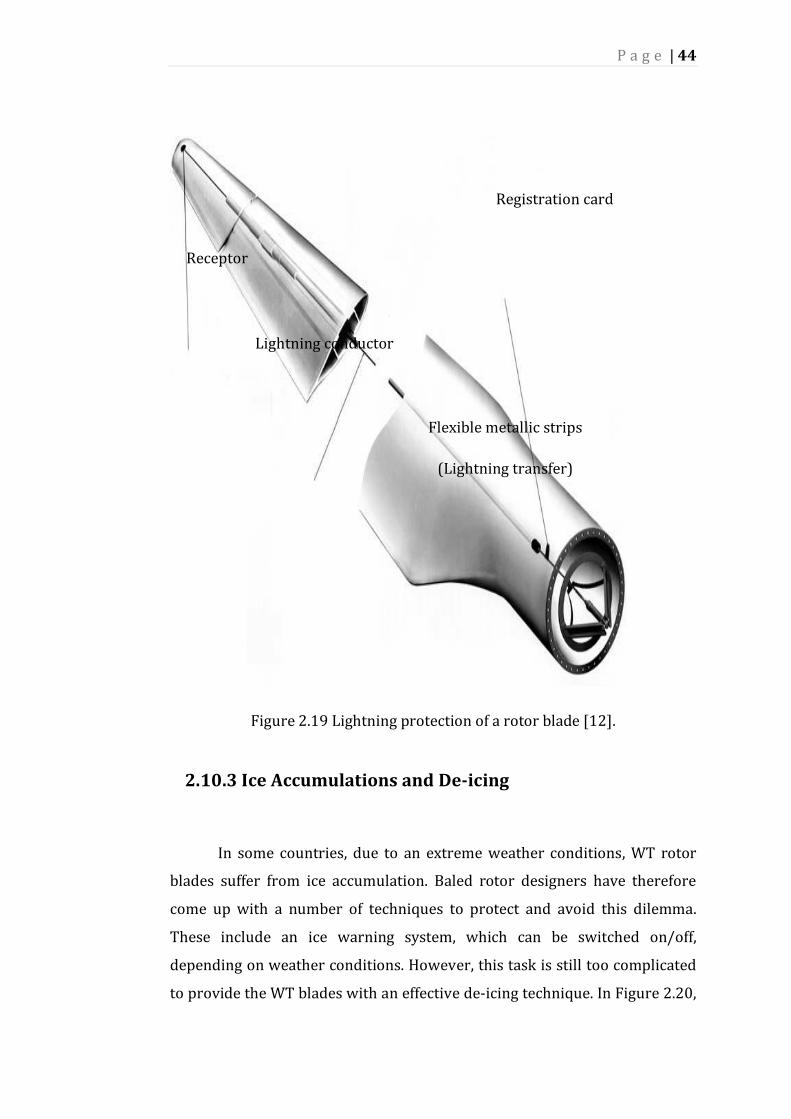
2.10.2 Lightning Protection
Lightning, which usually hits the blade tip area, is one of the most
common problems facing WT rotor blades. In the past, it was thought that
fibre glass blades would not be affected by lightning, but this has been found
to be false in real life operation.
A lightning system is essential for protection of the rotor blades,
especially as WT sizes become larger. Nowadays, this kind of protection has
become a standard design feature of wind turbine blades. The main
component of this lightning system is the receptor at the blade tip (as can be
seen in Figure 2.19). This receptor is made from metal material and screwed
to the blades. It can also be easily changed. Inside the blade, a solid wire runs
through the whole blade, from tip to base. This wire acts as a lightning
conductor and meets the flexible metallic strips at the base of the blade and,
from there, the earthing system of the WT.
P a g e | 44
Figure 2.19 Lightning protection of a rotor blade [12].
2.10.3 Ice Accumulations and De-icing
In some countries, due to an extreme weather conditions, WT rotor
blades suffer from ice accumulation. Baled rotor designers have therefore
come up with a number of techniques to protect and avoid this dilemma.
These include an ice warning system, which can be switched on/off,
depending on weather conditions. However, this task is still too complicated
to provide the WT blades with an effective de-icing technique. In Figure 2.20,
Receptor
Lightning conductor
Registration card
Flexible metallic strips
(Lightning transfer)
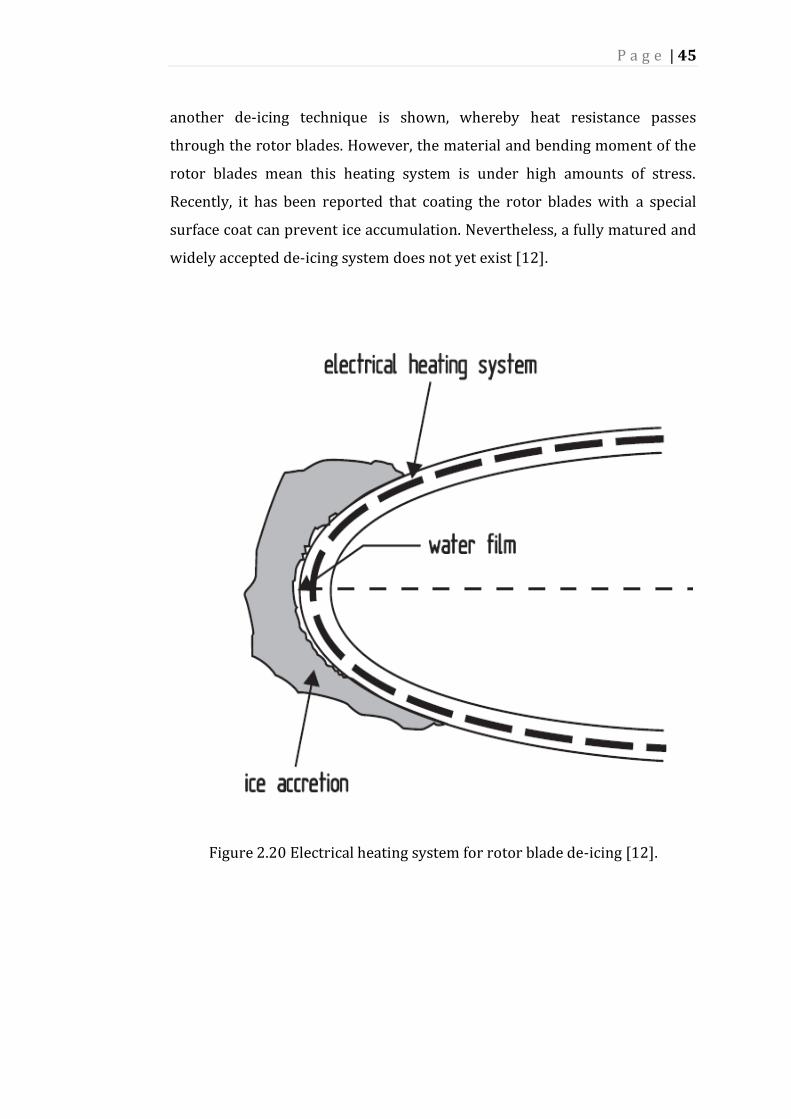
P a g e | 45
another de-icing technique is shown, whereby heat resistance passes
through the rotor blades. However, the material and bending moment of the
rotor blades mean this heating system is under high amounts of stress.
Recently, it has been reported that coating the rotor blades with a special
surface coat can prevent ice accumulation. Nevertheless, a fully matured and
widely accepted de-icing system does not yet exist [12].
Figure 2.20 Electrical heating system for rotor blade de-icing [12].
P a g e | 46
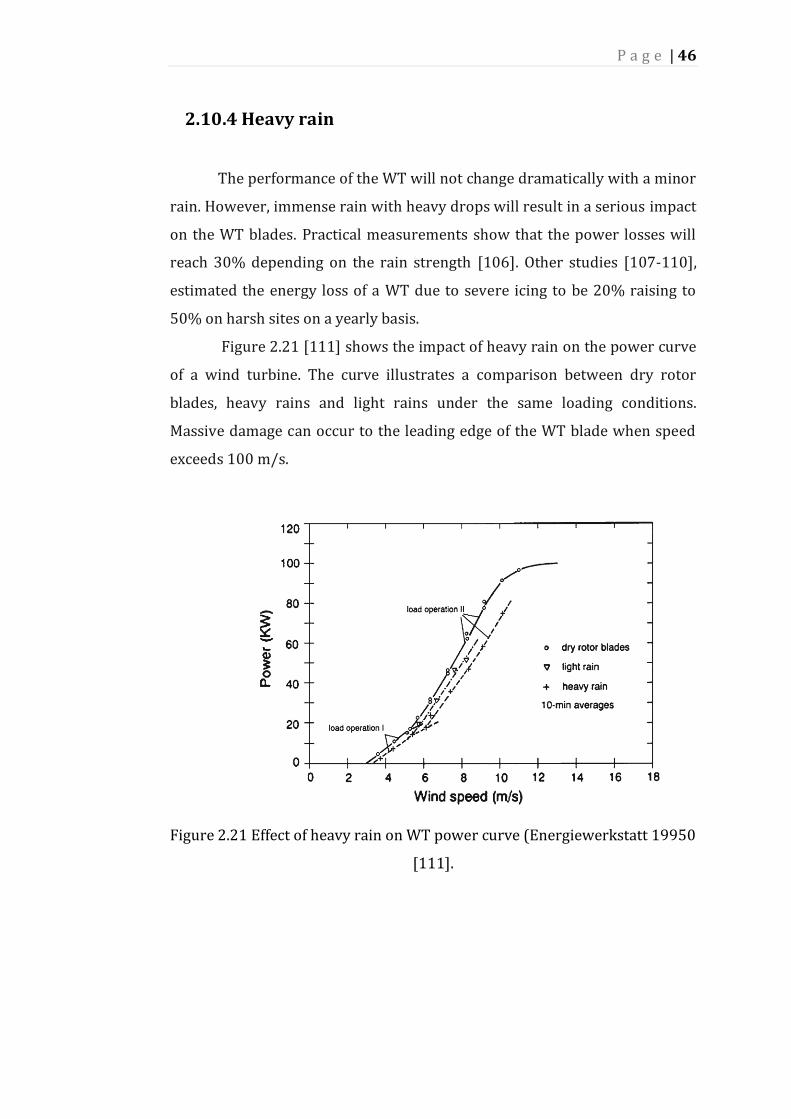
2.10.4 Heavy rain
The performance of the WT will not change dramatically with a minor
rain. However, immense rain with heavy drops will result in a serious impact
on the WT blades. Practical measurements show that the power losses will
reach 30% depending on the rain strength [106]. Other studies [107-110],
estimated the energy loss of a WT due to severe icing to be 20% raising to
50% on harsh sites on a yearly basis.
Figure 2.21 [111] shows the impact of heavy rain on the power curve
of a wind turbine. The curve illustrates a comparison between dry rotor
blades, heavy rains and light rains under the same loading conditions.
Massive damage can occur to the leading edge of the WT blade when speed
exceeds 100 m/s.
Figure 2.21 Effect of heavy rain on WT power curve (Energiewerkstatt 19950
[111].

P a g e | 47
Chapter 3 Signal Processing
Techniques for Condition
Monitoring
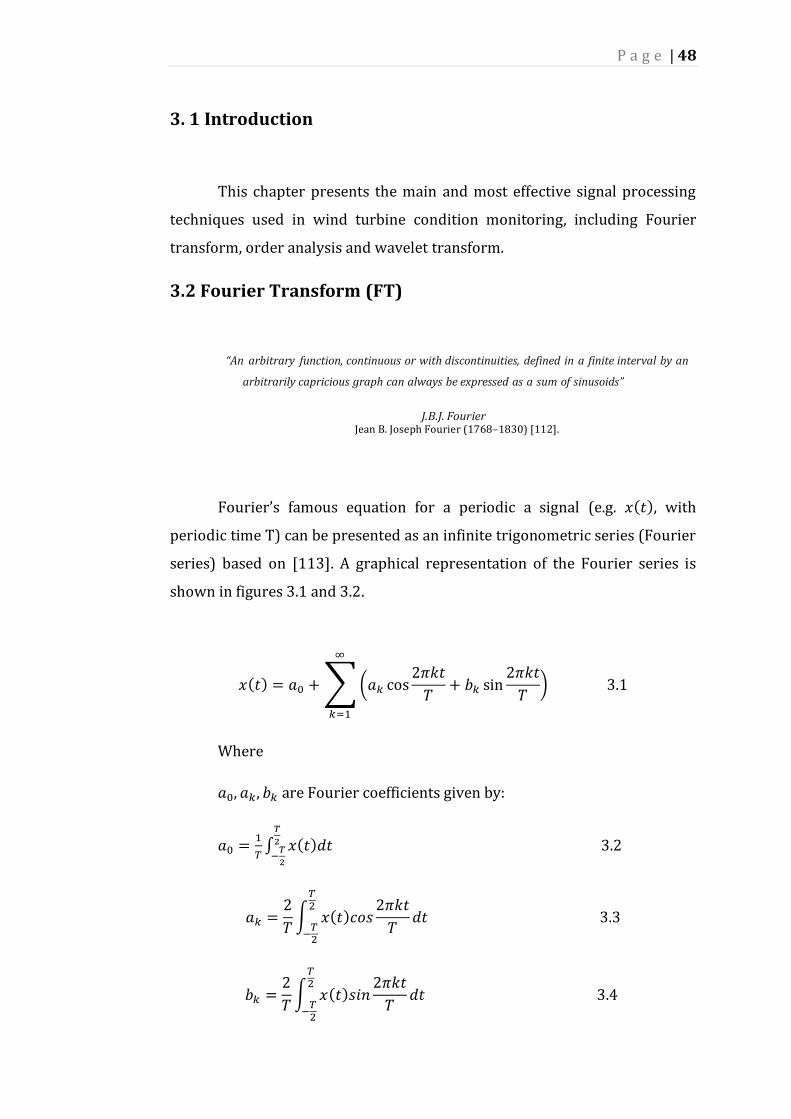
P a g e | 48
3. 1 Introduction
This chapter presents the main and most effective signal processing
techniques used in wind turbine condition monitoring, including Fourier
transform, order analysis and wavelet transform.
3.2 Fourier Transform (FT)
“An arbitrary function, continuous or with discontinuities, defined in a finite interval by an
arbitrarily capricious graph can always be expressed as a sum of sinusoids”
J.B.J. Fourier Jean B. Joseph Fourier (1768–1830) [112].
Fourier’s famous equation for a periodic a signal (e.g. 𝑥(𝑡), with
periodic time T) can be presented as an infinite trigonometric series (Fourier
series) based on [113]. A graphical representation of the Fourier series is
shown in figures 3.1 and 3.2.
𝑥(𝑡) = 𝑎0 +∑(𝑎𝑘 cos2𝜋𝑘𝑡
𝑇+ 𝑏𝑘 sin
2𝜋𝑘𝑡
𝑇)
∞
𝑘=1
3.1
Where
𝑎0, 𝑎𝑘, 𝑏𝑘 are Fourier coefficients given by:
𝑎0 =1
𝑇∫ 𝑥(𝑡)𝑑𝑡𝑇
2
−𝑇
2
3.2
𝑎𝑘 =2
𝑇∫ 𝑥(𝑡)𝑐𝑜𝑠
2𝜋𝑘𝑡
𝑇𝑑𝑡
𝑇2
−𝑇2
3.3
𝑏𝑘 =2
𝑇∫ 𝑥(𝑡)𝑠𝑖𝑛
2𝜋𝑘𝑡
𝑇𝑑𝑡
𝑇2
−𝑇2
3.4

P a g e | 49
𝑥(𝑡)
𝑡
T
Figure 3.1 A periodic signal
Figure 3.2 Fourier coefficients [113].
P a g e | 50
3.2.1 Spectral Averaging-based FT
Spectral averaging-based FT is one of the techniques used to prevent
the corruption of weak frequency components mixed with unwanted noise,
which is one of the limitations of FT. A previous study by Combet at al [52]
shows that sideband ratio features are also effective in detecting the health
condition of a rotating machine because they are less affected by load
variations. A more traditional technique is Time Domain Averaging (TDA),
which is used to detect faulty signals in rotating machine industries, and
achieved by extracting the periodic component from a raw signal. A TDA
pattern has been proposed by [114] to diagnose gearbox failures. [115]. In
[116], the oscillation of electric power is used by means of an angular data
clustering technique, and by doing so, the oscillation of the electric power in
the time domain becomes mapped into a discrete waveform in an angular
domain.
3.2.2 Discreet Fourier Transform (DFT)
DFT is a discreet version of a continuous time signal. FT of a signal
𝑓(𝑡) can be expressed as:
𝐹(𝑤) =1
√2𝜋∫ 𝑓(𝑡)∞
∞𝑒−𝑗𝑤𝑡𝑑𝑡 3.5
Where,
𝑤 is the angular frequency, and the invers FT of the same signal can
be written as:
𝑓(𝑡) =1
√2𝜋∫ 𝐹(𝑤)∞
∞𝑒𝑗𝑤𝑡𝑑𝑤 3.6
P a g e | 51
Both Eq. (3.5 and 3.6) confirm that FT for a signal is a superposition of
sinusoidal components of all probable amplitudes and frequencies of the
signal. Consequently, FT has the ability to extract the frequency statistics of a
time signal and obtain the “strength/energy of a particular frequency
component”.
In real application, the signal data is not continuous but instead
sampled at a specific frequency 𝑓(𝑠). Discrete Fourier Transform of the
sampled data in Eq. 3.5 (and its invers 3.6) is shown in 3.7 and 3.8
respectively:
𝐹(𝑘) = 1
𝑁∑ 𝑓[𝑛]𝑒−𝑗
2𝜋𝑘𝑛𝑁
𝑁−1
𝑛=0
3.7
𝑓(𝑛) = 1
𝑁∑𝐹(𝑘)𝑒𝑗
2𝜋𝑘𝑛𝑁
𝑁−1
𝑛=0
3.8
Where N represents the sample number of 𝑓(𝑛) and 𝑘 = 0, 1, 2 N-1
The sampled data shows one to one mapping (a distinctive
representation), but this is not always the case. This is proved in [117],
where further details can be found.
Discrete Fourier Transform has limitations, such as aliasing
phenomena and leakage. Aliasing is when the initial samples are not suitably
narrow-spaced to characterise the high frequency orders that appear in the
underlying function. DFT data becomes inaccurate and aliasing will take
place. However, to minimise these high frequencies, a pre-filter should be
used. Leakage, a second limitation of DFT, is when a finite amount of data and
a finite size of frequencies, when combined, result in frequency energy that is
performed over a range of frequency intervals (-∞ 𝑡𝑜 + ∞).

P a g e | 52
3.2.3 Order Analysis-based FFT
Order tracking analysis is one of the vibration analysis techniques
suitable for tracking the machine’s health condition [118]. Fluctuating load
conditions and deformity in the rotating machines cause constrained
vibrations. By involving spectra and time histories, with the speed of the
moving parts, order analysis can detect the vibration of fluctuating loads,
critical speeds, and unstable actions [118]. Order tracking of the spectrum is
a method used to analyse the vibration signal, based on related spectral
components, rising with the instantaneous rotating speed. When the
collected vibration data comprises of numerous spectral components with
significant rotational speed variations during measurement time, the
processed signal is unclear and challenging to analyse. This then leads to
misinterpretation [119]. A comprehensive discussion and further detail,
including the strengths and limitations of the order analysis technique, are
presented in [120, 121]. Eggers at al [122] prove that Computed Order
Tracking (COT) can effectively identify and detect faults within the pinion
gear in the gearbox. However, order tracking requires the collected vibration
signal from the machine to be sampled at fixed angular increments, which
means the shaft speed should be proportional to the sampling rate. Without
extra specified equipment, such as a ratio synthesiser and an anti-aliasing
tracking filter, the measured signal will not be accurate [118]. Figure 3.3
explains the stages of the order tracking system for the vibration signal
based on different models.
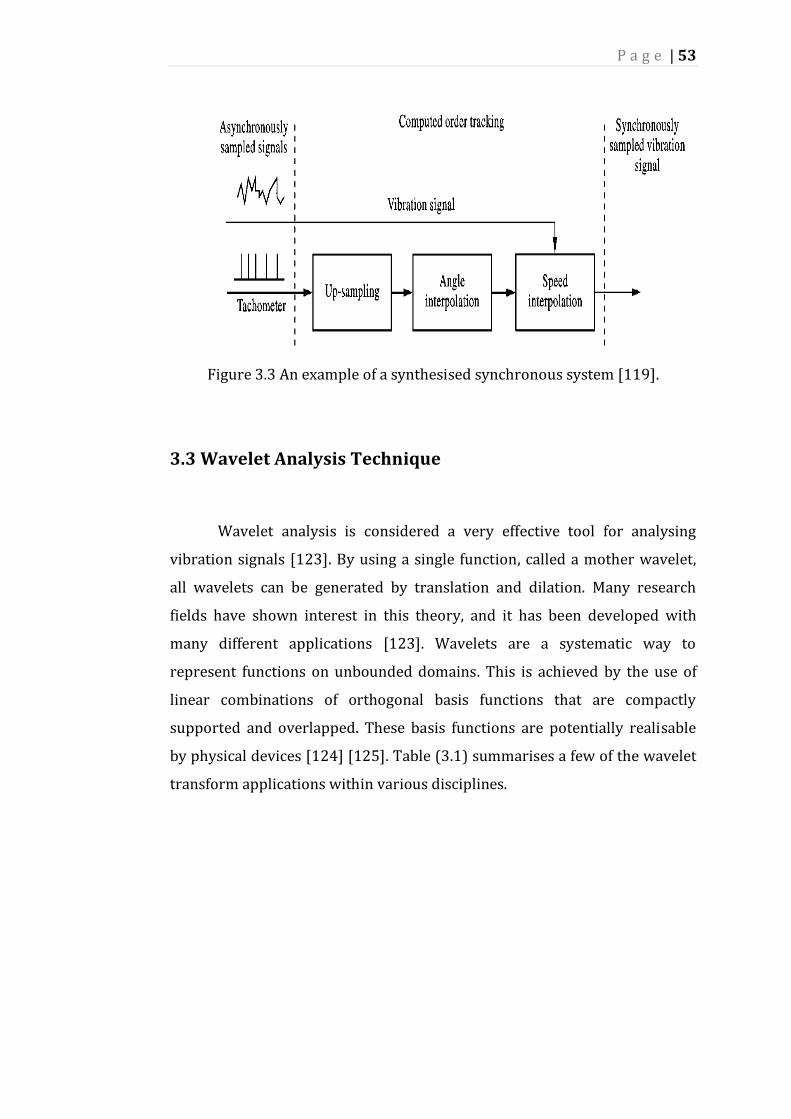
P a g e | 53
Figure 3.3 An example of a synthesised synchronous system [119].
3.3 Wavelet Analysis Technique
Wavelet analysis is considered a very effective tool for analysing
vibration signals [123]. By using a single function, called a mother wavelet,
all wavelets can be generated by translation and dilation. Many research
fields have shown interest in this theory, and it has been developed with
many different applications [123]. Wavelets are a systematic way to
represent functions on unbounded domains. This is achieved by the use of
linear combinations of orthogonal basis functions that are compactly
supported and overlapped. These basis functions are potentially realisable
by physical devices [124] [125]. Table (3.1) summarises a few of the wavelet
transform applications within various disciplines.
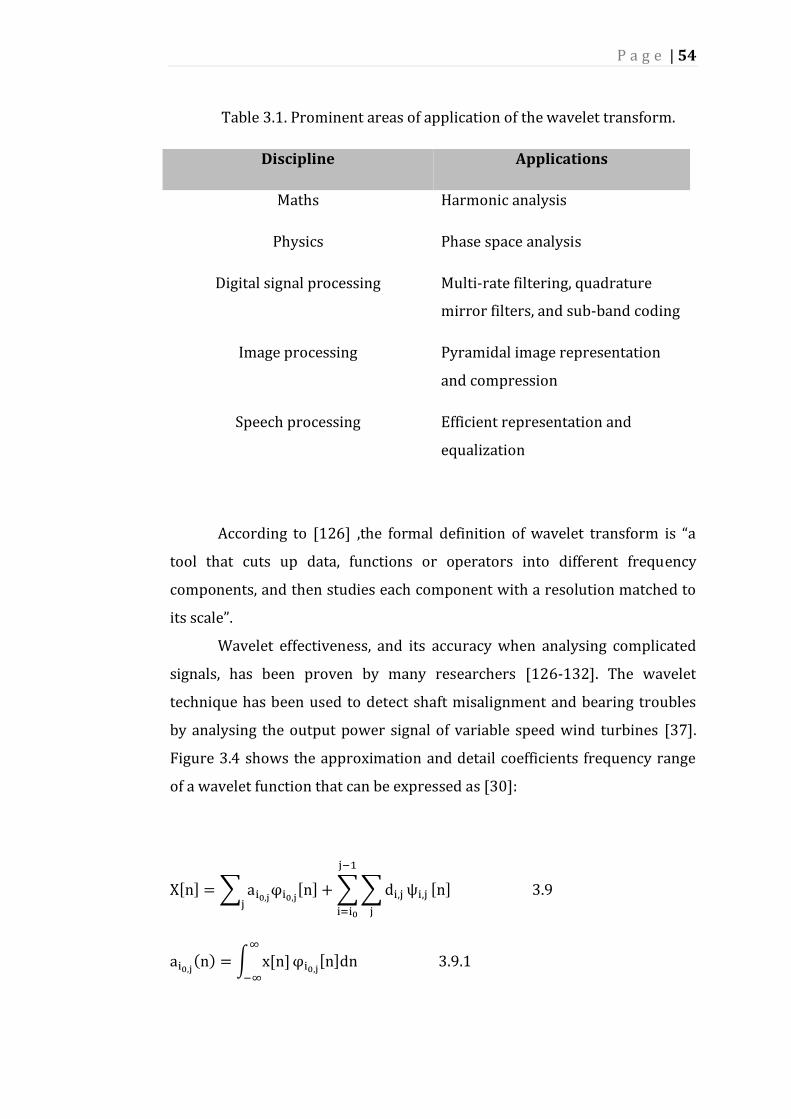
P a g e | 54
Table 3.1. Prominent areas of application of the wavelet transform.
Discipline Applications
Maths Harmonic analysis
Physics Phase space analysis
Digital signal processing Multi-rate filtering, quadrature
mirror filters, and sub-band coding
Image processing Pyramidal image representation
and compression
Speech processing Efficient representation and
equalization
According to [126] ,the formal definition of wavelet transform is “a
tool that cuts up data, functions or operators into different frequency
components, and then studies each component with a resolution matched to
its scale”.
Wavelet effectiveness, and its accuracy when analysing complicated
signals, has been proven by many researchers [126-132]. The wavelet
technique has been used to detect shaft misalignment and bearing troubles
by analysing the output power signal of variable speed wind turbines [37].
Figure 3.4 shows the approximation and detail coefficients frequency range
of a wavelet function that can be expressed as [30]:
X[n] = ∑ ai0,jφi0,j[n] +∑∑di,jj
ψi,j
j−1
i=i0j
[n] 3.9
ai0,j(n) = ∫ x[n]∞
−∞
φi0,j[n]dn 3.9.1

P a g e | 55
di,j(n) = ∫ x[n]∞
−∞ψi,jdn 3.9.2
Figure 3.4 Frequency range includes the details and approximation
coefficients
Where,
ψ [n]: the mother wavelet, and
φi,j[n] = 2i02φ(2i0n − j) : scaling functions at a scale of
s = 2i0 shifted by j.
Similarly,
ψi,j[n] = 2i
2ψ(2in − j) : the mother wavelet at a scale of
s = 2i0 shifted by j ai0,j : approximation coefficients at a scale of
s = 2i0 , and
di,j: detail coefficients at a scale of s = 2i
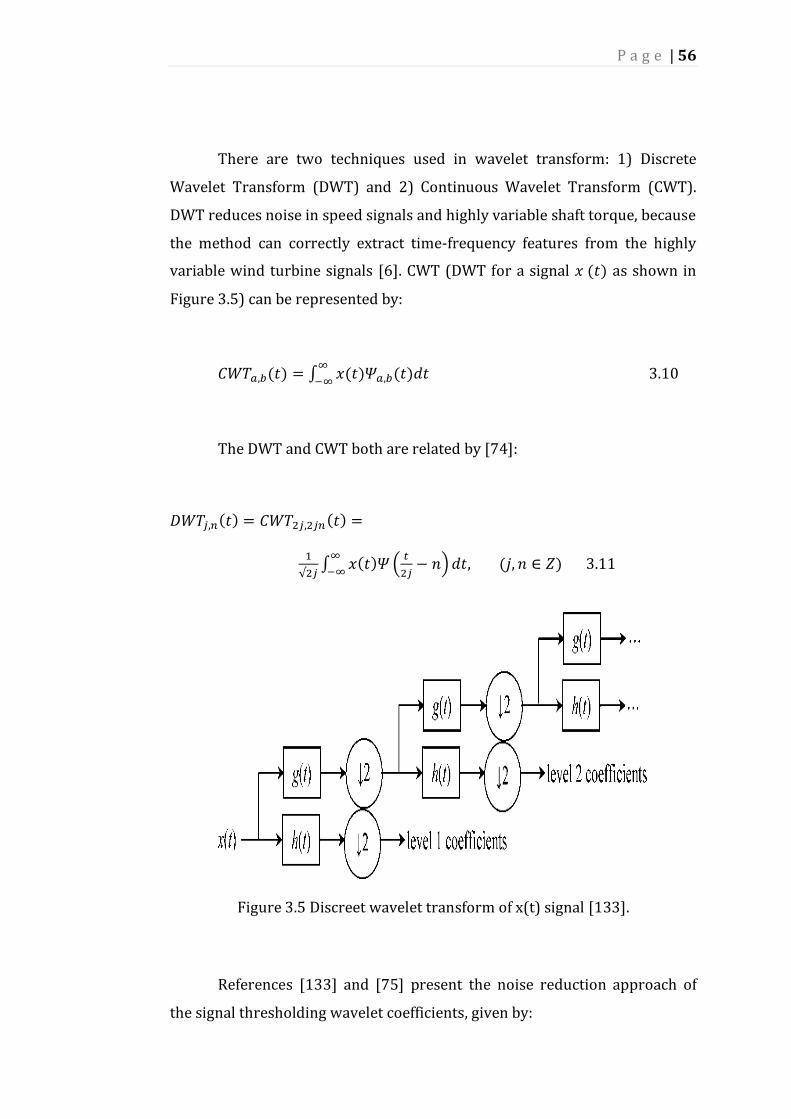
P a g e | 56
There are two techniques used in wavelet transform: 1) Discrete
Wavelet Transform (DWT) and 2) Continuous Wavelet Transform (CWT).
DWT reduces noise in speed signals and highly variable shaft torque, because
the method can correctly extract time-frequency features from the highly
variable wind turbine signals [6]. CWT (DWT for a signal 𝑥 (𝑡) as shown in
Figure 3.5) can be represented by:
𝐶𝑊𝑇𝑎,𝑏(𝑡) = ∫ 𝑥(𝑡)𝛹𝑎,𝑏(𝑡)𝑑𝑡∞
−∞ 3.10
The DWT and CWT both are related by [74]:
𝐷𝑊𝑇𝑗,𝑛(𝑡) = 𝐶𝑊𝑇2𝑗,2𝑗𝑛(𝑡) =
1
√2𝑗∫ 𝑥(𝑡)𝛹 (
𝑡
2𝑗− 𝑛)𝑑𝑡, (𝑗, 𝑛 ∈ 𝑍)
∞
−∞ 3.11
Figure 3.5 Discreet wavelet transform of x(t) signal [133].
References [133] and [75] present the noise reduction approach of
the signal thresholding wavelet coefficients, given by:

P a g e | 57
-First Hard Thresholding
�̂�𝑗,𝑛(𝑡) = {𝑑𝑗,𝑛(𝑡) 𝑖𝑓 |𝑑𝑗,𝑛(𝑡)| > 𝜃
0 𝑖𝑓 |𝑑𝑗,𝑛(𝑡)| ≤ 𝜃 3.12
-Second Soft Thresholding
�̂�𝑗,𝑛(𝑡) =
{
0
�̂�j,n(t) − θ if |dj,n(t)| > θ
if |𝑑𝑗,𝑛(𝑡)| ≤ 𝜃
dj,n(t) + θ if |dj,n(t)| < θ
3.13
Where
�̂�𝑗,𝑛(𝑡) are the thresholded values of 𝑑𝑗,𝑛(𝑡).
θ Can be calculated as
θ = σ√2log (𝐿)
Where
σ : t estimated noise level, and
L : number of coefficients in the same level.
Thus, the main de-noised signal can be built using the following
equation:
�̂�(𝑡) = ∑ �̂�0,𝑛∞𝑛=−∞ (𝑡)g0,𝑛(𝑡) + ∑ ∑ �̂�𝑗,𝑛(𝑡)ℎ𝑗,𝑛(𝑡)
∞𝑛=−∞
∞𝑗=0 3.14
Calculation of �̂�0,𝑛(𝑡) is similar to �̂�𝑗,𝑛(𝑡). Investigative work has found
that the hard thresholding approach is easier to calculate, and using a fixed
threshold amount will result in cut-offs in the de-noised signal.

P a g e | 58
For example, a high-order wavelet (Daubechies 14) is capable of
minimising the overlap between frequency bands. Due to the ability of
discrete wavelet transform to correctly localise frequencies with accurate
time locations, any unforeseen transient variations that could take place
within any steady-state regime can be detected by this application [134]. The
harmonic wavelet transform offers many advantages at reduced complexity.
The use of orthogonal wavelet families result in no redundancy, which means
N data points produce N wavelet amplitudes [113]. Wavelet common
function families — Daubechies family, Coiflets family and the Symlet family
are illustrated in Figure 3.7 [135].
Figure 3.6 Wavelet transform mother function principle.
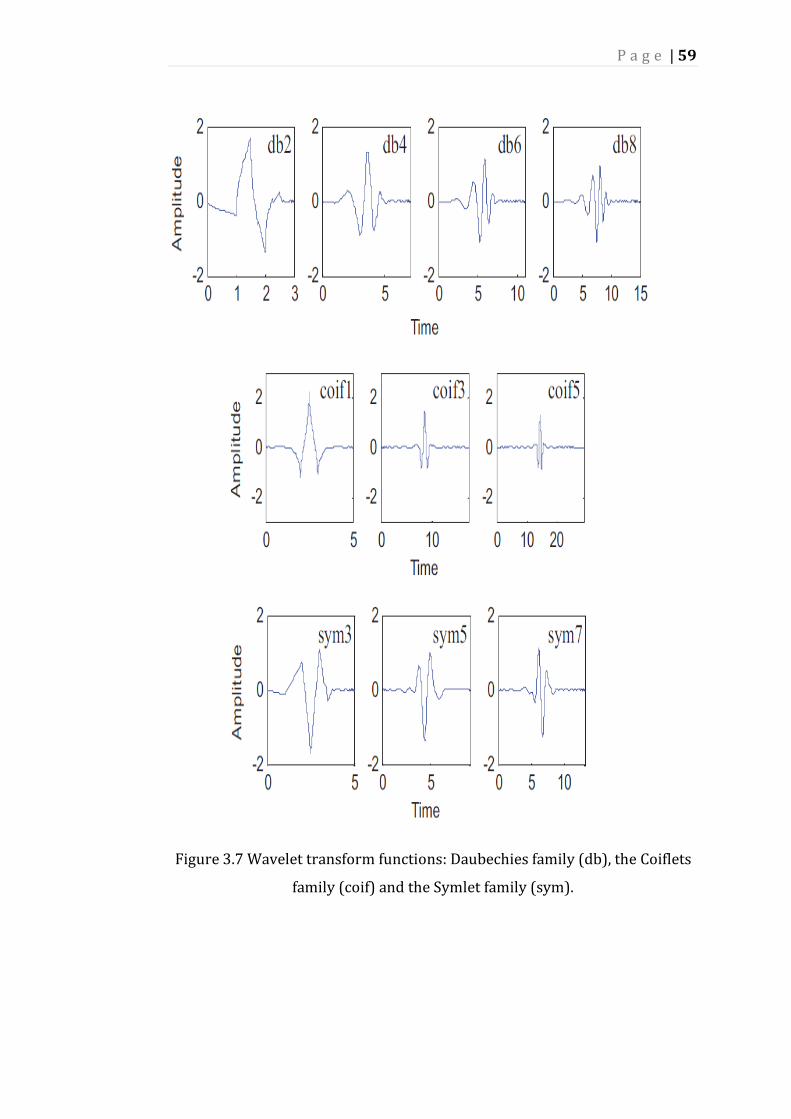
P a g e | 59
Figure 3.7 Wavelet transform functions: Daubechies family (db), the Coiflets
family (coif) and the Symlet family (sym).
P a g e | 60
Discrete wavelet transform has been applied to different signal
classifications and power quality applications in [124] and [136-139]. Mallat
[140] developed a new technique, in wavelet transform, to detect multi-
resolution signal decomposition, which helps when analysing the
information content of images. Daubechies [141] provides a full description
of different wavelet transform applications, focusing on time-frequency
localisation and signal analysis.
According to [142], the decomposition levels can be tested and
calculated based on the following formula:
nd >Log(
fsf⁄ )
Log(2)+ 1 3.15
Where
fs: sampling frequencies, and
f : supply frequencies
3.3.1 Wavelet and Fourier Transform Correlation
Based on [123]:
ℱ[𝛹𝑏,𝑎(𝑥)] =1
√|𝑎|∫ 𝑒−𝑖𝑥𝑦∞
−∞
𝛹 (𝑥 − 𝑏
𝑎)𝑑𝑥
= ∫ 𝑒−𝑖(𝑏+𝑎𝑧)𝑦∞
−∞𝛹(𝑧)
𝑎
√|𝑎|𝑑𝑧; 3.16
So that:
ℱ[𝛹𝑏,𝑎(𝑥)] =𝑎
√|𝑎|𝑒−𝑖𝑏𝑦�̂�(𝑎𝑦) 3.16.1
By using the Parseval formula below (3.17) and substituting n=1:

P a g e | 61
(𝑓, 𝘨) = (1
2𝜋)𝑛
(𝑓,̂ �̂�) 3.17
(𝑊𝛹 𝑓)(𝑏, 𝑎) = (𝑓,𝛹𝑏,𝑎) =1
2𝜋(𝑓,̂ �̂�𝑏,𝑎) 3.18
=𝑎|𝑎|−
12
2𝜋∫ 𝑓 ̂∞
−∞
(𝜔)𝑒𝑖𝑏𝜔�̂�(𝑎𝜔)̅̅ ̅̅ ̅̅ ̅̅ ̅𝑑𝜔
= 𝑎|𝑎|−12ℱ−1[𝑓 ̂(𝜔)�̂�(𝑎𝜔)̅̅ ̅̅ ̅̅ ̅̅ ̅ ](𝑏, 𝑎) 3.19
Hence:
ℱ[(𝑊𝛹𝑓)(𝑏, 𝑎)](𝜔) = 𝑎|𝑎|−1
2 𝑓 ̂(𝜔)�̂�(𝑎𝜔).̅̅ ̅̅ ̅̅ ̅̅ ̅̅ 3.20
The relation shown in 3.16 holds in general, for 𝑓 ∊ 𝐿𝑝(ℝ) 𝑎𝑛𝑑 𝛹 ∊
𝐿𝑞(ℝ)
Where 1+1/ 𝑟 =1/ 𝑝 +1/ 𝑞 and 1≤ 𝑝,𝑞, 𝑟 ≤2
Some other special techniques used in WT condition monitoring are
summarised in Table 3.2.
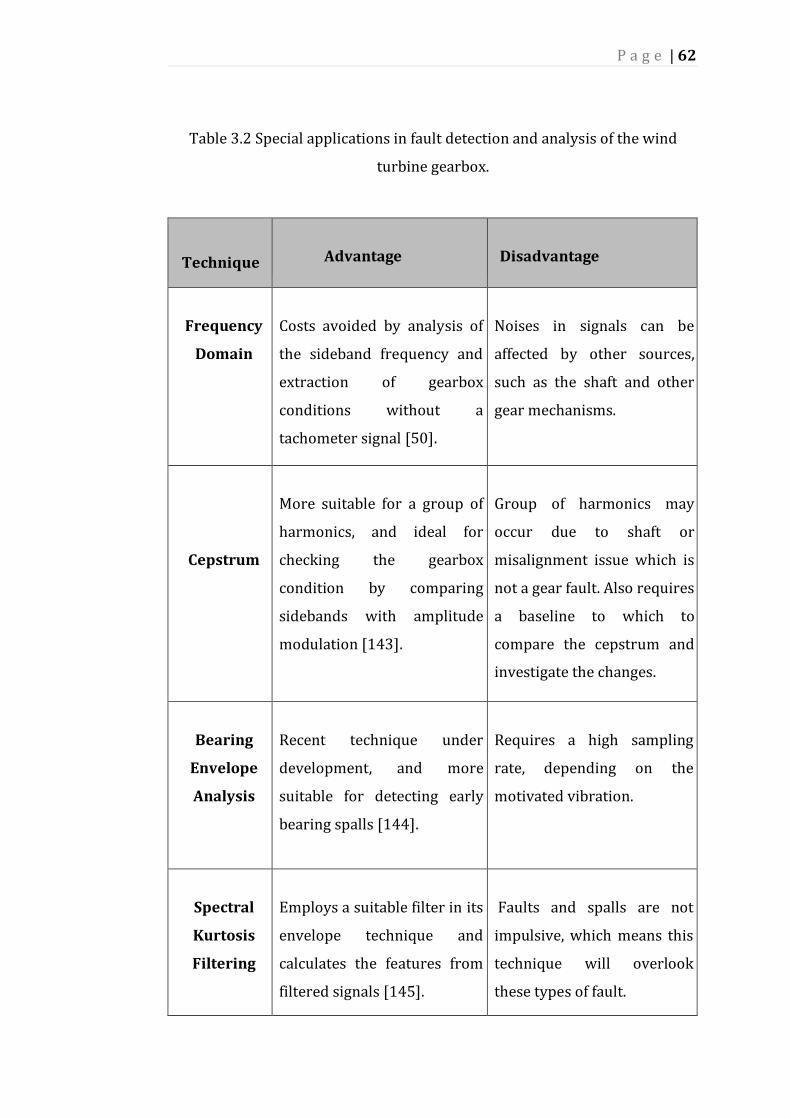
P a g e | 62
Table 3.2 Special applications in fault detection and analysis of the wind
turbine gearbox.
Technique
Advantage
Disadvantage
Frequency
Domain
Costs avoided by analysis of
the sideband frequency and
extraction of gearbox
conditions without a
tachometer signal [50].
Noises in signals can be
affected by other sources,
such as the shaft and other
gear mechanisms.
Cepstrum
More suitable for a group of
harmonics, and ideal for
checking the gearbox
condition by comparing
sidebands with amplitude
modulation [143].
Group of harmonics may
occur due to shaft or
misalignment issue which is
not a gear fault. Also requires
a baseline to which to
compare the cepstrum and
investigate the changes.
Bearing
Envelope
Analysis
Recent technique under
development, and more
suitable for detecting early
bearing spalls [144].
Requires a high sampling
rate, depending on the
motivated vibration.
Spectral
Kurtosis
Filtering
Employs a suitable filter in its
envelope technique and
calculates the features from
filtered signals [145].
Faults and spalls are not
impulsive, which means this
technique will overlook
these types of fault.

P a g e | 63
Time
Synchronous
Averaging
Effective for vibrations
synchronous with shaft.
Comparing the amplitude
with phase modulation will
result in identification of a
soft tooth, and residual
signals may follow the
irregularities in normal
meshing [146].
Specific tachometer required
for carrying out the
synchronous averaging.
Takes a long time to read the
samples for averaging, due to
low shaft speed.
Planet
Separation
Method
Particular algorithm
considered for carrying
out synchronous averaging
for planetary gearboxes
[147], which allows the
gearbox condition to be
analysed in detail.
Long acquisition time, and
requires a specific
tachometer for arranging the
data (taking into account the
rotations process, which has
to be collected for
averaging).

P a g e | 64
Chpater 4 Experim-
ental Test Rig Setup

P a g e | 65
4.1 Introduction
In this chapter, the hardware set-up used to conduct the experimental
measurements is presented. Figure 4.1 demonstrates the test rig components
used in investigating various failure modes of real wind turbines.
Components of the developed test rig are briefly presented below:
Figure 4.1 Test rig configuration
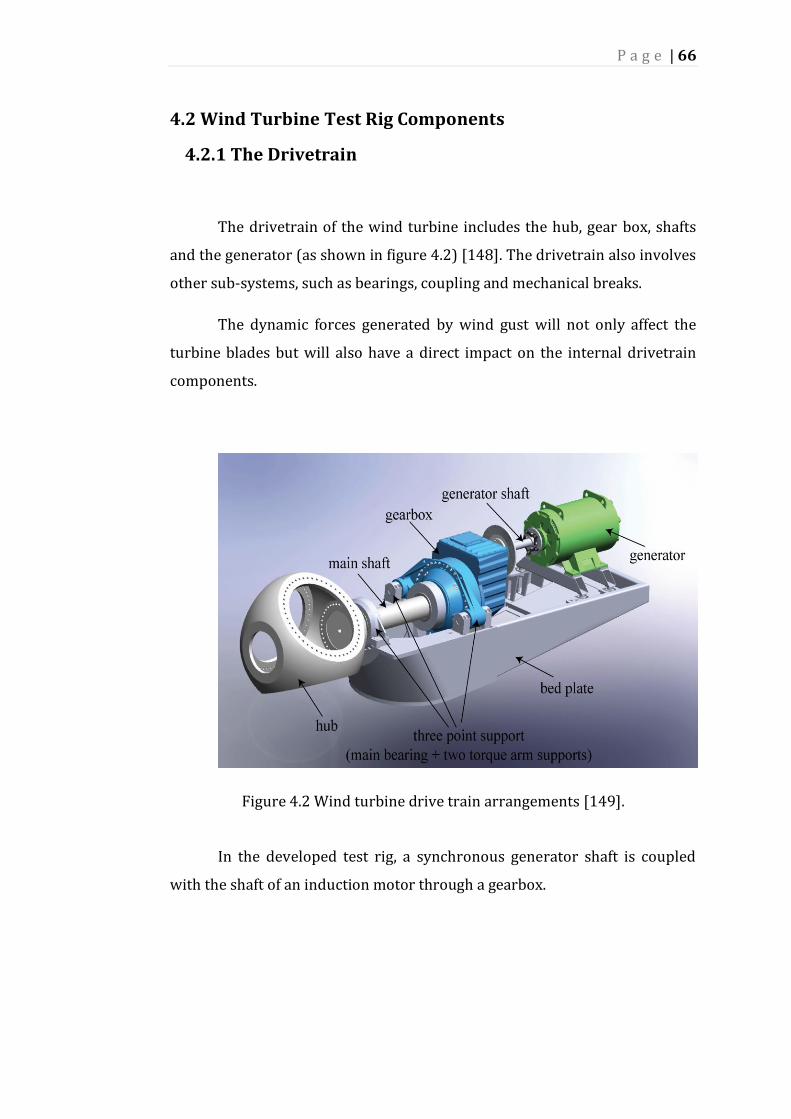
P a g e | 66
4.2 Wind Turbine Test Rig Components
4.2.1 The Drivetrain
The drivetrain of the wind turbine includes the hub, gear box, shafts
and the generator (as shown in figure 4.2) [148]. The drivetrain also involves
other sub-systems, such as bearings, coupling and mechanical breaks.
The dynamic forces generated by wind gust will not only affect the
turbine blades but will also have a direct impact on the internal drivetrain
components.
Figure 4.2 Wind turbine drive train arrangements [149].
In the developed test rig, a synchronous generator shaft is coupled
with the shaft of an induction motor through a gearbox.
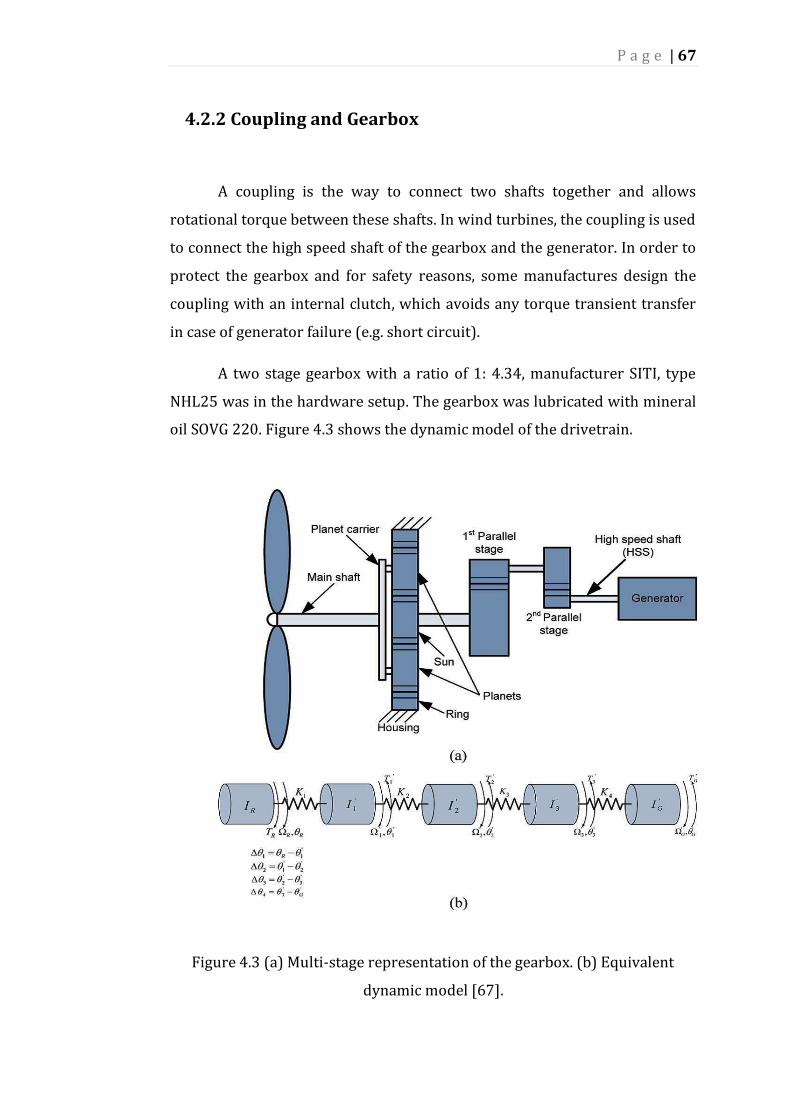
P a g e | 67
4.2.2 Coupling and Gearbox
A coupling is the way to connect two shafts together and allows
rotational torque between these shafts. In wind turbines, the coupling is used
to connect the high speed shaft of the gearbox and the generator. In order to
protect the gearbox and for safety reasons, some manufactures design the
coupling with an internal clutch, which avoids any torque transient transfer
in case of generator failure (e.g. short circuit).
A two stage gearbox with a ratio of 1: 4.34, manufacturer SITI, type
NHL25 was in the hardware setup. The gearbox was lubricated with mineral
oil SOVG 220. Figure 4.3 shows the dynamic model of the drivetrain.
Figure 4.3 (a) Multi-stage representation of the gearbox. (b) Equivalent
dynamic model [67].

P a g e | 68
The homogenous motion equation of the torsional model of this 5-
mass drivetrain is given by:’’
𝐼�̈� + 𝐾𝜃 = 0
Where
𝜃 = [𝜃ℎ𝜃𝑠1𝜃𝑠2𝜃𝑠3𝜃𝐺𝑒𝑛]𝑇 : displacement vector,
K: stiffness matrix, and
𝐼: diagonal inertia matrix.
𝐼 =
𝐼𝑆1 = 𝐼𝑃𝐶 + 𝑁12𝐼𝑆
𝐼𝑆2 = 𝑁12𝐼𝐺1 + (𝑁1𝑁2)
2𝐼𝑃1
𝐼𝑆3 = (𝑁1𝑁2)2𝐼𝐺2 + (𝑁1𝑁2𝑁3)
2𝐼𝑃2
𝐼𝐺𝑒𝑛 = (𝑁1𝑁2𝑁3)2𝐼𝐺𝑒𝑛
Where
: mass inertia for the rotor (blades);
IG : planetary carrier inertia;
𝐼𝑆 : sun inertia;
𝐼𝑆1 : effective inertia of stage I;
𝐼𝐺1: gear inertia of stage II;
𝐼𝑃1 : pinion inertia of stage II;
𝐼𝑆2 : effective inertia of stage II;
𝐼𝐺2: gear inertia of stage III;
𝐼𝑃12 : stage III pinion inertia; and
Gen
S
S
S
h
I
I
I
I
I
0000
0000
0000
0000
0000
3
2
1
hI

P a g e | 69
𝐼𝑆3 : effective inertia of stage III.
The stiffness matrix can be written as:
Where
= 𝑁12 𝐾2
𝐾𝑒3=(𝑁1𝑁2)2 𝐾3
𝐾𝑒4= (𝑁1𝑁2𝑁3)2𝐾4
𝐾𝑒5= (𝑁1𝑁2𝑁3)2𝐾5
Individual shaft stiffness can be expressed as:
𝐾𝑆ℎ𝑎𝑓𝑡 =𝐼. 𝐺
𝐿
Where
𝐼 : polar moment of inertia,
𝐿 : length of the shaft, and
𝐺: shear modulus.’’
These equations help to understand how the mechanism of the
gearbox works based on every stage, depending on the gearbox type and the
number of stages.
K
544
4433
3322
2211
11
000
00
00
00
000
eee
eeee
eeee
ee
KKK
KKKK
KKKK
KKKK
KK
2eK

P a g e | 70
4.2.3 Bearings
The main purpose of a bearing is to smooth the frictional resistance
between two surfaces within proportional motion, either linear or rotational.
Two types of bearings are employed in the WT drivetrain: 1) linear/axial,
and 2) rotational/radial. The first type is usually fitted in the main shaft,
while rotational bearings are commonly used for gears. Many studies have
reported that the bearing is one of the main causes of gearbox failure [150,
151].
4.2.4 Shaft
The shaft is designed to rotate based on the transmitting torque
function. A shaft can be fitted within the WT drivetrain in several different
ways, depending on the speed stage. At a high speed stage (HSS), the shaft is
connected to the rotor side (WT blades, main shaft), and at a low speed stage
(LSS), the shaft is fitted to the generator side (generator shaft).
4.2.5 The hub
The hub is located where the blades join together and is connected to
the main shaft. The hub also carries the electrical and mechanical control
systems, which improve the position of the blades. There are different hub
structure designs available in the industry, but they are predominantly made
from cast iron. This is due to cast iron’s solid nature and low cost.
P a g e | 71
4.2.6 Mechanical Brakes
One of the methods to control the over speed of a wind turbine is the
use of mechanical brakes. A mechanical brake is a steel disc, typically fitted
on the high speed shaft and combined with a calliper to accomplish braking.
The braking procedure involves extreme heat and stress, especially to the
disc. Temperature can reach up to 700 degrees Celsius [152], and for this
reason, special disc materials are used. The braking practice is called “a fail-
safe system,” because when power fails, the mechanical braking system is
engaged. It is compulsory in most countries for a wind turbine to be
equipped with two fail-safe systems. This is so that the the turbine can
always be stopped in the case of an emergency and so that any further
consequences can be avoided [153].
4.2.7 Signal Conditioning and Transducers
A signal conditioner was part of the test setup that was required for
low noisy signals and data acquisition purposes. Signal filtration cuts out any
noisy signals or irrelevant information, which can lead to large amounts of
data that may affect the analysis process and lead to speculation on the real
condition of the equipment. A real photo of the signal conditioner used in the
experimental setup is shown in Figure 4.1.
4.2.8 Accelerometers
Figure 4.4 shows a number of accelerometers that have been fitted to
the experimental setup test rig. The ISOTRON (ENDEVCO model 2258A-10)
accelerometer has excellent output sensitivity (10-100 mV/g), is of a small
size and light in weight (15 gm). This accelerometer is mounted on the
gearbox towards the low speed stage shaft. The other high performance and
low frequency accelerometer (model AC133-1D), with a sensitivity of 500
mV/g, is mounted at the top side of the gearbox casing. Figures showing the
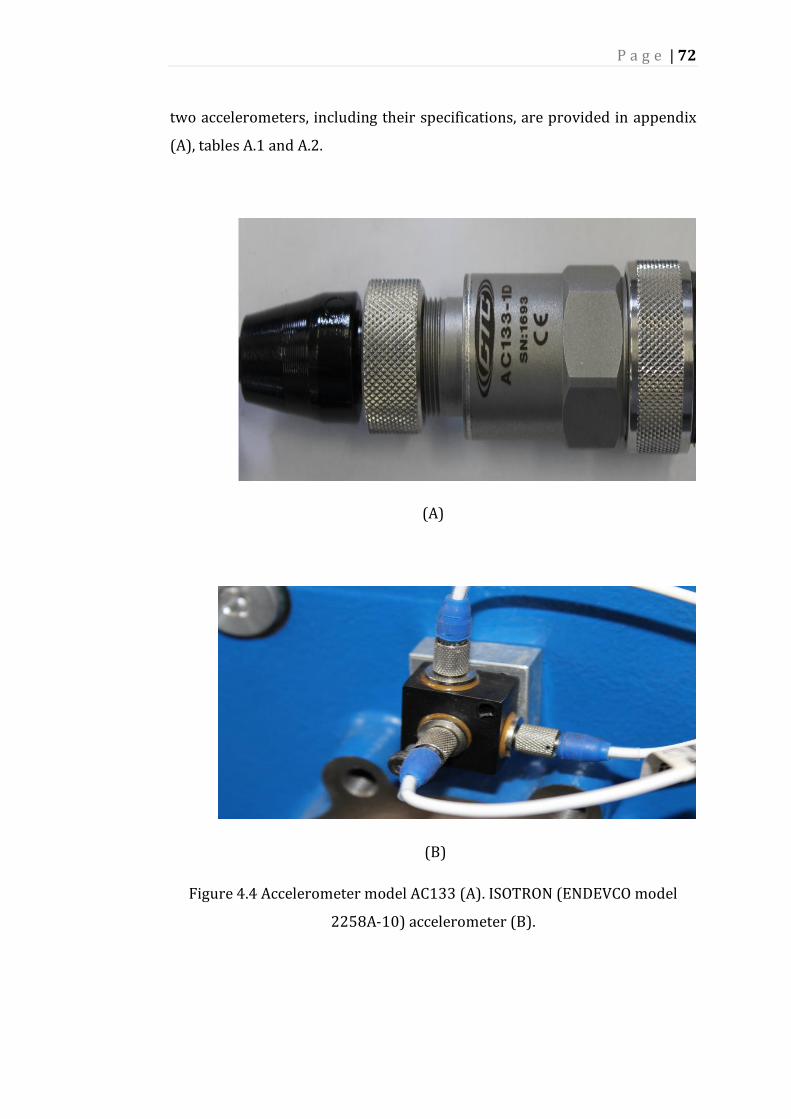
P a g e | 72
two accelerometers, including their specifications, are provided in appendix
(A), tables A.1 and A.2.
(A)
(B)
Figure 4.4 Accelerometer model AC133 (A). ISOTRON (ENDEVCO model
2258A-10) accelerometer (B).
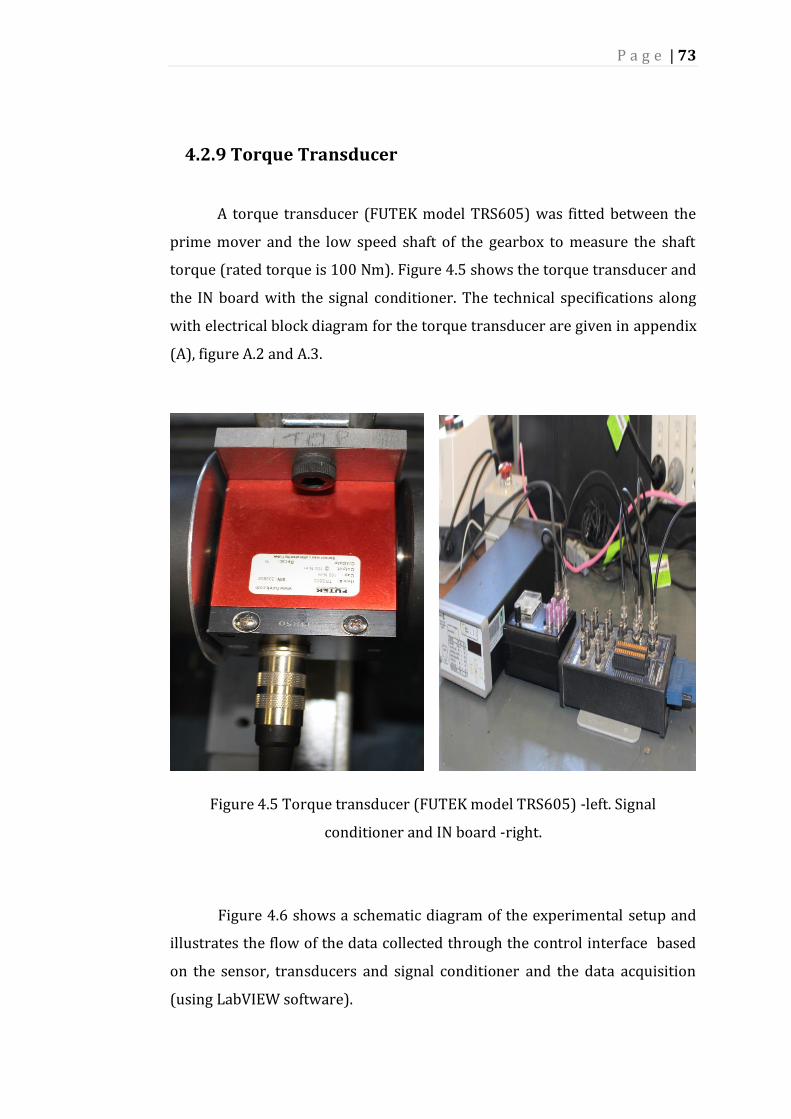
P a g e | 73
4.2.9 Torque Transducer
A torque transducer (FUTEK model TRS605) was fitted between the
prime mover and the low speed shaft of the gearbox to measure the shaft
torque (rated torque is 100 Nm). Figure 4.5 shows the torque transducer and
the IN board with the signal conditioner. The technical specifications along
with electrical block diagram for the torque transducer are given in appendix
(A), figure A.2 and A.3.
Figure 4.5 Torque transducer (FUTEK model TRS605) -left. Signal
conditioner and IN board -right.
Figure 4.6 shows a schematic diagram of the experimental setup and
illustrates the flow of the data collected through the control interface based
on the sensor, transducers and signal conditioner and the data acquisition
(using LabVIEW software).
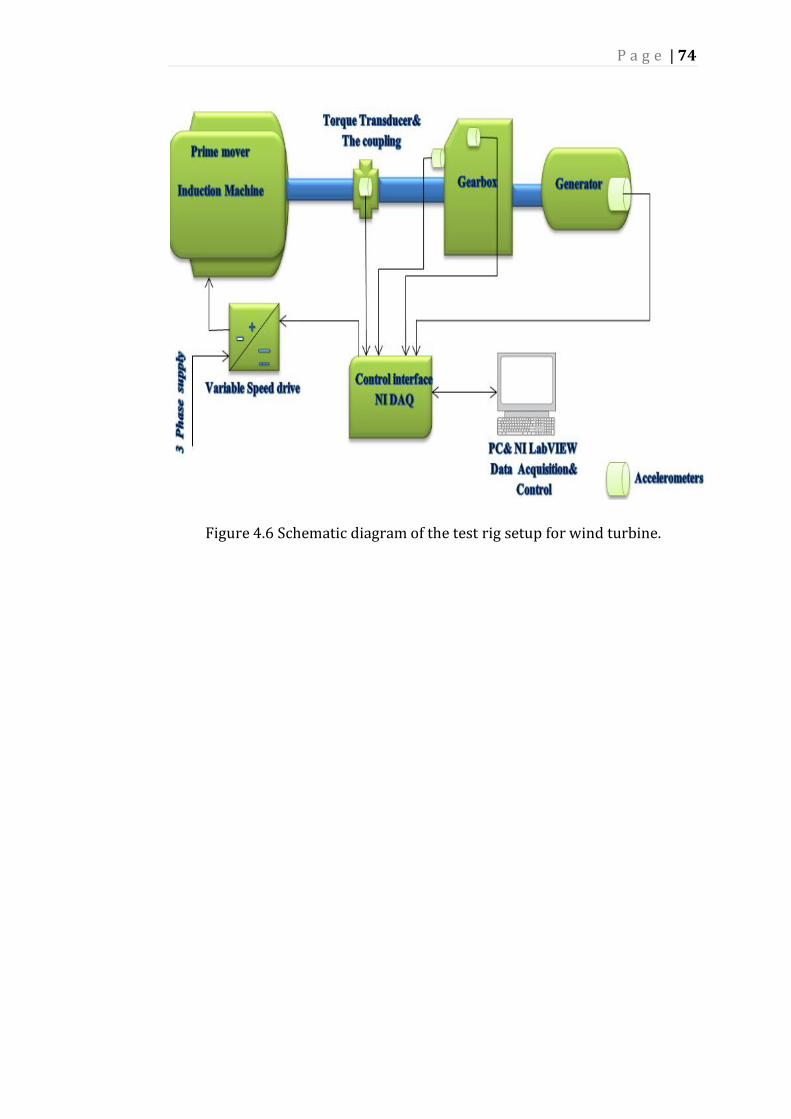
P a g e | 74
Figure 4.6 Schematic diagram of the test rig setup for wind turbine.

P a g e | 75
Chpater 5 Results and
Discussion

P a g e | 76
5.1 Case Study: Wind Turbine Drivetrain Stresses Based on
Narrow Band Wavelets
5.1.1 Introduction
This section introduces an improved technique to monitor the
condition of the wind turbine gearbox based on gearbox vibration and shaft
torque signatures analyses. In this context, shaft torque and mechanical
vibration signals are detected using high resolution sensors and are analysed
using two signal processing techniques: 1) wavelet and 2) fast Fourier
transform (order analyses). This is in order to investigate the impact of
investigated fault levels on the wind turbine drivetrain. Both signal
processing techniques are compared, based on their sensitivity to detect
incipient fault conditions.
5.1.2 Results and Discussion
Figure 5.1 (a) shows the torque signal during normal operating
conditions. The torque signal was measured by the torque transducer, which
was fitted between the prime mover and the low speed stage of the gearbox.
When there is no mechanical stress applied to the drive train, the torque
amplitude is measured at a rotor speed of 200 rpm. The results of the
wavelet technique have been calculated up to level 7.
Time (s)

P a g e | 77
Time (s)
Time (s)
Figure 5.1 Torque signal under normal operating conditions (healthy
conditions)
Figure 5.1 (b) shows approximated coefficients of the healthy torque
signal using wavelet db14 (Daubechies 14), while figure 5.1 (c) shows the
detail coefficients of the signal. Figure 5.1 (d) uses order analysis to show the
signal in a frequency domain representation. The healthy signature signals
presented in figure 3.7 are used as a reference, against which future

P a g e | 78
measured signatures signals are compared. Any variation can be assessed as
a possible fault.
A stressed shaft is simulated by injecting a current of 85% of the generator’s
rated current (9.39 A) through the generator stator terminals. This also
emulates real fault conditions on the wind turbine blades, such as icing
accumulation, wind shear, and gust wind. The 85% is the pulse current
represents the maximum value of the full load that can be injected, this has
been done to emulate the stress on the WT drivetrain when the rotor (blades
are in full capacity operation). This current was injected for short time due to
the load capacity otherwise if the injected current continue longer then the
whole drivetrain will over heated which may cause catastrophic failure to the
WT.
As can be seen in figure 5.2 (a), there is a significant increase in the
torque amplitude when compared with the healthy condition shown in figure
5.1 (a). Most of the rolling elements, such as the bearings, are designed to
operate with a relatively smooth transition between loaded and unloaded
modes. The rapid and significant amplitude change, shown in the torque
signal of figure 5.2 (a), is attributed to the machine delivering more
mechanical power to overcome the stress on its shaft. This can have a
significant impact on the surface durability of the rolling elements.
Time (s)
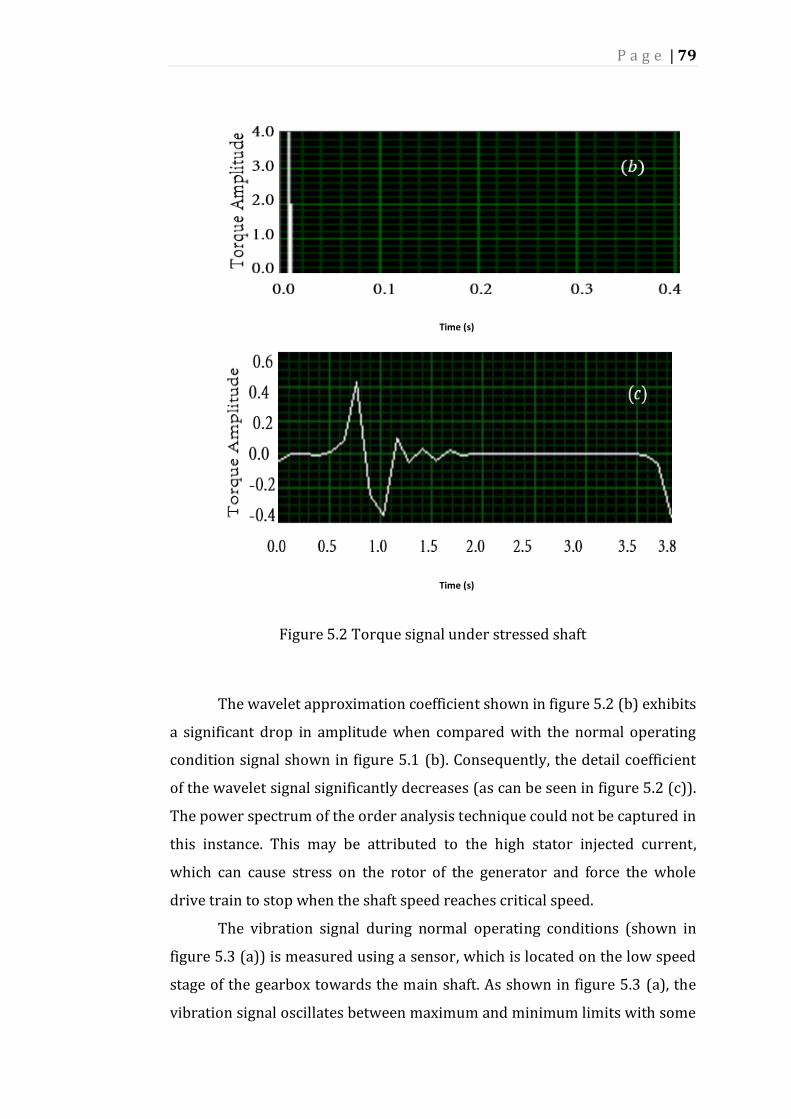
P a g e | 79
Time (s)
Time (s)
Figure 5.2 Torque signal under stressed shaft
The wavelet approximation coefficient shown in figure 5.2 (b) exhibits
a significant drop in amplitude when compared with the normal operating
condition signal shown in figure 5.1 (b). Consequently, the detail coefficient
of the wavelet signal significantly decreases (as can be seen in figure 5.2 (c)).
The power spectrum of the order analysis technique could not be captured in
this instance. This may be attributed to the high stator injected current,
which can cause stress on the rotor of the generator and force the whole
drive train to stop when the shaft speed reaches critical speed.
The vibration signal during normal operating conditions (shown in
figure 5.3 (a)) is measured using a sensor, which is located on the low speed
stage of the gearbox towards the main shaft. As shown in figure 5.3 (a), the
vibration signal oscillates between maximum and minimum limits with some
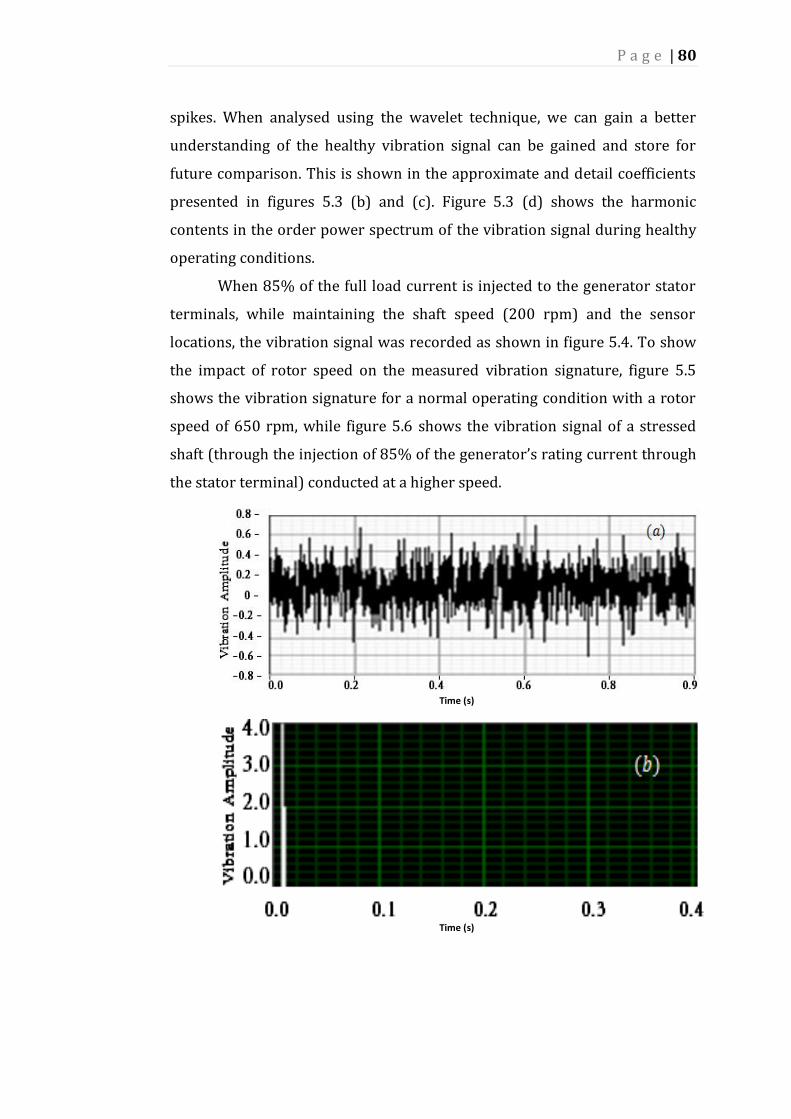
P a g e | 80
spikes. When analysed using the wavelet technique, we can gain a better
understanding of the healthy vibration signal can be gained and store for
future comparison. This is shown in the approximate and detail coefficients
presented in figures 5.3 (b) and (c). Figure 5.3 (d) shows the harmonic
contents in the order power spectrum of the vibration signal during healthy
operating conditions.
When 85% of the full load current is injected to the generator stator
terminals, while maintaining the shaft speed (200 rpm) and the sensor
locations, the vibration signal was recorded as shown in figure 5.4. To show
the impact of rotor speed on the measured vibration signature, figure 5.5
shows the vibration signature for a normal operating condition with a rotor
speed of 650 rpm, while figure 5.6 shows the vibration signal of a stressed
shaft (through the injection of 85% of the generator’s rating current through
the stator terminal) conducted at a higher speed.
Time (s)
Time (s)

P a g e | 81
Time (s)
Figure 5.3 Vibration signal under normal operating conditions.
Time (s)

P a g e | 82
Time (s)
Time (s)
Figure 5.4 Sensors signals under critical faulty operating conditions.
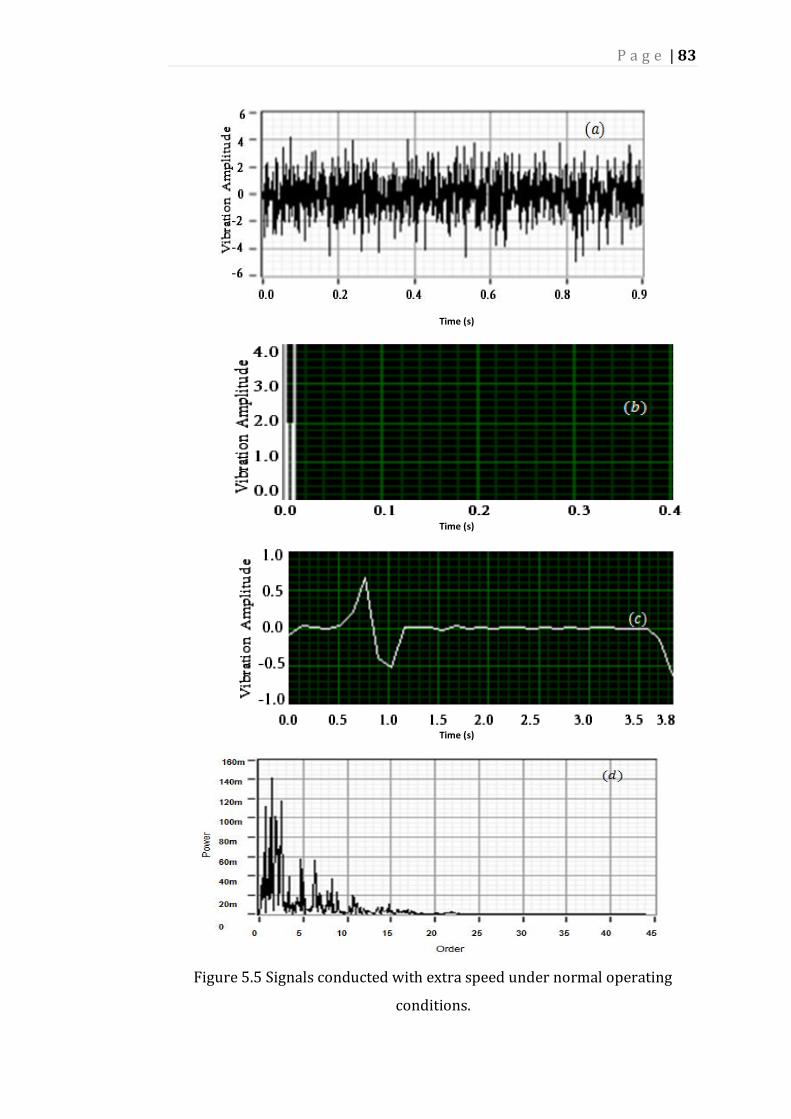
P a g e | 83
Time (s)
Time (s)
Time (s)
Figure 5.5 Signals conducted with extra speed under normal operating
conditions.
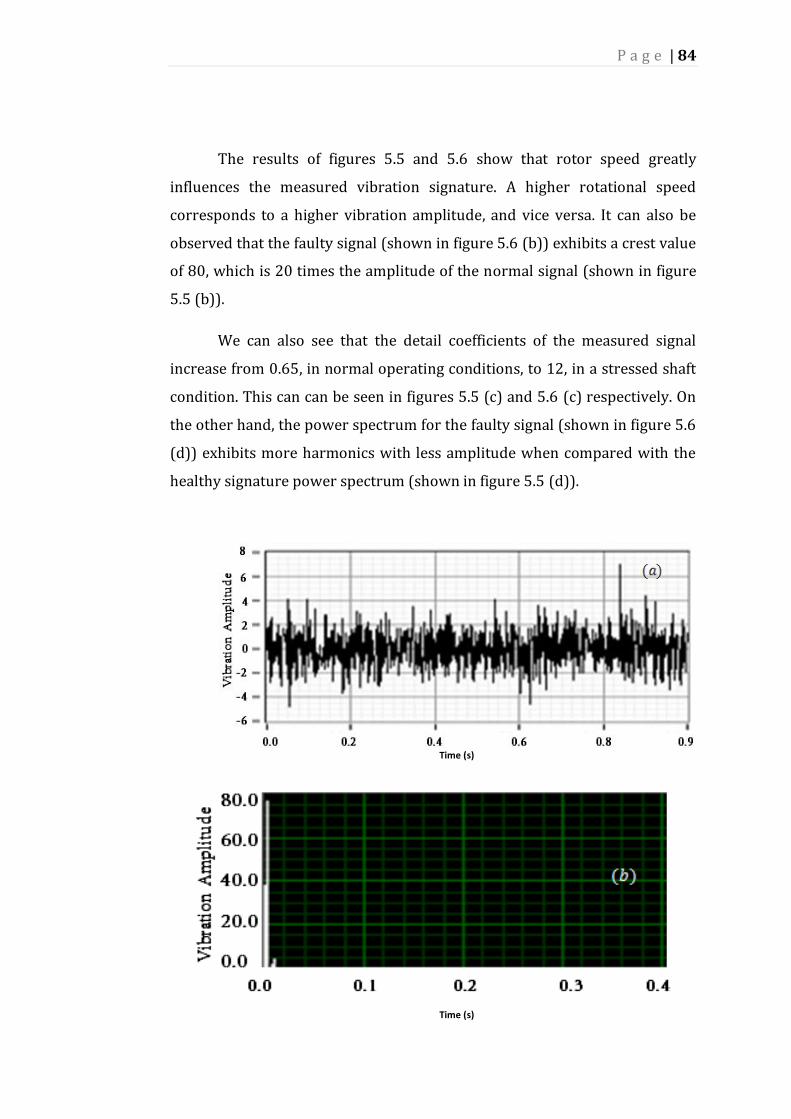
P a g e | 84
The results of figures 5.5 and 5.6 show that rotor speed greatly
influences the measured vibration signature. A higher rotational speed
corresponds to a higher vibration amplitude, and vice versa. It can also be
observed that the faulty signal (shown in figure 5.6 (b)) exhibits a crest value
of 80, which is 20 times the amplitude of the normal signal (shown in figure
5.5 (b)).
We can also see that the detail coefficients of the measured signal
increase from 0.65, in normal operating conditions, to 12, in a stressed shaft
condition. This can can be seen in figures 5.5 (c) and 5.6 (c) respectively. On
the other hand, the power spectrum for the faulty signal (shown in figure 5.6
(d)) exhibits more harmonics with less amplitude when compared with the
healthy signature power spectrum (shown in figure 5.5 (d)).
Time (s)
Time (s)
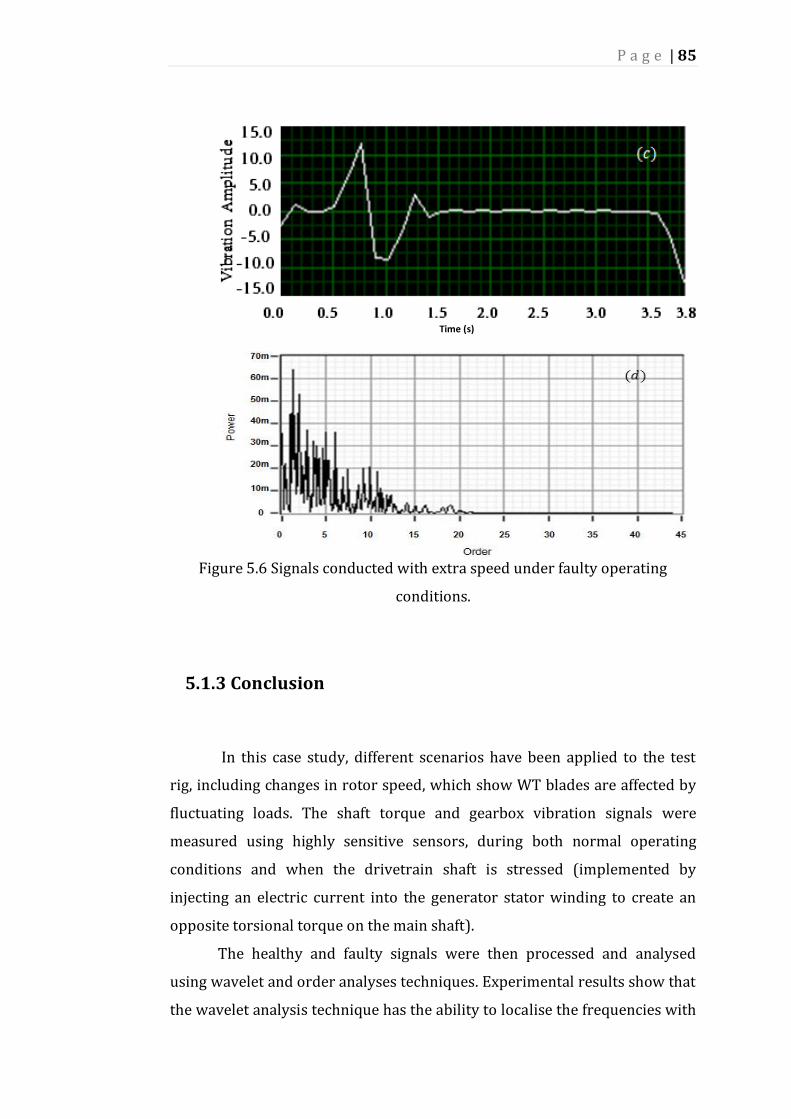
P a g e | 85
Time (s)
Figure 5.6 Signals conducted with extra speed under faulty operating
conditions.
5.1.3 Conclusion
In this case study, different scenarios have been applied to the test
rig, including changes in rotor speed, which show WT blades are affected by
fluctuating loads. The shaft torque and gearbox vibration signals were
measured using highly sensitive sensors, during both normal operating
conditions and when the drivetrain shaft is stressed (implemented by
injecting an electric current into the generator stator winding to create an
opposite torsional torque on the main shaft).
The healthy and faulty signals were then processed and analysed
using wavelet and order analyses techniques. Experimental results show that
the wavelet analysis technique has the ability to localise the frequencies with

P a g e | 86
accurate time locations, as well as detect unforseen transient variations
based on different faulty and healthy scenarios applied to the test rig. On the
other hand, order analysis shows more harmonics in the analysed faulty
signal, however it is hard to diagnose the cause of the root failures.
5.2 Case Study 2: Impact of Gearbox Oil Contamination on the
Performance of the Wind Turbine Drivetrain
5.2.1 Introduction
This case study investigates the impact of gearbox lubrication oil
contamination on the performance of the wind turbine drivetrain. In this
context, the vibration signal of the gearbox is measured and analysed under
various contamination levels of gearbox oil. A thermal camera is used to
identify the hot spot location within the gearbox during the investigated case
studies. Results show that quality of gearbox oil has a significant impact on
the overall performance of the wind energy conversion system.
Table 5.1 shows the characteristics of the mineral lubricants used
within the gearbox, along with ISOVG (International Standards Organisation
Viscosity Grade). Typical oil properties can be found on Appendix A, table A.3
and table A.4.
5.2.2 Results and Discussion
Table 5.1 Oil types and specifications
Mineral
Oil type
Viscosity (cSt)
At 40°C
Density
kg/L
ISOVG
220
224 At 20°C
0.861
ATF
MHP
37 At 15°C
0.849
P a g e | 87
Figure 5.7 shows the measured vibration signal of new and
contaminated lubrication oil. Oil is contaminated by dissolving 100 grams of
fine iron powder into the oil. Figure 5.8 shows the vibration signal of the
drivetrain when a current of 8 A is injected, to simulate real stress
conditions, into phase A of the generator stator winding. As can be seen in
figure 5.8 (a), the magnitude of the vibration signal is increased when
compared with the no-stress condition shown in figure 5.7 (a). This is
attributed to the high current injected into the generator stator windings,
which creates an opposite torque. This then causes high mechanical stress to
the generator shaft and, consequently, to the gearbox.
Figure 5.8 (b) shows the power spectrum of the measured vibration
signal, using the peak hold technique, where it is easy to identify the
maximum peaks. This figure also reveals that the peaks of the measured
vibration signal take place at 13.3Hz, 53.3Hz and 130Hz. These frequencies
represent zero, first, and second frequency modes.
Figure 5.8 (c) shows the rotor spectral map, from which it can be
observed that the speed of the rotor (800 rpm) corresponds to order 1 the
first frequency oscillating mode of 53.3 Hz. Figure 5.9 shows that the power
spectrum is decreased when compared with that of figure 5.8. This is
attributed to the contaminated oil, which leads to a change in oil viscosity
and also wear and tear within the gearbox. The time data collection was not
detailed enough to observe the real effect of gearbox degradation; in order to
have enough data with which to compare, a minimum of six months’ solid
data is required
In figure 5.9 (c), the spectral map of the new oil, before the
contamination process and also under stress conditions, shows the
differences in order spectrum between this stage and figure 5.9 (c).
Under normal operating conditions, there is no considerable
difference in terms of torque variation between the new oil (type ATF MHP)
and the original oil type (VG 220). Figure 5.11 shows the different
experiments conducted on the test rig setup: (a) rotor speed 700 rpm

P a g e | 88
healthy condition, (b) low speed 200 rpm in contaminated lubricant
condition, and (c) faulty condition 200 rpm. Comparing the three measured
torque signals shows a significant increase in the torque between (b) and (c).
This is due to gear tooth surface wear, as a result of a contaminated lubricant.
Figure 5.11 (a) illustrates the effect of wind speed, including the side
effect of wind speed on the torque pattern. Higher wind speeds cause
mechanical stress and increase fatigue life on the drive train of the wind
turbine.
Figure 5.7 (a) New oil ATF MHP, (b) New oil ATF MHP after contamination.
All under normal operating conditions.
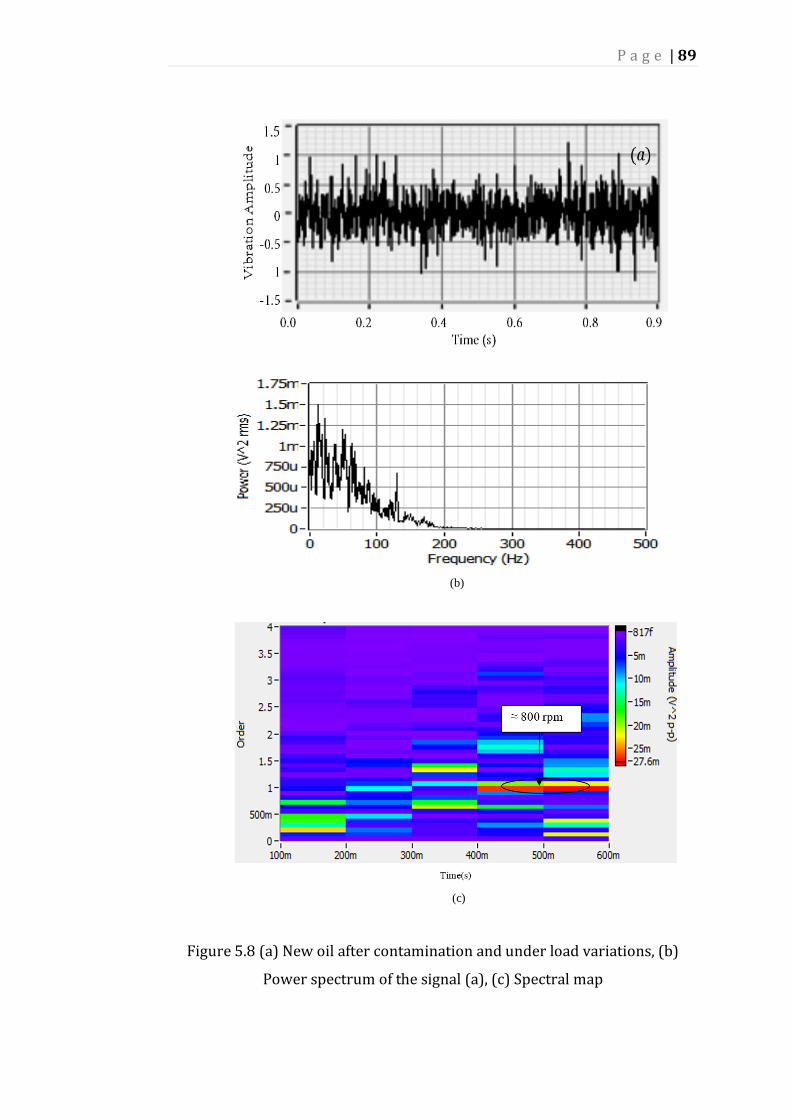
P a g e | 89
(b)
(c)
Figure 5.8 (a) New oil after contamination and under load variations, (b)
Power spectrum of the signal (a), (c) Spectral map
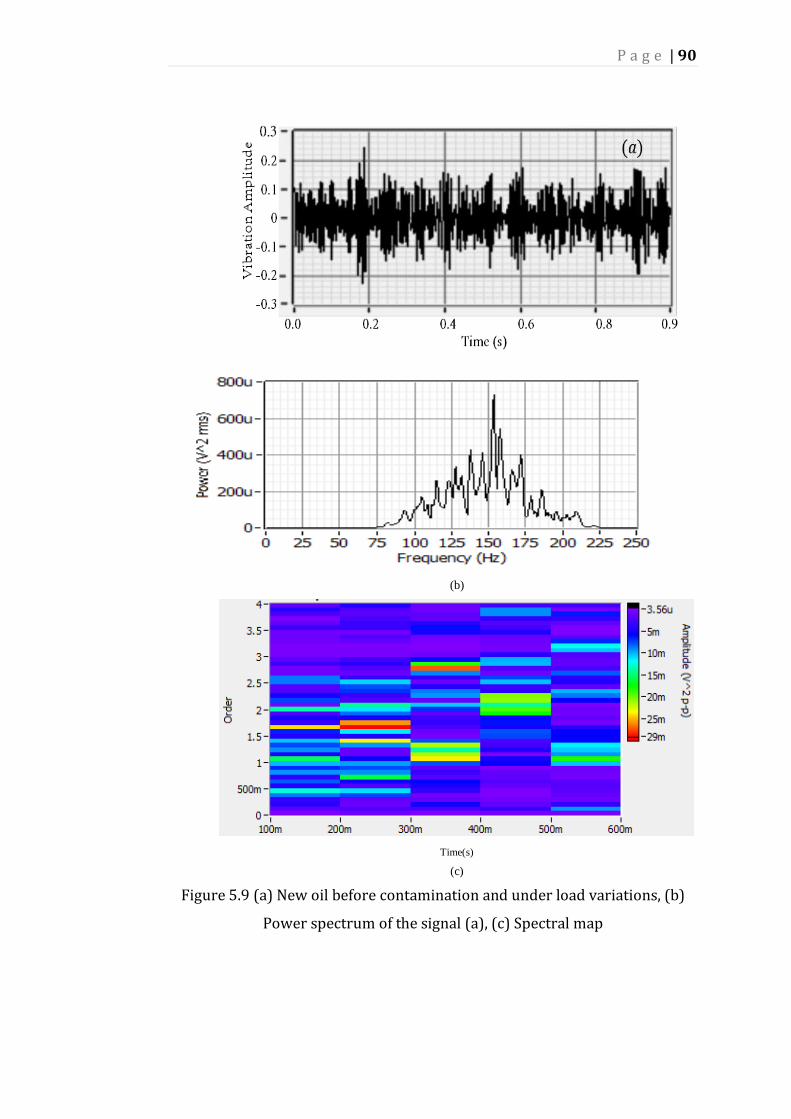
P a g e | 90
(b)
Time(s)
(c)
Figure 5.9 (a) New oil before contamination and under load variations, (b)
Power spectrum of the signal (a), (c) Spectral map
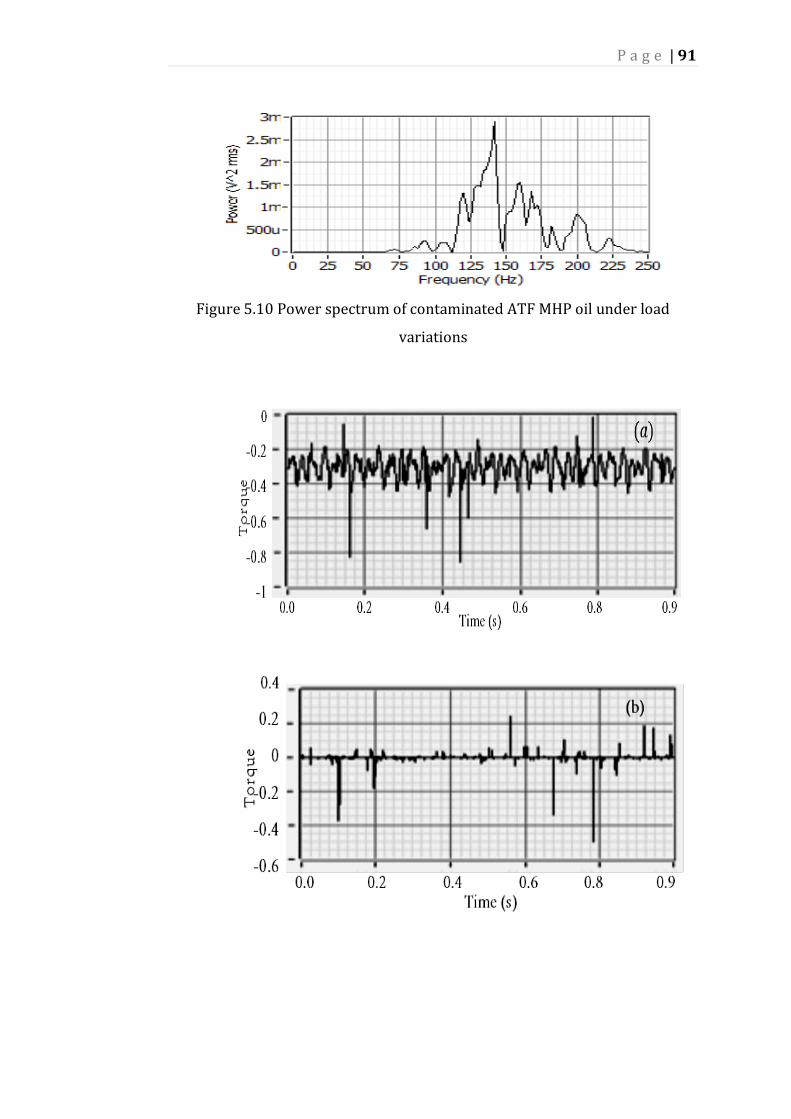
P a g e | 91
Figure 5.10 Power spectrum of contaminated ATF MHP oil under load
variations
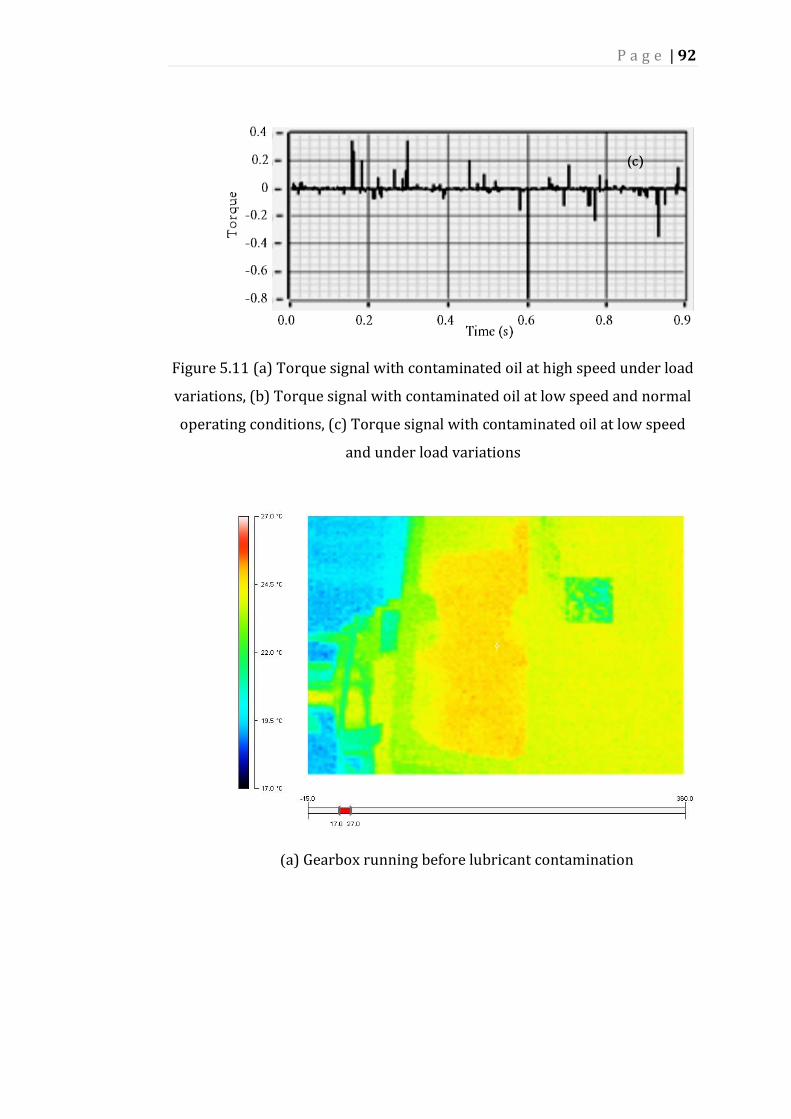
P a g e | 92
Figure 5.11 (a) Torque signal with contaminated oil at high speed under load
variations, (b) Torque signal with contaminated oil at low speed and normal
operating conditions, (c) Torque signal with contaminated oil at low speed
and under load variations
(a) Gearbox running before lubricant contamination
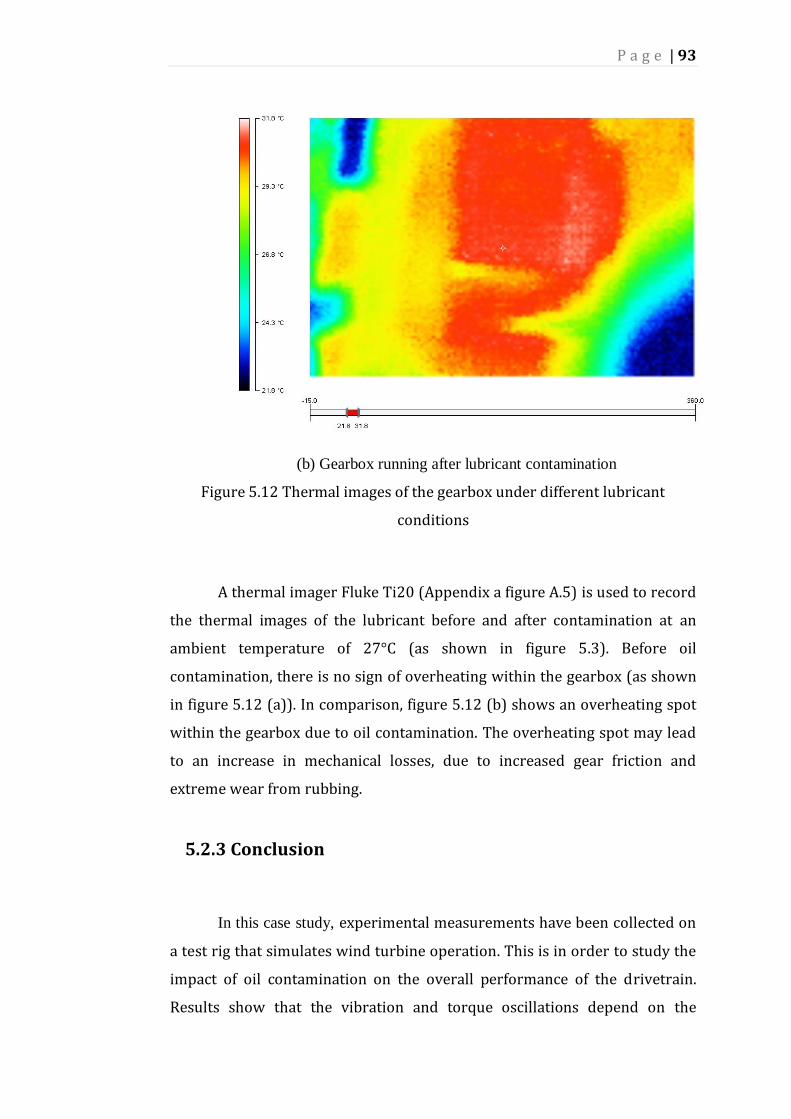
P a g e | 93
(b) Gearbox running after lubricant contamination
Figure 5.12 Thermal images of the gearbox under different lubricant
conditions
A thermal imager Fluke Ti20 (Appendix a figure A.5) is used to record
the thermal images of the lubricant before and after contamination at an
ambient temperature of 27°C (as shown in figure 5.3). Before oil
contamination, there is no sign of overheating within the gearbox (as shown
in figure 5.12 (a)). In comparison, figure 5.12 (b) shows an overheating spot
within the gearbox due to oil contamination. The overheating spot may lead
to an increase in mechanical losses, due to increased gear friction and
extreme wear from rubbing.
5.2.3 Conclusion
In this case study, experimental measurements have been collected on
a test rig that simulates wind turbine operation. This is in order to study the
impact of oil contamination on the overall performance of the drivetrain.
Results show that the vibration and torque oscillations depend on the

P a g e | 94
condition of the oil lubricant. Contaminated oil leads to overheating within
the gearbox and generates peaks on the vibration signature at the zero, first,
and second frequency modes. The overall performance of the wind turbine is
enhanced with contamination-free oil lubricants with high grade viscosity.
Better condition monitoring is also achieved through the detection of faults
at an early stage. Furthermore, smoothing the drivetrain torque signals
results in less mechanical stress and, therefore, decreases the drivetrain
component’s fatigue life.

P a g e | 95
5.3 Case Study 3: Monitoring the Impact of Gearbox Teeth
Failure on the Performance of the Wind Turbine.
This case study investigates the impact of gear box tooth
damage/breakage, and gear eccentricity (misalignment due to a bent shaft),
on the investigated torque and vibration signatures.
Figure 5.13 Gear in healthy condition before fault is applied
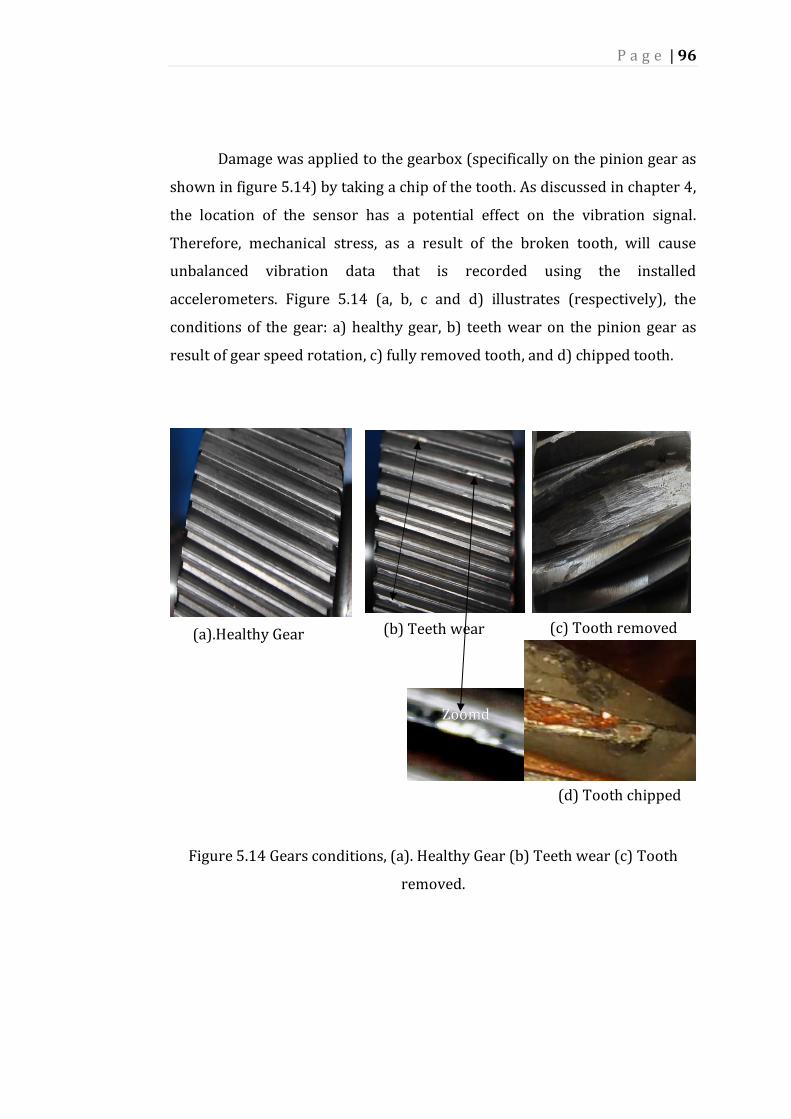
P a g e | 96
Damage was applied to the gearbox (specifically on the pinion gear as
shown in figure 5.14) by taking a chip of the tooth. As discussed in chapter 4,
the location of the sensor has a potential effect on the vibration signal.
Therefore, mechanical stress, as a result of the broken tooth, will cause
unbalanced vibration data that is recorded using the installed
accelerometers. Figure 5.14 (a, b, c and d) illustrates (respectively), the
conditions of the gear: a) healthy gear, b) teeth wear on the pinion gear as
result of gear speed rotation, c) fully removed tooth, and d) chipped tooth.
Figure 5.14 Gears conditions, (a). Healthy Gear (b) Teeth wear (c) Tooth
removed.
Zoomd
(a).Healthy Gear (b) Teeth wear (c) Tooth removed
(d) Tooth chipped

P a g e | 97
The recorded signals were processed and filtered to avoid any
unwanted noise that may have affected the output data.
Figure 5.13 shows the healthy gearbox based on the wavelet analysis
technique (Daubechies family) (decomposition up to level 7). The figure
reveals a smooth signal, which reflects normal gearbox operation. Figure
5.15 shows the same signals after taking a part of the tooth (tooth chipped).
As a WT operator, and based on the CMSs fitted to the wind turbine, it is clear
from the signal that the fault is progressively relocated across the gear. As
can be seen at decomposition level (d1), the amplitude changes along the
entire frequency range of all the levels of the decomposition signal
(compared to figure 5.13 (healthy case)). Furthermore, a fault with the
vibration monitoring system also occurs when the entire tooth is removed
(as shown in figure 5.16). This is shown by the level of the faulty signal.
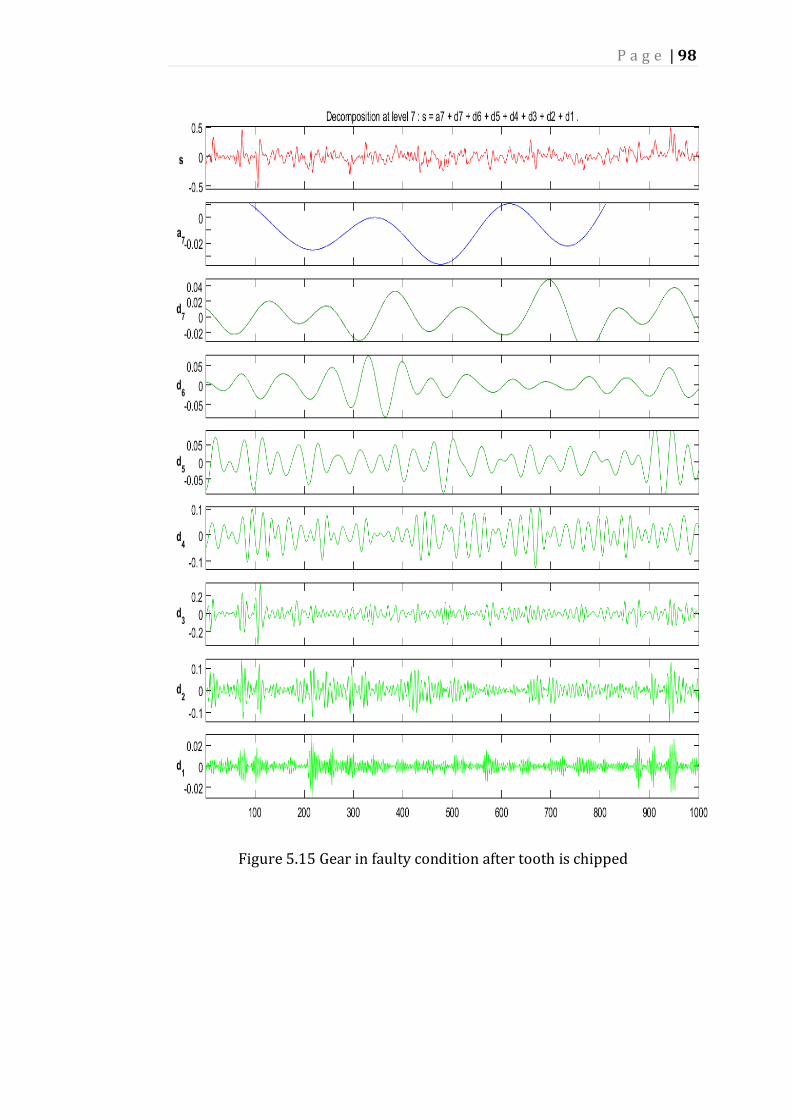
P a g e | 98
Figure 5.15 Gear in faulty condition after tooth is chipped
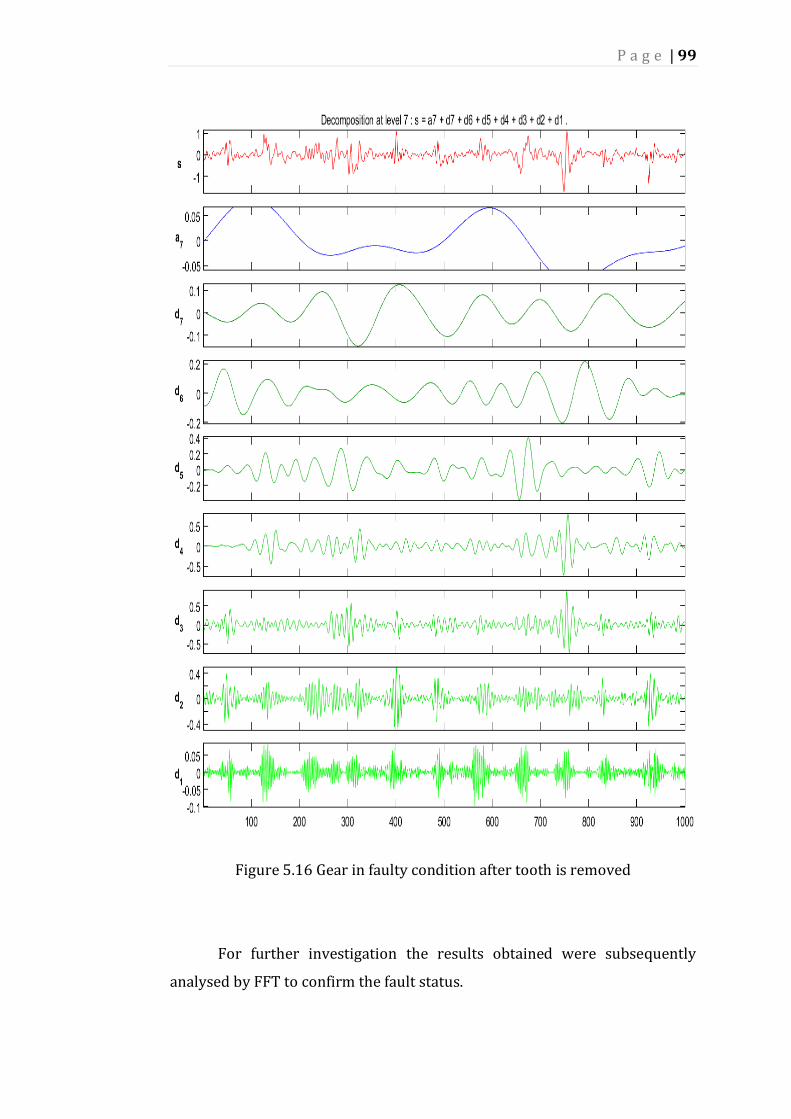
P a g e | 99
Figure 5.16 Gear in faulty condition after tooth is removed
For further investigation the results obtained were subsequently
analysed by FFT to confirm the fault status.
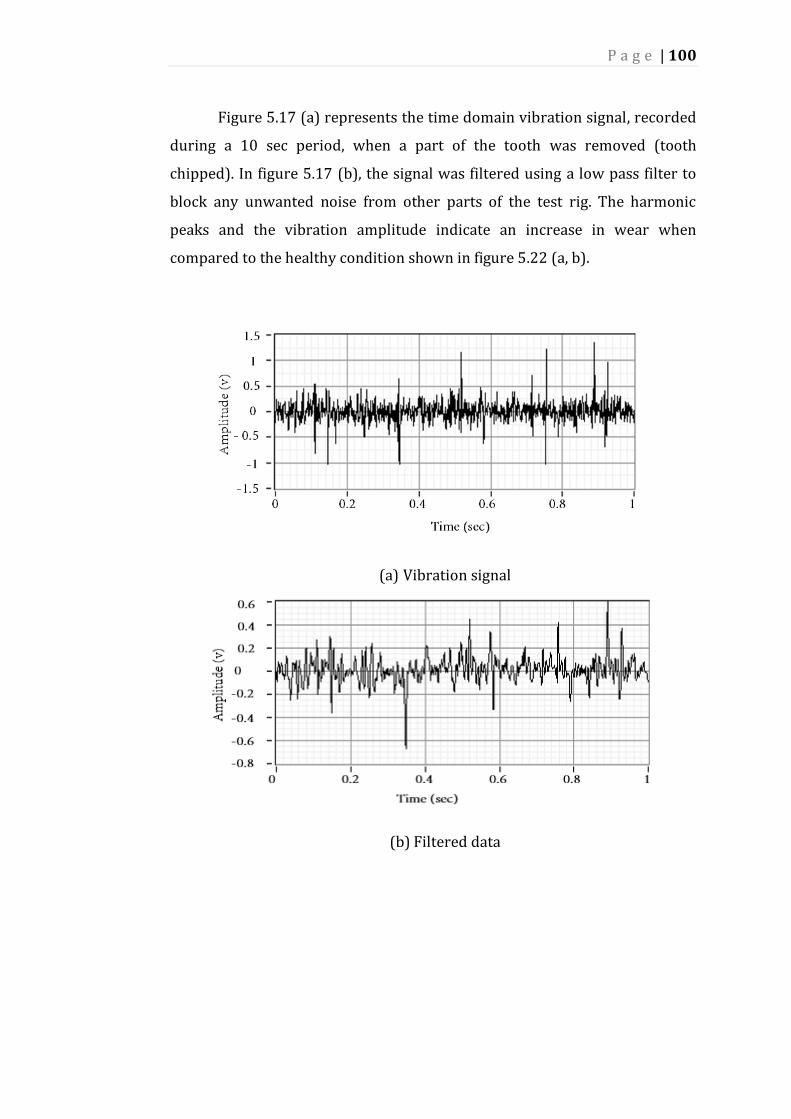
P a g e | 100
Figure 5.17 (a) represents the time domain vibration signal, recorded
during a 10 sec period, when a part of the tooth was removed (tooth
chipped). In figure 5.17 (b), the signal was filtered using a low pass filter to
block any unwanted noise from other parts of the test rig. The harmonic
peaks and the vibration amplitude indicate an increase in wear when
compared to the healthy condition shown in figure 5.22 (a, b).
(a) Vibration signal
(b) Filtered data

P a g e | 101
(c) Power spectrum of the filtered signal
Figure 5.17 Broken tooth fault. (a) Vibration signal, (b) Faulty signal filtered,
and (c) Power spectrum of the faulty signal
The power spectrum in figure 5.17 (c) shows the gear vibration signal
and sideband harmonics that are related to the gear meshing teeth frequency
and shaft rotational frequencies. The test was conducted with input shaft
speed = 200 RPM, gearbox ratio = 1:4.34, and output shaft speed
𝑆𝑂=200rpm×4.34=868 RPM. Hence, 1st carrier speed can be calculated as:
𝑅1 =𝑁1 + 𝑁21𝑁21
= 13 + 62
62= 1.209
𝐶𝑠 = 𝑃𝐺(𝑅𝑃𝑀) × 𝑅1 = 200 × 1.209 = 241.8 𝑅𝑃𝑀
Where
𝑅1& 𝐶𝑠: 1st gear stage ratio and 1st carrier speed (respectively).
After the gearbox was disassembled at the end of the experiments, the
number of gear teeth was counted (as in table 5.2).

P a g e | 102
Table 5.2 Outline of the gearbox shaft speed (input/output) and number of
gear teeth.
Symbol Shaft speed/Gears teeth
number
Calculated
𝑃𝐺 Pinion gear RPM 200
𝑆𝑂 Output gear RPM 868
𝐶𝑠 1st carrier speed RPM 241.8
𝑁1 Pinion gear teeth no. 13
𝑁21 2nd gear teeth no. 62
𝑁23 3rd gear teeth no. 40
𝑁3 4th gear teeth no. 44
Ratio Gearbox ratio 0.23 (1:4.34)
Figure 5.18 illustrates the gear’s dynamic arrangement used in this
study. From the outline provided in table 5.2, and based on each gear’s
number of teeth, the output gear ratio can be calculated as follows:
The output gear ratio N= (𝑁1 × 𝑁3) (𝑁21 × 𝑁23⁄ ) =
(13 × 44) (62 × 40⁄ ) = 0.23
Which agrees with the gearbox ratio provided by the gear manufacture
(1:4.34).
Figure 5.18 Gearbox dynamic arrangements

P a g e | 103
(a) Faulty data
(b) Filtered data
(c) Power spectrum of the removed tooth
Figure 5.19 Data of the removed tooth. (a) Faulty vibration signal, (b)
Filtered signal, (c) Power spectrum of the filtered signal

P a g e | 104
The signal in figure 5.19 (b) was adaptively filtered through the band-
pass filter. Peaks duration changes because of changes in the rotational
speed. Carrying out pulse position analysis, the time average for the pulse
changes can be calculated as follows:
Time duration average = (0.1+0.25+0.15+0.18+0.15+0.09+0.11)/7=
0.147
Relative frequency at 3.33Hz of input shaft = 1/0.147=6.802 Hz
Damaged gear rpm = 6.802×60=408.2
The power spectrum presented in figure 5.19 (c) shows the faulty
frequencies that reflect the gearbox condition. As can be seen from the figure,
the first harmonic indicates the input shaft running frequency is 3.33 Hz. The
remainder of the harmonics (13 Hz, 26 Hz, 38 Hz, 50 Hz and 63) are caused
by the rotational speed of the faulty gear tooth, along with gear mesh
frequencies. The fault’s precise frequencies can however exist under a
normal power signal and under normal operating conditions, but those
harmonic peaks will be at a lower magnitude when compared to those from a
faulty condition.
𝐻𝑢𝑛𝑡𝑖𝑛𝑔 𝑡𝑜𝑜𝑡ℎ 𝑓𝑟𝑒𝑞𝑢𝑒𝑛𝑐𝑦
= 𝐺𝑒𝑎𝑟 𝑚𝑒𝑐ℎ 𝑓𝑟𝑒𝑢𝑞𝑢𝑒𝑛𝑐𝑦 × 𝐶𝑜𝑚𝑚𝑜𝑛 𝑓𝑟𝑒𝑞𝑢𝑒𝑛𝑐𝑦
𝑁𝑜. 𝑡𝑒𝑒𝑡ℎ 𝑝𝑖𝑛𝑖𝑜𝑛 × 𝑁𝑜. 𝑇𝑒𝑒𝑡ℎ 𝑏𝑢𝑙𝑙 𝑔𝑒𝑎𝑟
Since the only multiplication of the 13 teeth is 1, then the common
frequency in this case would also be 1. Thus the hunting tooth frequency
(HTF) is calculated as:
𝐻𝑇𝐹 = 2600 ×1
13× 62 = 3.22 𝑐𝑝𝑚
Which explains the peaks in figure 59 (c) at 3.22 Hz (1 × 3.22 = 3.22 𝐻𝑧)

P a g e | 105
As calculated previously, the 1st carrier speed is 241.8 rpm, and the
calculation HTF at this speed is as follows:
𝐻𝑇𝐹 =14992 × 2
13 × 62= 37.2 𝑐𝑝𝑚
Which is close to the fourth peak (38 Hz), despite the differences between
theoretically calculated and practical measured values.
It is well known that tooth breakage can cause serious damage, not
just to the broken section, but also to the rest of the gear. This is due to
fleeting through the transmission and explains the sideband harmonics (next
to the mentioned faulty frequencies) in the figure.
Furthermore, due to the fact that gearbox teeth are extremely hard to
break, the little distortion you can see in figure 5.19 (a, b, and c) may refer to
the inflate surface of the removed tooth while removing it.

P a g e | 106
5.4 Case Study 4: Gear Eccentricity
A bent shaft is the most common reason for gear eccentricity [154,
155]. An unbalanced shaft was applied to the test rig (figure 4.1) by creating
a difference in shaft level between the input shaft (from the prime mover
side) and the output shaft (from the generator side). The difference between
the two levels is then adjusted to 3.5 cm from level zero, which is based on
the test bed. A detachable sign of the gear’s eccentricity is higher GMF
amplitude and high sideband (when compared to normal shaft operation).
A signal was collected for processing from the torque transducer,
when the input shaft was at a rotational speed of 200 RPM. When comparing
figures 5.21 (healthy condition) and 5.20 (faulty condition), the torque signal
shows dramatic changes in amplitude between the healthy and the faulty
case, as well as sideband variations. In figure 5.20 (faulty case), the vibration
amplitude reaches 0.6 much higher than in figure 5.21 (healthy case). The
higher amplitude-based GMFs that pass through the gears can cause
excessive backlash and unexplained frequencies (including the gear’s
resonant frequencies). Furthermore, poor coupling alignment of the input
and output shafts, as a result of unbalanced shafts, will have an acute effect
on the frequency spectrum amplitudes. This can be seen in figure 5.20 (c)
when compared to figure 5.21 (c).
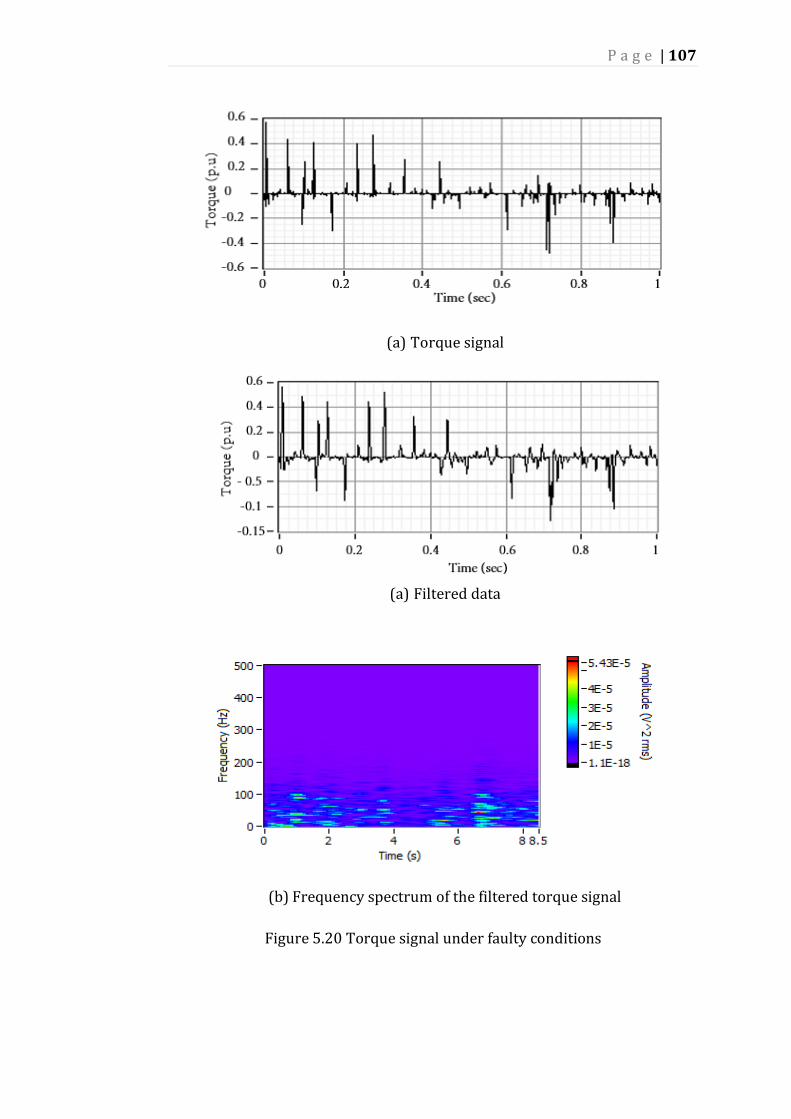
P a g e | 107
(a) Torque signal
(a) Filtered data
(b) Frequency spectrum of the filtered torque signal
Figure 5.20 Torque signal under faulty conditions
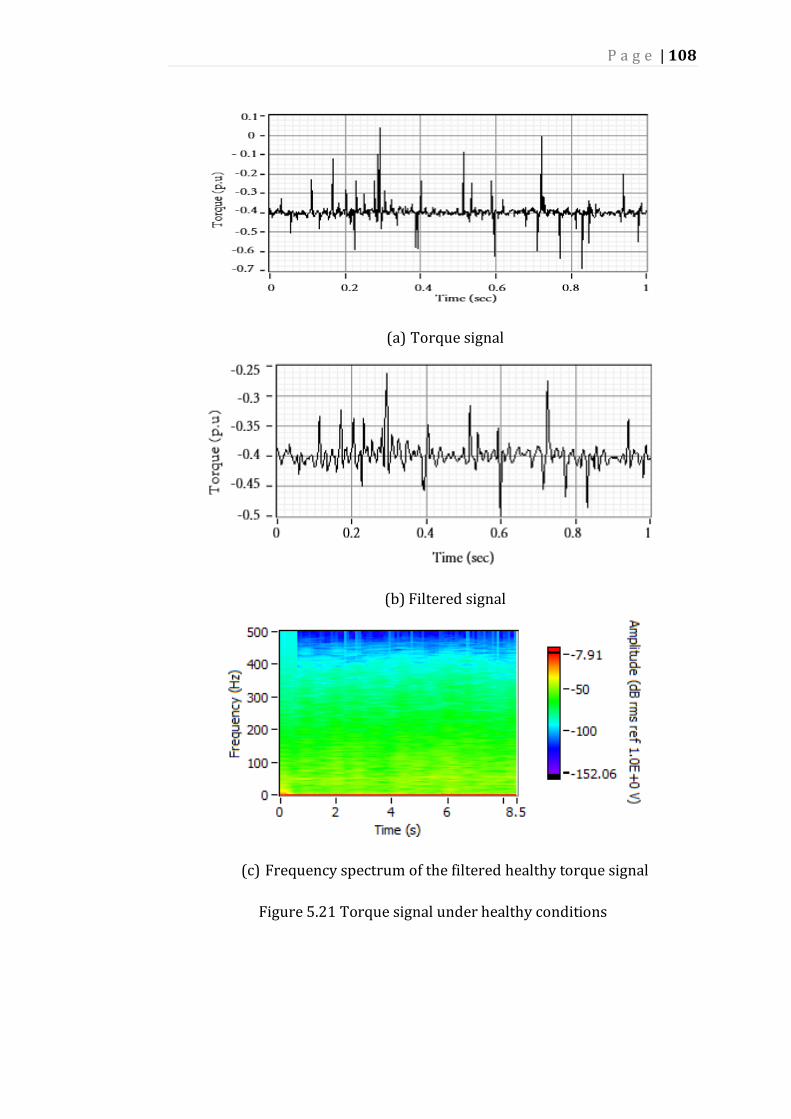
P a g e | 108
(a) Torque signal
(b) Filtered signal
(c) Frequency spectrum of the filtered healthy torque signal
Figure 5.21 Torque signal under healthy conditions
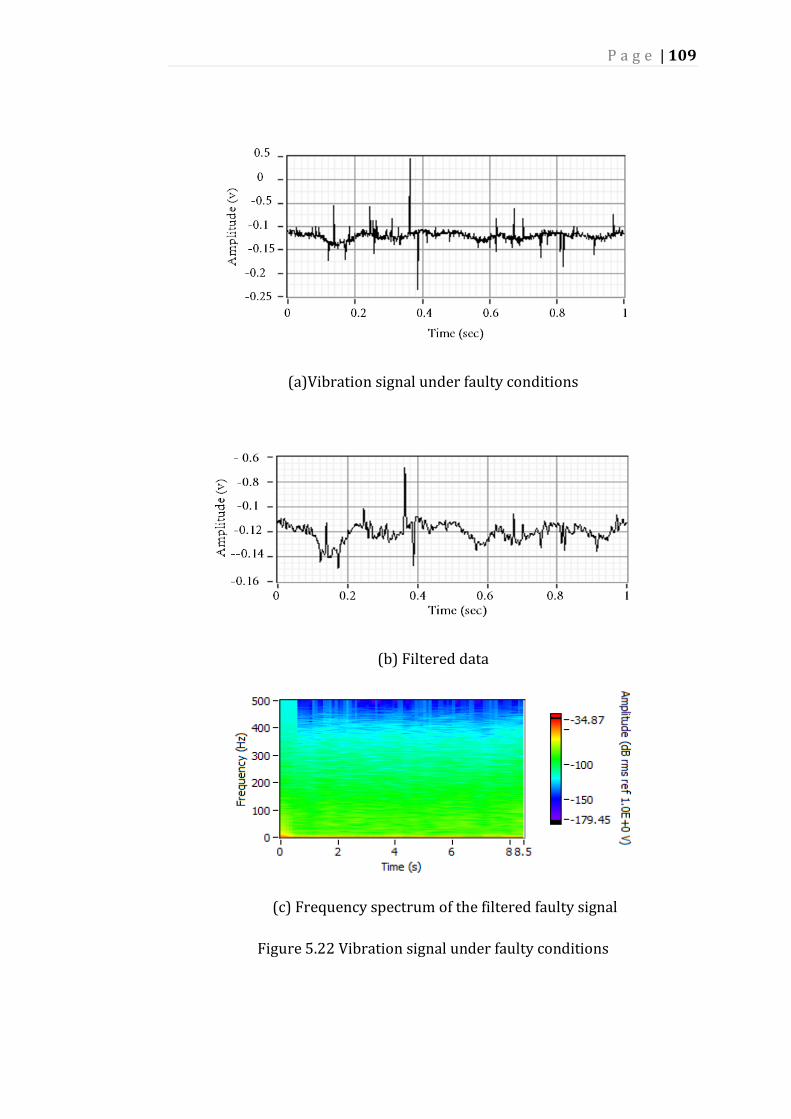
P a g e | 109
(a)Vibration signal under faulty conditions
(b) Filtered data
(c) Frequency spectrum of the filtered faulty signal
Figure 5.22 Vibration signal under faulty conditions
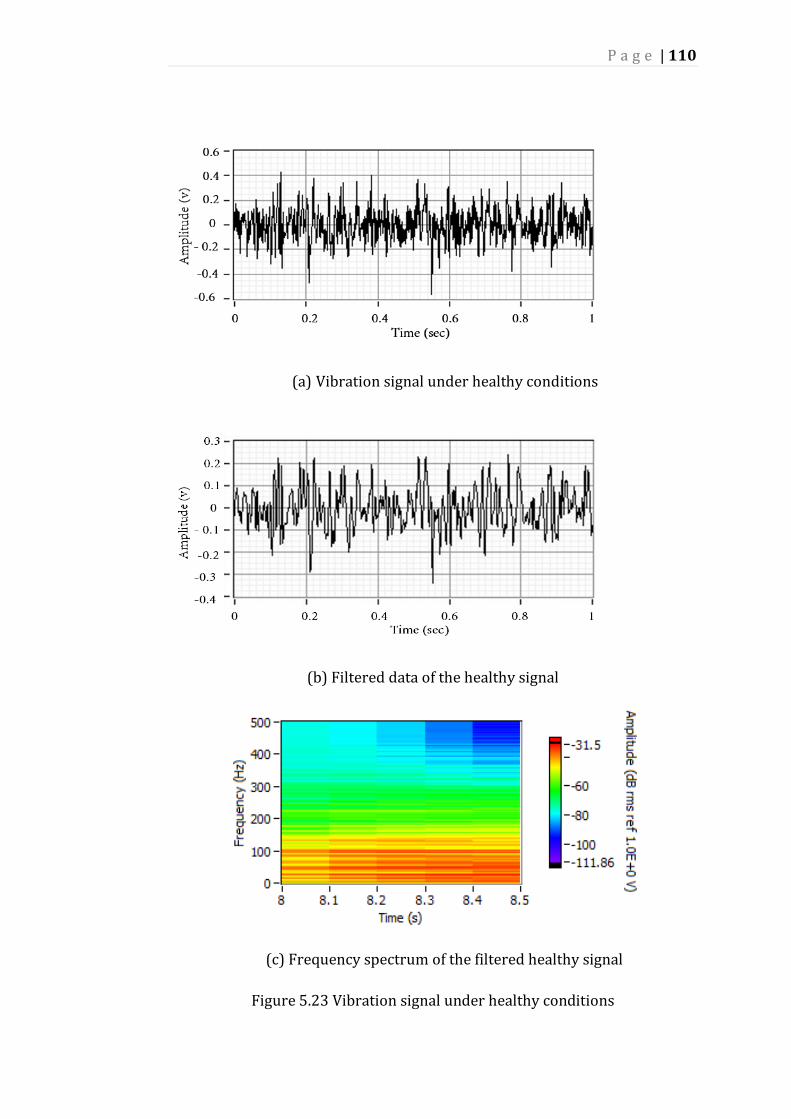
P a g e | 110
(a) Vibration signal under healthy conditions
(b) Filtered data of the healthy signal
(c) Frequency spectrum of the filtered healthy signal
Figure 5.23 Vibration signal under healthy conditions

P a g e | 111
Figures 5.22 and 5.23 show the measured vibration signatures during
normal and eccentricity fault conditions. Both cases use the same shaft speed
of 200 rpm and collect data from sensors positioned in the same place on the
gearbox. In fact the reason why this case was chosen to be conducted on a
single RPM because this speed is the ideal speed of the test rig setup based
on the capacity of the generator side and the rotor side (prime mover which
represents the blades of the WT). However, different variable speed was
applied on the test rig in other cases in this thesis. This ensures that any
differences can only originate from the bent shaft. In figure 5.23 (a, b), the
normal and the filtered signals show a smooth vibration signal with normal
harmonic sidebands; however, in figure 5.22 (a, b), the signal shows a
different starting point, with more fluctuating harmonics, as a result of the
abnormal alignment of the shaft sections. This stressed rotation can cause
teeth wear patterns and also progress to tooth breakage (due to heat action),
inclusions, and grinding burns. In figure (e), the frequency amplitude
changes in relation to the amount of stress (due to gear misalignment).
5.5 Fuzzy Logic Model
Fuzzy logic is utilised in a wide range of technologies. For wind energy
conversion systems, it is used to control power convertors, for wind
assessment and in maximum power search [156]. In this section, a fuzzy logic
model is introduced to identify various faults within the drivetrain of a wind
turbine. For all case studies, the inputs into the proposed model include the
maximum vibration amplitude and the corresponding time. These are
considered fuzzy variables.
In the first case study, a fuzzy logic model is developed based on the
vibration signature of a stressed drivetrain (shown in figure 5.4 (c)). Inputs
to the model are the vibration amplitudes and the time when the fault
occurred (as shown in table 5.3), while the output (represented by Gaussian

P a g e | 112
membership functions (MF)) is assumed to be in the range of 0-1.
Membership functions for the input and output variables (lowest to highest)
are as shown in figure 5.24 (a, b) and (c) respectively. Based on the results of
this case study, a set of rules has been developed to relate the input variables
with the output (as shown in figure 5.24 (d, e)). Results were collected from a
worst case scenario, where the wind turbine drivetrain is under a high level
of stress. This can be seen in figure 5.4 (c). Table 5.3 summarises all faulty
conditions, and outlines the recommended asset management decision
(based on the condition of the WT, and in order to establish the wind
turbine’s best availability and grid support).
(a)
(b)

P a g e | 113
(c)
(d)
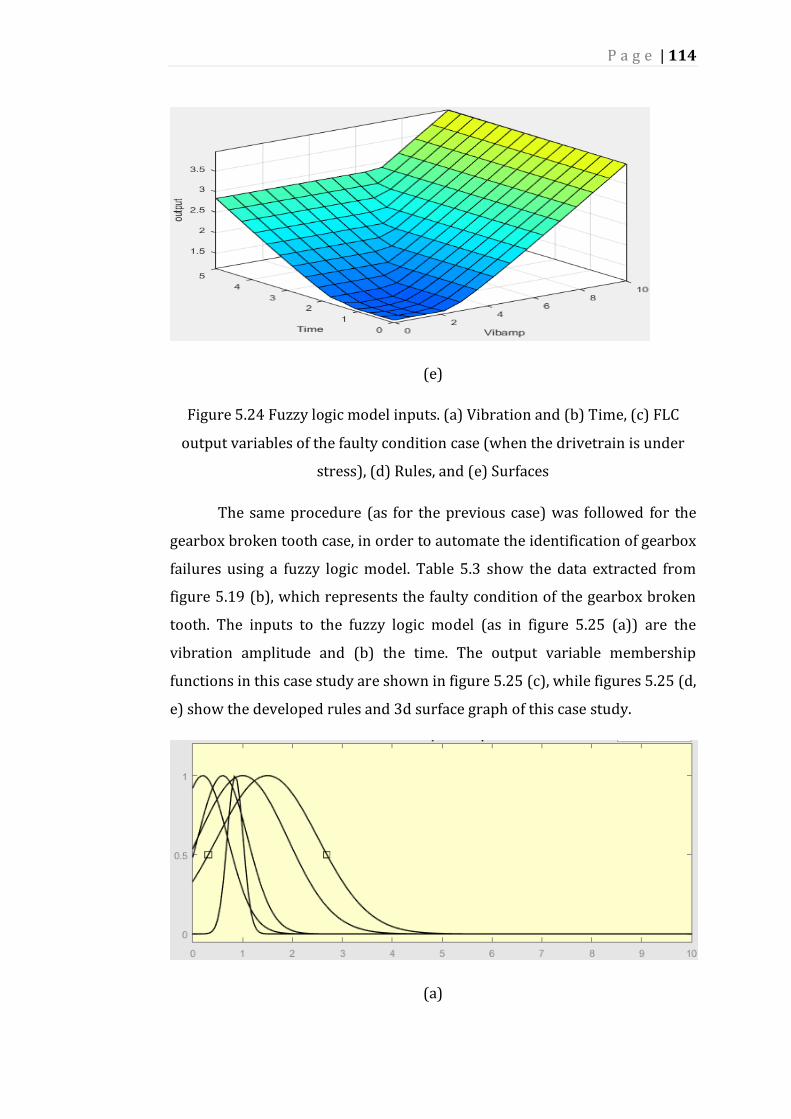
P a g e | 114
(e)
Figure 5.24 Fuzzy logic model inputs. (a) Vibration and (b) Time, (c) FLC
output variables of the faulty condition case (when the drivetrain is under
stress), (d) Rules, and (e) Surfaces
The same procedure (as for the previous case) was followed for the
gearbox broken tooth case, in order to automate the identification of gearbox
failures using a fuzzy logic model. Table 5.3 show the data extracted from
figure 5.19 (b), which represents the faulty condition of the gearbox broken
tooth. The inputs to the fuzzy logic model (as in figure 5.25 (a)) are the
vibration amplitude and (b) the time. The output variable membership
functions in this case study are shown in figure 5.25 (c), while figures 5.25 (d,
e) show the developed rules and 3d surface graph of this case study.
(a)
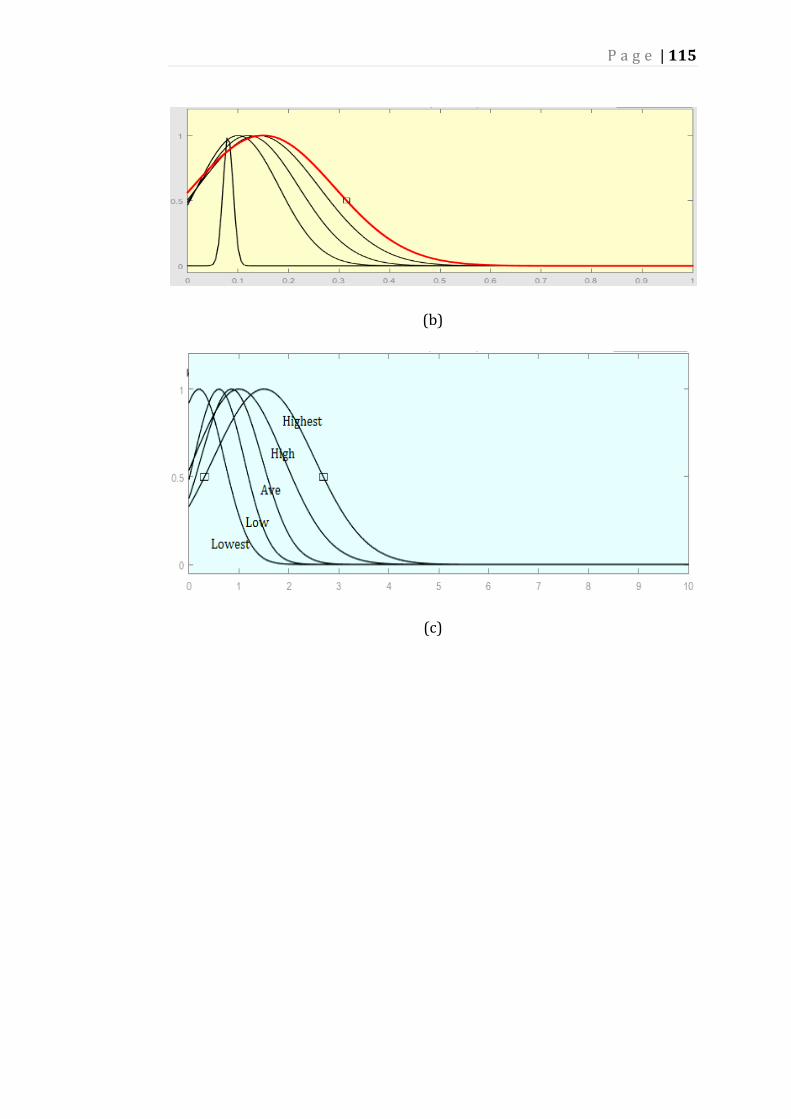
P a g e | 115
(b)
(c)
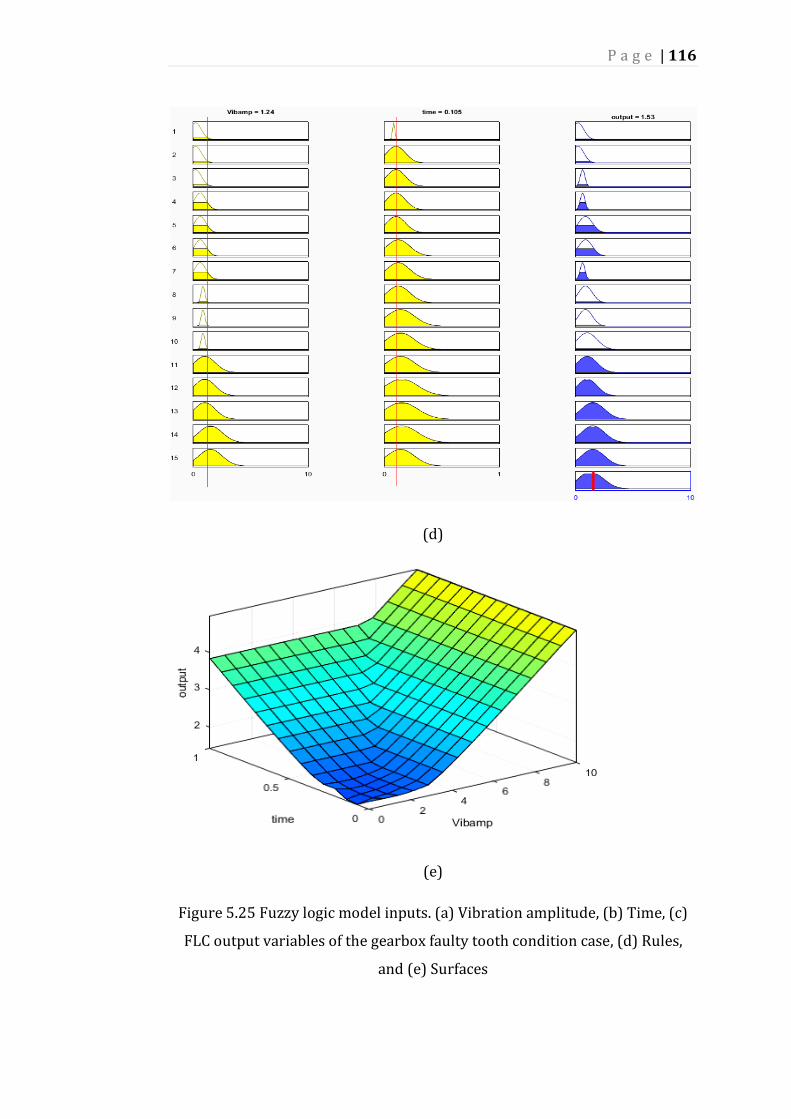
P a g e | 116
(d)
(e)
Figure 5.25 Fuzzy logic model inputs. (a) Vibration amplitude, (b) Time, (c)
FLC output variables of the gearbox faulty tooth condition case, (d) Rules,
and (e) Surfaces
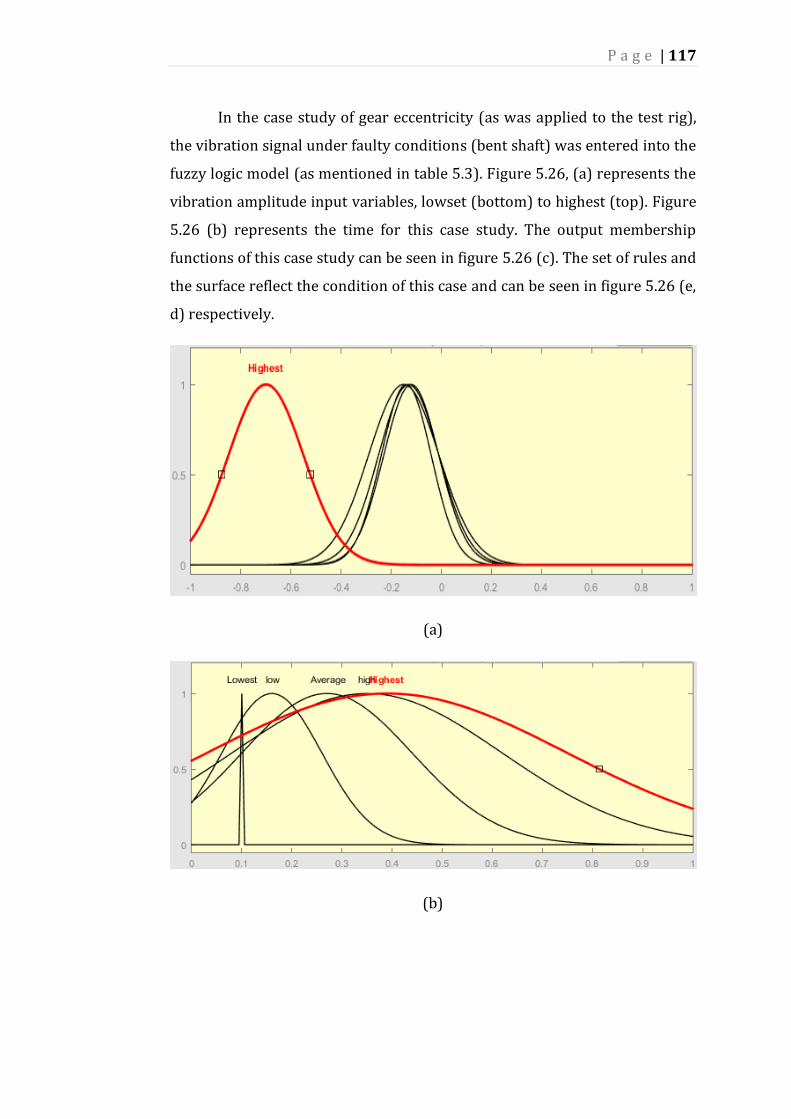
P a g e | 117
In the case study of gear eccentricity (as was applied to the test rig),
the vibration signal under faulty conditions (bent shaft) was entered into the
fuzzy logic model (as mentioned in table 5.3). Figure 5.26, (a) represents the
vibration amplitude input variables, lowset (bottom) to highest (top). Figure
5.26 (b) represents the time for this case study. The output membership
functions of this case study can be seen in figure 5.26 (c). The set of rules and
the surface reflect the condition of this case and can be seen in figure 5.26 (e,
d) respectively.
(a)
(b)
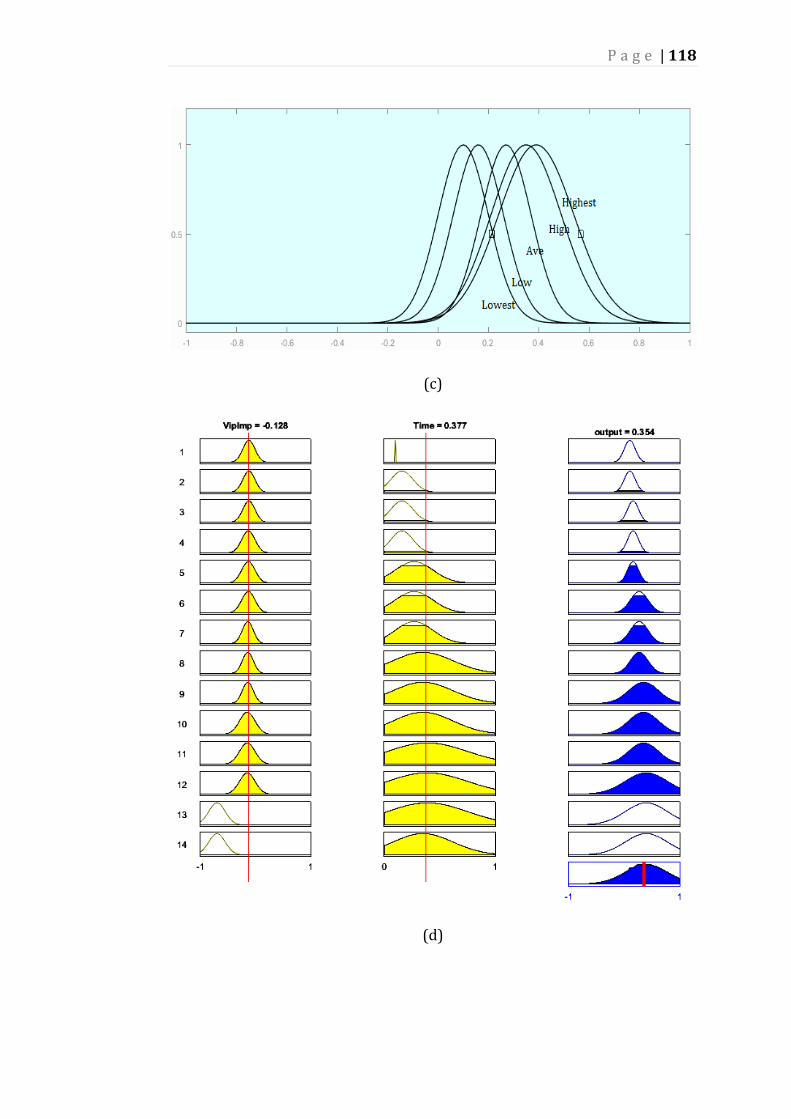
P a g e | 118
(c)
(d)
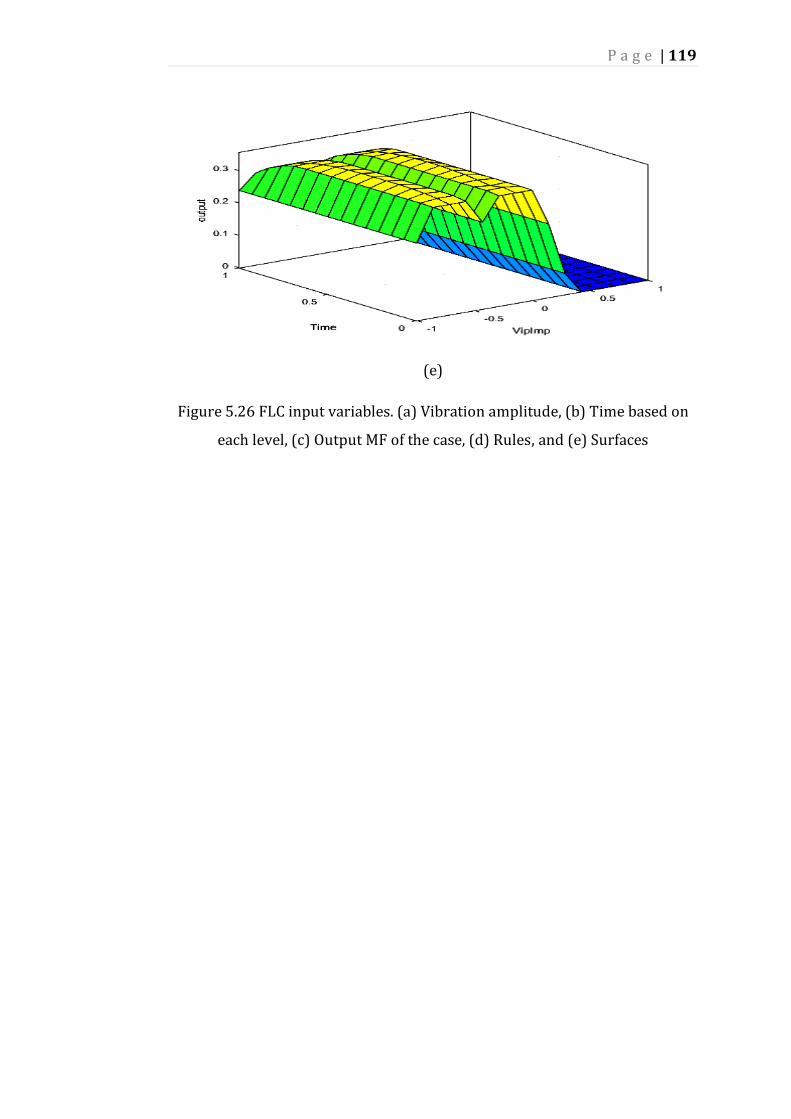
P a g e | 119
(e)
Figure 5.26 FLC input variables. (a) Vibration amplitude, (b) Time based on
each level, (c) Output MF of the case, (d) Rules, and (e) Surfaces
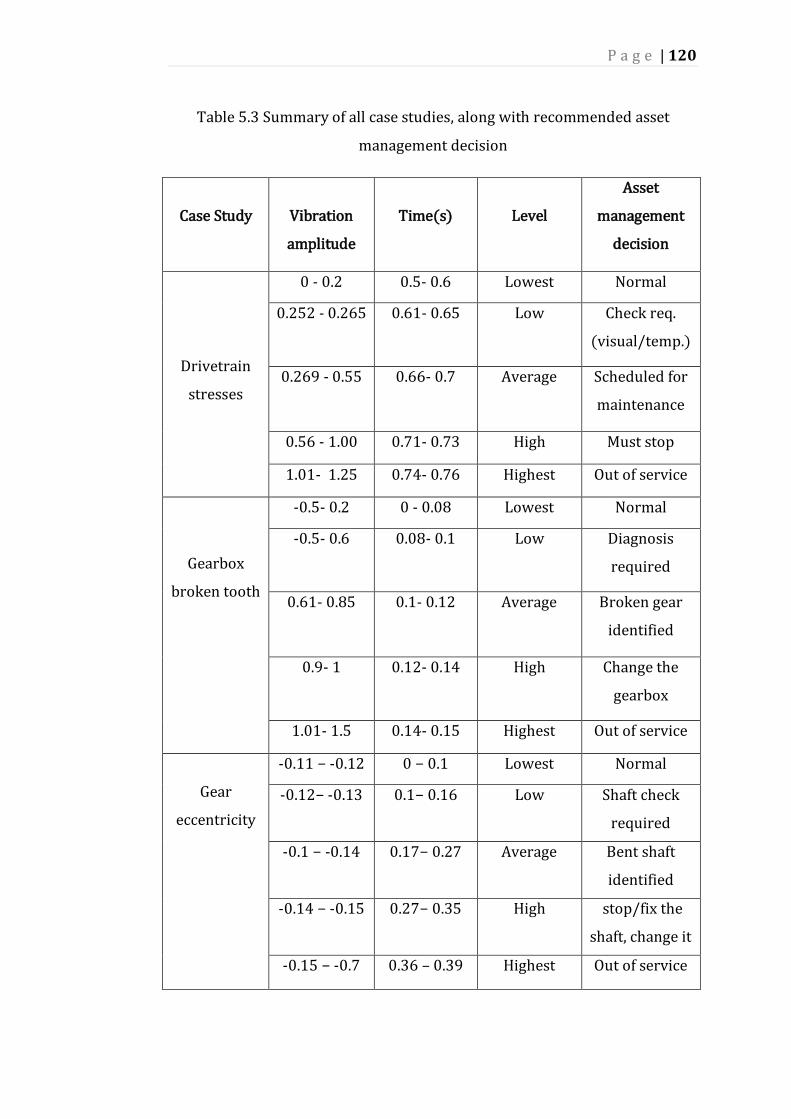
P a g e | 120
Table 5.3 Summary of all case studies, along with recommended asset
management decision
Case Study
Vibration
amplitude
Time(s)
Level
Asset
management
decision
Drivetrain
stresses
0 - 0.2 0.5- 0.6 Lowest Normal
0.252 - 0.265 0.61- 0.65 Low Check req.
(visual/temp.)
0.269 - 0.55 0.66- 0.7 Average Scheduled for
maintenance
0.56 - 1.00 0.71- 0.73 High Must stop
1.01- 1.25 0.74- 0.76 Highest Out of service
Gearbox
broken tooth
-0.5- 0.2 0 - 0.08 Lowest Normal
-0.5- 0.6 0.08- 0.1 Low Diagnosis
required
0.61- 0.85 0.1- 0.12 Average Broken gear
identified
0.9- 1 0.12- 0.14 High Change the
gearbox
1.01- 1.5 0.14- 0.15 Highest Out of service
Gear
eccentricity
-0.11 − -0.12 0 − 0.1 Lowest Normal
-0.12− -0.13 0.1− 0.16 Low Shaft check
required
-0.1 − -0.14 0.17− 0.27 Average Bent shaft
identified
-0.14 − -0.15 0.27− 0.35 High stop/fix the
shaft, change it
-0.15 − -0.7 0.36 – 0.39 Highest Out of service

P a g e | 121
5.6 Condition Monitoring and Asset Management Decision-
based WTOC
Based on the experiments conducted on the test rig, which consider
different possible scenarios (as outlined in the previous case studies along
with the literature review), an effective asset management decision model
can be provided for reliable operation and maintenance (O&M) of the wind
turbine.
To ensure a responsible decision model, all alarms (including false
alarms) were passed through all required interfaces and a hardware
arrangement. The decision will contribute to better power production, a
reduction in unrehearsed WT power failures, will enhance the availability of
the WT, as well as allowing time maintenance to be scheduled.
Calculating the probability of failure, as well the failure’s significance,
is critical to understanding the wind turbine operating condition (WTOC). It
reveals the status of the WT, and also the highest level of performance at
which it can survive before requiring scheduled maintenance. Figure 5.27
illustrates a proposed asset management and decision making strategy,
which consists of different levels of failure consequences, subsequently
clarified.

P a g e | 122
Figure 5.27 Asset management and decision-making based WTOC
Lowest: this level is the lowest risk level for both categories: failure
percentage and failure significance. This alert means that the WT can easily
survive until the next scheduled maintenance time without potential risk
involved.
Low: this level starts at the end of the lowest level, and ends before
the next level. The probability of failure here is around 30%, which means
the failure is likely to take place but not highly likely. This may leave the
operator divided as to what decision to make. Because the two categories
(probability of failure and failure significance) are not deemed high risk, the
operator is not required to make a quick decision. However, leaving the
turbine connected for a long time under these conditions is not
recommended.
Pr
ob
ab
ilit
y o
f fa
ilu
re
Failure significances
Highest
High
Average
Low
LOWEST
P a g e | 123
Average: .by this stage, the probability of failure and the
consequences of failure are around 60%, and the decision-maker has the
opportunity to look at the grid circumstances. For instance, if the grid is
suffering from a lack of productivity and therefore prone to retrospective
availability of network power, an extension should be obtained.
High: at this point, it is highly recommended for the operator to take
quick action within a short time frame, and ensure the WT is taken for
maintenance. This zone indicates the possibility for failure, and the failure’s
significance, is high.
Highest: immediate action needs to be taken at this time. If the WT
reaches this stage, the consequences of failure will be of the highest level and
will lead to the loss of the WT. Protection systems must be activated to
isolate the equipment from the network before any serious damage can
occur inside the WT components.
Table 5.5 summarises the different levels of PF&FS consequences,
along with the recommended action of the WT operator in order to keep the
WT in service. The actions should be carried out within network power
requirements and as soon as a good estimation for the time of next scheduled
maintenance has been provided by the CMS (based on the WTOC). When the
assets management decision-making table is applied to one of the case
studies in this chapter (i.e. the removed tooth case in figure 5.19 (c)), the
power output vibration levels initiate or trigger and send the commands
through the interference channels to the alarms on the monitoring system.
This is based on the present condition of the WT. Table 5.4 explains the case
conditions along with the approximate values that the CMS requires to take
action.

P a g e | 124
Table 5.4 Classification of the assets management.
Power output vib. Lowest Low Average High
Highest
Power vib. 𝑃𝑜 𝑃𝑜 ≤ 2 2 ≤ 𝑃𝑜 ≤ 4.5 4.5 ≤ 𝑃𝑜 ≤ 6 6 ≤ 𝑃𝑜 ≤ 10 12 ≤
𝑃𝑜
Table 5.5 Summary of asset management and decision-making.
PF versus FS
levels
CMS
indications
Immediate action
required
Lowest Yellow No
Low Orange Yes/No
Average Light Red Yes
High Red Yes
Highest Dark Red Yes
A study shows that failure of WT components can be very costly,
especially if the fault occurs on one of the WT’s most important parts, such as
the gearbox or the blades. Table 5.6 is taken from [157] and shows the
downtime and outage of the main components due to power failure. This is
shown for both onshore and offshore WTs and does not take into account
potential delays due to unacceptable weather conditions. Table 5.7 illustrates
the estimated cost to replace the major components of a 5 MW wind turbine,
based on [157].
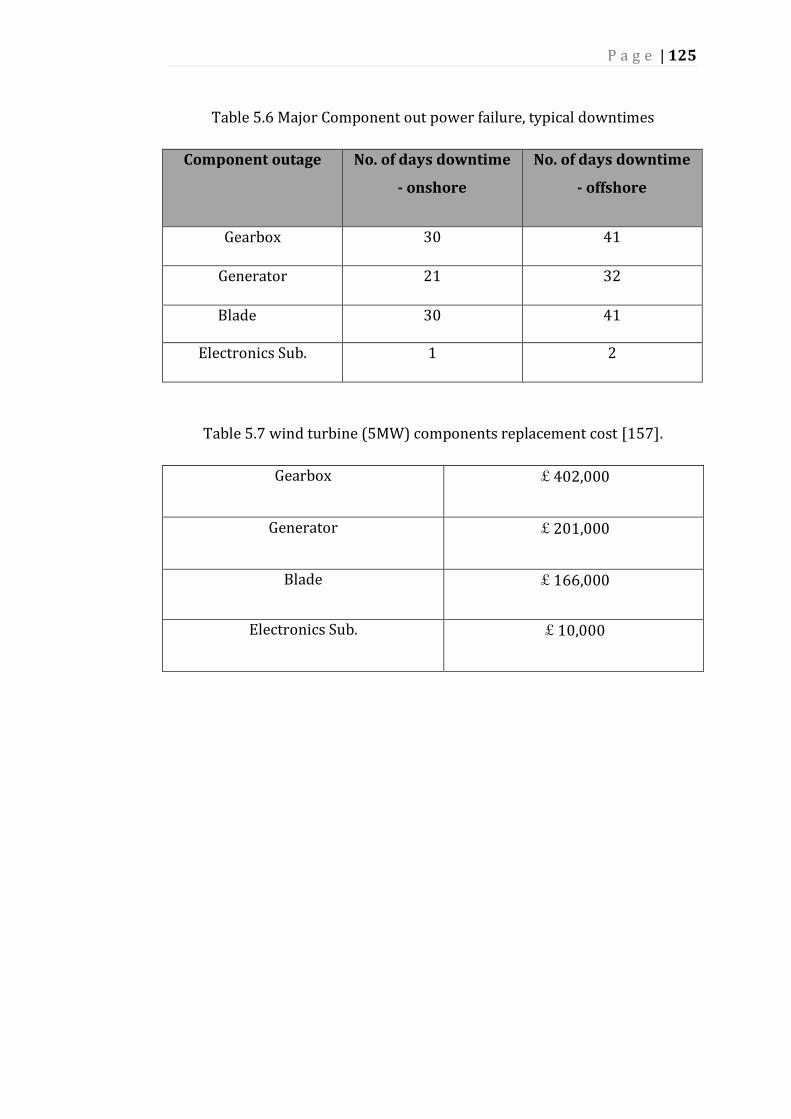
P a g e | 125
Table 5.6 Major Component out power failure, typical downtimes
Component outage No. of days downtime
- onshore
No. of days downtime
- offshore
Gearbox 30 41
Generator 21 32
Blade 30 41
Electronics Sub. 1 2
Table 5.7 wind turbine (5MW) components replacement cost [157].
Gearbox £402,000
Generator £201,000
Blade £166,000
Electronics Sub. £10,000

P a g e | 126
Chapter 6 Conclusion
and Future Work
P a g e | 127
6.1 Conclusion
In order to eliminate the detrimental impacts of conventional
electricity generation technologies, the utilisation of renewable energy
resources has grown rapidly. Wind turbines are a compatible target;
therefore. a reliable and effective condition monitoring and fault diagnosis
system (CMFDSs) is of a significant priority. This thesis proposes an
improved performance of the WT by monitoring and diagnosing various
mechanical failures modes within the drivetrain.
The thesis has discussed the various commercial tasks required of the
condition monitoring systems currently available for wind turbines. A
comprehensive literature review to summarise the current state of the art
techniques in WTCMSs, including failure and diagnosis was presented in
chapter 2. The importance of the WT gearbox in maintaining the overall
reliability and availability of the wind turbine has also been discussed. Based
on the fact that wind speed variations cause more stresses to the whole
drivetrain of the WT, a condition based maintenance (CBM) system has been
introduced to prevent unexpected failures.
In chapter 3, a number of common and generally applied CMS signal
processing approaches are introduced, including FFT, order analysis and the
wavelet transfer technique. The importance of these techniques and their
significant contribution to a WTCMS, as well their advantages and
disadvantages, are listed.
A test rig setup was developed to analyse the collected signals as
described in chapter 4. This test rig reflects the real operational conditions
that the wind turbine experiences during its lifespan. The wind turbine’s
main components are explained, as well as application mechanisms that
involve movements and/or breaking systems.
P a g e | 128
The signals recorded from the CM test rig were processed and
analysed, based on the techniques mentioned in chapter 3, using LabVIEW
and Matlab software packages.
The results from different case studies showed the successful
capability of the measured vibration and torque signals in detecting faulty
conditions applied to the WT test rig. All the applied fault scenarios clearly
show the difference between healthy and faulty conditions, especially when
wavelet is used to analyse these signals. Results also show that the wavelet
transfer technique (WTT) is more than capable in identifying low energy
incipient faults and the flexibility of time and frequency resolutions, which
are not likely to be detected using only FFT. The FFT technique is well known
in frequency domain fault detection; however, it is not an effective technique
when it comes to light loads, and time information can be lost in the process.
In addition, the “inherent averaging process” misses essential data present
within the signal.
The fuzzy logic (FLC) model was introduced to outline the results of
the case studies in chapter 5, and was based on the faulty scenarios applied
to the test rig setup.
Condition monitoring and asset management decision-making, based
on wind turbine operating conditions, have been demonstrated. An asset
management fuzzy logic-based model, for the WT operator to take proper
asset action, has also been developed.

P a g e | 129
6.2 Future Work
Wind turbine condition monitoring is still under investigation and further
improvements are to be carried out. Additional development of test rigs,
based on practical and real data from sites, will contribute to improvements
in the functionality of the CMS. The work presented in this thesis has been
conducted on a small scale test rig. Further investigation on a real setup will
better reflect outcomes, due to the limitations a small setup may face, such as
the limited number of sensors, transducers and even reduced shaft sizes.
Wavelet families are still a challenging subject and require further
investigation as to the best way to choose which one is more accurate for use
with a particular concern (such as bearing damage, root teeth failure (tooth
to tooth transmission error )).
An effective design is required, which merges the sensors and signal
processing techniques that contribute to the improved performance of a
wind turbine. The development of such a collaboration will have a potentially
positive impact on the WECS.
P a g e | 130
References
[1] Y. Wenxian, P. J. Tavner, C. J. Crabtree, and M. Wilkinson, "Cost-Effective
Condition Monitoring for Wind Turbines," Industrial Electronics, IEEE
Transactions on, vol. 57, pp. 263-271, 2010.
[2] M. Molinas, J. A. Suul, and T. Undeland, "Extending the life of gear box in
wind generators by smoothing transient torque with STATCOM," Industrial
Electronics, IEEE Transactions on, vol. 57, pp. 476-484, 2010.
[3] A. Salem, A. Abu-Siada, and S. Islam, "A review of condition monitoring
techniques of the wind turbines gearbox and rotor," International Journal of
Electrical Energy, vol. 2 No 1, pp. 53-56, 2013.
[4] C. Kar and A. Mohanty, "Monitoring gear vibrations through motor current
signature analysis and wavelet transform," Mechanical systems and signal
processing, vol. 20, pp. 158-187, 2006.
[5] C. E. Council, "Clean energy Australia report 2014," 2015.
[6] K. Maki, R. Sbragio, and N. Vlahopoulos, "System design of a wind turbine
using a multi-level optimization approach," Renewable Energy, 2011.
[7] Growth of wind turbine size, Intelligent Energy Eroup and European Wind
Energy Association (EWEA), web: http://www.ewea.org , available at
http://www.wind-energy-the-facts.org, access date: March 2016

P a g e | 131
[8] y. L. Bin Wu, Navid Zargari, Samir Kouro, Power Conversion and Control of
Wind Energy Systems vol. 74. United States of America: John
Wiley&Sons,Inc,Hooboken, New Jersey, 2011.
[9] R. L. Busby, Wind Power: The Industry Grows Up: PennWell Books, 2012.
[10] S. Heier, Grid integration of wind energy conversion systems: Wiley, 1998.
[11] T. Ackermann, Wind power in power systems: John Wiley & Sons, 2005.
[12] E. Hau, "Wind Turbines-Fundamentals, Technologies, Application,
Economics," IEEE Electrical Insulation Magazine, vol. 19, p. 48, 2003.
[13] Y. Han and Y. Song, "Condition monitoring techniques for electrical
equipment-a literature survey," Power Delivery, IEEE Transactions on, vol.
18, pp. 4-13, 2003.
[14] Y. Zhan, V. Makis, and A. K. Jardine, "Adaptive state detection of gearboxes
under varying load conditions based on parametric modelling," Mechanical
Systems and Signal Processing, vol. 20, pp. 188-221, 2006.
[15] R. Hyers, J. McGowan, K. Sullivan, J. Manwell, and B. Syrett, "Condition
monitoring and prognosis of utility scale wind turbines," Energy Materials:
Materials Science and Engineering for Energy Systems, vol. 1, pp. 187-203,
2006.
[16] Z. Hameed, Y. Hong, Y. Cho, S. Ahn, and C. Song, "Condition monitoring and
fault detection of wind turbines and related algorithms: A review,"
Renewable and Sustainable Energy Reviews, vol. 13, pp. 1-39, 2009.

P a g e | 132
[17] Y. Amirat, M. Benbouzid, B. Bensaker, and R. Wamkeue, "Condition
monitoring and ault diagnosis in wind energy conversion systems: a
review," in Electric Machines & Drives Conference, 2007. IEMDC'07. IEEE
International, 2007, pp. 1434-1439.
[18] P. Tavner, G. Van Bussel, and F. Spinato, "Machine and converter reliabilities
in wind turbines," 2006.
[19] M. R. Wilkinson, F. Spinato, and P. J. Tavner, "Condition monitoring of
generators & other subassemblies in wind turbine drive trains," in
Diagnostics for Electric Machines, Power Electronics and Drives, 2007.
SDEMPED 2007. IEEE International Symposium on, 2007, pp. 388-392.
[20] Y. Amirat, M. E. H. Benbouzid, E. Al-Ahmar, B. Bensaker, and S. Turri, "A brief
status on condition monitoring and fault diagnosis in wind energy
conversion systems," Renewable and Sustainable Energy Reviews, vol. 13, pp.
2629-2636, 2009.
[21] B. Lu, Y. Li, X. Wu, and Z. Yang, "A review of recent advances in wind turbine
condition monitoring and fault diagnosis," in Power Electronics and Machines
in Wind Applications, 2009. PEMWA 2009. IEEE, 2009, pp. 1-7.
[22] A. Kusiak and W. Li, "The prediction and diagnosis of wind turbine faults,"
Renewable Energy, vol. 36, pp. 16-23, 2011.
[23] P. Tavner, L. Ran, and J. Penman, Condition monitoring of rotating electrical
machines vol. 56: IET, 2008.
P a g e | 133
[24] P. G. Steve Barber. (2004). Case study 2: Wind Farm in Canada, Megawatt
Class Turbines, Age: 3 years. Available [Cited 08 October 2015] :
http://www.wwindea.org/technology/ch03/en/3_4_3.html.
[25] J. M. Carrasco, L. G. Franquelo, J. T. Bialasiewicz, E. Galván, R. C. P. Guisado, M.
Á. M. Prats, et al., "Power-electronic systems for the grid integration of
renewable energy sources: A survey," Industrial Electronics, IEEE
Transactions on, vol. 53, pp. 1002-1016, 2006.
[26] "Innovative solutions for preventing white etching cracks," ed.
BERLIN/SCHWEINFURT: SCHAEFFLER AG,, 2015.
[27] H. Link, W. LaCava, J. Van Dam, B. McNiff, S. Sheng, R. Wallen, et al., "Gearbox
reliability collaborative project report: findings from phase 1 and phase 2
testing," Contract, vol. 303, pp. 275-3000, 2011.
[28] D. G. Astridge, "Helicopter transmissions—Design for safety and reliability,"
Proceedings of the Institution of Mechanical Engineers, Part G: Journal of
Aerospace Engineering, vol. 203, pp. 123-138, 1989.
[29] E. d. Vries, "Wind turbine gearboxes and the effort to improve their
reliability," in Wind Power, ed. UK: Windcomms, 2010.
[30] K. Fischer, F. Besnard, and L. Bertling, "Reliability-centered maintenance for
wind turbines based on statistical analysis and practical experience," Energy
Conversion, IEEE Transactions on, vol. 27, pp. 184-195, 2012.
P a g e | 134
[31] Z. Zhang, A. Verma, and A. Kusiak, "Fault Analysis and Condition Monitoring
of the Wind Turbine Gearbox," Energy Conversion, IEEE Transactions on, vol.
27, pp. 526-535, 2012.
[32] X. Wang, V. Makis, and M. Yang, "A wavelet approach to fault diagnosis of a
gearbox under varying load conditions," Journal of Sound and Vibration, vol.
329, pp. 1570-1585, 2010.
[33] J. Cibulka, M. K. Ebbesen, and K. G. Robbersmyr, "Bearing Fault Detection in
Induction Motor-Gearbox Drivetrain," in Journal of Physics: Conference
Series, 2012, p. 012140.
[34] L. C. Xiaohong Yuan, "Variable amplitude Fourier series with its application
in gearbox diagnosis—Part II: Experiment and application," ScienceDirect,
vol. 19, pp. 1067-1081, 2005.
[35] J. Tang and H. Luo, "Wind Turbine Gearbox Fault Detection Using Multiple
Sensors With Features Level Data Fusion," Journal of Engineering for Gas
Turbines and Power, vol. 134, pp. 042501-1, 2012.
[36] S. J. Watson, B. J. Xiang, W. Yang, P. J. Tavner, and C. J. Crabtree, "Condition
monitoring of the power output of wind turbine generators using wavelets,"
Energy Conversion, IEEE Transactions on, vol. 25, pp. 715-721, 2010.
[37] E. Wiggelinkhuizen, T. Verbruggen, H. Braam, L. Rademakers, J. Xiang, and S.
Watson, "Assessment of condition monitoring techniques for offshore wind

P a g e | 135
farms," Journal of solar energy engineering, vol. 130, pp. 030301.1-
031020.12, 2008.
[38] N. Baydar and A. Ball, "Detection of gear deterioration under varying load
conditions by using the instantaneous power spectrum," Mechanical Systems
and Signal Processing, vol. 14, pp. 907-921, 2000.
[39] R. Zimroz and A. Bartkowiak, "Two simple multivariate procedures for
monitoring planetary gearboxes in non-stationary operating conditions,"
Mechanical Systems and Signal Processing, vol. 38, pp. 237-247, 2013.
[40] W. Bartelmus and R. Zimroz, "A new feature for monitoring the condition of
gearboxes in non-stationary operating conditions," Mechanical Systems and
Signal Processing, vol. 23, pp. 1528-1534, 2009.
[41] C. Stander and P. Heyns, "Instantaneous angular speed monitoring of
gearboxes under non-cyclic stationary load conditions," Mechanical Systems
and Signal Processing, vol. 19, pp. 817-835, 2005.
[42] C. Stander, P. Heyns, and W. Schoombie, "Using vibration monitoring for
local fault detection on gears operating under fluctuating load conditions,"
Mechanical Systems and Signal Processing, vol. 16, pp. 1005-1024, 2002.
[43] K. S. Gaeid and H. W. Ping, "Wavelet Fault Diagnosis of Induction Motor," cdn.
intechopen. com, 2009.
[44] F. Haghjoo and S. M. Shahrtash, "Wavelet transform based decomposition
and reconstruction for on-line PD detection and measurement. Part I:

P a g e | 136
Narrow band components decomposition," European Transactions on
Electrical Power, vol. 20, pp. 901-914, 2010.
[45] S. H. Kia, H. Henao, and S. G. A. Capolino, "Diagnosis of Broken Bar Fault in
Induction Machines Using Discrete Wavelet Transform without Slip
Estimation," in Industry Applications Conference, 2007. 42nd IAS Annual
Meeting. Conference Record of the 2007 IEEE, 2007, pp. 1917-1922.
[46] W. Wang and P. McFadden, "Early detection of gear failure by vibration
analysis i. calculation of the time-frequency distribution," Mechanical
systems and signal processing, vol. 7, pp. 193-203, 1993.
[47] P. McFadden, "Examination of a technique for the early detection of failure in
gears by signal processing of the time domain average of the meshing
vibration," Mechanical systems and signal processing, vol. 1, pp. 173-183,
1987.
[48] S. Li, "Effects of centrifugal load on tooth contact stresses and bending
stresses of thin-rimmed spur gears with inclined webs," Mechanism and
Machine Theory, vol. 59, pp. 34-47, 2013.
[49] S. K. Tiwari and U. K. Joshi, "Stress analysis of mating involute spur gear
teeth," in International Journal of Engineering Research and Technology,
2012.
P a g e | 137
[50] W. D. Mark, H. Lee, R. Patrick, and J. D. Coker, "A simple frequency-domain
algorithm for early detection of damaged gear teeth," Mechanical systems
and signal processing, vol. 24, pp. 2807-2823, 2010.
[51] M. Asmine, J. Brochu, J. Fortmann, R. Gagnon, Y. Kazachkov, C.-E. Langlois, et
al., "Model validation for wind turbine generator models," Power Systems,
IEEE Transactions on, vol. 26, pp. 1769-1782, 2011.
[52] F. Combet and L. Gelman, "Novel adaptation of the demodulation technology
for gear damage detection to variable amplitudes of mesh harmonics,"
Mechanical systems and signal processing, vol. 25, pp. 839-845, 2011.
[53] Y. Lei, D. Kong, J. Lin, and M. J. Zuo, "Fault detection of planetary gearboxes
using new diagnostic parameters," Measurement Science and Technology, vol.
23, p. 055605, 2012.
[54] P. Tavner, "A survey of wind turbine condition monitoring experience in
Europe," in Wind Turbine Condition Monitoring Workshop, 2011, pp. 19-21.
[55] O. Ozgener and L. Ozgener, "Exergy and reliability analysis of wind turbine
systems: a case study," Renewable and Sustainable Energy Reviews, vol. 11,
pp. 1811-1826, 2007.
[56] A. Staino, B. Basu, and S. R. Nielsen, "Actuator control of edgewise vibrations
in wind turbine blades," Journal of Sound and Vibration, vol. 331, pp. 1233-
1256, 2012.

P a g e | 138
[57] S. Sheng and W. Yang, "Wind Turbine Drivetrain Condition Monitoring-An
Overview (Presentation)," National Renewable Energy Laboratory (NREL),
Golden, CO.2013.
[58] T. Thiringer and J.-Å. Dahlberg, "Periodic pulsations from a three-bladed
wind turbine," Energy conversion, IEEE Transactions on, vol. 16, pp. 128-133,
2001.
[59] E. Hinrichsen and P. Nolan, "Dynamics and stability of wind turbine
generators," Power Apparatus and Systems, IEEE Transactions on, pp. 2640-
2648, 1982.
[60] A. A. Salem, A. Abu-Siada, and S. Islam, "Condition Monitoring Techniques of
the Wind Turbines Gearbox and Rotor," International Journal of Electrical
Energy, vol. 2, pp. 53-56, 2014.
[61] R. Randall, "A new method of modeling gear faults," Journal of Mechanical
Design, vol. 104, pp. 259-267, 1982.
[62] P. McFadden, "Detecting fatigue cracks in gears by amplitude and phase
demodulation of the meshing vibration," Journal of Vibration and Acoustics,
vol. 108, pp. 165-170, 1986.
[63] Z. Feng and F. Chu, "Application of atomic decomposition to gear damage
detection," Journal of Sound and Vibration, vol. 302, pp. 138-151, 2007.
[64] Z. Feng, M. Liang, Y. Zhang, and S. Hou, "Fault diagnosis for wind turbine
planetary gearboxes via demodulation analysis based on ensemble empirical
P a g e | 139
mode decomposition and energy separation," Renewable Energy, vol. 47, pp.
112-126, 2012.
[65] Z. Feng, M. J. Zuo, and F. Chu, "Application of regularization dimension to
gear damage assessment," Mechanical Systems and Signal Processing, vol. 24,
pp. 1081-1098, 2010.
[66] Z. Feng, M. J. Zuo, R. Hao, F. Chu, and M. El Badaoui, "Gear damage
assessment based on cyclic spectral analysis," Reliability, IEEE Transactions
on, vol. 60, pp. 21-32, 2011.
[67] G. Mandic, A. Nasiri, E. Muljadi, and F. Oyague, "Active torque control for
gearbox load reduction in a variable-speed wind turbine," Industry
Applications, IEEE Transactions on, vol. 48, pp. 2424-2432, 2012.
[68] H. Endo and R. Randall, "Enhancement of autoregressive model based gear
tooth fault detection technique by the use of minimum entropy
deconvolution filter," Mechanical Systems and Signal Processing, vol. 21, pp.
906-919, 2007.
[69] W. Wang and P. McFadden, "Application of wavelets to gearbox vibration
signals for fault detection," Journal of Sound and Vibration, vol. 192, pp. 927-
939, 1996.
[70] R. Yan and R. X. Gao, "Harmonic wavelet-based data filtering for enhanced
machine defect identification," Journal of Sound and Vibration, vol. 329, pp.
3203-3217, 2010.

P a g e | 140
[71] Y. Lu, X. Wang, J. Tang, and Y. Ding, "Damage detection using piezoelectric
transducers and the Lamb wave approach: II. Robust and quantitative
decision making," Smart Materials and Structures, vol. 17, p. 025034, 2008.
[72] D. E. Newland, "Harmonic wavelet analysis," in Proceedings of the Royal
Society of London A: Mathematical, Physical and Engineering Sciences, 1993,
pp. 203-225.
[73] D. E. Newland, "Harmonic and musical wavelets," in Proceedings of the Royal
Society of London A: Mathematical, Physical and Engineering Sciences, 1994,
pp. 605-620.
[74] S. Mallat and W. L. Hwang, "Singularity detection and processing with
wavelets," Information Theory, IEEE Transactions on, vol. 38, pp. 617-643,
1992.
[75] D. L. Donoho, "De-noising by soft-thresholding," Information Theory, IEEE
Transactions on, vol. 41, pp. 613-627, 1995.
[76] J. Zhu, J. M. Yoon, D. He, and E. Bechhoefer, "Online particle‐contaminated
lubrication oil condition monitoring and remaining useful life prediction for
wind turbines," Wind Energy, vol. 18, pp. 1131-1149, 2015.
[77] H. Shah and H. Hirani, "Online condition monitoring of spur gears,"
International Journal of Condition Monitoring, vol. 4, pp. 15-22, 2014.
P a g e | 141
[78] Y. Zhan and V. Makis, "A robust diagnostic model for gearboxes subject to
vibration monitoring," Journal of Sound and vibration, vol. 290, pp. 928-955,
2006.
[79] L. Gelman, R. Zimroz, J. Birkel, H. Leigh-Firbank, D. Simms, B. Waterland, et
al., "Adaptive vibration condition monitoring technology for local tooth
damage in gearboxes," Insight-Non-Destructive Testing and Condition
Monitoring, vol. 47, pp. 461-464, 2005.
[80] D. R. Barron, Engineering condition monitoring: practice, methods and
applications: Longman, 1996.
[81] G. Luo, D. Osypiw, and M. Irle, "Real-time condition monitoring by significant
and natural frequencies analysis of vibration signal with wavelet filter and
autocorrelation enhancement," Journal of Sound and Vibration, vol. 236, pp.
413-430, 2000.
[82] J. D. Smith, Vibration measurement and analysis: Butterworths, 1989.
[83] J. M. e Silva, "Machinery Vibration Measurements and Analysis," in Vibration
and Wear in High Speed Rotating Machinery, ed: Springer, 1990, pp. 221-239.
[84] T. G. Habetler, "Effects of time-varying loads on rotor fault detection in
induction machines," Industry Applications, IEEE Transactions on, vol. 31, pp.
900-906, 1995.
P a g e | 142
[85] R. G. T. De Almeida, S. A. da Silva Vicente, and L. R. Padovese, "New technique
for evaluation of global vibration levels in rolling bearings," Shock and
Vibration, vol. 9, pp. 225-234, 2002.
[86] Z. Liu, X. Yin, Z. Zhang, D. Chen, and W. Chen, "Online rotor mixed fault
diagnosis way based on spectrum analysis of instantaneous power in
squirrel cage induction motors," Energy Conversion, IEEE Transactions on,
vol. 19, pp. 485-490, 2004.
[87] Z. Peng, N. Kessissoglou, and M. Cox, "A study of the effect of contaminant
particles in lubricants using wear debris and vibration condition monitoring
techniques," Wear, vol. 258, pp. 1651-1662, 2005.
[88] D. P. Walsh, "Oil Analysis 101," Orbit, vol. 25, pp. 50-55, 2005.
[89] L. A. Toms and A. M. Toms, Machinery Oil Analysis: Methods, Automation and
Benefits: a Guide for Maintenance Managers, Supervisors & Technicians:
Society of Tribologists and Lubrication Engineers, 2008.
[90] Machinery Lubrication, accessed from http://www.machinerylubrication.com
on June 11, 2015.
[91] C. C. Ciang, J.-R. Lee, and H.-J. Bang, "Structural health monitoring for a wind
turbine system: a review of damage detection methods," Measurement
Science and Technology, vol. 19, p. 122001, 2008.
[92] R. Sharma and U. Madawala, "The concept of a smart wind turbine system,"
Renewable Energy, vol. 39, pp. 403-410, 2012.

P a g e | 143
[93] F. Besnard and L. Bertling, "An approach for condition-based maintenance
optimization applied to wind turbine blades," Sustainable Energy, IEEE
Transactions on, vol. 1, pp. 77-83, 2010.
[94] P. Schubel, R. Crossley, E. Boateng, and J. Hutchinson, "Review of structural
health and cure monitoring techniques for large wind turbine blades,"
Renewable Energy, vol. 51, pp. 113-123, 2013.
[95] A. McIlhagger, D. Brown, and B. Hill, "The development of a dielectric system
for the on-line cure monitoring of the resin transfer moulding process,"
Composites Part A: Applied Science and Manufacturing, vol. 31, pp. 1373-
1381, 2000.
[96] V. Antonucci, M. Giordano, A. Cusano, J. Nasser, and L. Nicolais, "Real time
monitoring of cure and gelification of a thermoset matrix," Composites
science and technology, vol. 66, pp. 3273-3280, 2006.
[97] R. Harrold and Z. Sanjana, "Acoustic waveguide monitoring of the cure and
structural integrity of composite materials," Polymer Engineering & Science,
vol. 26, pp. 367-372, 1986.
[98] D. D. Shepard and K. R. Smith, "Ultrasonic cure monitoring of advanced
composites," Sensor Review, vol. 19, pp. 187-194, 1999.
[99] T. Thiringer and J. Linders, "Control by variable rotor speed of a fixed-pitch
wind turbine operating in a wide speed range," Energy Conversion, IEEE
Transactions on, vol. 8, pp. 520-526, 1993.

P a g e | 144
[100] J. Wu and F. Lai, "Fatigue Life Analysis of Small Composite Sandwich Wind
Tuebine Blades," Procedia Engineering, vol. 14, pp. 2014-2020, 2011.
[101] G. Gualtieri and S. Secci, "Wind shear coefficients, roughness length and
energy yield over coastal locations in Southern Italy," Renewable Energy, vol.
36, pp. 1081-1094, 2011.
[102] F. R. Marzabadi, M. Soltani, and M. Masdari, "Experimental Investigation of
the Leadingedge Roughness on the Boundary Layer of a Plunging Airfoil," in
27th International Congress of the Aeronautical Sciences, 2010, pp. 1-7.
[103] R. Van Rooij and W. Timmer, "Roughness sensitivity considerations for thick
rotor blade airfoils," Journal of Solar Energy Engineering, vol. 125, pp. 468-
478, 2003.
[104] N. Ren and J. Ou, "Dust effect on the performance of wind turbine airfoils,"
Journal of Electromagnetic Analysis and Applications, vol. 1, p. 102, 2009.
[105] G. Mohammed and M. Aboelyazied, "Effect of dust on the performance of
wind turbines," Desalination, vol. 209, pp. 209-220, 2007.
[106] L. Battisti, Wind Turbines in Cold Climates: Icing Impacts and Mitigation
Systems: Springer, 2015.
[107] T. Laakso, H. Holttinen, G. Ronsten, L. Tallhaug, R. Horbaty, I. Baring-Gould,
et al., "State-of-the-art of wind energy in cold climates," IEA annex XIX, vol.
24, 2003.

P a g e | 145
[108] H. Seifert, "Technical requirements for rotor blades operating in cold
climate," BOREAS VI, vol. 9, 2003.
[109] B. Tammelin, M. Cavaliere, H. Holtinnen, C. Morgan, H. Seifert, and K. Säntti,
"Wind Energy in Cold Climate, Final Report WECO (JOR3-CT95-0014)," ISBN
951-679-518-6, Finnish Meteorological Institute, Helsinki, Finland2000.
[110] J. F. Maissan, "Wind power development in sub-arctic conditions with severe
rime icing," Northern Review, 2002.
[111] H. Dobesch and G. Kury, Basic meteorological concepts and recommendations
for the exploitation of wind energy in the atmospheric boundary layer:
Zentralanstalt für Meteorologie und Geodynamik, 2006.
[112] R. X. Gao and R. Yan, Wavelets: Theory and applications for manufacturing:
Springer Science & Business Media, 2010.
[113] D. E. Newland, An introduction to random vibrations, spectral & wavelet
analysis: Courier Dover Publications, 2012.
[114] J. Lin, "An integrated time domain averaging scheme for gearbox diagnosis,"
in Reliability, Maintainability and Safety, 2009. ICRMS 2009. 8th International
Conference on, 2009, pp. 808-812.
[115] E. Sreejith, A. Verma, and A. Srividya, "Fault diagnosis of rolling element
bearing using time-domain features and neural networks," in Industrial and
Information Systems, 2008. ICIIS 2008. IEEE Region 10 and the Third
international Conference on, 2008, pp. 1-6.
P a g e | 146
[116] C. Kral, T. G. Habetler, and R. G. Harley, "Detection of mechanical imbalances
of induction machines without spectral analysis of time-domain signals,"
Industry Applications, IEEE Transactions on, vol. 40, pp. 1101-1106, 2004.
[117] C. Burrus and T. W. Parks, DFT/FFT and Convolution Algorithms: theory and
Implementation: John Wiley & Sons, Inc., 1991.
[118] K. Fyfe and E. Munck, "Analysis of computed order tracking," Mechanical
Systems and Signal Processing, vol. 11, pp. 187-205, 1997.
[119] K. Bossley, R. Mckendrick, C. Harris, and C. Mercer, "Hybrid computed order
tracking," Mechanical systems and signal processing, vol. 13, pp. 627-641,
1999.
[120] C. L. Nikias and J. M. Mendel, "Signal processing with higher-order spectra,"
IEEE Signal processing magazine, vol. 10, pp. 10-37, 1993.
[121] P. Saavedra and C. Rodriguez, "Accurate assessment of computed order
tracking," Shock and Vibration, vol. 13, pp. 13-32, 2006.
[122] B. Eggers, P. Heyns, and C. Stander, "Using computed order tracking to detect
gear condition aboard a dragline," JOURNAL-SOUTH AFRICAN INSTITUTE OF
MINING AND METALLURGY, vol. 107, p. 115, 2007.
[123] R. S. Pathak, The wavelet transform vol. 4: Springer Science & Business
Media, 2009.

P a g e | 147
[124] K. Shukla and A. K. Tiwari, Efficient Algorithms for Discrete Wavelet
Transform: With Applications to Denoising and Fuzzy Inference Systems:
Springer Science & Business Media, 2013.
[125] R. Roberts and C. Mullis, "Digital Signal Processing. Addition," ed: Wesley
Publishing Company, 1987.
[126] I. Daubechies, Ten lectures on wavelets vol. 61: SIAM, 1992.
[127] C. K. Chui, Wavelets: a mathematical tool for signal analysis vol. 1: Siam,
1997.
[128] K. Gurley and A. Kareem, "Applications of wavelet transforms in earthquake,
wind and ocean engineering," Engineering structures, vol. 21, pp. 149-167,
1999.
[129] S. Mallat, A wavelet tour of signal processing: Academic press, 1999.
[130] M. Misiti, Y. Misiti, G. Oppenheim, and J.-M. Poggi, "Wavelet toolbox," The
MathWorks Inc., Natick, MA, 1996.
[131] W. G. G, "Wavelets and Other Orthogonal Systems with Application," ed: CRC
Press boca raton, 1994.
[132] S. Gopalakrishnan and M. Mitra, Wavelet Methods for Dynamical Problems:
With Application to Metallic, Composite, and Nano-Composite Structures: CRC
Press, 2010.
P a g e | 148
[133] W. Yang, P. Tavner, and M. Wilkinson, "Condition monitoring and fault
diagnosis of a wind turbine synchronous generator drive train," Renewable
Power Generation, IET, vol. 3, pp. 1-11, 2009.
[134] J. A. Antonino-Daviu, M. Riera-Guasp, J. R. Folch, and M. P. M. Palomares,
"Validation of a new method for the diagnosis of rotor bar failures via
wavelet transform in industrial induction machines," Industry Applications,
IEEE Transactions on, vol. 42, pp. 990-996, 2006.
[135] R. Supangat, "On-line condition monitoring and detection of stator and rotor
faults in induction motors," 2008.
[136] S. Santoso, E. J. Powers, W. M. Grady, and A. C. Parsons, "Power quality
disturbance waveform recognition using wavelet-based neural classifier. I.
Theoretical foundation," Power Delivery, IEEE Transactions on, vol. 15, pp.
222-228, 2000.
[137] S. Sardy, P. Tseng, and A. Bruce, "Robust wavelet denoising," Signal
Processing, IEEE Transactions on, vol. 49, pp. 1146-1152, 2001.
[138] M. J. Shensa, "The discrete wavelet transform: wedding the a trous and
Mallat algorithms," Signal Processing, IEEE Transactions on, vol. 40, pp.
2464-2482, 1992.
[139] S. Santoso, E. J. Powers, W. M. Grady, and P. Hofmann, "Power quality
assessment via wavelet transform analysis," Power Delivery, IEEE
Transactions on, vol. 11, pp. 924-930, 1996.

P a g e | 149
[140] S. G. Mallat, "A theory for multiresolution signal decomposition: the wavelet
representation," Pattern Analysis and Machine Intelligence, IEEE
Transactions on, vol. 11, pp. 674-693, 1989.
[141] I. Daubechies, "The wavelet transform, time-frequency localization and
signal analysis," Information Theory, IEEE Transactions on, vol. 36, pp. 961-
1005, 1990.
[142] S. G. Khalaf and W. P. Hew, "Wavelet fault diagnosis and tolerant of induction
motor: A review," International Journal of Physical Sciences, vol. 6, pp. 358-
376, 2011.
[143] R. B. Randall, Vibration-based condition monitoring: industrial, aerospace and
automotive applications: John Wiley & Sons, 2011.
[144] R. B. Randall and J. Antoni, "Rolling element bearing diagnostics—a tutorial,"
Mechanical Systems and Signal Processing, vol. 25, pp. 485-520, 2011.
[145] J. Antoni and R. Randall, "The spectral kurtosis: application to the vibratory
surveillance and diagnostics of rotating machines," Mechanical Systems and
Signal Processing, vol. 20, pp. 308-331, 2006.
[146] M. Lebold, K. McClintic, R. Campbell, C. Byington, and K. Maynard, "Review of
vibration analysis methods for gearbox diagnostics and prognostics," in
Proceedings of the 54th Meeting of the Society for Machinery Failure
Prevention Technology, 2000, p. 16.

P a g e | 150
[147] P. McFadden, "Window functions for the calculation of the time domain
averages of the vibration of the individual planet gears and sun gear in an
epicyclic gearbox," Journal of Vibration and Acoustics, vol. 116, pp. 179-187,
1994.
[148] E. Hau, Wind TurbinesFundamentals, Technologies,Application, Economics:
Springer Heidelberg New York Dordrecht London, 2013.
[149] "Annual Report 2012, Centre for Ships and Ocean Structures Cesos.
Available: http://www.cesos.ntnu.no," NTNU-Trondheim, Norwegian
University of science and Technology2012.
[150] E. Becker and P. Poste, "Keeping the blades turning: Condition monitoring of
wind turbine gears," Refocus, vol. 7, pp. 26-32, 2006.
[151] J. Derek Smith, "Gear Noise and Vibration," ed: Marcel Dekker, Inc, 1999.
[152] M. Entezami, S. Hillmansen, P. Weston, and M. P. Papaelias, "Fault detection
and diagnosis within a wind turbine mechanical braking system using
condition monitoring," Renewable Energy, vol. 47, pp. 175-182, 2012.
[153] I. Standard, "61400-1. Wind turbines e part 1: design requirements," ed:
International Electrotechnical Commission, 2005, p. 90.
[154] H. Henao, G.-A. Capolino, M. Fernandez-Cabanas, F. Filippetti, C. Bruzzese, E.
Strangas, et al., "Trends in fault diagnosis for electrical machines: a review of
diagnostic techniques," IEEE industrial electronics magazine, vol. 8, pp. 31-
42, 2014.

P a g e | 151
[155] A. R. Nejad, Y. Xing, Y. Guo, J. Keller, Z. Gao, and T. Moan, "Effects of floating
sun gear in a wind turbine's planetary gearbox with geometrical
imperfections," Wind Energy, vol. 18, pp. 2105-2120, 2015.
[156] M. d. S. G. Cascales, Soft Computing Applications for Renewable Energy and
Energy Efficiency: IGI Global, 2014.
[157] D. McMillan and G. W. Ault, "Quantification of condition monitoring benefit
for offshore wind turbines," Wind Engineering, vol. 31, pp. 267-285, 2007.
‘’Every reasonable efforts has been made to acknowledge the owners of
copyright material. I would be pleased to hear from any copyright owner who
has been omitted or incorrectly acknowledged.’’

Appendix A AC133 Series
Low & High Frequency Accelerometer, Top Exit Connector, 500 mV/g
Product Features
Designed for low speed Rotors, Main Bearings, and Gear Box Inputs, but
can also be used for High Frequency Detection.
Figure A.1 Accelerometer model AC133
500 mV/g Sensitivity, ±10% Sensitivity
0.1 Hz for Low Frequency Measurements
10,000 Hz for High Frequency Detection

Table A.1 Accelerometer model AC133 specification
Specifications Standard Metric
Part Number AC133-1D M/AC133-1D
Sensitivity (±10%) 500 mV/g
Frequency Response (±3dB)
Frequency Response (±10%)
6-600,000 CPM
36-180,000 CPM
0,1-10000 Hz
0,6-3000 Hz
Dynamic Range ± 10 g, peak
Electrical
Settling Time <2 Seconds
Voltage Source (IEPE) 18-30 VDC
Constant Current Excitation 2-10 mA
Spectral Noise @ 10 Hz 1.7 µg/√Hz
Spectral Noise @ 100 Hz 0.2 µg/√Hz
Spectral Noise @ 1000 Hz 0.12 µg/√Hz
Output Impedance <100 ohm
Bias Output Voltage 10-14 VDC
Case Isolation >108 ohm

Table A.2 Accelerometer model AC133 specification (continue)
Specifications Standard Metric
Environmental
Temperature Range -58 to 250°F -50 to 121°C
Maximum Shock Protection 5,000 g, peak
Electromagnetic Sensitivity CE
Sealing IP68
Physical
Sensing Element PZT Ceramic
Sensing Structure Shear Mode
Weight 3.25 oz 92 grams
Case Material 316L Stainless Steel
Mounting 1/4-28
Connector (non-integral) 2 Pin MIL-C-5015
Resonant Frequency 1,080,000 CPM 18000 Hz
Mounting Torque 2 to 5 ft. lbs. 2,7 to 6,8 Nm
Mounting Hardware 1/4-28 Stud M6x1 Adapter Stud
Calibration Certificate CA10

Oil Lubrication
Table A.3 Typical oil properties
Synthetic oils (lifetime lubrication)
MAKE TYPE
SHELL TIVELA OIL S 320
IP TELIUM OIL VSF 320
KLÜBER SYNTHESO D 320 EP
BP ENERGOL SGXP 320
TEXACO SYNLUBE CLP 320
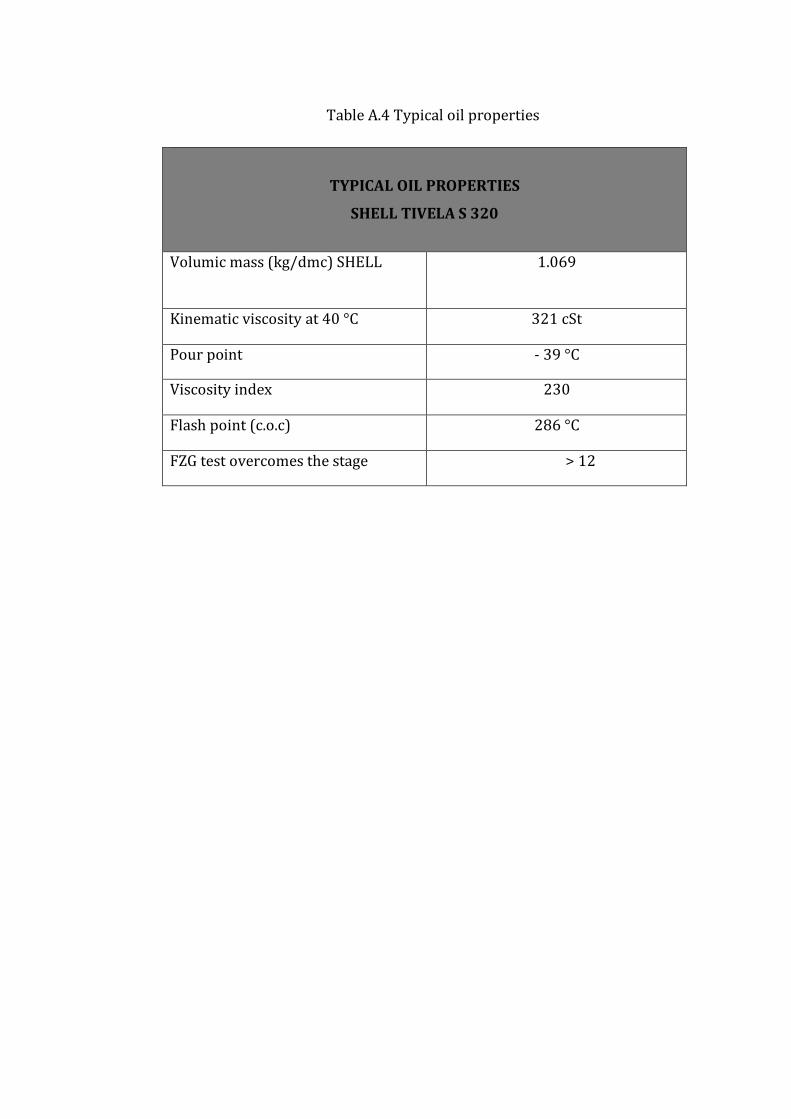
Table A.4 Typical oil properties
TYPICAL OIL PROPERTIES
SHELL TIVELA S 320
Volumic mass (kg/dmc) SHELL 1.069
Kinematic viscosity at 40 °C 321 cSt
Pour point - 39 °C
Viscosity index 230
Flash point (c.o.c) 286 °C
FZG test overcomes the stage > 12

Torque transducer specification
Figure A.2 Torque transducer (FUTEK model TRS605)

Figure A.3 Torque transducer electrical block diagram.
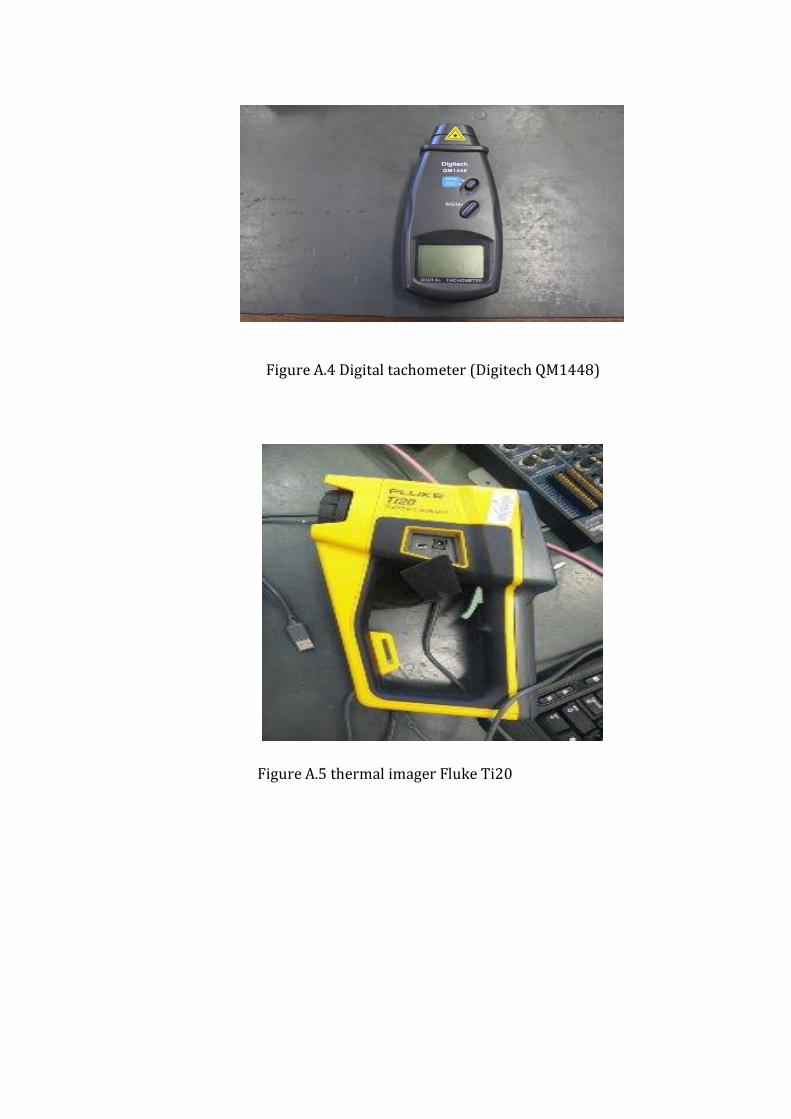
Figure A.4 Digital tachometer (Digitech QM1448)
Figure A.5 thermal imager Fluke Ti20