Embed Size (px)
Citation preview

Mark Ahlstrom UVIG Fall Technical Workshop Portland, Oregon October 31, 2013
Wind Plant Operational Reporting Applications Lessons Learned and New Research Results
2
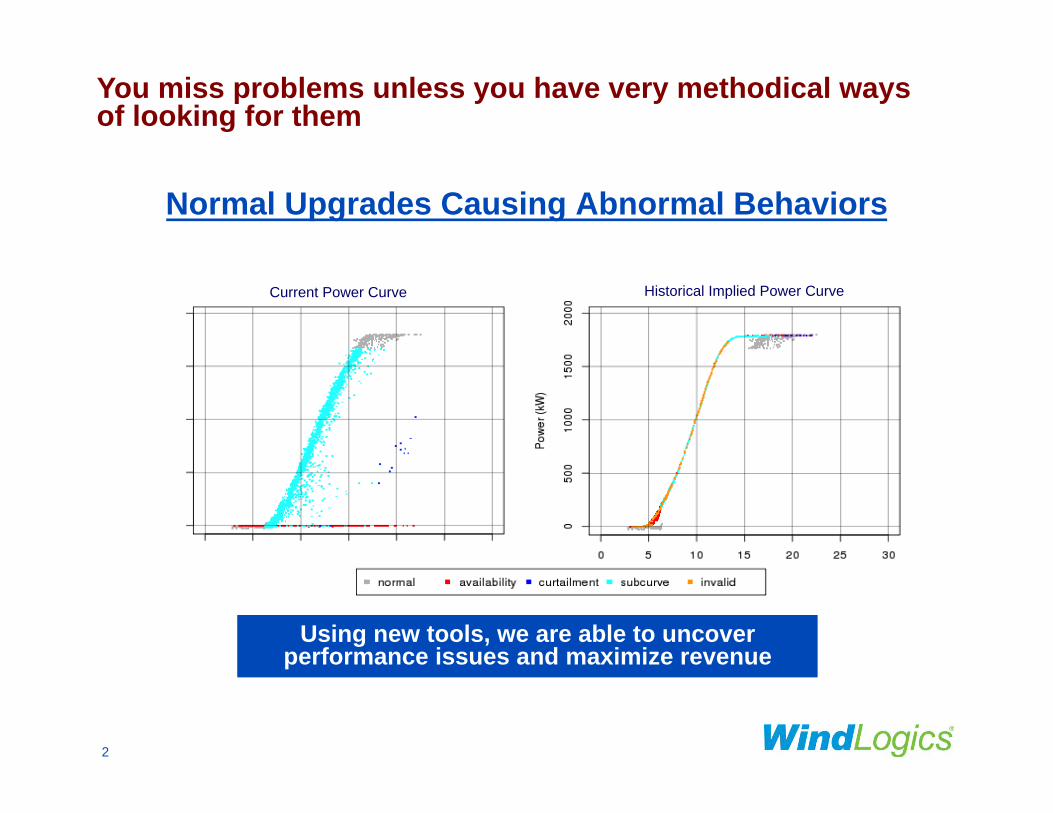
You miss problems unless you have very methodical ways of looking for them
Using new tools, we are able to uncover performance issues and maximize revenue
Normal Upgrades Causing Abnormal Behaviors
Historical Implied Power Curve Current Power Curve
3
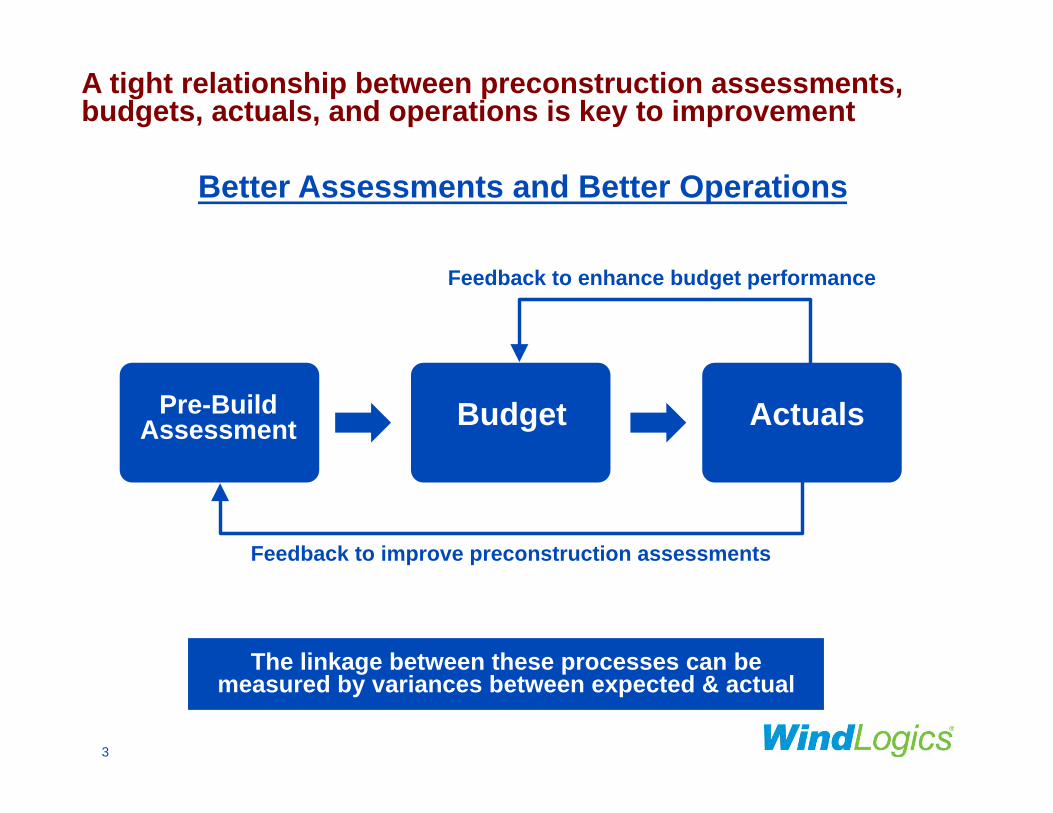
Better Assessments and Better Operations
A tight relationship between preconstruction assessments, budgets, actuals, and operations is key to improvement
The linkage between these processes can be measured by variances between expected & actual
Pre-Build Assessment Budget Actuals
Feedback to enhance budget performance
Feedback to improve preconstruction assessments
4
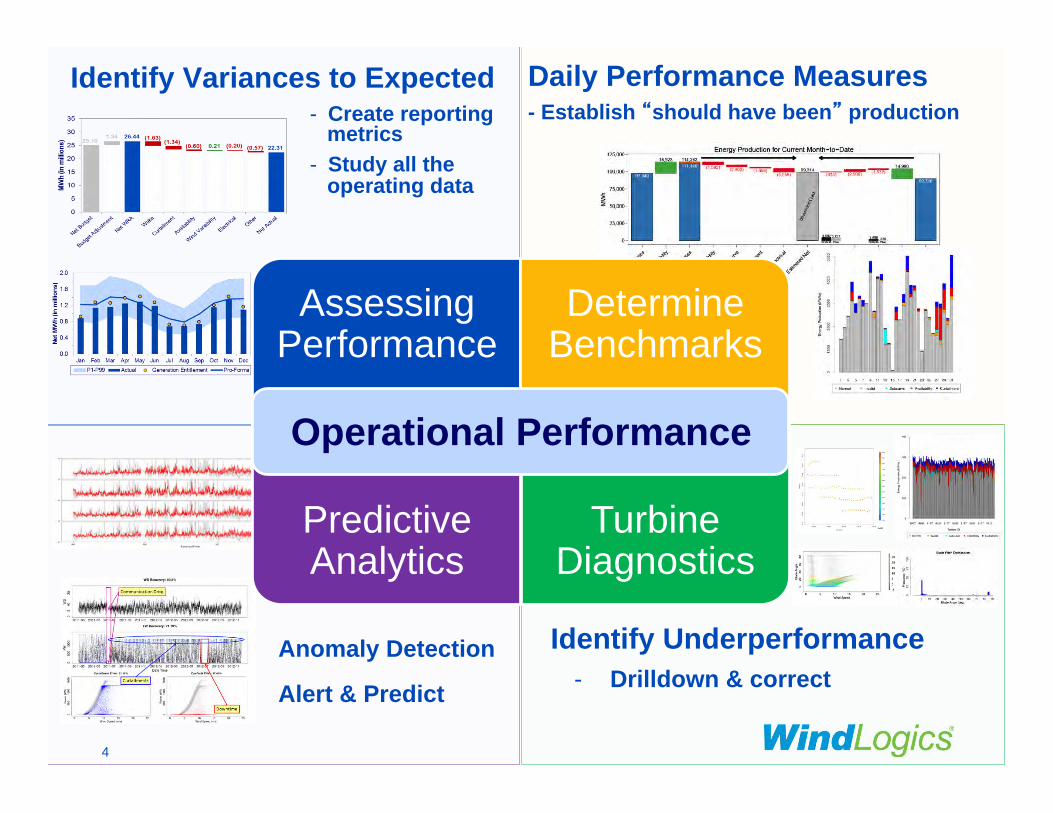
Daily Performance Measures - Establish “should have been” production
Identify Variances to Expected - Create reporting
metrics - Study all the
operating data
Identify Underperformance
- Drilldown & correct Anomaly Detection Alert & Predict
Assessing Performance
Determine Benchmarks
Predictive Analytics
Turbine Diagnostics
Operational Performance
5
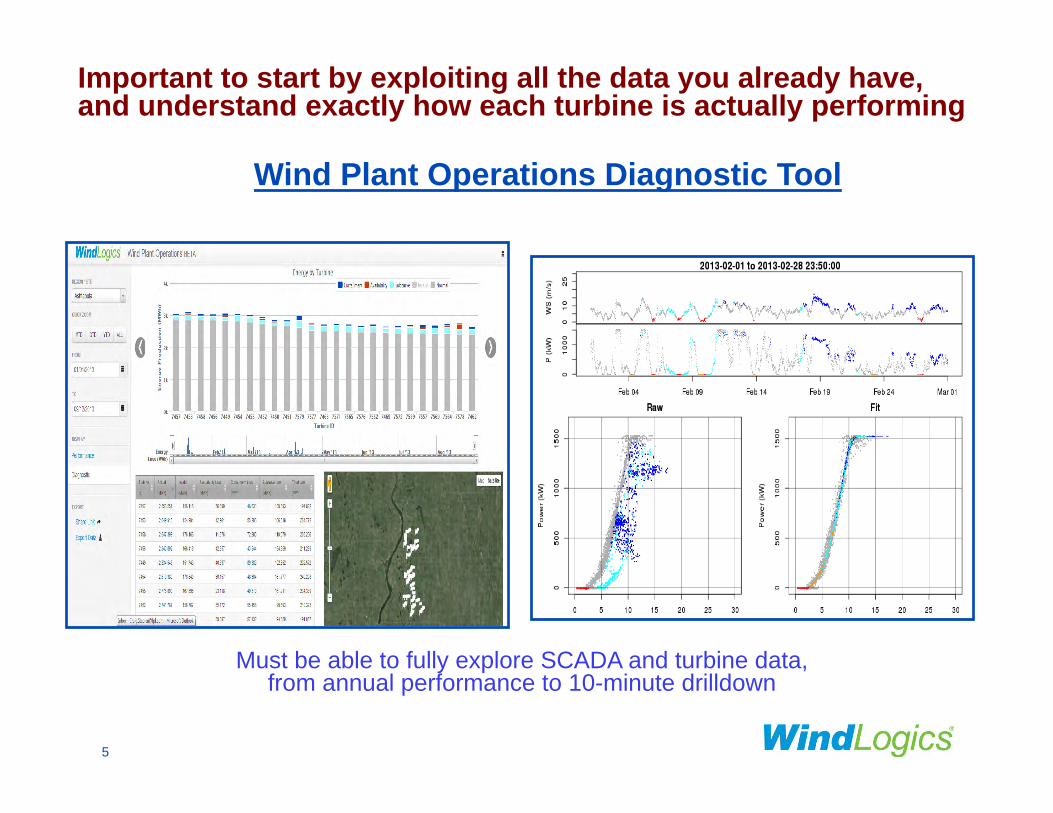
Wind Plant Operations Diagnostic Tool
Important to start by exploiting all the data you already have, and understand exactly how each turbine is actually performing
Must be able to fully explore SCADA and turbine data, from annual performance to 10-minute drilldown
6
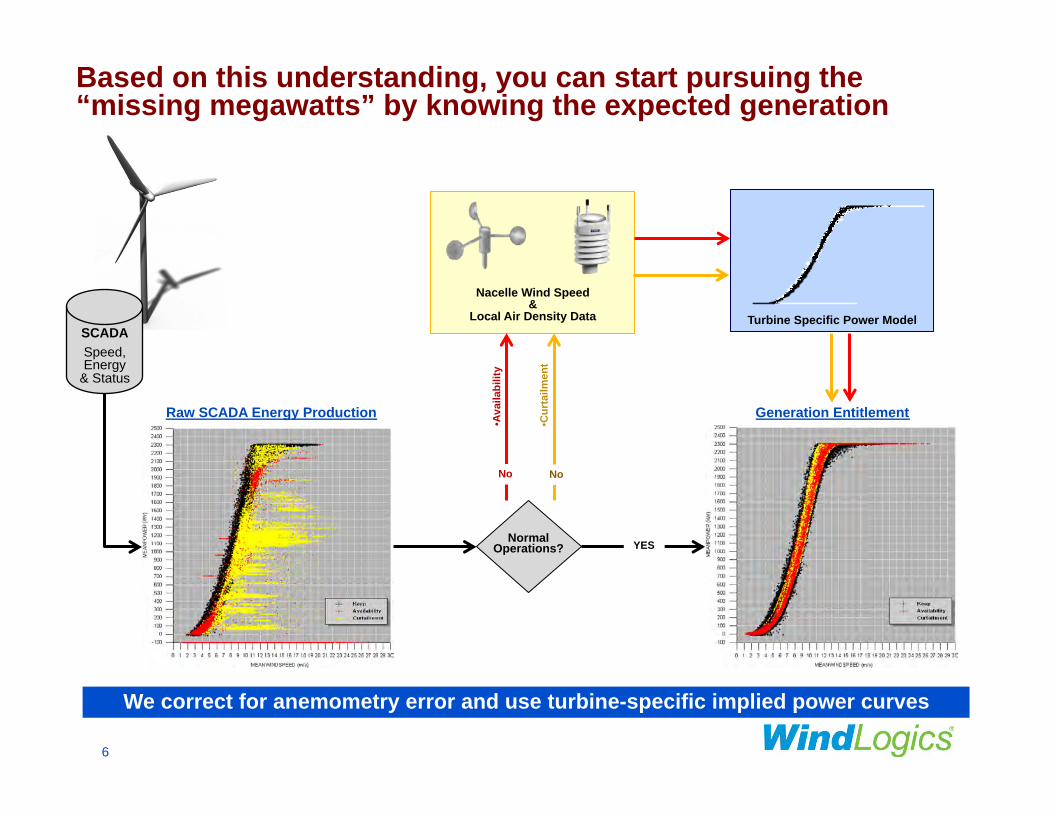
Nacelle Wind Speed &
Local Air Density Data SCADA Speed, Energy
& Status
Normal Operations?
Raw SCADA Energy Production Generation Entitlement
Turbine Specific Power Model
No No
YES
Based on this understanding, you can start pursuing the “missing megawatts” by knowing the expected generation
We correct for anemometry error and use turbine-specific implied power curves
• Ava
ilabi
lity
• Cur
tailm
ent
7
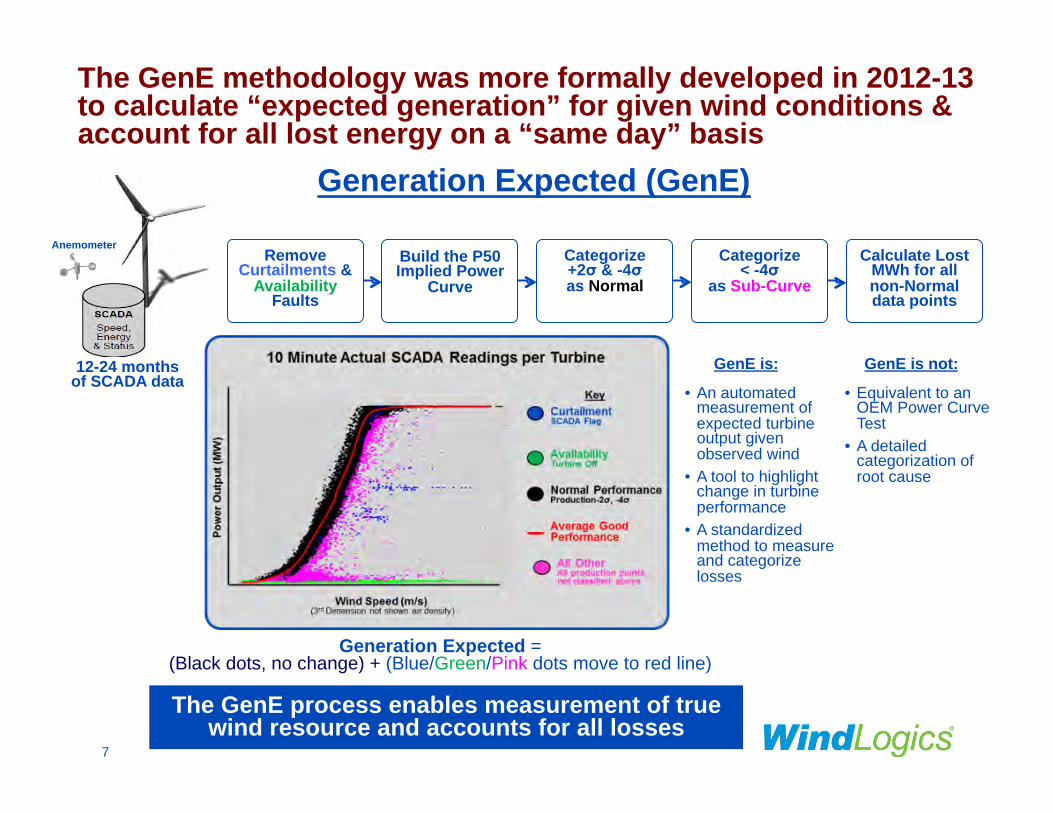
The GenE methodology was more formally developed in 2012-13 to calculate “expected generation” for given wind conditions & account for all lost energy on a “same day” basis
Generation Expected (GenE)
The GenE process enables measurement of true wind resource and accounts for all losses
Build the P50 Implied Power
Curve
Categorize +2σ & -4σ as Normal
Categorize < -4σ
as Sub-Curve
Generation Expected = (Black dots, no change) + (Blue/Green/Pink dots move to red line)
Calculate Lost MWh for all non-Normal data points
GenE is:
• An automated measurement of expected turbine output given observed wind
• A tool to highlight change in turbine performance
• A standardized method to measure and categorize losses
GenE is not:
• Equivalent to an OEM Power Curve Test
• A detailed categorization of root cause
12-24 months of SCADA data
Anemometer
Remove Curtailments &
Availability Faults
8
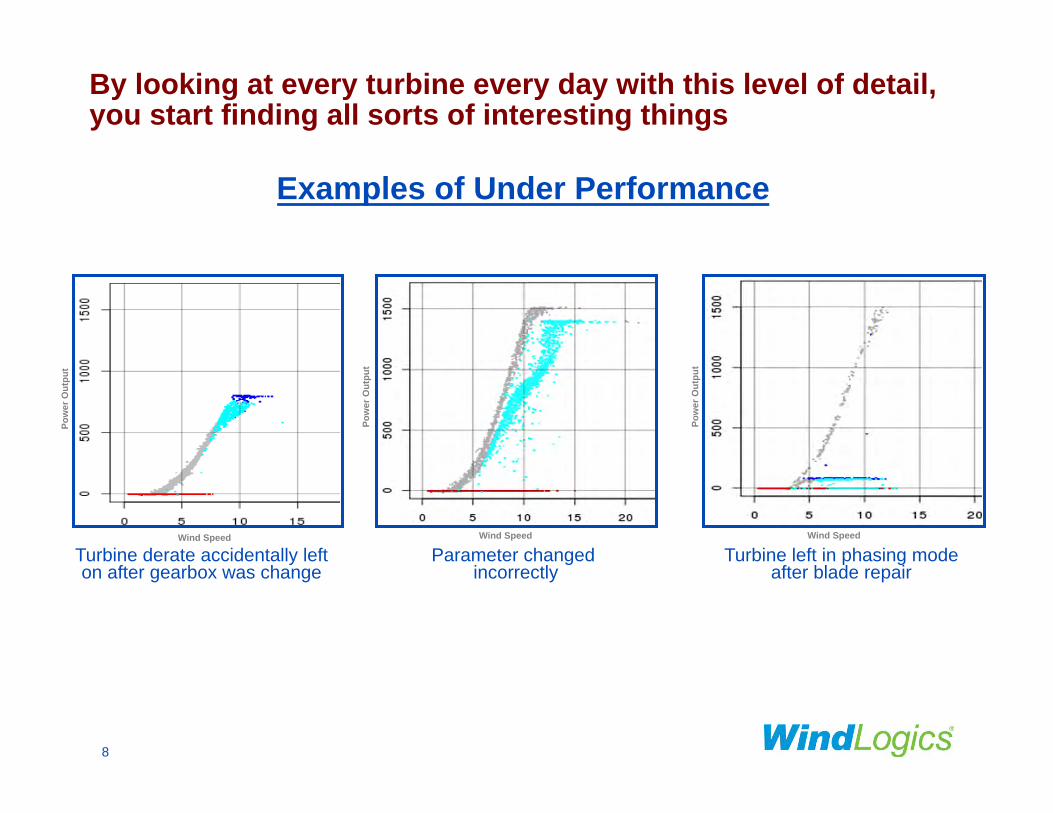
By looking at every turbine every day with this level of detail, you start finding all sorts of interesting things
Examples of Under Performance
Parameter changed incorrectly
Wind Speed
Pow
er O
utpu
t
Turbine left in phasing mode after blade repair
Wind Speed
Pow
er O
utpu
t
Turbine derate accidentally left on after gearbox was change
Wind Speed
Pow
er O
utpu
t
9
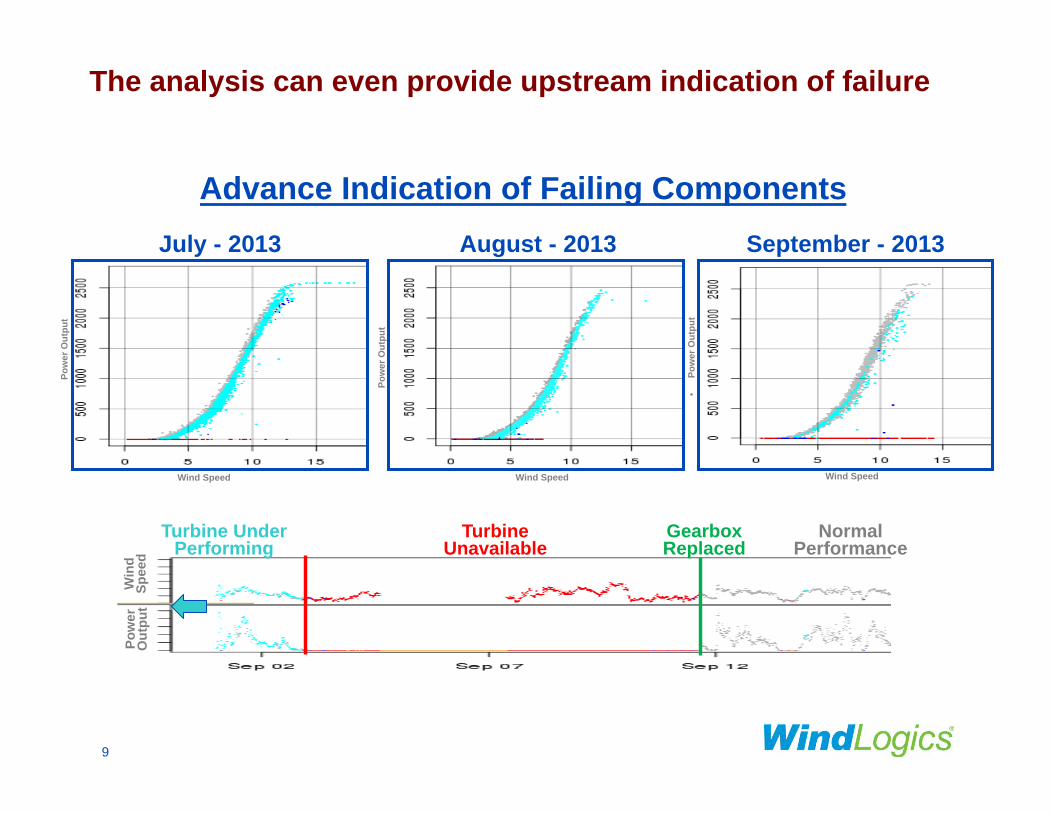
The analysis can even provide upstream indication of failure
July - 2013
Gearbox Replaced
Turbine Unavailable
Turbine Under Performing
Normal Performance
Win
d Sp
eed
Pow
er
Out
put
Pow
er O
utpu
t
Wind Speed
August - 2013
Pow
er O
utpu
t
Wind Speed
September - 2013
• Po
wer
Out
put
Wind Speed
Advance Indication of Failing Components
10
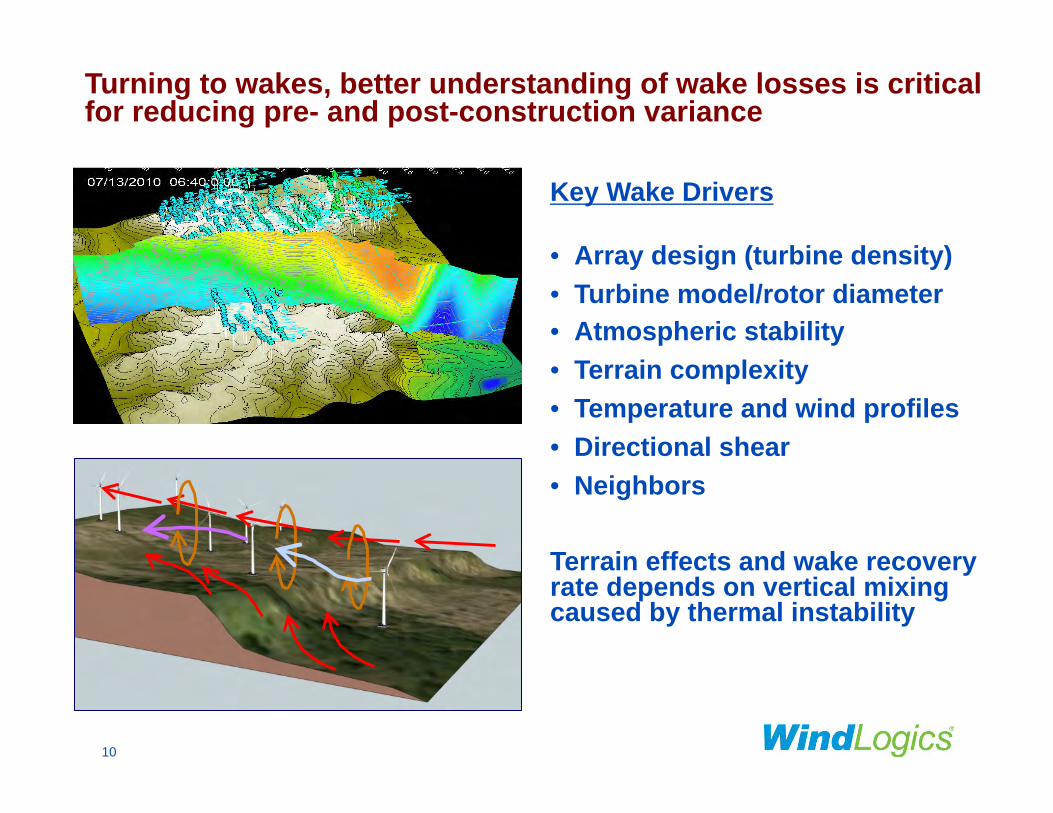
Turning to wakes, better understanding of wake losses is critical for reducing pre- and post-construction variance
Key Wake Drivers • Array design (turbine density) • Turbine model/rotor diameter • Atmospheric stability • Terrain complexity • Temperature and wind profiles • Directional shear • Neighbors
Terrain effects and wake recovery rate depends on vertical mixing caused by thermal instability
11
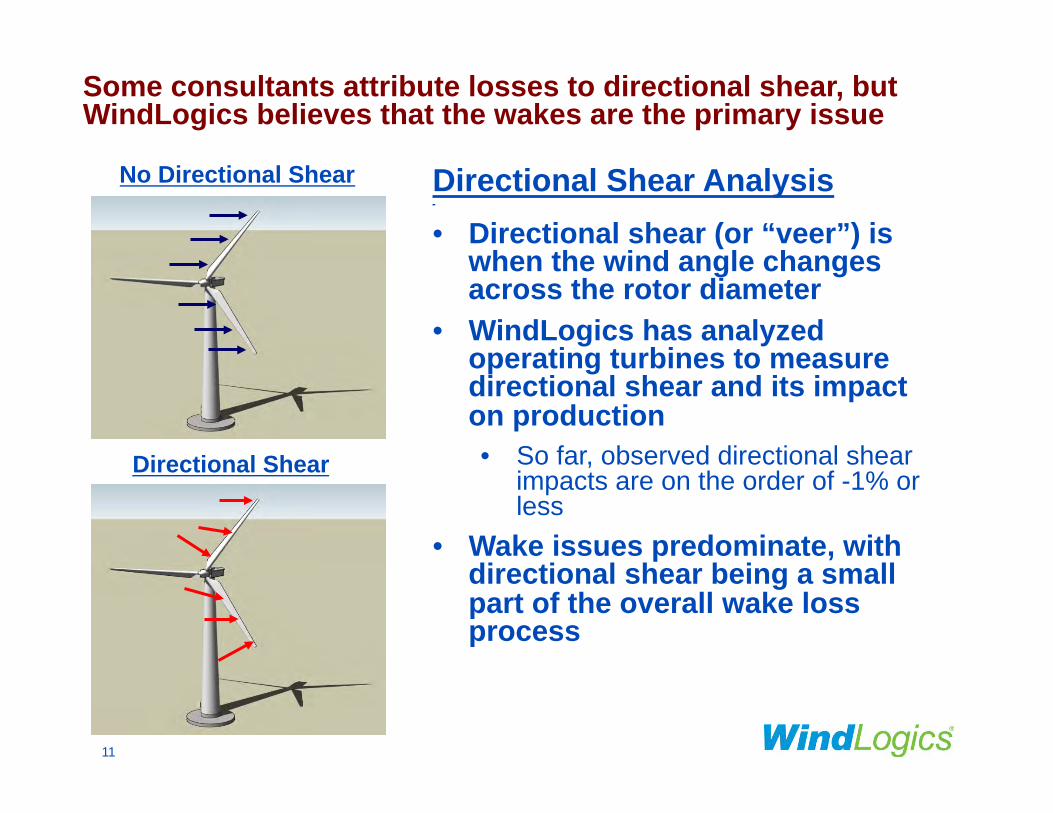
Directional Shear
No Directional Shear
Some consultants attribute losses to directional shear, but WindLogics believes that the wakes are the primary issue
Directional Shear Analysis • Directional shear (or “veer”) is
when the wind angle changes across the rotor diameter
• WindLogics has analyzed operating turbines to measure directional shear and its impact on production • So far, observed directional shear
impacts are on the order of -1% or less
• Wake issues predominate, with directional shear being a small part of the overall wake loss process
12
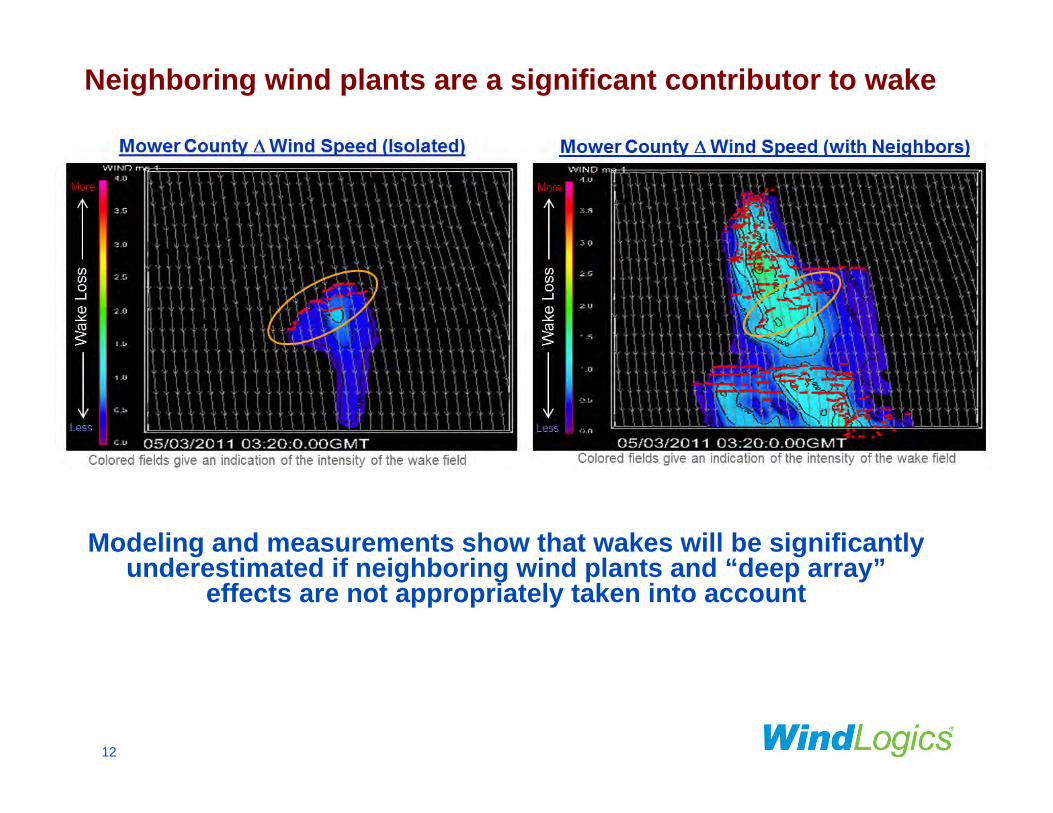
• Mower County Δ Wind Speed (with Neighbors) • Mower County Δ Wind Speed (Isolated)
Neighboring wind plants are a significant contributor to wake
• Colored fields give an indication of the intensity of the wake field
• Wak
e Lo
ss
• More
• Less
• Wak
e Lo
ss
• More
• Less
• Colored fields give an indication of the intensity of the wake field
Modeling and measurements show that wakes will be significantly underestimated if neighboring wind plants and “deep array”
effects are not appropriately taken into account
• L
• H
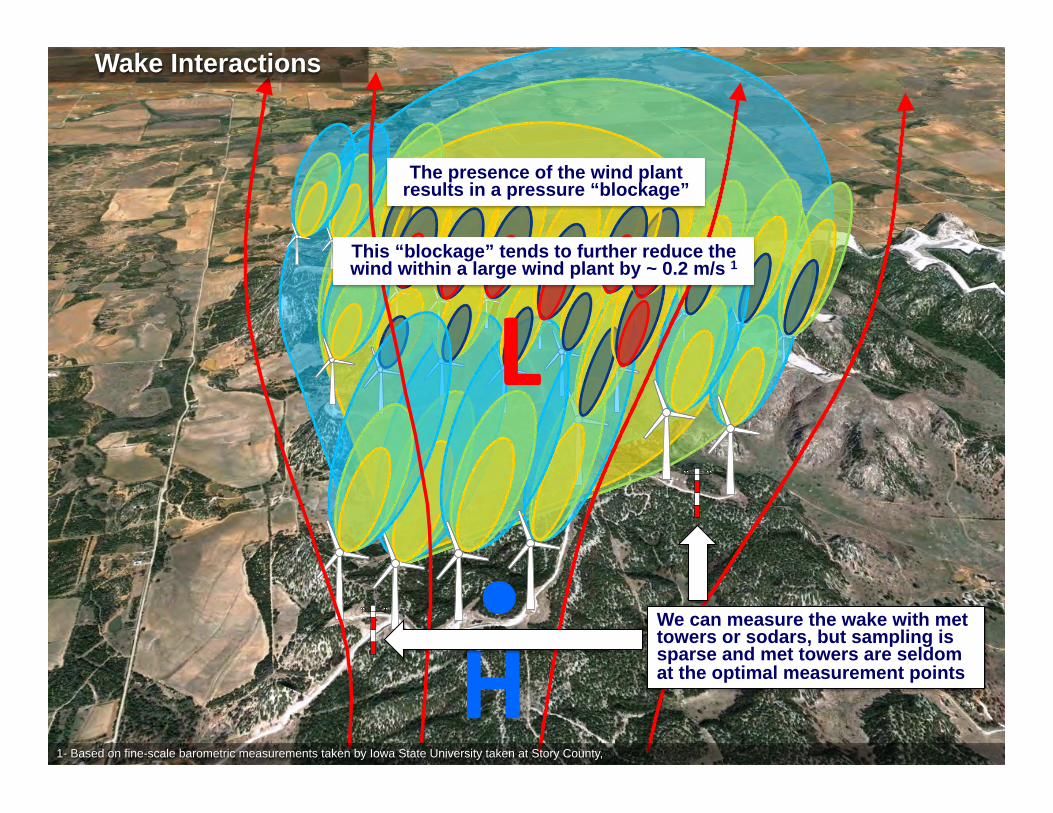
The presence of the wind plant results in a pressure “blockage”
This “blockage” tends to further reduce the wind within a large wind plant by ~ 0.2 m/s 1
1- Based on fine-scale barometric measurements taken by Iowa State University taken at Story County,
Wake Interactions
We can measure the wake with met towers or sodars, but sampling is sparse and met towers are seldom at the optimal measurement points
14
Summary - Key Drivers of Variance
• Wake, curtailment and availability are the top drivers – Neighboring wind plants must be considered – Continuous reviews and adjustments need to take place
• General observations – Wind speed estimates are generally very good – Loss assumptions in going from gross to net capacity factor are
complex and can often be improved • Goals
– Identify and fix the correctable losses – Improve preconstruction estimates for the fleet and for individual
wind power plants
Need to look very carefully at real data, improve operations to fix correctable losses, and improve preconstruction estimates


![[Public] ABB Operational Experiences of STATCOMs for Wind Parks](https://img.pdfslide.us/doc/110x75/577c7d581a28abe0549e69e4/public-abb-operational-experiences-of-statcoms-for-wind-parks.jpg)