Embed Size (px)
Citation preview
Slide 1
BPA Wind Interconnection and Operational ExperiencesBPA Wind Interconnection and Operational Experiences
Presented by Stephen Enyeart for the Presented by Stephen Enyeart for the Idaho Idaho WindWind Working Group Meeting Working Group Meeting Sept. 15, 2011Sept. 15, 2011
Slide 2
The New Look of Wind PowerThe New Look of Wind Power
Slide 3
Wind Progress in the US, NWWind Progress in the US, NW
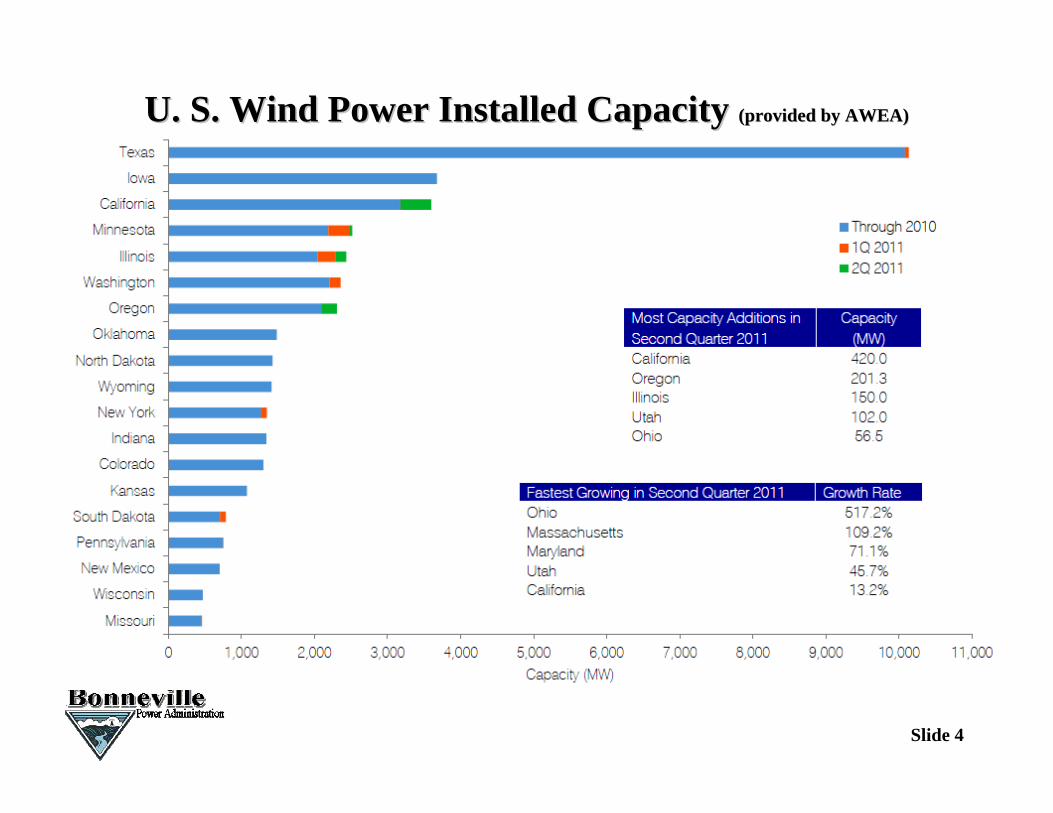
Thirty-Three (33) States now have Renewable Portfolio Standards.~1000 MW = Output of a Nuclear Power PlantUSA: Installed capacity 42,400 MW by June 2011 Germany, Denmark, Spain and China are leaders outside US, but USA is now world leader Texas, Mid-America (Iowa, Minnesota), NW (OR, WA), California most active regions NW now has over 5000 MW (as of 9/2011)
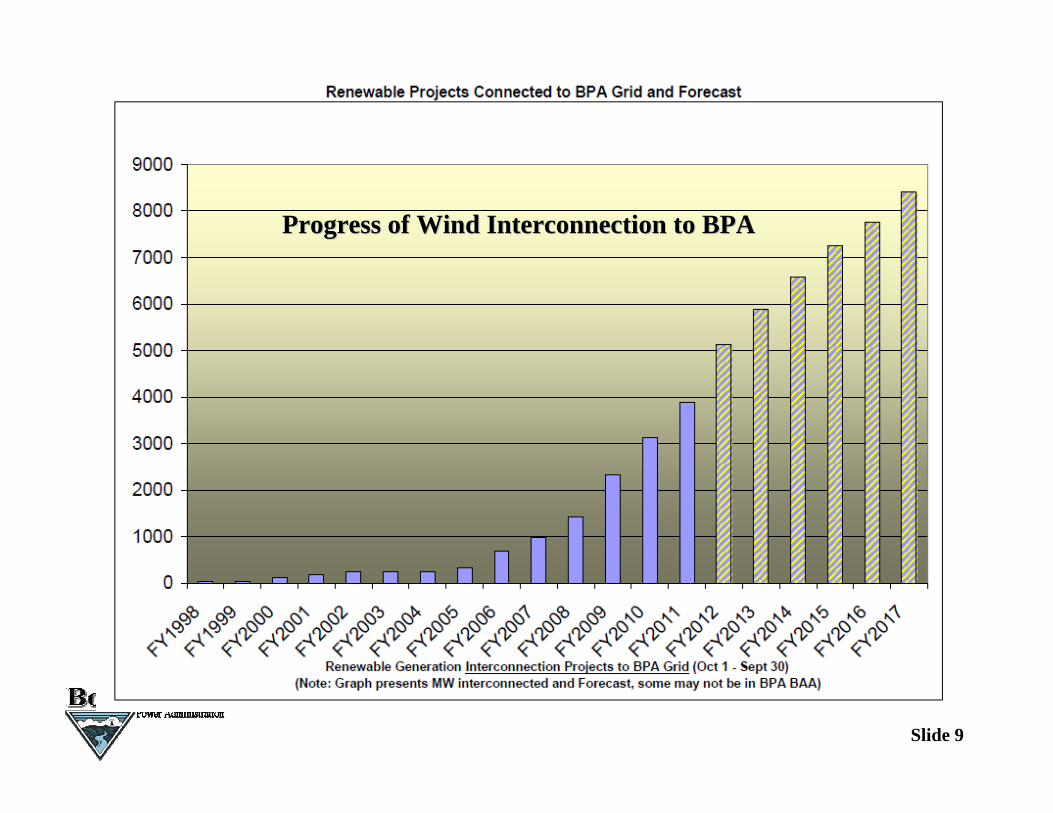
BPA interconnected 750 MW in 2011, expects over 1100 MW in 2012 BPA totals over 3890 MW connected to our grid 805 MW was connected in 2010 (BPA does not own or build Wind Generation)
Slide 4
U. S. Wind Power Installed Capacity U. S. Wind Power Installed Capacity (provided by AWEA)(provided by AWEA)
Slide 5
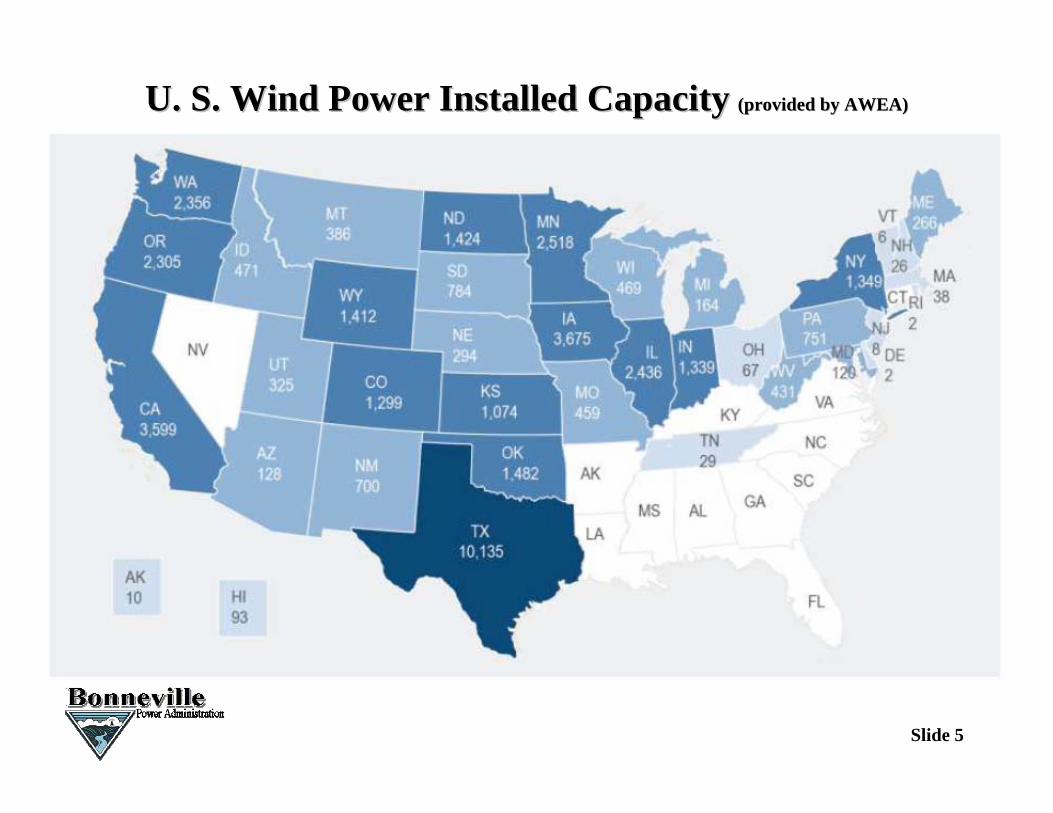
U. S. Wind Power Installed CapacityU. S. Wind Power Installed Capacity (provided by AWEA)(provided by AWEA)
Slide 6
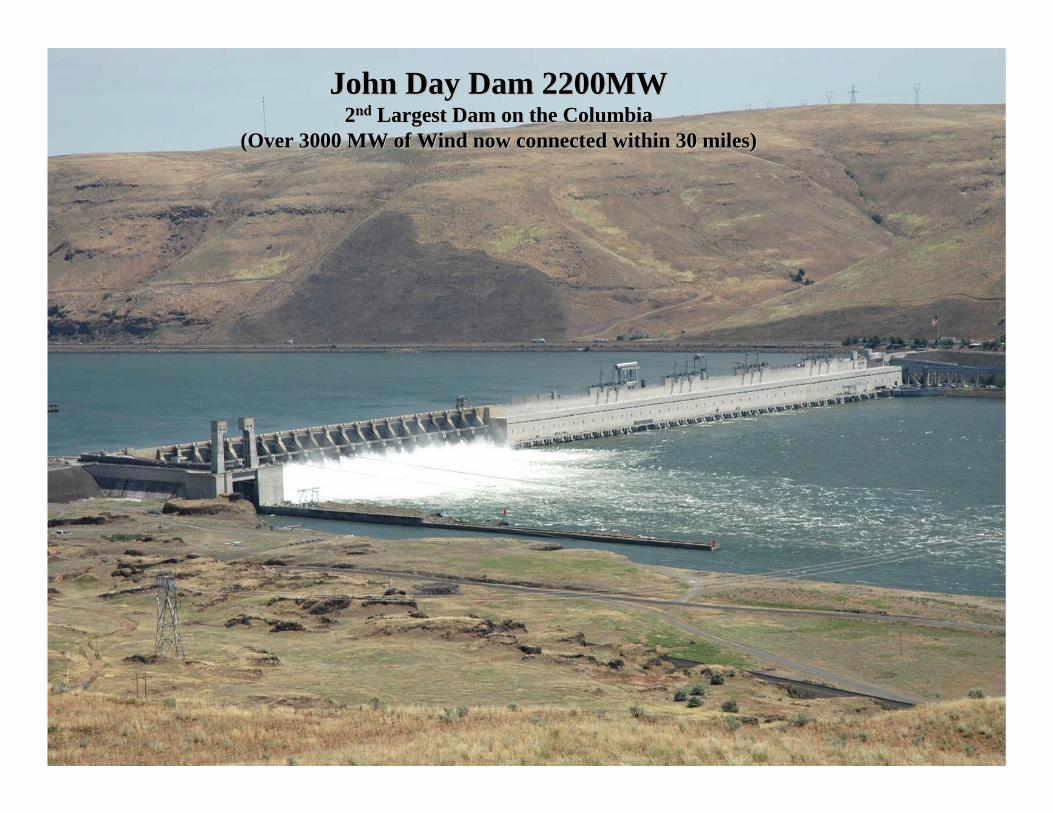
John Day Dam 2200MW John Day Dam 2200MW 22ndnd Largest Dam on the Columbia Largest Dam on the Columbia
(Over 3000 MW of Wind now connected within 30 miles)(Over 3000 MW of Wind now connected within 30 miles)
Slide 7
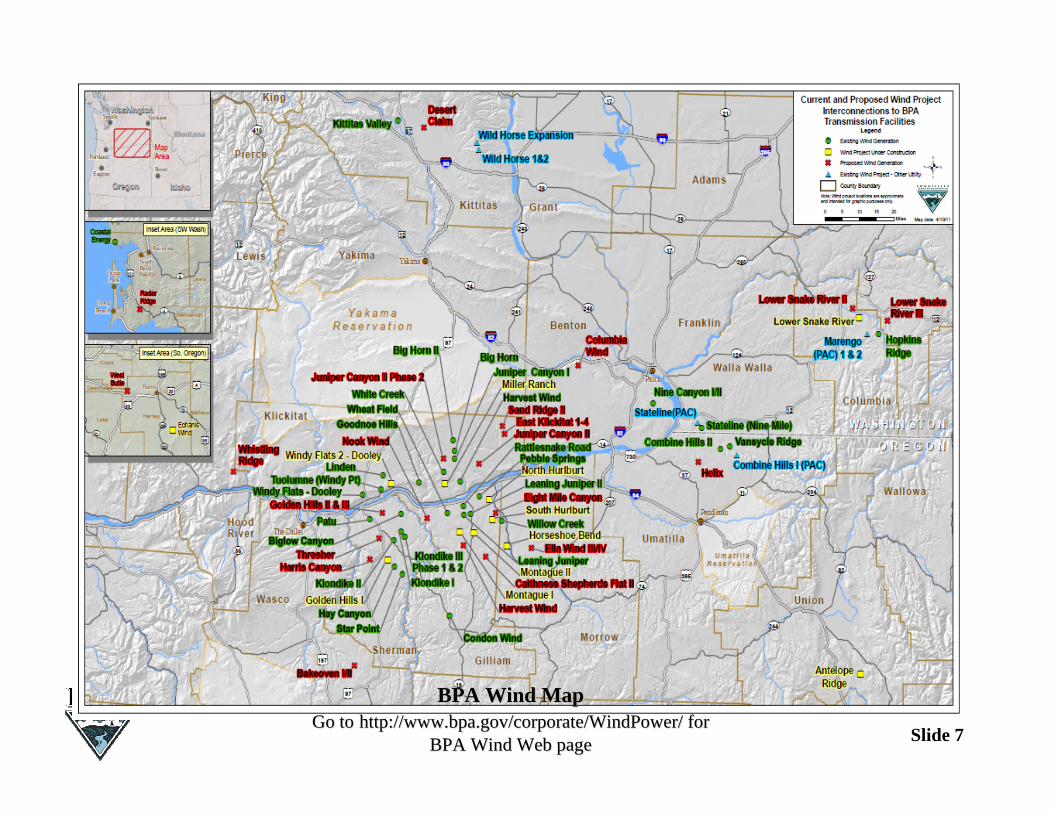
BPA Wind MapBPA Wind MapGo toGo to http://www.bpa.gov/corporate/WindPower/http://www.bpa.gov/corporate/WindPower/ for for
BPA Wind Web pageBPA Wind Web page
Slide 8Based on BPA’s wind interconnection queue and work done by E3
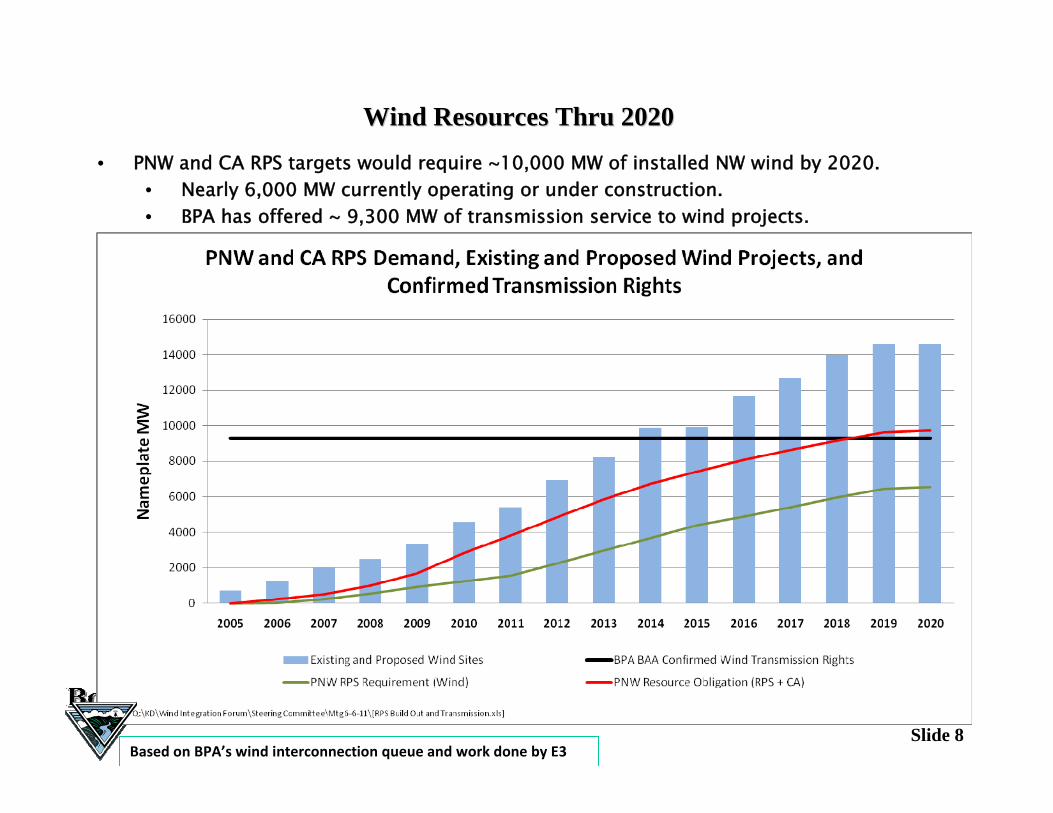
• PNW and CA RPS targets would require ~10,000 MW of installed NW wind by 2020.• Nearly 6,000 MW currently operating or under construction.• BPA has offered ~ 9,300 MW of transmission service to wind projects.
Wind Resources Thru 2020Wind Resources Thru 2020
Slide 9
Progress of Wind Interconnection to BPAProgress of Wind Interconnection to BPA
Slide 10
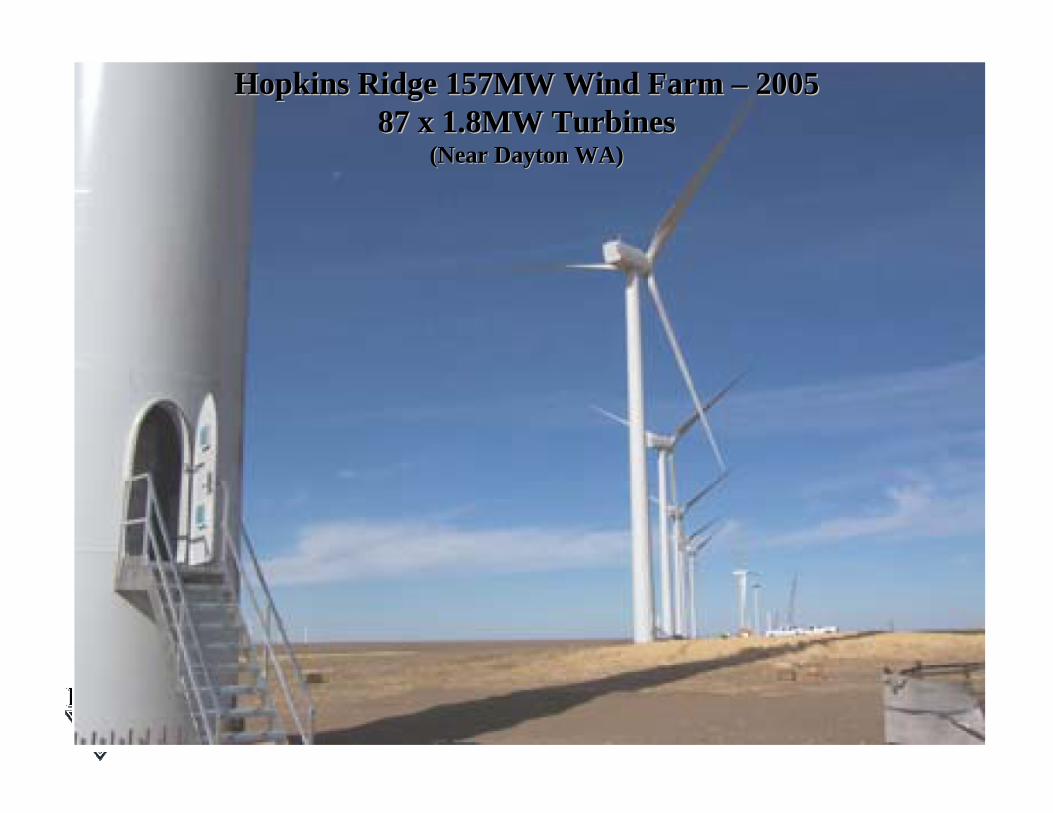
Hopkins Ridge 157MW Wind Farm Hopkins Ridge 157MW Wind Farm –– 2005 2005 87 x 1.8MW Turbines87 x 1.8MW Turbines
(Near Dayton WA)(Near Dayton WA)
Slide 11
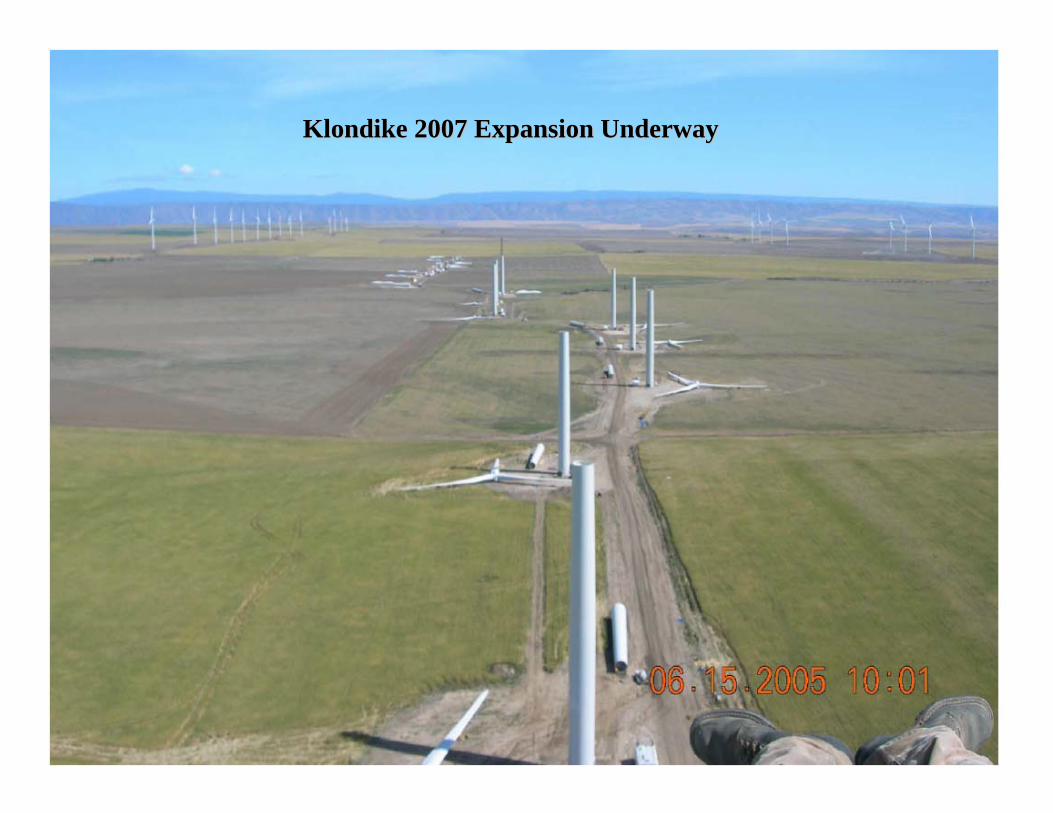
Klondike 2007 Expansion UnderwayKlondike 2007 Expansion Underway
Slide 12
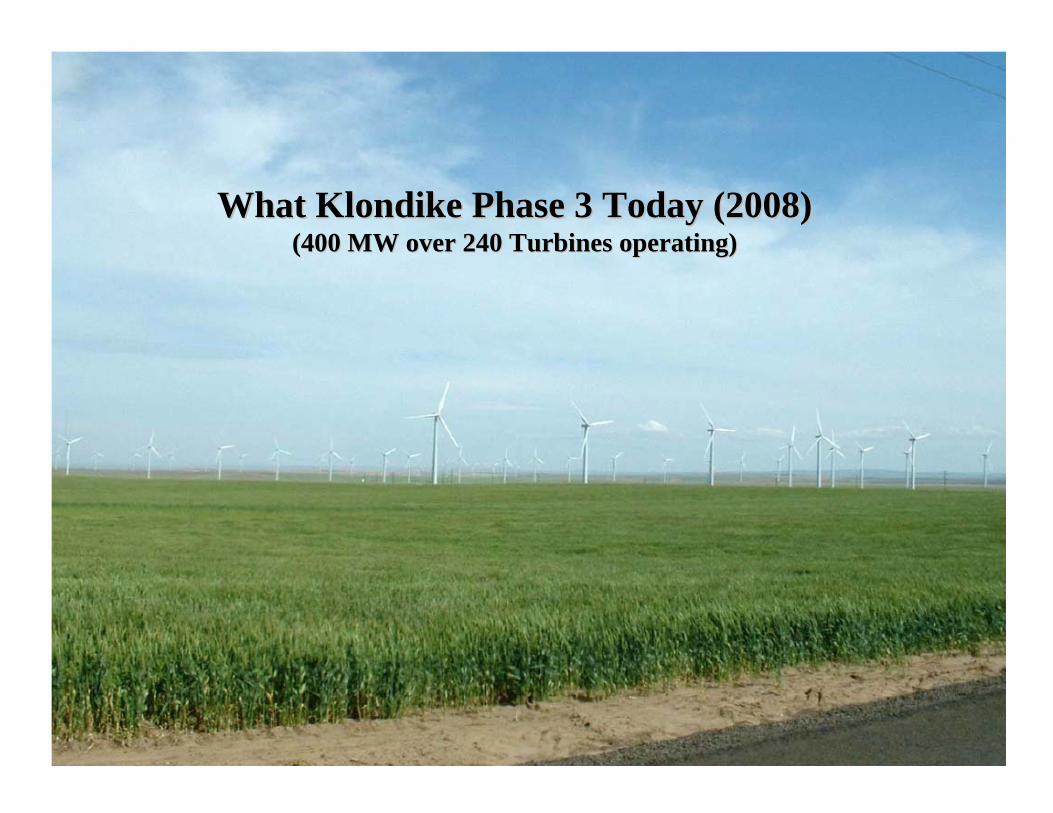
What Klondike Phase 3 Today (2008) What Klondike Phase 3 Today (2008) (400 MW over 240 Turbines operating)(400 MW over 240 Turbines operating)
Slide 13
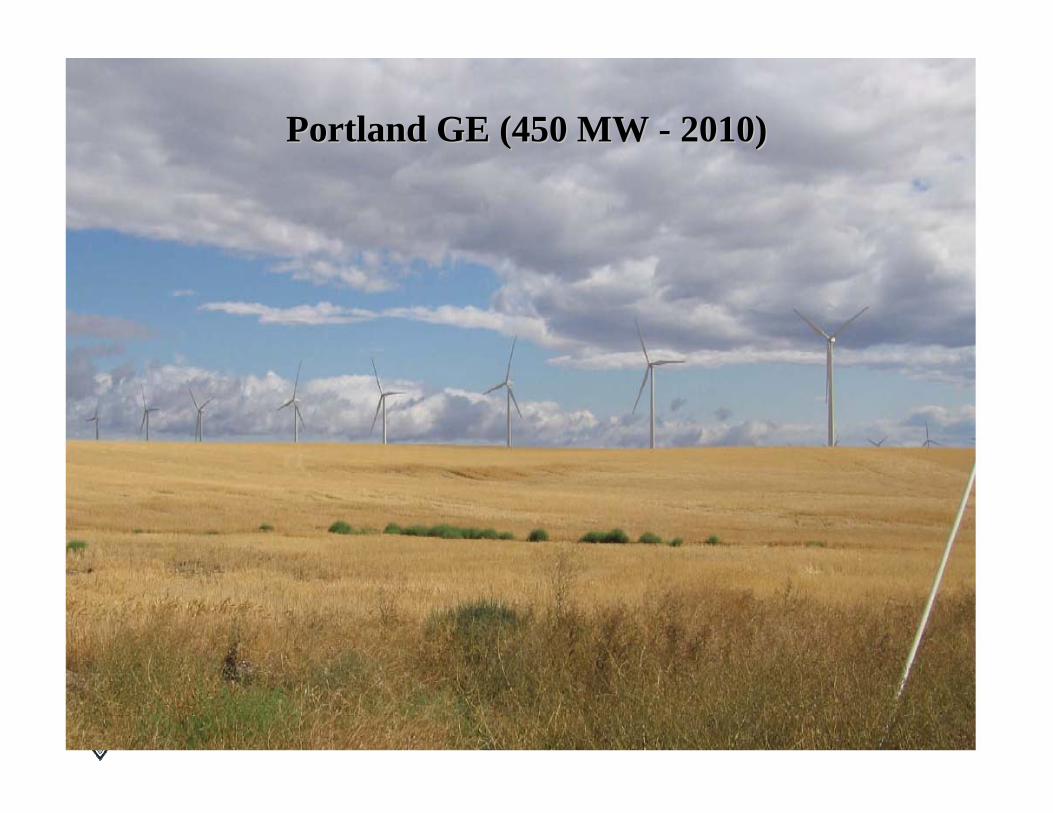
Portland GE (450 MW Portland GE (450 MW -- 2010)2010)
Slide 14
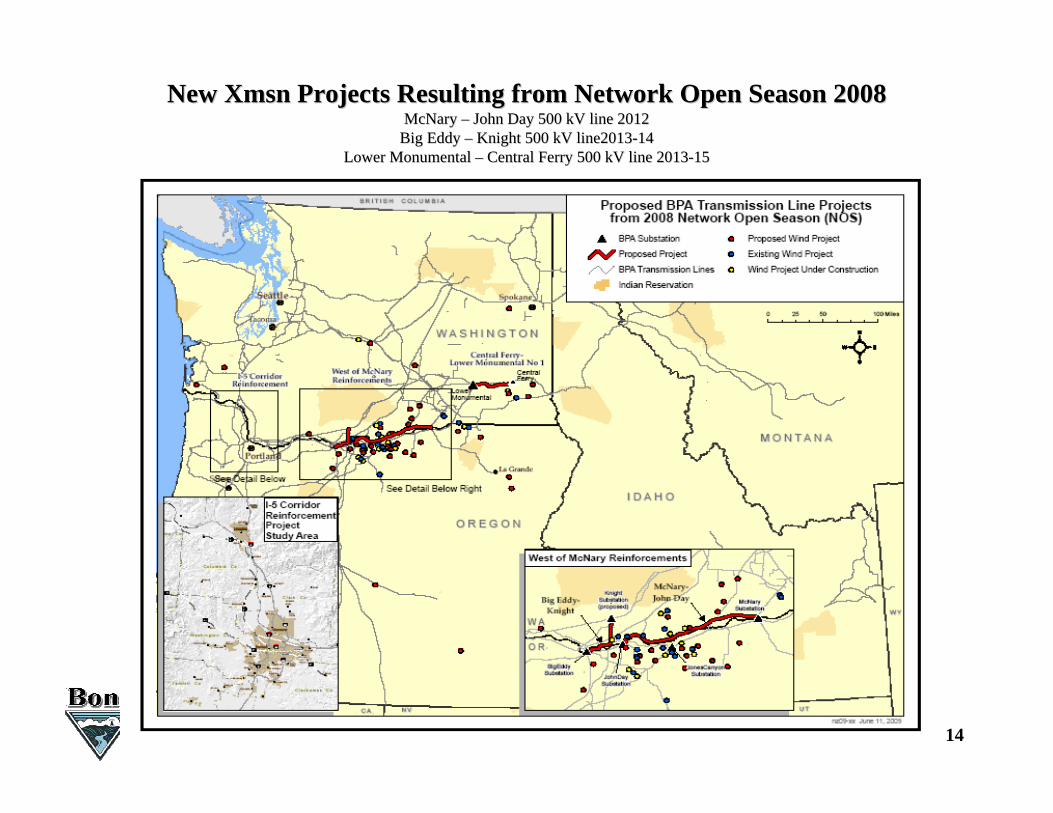
New New XmsnXmsn Projects Resulting from Network Open Season 2008Projects Resulting from Network Open Season 2008McNary McNary –– John Day 500 kV line 2012 John Day 500 kV line 2012
Big Eddy Big Eddy –– Knight 500 kV line2013Knight 500 kV line2013--14 14 Lower Monumental Lower Monumental –– Central Ferry 500 kV line 2013Central Ferry 500 kV line 2013--1515
Slide 15
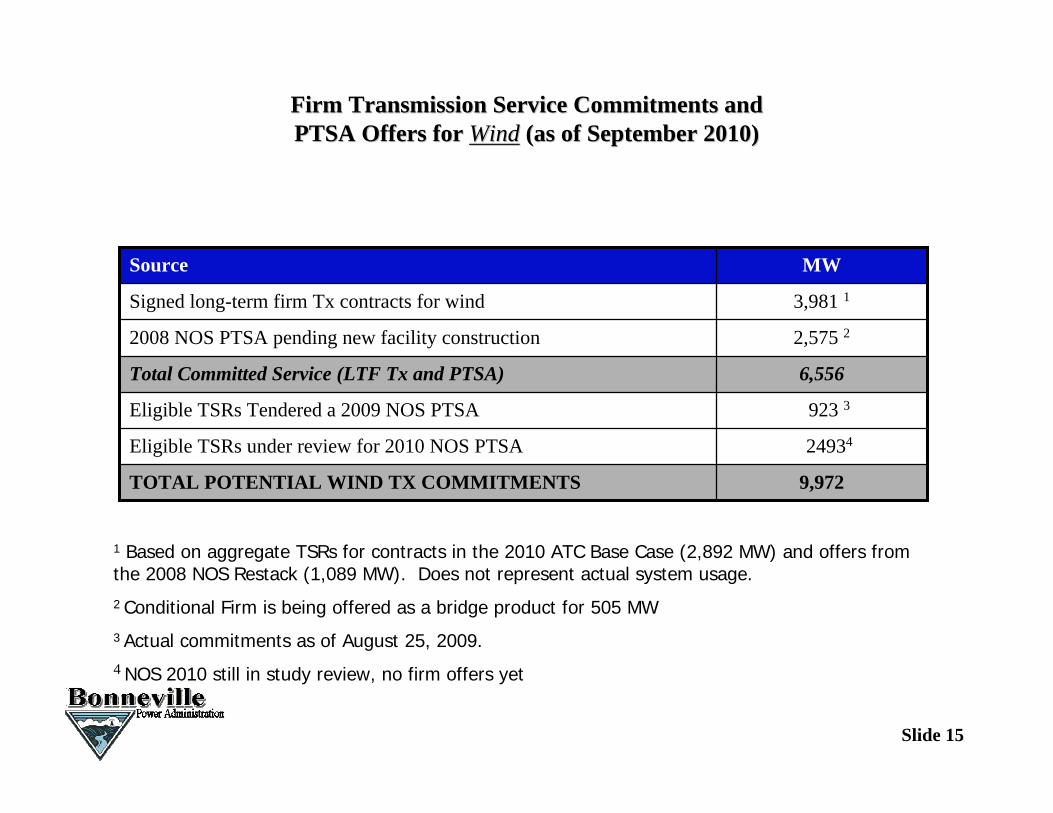
Firm Transmission Service Commitments and Firm Transmission Service Commitments and PTSA Offers for PTSA Offers for WindWind (as of September 2010)(as of September 2010)
923 3Eligible TSRs Tendered a 2009 NOS PTSA
6,556Total Committed Service (LTF Tx and PTSA)
9,972TOTAL POTENTIAL WIND TX COMMITMENTS
24934Eligible TSRs under review for 2010 NOS PTSA
2,575 22008 NOS PTSA pending new facility construction
3,981 1Signed long-term firm Tx contracts for wind
MWSource
1 Based on aggregate TSRs for contracts in the 2010 ATC Base Case (2,892 MW) and offers from the 2008 NOS Restack (1,089 MW). Does not represent actual system usage.2 Conditional Firm is being offered as a bridge product for 505 MW3 Actual commitments as of August 25, 2009.4 NOS 2010 still in study review, no firm offers yet
Slide 16
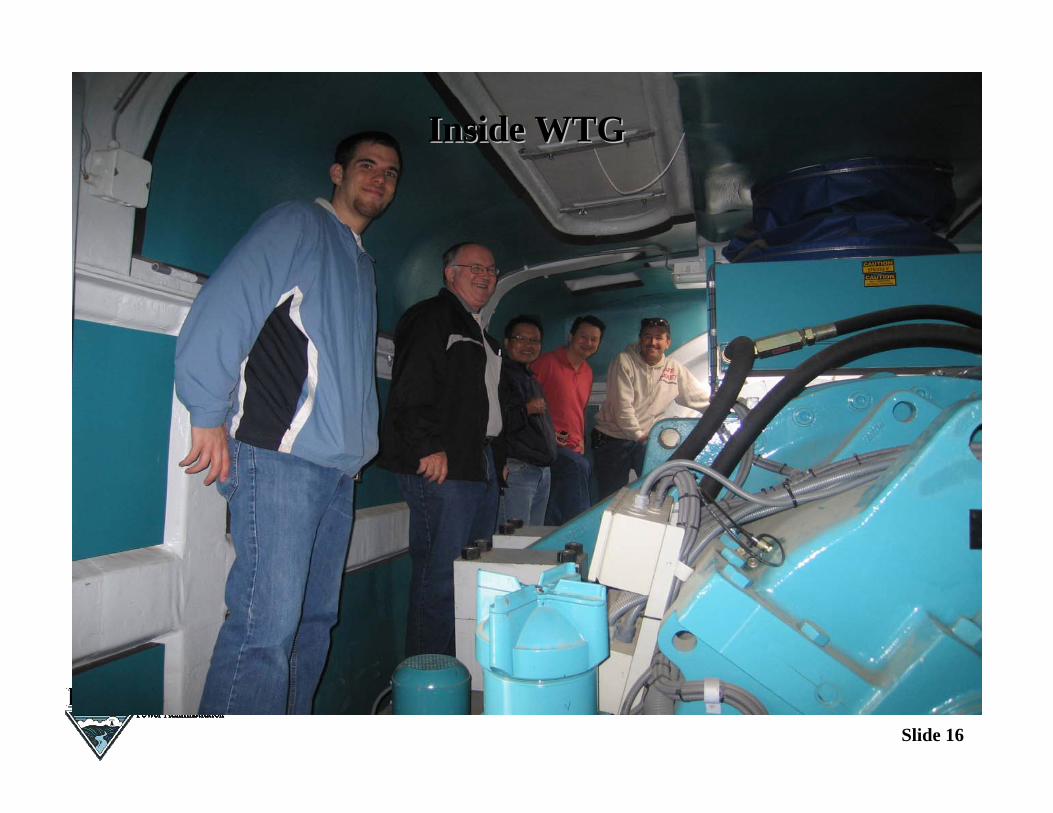
Inside WTGInside WTG
Slide 17
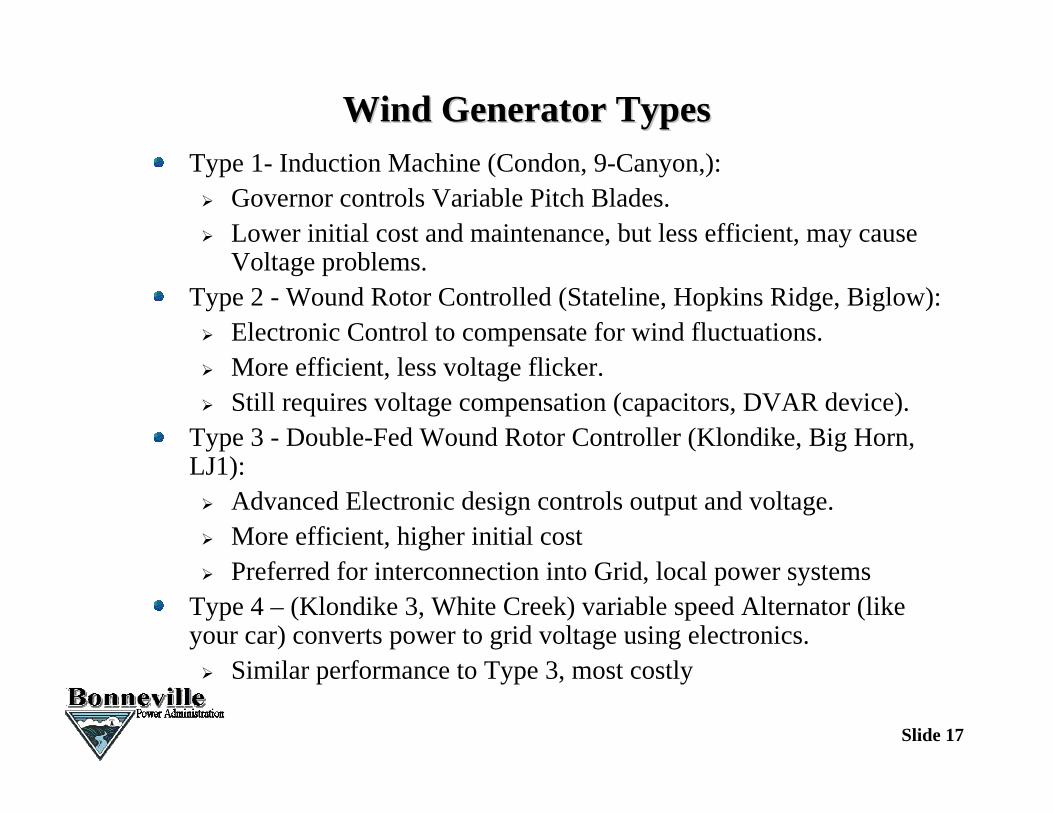
Wind Generator TypesWind Generator TypesType 1- Induction Machine (Condon, 9-Canyon,): Governor controls Variable Pitch Blades. Lower initial cost and maintenance, but less efficient, may cause
Voltage problems.Type 2 - Wound Rotor Controlled (Stateline, Hopkins Ridge, Biglow): Electronic Control to compensate for wind fluctuations. More efficient, less voltage flicker. Still requires voltage compensation (capacitors, DVAR device).
Type 3 - Double-Fed Wound Rotor Controller (Klondike, Big Horn, LJ1): Advanced Electronic design controls output and voltage. More efficient, higher initial cost Preferred for interconnection into Grid, local power systems
Type 4 – (Klondike 3, White Creek) variable speed Alternator (like your car) converts power to grid voltage using electronics. Similar performance to Type 3, most costly
Slide 18
BPA Interconnecting Wind Generation
Slide 19
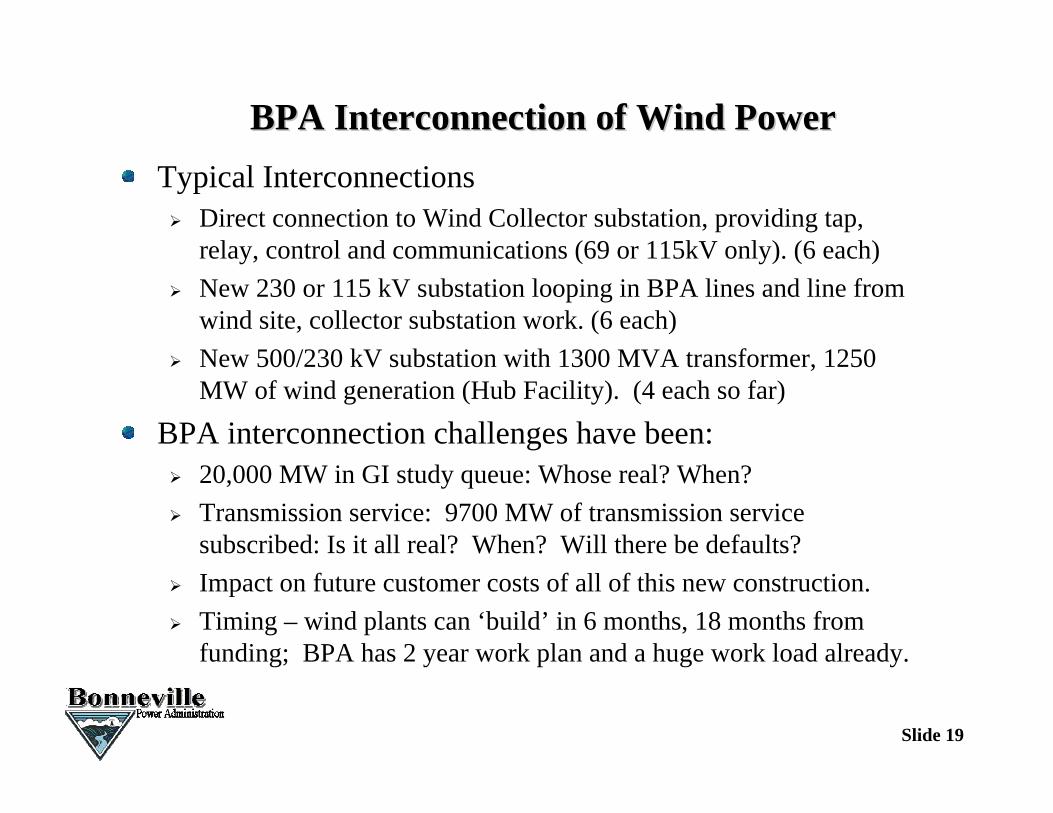
BPA Interconnection of Wind PowerBPA Interconnection of Wind PowerTypical Interconnections Direct connection to Wind Collector substation, providing tap,
relay, control and communications (69 or 115kV only). (6 each) New 230 or 115 kV substation looping in BPA lines and line from
wind site, collector substation work. (6 each) New 500/230 kV substation with 1300 MVA transformer, 1250
MW of wind generation (Hub Facility). (4 each so far)
BPA interconnection challenges have been: 20,000 MW in GI study queue: Whose real? When? Transmission service: 9700 MW of transmission service
subscribed: Is it all real? When? Will there be defaults? Impact on future customer costs of all of this new construction. Timing – wind plants can ‘build’ in 6 months, 18 months from
funding; BPA has 2 year work plan and a huge work load already.
Small Project Interconnection Small Project Interconnection (Condon Wind Site (Condon Wind Site -- Oregon 2001)Oregon 2001)
Slide 21
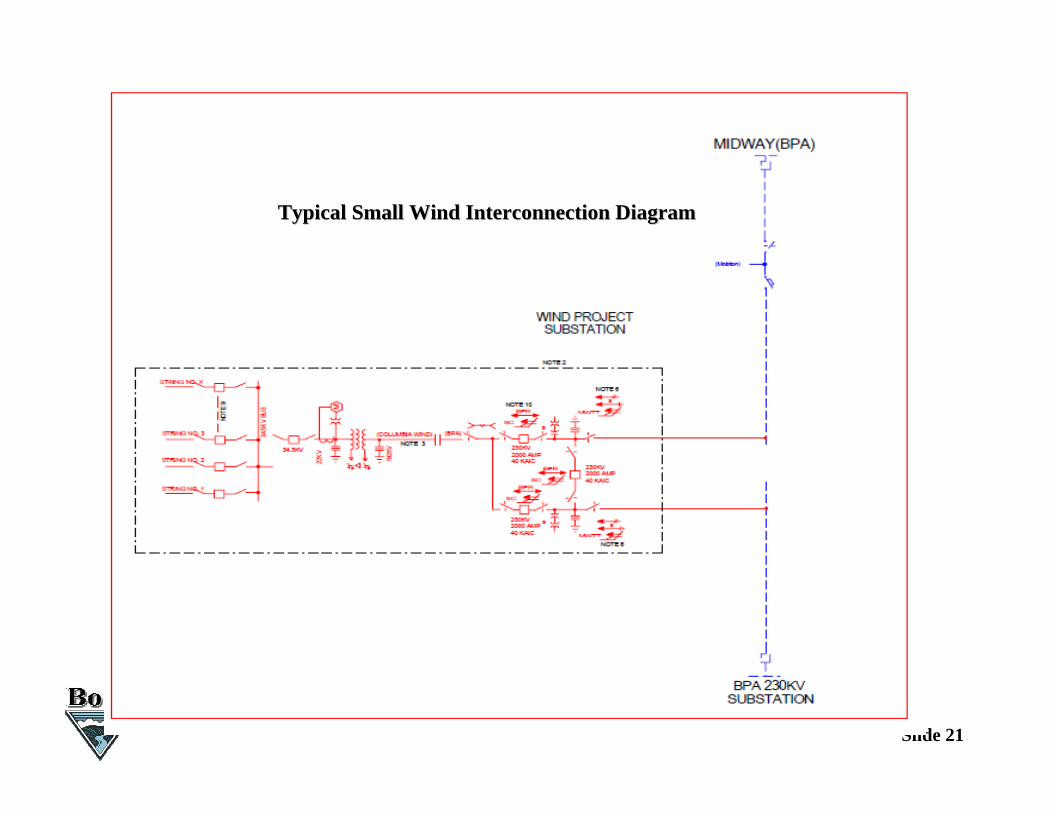
Typical Small Wind Interconnection DiagramTypical Small Wind Interconnection Diagram
Slide 22
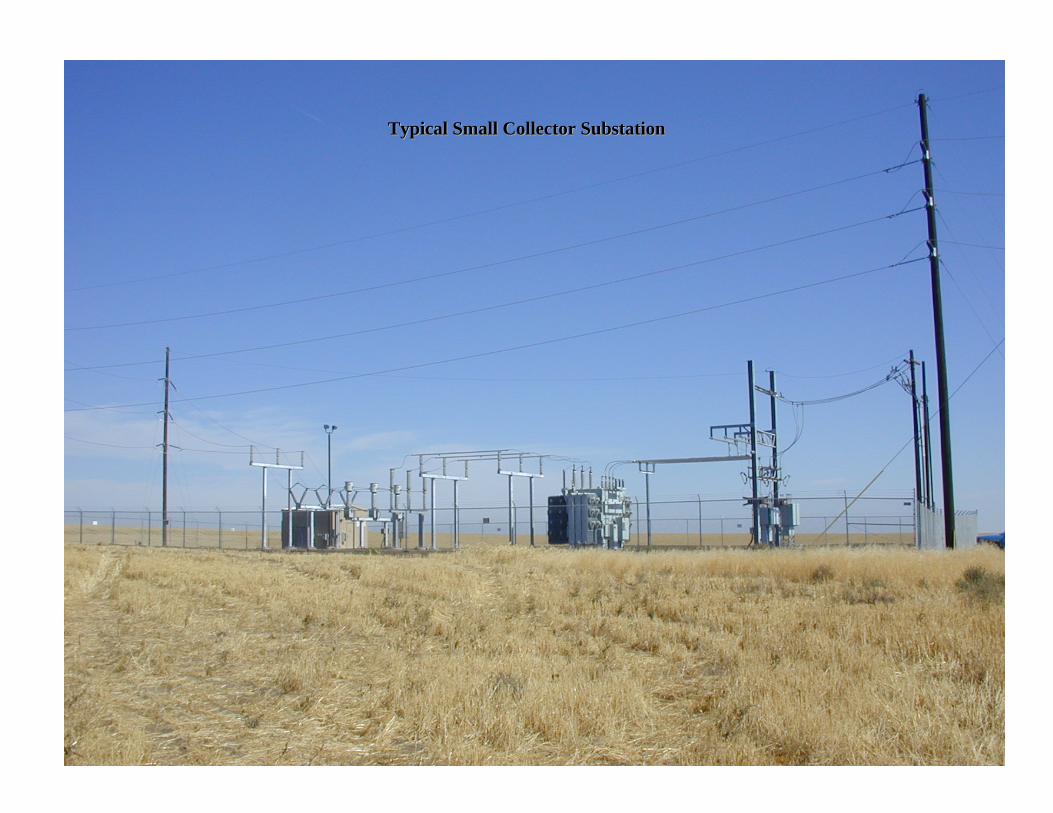
Typical Small Collector SubstationTypical Small Collector Substation
Slide 23
Slide 24
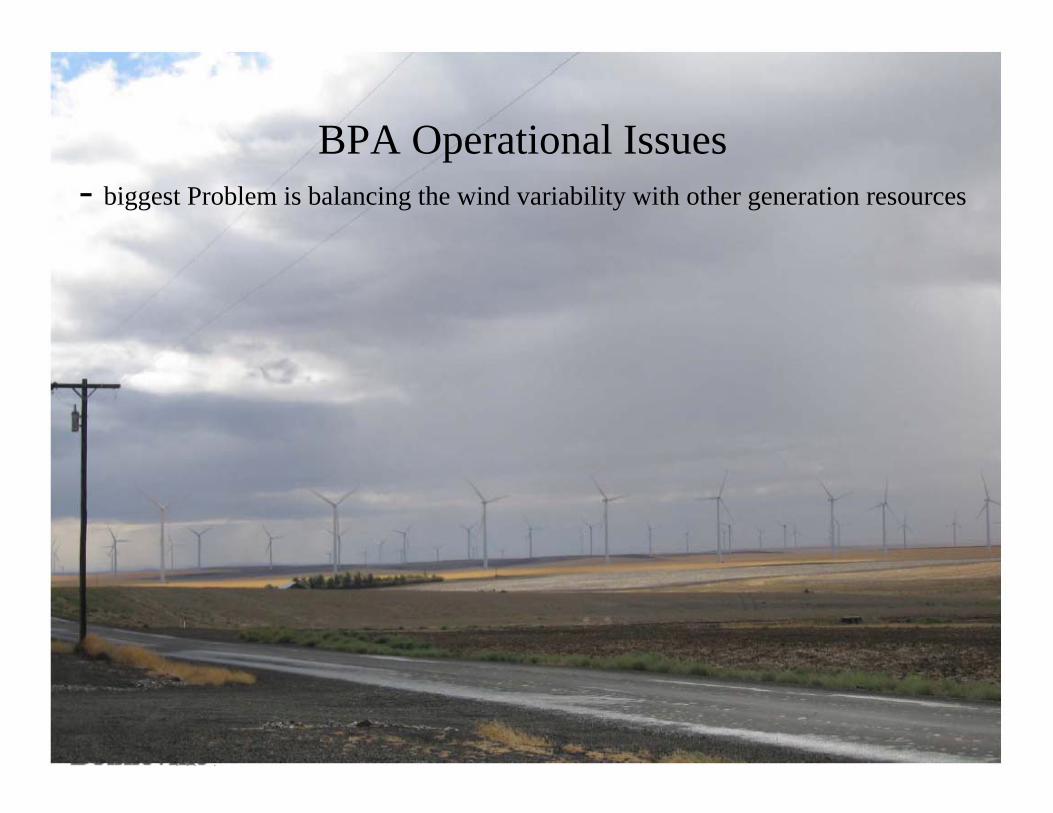
BPA Operational Issues- biggest Problem is balancing the wind variability with other generation resources
Slide 25
BPA Operational IssuesBPA Operational IssuesBPA concern is managing wind generaiton Wind is an energy resource, must have firm resources to
rely on for capacity needs. Wind Plants are remotely controlled, unlike traditional
generation, communications is an issue. Schedules seldom match actual generation – we have to
adjust other generation to maintain load-generation imbalance.
Rapid increase in wind generation – growing pains— The wind fleet is now paying $46M a year for BPA
to manage the short term variability of wind (within hour).
— For the NW region this will continue to be one of the biggest issues, and across the nation too.
Slide 26
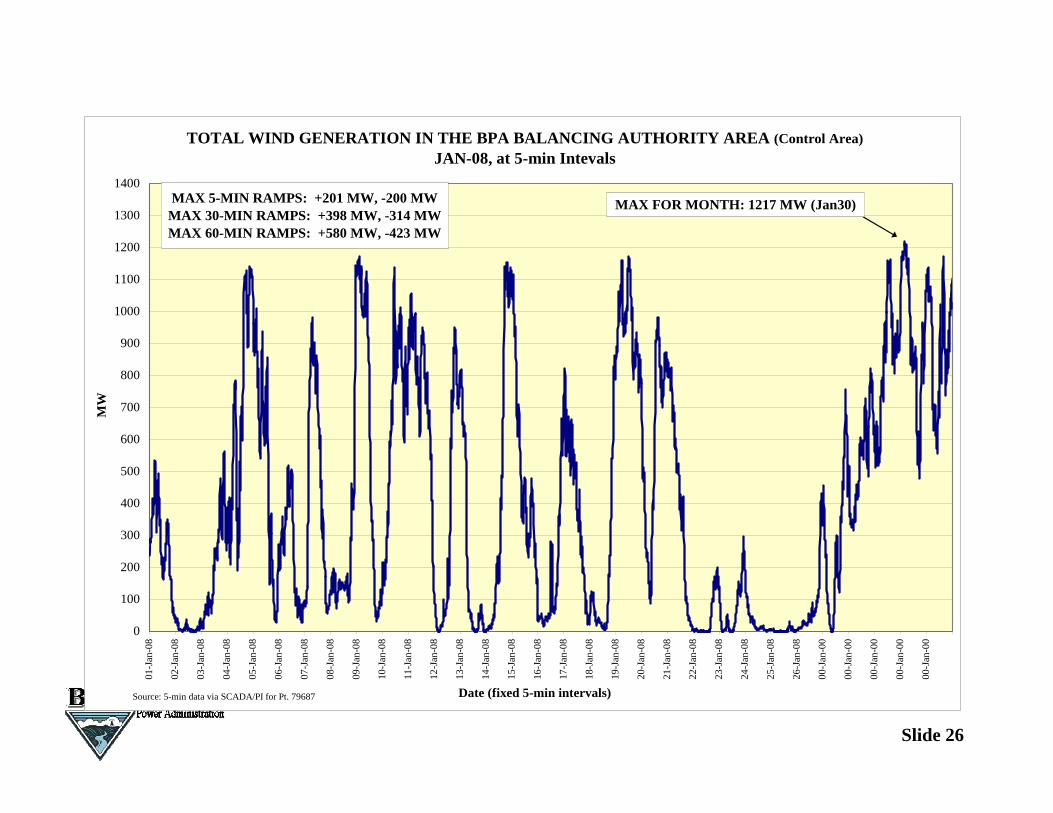
TOTAL WIND GENERATION IN THE BPA BALANCING AUTHORITY AREA (Control Area)JAN-08, at 5-min Intevals
0
100
200
300
400
500
600
700
800
900
1000
1100
1200
1300
1400
01-J
an-0
8
02-J
an-0
8
03-J
an-0
8
04-J
an-0
8
05-J
an-0
8
06-J
an-0
8
07-J
an-0
8
08-J
an-0
8
09-J
an-0
8
10-J
an-0
8
11-J
an-0
8
12-J
an-0
8
13-J
an-0
8
14-J
an-0
8
15-J
an-0
8
16-J
an-0
8
17-J
an-0
8
18-J
an-0
8
19-J
an-0
8
20-J
an-0
8
21-J
an-0
8
22-J
an-0
8
23-J
an-0
8
24-J
an-0
8
25-J
an-0
8
26-J
an-0
8
00-J
an-0
0
00-J
an-0
0
00-J
an-0
0
00-J
an-0
0
00-J
an-0
0
Date (fixed 5-min intervals)
MW
Source: 5-min data via SCADA/PI for Pt. 79687
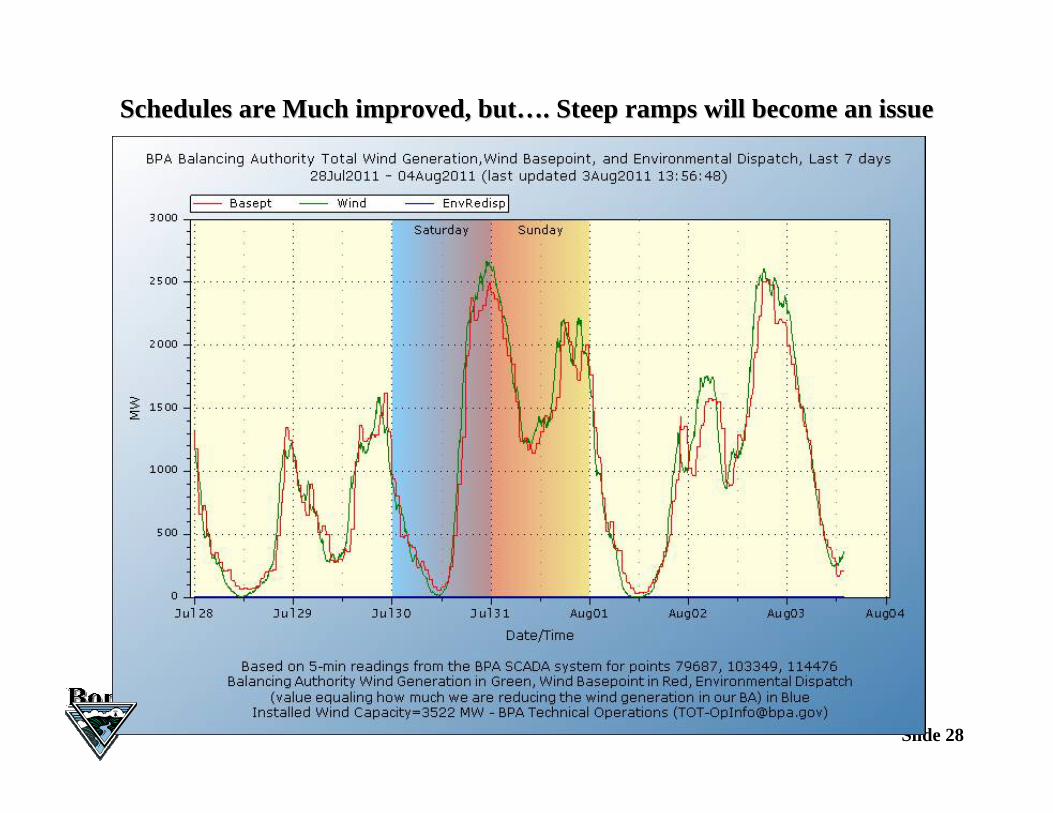
MAX 5-MIN RAMPS: +201 MW, -200 MWMAX 30-MIN RAMPS: +398 MW, -314 MWMAX 60-MIN RAMPS: +580 MW, -423 MW
MAX FOR MONTH: 1217 MW (Jan30)
Slide 27
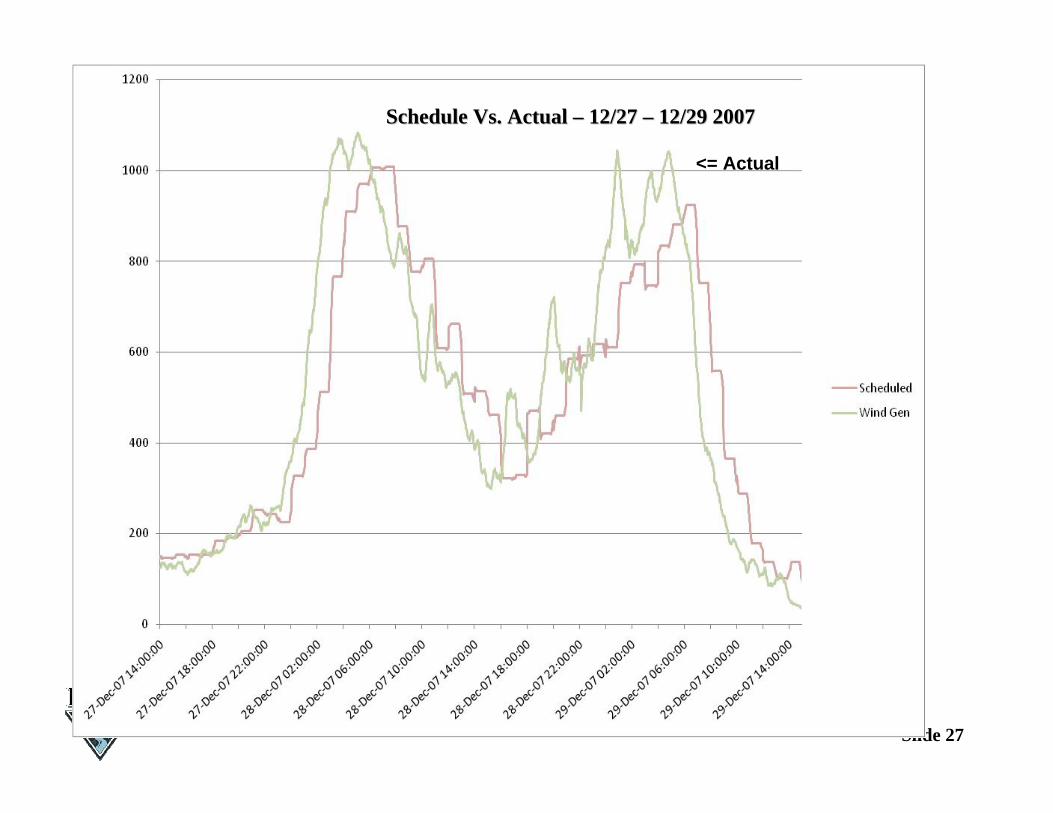
<= Actual
Schedule Vs. Actual Schedule Vs. Actual –– 12/27 12/27 –– 12/29 200712/29 2007
Slide 28
Schedules are Much improved, butSchedules are Much improved, but……. Steep ramps will become an issue . Steep ramps will become an issue
Slide 29
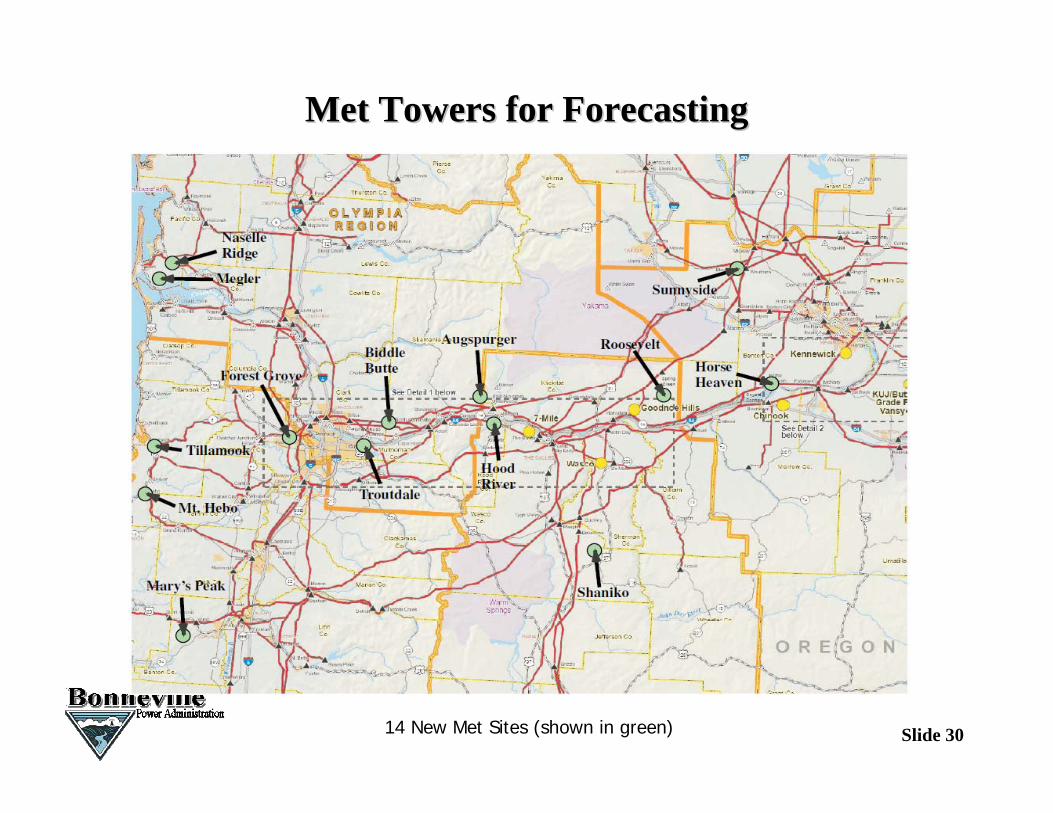
Operational ImprovementsOperational ImprovementsWind Plant operators have become much better at forecasting and adjusting wind schedules – reducing reserves.The per MW charge for wind imbalance service has actually reduced for the coming rate period.Collaboration with other NW utilities can improve (reduce) imbalancing costs (80% of wind energy generated in BPA is exported to other NW and CA utilities). BPA has implemented several initiatives to improve grid operation: Inter-Hour schedules (30 Min) to reduce the hourly errors. Better forecasting tools including adding 12 new Met Towers in the
region (data available to all wind plants). DSO216 protocol to shift tail events to the wind fleet Customer supplied balancing reserves and DTC to allow wind
projects to contract for balancing from other generation resources
Slide 30
Met Towers for ForecastingMet Towers for Forecasting
14 New Met Sites (shown in green)
Slide 31
Future EnhancementsFuture Enhancements
Increase use of gas plants and other generation resources in the NW The FCRPS is limited. BPA will need to rely on other resources to
accommodate more wind.New pilot program, “Committed Inter-Hour”, shifts imbalances to load receiving entity via 30 minute schedule adjustment of wind schedules. BPA Banks Lake will add some storage capability.Many storage technologies are now being pursued that may help in the future. Demand response adds another option to reduce the impact of wind’s variability.Balancing resource markets are being considered.The WECC is considering EIM – an Energy Imbalance Market to allow generators across the system to provide balancing services.
Slide 32
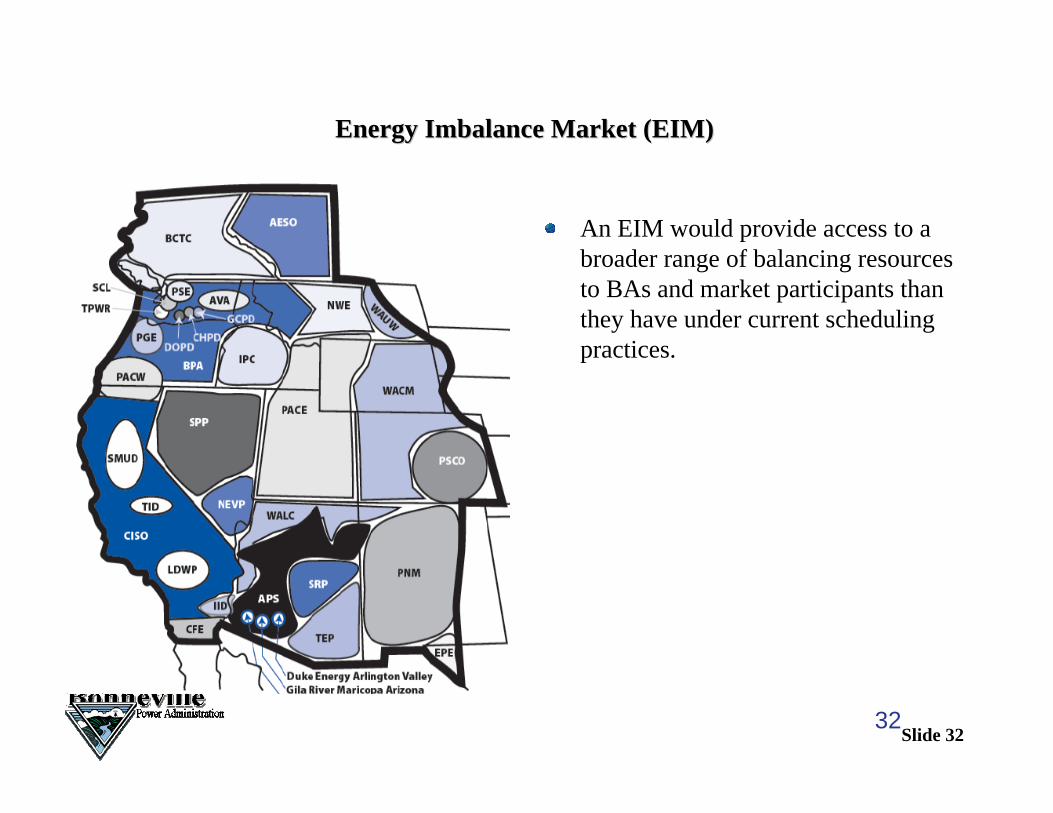
Energy Imbalance Market (EIM)Energy Imbalance Market (EIM)
32
An EIM would provide access to a broader range of balancing resources to BAs and market participants than they have under current scheduling practices.
Slide 33
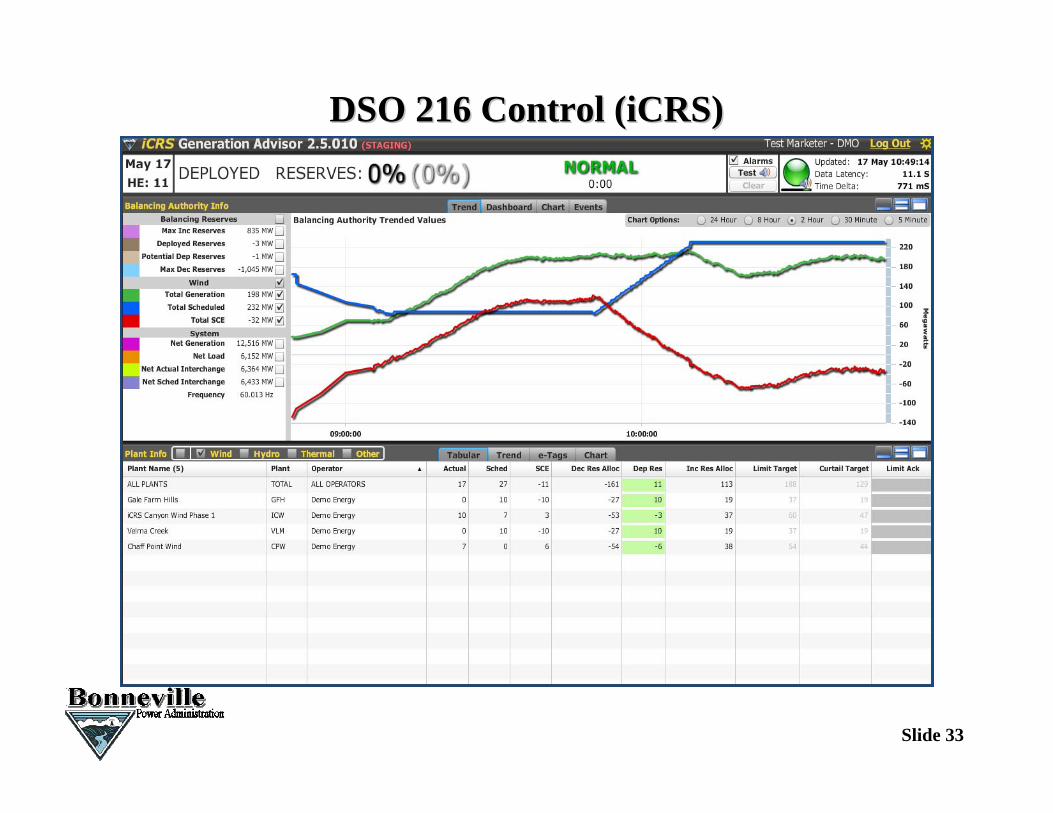
DSO 216 Control (iCRS)DSO 216 Control (iCRS)
Slide 34
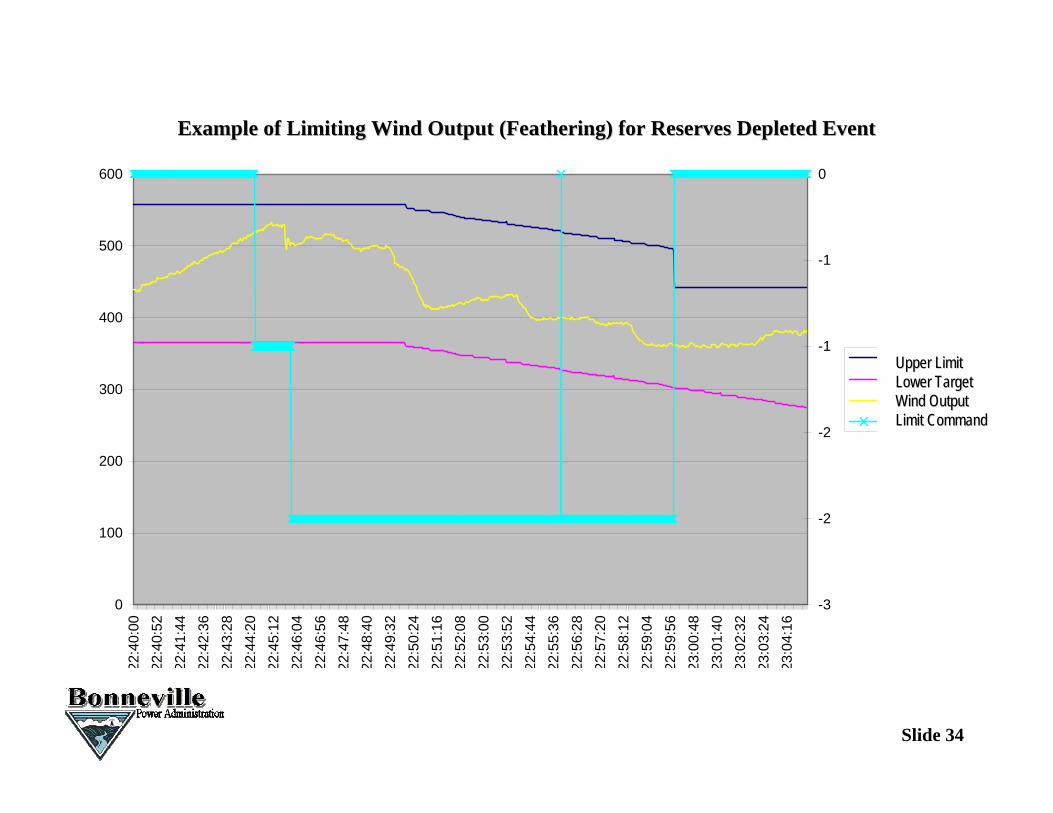
Example of Limiting Wind Output (Feathering) for Reserves DepletExample of Limiting Wind Output (Feathering) for Reserves Depleted Evented Event
0
100
200
300
400
500
600
22:4
0:00
22:4
0:52
22:4
1:44
22:4
2:36
22:4
3:28
22:4
4:20
22:4
5:12
22:4
6:04
22:4
6:56
22:4
7:48
22:4
8:40
22:4
9:32
22:5
0:24
22:5
1:16
22:5
2:08
22:5
3:00
22:5
3:52
22:5
4:44
22:5
5:36
22:5
6:28
22:5
7:20
22:5
8:12
22:5
9:04
22:5
9:56
23:0
0:48
23:0
1:40
23:0
2:32
23:0
3:24
23:0
4:16
-3
-2
-2
-1
-1
0
Upper LimitUpper LimitLower Target Lower Target Wind Output Wind Output Limit CommandLimit Command
Slide 35
Environmental Redispatch 2011Environmental Redispatch 2011BPA developed and implemented the Environmental Redispatch (ER) process to limit spills when total dissolved gas (TDG) exceeds limits. BPA must put more water through turbines to avoid increasing spill and
dissolved gas levels in the river. BPA arranges to ‘buy’ the output of non-hydro generation by offering zero cost
power from the FCRPS And temporarily limits the output of all other non-hydro generation in order to
maintain TDG levels.Environmental Redispatch BPA issued draft ROD Feb 2011 and final ROD on May 13, 2011. BPA offered free energy in the market prior to ER ER implemented as last resort. ER was used to control TDG levels May 18 – July 10 Mostly during light load hours and more infrequently during July (range of 4 –
7 hrs per night).
Slide 36
What’s next (A note from management):
Develop an equitable and durable protocol for managing the operational and cost allocation issues associated with over supply conditions for Spring 2012.
Collaborate with the Wind Integration Steering Commission (WISC) to review and implement longer-term solutions (beyond FY 12) for over-supply conditions.
Support Council efforts to define the supply curve of potential long-term physical solutions to the regional over-supply issue.
36
Environmental Redispatch 2012Environmental Redispatch 2012
Slide 37
ClosingClosingWind is Energy Resource not Demand Resource Will need traditional power plants for increasing demand But is helping NW meet energy needs.
Private Corps and Utilities are installing 3-4000MW’s of Wind in NW next 3-4 years ($7 - $8 Billion capital cost including 2011). This will add much Tax revenue to the local rural economies
Wind Projects have had rapid expansion since 2007: Locating first in areas with excess transmission interconnection
capability (no new long lines required) BPA has offered over 9,000 MW in new transmission service for
wind generation enabled in part by BPA build of 3 new major lines. The OR/WA/CA RPS’s one driver of the demand Federal PTC extended thru 2012 is another driver.
Community Wind Projects are picking up.
Slide 38