Embed Size (px)
Citation preview

Long term trends in the birds of Wimbledon Park
• Dave Dawson has made a monthly count since 1986
• This gives a unique description of long term trends in species’ populations
• On each slide, the trend is graphed top left
• At bottom left is the monthly average count, showing how the numbers change with the seasons
• There’s a summary of these findings beneath each chart

Black-headed gull
020406080
100120
1985
-86
1988
-89
1991
-92
1994
-95
1997
-98
2000
-01
2003
-04
2006
-07
2009
-10
Wimbledon Park Standard Walk count for years beginning in August
Mea
n m
onth
ly c
ount
for
Aug
to
July
yea
rs
Black-headed gull
0.0
20.0
40.0
60.0
80.0
100.0
120.0
140.0
160.0
Jan
Feb
Mar
Apr
May Jun
Jul
Aug
Sep Oct
Nov
Dec
Wimbledon Park standard w alk , average count in each month
Ave
rage
cou
nt 1
985-
2009
Non-breeding visitorA decline of about 50%
© Dr D.G. Dawson 2013
Blackbird
0
10
20
3040
50
1985
-86
1988
-89
1991
-92
1994
-95
1997
-98
2000
-01
2003
-04
2006
-07
2009
-10
Wimbledon Park Standard Walk count for years beginning in August
Mea
n m
onth
ly c
ount
for A
ug to
Ju
ly y
ears
Blackbird
0.0
5.0
10.0
15.0
20.0
25.0
30.0
35.0
Jan
Feb
Mar
Apr
May Ju
n
Jul
Aug
Sep
Oct
Nov
Dec
Wimbledon Park standard w alk, average count in each month
Ave
rage
cou
nt 1
985-
2009
ResidentA decline of about 80%
© Dr D.G. Dawson 2013

Blackcap
0.0
0.5
1.0
1.5
1985
-86
1988
-89
1991
-92
1994
-95
1997
-98
2000
-01
2003
-04
2006
-07
2009
-10
Wimbledon Park Standard Walk count for years beginning in August
Mea
n m
onth
ly c
ount
for A
ug to
Ju
ly y
ears
Blackcap
0.0
0.5
1.0
1.5
2.0
2.5
3.0
Jan
Feb
Mar
Apr
May Ju
n
Jul
Aug
Sep
Oct
Nov
Dec
Wimbledon Park standard w alk , average count in each month
Ave
rage
cou
nt 1
985-
2009
Summer migrantAn increase of about 90%
© Dr D.G. Dawson 2013

Blue tit
0
5
10
15
20
25
1985
-86
1988
-89
1991
-92
1994
-95
1997
-98
2000
-01
2003
-04
2006
-07
2009
-10
Wimbledon Park Standard Walk count for years beginning in August
Mea
n m
onth
ly c
ount
for A
ug to
Ju
ly y
ears
Blue tit
0
5
10
15
20
25
30
Jan
Feb
Mar
Apr
May Jun
Jul
Aug
Sep Oct
Nov
Dec
Wimbledon Park standard walk, average count in each month
Ave
rage
cou
nt 1
985-
2009
Resident.An increase and thena decreaseNet changeabout 20%
© Dr D.G. Dawson 2013

Canada goose
0
20
40
60
80
100
1985
-86
1988
-89
1991
-92
1994
-95
1997
-98
2000
-01
2003
-04
2006
-07
2009
-10
Wimbledon Park Standard Walk count for years beginning in August
Mea
n m
onth
ly c
ount
for
Aug
to
July
yea
rs
London residentNo overall change
Canada goose
0
10
20
30
40
50
60
70
80
90
Jan
Feb
Mar
Apr
May Jun
Jul
Aug
Sep Oct
Nov
Dec
Wimbledon Park standard walk, average count in each month
Ave
rage
cou
nt 1
985-
2009
© Dr D.G. Dawson 2013

Carrion crow
0
5
10
15
20
25
1985
-86
1988
-89
1991
-92
1994
-95
1997
-98
2000
-01
2003
-04
2006
-07
2009
-10
Wimbledon Park Standard Walk count
Mea
n m
onth
ly c
ount
for
Aug
to
July
yea
rs
Resident.An increase and thena decrease.Net lossabout 25%.
Carrion crow
0
5
10
15
20
25
Jan
Feb
Mar
Apr
May Jun
Jul
Aug
Sep Oct
Nov
Dec
Wimbledon Park standard walk, average count in each month
Ave
rage
cou
nt 1
985-
2009
© Dr D.G. Dawson 2013

Chaffinch
02468
1012141618
1985
-86
1988
-89
1991
-92
1994
-95
1997
-98
2000
-01
2003
-04
2006
-07
2009
-10
Wimbledon Park Standard Walk count
Mea
n m
onth
ly c
ount
for
Aug
to
July
yea
rs
Chaffinch
0
1
2
3
4
5
6
7
8
9
Jan
Feb
Mar
Apr
May Ju
n
Jul
Aug
Sep Oct
Nov
Dec
Wimbledon Park standard walk, average count in each month
Ave
rage
cou
nt 1
985-
2009
Resident. An increase to stability. Net increase about 500% © Dr D.G. Dawson 2013

Chiffchaff
0.00.10.20.30.40.50.60.70.8
1985
-86
1988
-89
1991
-92
1994
-95
1997
-98
2000
-01
2003
-04
2006
-07
2009
-10
Wimbledon Park Standard Walk count
Mea
n m
onth
ly c
ount
for
Aug
to
July
yea
rs
Chiffchaff
0.0
0.1
0.2
0.3
0.4
0.5
0.6
0.7
0.8
0.9
Jan
Feb
Mar
Apr
May Ju
n
Jul
Aug
Sep Oct
Nov
Dec
Wimbledon Park standard walk, average count in each month
Ave
rage
cou
nt 1
985-
2009
Summer migrant.An increase and thena decrease. Net gainabout 200%.
© Dr D.G. Dawson 2013

Common gull
0.01.02.03.04.05.06.07.0
1985
-86
1988
-89
1991
-92
1994
-95
1997
-98
2000
-01
2003
-04
2006
-07
2009
-10
Wimbledon Park Standard Walk count
Mea
n m
onth
ly c
ount
for
Aug
to
July
yea
rs
Common gull
0.0
1.0
2.0
3.0
4.0
5.0
6.0
Jan
Feb
Mar
Apr
May Ju
n
Jul
Aug
Sep Oct
Nov
Dec
Wimbledon Park standard walk, average count in each month
Ave
rage
cou
nt 1
985-
2009
Winter visitor.A decrease to stability.Net loss about 40%.
© Dr D.G. Dawson 2013

Coot
0
10
20
30
40
50
60
1985
-86
1988
-89
1991
-92
1994
-95
1997
-98
2000
-01
2003
-04
2006
-07
2009
-10
Wimbledon Park Standard Walk count
Mea
n m
onth
ly c
ount
for
Aug
to
July
yea
rs
Coot
0
5
10
15
20
25
30
35
40
45
Jan
Feb
Mar
Apr
May Ju
n
Jul
Aug
Sep Oct
Nov
Dec
Wimbledon Park standard walk, average count in each month
Ave
rage
cou
nt 1
985-
2009
Resident.An increase of about 80%
© Dr D.G. Dawson 2013

Cormorant
01234567
1985
-86
1988
-89
1991
-92
1994
-95
1997
-98
2000
-01
2003
-04
2006
-07
2009
-10
Wimbledon Park Standard Walk count
Mea
n m
onth
ly c
ount
for
Aug
to
July
yea
rs
Cormorant
0
1
2
3
4
5
6
7
8
Jan
Feb
Mar
Apr
May Ju
n
Jul
Aug
Sep Oct
Nov
Dec
Wimbledon Park standard walk, average count in each month
Ave
rage
cou
nt 1
985-
2009
Winter visitor.No overall change.
© Dr D.G. Dawson 2013

Dunnock
012345678
1985
-86
1987
-88
1989
-90
1991
-92
1993
-94
1995
-96
1997
-98
1999
-00
2001
-02
2003
-04
2005
-06
2007
-08
2009
-10
2011
-12
Wimbledon Park Standard Walk count
Mea
n m
onth
ly c
ount
for A
ug to
Ju
ly y
ears
Dunnock
0
1
2
3
4
5
6
7
8
9
Jan
Feb
Mar Ap
r
May Ju
n
Jul
Aug
Sep Oct
Nov
Dec
Wimbledon Park standard walk, average count in each month
Ave
rage
cou
nt 1
985-
2009
Resident.Decrease by 65%.
© Dr D.G. Dawson 2013

Egyptian Goose
02468
101214
1985
-86
1988
-89
1991
-92
1994
-95
1997
-98
2000
-01
2003
-04
2006
-07
2009
-10
Wimbledon Park Standard Walk count
Mea
n m
onth
ly c
ount
for
Aug
to
July
yea
rs
Egyptian Goose
0
1
2
3
4
5
6
Jan
Feb
Mar Apr
May Jun
Jul
Aug
Sep Oct
Nov
Dec
Wimbledon Park standard walk, average count in each month
Ave
rage
cou
nt 1
985-
2009
London resident.Arrived in 2003.Then stable.
© Dr D.G. Dawson 2013
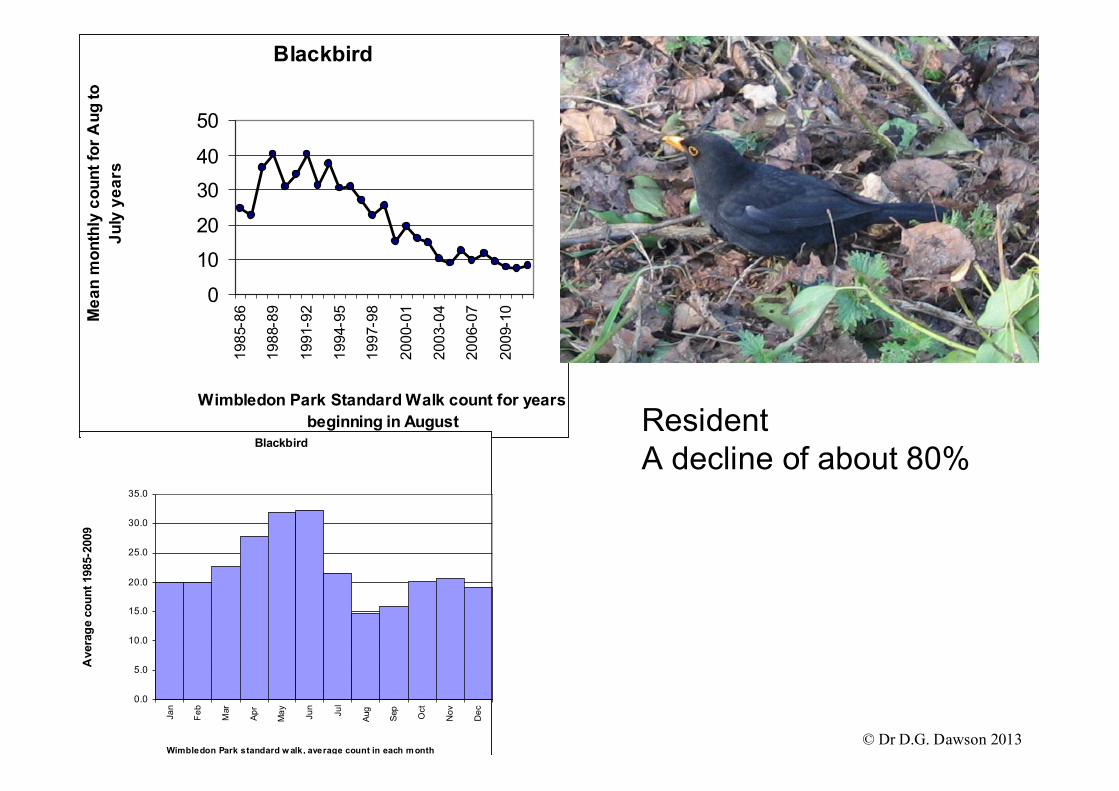
Feral pigeon
0102030405060708090
1985
-86
1988
-89
1991
-92
1994
-95
1997
-98
2000
-01
2003
-04
2006
-07
2009
-10
Wimbledon Park Standard Walk count
Mea
n m
onth
ly c
ount
for
Aug
to
July
yea
rs
Feral pigeon
0
10
20
30
40
50
60
70
80
90
Jan
Feb
Mar
Apr
May Ju
n
Jul
Aug
Sep Oct
Nov
Dec
Wimbledon Park standard walk, average count in each month
Ave
rage
cou
nt 1
985-
2009
London resident.Increased, then decreased.Little overall change.
© Dr D.G. Dawson 2013

Goldcrest
0.00.20.40.60.81.01.21.4
1985
-86
1988
-89
1991
-92
1994
-95
1997
-98
2000
-01
2003
-04
2006
-07
2009
-10
Wimbledon Park Standard Walk count
Mea
n m
onth
ly c
ount
for
Aug
to
July
yea
rs
Goldcrest
0.0
0.2
0.4
0.6
0.8
1.0
1.2
1.4
1.6
Jan
Feb
Mar
Apr
May Ju
n
Jul
Aug
Sep Oct
Nov
Dec
Wimbledon Park standard walk, average count in each month
Ave
rage
cou
nt 1
985-
2009
Mainly autumn visitor.No significant change.
© Dr D.G. Dawson 2013

Goldfinch
0.00.5
1.01.5
2.0
2.53.0
1985
-86
1988
-89
1991
-92
1994
-95
1997
-98
2000
-01
2003
-04
2006
-07
2009
-10
Wimbledon Park Standard Walk count
Mea
n m
onth
ly c
ount
for
Aug
to
July
yea
rs
Goldfinch
0.0
0.2
0.4
0.6
0.8
1.0
1.2
1.4
1.6
Jan
Feb
Mar
Apr
May Jun
Jul
Aug
Sep Oct
Nov
Dec
Wimbledon Park standard walk, average count in each month
Ave
rage
cou
nt 1
985-
2009
Resident.Increase by about 200%.
© Dr D.G. Dawson 2013

Great crested grebe
02468
101214
1985
-86
1988
-89
1991
-92
1994
-95
1997
-98
2000
-01
2003
-04
2006
-07
2009
-10
Wimbledon Park Standard Walk count
Mea
n m
onth
ly c
ount
for
Aug
to
July
yea
rs
Great crested grebe
0
2
4
6
8
10
12
Jan
Feb Mar
Apr
May Ju
n
Jul
Aug
Sep Oct
Nov
Dec
Wimbledon Park standard walk, average count in each month
Ave
rage
cou
nt 1
985-
2009
Resident.Increase, then decrease.Little overall change.
© Dr D.G. Dawson 2013

Great spotted woodpecker
0.0
0.5
1.0
1.5
2.0
2.5
1985
-86
1988
-89
1991
-92
1994
-95
1997
-98
2000
-01
2003
-04
2006
-07
2009
-10
Wimbledon Park Standard Walk count
Mea
n m
onth
ly c
ount
for A
ug to
Ju
ly y
ears
Great spotted woodpecker
0.0
0.2
0.4
0.6
0.8
1.0
1.2
1.4
1.6
1.8
Jan
Feb
Mar Ap
r
May Ju
n
Jul
Aug
Sep Oct
Nov
Dec
Wimbledon Park standard walk, average count in each month
Ave
rage
cou
nt 1
985-
2009
Resident.Increase, then decrease.150% increase overall.
© Dr D.G. Dawson 2013

Great tit
02468
101214
1985
-86
1988
-89
1991
-92
1994
-95
1997
-98
2000
-01
2003
-04
2006
-07
2009
-10
Wimbledon Park Standard Walk count
Mea
n m
onth
ly c
ount
for
Aug
to
July
yea
rs
Great tit
0
2
4
6
8
10
12
Jan
Feb
Mar Apr
May Jun
Jul
Aug
Sep Oct
Nov
Dec
Wimbledon Park standard walk, average count in each month
Ave
rage
cou
nt 1
985-
2009
Resident.Increase, to stability.Overall 150% increase.
© Dr D.G. Dawson 2013

Green woodpecker
0.00.20.40.60.81.01.21.41.6
1985
-86
1988
-89
1991
-92
1994
-95
1997
-98
2000
-01
2003
-04
2006
-07
2009
-10
Wimbledon Park Standard Walk count
Mea
n m
onth
ly c
ount
for
Aug
to
July
yea
rs
Green woodpecker
0.0
0.2
0.4
0.6
0.8
1.0
1.2
1.4
Jan
Feb
Mar
Apr
May Jun
Jul
Aug
Sep
Oct
Nov
Dec
Wimbledon Park standard w alk, average count in e ach month
Ave
rage
cou
nt 1
985-
2009
Resident.Increase, then decrease.Overall little change.
© Dr D.G. Dawson 2013

Greenfinch
02468
10121416
1985
-86
1988
-89
1991
-92
1994
-95
1997
-98
2000
-01
2003
-04
2006
-07
2009
-10
Wimbledon Park Standard Walk count
Mea
n m
onth
ly c
ount
for
Aug
to
July
yea
rs
Greenfinch
0
2
4
6
8
10
12
14
16
18
20
Jan
Feb
Mar
Apr
May Ju
n
Jul
Aug
Sep
Oct
Nov
Dec
Wimbledon Park standard walk, average count in each m onth
Ave
rage
cou
nt 1
985-
2009
Resident.Recent decrease.By about 50%.Believed to be because of disease
© Dr D.G. Dawson 2013

Grey heron
0.00.20.40.60.81.01.21.41.61.8
1985
-86
1988
-89
1991
-92
1994
-95
1997
-98
2000
-01
2003
-04
2006
-07
2009
-10
Wimbledon Park Standard Walk count
Mea
n m
onth
ly c
ount
for
Aug
to
July
yea
rs
Grey heron
0.0
0.2
0.4
0.6
0.8
1.0
1.2
1.4
Jan
Feb
Mar
Apr
May Jun
Jul
Aug Se
p
Oct
Nov
Dec
Wimbledon Park standard w alk , average count in each month
Ave
rage
cou
nt 1
985-
2009 London resident visitor.
Overall decrease.By about 50%.
© Dr D.G. Dawson 2013

Greylag
0
5
10
15
20
1985
-86
1988
-89
1991
-92
1994
-95
1997
-98
2000
-01
2003
-04
2006
-07
2009
-10
Wimbledon Park Standard Walk count
Mea
n m
onth
ly c
ount
for
Aug
to
July
yea
rs
Greylag
0
1
2
3
4
5
6
7
8
Jan
Feb
Mar
Apr
May Jun
Jul
Aug
Sep
Oct
Nov
Dec
Wimbledon Park standard w alk, average count in each month
Ave
rage
cou
nt 1
985-
2009 Native species but London resident
population feral.Arrived 2000 and still increasing.
© Dr D.G. Dawson 2013

House martin
05
101520253035
1985
-86
1988
-89
1991
-92
1994
-95
1997
-98
2000
-01
2003
-04
2006
-07
2009
-10
Wimbledon Park Standard Walk count
Mea
n m
onth
ly c
ount
for
Aug
to
July
yea
rs
House martin
0
5
10
15
20
25
Jan
Feb
Mar
Apr
May Jun
Jul
Aug
Sep
Oct
Nov
Dec
Wimbledon Park standard w alk, average count in each month
Ave
rage
cou
nt 1
985-
2009 Summer visitor to breed.
Decline by about 90%.Now almost extinct in south-west London.
© Dr D.G. Dawson 2013

House sparrow
01020304050607080
1985
-86
1988
-89
1991
-92
1994
-95
1997
-98
2000
-01
2003
-04
2006
-07
2009
-10
Wimbledon Park Standard Walk count
Mea
n m
onth
ly c
ount
for
Aug
to
July
yea
rs
House sparrow
0
5
10
15
20
25
30
35
Jan
Feb
Mar
Apr
May Jun
Jul
Aug Sep Oct
Nov
Dec
Wim bledon Par k standard walk, average count in each month
Ave
rage
cou
nt 1
985-
2009
Resident.Decrease by about 99%Possible small recent recovery.
© Dr D.G. Dawson 2013

Jay
0.00.51.01.52.02.53.03.5
1985
-86
1988
-89
1991
-92
1994
-95
1997
-98
2000
-01
2003
-04
2006
-07
2009
-10
Wimbledon Park Standard Walk count
Mea
n m
onth
ly c
ount
for
Aug
to
July
yea
rs
Jay
0.0
0.5
1.0
1.5
2.0
2.5
3.0
Jan
Feb
Mar
Apr
May Jun
Jul
Aug
Sep
Oct
Nov
Dec
Wimbledon Park standard w alk, average count in each month
Ave
rage
cou
nt 1
985-
2009 Resident, seen most in autumn.
Decline by about 55%.
© Dr D.G. Dawson 2013

Kestrel
0.000.050.100.150.200.250.300.35
1985
-86
1988
-89
1991
-92
1994
-95
1997
-98
2000
-01
2003
-04
2006
-07
2009
-10
Wimbledon Park Standard Walk count
Mea
n m
onth
ly c
ount
for
Aug
to
July
yea
rs
Kestrel
0.00
0.02
0.04
0.06
0.08
0.10
0.12
0.14
Jan
Feb
Mar
Apr
May Jun
Jul
Aug
Sep
Oct
Nov
Dec
Wimbledon Park standard walk, average count in each month
Ave
rage
cou
nt 1
985-
2009 Uncommon resident.
Declined to zero in the early 00s
© Dr D.G. Dawson 2013

Lesser black-backed gull
0.00.20.40.60.81.01.21.4
1985
-86
1988
-89
1991
-92
1994
-95
1997
-98
2000
-01
2003
-04
2006
-07
2009
-10
Wimbledon Park Standard Walk count
Mea
n m
onth
ly c
ount
for
Aug
to
July
yea
rs
Lesser black-backed gull
0.0
0.2
0.4
0.6
0.8
1.0
1.2
Jan
Feb
Mar
Apr
May Jun
Jul
Aug
Sep
Oct
Nov
Dec
Wimbledon Park standard walk, average count in each month
Ave
rage
cou
nt 1
985-
2009 Uncommon resident.
Declined by about 65%
© Dr D.G. Dawson 2013

Long-tailed tit
0.0
1.0
2.0
3.0
4.0
5.0
1985
-86
1988
-89
1991
-92
1994
-95
1997
-98
2000
-01
2003
-04
2006
-07
2009
-10
Wimbledon Park Standard Walk count
Mea
n m
onth
ly c
ount
for
Aug
to
July
yea
rs
Long-tailed tit
0.0
0.5
1.0
1.5
2.0
2.5
3.0
Jan
Feb
Mar
Apr
May Jun
Jul
Aug
Sep
Oct
Nov
Dec
Wimbledon Park standard walk, average count in each month
Ave
rage
cou
nt 1
985-
2009 Uncommon resident.
Increased about twofold
© Dr D.G. Dawson 2013
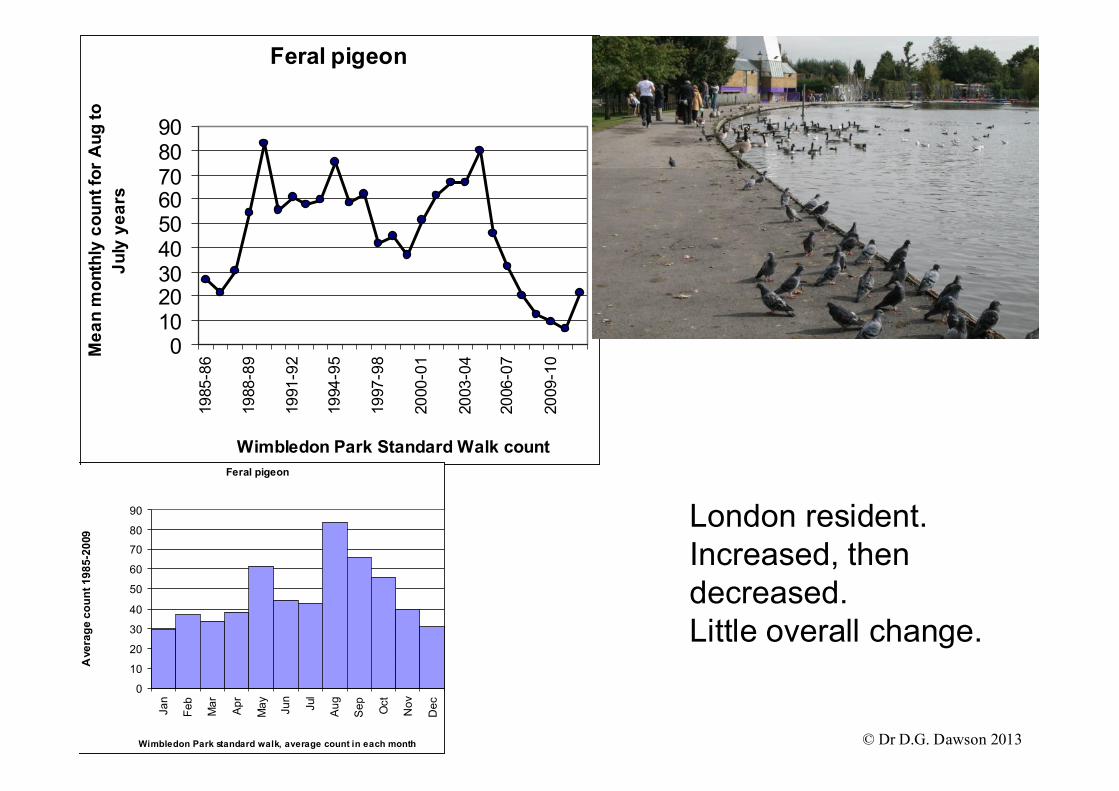
Magpie
0123456789
1985
-86
1987
-88
1989
-90
1991
-92
1993
-94
1995
-96
1997
-98
1999
-00
2001
-02
2003
-04
2005
-06
2007
-08
2009
-10
2011
-12
Wimbledon Park Standard Walk count
Mea
n m
onth
ly c
ount
for
Aug
to
July
yea
rs
Magpie
0.0
1.0
2.0
3.0
4.0
5.0
6.0
7.0
8.0
9.0
Jan
Feb
Mar
Apr
May Jun
Jul
Aug
Sep
Oct
Nov
Dec
Wimbledon Park standard walk, average count in each month
Ave
rage
cou
nt 1
985-
2009 Resident.
Increased about twofold
© Dr D.G. Dawson 2013

Mallard
0
1020
30
40
50
60
1985
-86
1988
-89
1991
-92
1994
-95
1997
-98
2000
-01
2003
-04
2006
-07
2009
-10
Wimbledon Park Standard Walk count
Mea
n m
onth
ly c
ount
for
Aug
to
July
yea
rs
Mallard
0
10
20
30
40
50
60
70
Jan
Feb
Mar
Apr
May Jun
Jul
Aug
Sep
Oct
Nov
Dec
Wimbledon Park standard w alk, average count in each month
Ave
rage
cou
nt 1
985-
2009 London resident.
Decreased about 60%
© Dr D.G. Dawson 2013

Mistle thrush
0.00.5
1.0
1.5
2.02.5
3.0
1985
-86
1988
-89
1991
-92
1994
-95
1997
-98
2000
-01
2003
-04
2006
-07
2009
-10
Wimbledon Park Standard Walk count
Mea
n m
onth
ly c
ount
for
Aug
to
July
yea
rs
Mistle thrush
0.0
0.2
0.4
0.6
0.8
1.0
1.2
1.4
1.6
1.8
2.0
Jan
Feb
Mar
Apr
May Ju
n
Jul
Aug
Sep
Oct
Nov
Dec
Wim bledon Park standard walk, average count in each month
Ave
rage
cou
nt 1
985-
2009 Resident.
Decreased about 40%
© Dr D.G. Dawson 2013

Moorhen
0123456789
1985
-86
1988
-89
1991
-92
1994
-95
1997
-98
2000
-01
2003
-04
2006
-07
2009
-10
Wimbledon Park Standard Walk count
Mea
n m
onth
ly c
ount
for
Aug
to
July
yea
rs
Moorhen
0
1
2
3
4
5
6
7
8
9
Jan
Feb
Mar
Apr
May Jun
Jul
Aug
Sep
Oct
Nov
Dec
Wimbledon Park standard w alk, average count in each month
Ave
rage
cou
nt 1
985-
2009 Resident.
Increased, then decreasedOverall change about 70%
© Dr D.G. Dawson 2013

Mute swan
0
12
3
45
6
1985
-86
1987
-88
1989
-90
1991
-92
1993
-94
1995
-96
1997
-98
1999
-00
2001
-02
2003
-04
2005
-06
2007
-08
2009
-10
2011
-12
Wimbledon Park Standard Walk count
Mea
n m
onth
ly c
ount
for A
ug to
Ju
ly y
ears
Mute swan
0.0
0.5
1.0
1.5
2.0
2.5
3.0
3.5
4.0
4.5
Jan
Feb
Mar
Apr
May Ju
n
Jul
Aug Sep Oct
Nov
Dec
Wimbledon Park standard w alk, average count in each month
Ave
rage
cou
nt 1
985-
2009 Resident pair.
Changes reflect breeding success.Recent decline because of the Golf Course fence.
© Dr D.G. Dawson 2013

Pied wagtail
0.00.51.01.52.02.53.03.54.0
1985
-86
1988
-89
1991
-92
1994
-95
1997
-98
2000
-01
2003
-04
2006
-07
2009
-10
Wimbledon Park Standard Walk count
Mea
n m
onth
ly c
ount
for A
ug to
Ju
ly y
ears
Pied wagtail
0.0
0.5
1.0
1.5
2.0
2.5
3.0
Jan
Feb
Mar
Apr
May Ju
n
Jul
Aug
Sep
Oct
Nov
Dec
Wimbledon Park standard w alk, average count in each month
Ave
rage
cou
nt 1
985-
2009
London resident visitor.Seen most in autumn.Increase and then a decrease.
© Dr D.G. Dawson 2013

Redwing
0.01.02.03.04.05.06.07.0
1985
-86
1988
-89
1991
-92
1994
-95
1997
-98
2000
-01
2003
-04
2006
-07
2009
-10
Wimbledon Park Standard Walk count
Mea
n m
onth
ly c
ount
for
Aug
to
July
yea
rs
Redwing
0.0
0.5
1.0
1.5
2.0
2.5
3.0
3.5
4.0
4.5
Jan
Feb
Mar
Apr
May Jun
Jul
Aug
Sep
Oct
Nov
Dec
Wimbledon Park standard w alk, average count in each month
Ave
rage
cou
nt 1
985-
2009 Uncommon winter visitor.
No overall trend.
© Dr D.G. Dawson 2013

Ring-necked parakeet
02468
10121416
1985
-86
1988
-89
1991
-92
1994
-95
1997
-98
2000
-01
2003
-04
2006
-07
2009
-10
Wimbledon Park Standard Walk count
Mea
n m
onth
ly c
ount
for
Aug
to
July
yea
rs
Ring-necked parakeet
0.0
0.5
1.0
1.5
2.0
2.5
3.0
3.5
Jan
Feb
Mar
Apr
May Ju
n
Jul
Aug
Sep
Oct
Nov
Dec
Wimbledon Park standard walk, average count in each m onth
Ave
rage
cou
nt 1
985-
2009 Began to breed in 2004.
Still increasing.No evidence of adverse effects on native birds, but they do eat soft fruit
© Dr D.G. Dawson 2013

Robin
0
5
10
15
20
25
1985
-86
1988
-89
1991
-92
1994
-95
1997
-98
2000
-01
2003
-04
2006
-07
2009
-10
Wimbledon Park Standard Walk count
Mea
n m
onth
ly c
ount
for
Aug
to
July
yea
rs
Robin
0
5
10
15
20
25
30
Jan
Feb
Mar
Apr
May Ju
n
Jul
Aug
Sep
Oct
Nov
Dec
Wimbledon Park standard walk, average count in each m onth
Ave
rage
cou
nt 1
985-
2009 Common resident.
Increased by about 50%.
© Dr D.G. Dawson 2013

Ruddy duck
0.0
1.0
2.0
3.0
4.0
5.0
1985
-86
1988
-89
1991
-92
1994
-95
1997
-98
2000
-01
2003
-04
2006
-07
2009
-10
Wimbledon Park Standard Walk count
Mea
n m
onth
ly c
ount
for
Aug
to
July
yea
rs
Ruddy duck
0.0
0.2
0.4
0.6
0.8
1.0
1.2
1.4
1.6
1.8
2.0
Jan
Feb
Mar
Apr
May Ju
n
Jul
Aug
Sep
Oct
Nov
Dec
Wim bledon Park standard walk, average count in each m onth
Ave
rage
cou
nt 1
985-
2009 Increased in the early 00s.
Peak numbers in spring to breed.National cull means none seen in the last three years.
© Dr D.G. Dawson 2013

Shoveller
0
2
4
6
8
10
12
1985
-86
1988
-89
1991
-92
1994
-95
1997
-98
2000
-01
2003
-04
2006
-07
2009
-10
Wimbledon Park Standard Walk count
Mea
n m
onth
ly c
ount
for
Aug
to
July
yea
rs
Shoveller
0.0
2.0
4.0
6.0
8.0
10.0
12.0
Jan
Feb
Mar
Apr
May Jun
Jul
Aug
Sep
Oct
Nov
Dec
Wimbledon Park standard w alk, average count in each month
Ave
rage
cou
nt 1
985-
2009 Winter visitor.
Declined by 85%.
© Dr D.G. Dawson 2013

Song thrush
0
2
4
6
8
10
12
1985
-86
1988
-89
1991
-92
1994
-95
1997
-98
2000
-01
2003
-04
2006
-07
2009
-10
Wimbledon Park Standard Walk count
Mea
n m
onth
ly c
ount
for
Aug
to
July
yea
rs
Song thrush
0.0
1.0
2.0
3.0
4.0
5.0
6.0
7.0
Jan
Feb
Mar
Apr
May Jun
Jul
Aug
Sep
Oct
Nov
Dec
Wimbledon Park standard w alk, average count in each month
Ave
rage
cou
nt 1
985-
2009 Resident.
Declined by 85%.
© Dr D.G. Dawson 2013

Starling
0
20
40
60
80
100
1985
-86
1988
-89
1991
-92
1994
-95
1997
-98
2000
-01
2003
-04
2006
-07
2009
-10
Wimbledon Park Standard Walk count
Mea
n m
onth
ly c
ount
for
Aug
to
July
yea
rs
Starling
0
10
20
30
40
50
60
70
80
Jan
Feb
Mar
Apr
May Jun Jul
Aug
Sep
Oct
Nov
Dec
Wimbledon Park standard walk, average count in each m onth
Ave
rage
cou
nt 1
985-
2009 Resident.
Declined by 90%.
© Dr D.G. Dawson 2013

Swift
0
5
10
15
20
1985
-86
1988
-89
1991
-92
1994
-95
1997
-98
2000
-01
2003
-04
2006
-07
2009
-10
Wimbledon Park Standard Walk count
Mea
n m
onth
ly c
ount
for
Aug
to
July
yea
rs
Swift
0
2
4
6
8
10
12
14
16
Jan
Feb
Mar
Apr
May Jun
Jul
Aug
Sep
Oct
Nov
Dec
Wimbledon Park standard w alk, average count in each month
Ave
rage
cou
nt 1
985-
2009 London resident.
Comes to feed on insects over the lake.Increased about twofold
© Dr D.G. Dawson 2013

Tufted duck
0
5
10
15
20
25
30
1985
-86
1988
-89
1991
-92
1994
-95
1997
-98
2000
-01
2003
-04
2006
-07
2009
-10
Wimbledon Park Standard Walk count
Mea
n m
onth
ly c
ount
for
Aug
to
July
yea
rs
Tufted duck
0
5
10
15
20
25
30
35
Jan
Feb
Mar
Apr
May Jun
Jul
Aug
Sep
Oct
Nov
Dec
Wimbledon Park standard walk, average count in each month
Ave
rage
cou
nt 1
985-
2009 Resident.
Increased to a plateau.Overall change about sevenfold.
© Dr D.G. Dawson 2013

Woodpigeon
0102030405060708090
1985
-86
1988
-89
1991
-92
1994
-95
1997
-98
2000
-01
2003
-04
2006
-07
2009
-10
Wimbledon Park Standard Walk count
Mea
n m
onth
ly c
ount
for
Aug
to
July
yea
rs
Woodpigeon
0
10
20
30
40
50
60
70
Jan
Feb
Mar
Apr
May Ju
n
Jul
Aug
Sep
Oct
Nov
Dec
Wimbledon Park standard walk, average count in each m onth
Ave
rage
cou
nt 1
985-
2009 Resident.
Increased then decreased.Little overall change.
© Dr D.G. Dawson 2013

Wren
0
5
10
15
20
1985
-86
1988
-89
1991
-92
1994
-95
1997
-98
2000
-01
2003
-04
2006
-07
2009
-10
Wimbledon Park Standard Walk count
Mea
n m
onth
ly c
ount
for
Aug
to
July
yea
rs
Wren
0
2
4
6
8
10
12
14
16
18
20
Jan
Feb
Mar
Apr
May Ju
n
Jul
Aug
Sep
Oct
Nov
Dec
Wim bledon Park standard walk, average count in each m onth
Ave
rage
cou
nt 1
985-
2009 Common resident.
Increased then decreased.Little overall change.
© Dr D.G. Dawson 2013

The route of about 2.8 km was walked once a month in the morning, on average starting 08:35 ending 10:35.

The small print
• The birds were counted in a standard walk, usually once a month, beginning in August 1985 and continuing today. The data for a few missed months were “imputed” statistically.
• The Standard Walk is a method for monitoring changes in common bird populations over time. It involves recording the numbers of all species encountered on a fixed route while walking.
• The standardisation ensures that counts are comparable across years, so that trends may be investigated.• There is a strong seasonal pattern in the counts of most species shown in the blue bar charts. For some
conspicuous species this reflects closely the actual pattern of numbers in the park. Examples of this are the Black-headed Gull and Mallard. For others it more reflects seasonal changes in detectability. Examples of this are the Dunnock and Wren for which counts increase at a time that breeding or immigration are unlikely, implying a change in detectability. For by far the majority of species the counts were clearly influenced by detectability, making it difficult to determine the seasonal changes in actual numbers.
• Long-term trends in numbers are indicated by the graphs of average count for each species. These assume that detectabilty has not differed between years. We expect that errors from this source would be small in comparison to the trend over time, especially as there were counts from all months each year.
• Each species has a summary sentence describing its status at Wimbledon Park and the long-term trend in numbers. Trends were examined by fitting quadratic regression equations to log transformed counts and testing for statistical significance.
• For more details of the methods employed to count the birds and analyse the results, see the report on Wimbledon Common using the same methods (Dawson, D.G. “Wimbledon Common Bird Monitoring, changes in the numbers of common birds over the last fourteen years“ 2009).
• Many of the trends at Wimbledon Park are similar to those documented by the national monitoring scheme, the “Breeding Bird Survey”, which began in 1994, but we have an extra ten years’ information from the Park and have documented many more species than the national scheme has in London.
• As the study continues, and it is planned to publish the results elsewhere, this presentation should be considered to be a summary of work in progress, not a final considered product.
© Dr D.G. Dawson 2013