Embed Size (px)
Citation preview

Wideband 20 GHz RF Digitizer and Python-based Open Application Framework for Test and
Measurement
Nikhil Adnani, Tim Hember, Tarek Helaly, Mohammad Farhan, Ian Ward ThinkRF Corp.
http://www.thinkrf.com Ottawa, Canada
Abstract—The measurement and analysis of modern wireless
signals is a complex task requiring wideband signal analyzers that can operate over large frequency ranges. In addition they should meet other stringent specifications such as those for dynamic range and noise figure. These signal analyzers are expensive and similar, less expensive analyzers lack the functionality and specifications to meet the requirements for testing modern waveforms. To address this challenge a small, cost-effective wideband RF digitizer that spans the frequency range 100 kHz to 20 GHz with an instantaneous bandwidth of 100 MHz has been built using novel techniques. Developers can design their own signal analysis applications for this hardware platform using a free, easy to use Python-based open source application framework. The combination of the RF digitizer and application framework comprises a cost-effective signal analysis solution for the test and measurement of modern waveforms.
Keywords—RF Test and Instrumentation; Wireless Receiver and Digitizer; Python; Vector Signal Analyzer; Spectrum Analyzer.
I. INTRODUCTION Wireless device manufacturers are challenged with the test and measurement of ever-evolving complex signals while at the same time having to contend with shrinking test equipment budgets. Modern wireless signals for instance can have bandwidths up to 80 MHz [1] and can vary in operating frequency and amplitude over time. Affordable spectrum analyzers typically have narrow (up to 10 MHz) instantaneous bandwidth (IBW). Accordingly, analyzing a time-varying, wideband signal that is greater than 10 MHz in bandwidth with such narrowband instrumentation necessitates a ‘sweep’ over several frequency bands, which would therefore yield erroneous measurement results. The measurement of such sophisticated waveforms requires wideband vector or real-time signal analyzers that can cost as much as $50,000 to $100,000 each, depending on frequency range and IBW. Additionally these wireless devices and their associated signals have to be tested in the field and/or real-world operating environments. It is however difficult to field-deploy these legacy analyzers on account of factors such as size, weight and power consumption.
This paper introduces the WSA5000 and PyRF - a novel cost-effective, integrated, open application development framework for automating the acquisition, measurement and processing of RF signals in a variety of operating environments. The WSA5000 is a small (9.5” x 6.5” x 1.2”) RF digitizer that includes a radio receiver front-end, a wideband digitizer, real-time processing hardware and a network interface. It operates from 100 kHz to 20 GHz and has a wide IBW of 100 MHz. PyRF is an open source application development framework implemented in the Python programming language and currently used in conjunction with the WSA5000 to enable a wide range of applications including spectrum analysis, signal demodulation and a variety of waveform measurements. The WSA5000 can be used in automated test equipment (ATE) setups for measurements of signal strength, bandwidth, intermodulation distortion, and other parameters. Additionally it can be used to analyze complex modulated waveforms such as Wi-Fi and LTE in a variety of operating environments. The combination of an RF digitizer and application software that enables the processing and visualization of raw digitized data is referred to as a signal analyzer. Products such as real-time and vector signal analyzers bundle this capability into a single unit of test equipment. A different, modular approach to signal analysis provides RF digitizer hardware within a Peripheral Component Interconnect (PCI) or PCI eXtensions for Instrumentation (PXI) form factor. This hardware interfaces with processing software residing on the host PC. Since the software can be modified to suit any measurement, the latter approach offers greater flexibility. The WSA5000 has taken a similar approach to software-defined instrumentation with one major difference – the RF digitizer resides in a stand-alone, small enclosure. This form-factor provides the ability to easily integrate it within a number of different test and measurement applications. For instance it can be embedded within a specialized test module designed to perform third-order intercept point (IP3) measurements. Alternatively it can also be interfaced with PXI or PCI-based

wideband digitizers to enable measurements and record data over even wider bandwidths - greater than 100 MHz. This paper first discusses key considerations to be taken into account for the design of general-purpose signal analyzers. It briefly explains the three main radio receiver front-end architectures. The paper then describes the architecture of the WSA5000 which is a reconfigurable software-defined radio receiver. This reconfigurability enables its use in a wide variety of test and measurement applications in both production environments and out in the field. This paper also describes the software architecture of the platform. The Python-based open application development framework PyRF is described and its applications illustrated with a brief example. The source code for PyRF is released under a flexible open-source BSD license [2, 3] that allows users to customize the source code and additionally commercialize their final applications. Along with implementation examples, the source code is made available at: http://www.pyrf.org.
I. KEY CONSIDERATIONS FOR THE DESIGN OF GENERAL- PURPOSE SIGNAL ANALYZERS
This section provides an overview of key considerations and related specifications for the design of general-purpose spectrum or signal analysis hardware.
A. Frequency range A large percentage of commercial waveforms are limited to 6 GHz and therefore this is a reasonable upper limit for most wireless test and measurement applications. There is however a number of applications such as microwave backhaul systems operating at higher frequencies. Therefore providing a means to extend the frequency range of the signal analyzer would be an important consideration.
B. Instantaneous bandwidth The bandwidths of commercial wireless systems have been increasing steadily to accommodate the increasing demand for larger data rates from a growing user base. For instance, devices on the market today that use the new 802.11ac standard utilize waveforms that occupy up to 80 MHz in bandwidth. Furthermore, the Third Generation Partnership Project (3GPP) introduced its Long Term Evolution (LTE) – Release 10, namely LTE-Advanced, which outsteps the bandwidth requirements for fourth generation (4G) mobile systems as it aims to utilize bandwidths of up to 100 MHz [4, 5]. The instantaneous bandwidth for an analyzer therefore should be at least 100 MHz if not higher to account for the bandwidth requirements of upcoming standards.
C. Acquisition memory and trigger capability Modern waveforms such as those associated with the wireless LAN standards utilize packet-based signaling techniques. It would therefore be essential to allow for enough memory to enable real-time capture of multiple data packets. As well, both time and Fast Fourier Transform (FFT) based trigger
capabilities to initiate the capture of relevant data would be useful.
D. Scan speed In production it is often required to test an RF product at multiple different frequencies. The speed at which such tests can be conducted is an important consideration. While a wide IBW is important in this regard, the scan or sweep speed of an analyzer is also an important parameter. This speed determines how fast the analyzer can jump from analyzing one set of frequencies separated at most by the IBW to another set.
E. Dynamic range The dynamic range of a spectrum analyzer depends on a number of factors including the resolution of the analog-to-digital converter (ADC). ADCs with sampling rates in excess of 100 MS/s required for wideband signal processing typically have dynamic ranges between 70-80 dB. This is consistent with an effective 12-16 bits of resolution. However RF measurements for characterizing IP3 generally require a dynamic range of around 100 dB. A means for enabling both wideband measurements as well as high-sensitivity RF measurements is therefore desirable.
F. Interfaces While USB remains one of the most ubiquitous and simple to implement interfaces, its main application is to enable a point-to-point link. Fast Ethernet connectivity is more desirable as it enables network connectivity, which is important in ATE setups that need to be controlled remotely, in addition to alternatively supporting a point-to-point link.
G. Size, weight and power In order that the signal analyzer be field-deployable, easy to integrate within larger setups and suitable for portability in applications such as drive testing, it is important that its dimensions be small. Typical lab spectrum analyzers weigh around 50 pounds and consume about 500W of power thereby making them unsuitable for field applications. To be consistent with the size and power specifications of a typical business laptop, a field-deployable analyzer should weigh less than 5 pounds and consume less than 50 W.
H. Cost Finally the ever-increasing demand for low-cost mobile devices is driving the need for efficiencies in the costs of production. This necessitates lowering the costs of test equipment in several stages of the research, development and production cycle. Alternatives to signal analyzers that cost in excess of $50,000 are therefore highly desirable.

II. RECEIVER ARCHITECTURES This section provides an overview of three main receiver
front-end architectures that are used in modern signal or spectrum analysis hardware.
A. SuperHeterodyne Receivers In super-heterodyne receivers, the incoming RF signal is
translated down to a lower intermediate frequency (IF) where it is filtered and subsequently digitized. A pre-select filter bank placed right after the RF input is used to reject strong out-of-band signals that can interfere with the signal of interest. This is followed by a low noise amplifier (LNA) to reduce the overall noise figure of the receiver. Right after are filters to reject images prior to mixing the signal with a local oscillator (LO) down to the first IF. A surface acoustic wave (SAW) filter is typically used to filter the IF output from the mixer. The signal is translated down once again to a final lower IF.
The filtered IF signal is subsequently digitized by an ADC and data is transferred to a field programmable gate array (FPGA) and subsequently to a computer for further processing. Digital signal processing (DSP) on the digitized data is done either in the FPGA and/or on the host computer.
This basic architecture can be extended to include multiple LNAs and mixing stages to achieve desired system specifications. For instance a requirement for low receiver noise figure might require multiple cascaded LNAs.
B. Homodyne Receivers In homodyne or direct-conversion receivers, the frequency
of the LO is the same as that of the incoming RF signal. As a result, unlike the super-heterodyne architecture, the signal is mixed down to an IF of zero. This architecture has several advantages over the super-heterodyne scheme.
1. There is no requirement for image or SAW filters in homodyne receivers.
2. The ADC sampling rate required to process a fixed bandwidth needs to be at least twice as high for the super-heterodyne scheme relative to the homodyne scheme. Post-digitization signal processing circuitry therefore needs to operate at higher speeds in super-heterodyne systems.
For the aforementioned reasons, direct-conversion receivers are less expensive. Such receiver architectures have gained in popularity and are commonly used in consumer wireless devices, for instance those operating in the 2.4 GHz industrial, scientific and medical (ISM) band.
The use of such receivers in instrumentation has been limited on account of two main drawbacks:
Figure 1: Receiver architectures

1. DC offsets: The input signal is mixed with an LO set to the same frequency and there is always some LO signal that couples to the RF port. This spurious LO signal mixes with itself to result in unwanted signal content at DC. This DC content can mask weaker signals present at the center of the RF band being processed by the receiver.
2. In-phase and quadrature offsets: The in-phase and quadrature (I/Q) signals at the output of the receiver are never perfectly matched in amplitude and never exactly 90o out of phase. This offset creates signal artifacts in the output spectrum.
There are various techniques to compensate for such offsets that have been documented in open literature [6-8]. In general it is harder to compensate for such offsets over the large frequency ranges that are required for general-purpose instrumentation applications. It is easier to do this over a limited frequency range of operation where the offsets can be characterized and various pilot-based or calibration techniques can be developed and applied.
C. Direct Digitization Receivers Direct digitization of the RF input signal yields the simplest
and most ideal front-end architecture for software-defined radio systems. A wideband ADC processes RF signals that can vary in frequency up to about half of its sampling rate. All subsequent processing is done either in the FPGA and/or in software. Such ADCs required to process multiple GHz of input signals instantaneously however are quite expensive and their power consumption as well as that of associated circuitry can be high.
Direct Digitization architectures have found applications in software-defined HF and VHF receivers.
III. ARCHITECTURE OF THE WSA FAMILY OF RECEIVERS This section provides some background on architectural considerations, available technologies and signal processing requirements. Our first generation receivers were limited to cellular or ISM bands only and intended for band-specific applications. With the second generation WSA4000 we addressed the problem of monitoring up to 10 GHz of the radio spectrum. The WSA5000 which represents the third and present generation product extends the capabilities of the WSA4000 to monitor up to 20 GHz of the radio spectrum in addition to providing other enhancements for test and measurement applications. This section explains various system considerations in the development of our receiver platforms.
Our goal with the WSA family of receivers has been to build a common platform that could be used for a variety of signal processing applications in different operating environments such as in the lab or out in the field. The primary design goals were to achieve the following key specifications at an affordable price point.
1. Large operating frequency range: this requirement was primarily driven by the objective to design a general purpose instrument for the analysis of most commercial wireless signals.
2. Wide instantaneous bandwidth of at least 100 MHz: this requirement was defined in order to: 1) facilitate the monitoring, detection and analysis of all signals in the popular cellular and ISM bands, 2) enable fast sweep rates for greater measurement speeds.
A. Architectural considerations for the WSA4000 Our second generation receiver, the WSA4000 was based on the direct-conversion radio architecture as it enabled us to achieve the aforementioned design goals of wideband signal
Figure 2: Architecture of the WSA4000

processing over a large frequency range at a compelling price-performance ratio.
In designing the WSA4000, which was based on a homodyne receiver architecture, we had to overcome the constraints of direct-conversion technology such as I/Q and DC offsets. I/Q offset correction was done in software while the DC offset was corrected partially in hardware.
Other technological issues needed resolution as well. Referring to Figure 2, the I/Q mixer (also known as a quadrature demodulator) typically restricts the operating frequency range of the receiver as it is difficult to maintain a reasonable level of I/Q phase mismatch over large frequency ranges. Overcoming this limitation to process signals outside of those limited frequency ranges required a frequency conversion stage prior to the I/Q mixer to shift the frequency of the incoming RF signal to within the limits of the I/Q mixer. As a result, the WSA4000 unlike a conventional homodyne receiver, incorporated two IFs, the first at 1250 MHz and the second at DC. The WSA4000 uses both upconversion and downconversion blocks to operate over the frequency range of 100 kHz to 10 GHz as shown in Figure 2.
The instantaneous bandwidth of the final system was 100 MHz which enabled concurrent processing of the entire 2.4-2.5 GHz ISM band for instance. This receiver architecture enabled vector signal analysis at an attractive price point.
One of the main drawbacks of the direct-conversion architecture for real-time processing tasks such as signal demodulation was the complexity of I/Q and DC offset correction. This processing when done in software introduced latencies in signal processing which in turn impacted the ability to stream and demodulate signals in real-time.
As mentioned earlier, the super-heterodyne architecture produces a non-zero IF at its final stage and therefore does not
have DC or I/Q offsets. As a result it is better suited to real-time signal demodulation. The final IBW using the same component technology (ADC sampling rate) would however be lower than when the direct-conversion architecture is used.
B. Architectural considerations for the WSA5000 With the WSA5000 the goal was to create a versatile signal
analysis platform which could offer the best features of both receiver architectures. More specifically it was designed to retain the wide 100 MHz instantaneous bandwidth with the flexibility to switch into an ‘offset-free’ super-heterodyne mode of operation. Other important enhancements over the previous generation were:
1. Frequency range: The extension of the upper end of the operating frequency range from 10 GHz to 20 GHz was important to keep up with the evolution of new wireless devices that utilize these frequencies.
2. Dynamic range: Enabling a system dynamic range in excess of 100 dB – a key requirement for measuring the IP3 of various semiconductor devices such as LNAs and mixers.
3. Providing the ability to test baseband signals and also to interface with very wideband (> 100 MS/s) digitizers and data recording systems.
4. Spectrum scan rate of 200 GHz/s.
5. Smaller form factor and low power consumption: Fulfilling this requirement was instrumental toward ensuring that the receiver be used within a number of form-factors i.e. in a rack or in a handheld. The dimensions of the WSA5000 are 9.5” x 6.5” x 1.2” and the DC power consumption has been measured to be less than 17 W.
Figure 3: Architecture of the WSA5000
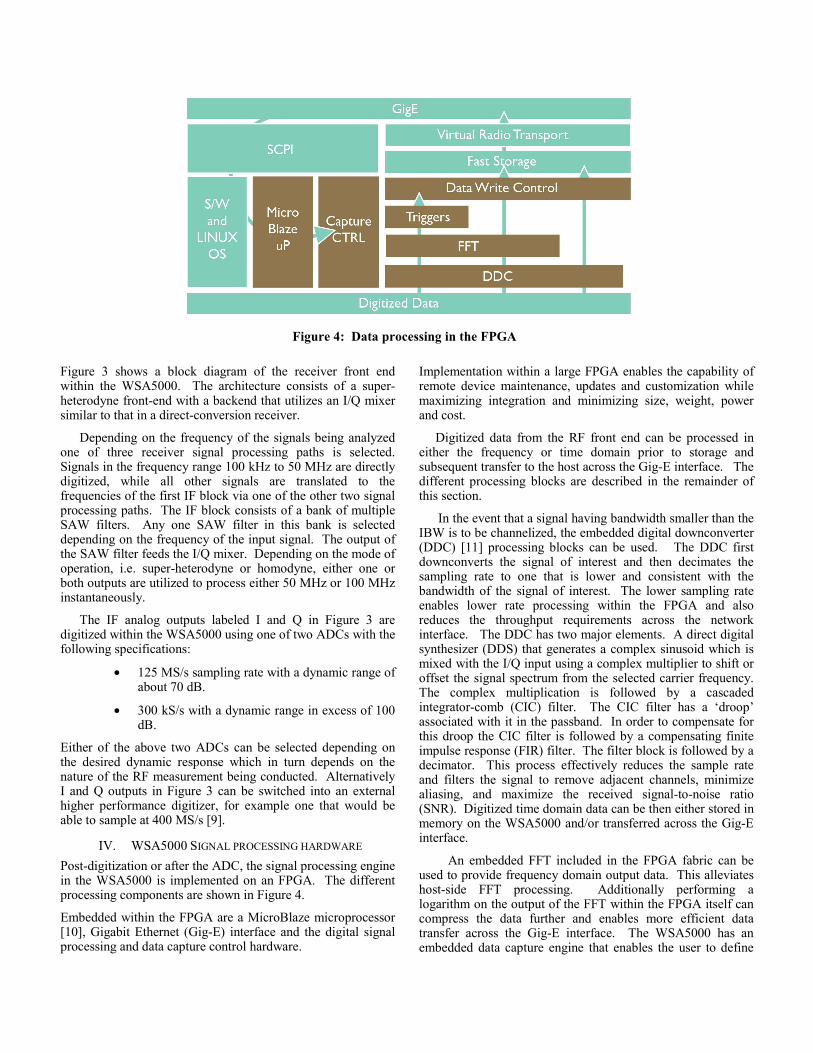
Figure 3 shows a block diagram of the receiver front end within the WSA5000. The architecture consists of a super-heterodyne front-end with a backend that utilizes an I/Q mixer similar to that in a direct-conversion receiver.
Depending on the frequency of the signals being analyzed one of three receiver signal processing paths is selected. Signals in the frequency range 100 kHz to 50 MHz are directly digitized, while all other signals are translated to the frequencies of the first IF block via one of the other two signal processing paths. The IF block consists of a bank of multiple SAW filters. Any one SAW filter in this bank is selected depending on the frequency of the input signal. The output of the SAW filter feeds the I/Q mixer. Depending on the mode of operation, i.e. super-heterodyne or homodyne, either one or both outputs are utilized to process either 50 MHz or 100 MHz instantaneously.
The IF analog outputs labeled I and Q in Figure 3 are digitized within the WSA5000 using one of two ADCs with the following specifications:
• 125 MS/s sampling rate with a dynamic range of about 70 dB.
• 300 kS/s with a dynamic range in excess of 100 dB.
Either of the above two ADCs can be selected depending on the desired dynamic response which in turn depends on the nature of the RF measurement being conducted. Alternatively I and Q outputs in Figure 3 can be switched into an external higher performance digitizer, for example one that would be able to sample at 400 MS/s [9].
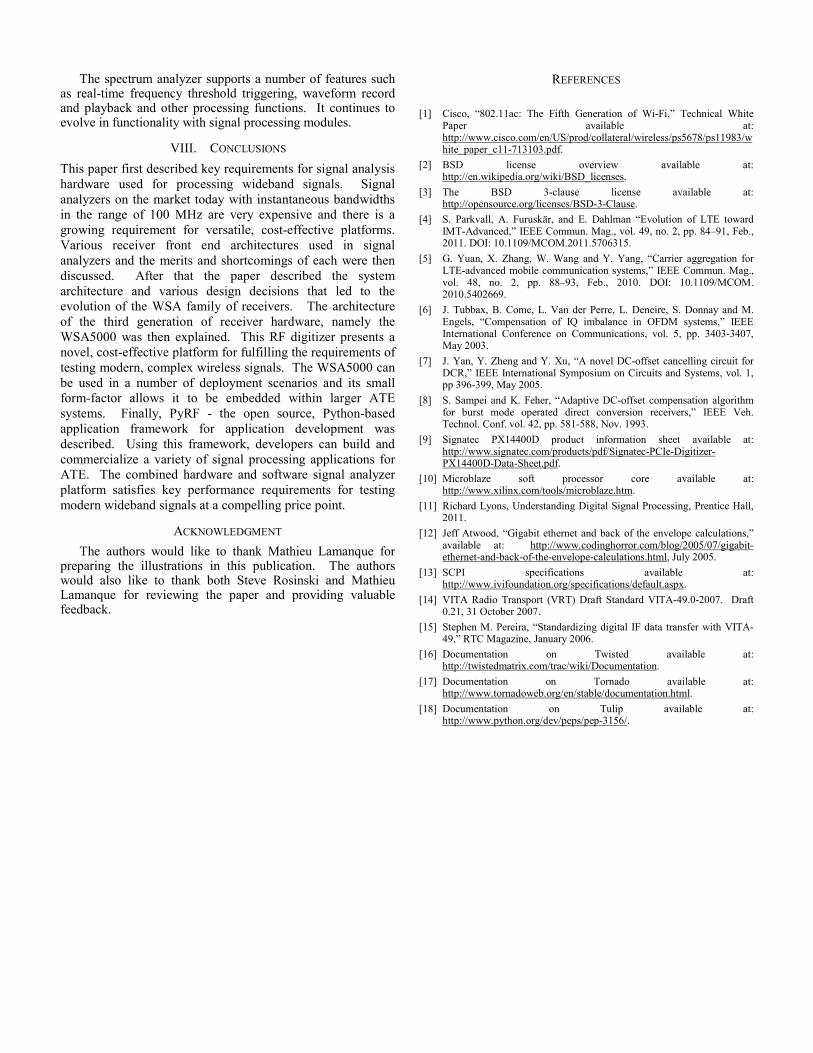
IV. WSA5000 SIGNAL PROCESSING HARDWARE Post-digitization or after the ADC, the signal processing engine in the WSA5000 is implemented on an FPGA. The different processing components are shown in Figure 4.
Embedded within the FPGA are a MicroBlaze microprocessor [10], Gigabit Ethernet (Gig-E) interface and the digital signal processing and data capture control hardware.
Implementation within a large FPGA enables the capability of remote device maintenance, updates and customization while maximizing integration and minimizing size, weight, power and cost.
Digitized data from the RF front end can be processed in either the frequency or time domain prior to storage and subsequent transfer to the host across the Gig-E interface. The different processing blocks are described in the remainder of this section.
In the event that a signal having bandwidth smaller than the IBW is to be channelized, the embedded digital downconverter (DDC) [11] processing blocks can be used. The DDC first downconverts the signal of interest and then decimates the sampling rate to one that is lower and consistent with the bandwidth of the signal of interest. The lower sampling rate enables lower rate processing within the FPGA and also reduces the throughput requirements across the network interface. The DDC has two major elements. A direct digital synthesizer (DDS) that generates a complex sinusoid which is mixed with the I/Q input using a complex multiplier to shift or offset the signal spectrum from the selected carrier frequency. The complex multiplication is followed by a cascaded integrator-comb (CIC) filter. The CIC filter has a ‘droop’ associated with it in the passband. In order to compensate for this droop the CIC filter is followed by a compensating finite impulse response (FIR) filter. The filter block is followed by a decimator. This process effectively reduces the sample rate and filters the signal to remove adjacent channels, minimize aliasing, and maximize the received signal-to-noise ratio (SNR). Digitized time domain data can be then either stored in memory on the WSA5000 and/or transferred across the Gig-E interface.
An embedded FFT included in the FPGA fabric can be used to provide frequency domain output data. This alleviates host-side FFT processing. Additionally performing a logarithm on the output of the FFT within the FPGA itself can compress the data further and enables more efficient data transfer across the Gig-E interface. The WSA5000 has an embedded data capture engine that enables the user to define
Figure 4: Data processing in the FPGA

and execute sophisticated triggers, traces and sweeps. A trace and a sweep are defined as a single capture and a series of captures respectively, each with their associated hardware configurations. Traces and sweeps are controlled by the capture controller as illustrated in Figure 4. The capture controller configures the RF front-end, DDC, triggers, time-stamping and data output for traces and sweeps.
Hardware-based triggering provides a means of qualifying the storage of captured time domain I/Q data samples based on external, periodic or frequency domain events, and thereby selecting signals of interest for the purposes of subsequent visualization and/or analysis. The qualification of triggers is performed at the rate of the 125 MS/s clock thereby ensuring that events are reliably captured to within an 8 ns window of uncertainty in the time domain. In the frequency domain, using a resolution bandwidth of 122 kHz, a signal has to persist for at least 8.2 μs for 100% probability of detection.
The WSA5000 has up to 512 MB of fast dedicated data storage. This provides the ability to buffer, store and forward up to one second of contiguous time domain I/Q data sampled at 125 MS/s. Lower or decimated sampling rates consistent with signals having narrower bandwidth enable longer time duration signal recordings.
High-speed TCP/IP data connectivity is provided over the Gig-E interface. Network connectivity enables remote operation of the WSA5000 in a test rack or over a simple point-to-point link. The Gig-E link has a maximum theoretical throughput of 1000 Mb/s, although practical throughputs have been reported to be limited to 600 Mb/s [12]. The sampling rate within the WSA5000 is 125 MS/s where each sample is comprised of 32 bits. It is impossible to sustain this throughput rate of 125*32=4000 Mb/s over a Gig-E link without data loss.
Depending on the application, there are four different techniques, any combination or all of which can be used to alleviate this throughput bottleneck.
1. DDC: as explained decimation can be used to reduce the effective sampling rate to stream a narrower band of signal content.
2. Hardware triggering in either the time or frequency domain can be used to store relevant portions of the digitized data which then results in a lower throughput requirement.
3. Capturing blocks of data asynchronously for signal measurement applications that do not have a time-varying aspect to them.
4. Using a digitizer external to the WSA5000 that has a faster interface such as PCI Express (PCIe) into the host processor.
The WSA5000 has an embedded Linux OS and embedded application to enable remote control and management of the WSA5000. A webserver console is accessible via both a local USB console port and remotely over the TCP/IP Ethernet interface. The webserver console provides remote management, updates and customization whereby new versions
of the entire FPGA and embedded software system can be remotely uploaded and installed to the WSA5000.
V. WSA5000 EXTERNAL PORTS The WSA5000 provides a general-purpose input/output
(GPIO) port for both trigger sources and hardware expansion to exterior modules such as antenna switches, downconverters, GPS and power-over-Ethernet (POE) sources.
For the purposes of synchronization, a 10 MHz input is provided. A 10 MHz output is also provided from the WSA5000 to enable multi-unit synchronization. The benefit in providing the latter is that the user does not have to create or source external clock distribution circuits or devices.
As shown in Figure 3, the front end includes one RF input to process signals between 100 kHz and 20 GHz. Two identical baseband inputs labeled Iin and Qin are also provided for processing and testing the complex baseband signal output from a radio transmitter. Finally, I and Q output ports are included that can be used to mate the RF front end with an external, high speed digitizer.
VI. SOFTWARE This section describes the host-side software architecture
that interfaces with the WSA5000.
A. Control and communication Communication protocols for the purposes of control and
acquiring data from the WSA5000 across the network interface were designed to conform to widely adopted standards. Compliance with standard protocols is critical to the end-user because it provides both device independence and interoperability. One such standard is Standard Commands for Programmable Instruments (SCPI) [13] – a language that has been adopted by most test and measurement equipment vendors for controlling programmable instruments. SCPI commands are ASCII textual strings, which are sent to the instrument over the Gig-E interface. Commands can either 1) Set a parameter - such as the frequency to which the receiver is to tune or 2) Query a parameter – e.g. front end attenuator setting.
Data is returned from the WSA5000 using the VITA-49 Radio Transport (VRT) protocol [14] for digitized data. This is an interconnect standard for transporting digitized data in a link-agnostic format. VITA-49 was primarily intended for communication signal processing applications including beam-forming, direction-finding and signals intelligence (SIGINT). It includes support for streaming data, time-stamping and other similar features [15] to support tasks such as signal demodulation and fast scans. The protocol is therefore ideally suited for use with the WSA5000 hardware.
B. Application software Commercial numerical computing and/or lab equipment
control software packages have traditionally been used to process raw data acquired from hardware instrumentation. One of the benefits in using these packages is the availability of comprehensive signal processing libraries. However, such software packages are very expensive with single-user licenses costing thousands of dollars.

If an application developer were to distribute a standalone executable, then typically more software is required at additional cost. Also from a usability standpoint, the final outcome is not as flexible as an application developed from scratch in a general-purpose programming language such as C.
When deciding on an application development environment for the WSA5000 it was decided to adopt a language that:
• is easy to use and develop with
• has a rich environment of diverse and comprehensive libraries
• is widely used by the scientific community
• is affordable.
The Python programming language was chosen for the application development environment as it satisfied all of the above requirements.
Python is easy to develop with as it is a high-level programming language. Its design philosophy places an emphasis on readability of the code and programmers can exploit its syntax to express concepts more efficiently than would be possible in languages such as C. As well, libraries such as NumPy and matplotlib have made Python easy to learn for users of other numerical computing languages. In general Python has gained widespread acceptance and its adoption within the scientific community continues to increase. Finally, Python is available as open source software.
C. PyRF framework The source code for the Python-based application framework we call PyRF is released under a flexible open-source BSD license [2, 3]. Implementation examples and the source code are made available at: http://www.pyrf.org.
VII. SOFTWARE APPLICATIONS This section explains the application architecture and provides an example to illustrate the use of PyRF with the WSA5000 for purposes of signal processing. Figure 5 shows a block diagram with various components representing the software architecture associated with the host-side processing of data acquired from hardware. Software applications can interface directly with the WSA5000 using SCPI with raw data retrieved in VRT format. Using this technique, control software written for any spectrum analyzer that utilizes SCPI can be ported easily. In this case, connections to the WSA5000 device are made using TCP across the Gig-E interface. Users can write either low-level or high-level Python applications. User applications that need to exploit the full features of the device can use the WSA class. Within this class, commands to control and retrieve data from the device are implemented as Python methods. An example of a low-level application within PyRF is an application that captures a stream of 30 million data samples over a time duration of 250 ms at a center frequency of 1.9 GHz. Alternatively, users can author high-level applications. An example of this would be one that calculates peak power over the frequency range
Figure 5: Software architecture

100 kHz to 20 GHz using a resolution bandwidth of 50 kHz. Details of the sweep are taken care of by the SweepDevice Python class. Additional specialized ‘devices’ can be authored for various applications. One such application is frequency threshold triggering where FFT data is recorded into memory every time the amplitude of any signal across two user-specified frequency limits exceeds an amplitude threshold.
The WSA Python class interfaces with SCPI through a connector. Two device connectors have been authored at the time of writing this paper and users can write their own. PlainSocketConnector is the default connector for the WSA5000 class. The term socket refers to an endpoint of a two-way communication link across a network. This connector provides the simplest form of connectivity to the device and in this case any method calls have to wait for a response from the device before returning to the calling function. In other words no other processing can be performed in the same thread until a response is received.
An asynchronous connector called TwistedConnector has also been written based on the Twisted [16] framework. Using this connector, WSA5000 method calls return deferred objects instead of blocking as is the case in the default connector. New connector classes can be authored by the user to support other asynchronous Python frameworks such as Tornado [17] or Tulip [18].
The following lines of sample Python code are used to determine the strongest signal across a specified frequency range. It’s an example of a high-level Python application that works with SweepDevice.
# connect to a WSA5000 with a static IP address dut = WSA() dut.connect('10.126.110.112') # perform a sweep and collect amplitude data across the frequency range 2.1 - 2.9 GHz with a resolution bandwidth of 100 kHz sweep = SweepDevice(dut) fstart, fstop, bins = ( sweep.capture_power_spectrum(2.1e9, 2.9e9, 100e3)) # show the peak amplitude print max(bins)
Figure 6 shows a sample spectrum analyzer application that has been written using PyRF. This application is available as an open-source code example on the PyRF.org website. Released under the open-source BSD license, users may also customize and/or commercialize the spectrum analyzer application for their own purposes.
Figure 6: Spectrum analyzer application authored in PyRF
The spectrum analyzer supports a number of features such as real-time frequency threshold triggering, waveform record and playback and other processing functions. It continues to evolve in functionality with signal processing modules.
VIII. CONCLUSIONS This paper first described key requirements for signal analysis hardware used for processing wideband signals. Signal analyzers on the market today with instantaneous bandwidths in the range of 100 MHz are very expensive and there is a growing requirement for versatile, cost-effective platforms. Various receiver front end architectures used in signal analyzers and the merits and shortcomings of each were then discussed. After that the paper described the system architecture and various design decisions that led to the evolution of the WSA family of receivers. The architecture of the third generation of receiver hardware, namely the WSA5000 was then explained. This RF digitizer presents a novel, cost-effective platform for fulfilling the requirements of testing modern, complex wireless signals. The WSA5000 can be used in a number of deployment scenarios and its small form-factor allows it to be embedded within larger ATE systems. Finally, PyRF - the open source, Python-based application framework for application development was described. Using this framework, developers can build and commercialize a variety of signal processing applications for ATE. The combined hardware and software signal analyzer platform satisfies key performance requirements for testing modern wideband signals at a compelling price point.
ACKNOWLEDGMENT The authors would like to thank Mathieu Lamanque for
preparing the illustrations in this publication. The authors would also like to thank both Steve Rosinski and Mathieu Lamanque for reviewing the paper and providing valuable feedback.
REFERENCES
[1] Cisco, “802.11ac: The Fifth Generation of Wi-Fi,” Technical White Paper available at: http://www.cisco.com/en/US/prod/collateral/wireless/ps5678/ps11983/white_paper_c11-713103.pdf.
[2] BSD license overview available at: http://en.wikipedia.org/wiki/BSD_licenses.
[3] The BSD 3-clause license available at: http://opensource.org/licenses/BSD-3-Clause.
[4] S. Parkvall, A. Furuskär, and E. Dahlman “Evolution of LTE toward IMT-Advanced,” IEEE Commun. Mag., vol. 49, no. 2, pp. 84–91, Feb., 2011. DOI: 10.1109/MCOM.2011.5706315.
[5] G. Yuan, X. Zhang, W. Wang and Y. Yang, “Carrier aggregation for LTE-advanced mobile communication systems,” IEEE Commun. Mag., vol. 48, no. 2, pp. 88–93, Feb., 2010. DOI: 10.1109/MCOM. 2010.5402669.
[6] J. Tubbax, B. Come, L. Van der Perre, L. Deneire, S. Donnay and M. Engels, “Compensation of IQ imbalance in OFDM systems,” IEEE International Conference on Communications, vol. 5, pp. 3403-3407, May 2003.
[7] J. Yan, Y. Zheng and Y. Xu, “A novel DC-offset cancelling circuit for DCR,” IEEE International Symposium on Circuits and Systems, vol. 1, pp 396-399, May 2005.
[8] S. Sampei and K. Feher, “Adaptive DC-offset compensation algorithm for burst mode operated direct conversion receivers,” IEEE Veh. Technol. Conf. vol. 42, pp. 581-588, Nov. 1993.
[9] Signatec PX14400D product information sheet available at: http://www.signatec.com/products/pdf/Signatec-PCIe-Digitizer-PX14400D-Data-Sheet.pdf.
[10] Microblaze soft processor core available at: http://www.xilinx.com/tools/microblaze.htm.
[11] Richard Lyons, Understanding Digital Signal Processing, Prentice Hall, 2011.
[12] Jeff Atwood, “Gigabit ethernet and back of the envelope calculations,” available at: http://www.codinghorror.com/blog/2005/07/gigabit-ethernet-and-back-of-the-envelope-calculations.html, July 2005.
[13] SCPI specifications available at: http://www.ivifoundation.org/specifications/default.aspx.
[14] VITA Radio Transport (VRT) Draft Standard VITA-49.0-2007. Draft 0.21, 31 October 2007.
[15] Stephen M. Pereira, “Standardizing digital IF data transfer with VITA-49,” RTC Magazine, January 2006.
[16] Documentation on Twisted available at: http://twistedmatrix.com/trac/wiki/Documentation.
[17] Documentation on Tornado available at: http://www.tornadoweb.org/en/stable/documentation.html.
[18] Documentation on Tulip available at: http://www.python.org/dev/peps/pep-3156/.