Embed Size (px)
Citation preview
Sweden A. Definitions and sources of data
Data on stock and flows of foreign direct investment (FDI) in Sweden are compiled by Sverige Riksbank (Central Bank of Sweden). Sverige Riksbank defines FDI -- in line with international recommendations-- as direct or indirect ownership between two companies of at least 10 per cent of the share capital or votes. All financial transactions between such companies are regarded as direct investments. It can take the form of establishment or acquisition of an enterprise as well as subsequent investments.
Data on flows of FDI are since January 2003 based on direct reports of enterprises. Since
1997, FDI flow data also cover short-term loans and trade credits, real estate transactions as well as holding companies. The directional principle is applied. Earlier data had not been revised subsequently and therefore, there is a break in time series. Data with a breakdown by regions and countries and by economic activity are available since 1992. Reinvested earnings which are obtained through the survey on FDI stock data can not be broken down by regions and countries or economic activity. Aggregate flow data and the data with a breakdown by region and country and by economic activity are published quarterly by Sveriges Riksbank (www.riksbank.com).
Stock data (including directly-owned real estate) are collected by Sverige Riksbank
through annual company surveys, and published with a time lag of about a year. In addition, data on private non-business real estate and trade (commercial) credit are included in direct investment. Furthermore, data on trade credits between affiliated enterprises are obtained from Statistics Sweden based on quarterly sample surveys with a three-months time lag. Stock data are published annually, in December, in Sverige Riksbank's report on Direct Investments, Assets and Income (www.riksbank.com).While published stock data represent book values, a valuation method for market values has been developed and included in the International Investment Position (IIP) as a memorandum item.
Data on the inward and outward stock of FDI are available since 1986. Data for outward
stock broken down by region and countries are compiled with distribution on host countries (directly and indirectly). For inward stock, data broken down by region and countries are compiled with the principle of first chain ownership being applied, while data according to the UBO are also available. Classification by economic activity follows the United Nations International Standard Industrial Classification of All Economic Activities (ISIC). Data are reported according to the economic activity of the Swedish affiliate abroad (for outward FDI) and the foreign affiliate in Sweden (inward FDI), respectively. Reinvested earnings are also obtained through enterprise surveys and are calculated as the difference between total profits after tax and dividends. They are assigned to the year in which they were earned, and distributed evenly across the months. Reinvested earnings can not be broken down further, by region and country or economic activity.
Data on the activities of majority-owned foreign affiliates of Swedish transnational corporations (TNCs) and majority-owned foreign affiliates in Sweden are published by the Swedish Institute for Growth Policy Studies (ITPS), in conjunction with Statistics Sweden, while data on TNCs are published by ITPS in conjunction with MM Partner. ITPS emerged when the former Swedish National Board for Industrial and Technical Development (NUTEK) was
Posting date: 19 September 2005
transformed in the Swedish Business Development Agency, as of January 2001. ITPS deals with policy analysis, growth studies and various areas of Government statistics. It is the responsible government authority for official statistics on international business. The surveys include foreign-owned enterprises in Sweden, Swedish TNCs and the structure of the total business sector according to the degree of internationalisation. Survey results are published on the ITPS website (www.itps.se). Data are available with a breakdown by economic activity and by region and country (the latter, classified according to the UBO).
UNCTAD WID Country Profile: SWEDEN Page 2 of 54
B. Statistics on FDI and the operations of TNCs
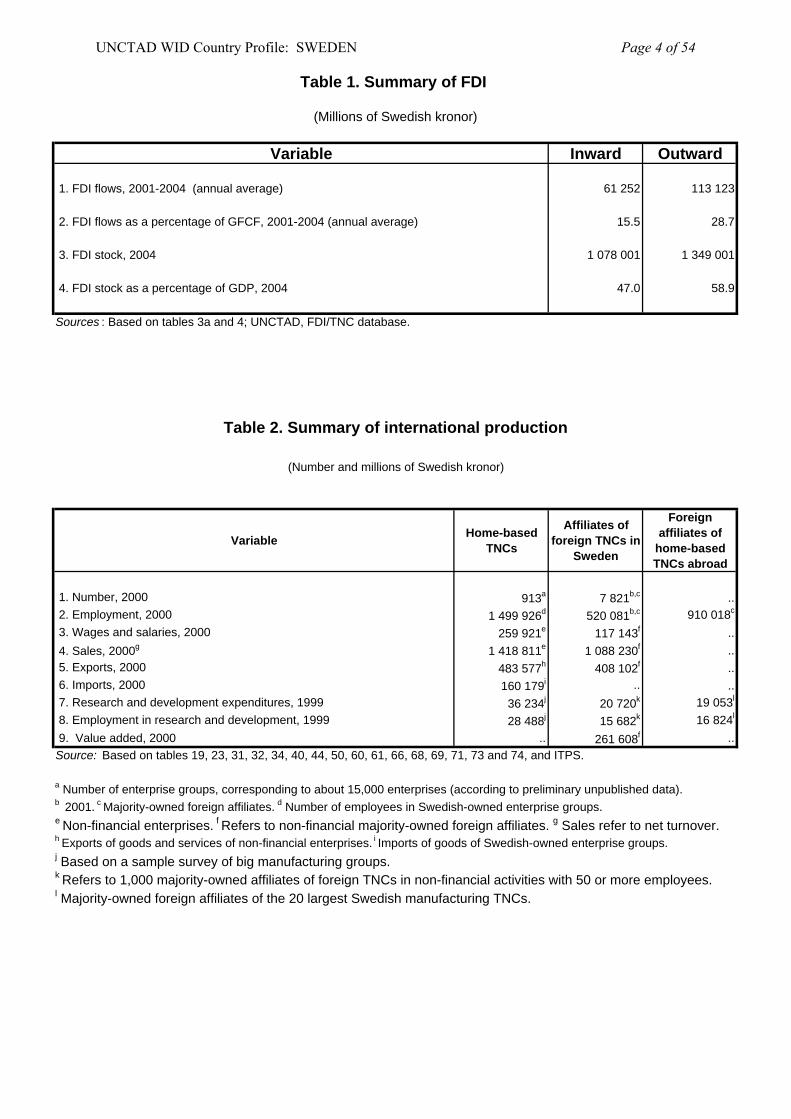
Table 1. Summary of FDI
Variable Inward Outward
1. FDI flows, 2001-2004 (annual average) 61 252 113 123
2. FDI flows as a percentage of GFCF, 2001-2004 (annual average) 15.5 28.7
3. FDI stock, 2004 1 078 001 1 349 001
4. FDI stock as a percentage of GDP, 2004 47.0 58.9
Sources : Based on tables 3a and 4; UNCTAD, FDI/TNC database.
Table 2. Summary of international production
(Number and millions of Swedish kronor)
Variable Home-based TNCs
Affiliates of foreign TNCs in
Sweden
Foreign affiliates of
home-based TNCs abroad
1. Number, 2000 913a 7 821b,c .. 2. Employment, 2000 1 499 926d 520 081b,c 910 018c
3. Wages and salaries, 2000 259 921e 117 143f .. 4. Sales, 2000g 1 418 811e 1 088 230f .. 5. Exports, 2000 483 577h 408 102f .. 6. Imports, 2000 160 179i .. .. 7. Research and development expenditures, 1999 36 234j 20 720k 19 053l
8. Employment in research and development, 1999 28 488j 15 682k 16 824l
9. Value added, 2000 .. 261 608f ..Source: Based on tables 19, 23, 31, 32, 34, 40, 44, 50, 60, 61, 66, 68, 69, 71, 73 and 74, and ITPS.
a Number of enterprise groups, corresponding to about 15,000 enterprises (according to preliminary unpublished data).b 2001. c Majority-owned foreign affiliates. d Number of employees in Swedish-owned enterprise groups.
h Exports of goods and services of non-financial enterprises. i Imports of goods of Swedish-owned enterprise groups.
k Refers to 1,000 majority-owned affiliates of foreign TNCs in non-financial activities with 50 or more employees.l Majority-owned foreign affiliates of the 20 largest Swedish manufacturing TNCs.
(Millions of Swedish kronor)
e Non-financial enterprises. f Refers to non-financial majority-owned foreign affiliates. g Sales refer to net turnover.
j Based on a sample survey of big manufacturing groups.
UNCTAD WID Country Profile: SWEDEN Page 4 of 54
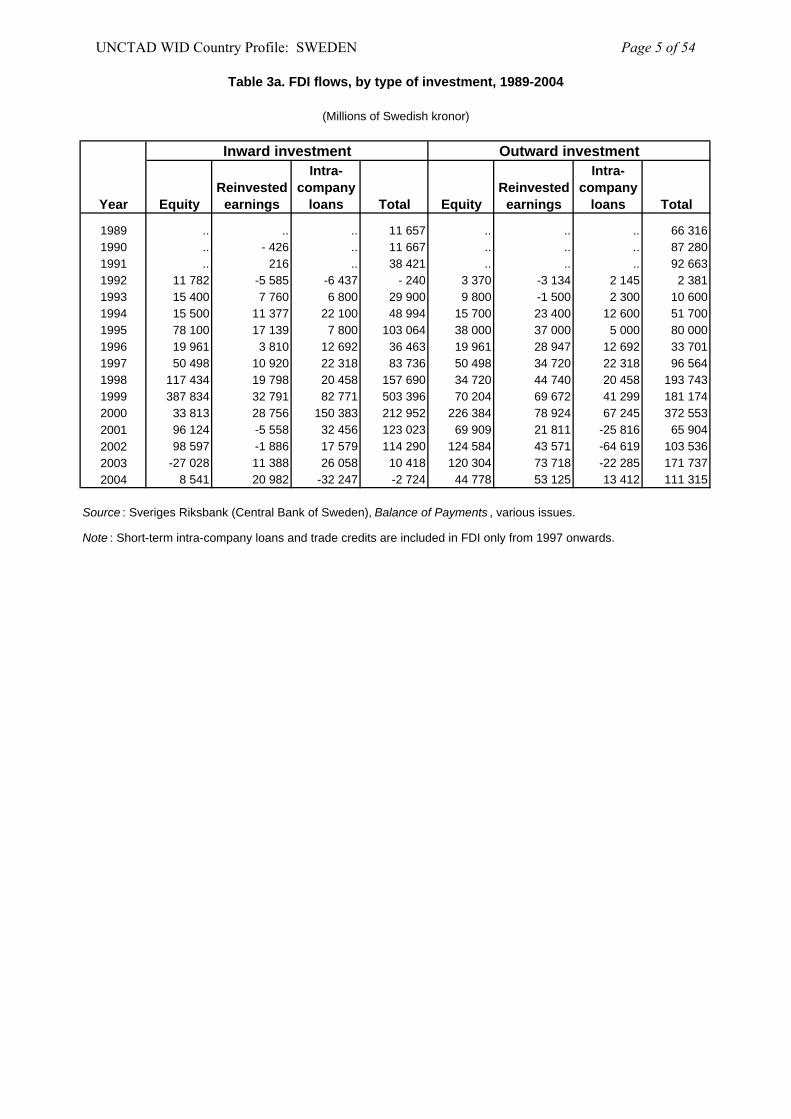
Table 3a. FDI flows, by type of investment, 1989-2004
(Millions of Swedish kronor)
Inward investment Outward investment
Year EquityReinvested
earnings
Intra-company
loans Total EquityReinvested
earnings
Intra-company
loans Total
1989 .. .. .. 11 657 .. .. .. 66 3161990 .. - 426 .. 11 667 .. .. .. 87 2801991 .. 216 .. 38 421 .. .. .. 92 6631992 11 782 -5 585 -6 437 - 240 3 370 -3 134 2 145 2 3811993 15 400 7 760 6 800 29 900 9 800 -1 500 2 300 10 6001994 15 500 11 377 22 100 48 994 15 700 23 400 12 600 51 7001995 78 100 17 139 7 800 103 064 38 000 37 000 5 000 80 0001996 19 961 3 810 12 692 36 463 19 961 28 947 12 692 33 7011997 50 498 10 920 22 318 83 736 50 498 34 720 22 318 96 5641998 117 434 19 798 20 458 157 690 34 720 44 740 20 458 193 7431999 387 834 32 791 82 771 503 396 70 204 69 672 41 299 181 1742000 33 813 28 756 150 383 212 952 226 384 78 924 67 245 372 5532001 96 124 -5 558 32 456 123 023 69 909 21 811 -25 816 65 9042002 98 597 -1 886 17 579 114 290 124 584 43 571 -64 619 103 5362003 -27 028 11 388 26 058 10 418 120 304 73 718 -22 285 171 7372004 8 541 20 982 -32 247 -2 724 44 778 53 125 13 412 111 315
Source : Sveriges Riksbank (Central Bank of Sweden), Balance of Payments , various issues.
Note : Short-term intra-company loans and trade credits are included in FDI only from 1997 onwards.
UNCTAD WID Country Profile: SWEDEN Page 5 of 54
Year
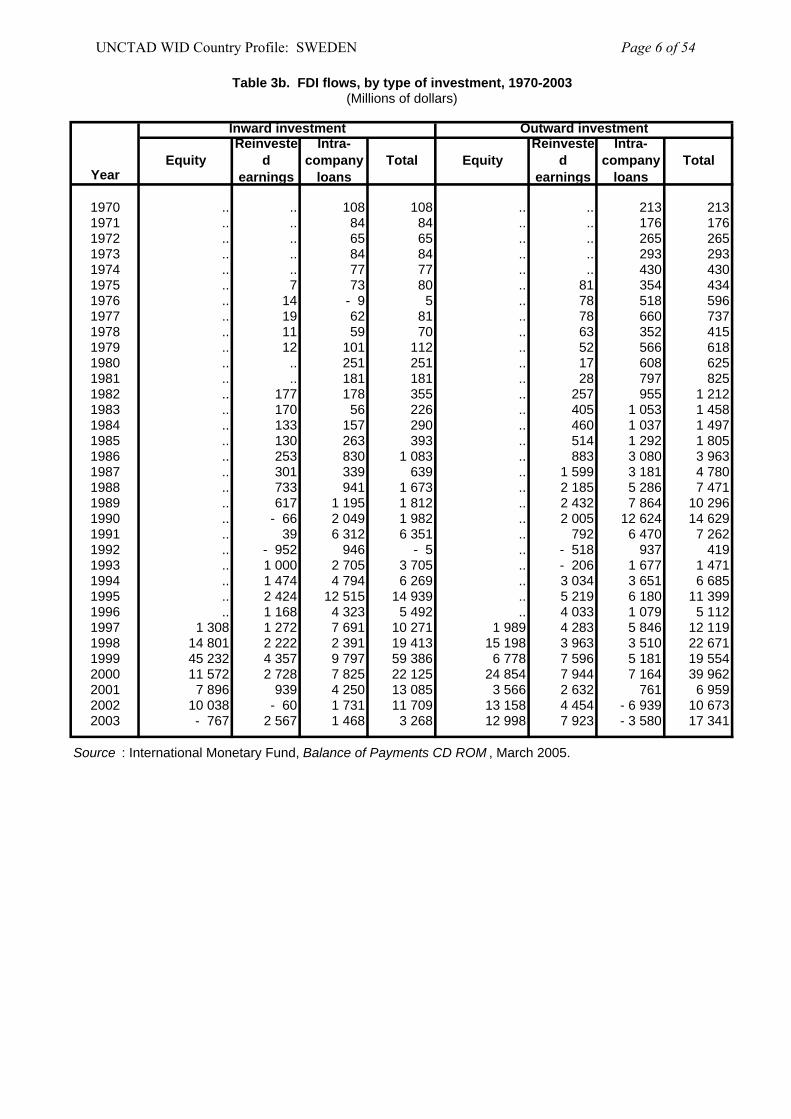
1970 .. .. 108 108 .. .. 213 2131971 .. .. 84 84 .. .. 176 1761972 .. .. 65 65 .. .. 265 2651973 .. .. 84 84 .. .. 293 2931974 .. .. 77 77 .. .. 430 4301975 .. 7 73 80 .. 81 354 4341976 .. 14 - 9 5 .. 78 518 5961977 .. 19 62 81 .. 78 660 7371978 .. 11 59 70 .. 63 352 4151979 .. 12 101 112 .. 52 566 6181980 .. .. 251 251 .. 17 608 6251981 .. .. 181 181 .. 28 797 8251982 .. 177 178 355 .. 257 955 1 2121983 .. 170 56 226 .. 405 1 053 1 4581984 .. 133 157 290 .. 460 1 037 1 4971985 .. 130 263 393 .. 514 1 292 1 8051986 .. 253 830 1 083 .. 883 3 080 3 9631987 .. 301 339 639 .. 1 599 3 181 4 7801988 .. 733 941 1 673 .. 2 185 5 286 7 4711989 .. 617 1 195 1 812 .. 2 432 7 864 10 2961990 .. - 66 2 049 1 982 .. 2 005 12 624 14 6291991 .. 39 6 312 6 351 .. 792 6 470 7 2621992 .. - 952 946 - 5 .. - 518 937 4191993 .. 1 000 2 705 3 705 .. - 206 1 677 1 4711994 .. 1 474 4 794 6 269 .. 3 034 3 651 6 6851995 .. 2 424 12 515 14 939 .. 5 219 6 180 11 3991996 .. 1 168 4 323 5 492 .. 4 033 1 079 5 1121997 1 308 1 272 7 691 10 271 1 989 4 283 5 846 12 1191998 14 801 2 222 2 391 19 413 15 198 3 963 3 510 22 6711999 45 232 4 357 9 797 59 386 6 778 7 596 5 181 19 5542000 11 572 2 728 7 825 22 125 24 854 7 944 7 164 39 9622001 7 896 939 4 250 13 085 3 566 2 632 761 6 9592002 10 038 - 60 1 731 11 709 13 158 4 454 - 6 939 10 6732003 - 767 2 567 1 468 3 268 12 998 7 923 - 3 580 17 341
Source : International Monetary Fund, Balance of Payments CD ROM , March 2005.
EquityReinveste
d earnings
Intra-company
loansTotalEquity
Reinvested
earnings
Intra-company
loansTotal
Table 3b. FDI flows, by type of investment, 1970-2003(Millions of dollars)
Inward investment Outward investment
UNCTAD WID Country Profile: SWEDEN Page 6 of 54
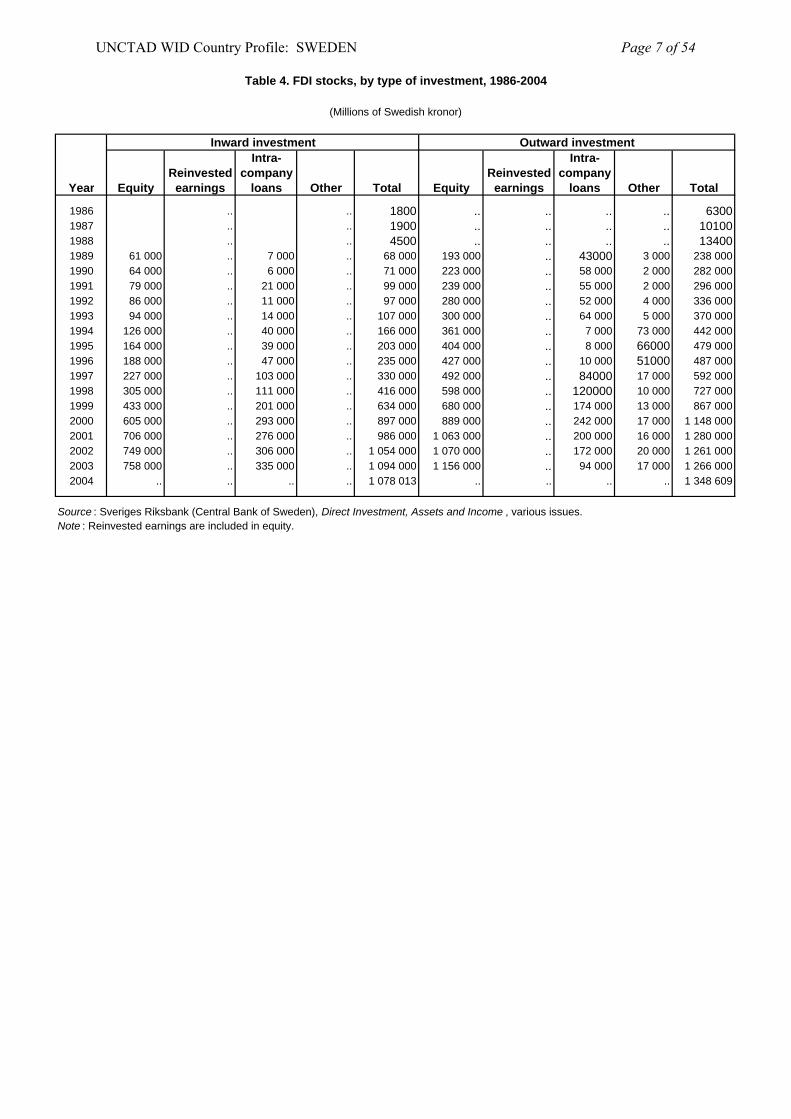
Table 4. FDI stocks, by type of investment, 1986-2004
(Millions of Swedish kronor)
Inward investment Outward investmentIntra- Intra-
Reinvested company Reinvested companyYear Equity earnings loans Other Total Equity earnings loans Other Total
1986 .. .. 1800 .. .. .. .. 63001987 .. .. 1900 .. .. .. .. 101001988 .. .. 4500 .. .. .. .. 134001989 61 000 .. 7 000 .. 68 000 193 000 .. 43000 3 000 238 0001990 64 000 .. 6 000 .. 71 000 223 000 .. 58 000 2 000 282 0001991 79 000 .. 21 000 .. 99 000 239 000 .. 55 000 2 000 296 0001992 86 000 .. 11 000 .. 97 000 280 000 .. 52 000 4 000 336 0001993 94 000 .. 14 000 .. 107 000 300 000 .. 64 000 5 000 370 0001994 126 000 .. 40 000 .. 166 000 361 000 .. 7 000 73 000 442 0001995 164 000 .. 39 000 .. 203 000 404 000 .. 8 000 66000 479 0001996 188 000 .. 47 000 .. 235 000 427 000 .. 10 000 51000 487 0001997 227 000 .. 103 000 .. 330 000 492 000 .. 84000 17 000 592 0001998 305 000 .. 111 000 .. 416 000 598 000 .. 120000 10 000 727 0001999 433 000 .. 201 000 .. 634 000 680 000 .. 174 000 13 000 867 0002000 605 000 .. 293 000 .. 897 000 889 000 .. 242 000 17 000 1 148 0002001 706 000 .. 276 000 .. 986 000 1 063 000 .. 200 000 16 000 1 280 0002002 749 000 .. 306 000 .. 1 054 000 1 070 000 .. 172 000 20 000 1 261 0002003 758 000 .. 335 000 .. 1 094 000 1 156 000 .. 94 000 17 000 1 266 0002004 .. .. .. .. 1 078 013 .. .. .. .. 1 348 609
Source : Sveriges Riksbank (Central Bank of Sweden), Direct Investment, Assets and Income , various issues.Note : Reinvested earnings are included in equity.
UNCTAD WID Country Profile: SWEDEN Page 7 of 54
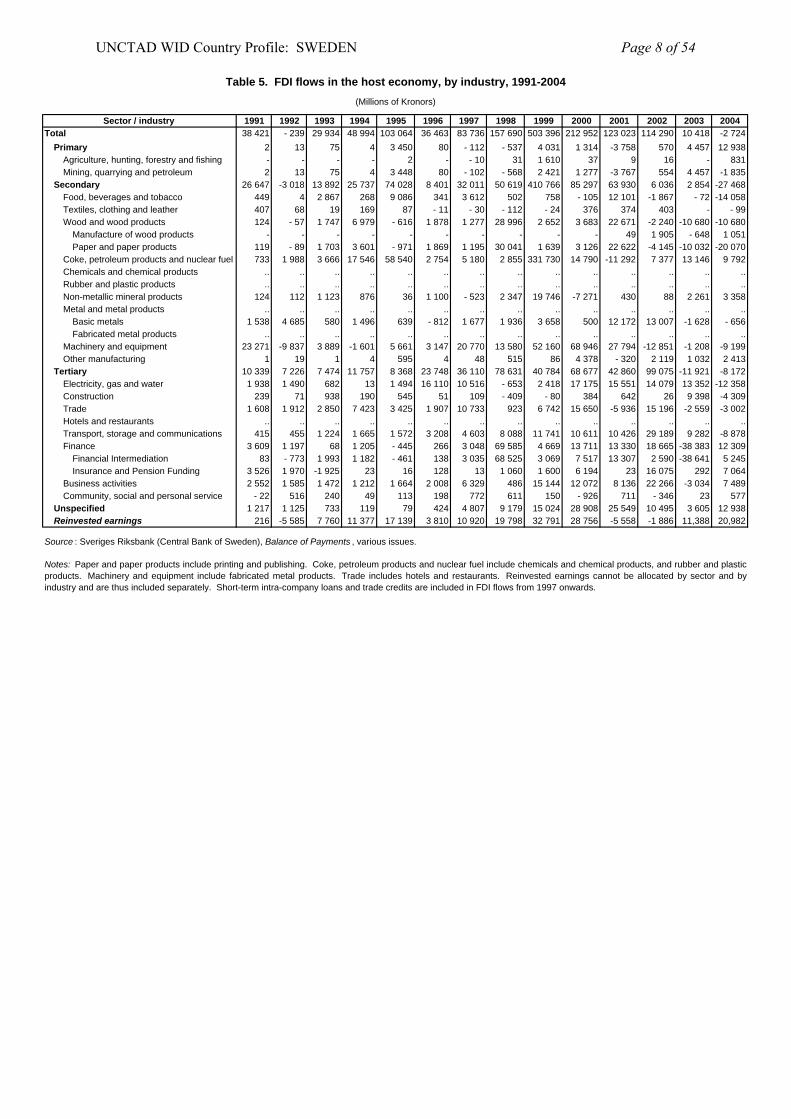
Table 5. FDI flows in the host economy, by industry, 1991-2004(Millions of Kronors)
Sector / industry 1991 1992 1993 1994 1995 1996 1997 1998 1999 2000 2001 2002 2003 2004Total 38 421 - 239 29 934 48 994 103 064 36 463 83 736 157 690 503 396 212 952 123 023 114 290 10 418 -2 724
Primary 2 13 75 4 3 450 80 - 112 - 537 4 031 1 314 -3 758 570 4 457 12 938Agriculture, hunting, forestry and fishing - - - - 2 - - 10 31 1 610 37 9 16 - 831Mining, quarrying and petroleum 2 13 75 4 3 448 80 - 102 - 568 2 421 1 277 -3 767 554 4 457 -1 835
Secondary 26 647 -3 018 13 892 25 737 74 028 8 401 32 011 50 619 410 766 85 297 63 930 6 036 2 854 -27 468Food, beverages and tobacco 449 4 2 867 268 9 086 341 3 612 502 758 - 105 12 101 -1 867 - 72 -14 058Textiles, clothing and leather 407 68 19 169 87 - 11 - 30 - 112 - 24 376 374 403 - - 99Wood and wood products 124 - 57 1 747 6 979 - 616 1 878 1 277 28 996 2 652 3 683 22 671 -2 240 -10 680 -10 680
Manufacture of wood products - - - - - - - - - - 49 1 905 - 648 1 051Paper and paper products 119 - 89 1 703 3 601 - 971 1 869 1 195 30 041 1 639 3 126 22 622 -4 145 -10 032 -20 070
Coke, petroleum products and nuclear fuel 733 1 988 3 666 17 546 58 540 2 754 5 180 2 855 331 730 14 790 -11 292 7 377 13 146 9 792Chemicals and chemical products .. .. .. .. .. .. .. .. .. .. .. .. .. ..Rubber and plastic products .. .. .. .. .. .. .. .. .. .. .. .. .. ..Non-metallic mineral products 124 112 1 123 876 36 1 100 - 523 2 347 19 746 -7 271 430 88 2 261 3 358Metal and metal products .. .. .. .. .. .. .. .. .. .. .. .. .. ..
Basic metals 1 538 4 685 580 1 496 639 - 812 1 677 1 936 3 658 500 12 172 13 007 -1 628 - 656Fabricated metal products .. .. .. .. .. .. .. .. .. .. .. .. .. ..
Machinery and equipment 23 271 -9 837 3 889 -1 601 5 661 3 147 20 770 13 580 52 160 68 946 27 794 -12 851 -1 208 -9 199Other manufacturing 1 19 1 4 595 4 48 515 86 4 378 - 320 2 119 1 032 2 413
Tertiary 10 339 7 226 7 474 11 757 8 368 23 748 36 110 78 631 40 784 68 677 42 860 99 075 -11 921 -8 172Electricity, gas and water 1 938 1 490 682 13 1 494 16 110 10 516 - 653 2 418 17 175 15 551 14 079 13 352 -12 358Construction 239 71 938 190 545 51 109 - 409 - 80 384 642 26 9 398 -4 309Trade 1 608 1 912 2 850 7 423 3 425 1 907 10 733 923 6 742 15 650 -5 936 15 196 -2 559 -3 002Hotels and restaurants .. .. .. .. .. .. .. .. .. .. .. .. .. ..Transport, storage and communications 415 455 1 224 1 665 1 572 3 208 4 603 8 088 11 741 10 611 10 426 29 189 9 282 -8 878Finance 3 609 1 197 68 1 205 - 445 266 3 048 69 585 4 669 13 711 13 330 18 665 -38 383 12 309
Financial Intermediation 83 - 773 1 993 1 182 - 461 138 3 035 68 525 3 069 7 517 13 307 2 590 -38 641 5 245Insurance and Pension Funding 3 526 1 970 -1 925 23 16 128 13 1 060 1 600 6 194 23 16 075 292 7 064
Business activities 2 552 1 585 1 472 1 212 1 664 2 008 6 329 486 15 144 12 072 8 136 22 266 -3 034 7 489Community, social and personal service - 22 516 240 49 113 198 772 611 150 - 926 711 - 346 23 577
Unspecified 1 217 1 125 733 119 79 424 4 807 9 179 15 024 28 908 25 549 10 495 3 605 12 938Reinvested earnings 216 -5 585 7 760 11 377 17 139 3 810 10 920 19 798 32 791 28 756 -5 558 -1 886 11,388 20,982
Source : Sveriges Riksbank (Central Bank of Sweden), Balance of Payments , various issues.
Notes: Paper and paper products include printing and publishing. Coke, petroleum products and nuclear fuel include chemicals and chemical products, and rubber and plasticproducts. Machinery and equipment include fabricated metal products. Trade includes hotels and restaurants. Reinvested earnings cannot be allocated by sector and byindustry and are thus included separately. Short-term intra-company loans and trade credits are included in FDI flows from 1997 onwards.
UNCTAD WID Country Profile: SWEDEN Page 8 of 54
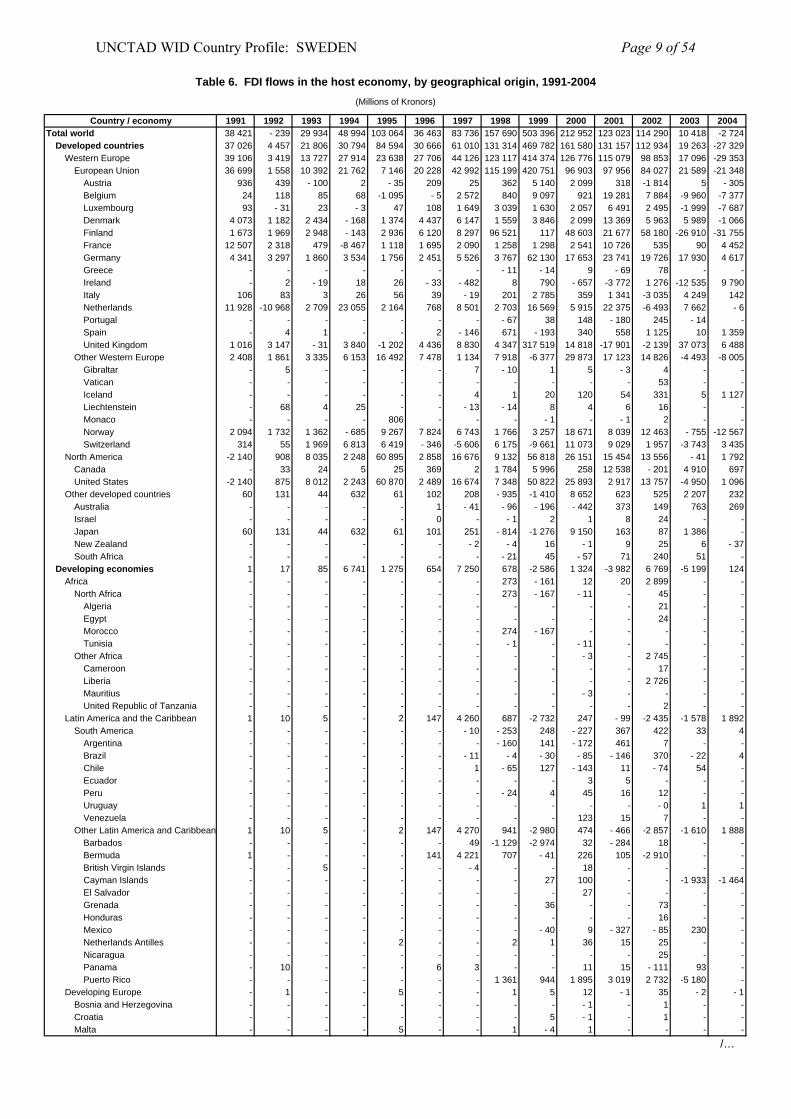
Table 6. FDI flows in the host economy, by geographical origin, 1991-2004(Millions of Kronors)
Country / economy 1991 1992 1993 1994 1995 1996 1997 1998 1999 2000 2001 2002 2003 2004Total world 38 421 - 239 29 934 48 994 103 064 36 463 83 736 157 690 503 396 212 952 123 023 114 290 10 418 -2 724
Developed countries 37 026 4 457 21 806 30 794 84 594 30 666 61 010 131 314 469 782 161 580 131 157 112 934 19 263 -27 329Western Europe 39 106 3 419 13 727 27 914 23 638 27 706 44 126 123 117 414 374 126 776 115 079 98 853 17 096 -29 353
European Union 36 699 1 558 10 392 21 762 7 146 20 228 42 992 115 199 420 751 96 903 97 956 84 027 21 589 -21 348Austria 936 439 - 100 2 - 35 209 25 362 5 140 2 099 318 -1 814 5 - 305Belgium 24 118 85 68 -1 095 - 5 2 572 840 9 097 921 19 281 7 884 -9 960 -7 377Luxembourg 93 - 31 23 - 3 47 108 1 649 3 039 1 630 2 057 6 491 2 495 -1 999 -7 687Denmark 4 073 1 182 2 434 - 168 1 374 4 437 6 147 1 559 3 846 2 099 13 369 5 963 5 989 -1 066Finland 1 673 1 969 2 948 - 143 2 936 6 120 8 297 96 521 117 48 603 21 677 58 180 -26 910 -31 755France 12 507 2 318 479 -8 467 1 118 1 695 2 090 1 258 1 298 2 541 10 726 535 90 4 452Germany 4 341 3 297 1 860 3 534 1 756 2 451 5 526 3 767 62 130 17 653 23 741 19 726 17 930 4 617Greece - - - - - - - - 11 - 14 9 - 69 78 - -Ireland - 2 - 19 18 26 - 33 - 482 8 790 - 657 -3 772 1 276 -12 535 9 790Italy 106 83 3 26 56 39 - 19 201 2 785 359 1 341 -3 035 4 249 142Netherlands 11 928 -10 968 2 709 23 055 2 164 768 8 501 2 703 16 569 5 915 22 375 -6 493 7 662 - 6Portugal - - - - - - - - 67 38 148 - 180 245 - 14 -Spain - 4 1 - - 2 - 146 671 - 193 340 558 1 125 10 1 359United Kingdom 1 016 3 147 - 31 3 840 -1 202 4 436 8 830 4 347 317 519 14 818 -17 901 -2 139 37 073 6 488
Other Western Europe 2 408 1 861 3 335 6 153 16 492 7 478 1 134 7 918 -6 377 29 873 17 123 14 826 -4 493 -8 005Gibraltar - 5 - - - - 7 - 10 1 5 - 3 4 - -Vatican - - - - - - - - - - - 53 - -Iceland - - - - - - 4 1 20 120 54 331 5 1 127Liechtenstein - 68 4 25 - - - 13 - 14 8 4 6 16 - -Monaco - - - - 806 - - - - 1 - - 1 2 - -Norway 2 094 1 732 1 362 - 685 9 267 7 824 6 743 1 766 3 257 18 671 8 039 12 463 - 755 -12 567Switzerland 314 55 1 969 6 813 6 419 - 346 -5 606 6 175 -9 661 11 073 9 029 1 957 -3 743 3 435
North America -2 140 908 8 035 2 248 60 895 2 858 16 676 9 132 56 818 26 151 15 454 13 556 - 41 1 792Canada - 33 24 5 25 369 2 1 784 5 996 258 12 538 - 201 4 910 697United States -2 140 875 8 012 2 243 60 870 2 489 16 674 7 348 50 822 25 893 2 917 13 757 -4 950 1 096
Other developed countries 60 131 44 632 61 102 208 - 935 -1 410 8 652 623 525 2 207 232Australia - - - - - 1 - 41 - 96 - 196 - 442 373 149 763 269Israel - - - - - 0 - - 1 2 1 8 24 - -Japan 60 131 44 632 61 101 251 - 814 -1 276 9 150 163 87 1 386 -New Zealand - - - - - - - 2 - 4 16 - 1 9 25 6 - 37South Africa - - - - - - - - 21 45 - 57 71 240 51 -
Developing economies 1 17 85 6 741 1 275 654 7 250 678 -2 586 1 324 -3 982 6 769 -5 199 124Africa - - - - - - - 273 - 161 12 20 2 899 - -
North Africa - - - - - - - 273 - 167 - 11 - 45 - -Algeria - - - - - - - - - - - 21 - -Egypt - - - - - - - - - - - 24 - -Morocco - - - - - - - 274 - 167 - - - - -Tunisia - - - - - - - - 1 - - 11 - - - -
Other Africa - - - - - - - - - - 3 - 2 745 - -Cameroon - - - - - - - - - - - 17 - -Liberia - - - - - - - - - - - 2 726 - -Mauritius - - - - - - - - - - 3 - - - -United Republic of Tanzania - - - - - - - - - - - 2 - -
Latin America and the Caribbean 1 10 5 - 2 147 4 260 687 -2 732 247 - 99 -2 435 -1 578 1 892South America - - - - - - - 10 - 253 248 - 227 367 422 33 4
Argentina - - - - - - - - 160 141 - 172 461 7 - -Brazil - - - - - - - 11 - 4 - 30 - 85 - 146 370 - 22 4Chile - - - - - - 1 - 65 127 - 143 11 - 74 54 -Ecuador - - - - - - - - - 3 5 - - -Peru - - - - - - - - 24 4 45 16 12 - -Uruguay - - - - - - - - - - - - 0 1 1Venezuela - - - - - - - - - 123 15 7 - -
Other Latin America and Caribbean 1 10 5 - 2 147 4 270 941 -2 980 474 - 466 -2 857 -1 610 1 888Barbados - - - - - - 49 -1 129 -2 974 32 - 284 18 - -Bermuda 1 - - - - 141 4 221 707 - 41 226 105 -2 910 - -British Virgin Islands - - 5 - - - - 4 - - 18 - - - -Cayman Islands - - - - - - - - 27 100 - - -1 933 -1 464El Salvador - - - - - - - - - 27 - - - -Grenada - - - - - - - - 36 - - 73 - -Honduras - - - - - - - - - - - 16 - -Mexico - - - - - - - - - 40 9 - 327 - 85 230 -Netherlands Antilles - - - - 2 - - 2 1 36 15 25 - -Nicaragua - - - - - - - - - - - 25 - -Panama - 10 - - - 6 3 - - 11 15 - 111 93 -Puerto Rico - - - - - - - 1 361 944 1 895 3 019 2 732 -5 180 -
Developing Europe - 1 - - 5 - - 1 5 12 - 1 35 - 2 - 1Bosnia and Herzegovina - - - - - - - - - - 1 - 1 - -Croatia - - - - - - - - 5 - 1 - 1 - -Malta - - - - 5 - - 1 - 4 1 - - - -
/…
UNCTAD WID Country Profile: SWEDEN Page 9 of 54
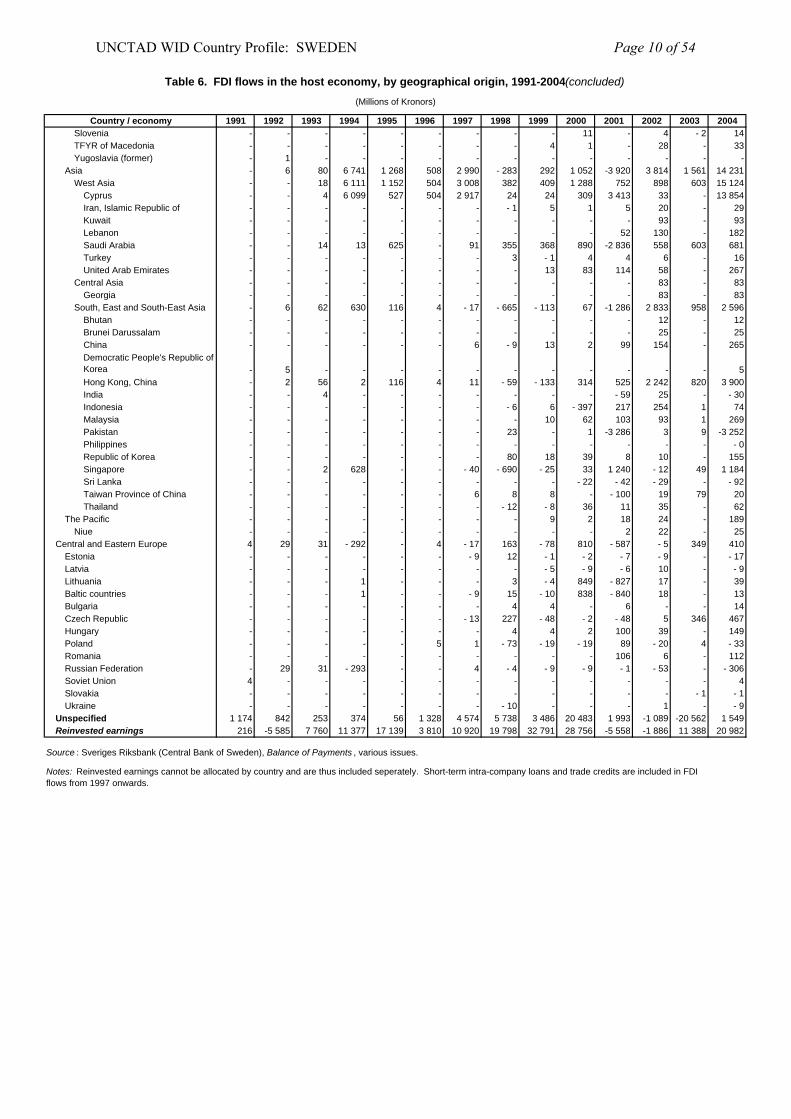
Table 6. FDI flows in the host economy, by geographical origin, 1991-2004(concluded)
(Millions of Kronors)
Country / economy 1991 1992 1993 1994 1995 1996 1997 1998 1999 2000 2001 2002 2003 2004Slovenia - - - - - - - - - 11 - 4 - 2 14TFYR of Macedonia - - - - - - - - 4 1 - 28 - 33Yugoslavia (former) - 1 - - - - - - - - - - - -
Asia - 6 80 6 741 1 268 508 2 990 - 283 292 1 052 -3 920 3 814 1 561 14 231West Asia - - 18 6 111 1 152 504 3 008 382 409 1 288 752 898 603 15 124
Cyprus - - 4 6 099 527 504 2 917 24 24 309 3 413 33 - 13 854Iran, Islamic Republic of - - - - - - - - 1 5 1 5 20 - 29Kuwait - - - - - - - - - - - 93 - 93Lebanon - - - - - - - - - - 52 130 - 182Saudi Arabia - - 14 13 625 - 91 355 368 890 -2 836 558 603 681Turkey - - - - - - - 3 - 1 4 4 6 - 16United Arab Emirates - - - - - - - - 13 83 114 58 - 267
Central Asia - - - - - - - - - - - 83 - 83Georgia - - - - - - - - - - - 83 - 83
South, East and South-East Asia - 6 62 630 116 4 - 17 - 665 - 113 67 -1 286 2 833 958 2 596Bhutan - - - - - - - - - - - 12 - 12Brunei Darussalam - - - - - - - - - - - 25 - 25China - - - - - - 6 - 9 13 2 99 154 - 265Democratic People's Republic of Korea - 5 - - - - - - - - - - - 5Hong Kong, China - 2 56 2 116 4 11 - 59 - 133 314 525 2 242 820 3 900India - - 4 - - - - - - - - 59 25 - - 30Indonesia - - - - - - - - 6 6 - 397 217 254 1 74Malaysia - - - - - - - - 10 62 103 93 1 269Pakistan - - - - - - - 23 - 1 -3 286 3 9 -3 252Philippines - - - - - - - - - - - - - - 0Republic of Korea - - - - - - - 80 18 39 8 10 - 155Singapore - - 2 628 - - - 40 - 690 - 25 33 1 240 - 12 49 1 184Sri Lanka - - - - - - - - - - 22 - 42 - 29 - - 92Taiwan Province of China - - - - - - 6 8 8 - - 100 19 79 20Thailand - - - - - - - - 12 - 8 36 11 35 - 62
The Pacific - - - - - - - - 9 2 18 24 - 189Niue - - - - - - - - - - 2 22 - 25
Central and Eastern Europe 4 29 31 - 292 - 4 - 17 163 - 78 810 - 587 - 5 349 410Estonia - - - - - - - 9 12 - 1 - 2 - 7 - 9 - - 17Latvia - - - - - - - - - 5 - 9 - 6 10 - - 9Lithuania - - - 1 - - - 3 - 4 849 - 827 17 - 39Baltic countries - - - 1 - - - 9 15 - 10 838 - 840 18 - 13Bulgaria - - - - - - - 4 4 - 6 - - 14Czech Republic - - - - - - - 13 227 - 48 - 2 - 48 5 346 467Hungary - - - - - - - 4 4 2 100 39 - 149Poland - - - - - 5 1 - 73 - 19 - 19 89 - 20 4 - 33Romania - - - - - - - - - - 106 6 - 112Russian Federation - 29 31 - 293 - - 4 - 4 - 9 - 9 - 1 - 53 - - 306Soviet Union 4 - - - - - - - - - - - - 4Slovakia - - - - - - - - - - - - - 1 - 1Ukraine - - - - - - - - 10 - - - 1 - - 9
Unspecified 1 174 842 253 374 56 1 328 4 574 5 738 3 486 20 483 1 993 -1 089 -20 562 1 549Reinvested earnings 216 -5 585 7 760 11 377 17 139 3 810 10 920 19 798 32 791 28 756 -5 558 -1 886 11 388 20 982
Source : Sveriges Riksbank (Central Bank of Sweden), Balance of Payments , various issues.
Notes: Reinvested earnings cannot be allocated by country and are thus included seperately. Short-term intra-company loans and trade credits are included in FDI flows from 1997 onwards.
UNCTAD WID Country Profile: SWEDEN Page 10 of 54
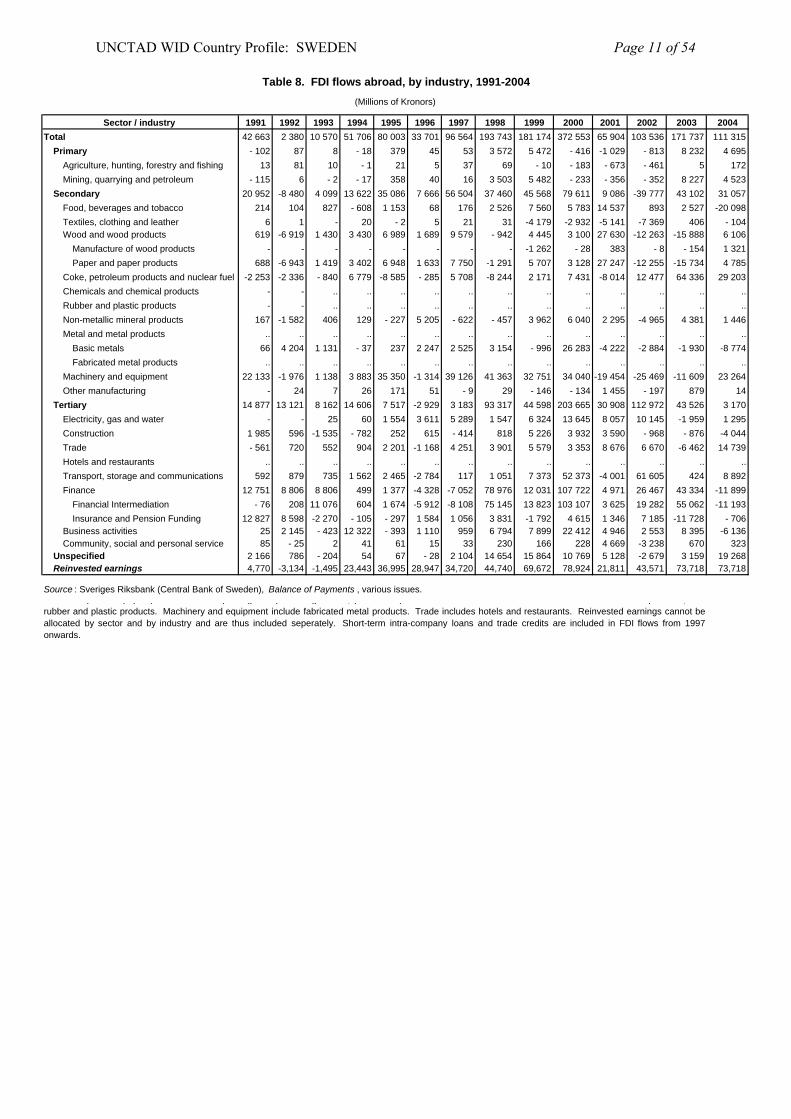
Table 8. FDI flows abroad, by industry, 1991-2004(Millions of Kronors)
Sector / industry 1991 1992 1993 1994 1995 1996 1997 1998 1999 2000 2001 2002 2003 2004Total 42 663 2 380 10 570 51 706 80 003 33 701 96 564 193 743 181 174 372 553 65 904 103 536 171 737 111 315
Primary - 102 87 8 - 18 379 45 53 3 572 5 472 - 416 -1 029 - 813 8 232 4 695Agriculture, hunting, forestry and fishing 13 81 10 - 1 21 5 37 69 - 10 - 183 - 673 - 461 5 172Mining, quarrying and petroleum - 115 6 - 2 - 17 358 40 16 3 503 5 482 - 233 - 356 - 352 8 227 4 523
Secondary 20 952 -8 480 4 099 13 622 35 086 7 666 56 504 37 460 45 568 79 611 9 086 -39 777 43 102 31 057Food, beverages and tobacco 214 104 827 - 608 1 153 68 176 2 526 7 560 5 783 14 537 893 2 527 -20 098Textiles, clothing and leather 6 1 - 20 - 2 5 21 31 -4 179 -2 932 -5 141 -7 369 406 - 104Wood and wood products 619 -6 919 1 430 3 430 6 989 1 689 9 579 - 942 4 445 3 100 27 630 -12 263 -15 888 6 106
Manufacture of wood products - - - - - - - - -1 262 - 28 383 - 8 - 154 1 321Paper and paper products 688 -6 943 1 419 3 402 6 948 1 633 7 750 -1 291 5 707 3 128 27 247 -12 255 -15 734 4 785
Coke, petroleum products and nuclear fuel -2 253 -2 336 - 840 6 779 -8 585 - 285 5 708 -8 244 2 171 7 431 -8 014 12 477 64 336 29 203Chemicals and chemical products - - .. .. .. .. .. .. .. .. .. .. .. ..Rubber and plastic products - - .. .. .. .. .. .. .. .. .. .. .. ..Non-metallic mineral products 167 -1 582 406 129 - 227 5 205 - 622 - 457 3 962 6 040 2 295 -4 965 4 381 1 446Metal and metal products .. .. .. .. .. .. .. .. .. .. .. .. .. ..
Basic metals 66 4 204 1 131 - 37 237 2 247 2 525 3 154 - 996 26 283 -4 222 -2 884 -1 930 -8 774Fabricated metal products .. .. .. .. .. .. .. .. .. .. .. .. .. ..
Machinery and equipment 22 133 -1 976 1 138 3 883 35 350 -1 314 39 126 41 363 32 751 34 040 -19 454 -25 469 -11 609 23 264Other manufacturing - 24 7 26 171 51 - 9 29 - 146 - 134 1 455 - 197 879 14
Tertiary 14 877 13 121 8 162 14 606 7 517 -2 929 3 183 93 317 44 598 203 665 30 908 112 972 43 526 3 170Electricity, gas and water - - 25 60 1 554 3 611 5 289 1 547 6 324 13 645 8 057 10 145 -1 959 1 295Construction 1 985 596 -1 535 - 782 252 615 - 414 818 5 226 3 932 3 590 - 968 - 876 -4 044Trade - 561 720 552 904 2 201 -1 168 4 251 3 901 5 579 3 353 8 676 6 670 -6 462 14 739Hotels and restaurants .. .. .. .. .. .. .. .. .. .. .. .. .. ..Transport, storage and communications 592 879 735 1 562 2 465 -2 784 117 1 051 7 373 52 373 -4 001 61 605 424 8 892Finance 12 751 8 806 8 806 499 1 377 -4 328 -7 052 78 976 12 031 107 722 4 971 26 467 43 334 -11 899
Financial Intermediation - 76 208 11 076 604 1 674 -5 912 -8 108 75 145 13 823 103 107 3 625 19 282 55 062 -11 193Insurance and Pension Funding 12 827 8 598 -2 270 - 105 - 297 1 584 1 056 3 831 -1 792 4 615 1 346 7 185 -11 728 - 706
Business activities 25 2 145 - 423 12 322 - 393 1 110 959 6 794 7 899 22 412 4 946 2 553 8 395 -6 136Community, social and personal service 85 - 25 2 41 61 15 33 230 166 228 4 669 -3 238 670 323
Unspecified 2 166 786 - 204 54 67 - 28 2 104 14 654 15 864 10 769 5 128 -2 679 3 159 19 268Reinvested earnings 4,770 -3,134 -1,495 23,443 36,995 28,947 34,720 44,740 69,672 78,924 21,811 43,571 73,718 73,718
Source : Sveriges Riksbank (Central Bank of Sweden), Balance of Payments , various issues.p p p p p g p g , p p p ,
rubber and plastic products. Machinery and equipment include fabricated metal products. Trade includes hotels and restaurants. Reinvested earnings cannot beallocated by sector and by industry and are thus included seperately. Short-term intra-company loans and trade credits are included in FDI flows from 1997onwards.
UNCTAD WID Country Profile: SWEDEN Page 11 of 54
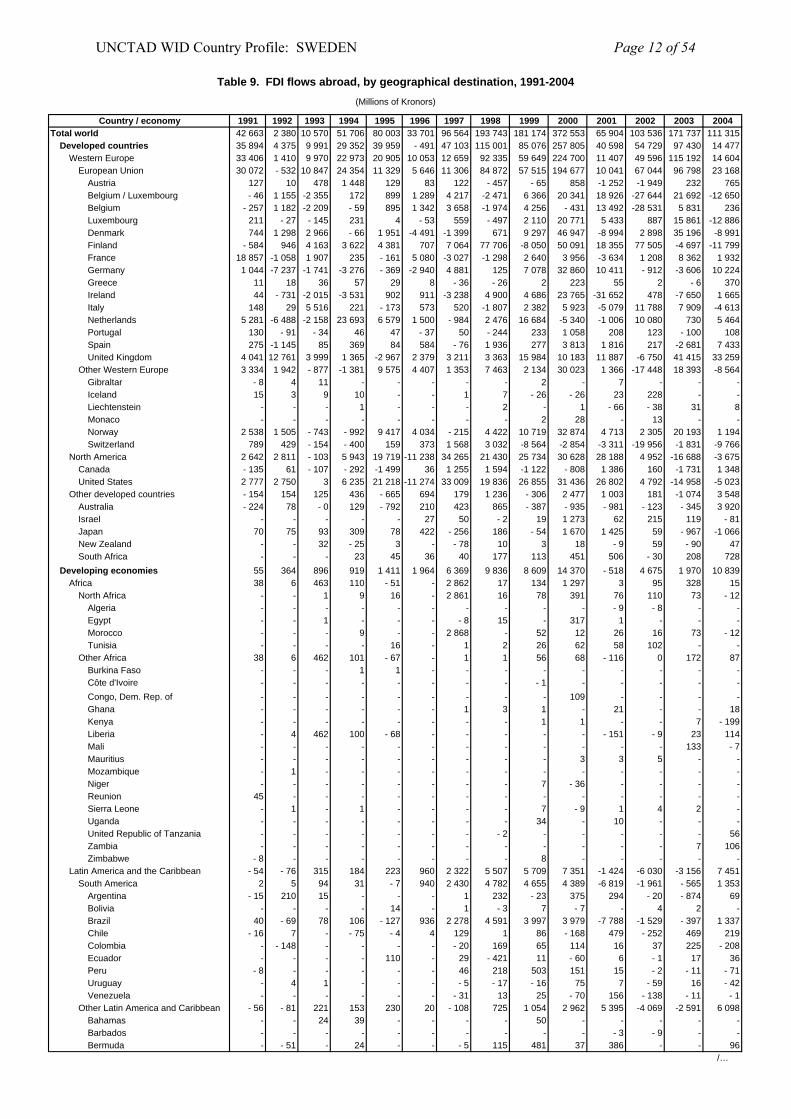
Table 9. FDI flows abroad, by geographical destination, 1991-2004(Millions of Kronors)
Country / economy 1991 1992 1993 1994 1995 1996 1997 1998 1999 2000 2001 2002 2003 2004Total world 42 663 2 380 10 570 51 706 80 003 33 701 96 564 193 743 181 174 372 553 65 904 103 536 171 737 111 315
Developed countries 35 894 4 375 9 991 29 352 39 959 - 491 47 103 115 001 85 076 257 805 40 598 54 729 97 430 14 477Western Europe 33 406 1 410 9 970 22 973 20 905 10 053 12 659 92 335 59 649 224 700 11 407 49 596 115 192 14 604
European Union 30 072 - 532 10 847 24 354 11 329 5 646 11 306 84 872 57 515 194 677 10 041 67 044 96 798 23 168Austria 127 10 478 1 448 129 83 122 - 457 - 65 858 -1 252 -1 949 232 765Belgium / Luxembourg - 46 1 155 -2 355 172 899 1 289 4 217 -2 471 6 366 20 341 18 926 -27 644 21 692 -12 650Belgium - 257 1 182 -2 209 - 59 895 1 342 3 658 -1 974 4 256 - 431 13 492 -28 531 5 831 236Luxembourg 211 - 27 - 145 231 4 - 53 559 - 497 2 110 20 771 5 433 887 15 861 -12 886Denmark 744 1 298 2 966 - 66 1 951 -4 491 -1 399 671 9 297 46 947 -8 994 2 898 35 196 -8 991Finland - 584 946 4 163 3 622 4 381 707 7 064 77 706 -8 050 50 091 18 355 77 505 -4 697 -11 799France 18 857 -1 058 1 907 235 - 161 5 080 -3 027 -1 298 2 640 3 956 -3 634 1 208 8 362 1 932Germany 1 044 -7 237 -1 741 -3 276 - 369 -2 940 4 881 125 7 078 32 860 10 411 - 912 -3 606 10 224Greece 11 18 36 57 29 8 - 36 - 26 2 223 55 2 - 6 370Ireland 44 - 731 -2 015 -3 531 902 911 -3 238 4 900 4 686 23 765 -31 652 478 -7 650 1 665Italy 148 29 5 516 221 - 173 573 520 -1 807 2 382 5 923 -5 079 11 788 7 909 -4 613Netherlands 5 281 -6 488 -2 158 23 693 6 579 1 500 - 984 2 476 16 684 -5 340 -1 006 10 080 730 5 464Portugal 130 - 91 - 34 46 47 - 37 50 - 244 233 1 058 208 123 - 100 108Spain 275 -1 145 85 369 84 584 - 76 1 936 277 3 813 1 816 217 -2 681 7 433United Kingdom 4 041 12 761 3 999 1 365 -2 967 2 379 3 211 3 363 15 984 10 183 11 887 -6 750 41 415 33 259
Other Western Europe 3 334 1 942 - 877 -1 381 9 575 4 407 1 353 7 463 2 134 30 023 1 366 -17 448 18 393 -8 564Gibraltar - 8 4 11 - - - - - 2 - 7 - - -Iceland 15 3 9 10 - - 1 7 - 26 - 26 23 228 - -Liechtenstein - - - 1 - - - 2 - 1 - 66 - 38 31 8Monaco - - - - - - - - 2 28 - 13 - -Norway 2 538 1 505 - 743 - 992 9 417 4 034 - 215 4 422 10 719 32 874 4 713 2 305 20 193 1 194Switzerland 789 429 - 154 - 400 159 373 1 568 3 032 -8 564 -2 854 -3 311 -19 956 -1 831 -9 766
North America 2 642 2 811 - 103 5 943 19 719 -11 238 34 265 21 430 25 734 30 628 28 188 4 952 -16 688 -3 675Canada - 135 61 - 107 - 292 -1 499 36 1 255 1 594 -1 122 - 808 1 386 160 -1 731 1 348United States 2 777 2 750 3 6 235 21 218 -11 274 33 009 19 836 26 855 31 436 26 802 4 792 -14 958 -5 023
Other developed countries - 154 154 125 436 - 665 694 179 1 236 - 306 2 477 1 003 181 -1 074 3 548Australia - 224 78 - 0 129 - 792 210 423 865 - 387 - 935 - 981 - 123 - 345 3 920Israel - - - - - 27 50 - 2 19 1 273 62 215 119 - 81Japan 70 75 93 309 78 422 - 256 186 - 54 1 670 1 425 59 - 967 -1 066New Zealand - - 32 - 25 3 - - 78 10 3 18 - 9 59 - 90 47South Africa - - - 23 45 36 40 177 113 451 506 - 30 208 728
Developing economies 55 364 896 919 1 411 1 964 6 369 9 836 8 609 14 370 - 518 4 675 1 970 10 839Africa 38 6 463 110 - 51 - 2 862 17 134 1 297 3 95 328 15
North Africa - - 1 9 16 - 2 861 16 78 391 76 110 73 - 12Algeria - - - - - - - - - - - 9 - 8 - -Egypt - - 1 - - - - 8 15 - 317 1 - - -Morocco - - - 9 - - 2 868 - 52 12 26 16 73 - 12Tunisia - - - - 16 - 1 2 26 62 58 102 - -
Other Africa 38 6 462 101 - 67 - 1 1 56 68 - 116 0 172 87Burkina Faso - - - 1 1 - - - - - - - - -Côte d'Ivoire - - - - - - - - - 1 - - - - -Congo, Dem. Rep. of - - - - - - - - - 109 - - - -Ghana - - - - - - 1 3 1 - 21 - - 18Kenya - - - - - - - - 1 1 - - 7 - 199Liberia - 4 462 100 - 68 - - - - - - 151 - 9 23 114Mali - - - - - - - - - - - - 133 - 7Mauritius - - - - - - - - - 3 3 5 - -Mozambique - 1 - - - - - - - - - - - -Niger - - - - - - - - 7 - 36 - - - -Reunion 45 - - - - - - - - - - - - -Sierra Leone - 1 - 1 - - - - 7 - 9 1 4 2 -Uganda - - - - - - - - 34 - 10 - - -United Republic of Tanzania - - - - - - - - 2 - - - - - 56Zambia - - - - - - - - - - - - 7 106Zimbabwe - 8 - - - - - - - 8 - - - - -
Latin America and the Caribbean - 54 - 76 315 184 223 960 2 322 5 507 5 709 7 351 -1 424 -6 030 -3 156 7 451South America 2 5 94 31 - 7 940 2 430 4 782 4 655 4 389 -6 819 -1 961 - 565 1 353
Argentina - 15 210 15 - - - 1 232 - 23 375 294 - 20 - 874 69Bolivia - - - - 14 - 1 - 3 7 - 7 - 4 2 -Brazil 40 - 69 78 106 - 127 936 2 278 4 591 3 997 3 979 -7 788 -1 529 - 397 1 337Chile - 16 7 - - 75 - 4 4 129 1 86 - 168 479 - 252 469 219Colombia - - 148 - - - - - 20 169 65 114 16 37 225 - 208Ecuador - - - - 110 - 29 - 421 11 - 60 6 - 1 17 36Peru - 8 - - - - - 46 218 503 151 15 - 2 - 11 - 71Uruguay - 4 1 - - - - 5 - 17 - 16 75 7 - 59 16 - 42Venezuela - - - - - - - 31 13 25 - 70 156 - 138 - 11 - 1
Other Latin America and Caribbean - 56 - 81 221 153 230 20 - 108 725 1 054 2 962 5 395 -4 069 -2 591 6 098Bahamas - - 24 39 - - - - 50 - - - - -Barbados - - - - - - - - - - - 3 - 9 - -Bermuda - - 51 - 24 - - - 5 115 481 37 386 - - 96
/…
UNCTAD WID Country Profile: SWEDEN Page 12 of 54
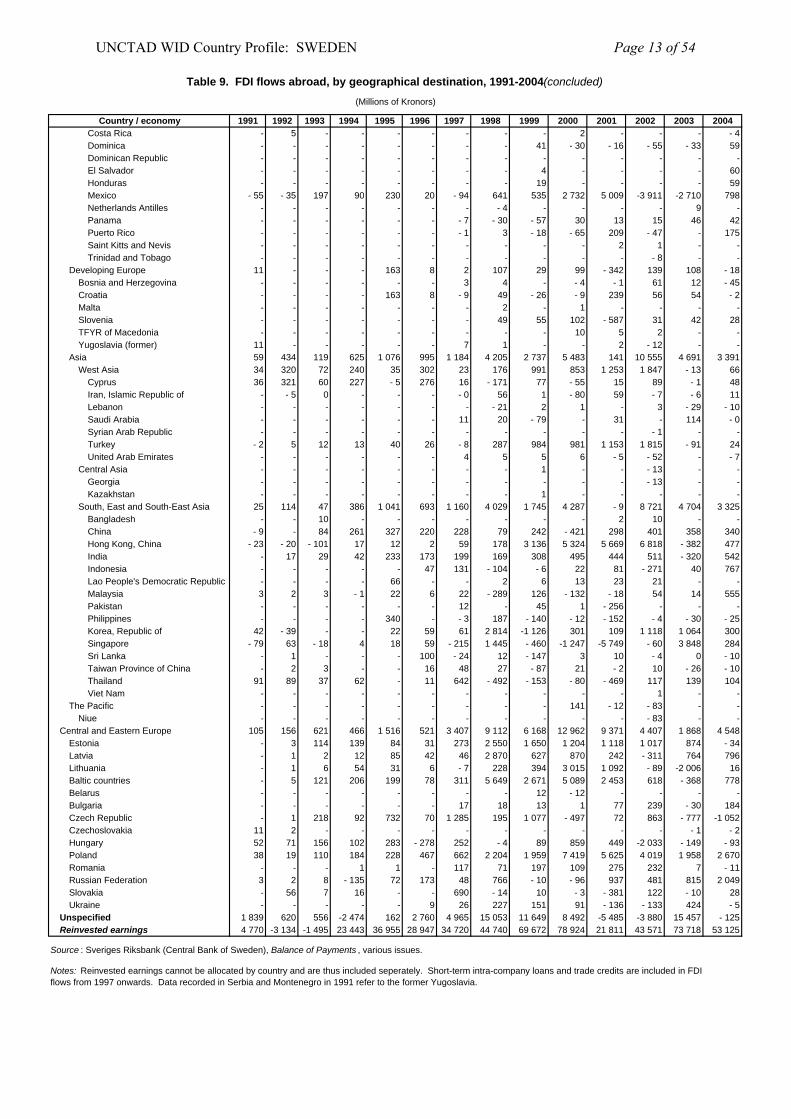
Table 9. FDI flows abroad, by geographical destination, 1991-2004(concluded)
(Millions of Kronors)
Country / economy 1991 1992 1993 1994 1995 1996 1997 1998 1999 2000 2001 2002 2003 2004Costa Rica - 5 - - - - - - - 2 - - - - 4Dominica - - - - - - - - 41 - 30 - 16 - 55 - 33 59Dominican Republic - - - - - - - - - - - - - -El Salvador - - - - - - - - 4 - - - - 60Honduras - - - - - - - - 19 - - - - 59Mexico - 55 - 35 197 90 230 20 - 94 641 535 2 732 5 009 -3 911 -2 710 798Netherlands Antilles - - - - - - - - 4 - - - - 9 -Panama - - - - - - - 7 - 30 - 57 30 13 15 46 42Puerto Rico - - - - - - - 1 3 - 18 - 65 209 - 47 - 175Saint Kitts and Nevis - - - - - - - - - - 2 1 - -Trinidad and Tobago - - - - - - - - - - - - 8 - -
Developing Europe 11 - - - 163 8 2 107 29 99 - 342 139 108 - 18Bosnia and Herzegovina - - - - - - 3 4 - - 4 - 1 61 12 - 45Croatia - - - - 163 8 - 9 49 - 26 - 9 239 56 54 - 2Malta - - - - - - - 2 - 1 - - - -Slovenia - - - - - - - 49 55 102 - 587 31 42 28TFYR of Macedonia - - - - - - - - - 10 5 2 - -Yugoslavia (former) 11 - - - - - 7 1 - - 2 - 12 - -
Asia 59 434 119 625 1 076 995 1 184 4 205 2 737 5 483 141 10 555 4 691 3 391West Asia 34 320 72 240 35 302 23 176 991 853 1 253 1 847 - 13 66
Cyprus 36 321 60 227 - 5 276 16 - 171 77 - 55 15 89 - 1 48Iran, Islamic Republic of - - 5 0 - - - - 0 56 1 - 80 59 - 7 - 6 11Lebanon - - - - - - - - 21 2 1 - 3 - 29 - 10Saudi Arabia - - - - - - 11 20 - 79 - 31 - 114 - 0Syrian Arab Republic - - - - - - - - - - - - 1 - -Turkey - 2 5 12 13 40 26 - 8 287 984 981 1 153 1 815 - 91 24United Arab Emirates - - - - - - 4 5 5 6 - 5 - 52 - - 7
Central Asia - - - - - - - - 1 - - - 13 - -Georgia - - - - - - - - - - - - 13 - -Kazakhstan - - - - - - - - 1 - - - - -
South, East and South-East Asia 25 114 47 386 1 041 693 1 160 4 029 1 745 4 287 - 9 8 721 4 704 3 325Bangladesh - - 10 - - - - - - - 2 10 - -China - 9 - 84 261 327 220 228 79 242 - 421 298 401 358 340Hong Kong, China - 23 - 20 - 101 17 12 2 59 178 3 136 5 324 5 669 6 818 - 382 477India - 17 29 42 233 173 199 169 308 495 444 511 - 320 542Indonesia - - - - - 47 131 - 104 - 6 22 81 - 271 40 767Lao People's Democratic Republic - - - - 66 - - 2 6 13 23 21 - -Malaysia 3 2 3 - 1 22 6 22 - 289 126 - 132 - 18 54 14 555Pakistan - - - - - - 12 - 45 1 - 256 - - -Philippines - - - - 340 - - 3 187 - 140 - 12 - 152 - 4 - 30 - 25Korea, Republic of 42 - 39 - - 22 59 61 2 814 -1 126 301 109 1 118 1 064 300Singapore - 79 63 - 18 4 18 59 - 215 1 445 - 460 -1 247 -5 749 - 60 3 848 284Sri Lanka - 1 - - - 100 - 24 12 - 147 3 10 - 4 0 - 10Taiwan Province of China - 2 3 - - 16 48 27 - 87 21 - 2 10 - 26 - 10Thailand 91 89 37 62 - 11 642 - 492 - 153 - 80 - 469 117 139 104Viet Nam - - - - - - - - - - - 1 - -
The Pacific - - - - - - - - - 141 - 12 - 83 - -Niue - - - - - - - - - - - - 83 - -
Central and Eastern Europe 105 156 621 466 1 516 521 3 407 9 112 6 168 12 962 9 371 4 407 1 868 4 548Estonia - 3 114 139 84 31 273 2 550 1 650 1 204 1 118 1 017 874 - 34Latvia - 1 2 12 85 42 46 2 870 627 870 242 - 311 764 796Lithuania - 1 6 54 31 6 - 7 228 394 3 015 1 092 - 89 -2 006 16Baltic countries - 5 121 206 199 78 311 5 649 2 671 5 089 2 453 618 - 368 778Belarus - - - - - - - - 12 - 12 - - - -Bulgaria - - - - - - 17 18 13 1 77 239 - 30 184Czech Republic - 1 218 92 732 70 1 285 195 1 077 - 497 72 863 - 777 -1 052Czechoslovakia 11 2 - - - - - - - - - - - 1 - 2Hungary 52 71 156 102 283 - 278 252 - 4 89 859 449 -2 033 - 149 - 93Poland 38 19 110 184 228 467 662 2 204 1 959 7 419 5 625 4 019 1 958 2 670Romania - - - 1 1 - 117 71 197 109 275 232 7 - 11Russian Federation 3 2 8 - 135 72 173 48 766 - 10 - 96 937 481 815 2 049Slovakia - 56 7 16 - - 690 - 14 10 - 3 - 381 122 - 10 28Ukraine - - - - - 9 26 227 151 91 - 136 - 133 424 - 5
Unspecified 1 839 620 556 -2 474 162 2 760 4 965 15 053 11 649 8 492 -5 485 -3 880 15 457 - 125Reinvested earnings 4 770 -3 134 -1 495 23 443 36 955 28 947 34 720 44 740 69 672 78 924 21 811 43 571 73 718 53 125
Source : Sveriges Riksbank (Central Bank of Sweden), Balance of Payments , various issues.
Notes: Reinvested earnings cannot be allocated by country and are thus included seperately. Short-term intra-company loans and trade credits are included in FDIflows from 1997 onwards. Data recorded in Serbia and Montenegro in 1991 refer to the former Yugoslavia.
UNCTAD WID Country Profile: SWEDEN Page 13 of 54
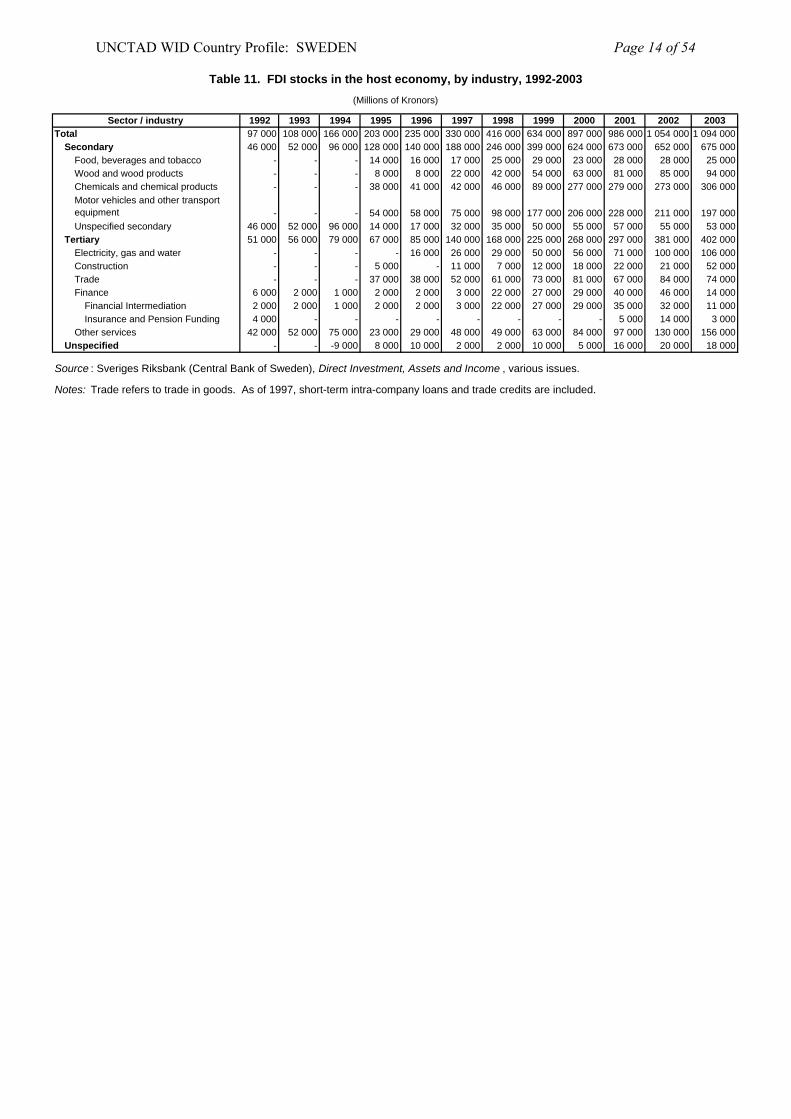
Table 11. FDI stocks in the host economy, by industry, 1992-2003(Millions of Kronors)
Sector / industry 1992 1993 1994 1995 1996 1997 1998 1999 2000 2001 2002 2003Total 97 000 108 000 166 000 203 000 235 000 330 000 416 000 634 000 897 000 986 000 1 054 000 1 094 000
Secondary 46 000 52 000 96 000 128 000 140 000 188 000 246 000 399 000 624 000 673 000 652 000 675 000Food, beverages and tobacco - - - 14 000 16 000 17 000 25 000 29 000 23 000 28 000 28 000 25 000Wood and wood products - - - 8 000 8 000 22 000 42 000 54 000 63 000 81 000 85 000 94 000Chemicals and chemical products - - - 38 000 41 000 42 000 46 000 89 000 277 000 279 000 273 000 306 000Motor vehicles and other transport equipment - - - 54 000 58 000 75 000 98 000 177 000 206 000 228 000 211 000 197 000Unspecified secondary 46 000 52 000 96 000 14 000 17 000 32 000 35 000 50 000 55 000 57 000 55 000 53 000
Tertiary 51 000 56 000 79 000 67 000 85 000 140 000 168 000 225 000 268 000 297 000 381 000 402 000Electricity, gas and water - - - - 16 000 26 000 29 000 50 000 56 000 71 000 100 000 106 000Construction - - - 5 000 - 11 000 7 000 12 000 18 000 22 000 21 000 52 000Trade - - - 37 000 38 000 52 000 61 000 73 000 81 000 67 000 84 000 74 000Finance 6 000 2 000 1 000 2 000 2 000 3 000 22 000 27 000 29 000 40 000 46 000 14 000
Financial Intermediation 2 000 2 000 1 000 2 000 2 000 3 000 22 000 27 000 29 000 35 000 32 000 11 000Insurance and Pension Funding 4 000 - - - - - - - - 5 000 14 000 3 000
Other services 42 000 52 000 75 000 23 000 29 000 48 000 49 000 63 000 84 000 97 000 130 000 156 000Unspecified - - -9 000 8 000 10 000 2 000 2 000 10 000 5 000 16 000 20 000 18 000
Source : Sveriges Riksbank (Central Bank of Sweden), Direct Investment, Assets and Income , various issues.
Notes: Trade refers to trade in goods. As of 1997, short-term intra-company loans and trade credits are included.
UNCTAD WID Country Profile: SWEDEN Page 14 of 54
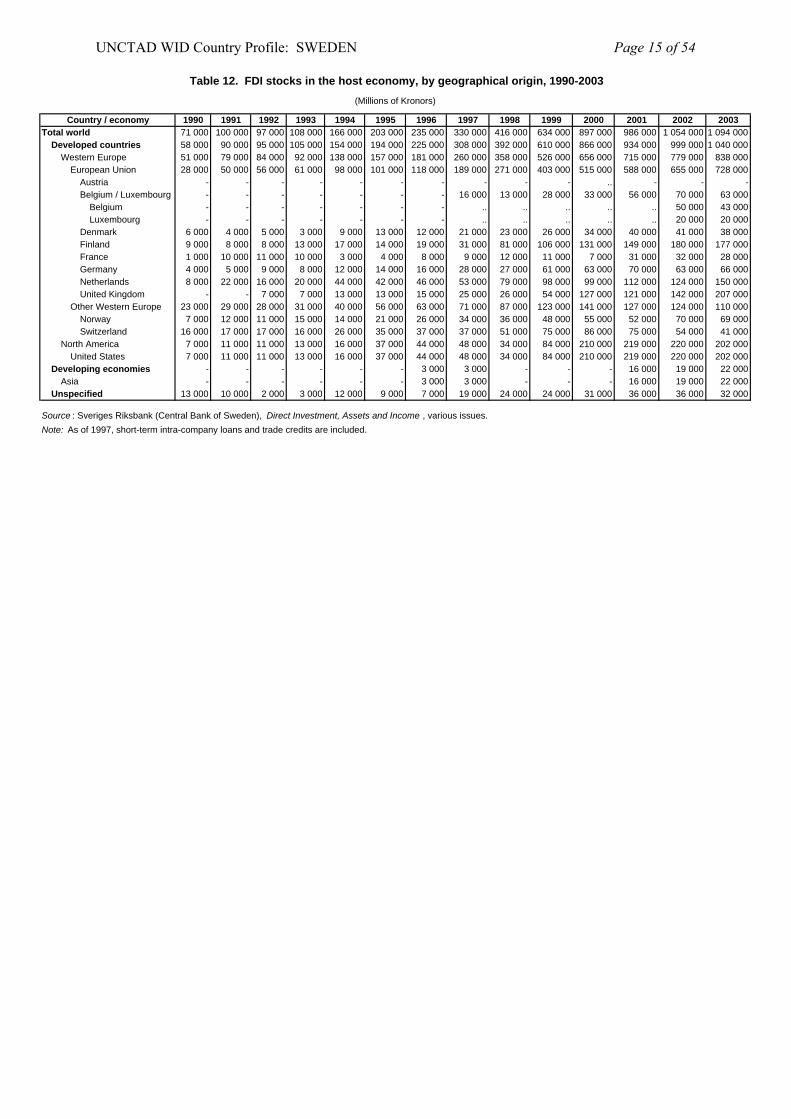
Table 12. FDI stocks in the host economy, by geographical origin, 1990-2003(Millions of Kronors)
Country / economy 1990 1991 1992 1993 1994 1995 1996 1997 1998 1999 2000 2001 2002 2003Total world 71 000 100 000 97 000 108 000 166 000 203 000 235 000 330 000 416 000 634 000 897 000 986 000 1 054 000 1 094 000
Developed countries 58 000 90 000 95 000 105 000 154 000 194 000 225 000 308 000 392 000 610 000 866 000 934 000 999 000 1 040 000Western Europe 51 000 79 000 84 000 92 000 138 000 157 000 181 000 260 000 358 000 526 000 656 000 715 000 779 000 838 000
European Union 28 000 50 000 56 000 61 000 98 000 101 000 118 000 189 000 271 000 403 000 515 000 588 000 655 000 728 000Austria - - - - - - - - - - .. - - -Belgium / Luxembourg - - - - - - - 16 000 13 000 28 000 33 000 56 000 70 000 63 000
Belgium - - - - - - - .. .. .. .. .. 50 000 43 000Luxembourg - - - - - - - .. .. .. .. .. 20 000 20 000
Denmark 6 000 4 000 5 000 3 000 9 000 13 000 12 000 21 000 23 000 26 000 34 000 40 000 41 000 38 000Finland 9 000 8 000 8 000 13 000 17 000 14 000 19 000 31 000 81 000 106 000 131 000 149 000 180 000 177 000France 1 000 10 000 11 000 10 000 3 000 4 000 8 000 9 000 12 000 11 000 7 000 31 000 32 000 28 000Germany 4 000 5 000 9 000 8 000 12 000 14 000 16 000 28 000 27 000 61 000 63 000 70 000 63 000 66 000Netherlands 8 000 22 000 16 000 20 000 44 000 42 000 46 000 53 000 79 000 98 000 99 000 112 000 124 000 150 000United Kingdom - - 7 000 7 000 13 000 13 000 15 000 25 000 26 000 54 000 127 000 121 000 142 000 207 000
Other Western Europe 23 000 29 000 28 000 31 000 40 000 56 000 63 000 71 000 87 000 123 000 141 000 127 000 124 000 110 000Norway 7 000 12 000 11 000 15 000 14 000 21 000 26 000 34 000 36 000 48 000 55 000 52 000 70 000 69 000Switzerland 16 000 17 000 17 000 16 000 26 000 35 000 37 000 37 000 51 000 75 000 86 000 75 000 54 000 41 000
North America 7 000 11 000 11 000 13 000 16 000 37 000 44 000 48 000 34 000 84 000 210 000 219 000 220 000 202 000United States 7 000 11 000 11 000 13 000 16 000 37 000 44 000 48 000 34 000 84 000 210 000 219 000 220 000 202 000
Developing economies - - - - - - 3 000 3 000 - - - 16 000 19 000 22 000Asia - - - - - - 3 000 3 000 - - - 16 000 19 000 22 000
Unspecified 13 000 10 000 2 000 3 000 12 000 9 000 7 000 19 000 24 000 24 000 31 000 36 000 36 000 32 000
Source : Sveriges Riksbank (Central Bank of Sweden), Direct Investment, Assets and Income , various issues.Note: As of 1997, short-term intra-company loans and trade credits are included.
UNCTAD WID Country Profile: SWEDEN Page 15 of 54
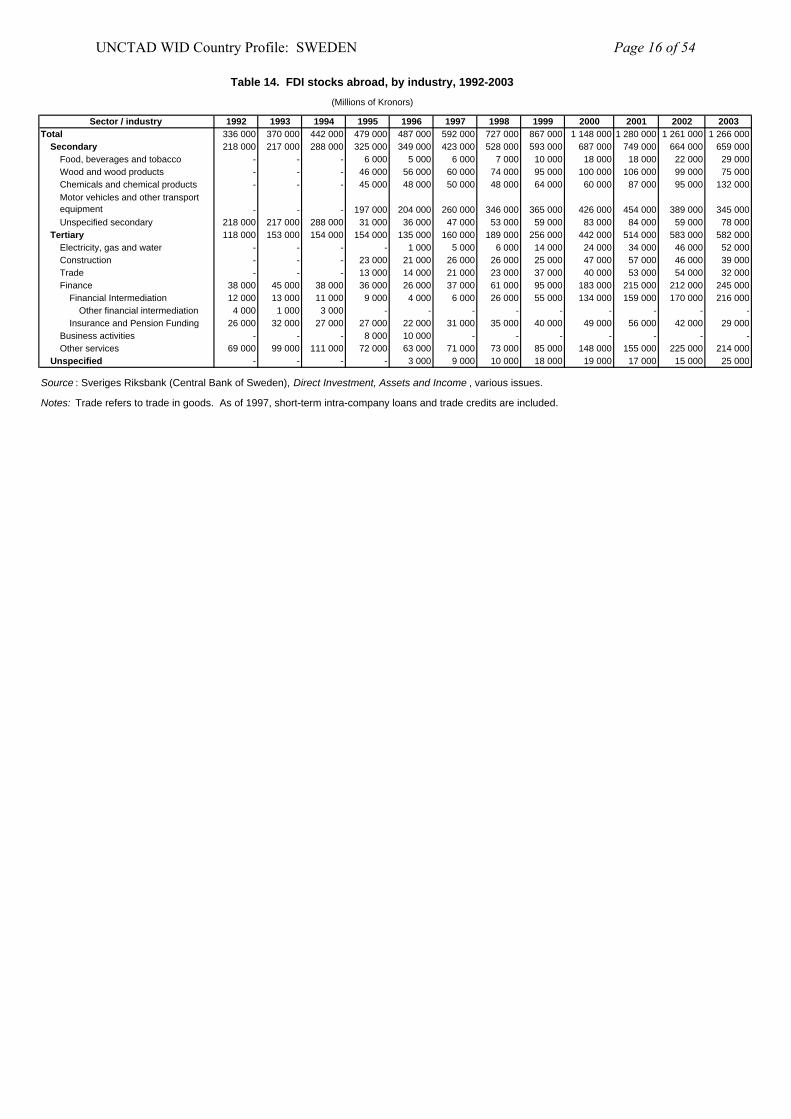
Table 14. FDI stocks abroad, by industry, 1992-2003(Millions of Kronors)
Sector / industry 1992 1993 1994 1995 1996 1997 1998 1999 2000 2001 2002 2003Total 336 000 370 000 442 000 479 000 487 000 592 000 727 000 867 000 1 148 000 1 280 000 1 261 000 1 266 000
Secondary 218 000 217 000 288 000 325 000 349 000 423 000 528 000 593 000 687 000 749 000 664 000 659 000Food, beverages and tobacco - - - 6 000 5 000 6 000 7 000 10 000 18 000 18 000 22 000 29 000Wood and wood products - - - 46 000 56 000 60 000 74 000 95 000 100 000 106 000 99 000 75 000Chemicals and chemical products - - - 45 000 48 000 50 000 48 000 64 000 60 000 87 000 95 000 132 000Motor vehicles and other transport equipment - - - 197 000 204 000 260 000 346 000 365 000 426 000 454 000 389 000 345 000Unspecified secondary 218 000 217 000 288 000 31 000 36 000 47 000 53 000 59 000 83 000 84 000 59 000 78 000
Tertiary 118 000 153 000 154 000 154 000 135 000 160 000 189 000 256 000 442 000 514 000 583 000 582 000Electricity, gas and water - - - - 1 000 5 000 6 000 14 000 24 000 34 000 46 000 52 000Construction - - - 23 000 21 000 26 000 26 000 25 000 47 000 57 000 46 000 39 000Trade - - - 13 000 14 000 21 000 23 000 37 000 40 000 53 000 54 000 32 000Finance 38 000 45 000 38 000 36 000 26 000 37 000 61 000 95 000 183 000 215 000 212 000 245 000
Financial Intermediation 12 000 13 000 11 000 9 000 4 000 6 000 26 000 55 000 134 000 159 000 170 000 216 000Other financial intermediation 4 000 1 000 3 000 - - - - - - - - -
Insurance and Pension Funding 26 000 32 000 27 000 27 000 22 000 31 000 35 000 40 000 49 000 56 000 42 000 29 000Business activities - - - 8 000 10 000 - - - - - - -Other services 69 000 99 000 111 000 72 000 63 000 71 000 73 000 85 000 148 000 155 000 225 000 214 000
Unspecified - - - - 3 000 9 000 10 000 18 000 19 000 17 000 15 000 25 000
Source : Sveriges Riksbank (Central Bank of Sweden), Direct Investment, Assets and Income , various issues.
Notes: Trade refers to trade in goods. As of 1997, short-term intra-company loans and trade credits are included.
UNCTAD WID Country Profile: SWEDEN Page 16 of 54
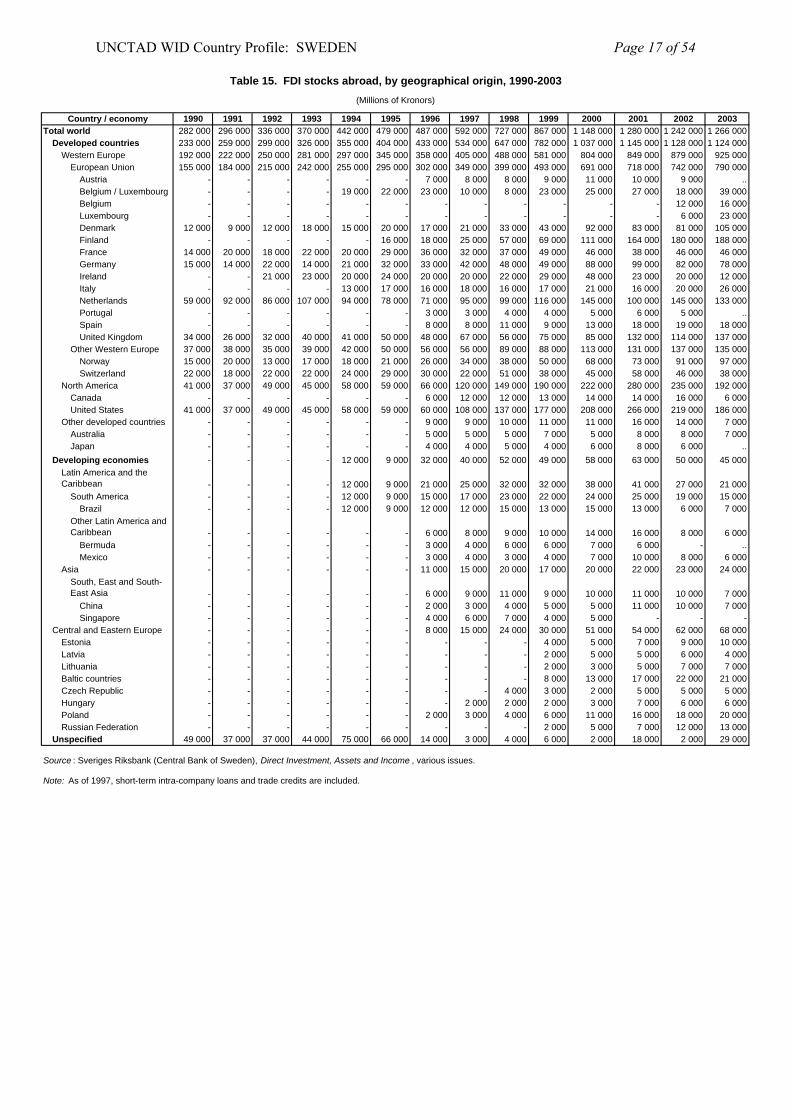
Table 15. FDI stocks abroad, by geographical origin, 1990-2003(Millions of Kronors)
Country / economy 1990 1991 1992 1993 1994 1995 1996 1997 1998 1999 2000 2001 2002 2003Total world 282 000 296 000 336 000 370 000 442 000 479 000 487 000 592 000 727 000 867 000 1 148 000 1 280 000 1 242 000 1 266 000
Developed countries 233 000 259 000 299 000 326 000 355 000 404 000 433 000 534 000 647 000 782 000 1 037 000 1 145 000 1 128 000 1 124 000Western Europe 192 000 222 000 250 000 281 000 297 000 345 000 358 000 405 000 488 000 581 000 804 000 849 000 879 000 925 000
European Union 155 000 184 000 215 000 242 000 255 000 295 000 302 000 349 000 399 000 493 000 691 000 718 000 742 000 790 000Austria - - - - - - 7 000 8 000 8 000 9 000 11 000 10 000 9 000 ..Belgium / Luxembourg - - - - 19 000 22 000 23 000 10 000 8 000 23 000 25 000 27 000 18 000 39 000Belgium - - - - - - - - - - - - 12 000 16 000Luxembourg - - - - - - - - - - - - 6 000 23 000Denmark 12 000 9 000 12 000 18 000 15 000 20 000 17 000 21 000 33 000 43 000 92 000 83 000 81 000 105 000Finland - - - - - 16 000 18 000 25 000 57 000 69 000 111 000 164 000 180 000 188 000France 14 000 20 000 18 000 22 000 20 000 29 000 36 000 32 000 37 000 49 000 46 000 38 000 46 000 46 000Germany 15 000 14 000 22 000 14 000 21 000 32 000 33 000 42 000 48 000 49 000 88 000 99 000 82 000 78 000Ireland - - 21 000 23 000 20 000 24 000 20 000 20 000 22 000 29 000 48 000 23 000 20 000 12 000Italy - - - - 13 000 17 000 16 000 18 000 16 000 17 000 21 000 16 000 20 000 26 000Netherlands 59 000 92 000 86 000 107 000 94 000 78 000 71 000 95 000 99 000 116 000 145 000 100 000 145 000 133 000Portugal - - - - - - 3 000 3 000 4 000 4 000 5 000 6 000 5 000 ..Spain - - - - - - 8 000 8 000 11 000 9 000 13 000 18 000 19 000 18 000United Kingdom 34 000 26 000 32 000 40 000 41 000 50 000 48 000 67 000 56 000 75 000 85 000 132 000 114 000 137 000
Other Western Europe 37 000 38 000 35 000 39 000 42 000 50 000 56 000 56 000 89 000 88 000 113 000 131 000 137 000 135 000Norway 15 000 20 000 13 000 17 000 18 000 21 000 26 000 34 000 38 000 50 000 68 000 73 000 91 000 97 000Switzerland 22 000 18 000 22 000 22 000 24 000 29 000 30 000 22 000 51 000 38 000 45 000 58 000 46 000 38 000
North America 41 000 37 000 49 000 45 000 58 000 59 000 66 000 120 000 149 000 190 000 222 000 280 000 235 000 192 000Canada - - - - - - 6 000 12 000 12 000 13 000 14 000 14 000 16 000 6 000United States 41 000 37 000 49 000 45 000 58 000 59 000 60 000 108 000 137 000 177 000 208 000 266 000 219 000 186 000
Other developed countries - - - - - - 9 000 9 000 10 000 11 000 11 000 16 000 14 000 7 000Australia - - - - - - 5 000 5 000 5 000 7 000 5 000 8 000 8 000 7 000Japan - - - - - - 4 000 4 000 5 000 4 000 6 000 8 000 6 000 ..
Developing economies - - - - 12 000 9 000 32 000 40 000 52 000 49 000 58 000 63 000 50 000 45 000Latin America and the Caribbean - - - - 12 000 9 000 21 000 25 000 32 000 32 000 38 000 41 000 27 000 21 000
South America - - - - 12 000 9 000 15 000 17 000 23 000 22 000 24 000 25 000 19 000 15 000Brazil - - - - 12 000 9 000 12 000 12 000 15 000 13 000 15 000 13 000 6 000 7 000
Other Latin America and Caribbean - - - - - - 6 000 8 000 9 000 10 000 14 000 16 000 8 000 6 000
Bermuda - - - - - - 3 000 4 000 6 000 6 000 7 000 6 000 - ..Mexico - - - - - - 3 000 4 000 3 000 4 000 7 000 10 000 8 000 6 000
Asia - - - - - - 11 000 15 000 20 000 17 000 20 000 22 000 23 000 24 000South, East and South-East Asia - - - - - - 6 000 9 000 11 000 9 000 10 000 11 000 10 000 7 000
China - - - - - - 2 000 3 000 4 000 5 000 5 000 11 000 10 000 7 000Singapore - - - - - - 4 000 6 000 7 000 4 000 5 000 - - -
Central and Eastern Europe - - - - - - 8 000 15 000 24 000 30 000 51 000 54 000 62 000 68 000Estonia - - - - - - - - - 4 000 5 000 7 000 9 000 10 000Latvia - - - - - - - - - 2 000 5 000 5 000 6 000 4 000Lithuania - - - - - - - - - 2 000 3 000 5 000 7 000 7 000Baltic countries - - - - - - - - - 8 000 13 000 17 000 22 000 21 000Czech Republic - - - - - - - - 4 000 3 000 2 000 5 000 5 000 5 000Hungary - - - - - - - 2 000 2 000 2 000 3 000 7 000 6 000 6 000Poland - - - - - - 2 000 3 000 4 000 6 000 11 000 16 000 18 000 20 000Russian Federation - - - - - - - - - 2 000 5 000 7 000 12 000 13 000
Unspecified 49 000 37 000 37 000 44 000 75 000 66 000 14 000 3 000 4 000 6 000 2 000 18 000 2 000 29 000
Source : Sveriges Riksbank (Central Bank of Sweden), Direct Investment, Assets and Income , various issues.
Note: As of 1997, short-term intra-company loans and trade credits are included.
UNCTAD WID Country Profile: SWEDEN Page 17 of 54
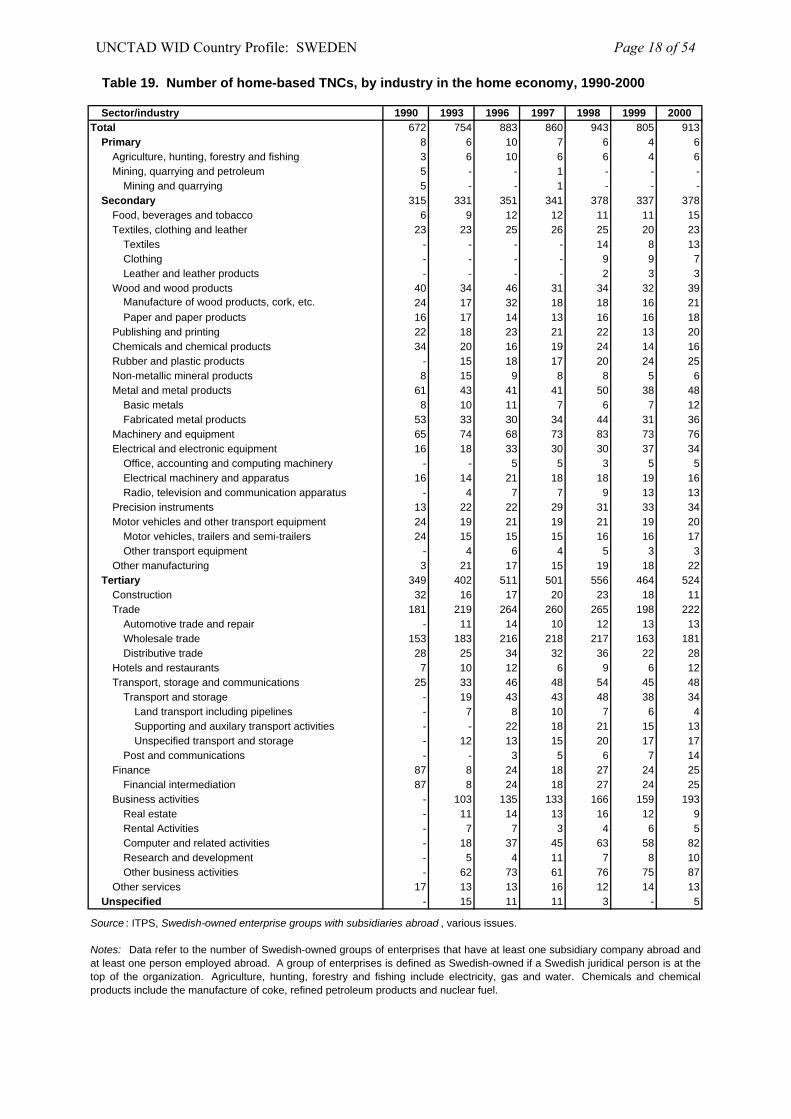
Table 19. Number of home-based TNCs, by industry in the home economy, 1990-2000
Sector/industry 1990 1993 1996 1997 1998 1999 2000Total 672 754 883 860 943 805 913
Primary 8 6 10 7 6 4 6Agriculture, hunting, forestry and fishing 3 6 10 6 6 4 6Mining, quarrying and petroleum 5 - - 1 - - -
Mining and quarrying 5 - - 1 - - -Secondary 315 331 351 341 378 337 378
Food, beverages and tobacco 6 9 12 12 11 11 15Textiles, clothing and leather 23 23 25 26 25 20 23
Textiles - - - - 14 8 13Clothing - - - - 9 9 7Leather and leather products - - - - 2 3 3
Wood and wood products 40 34 46 31 34 32 39Manufacture of wood products, cork, etc. 24 17 32 18 18 16 21Paper and paper products 16 17 14 13 16 16 18
Publishing and printing 22 18 23 21 22 13 20Chemicals and chemical products 34 20 16 19 24 14 16Rubber and plastic products - 15 18 17 20 24 25Non-metallic mineral products 8 15 9 8 8 5 6Metal and metal products 61 43 41 41 50 38 48
Basic metals 8 10 11 7 6 7 12Fabricated metal products 53 33 30 34 44 31 36
Machinery and equipment 65 74 68 73 83 73 76Electrical and electronic equipment 16 18 33 30 30 37 34
Office, accounting and computing machinery - - 5 5 3 5 5Electrical machinery and apparatus 16 14 21 18 18 19 16Radio, television and communication apparatus - 4 7 7 9 13 13
Precision instruments 13 22 22 29 31 33 34Motor vehicles and other transport equipment 24 19 21 19 21 19 20
Motor vehicles, trailers and semi-trailers 24 15 15 15 16 16 17Other transport equipment - 4 6 4 5 3 3
Other manufacturing 3 21 17 15 19 18 22Tertiary 349 402 511 501 556 464 524
Construction 32 16 17 20 23 18 11Trade 181 219 264 260 265 198 222
Automotive trade and repair - 11 14 10 12 13 13Wholesale trade 153 183 216 218 217 163 181Distributive trade 28 25 34 32 36 22 28
Hotels and restaurants 7 10 12 6 9 6 12Transport, storage and communications 25 33 46 48 54 45 48
Transport and storage - 19 43 43 48 38 34Land transport including pipelines - 7 8 10 7 6 4Supporting and auxilary transport activities - - 22 18 21 15 13Unspecified transport and storage - 12 13 15 20 17 17
Post and communications - - 3 5 6 7 14Finance 87 8 24 18 27 24 25
Financial intermediation 87 8 24 18 27 24 25Business activities - 103 135 133 166 159 193
Real estate - 11 14 13 16 12 9Rental Activities - 7 7 3 4 6 5Computer and related activities - 18 37 45 63 58 82Research and development - 5 4 11 7 8 10Other business activities - 62 73 61 76 75 87
Other services 17 13 13 16 12 14 13Unspecified - 15 11 11 3 - 5
Source : ITPS, Swedish-owned enterprise groups with subsidiaries abroad , various issues.
Notes: Data refer to the number of Swedish-owned groups of enterprises that have at least one subsidiary company abroad andat least one person employed abroad. A group of enterprises is defined as Swedish-owned if a Swedish juridical person is at thetop of the organization. Agriculture, hunting, forestry and fishing include electricity, gas and water. Chemicals and chemicalproducts include the manufacture of coke, refined petroleum products and nuclear fuel.
UNCTAD WID Country Profile: SWEDEN Page 18 of 54
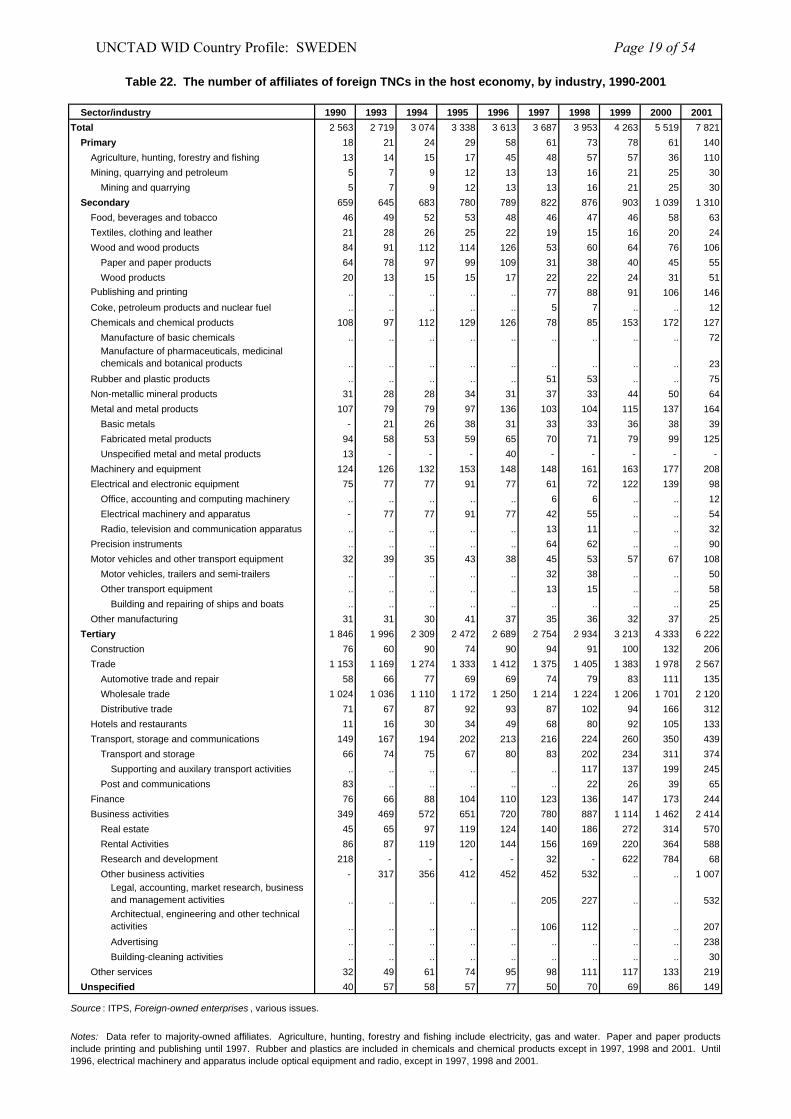
Table 22. The number of affiliates of foreign TNCs in the host economy, by industry, 1990-2001
Sector/industry 1990 1993 1994 1995 1996 1997 1998 1999 2000 2001Total 2 563 2 719 3 074 3 338 3 613 3 687 3 953 4 263 5 519 7 821
Primary 18 21 24 29 58 61 73 78 61 140Agriculture, hunting, forestry and fishing 13 14 15 17 45 48 57 57 36 110Mining, quarrying and petroleum 5 7 9 12 13 13 16 21 25 30
Mining and quarrying 5 7 9 12 13 13 16 21 25 30Secondary 659 645 683 780 789 822 876 903 1 039 1 310
Food, beverages and tobacco 46 49 52 53 48 46 47 46 58 63Textiles, clothing and leather 21 28 26 25 22 19 15 16 20 24Wood and wood products 84 91 112 114 126 53 60 64 76 106
Paper and paper products 64 78 97 99 109 31 38 40 45 55Wood products 20 13 15 15 17 22 22 24 31 51
Publishing and printing .. .. .. .. .. 77 88 91 106 146Coke, petroleum products and nuclear fuel .. .. .. .. .. 5 7 .. .. 12Chemicals and chemical products 108 97 112 129 126 78 85 153 172 127
Manufacture of basic chemicals .. .. .. .. .. .. .. .. .. 72Manufacture of pharmaceuticals, medicinal chemicals and botanical products .. .. .. .. .. .. .. .. .. 23
Rubber and plastic products .. .. .. .. .. 51 53 .. .. 75Non-metallic mineral products 31 28 28 34 31 37 33 44 50 64Metal and metal products 107 79 79 97 136 103 104 115 137 164
Basic metals - 21 26 38 31 33 33 36 38 39Fabricated metal products 94 58 53 59 65 70 71 79 99 125Unspecified metal and metal products 13 - - - 40 - - - - -
Machinery and equipment 124 126 132 153 148 148 161 163 177 208Electrical and electronic equipment 75 77 77 91 77 61 72 122 139 98
Office, accounting and computing machinery .. .. .. .. .. 6 6 .. .. 12Electrical machinery and apparatus - 77 77 91 77 42 55 .. .. 54Radio, television and communication apparatus .. .. .. .. .. 13 11 .. .. 32
Precision instruments .. .. .. .. .. 64 62 .. .. 90Motor vehicles and other transport equipment 32 39 35 43 38 45 53 57 67 108
Motor vehicles, trailers and semi-trailers .. .. .. .. .. 32 38 .. .. 50Other transport equipment .. .. .. .. .. 13 15 .. .. 58
Building and repairing of ships and boats .. .. .. .. .. .. .. .. .. 25Other manufacturing 31 31 30 41 37 35 36 32 37 25
Tertiary 1 846 1 996 2 309 2 472 2 689 2 754 2 934 3 213 4 333 6 222Construction 76 60 90 74 90 94 91 100 132 206Trade 1 153 1 169 1 274 1 333 1 412 1 375 1 405 1 383 1 978 2 567
Automotive trade and repair 58 66 77 69 69 74 79 83 111 135Wholesale trade 1 024 1 036 1 110 1 172 1 250 1 214 1 224 1 206 1 701 2 120Distributive trade 71 67 87 92 93 87 102 94 166 312
Hotels and restaurants 11 16 30 34 49 68 80 92 105 133Transport, storage and communications 149 167 194 202 213 216 224 260 350 439
Transport and storage 66 74 75 67 80 83 202 234 311 374Supporting and auxilary transport activities .. .. .. .. .. .. 117 137 199 245
Post and communications 83 .. .. .. .. .. 22 26 39 65Finance 76 66 88 104 110 123 136 147 173 244Business activities 349 469 572 651 720 780 887 1 114 1 462 2 414
Real estate 45 65 97 119 124 140 186 272 314 570Rental Activities 86 87 119 120 144 156 169 220 364 588Research and development 218 - - - - 32 - 622 784 68Other business activities - 317 356 412 452 452 532 .. .. 1 007
Legal, accounting, market research, business and management activities .. .. .. .. .. 205 227 .. .. 532Architectual, engineering and other technical activities .. .. .. .. .. 106 112 .. .. 207Advertising .. .. .. .. .. .. .. .. .. 238Building-cleaning activities .. .. .. .. .. .. .. .. .. 30
Other services 32 49 61 74 95 98 111 117 133 219Unspecified 40 57 58 57 77 50 70 69 86 149
Source : ITPS, Foreign-owned enterprises , various issues.
Notes: Data refer to majority-owned affiliates. Agriculture, hunting, forestry and fishing include electricity, gas and water. Paper and paper productsinclude printing and publishing until 1997. Rubber and plastics are included in chemicals and chemical products except in 1997, 1998 and 2001. Until1996, electrical machinery and apparatus include optical equipment and radio, except in 1997, 1998 and 2001.
UNCTAD WID Country Profile: SWEDEN Page 19 of 54
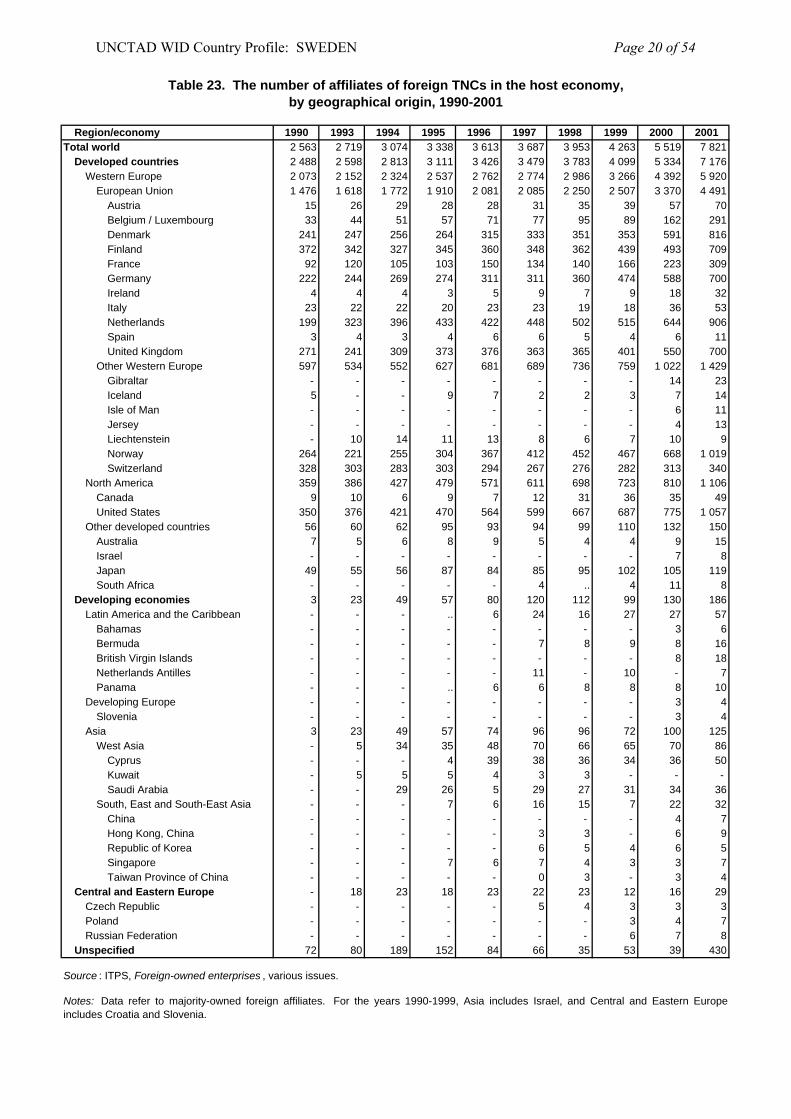
Table 23. The number of affiliates of foreign TNCs in the host economy, by geographical origin, 1990-2001
Region/economy 1990 1993 1994 1995 1996 1997 1998 1999 2000 2001Total world 2 563 2 719 3 074 3 338 3 613 3 687 3 953 4 263 5 519 7 821
Developed countries 2 488 2 598 2 813 3 111 3 426 3 479 3 783 4 099 5 334 7 176Western Europe 2 073 2 152 2 324 2 537 2 762 2 774 2 986 3 266 4 392 5 920
European Union 1 476 1 618 1 772 1 910 2 081 2 085 2 250 2 507 3 370 4 491Austria 15 26 29 28 28 31 35 39 57 70Belgium / Luxembourg 33 44 51 57 71 77 95 89 162 291Denmark 241 247 256 264 315 333 351 353 591 816Finland 372 342 327 345 360 348 362 439 493 709France 92 120 105 103 150 134 140 166 223 309Germany 222 244 269 274 311 311 360 474 588 700Ireland 4 4 4 3 5 9 7 9 18 32Italy 23 22 22 20 23 23 19 18 36 53Netherlands 199 323 396 433 422 448 502 515 644 906Spain 3 4 3 4 6 6 5 4 6 11United Kingdom 271 241 309 373 376 363 365 401 550 700
Other Western Europe 597 534 552 627 681 689 736 759 1 022 1 429Gibraltar - - - - - - - - 14 23Iceland 5 - - 9 7 2 2 3 7 14Isle of Man - - - - - - - - 6 11Jersey - - - - - - - - 4 13Liechtenstein - 10 14 11 13 8 6 7 10 9Norway 264 221 255 304 367 412 452 467 668 1 019Switzerland 328 303 283 303 294 267 276 282 313 340
North America 359 386 427 479 571 611 698 723 810 1 106Canada 9 10 6 9 7 12 31 36 35 49United States 350 376 421 470 564 599 667 687 775 1 057
Other developed countries 56 60 62 95 93 94 99 110 132 150Australia 7 5 6 8 9 5 4 4 9 15Israel - - - - - - - - 7 8Japan 49 55 56 87 84 85 95 102 105 119South Africa - - - - - 4 .. 4 11 8
Developing economies 3 23 49 57 80 120 112 99 130 186Latin America and the Caribbean - - - .. 6 24 16 27 27 57
Bahamas - - - - - - - - 3 6Bermuda - - - - - 7 8 9 8 16British Virgin Islands - - - - - - - - 8 18Netherlands Antilles - - - - - 11 - 10 - 7Panama - - - .. 6 6 8 8 8 10
Developing Europe - - - - - - - - 3 4Slovenia - - - - - - - - 3 4
Asia 3 23 49 57 74 96 96 72 100 125West Asia - 5 34 35 48 70 66 65 70 86
Cyprus - - - 4 39 38 36 34 36 50Kuwait - 5 5 5 4 3 3 - - - Saudi Arabia - - 29 26 5 29 27 31 34 36
South, East and South-East Asia - - - 7 6 16 15 7 22 32China - - - - - - - - 4 7Hong Kong, China - - - - - 3 3 - 6 9Republic of Korea - - - - - 6 5 4 6 5Singapore - - - 7 6 7 4 3 3 7Taiwan Province of China - - - - - 0 3 - 3 4
Central and Eastern Europe - 18 23 18 23 22 23 12 16 29Czech Republic - - - - - 5 4 3 3 3Poland - - - - - - - 3 4 7Russian Federation - - - - - - - 6 7 8
Unspecified 72 80 189 152 84 66 35 53 39 430
Source : ITPS, Foreign-owned enterprises , various issues.
Notes: Data refer to majority-owned foreign affiliates. For the years 1990-1999, Asia includes Israel, and Central and Eastern Europeincludes Croatia and Slovenia.
UNCTAD WID Country Profile: SWEDEN Page 20 of 54
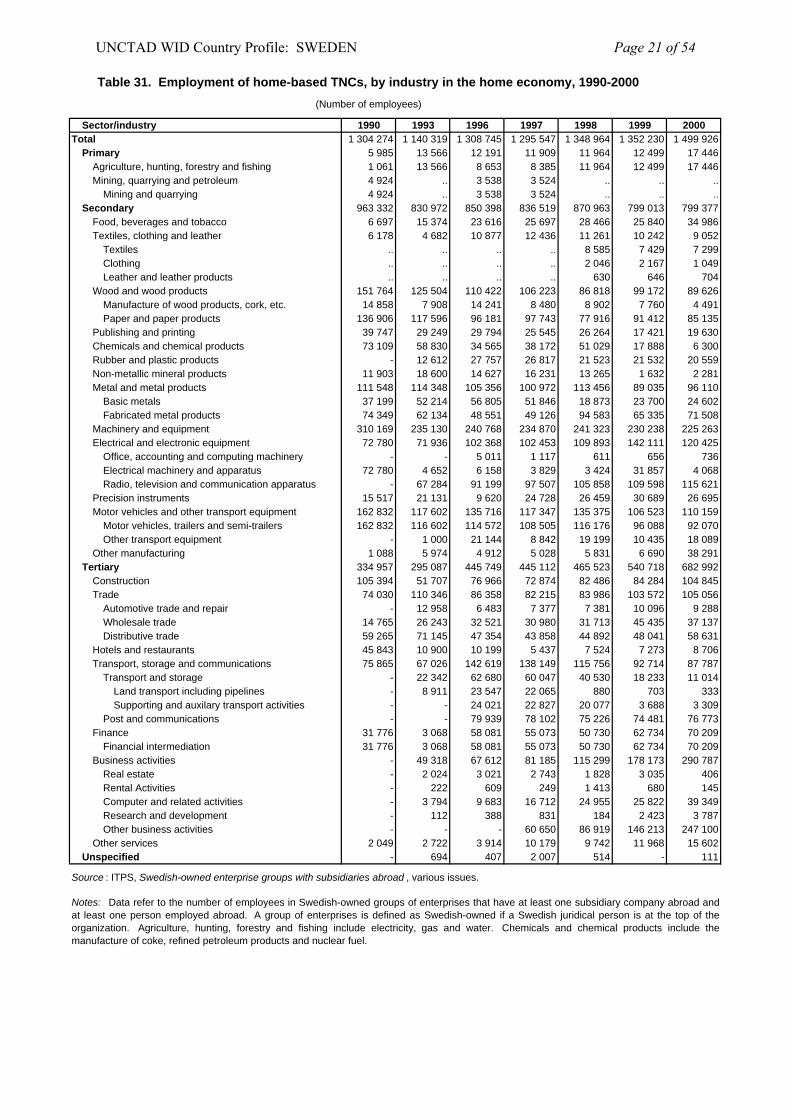
Table 31. Employment of home-based TNCs, by industry in the home economy, 1990-2000(Number of employees)
Sector/industry 1990 1993 1996 1997 1998 1999 2000Total 1 304 274 1 140 319 1 308 745 1 295 547 1 348 964 1 352 230 1 499 926
Primary 5 985 13 566 12 191 11 909 11 964 12 499 17 446Agriculture, hunting, forestry and fishing 1 061 13 566 8 653 8 385 11 964 12 499 17 446Mining, quarrying and petroleum 4 924 .. 3 538 3 524 .. .. ..
Mining and quarrying 4 924 .. 3 538 3 524 .. .. ..Secondary 963 332 830 972 850 398 836 519 870 963 799 013 799 377
Food, beverages and tobacco 6 697 15 374 23 616 25 697 28 466 25 840 34 986Textiles, clothing and leather 6 178 4 682 10 877 12 436 11 261 10 242 9 052
Textiles .. .. .. .. 8 585 7 429 7 299Clothing .. .. .. .. 2 046 2 167 1 049Leather and leather products .. .. .. .. 630 646 704
Wood and wood products 151 764 125 504 110 422 106 223 86 818 99 172 89 626Manufacture of wood products, cork, etc. 14 858 7 908 14 241 8 480 8 902 7 760 4 491Paper and paper products 136 906 117 596 96 181 97 743 77 916 91 412 85 135
Publishing and printing 39 747 29 249 29 794 25 545 26 264 17 421 19 630Chemicals and chemical products 73 109 58 830 34 565 38 172 51 029 17 888 6 300Rubber and plastic products - 12 612 27 757 26 817 21 523 21 532 20 559Non-metallic mineral products 11 903 18 600 14 627 16 231 13 265 1 632 2 281Metal and metal products 111 548 114 348 105 356 100 972 113 456 89 035 96 110
Basic metals 37 199 52 214 56 805 51 846 18 873 23 700 24 602Fabricated metal products 74 349 62 134 48 551 49 126 94 583 65 335 71 508
Machinery and equipment 310 169 235 130 240 768 234 870 241 323 230 238 225 263Electrical and electronic equipment 72 780 71 936 102 368 102 453 109 893 142 111 120 425
Office, accounting and computing machinery - - 5 011 1 117 611 656 736Electrical machinery and apparatus 72 780 4 652 6 158 3 829 3 424 31 857 4 068Radio, television and communication apparatus - 67 284 91 199 97 507 105 858 109 598 115 621
Precision instruments 15 517 21 131 9 620 24 728 26 459 30 689 26 695Motor vehicles and other transport equipment 162 832 117 602 135 716 117 347 135 375 106 523 110 159
Motor vehicles, trailers and semi-trailers 162 832 116 602 114 572 108 505 116 176 96 088 92 070Other transport equipment - 1 000 21 144 8 842 19 199 10 435 18 089
Other manufacturing 1 088 5 974 4 912 5 028 5 831 6 690 38 291Tertiary 334 957 295 087 445 749 445 112 465 523 540 718 682 992
Construction 105 394 51 707 76 966 72 874 82 486 84 284 104 845Trade 74 030 110 346 86 358 82 215 83 986 103 572 105 056
Automotive trade and repair - 12 958 6 483 7 377 7 381 10 096 9 288Wholesale trade 14 765 26 243 32 521 30 980 31 713 45 435 37 137Distributive trade 59 265 71 145 47 354 43 858 44 892 48 041 58 631
Hotels and restaurants 45 843 10 900 10 199 5 437 7 524 7 273 8 706Transport, storage and communications 75 865 67 026 142 619 138 149 115 756 92 714 87 787
Transport and storage - 22 342 62 680 60 047 40 530 18 233 11 014Land transport including pipelines - 8 911 23 547 22 065 880 703 333Supporting and auxilary transport activities - - 24 021 22 827 20 077 3 688 3 309
Post and communications - - 79 939 78 102 75 226 74 481 76 773Finance 31 776 3 068 58 081 55 073 50 730 62 734 70 209
Financial intermediation 31 776 3 068 58 081 55 073 50 730 62 734 70 209Business activities - 49 318 67 612 81 185 115 299 178 173 290 787
Real estate - 2 024 3 021 2 743 1 828 3 035 406Rental Activities - 222 609 249 1 413 680 145Computer and related activities - 3 794 9 683 16 712 24 955 25 822 39 349Research and development - 112 388 831 184 2 423 3 787Other business activities - - - 60 650 86 919 146 213 247 100
Other services 2 049 2 722 3 914 10 179 9 742 11 968 15 602Unspecified - 694 407 2 007 514 - 111
Source : ITPS, Swedish-owned enterprise groups with subsidiaries abroad , various issues.
Notes: Data refer to the number of employees in Swedish-owned groups of enterprises that have at least one subsidiary company abroad andat least one person employed abroad. A group of enterprises is defined as Swedish-owned if a Swedish juridical person is at the top of theorganization. Agriculture, hunting, forestry and fishing include electricity, gas and water. Chemicals and chemical products include themanufacture of coke, refined petroleum products and nuclear fuel.
UNCTAD WID Country Profile: SWEDEN Page 21 of 54
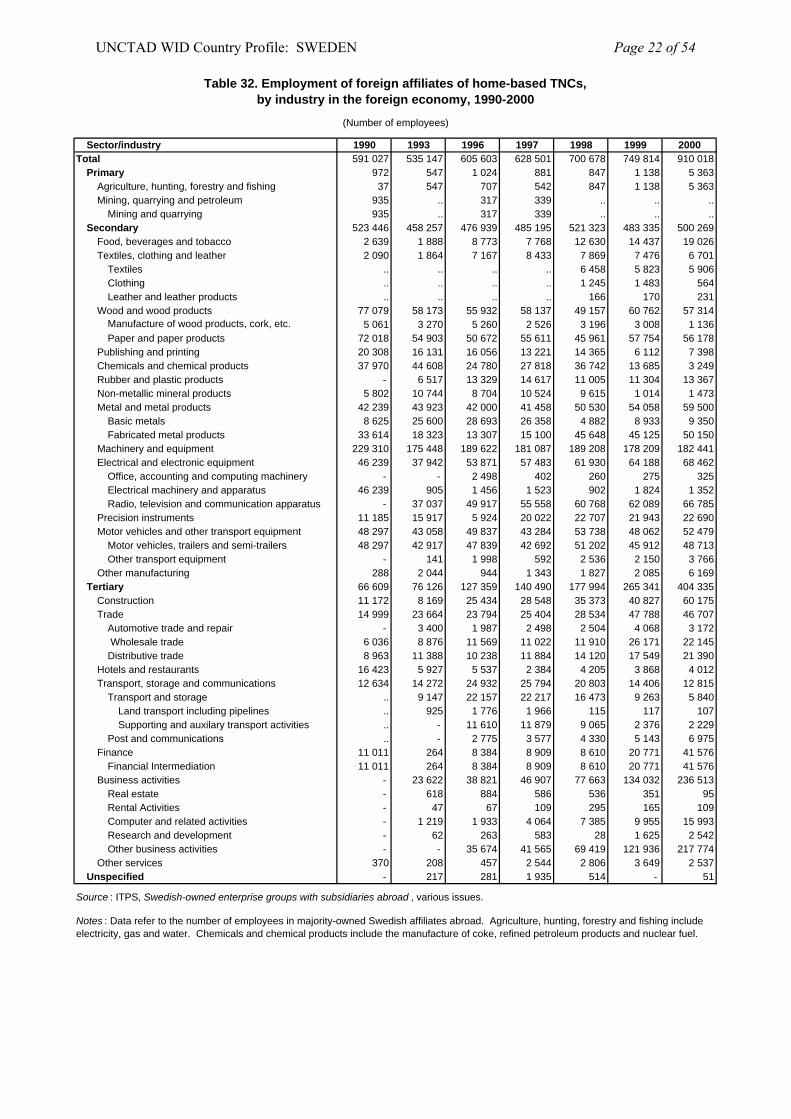
Table 32. Employment of foreign affiliates of home-based TNCs, by industry in the foreign economy, 1990-2000
(Number of employees)
Sector/industry 1990 1993 1996 1997 1998 1999 2000Total 591 027 535 147 605 603 628 501 700 678 749 814 910 018
Primary 972 547 1 024 881 847 1 138 5 363Agriculture, hunting, forestry and fishing 37 547 707 542 847 1 138 5 363Mining, quarrying and petroleum 935 .. 317 339 .. .. ..
Mining and quarrying 935 .. 317 339 .. .. ..Secondary 523 446 458 257 476 939 485 195 521 323 483 335 500 269
Food, beverages and tobacco 2 639 1 888 8 773 7 768 12 630 14 437 19 026Textiles, clothing and leather 2 090 1 864 7 167 8 433 7 869 7 476 6 701
Textiles .. .. .. .. 6 458 5 823 5 906Clothing .. .. .. .. 1 245 1 483 564Leather and leather products .. .. .. .. 166 170 231
Wood and wood products 77 079 58 173 55 932 58 137 49 157 60 762 57 314Manufacture of wood products, cork, etc. 5 061 3 270 5 260 2 526 3 196 3 008 1 136Paper and paper products 72 018 54 903 50 672 55 611 45 961 57 754 56 178
Publishing and printing 20 308 16 131 16 056 13 221 14 365 6 112 7 398Chemicals and chemical products 37 970 44 608 24 780 27 818 36 742 13 685 3 249Rubber and plastic products - 6 517 13 329 14 617 11 005 11 304 13 367Non-metallic mineral products 5 802 10 744 8 704 10 524 9 615 1 014 1 473Metal and metal products 42 239 43 923 42 000 41 458 50 530 54 058 59 500
Basic metals 8 625 25 600 28 693 26 358 4 882 8 933 9 350Fabricated metal products 33 614 18 323 13 307 15 100 45 648 45 125 50 150
Machinery and equipment 229 310 175 448 189 622 181 087 189 208 178 209 182 441Electrical and electronic equipment 46 239 37 942 53 871 57 483 61 930 64 188 68 462
Office, accounting and computing machinery - - 2 498 402 260 275 325Electrical machinery and apparatus 46 239 905 1 456 1 523 902 1 824 1 352Radio, television and communication apparatus - 37 037 49 917 55 558 60 768 62 089 66 785
Precision instruments 11 185 15 917 5 924 20 022 22 707 21 943 22 690Motor vehicles and other transport equipment 48 297 43 058 49 837 43 284 53 738 48 062 52 479
Motor vehicles, trailers and semi-trailers 48 297 42 917 47 839 42 692 51 202 45 912 48 713Other transport equipment - 141 1 998 592 2 536 2 150 3 766
Other manufacturing 288 2 044 944 1 343 1 827 2 085 6 169Tertiary 66 609 76 126 127 359 140 490 177 994 265 341 404 335
Construction 11 172 8 169 25 434 28 548 35 373 40 827 60 175Trade 14 999 23 664 23 794 25 404 28 534 47 788 46 707
Automotive trade and repair - 3 400 1 987 2 498 2 504 4 068 3 172 Wholesale trade 6 036 8 876 11 569 11 022 11 910 26 171 22 145Distributive trade 8 963 11 388 10 238 11 884 14 120 17 549 21 390
Hotels and restaurants 16 423 5 927 5 537 2 384 4 205 3 868 4 012Transport, storage and communications 12 634 14 272 24 932 25 794 20 803 14 406 12 815
Transport and storage .. 9 147 22 157 22 217 16 473 9 263 5 840Land transport including pipelines .. 925 1 776 1 966 115 117 107Supporting and auxilary transport activities .. - 11 610 11 879 9 065 2 376 2 229
Post and communications .. - 2 775 3 577 4 330 5 143 6 975Finance 11 011 264 8 384 8 909 8 610 20 771 41 576
Financial Intermediation 11 011 264 8 384 8 909 8 610 20 771 41 576Business activities - 23 622 38 821 46 907 77 663 134 032 236 513
Real estate - 618 884 586 536 351 95Rental Activities - 47 67 109 295 165 109Computer and related activities - 1 219 1 933 4 064 7 385 9 955 15 993Research and development - 62 263 583 28 1 625 2 542Other business activities - - 35 674 41 565 69 419 121 936 217 774
Other services 370 208 457 2 544 2 806 3 649 2 537Unspecified - 217 281 1 935 514 - 51
Source : ITPS, Swedish-owned enterprise groups with subsidiaries abroad , various issues.
Notes : Data refer to the number of employees in majority-owned Swedish affiliates abroad. Agriculture, hunting, forestry and fishing include electricity, gas and water. Chemicals and chemical products include the manufacture of coke, refined petroleum products and nuclear fuel.
UNCTAD WID Country Profile: SWEDEN Page 22 of 54
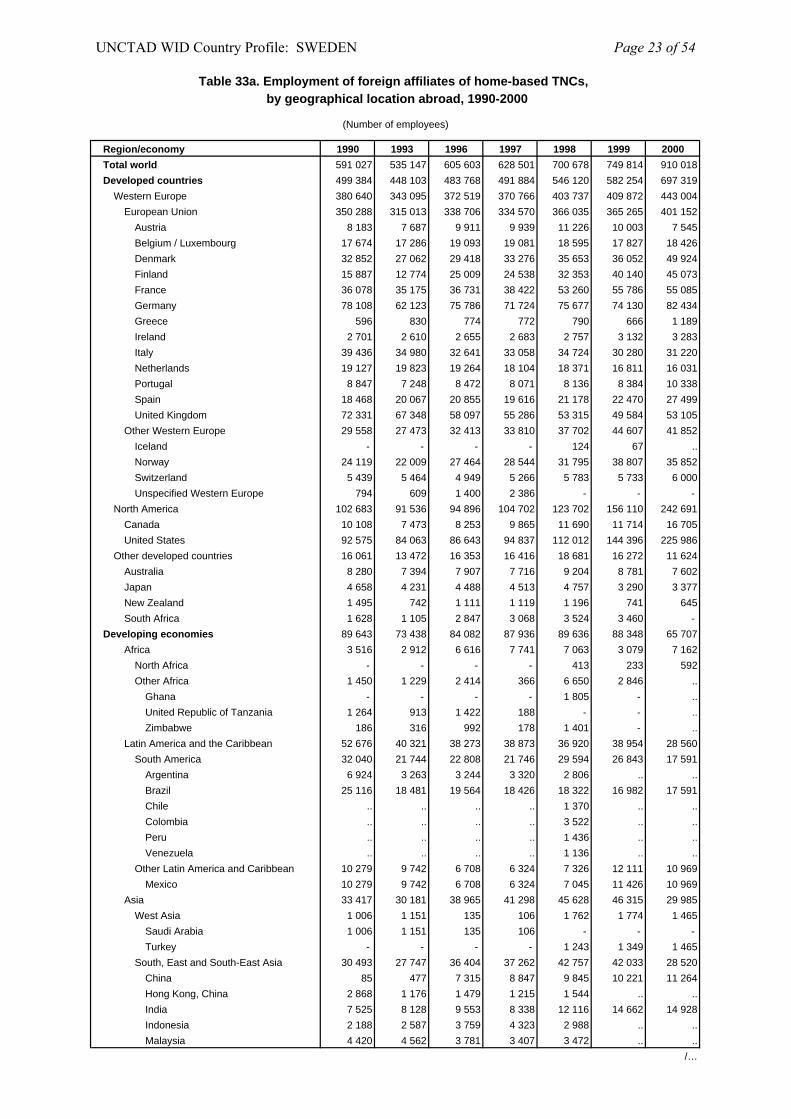
Table 33a. Employment of foreign affiliates of home-based TNCs, by geographical location abroad, 1990-2000
(Number of employees)
Region/economy 1990 1993 1996 1997 1998 1999 2000Total world 591 027 535 147 605 603 628 501 700 678 749 814 910 018Developed countries 499 384 448 103 483 768 491 884 546 120 582 254 697 319
Western Europe 380 640 343 095 372 519 370 766 403 737 409 872 443 004European Union 350 288 315 013 338 706 334 570 366 035 365 265 401 152
Austria 8 183 7 687 9 911 9 939 11 226 10 003 7 545Belgium / Luxembourg 17 674 17 286 19 093 19 081 18 595 17 827 18 426Denmark 32 852 27 062 29 418 33 276 35 653 36 052 49 924Finland 15 887 12 774 25 009 24 538 32 353 40 140 45 073France 36 078 35 175 36 731 38 422 53 260 55 786 55 085Germany 78 108 62 123 75 786 71 724 75 677 74 130 82 434Greece 596 830 774 772 790 666 1 189Ireland 2 701 2 610 2 655 2 683 2 757 3 132 3 283Italy 39 436 34 980 32 641 33 058 34 724 30 280 31 220Netherlands 19 127 19 823 19 264 18 104 18 371 16 811 16 031Portugal 8 847 7 248 8 472 8 071 8 136 8 384 10 338Spain 18 468 20 067 20 855 19 616 21 178 22 470 27 499United Kingdom 72 331 67 348 58 097 55 286 53 315 49 584 53 105
Other Western Europe 29 558 27 473 32 413 33 810 37 702 44 607 41 852Iceland - - - - 124 67 ..Norway 24 119 22 009 27 464 28 544 31 795 38 807 35 852Switzerland 5 439 5 464 4 949 5 266 5 783 5 733 6 000Unspecified Western Europe 794 609 1 400 2 386 - - -
North America 102 683 91 536 94 896 104 702 123 702 156 110 242 691Canada 10 108 7 473 8 253 9 865 11 690 11 714 16 705United States 92 575 84 063 86 643 94 837 112 012 144 396 225 986
Other developed countries 16 061 13 472 16 353 16 416 18 681 16 272 11 624Australia 8 280 7 394 7 907 7 716 9 204 8 781 7 602Japan 4 658 4 231 4 488 4 513 4 757 3 290 3 377New Zealand 1 495 742 1 111 1 119 1 196 741 645South Africa 1 628 1 105 2 847 3 068 3 524 3 460 -
Developing economies 89 643 73 438 84 082 87 936 89 636 88 348 65 707Africa 3 516 2 912 6 616 7 741 7 063 3 079 7 162
North Africa - - - - 413 233 592Other Africa 1 450 1 229 2 414 366 6 650 2 846 ..
Ghana - - - - 1 805 - ..United Republic of Tanzania 1 264 913 1 422 188 - - ..Zimbabwe 186 316 992 178 1 401 - ..
Latin America and the Caribbean 52 676 40 321 38 273 38 873 36 920 38 954 28 560South America 32 040 21 744 22 808 21 746 29 594 26 843 17 591
Argentina 6 924 3 263 3 244 3 320 2 806 .. ..Brazil 25 116 18 481 19 564 18 426 18 322 16 982 17 591Chile .. .. .. .. 1 370 .. ..Colombia .. .. .. .. 3 522 .. ..Peru .. .. .. .. 1 436 .. ..Venezuela .. .. .. .. 1 136 .. ..
Other Latin America and Caribbean 10 279 9 742 6 708 6 324 7 326 12 111 10 969Mexico 10 279 9 742 6 708 6 324 7 045 11 426 10 969
Asia 33 417 30 181 38 965 41 298 45 628 46 315 29 985West Asia 1 006 1 151 135 106 1 762 1 774 1 465
Saudi Arabia 1 006 1 151 135 106 - - - Turkey - - - - 1 243 1 349 1 465
South, East and South-East Asia 30 493 27 747 36 404 37 262 42 757 42 033 28 520China 85 477 7 315 8 847 9 845 10 221 11 264Hong Kong, China 2 868 1 176 1 479 1 215 1 544 .. ..India 7 525 8 128 9 553 8 338 12 116 14 662 14 928Indonesia 2 188 2 587 3 759 4 323 2 988 .. ..Malaysia 4 420 4 562 3 781 3 407 3 472 .. ..
/…
UNCTAD WID Country Profile: SWEDEN Page 23 of 54
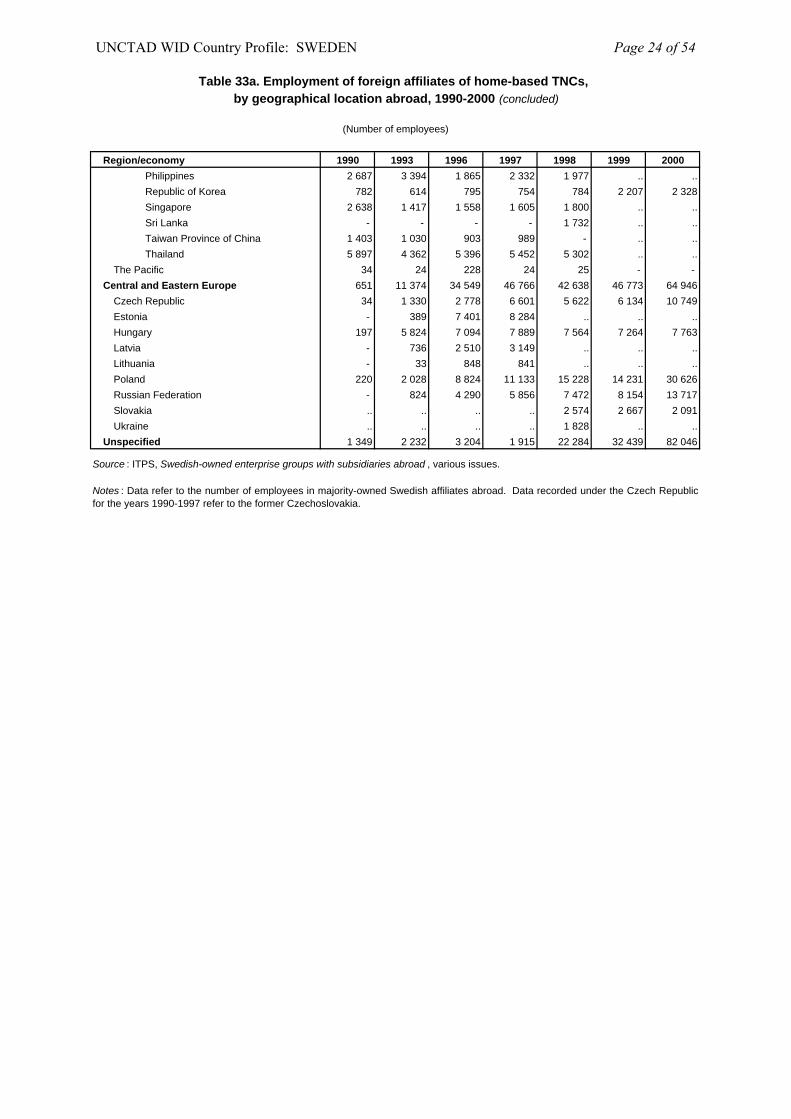
Table 33a. Employment of foreign affiliates of home-based TNCs, by geographical location abroad, 1990-2000 (concluded)
(Number of employees)
Region/economy 1990 1993 1996 1997 1998 1999 2000Philippines 2 687 3 394 1 865 2 332 1 977 .. ..Republic of Korea 782 614 795 754 784 2 207 2 328Singapore 2 638 1 417 1 558 1 605 1 800 .. ..Sri Lanka - - - - 1 732 .. ..Taiwan Province of China 1 403 1 030 903 989 - .. ..Thailand 5 897 4 362 5 396 5 452 5 302 .. ..
The Pacific 34 24 228 24 25 - - Central and Eastern Europe 651 11 374 34 549 46 766 42 638 46 773 64 946
Czech Republic 34 1 330 2 778 6 601 5 622 6 134 10 749Estonia - 389 7 401 8 284 .. .. ..Hungary 197 5 824 7 094 7 889 7 564 7 264 7 763Latvia - 736 2 510 3 149 .. .. ..Lithuania - 33 848 841 .. .. ..Poland 220 2 028 8 824 11 133 15 228 14 231 30 626Russian Federation - 824 4 290 5 856 7 472 8 154 13 717Slovakia .. .. .. .. 2 574 2 667 2 091Ukraine .. .. .. .. 1 828 .. ..
Unspecified 1 349 2 232 3 204 1 915 22 284 32 439 82 046
Source : ITPS, Swedish-owned enterprise groups with subsidiaries abroad , various issues.
Notes : Data refer to the number of employees in majority-owned Swedish affiliates abroad. Data recorded under the Czech Republicfor the years 1990-1997 refer to the former Czechoslovakia.
UNCTAD WID Country Profile: SWEDEN Page 24 of 54
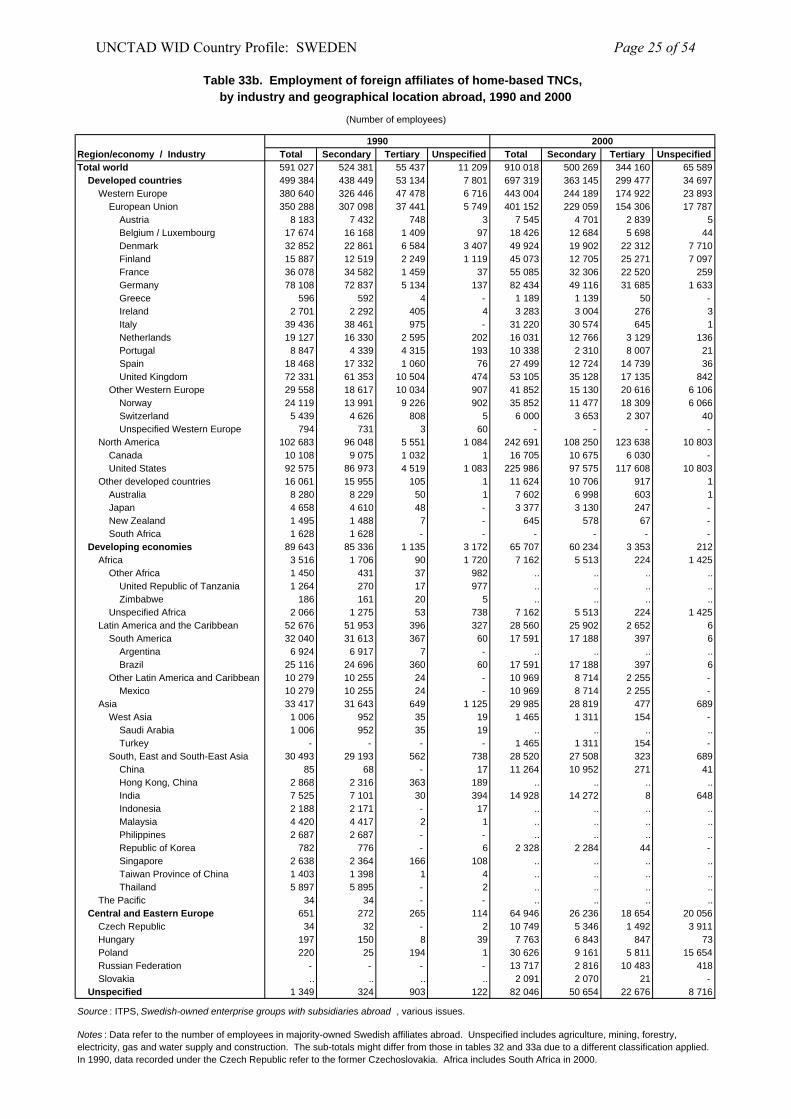
Table 33b. Employment of foreign affiliates of home-based TNCs, by industry and geographical location abroad, 1990 and 2000
(Number of employees)
1990 2000Region/economy / Industry Total Secondary Tertiary Unspecified Total Secondary Tertiary UnspecifiedTotal world 591 027 524 381 55 437 11 209 910 018 500 269 344 160 65 589
Developed countries 499 384 438 449 53 134 7 801 697 319 363 145 299 477 34 697Western Europe 380 640 326 446 47 478 6 716 443 004 244 189 174 922 23 893
European Union 350 288 307 098 37 441 5 749 401 152 229 059 154 306 17 787Austria 8 183 7 432 748 3 7 545 4 701 2 839 5Belgium / Luxembourg 17 674 16 168 1 409 97 18 426 12 684 5 698 44Denmark 32 852 22 861 6 584 3 407 49 924 19 902 22 312 7 710Finland 15 887 12 519 2 249 1 119 45 073 12 705 25 271 7 097France 36 078 34 582 1 459 37 55 085 32 306 22 520 259Germany 78 108 72 837 5 134 137 82 434 49 116 31 685 1 633Greece 596 592 4 - 1 189 1 139 50 - Ireland 2 701 2 292 405 4 3 283 3 004 276 3Italy 39 436 38 461 975 - 31 220 30 574 645 1Netherlands 19 127 16 330 2 595 202 16 031 12 766 3 129 136Portugal 8 847 4 339 4 315 193 10 338 2 310 8 007 21Spain 18 468 17 332 1 060 76 27 499 12 724 14 739 36United Kingdom 72 331 61 353 10 504 474 53 105 35 128 17 135 842
Other Western Europe 29 558 18 617 10 034 907 41 852 15 130 20 616 6 106Norway 24 119 13 991 9 226 902 35 852 11 477 18 309 6 066Switzerland 5 439 4 626 808 5 6 000 3 653 2 307 40Unspecified Western Europe 794 731 3 60 - - - -
North America 102 683 96 048 5 551 1 084 242 691 108 250 123 638 10 803Canada 10 108 9 075 1 032 1 16 705 10 675 6 030 - United States 92 575 86 973 4 519 1 083 225 986 97 575 117 608 10 803
Other developed countries 16 061 15 955 105 1 11 624 10 706 917 1Australia 8 280 8 229 50 1 7 602 6 998 603 1Japan 4 658 4 610 48 - 3 377 3 130 247 - New Zealand 1 495 1 488 7 - 645 578 67 - South Africa 1 628 1 628 - - - - - -
Developing economies 89 643 85 336 1 135 3 172 65 707 60 234 3 353 212Africa 3 516 1 706 90 1 720 7 162 5 513 224 1 425
Other Africa 1 450 431 37 982 .. .. .. ..United Republic of Tanzania 1 264 270 17 977 .. .. .. ..Zimbabwe 186 161 20 5 .. .. .. ..
Unspecified Africa 2 066 1 275 53 738 7 162 5 513 224 1 425Latin America and the Caribbean 52 676 51 953 396 327 28 560 25 902 2 652 6
South America 32 040 31 613 367 60 17 591 17 188 397 6Argentina 6 924 6 917 7 - .. .. .. ..Brazil 25 116 24 696 360 60 17 591 17 188 397 6
Other Latin America and Caribbean 10 279 10 255 24 - 10 969 8 714 2 255 - Mexico 10 279 10 255 24 - 10 969 8 714 2 255 -
Asia 33 417 31 643 649 1 125 29 985 28 819 477 689West Asia 1 006 952 35 19 1 465 1 311 154 -
Saudi Arabia 1 006 952 35 19 .. .. .. ..Turkey - - - - 1 465 1 311 154 -
South, East and South-East Asia 30 493 29 193 562 738 28 520 27 508 323 689China 85 68 - 17 11 264 10 952 271 41Hong Kong, China 2 868 2 316 363 189 .. .. .. ..India 7 525 7 101 30 394 14 928 14 272 8 648Indonesia 2 188 2 171 - 17 .. .. .. ..Malaysia 4 420 4 417 2 1 .. .. .. ..Philippines 2 687 2 687 - - .. .. .. ..Republic of Korea 782 776 - 6 2 328 2 284 44 - Singapore 2 638 2 364 166 108 .. .. .. ..Taiwan Province of China 1 403 1 398 1 4 .. .. .. ..Thailand 5 897 5 895 - 2 .. .. .. ..
The Pacific 34 34 - - .. .. .. ..Central and Eastern Europe 651 272 265 114 64 946 26 236 18 654 20 056
Czech Republic 34 32 - 2 10 749 5 346 1 492 3 911Hungary 197 150 8 39 7 763 6 843 847 73Poland 220 25 194 1 30 626 9 161 5 811 15 654Russian Federation - - - - 13 717 2 816 10 483 418Slovakia .. .. .. .. 2 091 2 070 21 -
Unspecified 1 349 324 903 122 82 046 50 654 22 676 8 716
Source : ITPS, Swedish-owned enterprise groups with subsidiaries abroad , various issues.
Notes : Data refer to the number of employees in majority-owned Swedish affiliates abroad. Unspecified includes agriculture, mining, forestry, electricity, gas and water supply and construction. The sub-totals might differ from those in tables 32 and 33a due to a different classification applied. In 1990, data recorded under the Czech Republic refer to the former Czechoslovakia. Africa includes South Africa in 2000.
UNCTAD WID Country Profile: SWEDEN Page 25 of 54
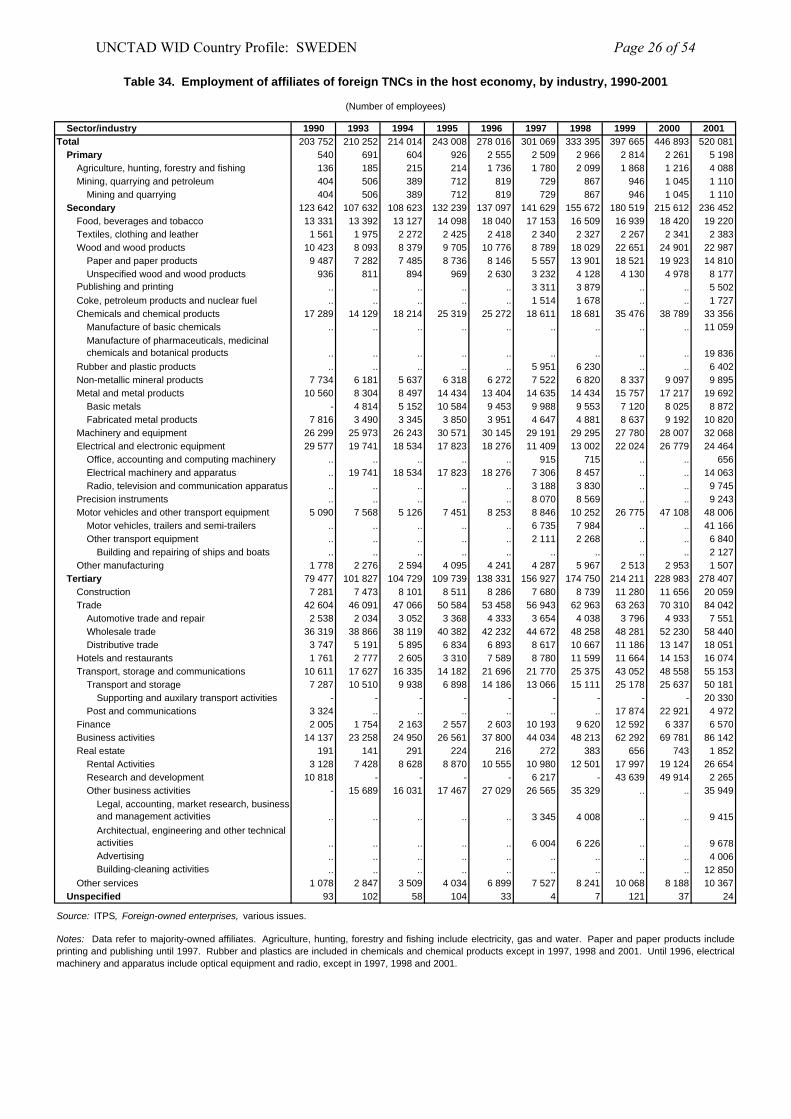
Table 34. Employment of affiliates of foreign TNCs in the host economy, by industry, 1990-2001
(Number of employees)
Sector/industry 1990 1993 1994 1995 1996 1997 1998 1999 2000 2001Total 203 752 210 252 214 014 243 008 278 016 301 069 333 395 397 665 446 893 520 081
Primary 540 691 604 926 2 555 2 509 2 966 2 814 2 261 5 198Agriculture, hunting, forestry and fishing 136 185 215 214 1 736 1 780 2 099 1 868 1 216 4 088Mining, quarrying and petroleum 404 506 389 712 819 729 867 946 1 045 1 110
Mining and quarrying 404 506 389 712 819 729 867 946 1 045 1 110Secondary 123 642 107 632 108 623 132 239 137 097 141 629 155 672 180 519 215 612 236 452
Food, beverages and tobacco 13 331 13 392 13 127 14 098 18 040 17 153 16 509 16 939 18 420 19 220Textiles, clothing and leather 1 561 1 975 2 272 2 425 2 418 2 340 2 327 2 267 2 341 2 383Wood and wood products 10 423 8 093 8 379 9 705 10 776 8 789 18 029 22 651 24 901 22 987
Paper and paper products 9 487 7 282 7 485 8 736 8 146 5 557 13 901 18 521 19 923 14 810Unspecified wood and wood products 936 811 894 969 2 630 3 232 4 128 4 130 4 978 8 177
Publishing and printing .. .. .. .. .. 3 311 3 879 .. .. 5 502Coke, petroleum products and nuclear fuel .. .. .. .. .. 1 514 1 678 .. .. 1 727Chemicals and chemical products 17 289 14 129 18 214 25 319 25 272 18 611 18 681 35 476 38 789 33 356
Manufacture of basic chemicals .. .. .. .. .. .. .. .. .. 11 059Manufacture of pharmaceuticals, medicinal chemicals and botanical products .. .. .. .. .. .. .. .. .. 19 836
Rubber and plastic products .. .. .. .. .. 5 951 6 230 .. .. 6 402Non-metallic mineral products 7 734 6 181 5 637 6 318 6 272 7 522 6 820 8 337 9 097 9 895Metal and metal products 10 560 8 304 8 497 14 434 13 404 14 635 14 434 15 757 17 217 19 692
Basic metals - 4 814 5 152 10 584 9 453 9 988 9 553 7 120 8 025 8 872Fabricated metal products 7 816 3 490 3 345 3 850 3 951 4 647 4 881 8 637 9 192 10 820
Machinery and equipment 26 299 25 973 26 243 30 571 30 145 29 191 29 295 27 780 28 007 32 068Electrical and electronic equipment 29 577 19 741 18 534 17 823 18 276 11 409 13 002 22 024 26 779 24 464
Office, accounting and computing machinery .. .. .. .. .. 915 715 .. .. 656Electrical machinery and apparatus .. 19 741 18 534 17 823 18 276 7 306 8 457 .. .. 14 063Radio, television and communication apparatus .. .. .. .. .. 3 188 3 830 .. .. 9 745
Precision instruments .. .. .. .. .. 8 070 8 569 .. .. 9 243Motor vehicles and other transport equipment 5 090 7 568 5 126 7 451 8 253 8 846 10 252 26 775 47 108 48 006
Motor vehicles, trailers and semi-trailers .. .. .. .. .. 6 735 7 984 .. .. 41 166Other transport equipment .. .. .. .. .. 2 111 2 268 .. .. 6 840
Building and repairing of ships and boats .. .. .. .. .. .. .. .. .. 2 127Other manufacturing 1 778 2 276 2 594 4 095 4 241 4 287 5 967 2 513 2 953 1 507
Tertiary 79 477 101 827 104 729 109 739 138 331 156 927 174 750 214 211 228 983 278 407Construction 7 281 7 473 8 101 8 511 8 286 7 680 8 739 11 280 11 656 20 059Trade 42 604 46 091 47 066 50 584 53 458 56 943 62 963 63 263 70 310 84 042
Automotive trade and repair 2 538 2 034 3 052 3 368 4 333 3 654 4 038 3 796 4 933 7 551Wholesale trade 36 319 38 866 38 119 40 382 42 232 44 672 48 258 48 281 52 230 58 440Distributive trade 3 747 5 191 5 895 6 834 6 893 8 617 10 667 11 186 13 147 18 051
Hotels and restaurants 1 761 2 777 2 605 3 310 7 589 8 780 11 599 11 664 14 153 16 074Transport, storage and communications 10 611 17 627 16 335 14 182 21 696 21 770 25 375 43 052 48 558 55 153
Transport and storage 7 287 10 510 9 938 6 898 14 186 13 066 15 111 25 178 25 637 50 181Supporting and auxilary transport activities - - - - - - - - - 20 330
Post and communications 3 324 .. .. .. .. .. .. 17 874 22 921 4 972Finance 2 005 1 754 2 163 2 557 2 603 10 193 9 620 12 592 6 337 6 570Business activities 14 137 23 258 24 950 26 561 37 800 44 034 48 213 62 292 69 781 86 142Real estate 191 141 291 224 216 272 383 656 743 1 852
Rental Activities 3 128 7 428 8 628 8 870 10 555 10 980 12 501 17 997 19 124 26 654Research and development 10 818 - - - - 6 217 - 43 639 49 914 2 265Other business activities - 15 689 16 031 17 467 27 029 26 565 35 329 .. .. 35 949
Legal, accounting, market research, business and management activities .. .. .. .. .. 3 345 4 008 .. .. 9 415Architectual, engineering and other technical activities .. .. .. .. .. 6 004 6 226 .. .. 9 678Advertising .. .. .. .. .. .. .. .. .. 4 006Building-cleaning activities .. .. .. .. .. .. .. .. .. 12 850
Other services 1 078 2 847 3 509 4 034 6 899 7 527 8 241 10 068 8 188 10 367Unspecified 93 102 58 104 33 4 7 121 37 24
Source: ITPS, Foreign-owned enterprises, various issues.
Notes: Data refer to majority-owned affiliates. Agriculture, hunting, forestry and fishing include electricity, gas and water. Paper and paper products includeprinting and publishing until 1997. Rubber and plastics are included in chemicals and chemical products except in 1997, 1998 and 2001. Until 1996, electricalmachinery and apparatus include optical equipment and radio, except in 1997, 1998 and 2001.
UNCTAD WID Country Profile: SWEDEN Page 26 of 54
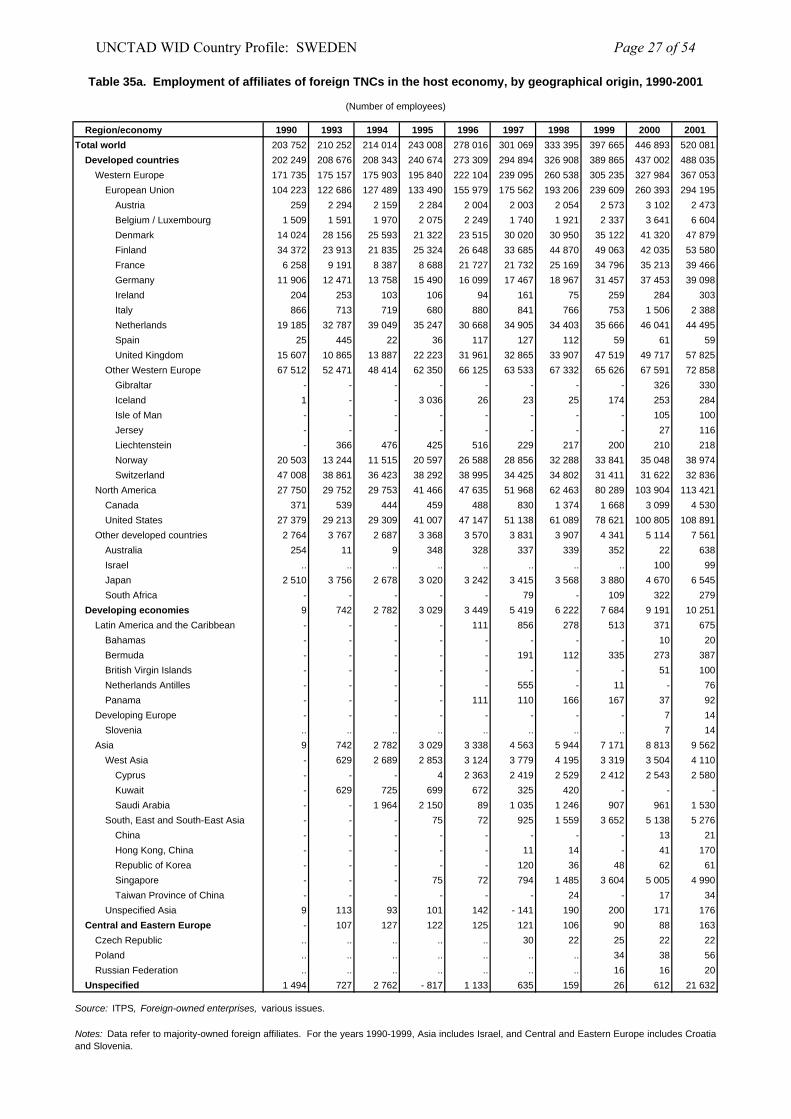
Table 35a. Employment of affiliates of foreign TNCs in the host economy, by geographical origin, 1990-2001
(Number of employees)
Region/economy 1990 1993 1994 1995 1996 1997 1998 1999 2000 2001Total world 203 752 210 252 214 014 243 008 278 016 301 069 333 395 397 665 446 893 520 081
Developed countries 202 249 208 676 208 343 240 674 273 309 294 894 326 908 389 865 437 002 488 035Western Europe 171 735 175 157 175 903 195 840 222 104 239 095 260 538 305 235 327 984 367 053
European Union 104 223 122 686 127 489 133 490 155 979 175 562 193 206 239 609 260 393 294 195Austria 259 2 294 2 159 2 284 2 004 2 003 2 054 2 573 3 102 2 473Belgium / Luxembourg 1 509 1 591 1 970 2 075 2 249 1 740 1 921 2 337 3 641 6 604Denmark 14 024 28 156 25 593 21 322 23 515 30 020 30 950 35 122 41 320 47 879Finland 34 372 23 913 21 835 25 324 26 648 33 685 44 870 49 063 42 035 53 580France 6 258 9 191 8 387 8 688 21 727 21 732 25 169 34 796 35 213 39 466Germany 11 906 12 471 13 758 15 490 16 099 17 467 18 967 31 457 37 453 39 098Ireland 204 253 103 106 94 161 75 259 284 303Italy 866 713 719 680 880 841 766 753 1 506 2 388Netherlands 19 185 32 787 39 049 35 247 30 668 34 905 34 403 35 666 46 041 44 495Spain 25 445 22 36 117 127 112 59 61 59United Kingdom 15 607 10 865 13 887 22 223 31 961 32 865 33 907 47 519 49 717 57 825
Other Western Europe 67 512 52 471 48 414 62 350 66 125 63 533 67 332 65 626 67 591 72 858Gibraltar - - - - - - - - 326 330Iceland 1 - - 3 036 26 23 25 174 253 284Isle of Man - - - - - - - - 105 100Jersey - - - - - - - - 27 116Liechtenstein - 366 476 425 516 229 217 200 210 218Norway 20 503 13 244 11 515 20 597 26 588 28 856 32 288 33 841 35 048 38 974Switzerland 47 008 38 861 36 423 38 292 38 995 34 425 34 802 31 411 31 622 32 836
North America 27 750 29 752 29 753 41 466 47 635 51 968 62 463 80 289 103 904 113 421Canada 371 539 444 459 488 830 1 374 1 668 3 099 4 530United States 27 379 29 213 29 309 41 007 47 147 51 138 61 089 78 621 100 805 108 891
Other developed countries 2 764 3 767 2 687 3 368 3 570 3 831 3 907 4 341 5 114 7 561Australia 254 11 9 348 328 337 339 352 22 638Israel .. .. .. .. .. .. .. .. 100 99Japan 2 510 3 756 2 678 3 020 3 242 3 415 3 568 3 880 4 670 6 545South Africa - - - - - 79 - 109 322 279
Developing economies 9 742 2 782 3 029 3 449 5 419 6 222 7 684 9 191 10 251Latin America and the Caribbean - - - - 111 856 278 513 371 675
Bahamas - - - - - - - - 10 20Bermuda - - - - - 191 112 335 273 387British Virgin Islands - - - - - - - - 51 100Netherlands Antilles - - - - - 555 - 11 - 76Panama - - - - 111 110 166 167 37 92
Developing Europe - - - - - - - - 7 14Slovenia .. .. .. .. .. .. .. .. 7 14
Asia 9 742 2 782 3 029 3 338 4 563 5 944 7 171 8 813 9 562West Asia - 629 2 689 2 853 3 124 3 779 4 195 3 319 3 504 4 110
Cyprus - - - 4 2 363 2 419 2 529 2 412 2 543 2 580Kuwait - 629 725 699 672 325 420 - - -Saudi Arabia - - 1 964 2 150 89 1 035 1 246 907 961 1 530
South, East and South-East Asia - - - 75 72 925 1 559 3 652 5 138 5 276China - - - - - - - - 13 21Hong Kong, China - - - - - 11 14 - 41 170Republic of Korea - - - - - 120 36 48 62 61Singapore - - - 75 72 794 1 485 3 604 5 005 4 990Taiwan Province of China - - - - - - 24 - 17 34
Unspecified Asia 9 113 93 101 142 - 141 190 200 171 176Central and Eastern Europe - 107 127 122 125 121 106 90 88 163
Czech Republic .. .. .. .. .. 30 22 25 22 22Poland .. .. .. .. .. .. .. 34 38 56Russian Federation .. .. .. .. .. .. .. 16 16 20
Unspecified 1 494 727 2 762 - 817 1 133 635 159 26 612 21 632
Source: ITPS, Foreign-owned enterprises, various issues.
Notes: Data refer to majority-owned foreign affiliates. For the years 1990-1999, Asia includes Israel, and Central and Eastern Europe includes Croatiaand Slovenia.
UNCTAD WID Country Profile: SWEDEN Page 27 of 54
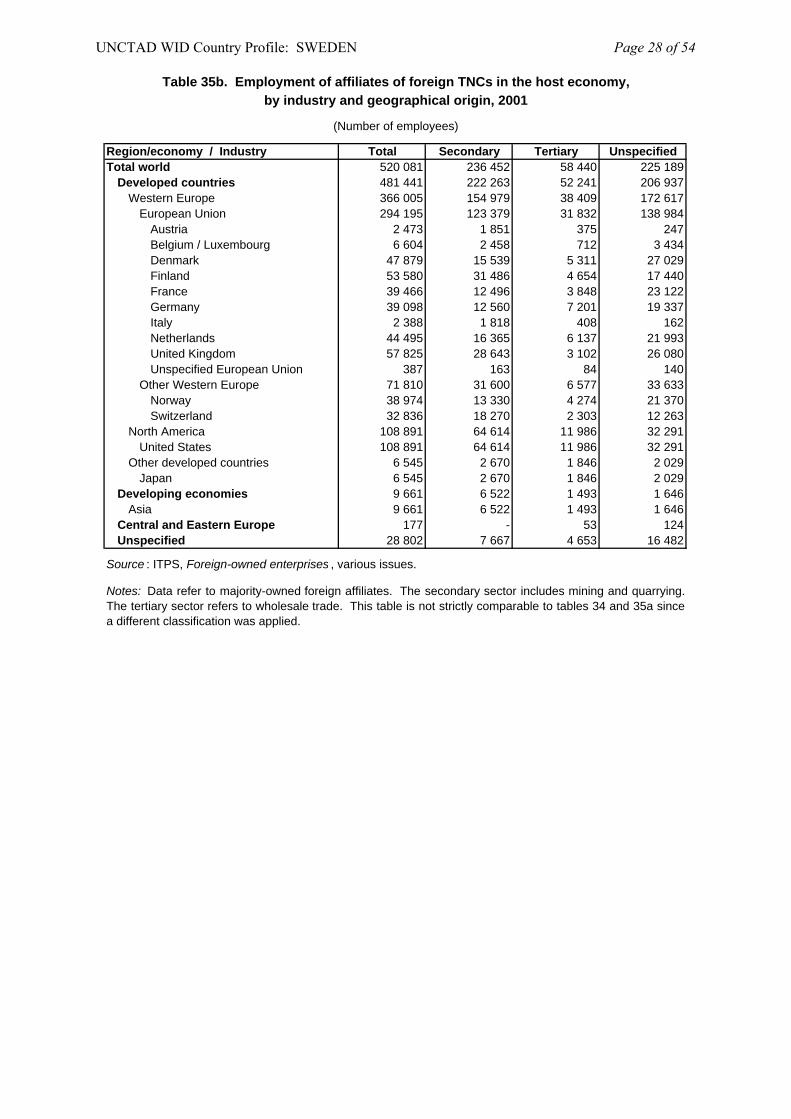
Table 35b. Employment of affiliates of foreign TNCs in the host economy,by industry and geographical origin, 2001
(Number of employees)
Region/economy / Industry Total Secondary Tertiary UnspecifiedTotal world 520 081 236 452 58 440 225 189
Developed countries 481 441 222 263 52 241 206 937Western Europe 366 005 154 979 38 409 172 617
European Union 294 195 123 379 31 832 138 984Austria 2 473 1 851 375 247Belgium / Luxembourg 6 604 2 458 712 3 434Denmark 47 879 15 539 5 311 27 029Finland 53 580 31 486 4 654 17 440France 39 466 12 496 3 848 23 122Germany 39 098 12 560 7 201 19 337Italy 2 388 1 818 408 162Netherlands 44 495 16 365 6 137 21 993United Kingdom 57 825 28 643 3 102 26 080Unspecified European Union 387 163 84 140
Other Western Europe 71 810 31 600 6 577 33 633Norway 38 974 13 330 4 274 21 370Switzerland 32 836 18 270 2 303 12 263
North America 108 891 64 614 11 986 32 291United States 108 891 64 614 11 986 32 291
Other developed countries 6 545 2 670 1 846 2 029Japan 6 545 2 670 1 846 2 029
Developing economies 9 661 6 522 1 493 1 646Asia 9 661 6 522 1 493 1 646
Central and Eastern Europe 177 - 53 124Unspecified 28 802 7 667 4 653 16 482
Source : ITPS, Foreign-owned enterprises , various issues.
Notes: Data refer to majority-owned foreign affiliates. The secondary sector includes mining and quarrying.The tertiary sector refers to wholesale trade. This table is not strictly comparable to tables 34 and 35a sincea different classification was applied.
UNCTAD WID Country Profile: SWEDEN Page 28 of 54
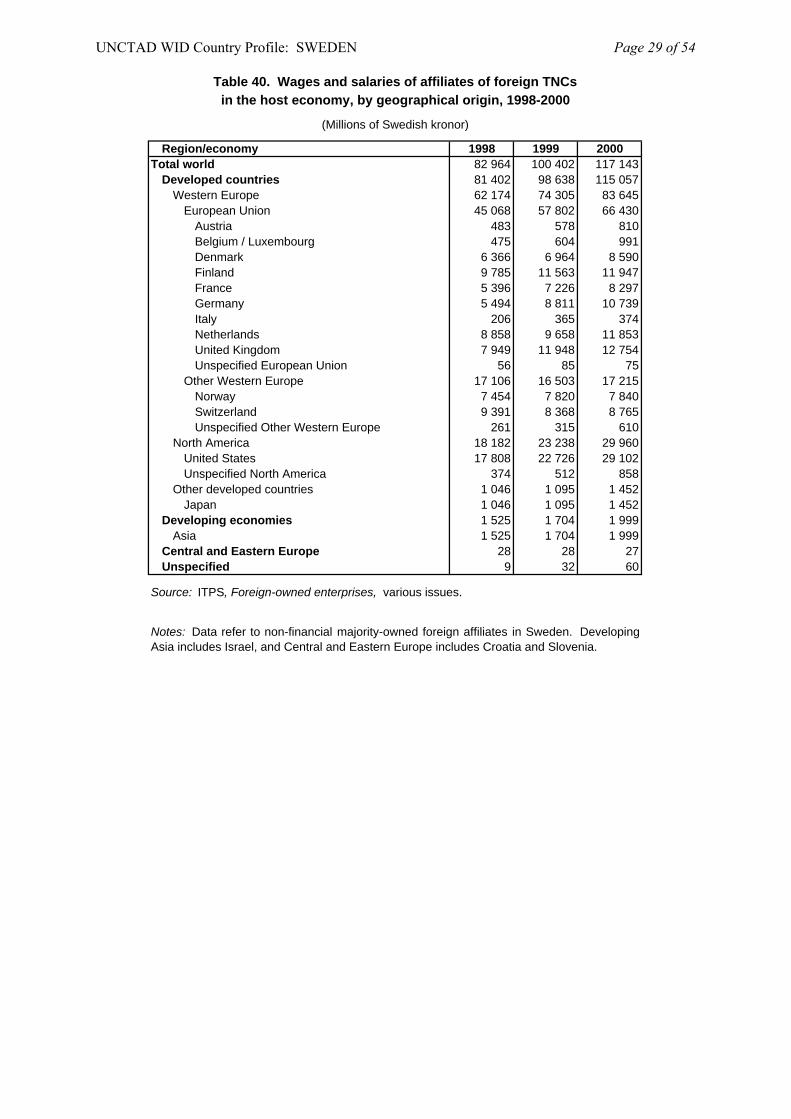
Table 40. Wages and salaries of affiliates of foreign TNCsin the host economy, by geographical origin, 1998-2000
(Millions of Swedish kronor)
Region/economy 1998 1999 2000Total world 82 964 100 402 117 143
Developed countries 81 402 98 638 115 057Western Europe 62 174 74 305 83 645
European Union 45 068 57 802 66 430Austria 483 578 810Belgium / Luxembourg 475 604 991Denmark 6 366 6 964 8 590Finland 9 785 11 563 11 947France 5 396 7 226 8 297Germany 5 494 8 811 10 739Italy 206 365 374Netherlands 8 858 9 658 11 853United Kingdom 7 949 11 948 12 754Unspecified European Union 56 85 75
Other Western Europe 17 106 16 503 17 215Norway 7 454 7 820 7 840Switzerland 9 391 8 368 8 765Unspecified Other Western Europe 261 315 610
North America 18 182 23 238 29 960United States 17 808 22 726 29 102Unspecified North America 374 512 858
Other developed countries 1 046 1 095 1 452Japan 1 046 1 095 1 452
Developing economies 1 525 1 704 1 999Asia 1 525 1 704 1 999
Central and Eastern Europe 28 28 27Unspecified 9 32 60
Source: ITPS, Foreign-owned enterprises, various issues.
Notes: Data refer to non-financial majority-owned foreign affiliates in Sweden. DevelopingAsia includes Israel, and Central and Eastern Europe includes Croatia and Slovenia.
UNCTAD WID Country Profile: SWEDEN Page 29 of 54
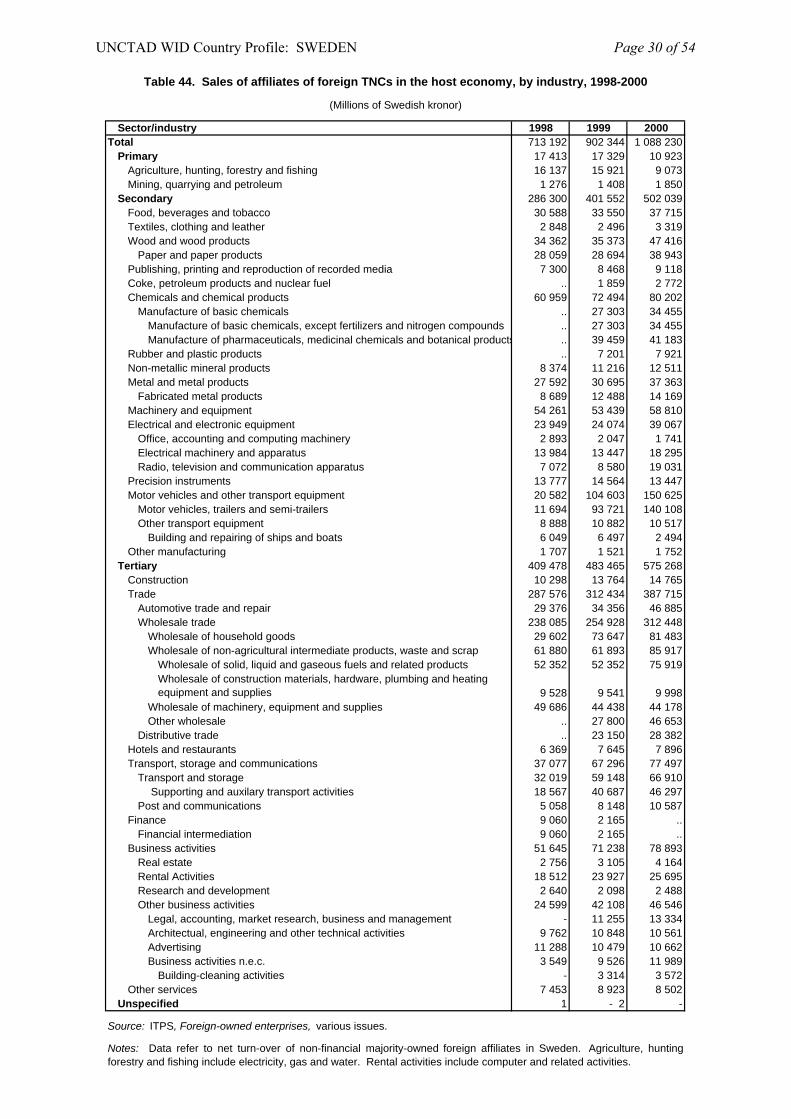
Table 44. Sales of affiliates of foreign TNCs in the host economy, by industry, 1998-2000
(Millions of Swedish kronor)
Sector/industry 1998 1999 2000Total 713 192 902 344 1 088 230
Primary 17 413 17 329 10 923Agriculture, hunting, forestry and fishing 16 137 15 921 9 073Mining, quarrying and petroleum 1 276 1 408 1 850
Secondary 286 300 401 552 502 039Food, beverages and tobacco 30 588 33 550 37 715Textiles, clothing and leather 2 848 2 496 3 319Wood and wood products 34 362 35 373 47 416
Paper and paper products 28 059 28 694 38 943Publishing, printing and reproduction of recorded media 7 300 8 468 9 118Coke, petroleum products and nuclear fuel .. 1 859 2 772Chemicals and chemical products 60 959 72 494 80 202
Manufacture of basic chemicals .. 27 303 34 455Manufacture of basic chemicals, except fertilizers and nitrogen compounds .. 27 303 34 455Manufacture of pharmaceuticals, medicinal chemicals and botanical products .. 39 459 41 183
Rubber and plastic products .. 7 201 7 921Non-metallic mineral products 8 374 11 216 12 511Metal and metal products 27 592 30 695 37 363
Fabricated metal products 8 689 12 488 14 169Machinery and equipment 54 261 53 439 58 810Electrical and electronic equipment 23 949 24 074 39 067
Office, accounting and computing machinery 2 893 2 047 1 741Electrical machinery and apparatus 13 984 13 447 18 295Radio, television and communication apparatus 7 072 8 580 19 031
Precision instruments 13 777 14 564 13 447Motor vehicles and other transport equipment 20 582 104 603 150 625
Motor vehicles, trailers and semi-trailers 11 694 93 721 140 108Other transport equipment 8 888 10 882 10 517
Building and repairing of ships and boats 6 049 6 497 2 494Other manufacturing 1 707 1 521 1 752
Tertiary 409 478 483 465 575 268Construction 10 298 13 764 14 765Trade 287 576 312 434 387 715
Automotive trade and repair 29 376 34 356 46 885Wholesale trade 238 085 254 928 312 448
Wholesale of household goods 29 602 73 647 81 483Wholesale of non-agricultural intermediate products, waste and scrap 61 880 61 893 85 917
Wholesale of solid, liquid and gaseous fuels and related products 52 352 52 352 75 919Wholesale of construction materials, hardware, plumbing and heating equipment and supplies 9 528 9 541 9 998
Wholesale of machinery, equipment and supplies 49 686 44 438 44 178Other wholesale .. 27 800 46 653
Distributive trade .. 23 150 28 382Hotels and restaurants 6 369 7 645 7 896Transport, storage and communications 37 077 67 296 77 497
Transport and storage 32 019 59 148 66 910 Supporting and auxilary transport activities 18 567 40 687 46 297
Post and communications 5 058 8 148 10 587Finance 9 060 2 165 ..
Financial intermediation 9 060 2 165 ..Business activities 51 645 71 238 78 893
Real estate 2 756 3 105 4 164Rental Activities 18 512 23 927 25 695Research and development 2 640 2 098 2 488Other business activities 24 599 42 108 46 546
Legal, accounting, market research, business and management - 11 255 13 334Architectual, engineering and other technical activities 9 762 10 848 10 561Advertising 11 288 10 479 10 662Business activities n.e.c. 3 549 9 526 11 989
Building-cleaning activities - 3 314 3 572Other services 7 453 8 923 8 502
Unspecified 1 - 2 -
Source: ITPS, Foreign-owned enterprises, various issues.
Notes: Data refer to net turn-over of non-financial majority-owned foreign affiliates in Sweden. Agriculture, huntingforestry and fishing include electricity, gas and water. Rental activities include computer and related activities.
UNCTAD WID Country Profile: SWEDEN Page 30 of 54
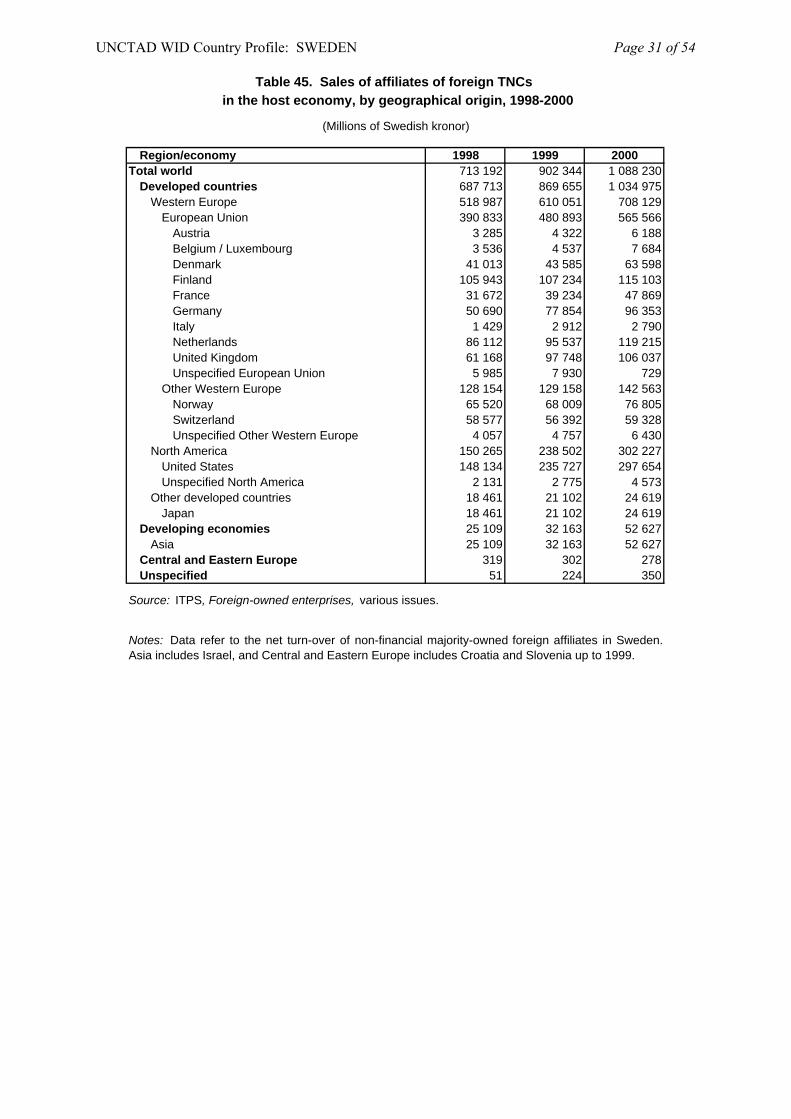
Table 45. Sales of affiliates of foreign TNCs in the host economy, by geographical origin, 1998-2000
(Millions of Swedish kronor)
Region/economy 1998 1999 2000Total world 713 192 902 344 1 088 230
Developed countries 687 713 869 655 1 034 975Western Europe 518 987 610 051 708 129
European Union 390 833 480 893 565 566Austria 3 285 4 322 6 188Belgium / Luxembourg 3 536 4 537 7 684Denmark 41 013 43 585 63 598Finland 105 943 107 234 115 103France 31 672 39 234 47 869Germany 50 690 77 854 96 353Italy 1 429 2 912 2 790Netherlands 86 112 95 537 119 215United Kingdom 61 168 97 748 106 037Unspecified European Union 5 985 7 930 729
Other Western Europe 128 154 129 158 142 563Norway 65 520 68 009 76 805Switzerland 58 577 56 392 59 328Unspecified Other Western Europe 4 057 4 757 6 430
North America 150 265 238 502 302 227United States 148 134 235 727 297 654Unspecified North America 2 131 2 775 4 573
Other developed countries 18 461 21 102 24 619Japan 18 461 21 102 24 619
Developing economies 25 109 32 163 52 627Asia 25 109 32 163 52 627
Central and Eastern Europe 319 302 278Unspecified 51 224 350
Source: ITPS, Foreign-owned enterprises, various issues.
Notes: Data refer to the net turn-over of non-financial majority-owned foreign affiliates in Sweden.Asia includes Israel, and Central and Eastern Europe includes Croatia and Slovenia up to 1999.
UNCTAD WID Country Profile: SWEDEN Page 31 of 54
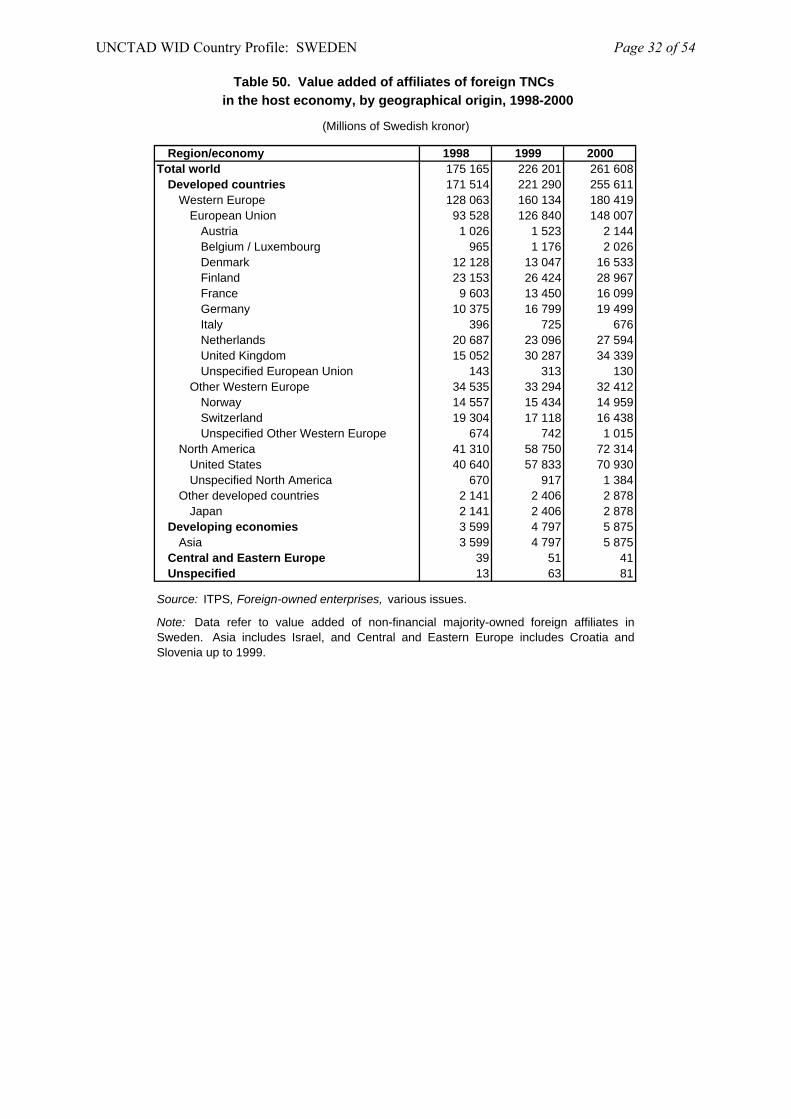
Table 50. Value added of affiliates of foreign TNCs in the host economy, by geographical origin, 1998-2000
(Millions of Swedish kronor)
Region/economy 1998 1999 2000Total world 175 165 226 201 261 608
Developed countries 171 514 221 290 255 611Western Europe 128 063 160 134 180 419
European Union 93 528 126 840 148 007Austria 1 026 1 523 2 144Belgium / Luxembourg 965 1 176 2 026Denmark 12 128 13 047 16 533Finland 23 153 26 424 28 967France 9 603 13 450 16 099Germany 10 375 16 799 19 499Italy 396 725 676Netherlands 20 687 23 096 27 594United Kingdom 15 052 30 287 34 339Unspecified European Union 143 313 130
Other Western Europe 34 535 33 294 32 412Norway 14 557 15 434 14 959Switzerland 19 304 17 118 16 438Unspecified Other Western Europe 674 742 1 015
North America 41 310 58 750 72 314United States 40 640 57 833 70 930Unspecified North America 670 917 1 384
Other developed countries 2 141 2 406 2 878Japan 2 141 2 406 2 878
Developing economies 3 599 4 797 5 875Asia 3 599 4 797 5 875
Central and Eastern Europe 39 51 41Unspecified 13 63 81
Source: ITPS, Foreign-owned enterprises, various issues.
Note: Data refer to value added of non-financial majority-owned foreign affiliates inSweden. Asia includes Israel, and Central and Eastern Europe includes Croatia andSlovenia up to 1999.
UNCTAD WID Country Profile: SWEDEN Page 32 of 54
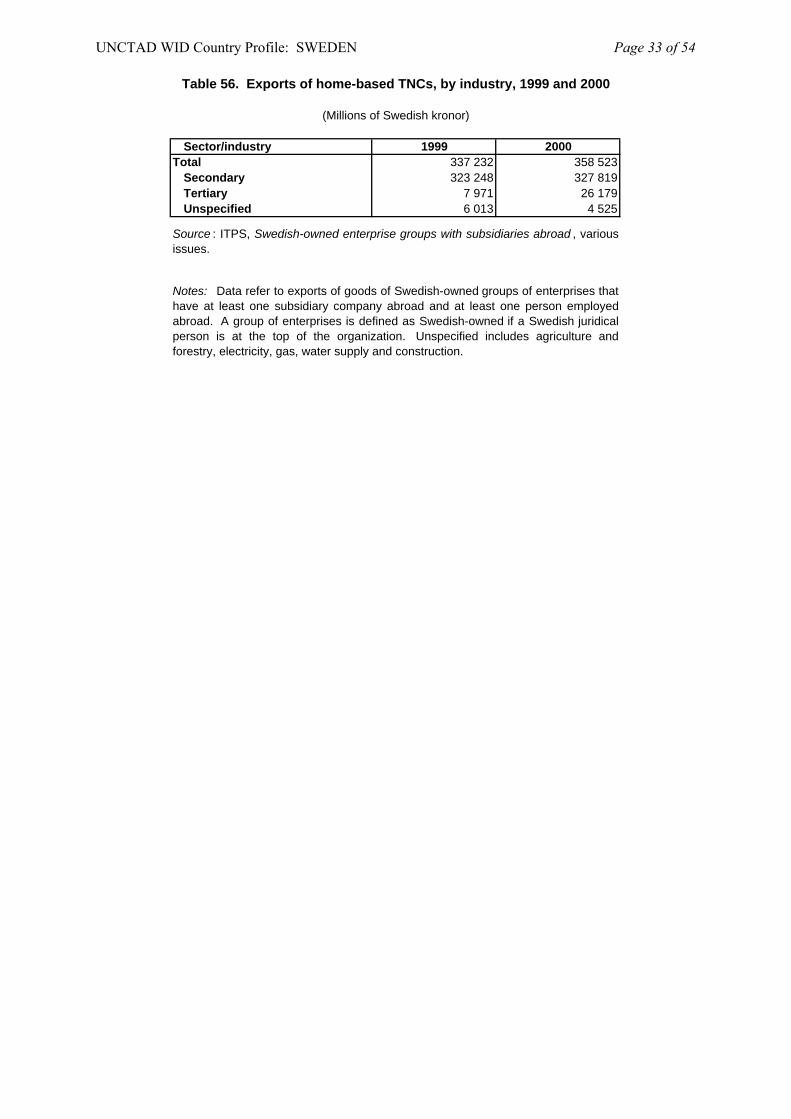
Table 56. Exports of home-based TNCs, by industry, 1999 and 2000
(Millions of Swedish kronor)
Sector/industry 1999 2000Total 337 232 358 523
Secondary 323 248 327 819Tertiary 7 971 26 179Unspecified 6 013 4 525
Source : ITPS, Swedish-owned enterprise groups with subsidiaries abroad , variousissues.
Notes: Data refer to exports of goods of Swedish-owned groups of enterprises thathave at least one subsidiary company abroad and at least one person employedabroad. A group of enterprises is defined as Swedish-owned if a Swedish juridicalperson is at the top of the organization. Unspecified includes agriculture andforestry, electricity, gas, water supply and construction.
UNCTAD WID Country Profile: SWEDEN Page 33 of 54
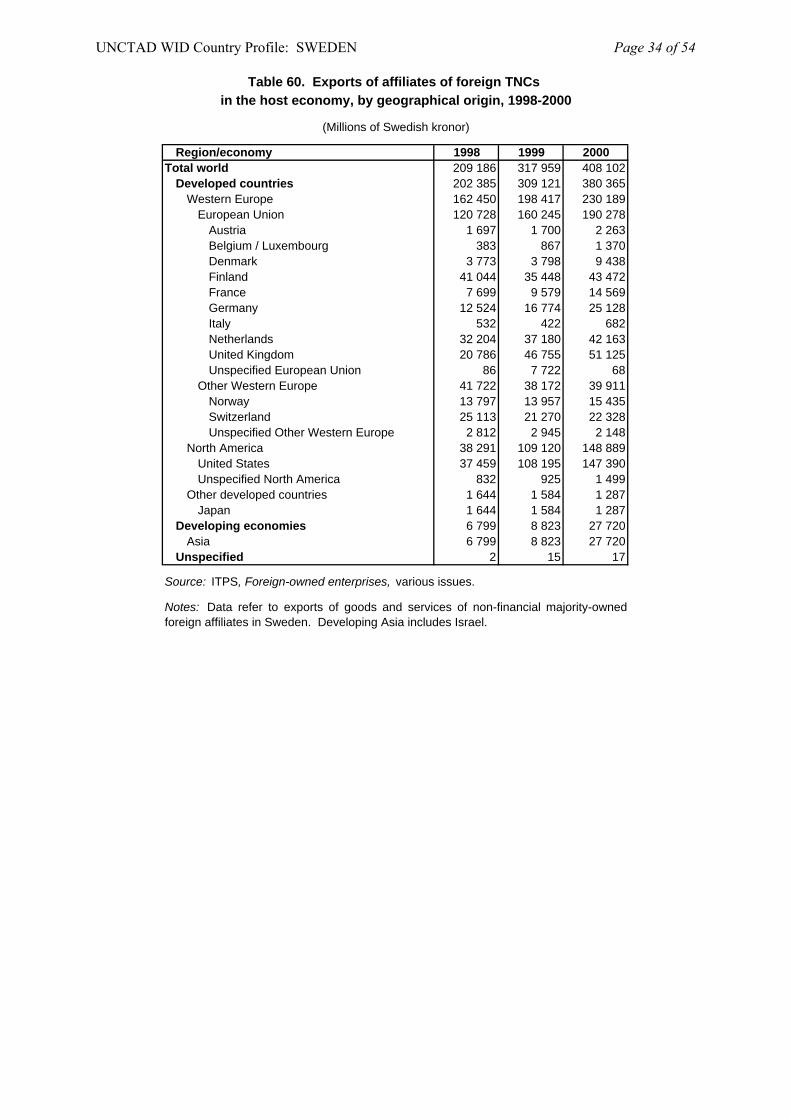
Table 60. Exports of affiliates of foreign TNCs in the host economy, by geographical origin, 1998-2000
(Millions of Swedish kronor)
Region/economy 1998 1999 2000Total world 209 186 317 959 408 102
Developed countries 202 385 309 121 380 365Western Europe 162 450 198 417 230 189
European Union 120 728 160 245 190 278Austria 1 697 1 700 2 263Belgium / Luxembourg 383 867 1 370Denmark 3 773 3 798 9 438Finland 41 044 35 448 43 472France 7 699 9 579 14 569Germany 12 524 16 774 25 128Italy 532 422 682Netherlands 32 204 37 180 42 163United Kingdom 20 786 46 755 51 125Unspecified European Union 86 7 722 68
Other Western Europe 41 722 38 172 39 911Norway 13 797 13 957 15 435Switzerland 25 113 21 270 22 328Unspecified Other Western Europe 2 812 2 945 2 148
North America 38 291 109 120 148 889United States 37 459 108 195 147 390Unspecified North America 832 925 1 499
Other developed countries 1 644 1 584 1 287Japan 1 644 1 584 1 287
Developing economies 6 799 8 823 27 720Asia 6 799 8 823 27 720
Unspecified 2 15 17
Source: ITPS, Foreign-owned enterprises, various issues.
Notes: Data refer to exports of goods and services of non-financial majority-ownedforeign affiliates in Sweden. Developing Asia includes Israel.
UNCTAD WID Country Profile: SWEDEN Page 34 of 54

Table 61. Imports of home-based TNCs, by industry, 1999 and 2000
(Millions of Swedish kronor)
Sector/industry 1999 2000Total 145 176 160 179
Secondary 115 337 103 156Tertiary 25 673 53 528Unspecified 4 166 3 495
Source : ITPS, Swedish-owned enterprise groups with subsidiaries abroad , variousissues.
Notes: Data refer to imports of goods of Swedish-owned groups of enterprises thathave at least one subsidiary company abroad and at least one person employedabroad. A group of enterprises is defined as Swedish-owned if a Swedish juridicalperson is at the top of the organization. Unspecified includes agriculture andforestry, electricity, gas, water supply and construction.
UNCTAD WID Country Profile: SWEDEN Page 35 of 54
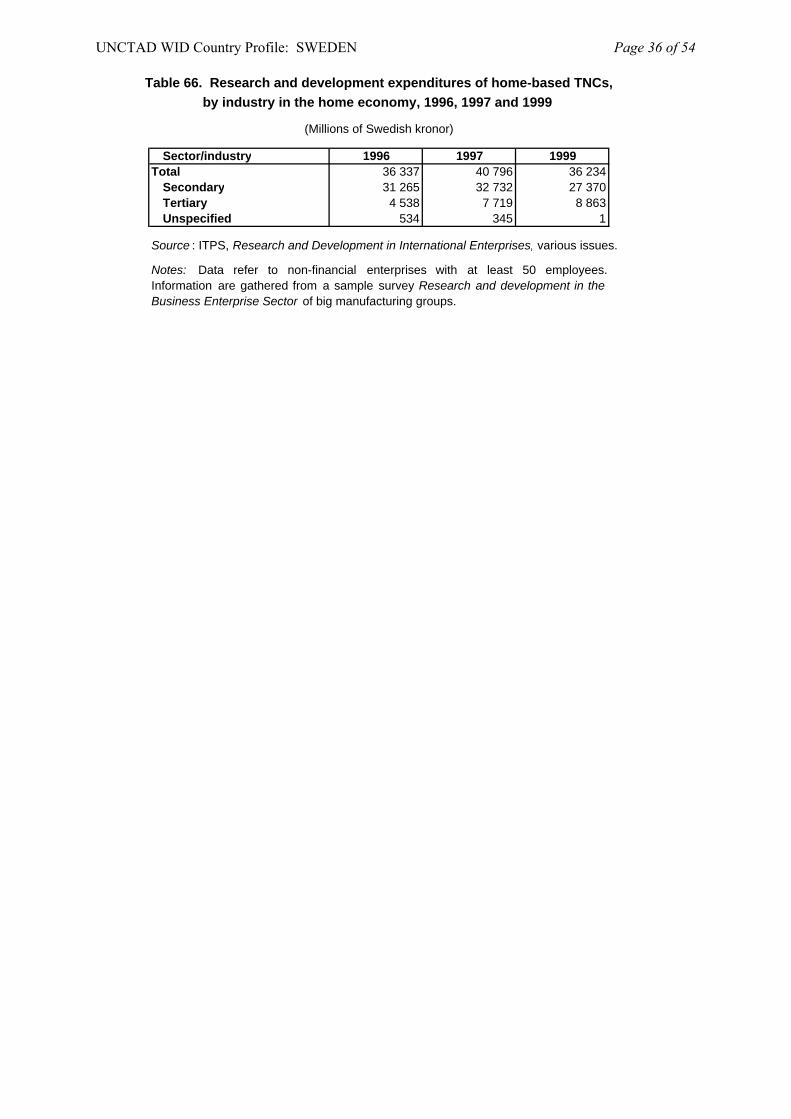
Table 66. Research and development expenditures of home-based TNCs,by industry in the home economy, 1996, 1997 and 1999
(Millions of Swedish kronor)
Sector/industry 1996 1997 1999Total 36 337 40 796 36 234
Secondary 31 265 32 732 27 370Tertiary 4 538 7 719 8 863Unspecified 534 345 1
Source : ITPS, Research and Development in International Enterprises, various issues.
Notes: Data refer to non-financial enterprises with at least 50 employees.Information are gathered from a sample survey Research and development in theBusiness Enterprise Sector of big manufacturing groups.
UNCTAD WID Country Profile: SWEDEN Page 36 of 54
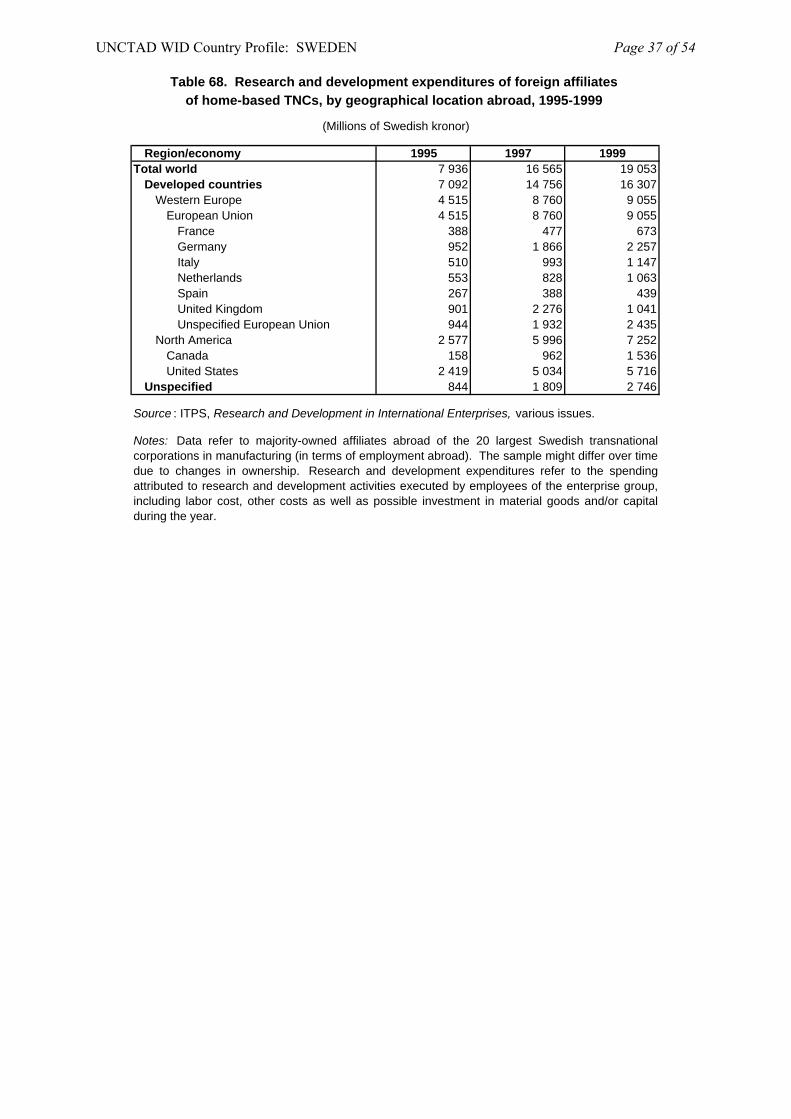
Table 68. Research and development expenditures of foreign affiliates of home-based TNCs, by geographical location abroad, 1995-1999
(Millions of Swedish kronor)
Region/economy 1995 1997 1999Total world 7 936 16 565 19 053
Developed countries 7 092 14 756 16 307Western Europe 4 515 8 760 9 055
European Union 4 515 8 760 9 055France 388 477 673Germany 952 1 866 2 257Italy 510 993 1 147Netherlands 553 828 1 063Spain 267 388 439United Kingdom 901 2 276 1 041Unspecified European Union 944 1 932 2 435
North America 2 577 5 996 7 252Canada 158 962 1 536United States 2 419 5 034 5 716
Unspecified 844 1 809 2 746
Source : ITPS, Research and Development in International Enterprises, various issues.
Notes: Data refer to majority-owned affiliates abroad of the 20 largest Swedish transnationalcorporations in manufacturing (in terms of employment abroad). The sample might differ over timedue to changes in ownership. Research and development expenditures refer to the spendingattributed to research and development activities executed by employees of the enterprise group,including labor cost, other costs as well as possible investment in material goods and/or capitalduring the year.
UNCTAD WID Country Profile: SWEDEN Page 37 of 54
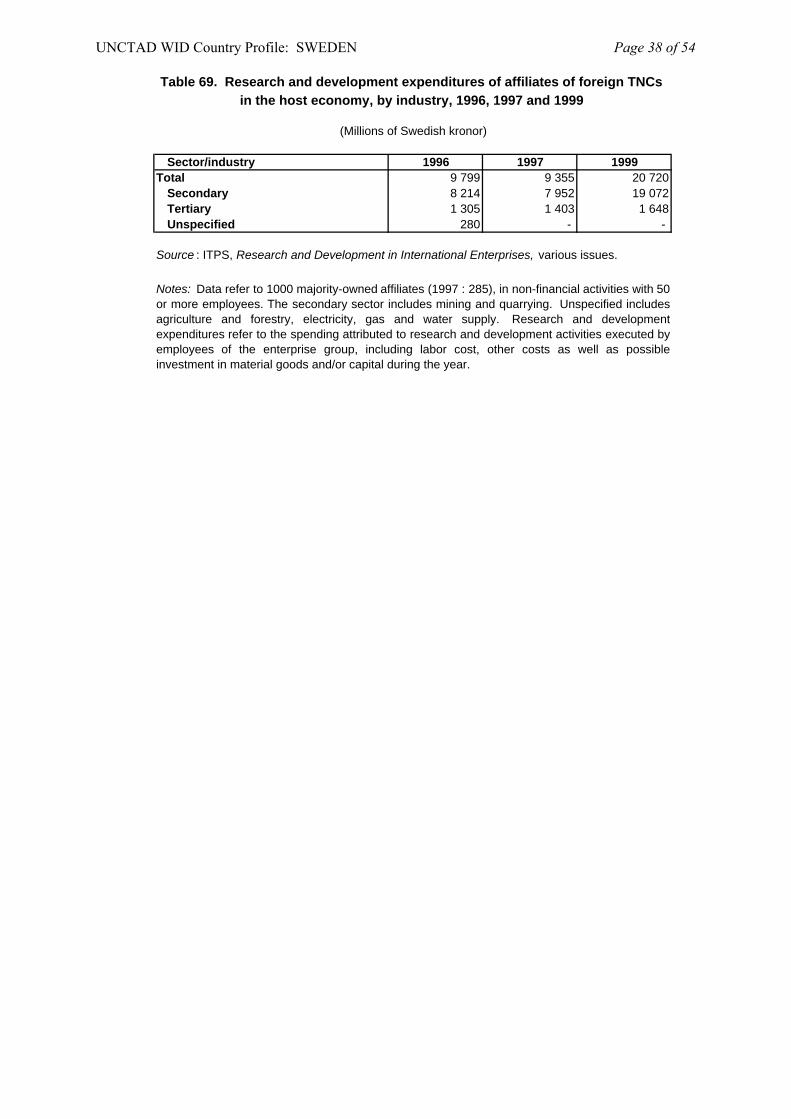
Table 69. Research and development expenditures of affiliates of foreign TNCs in the host economy, by industry, 1996, 1997 and 1999
(Millions of Swedish kronor)
Sector/industry 1996 1997 1999Total 9 799 9 355 20 720
Secondary 8 214 7 952 19 072Tertiary 1 305 1 403 1 648Unspecified 280 - -
Source : ITPS, Research and Development in International Enterprises, various issues.
Notes: Data refer to 1000 majority-owned affiliates (1997 : 285), in non-financial activities with 50or more employees. The secondary sector includes mining and quarrying. Unspecified includesagriculture and forestry, electricity, gas and water supply. Research and developmentexpenditures refer to the spending attributed to research and development activities executed byemployees of the enterprise group, including labor cost, other costs as well as possibleinvestment in material goods and/or capital during the year.
UNCTAD WID Country Profile: SWEDEN Page 38 of 54
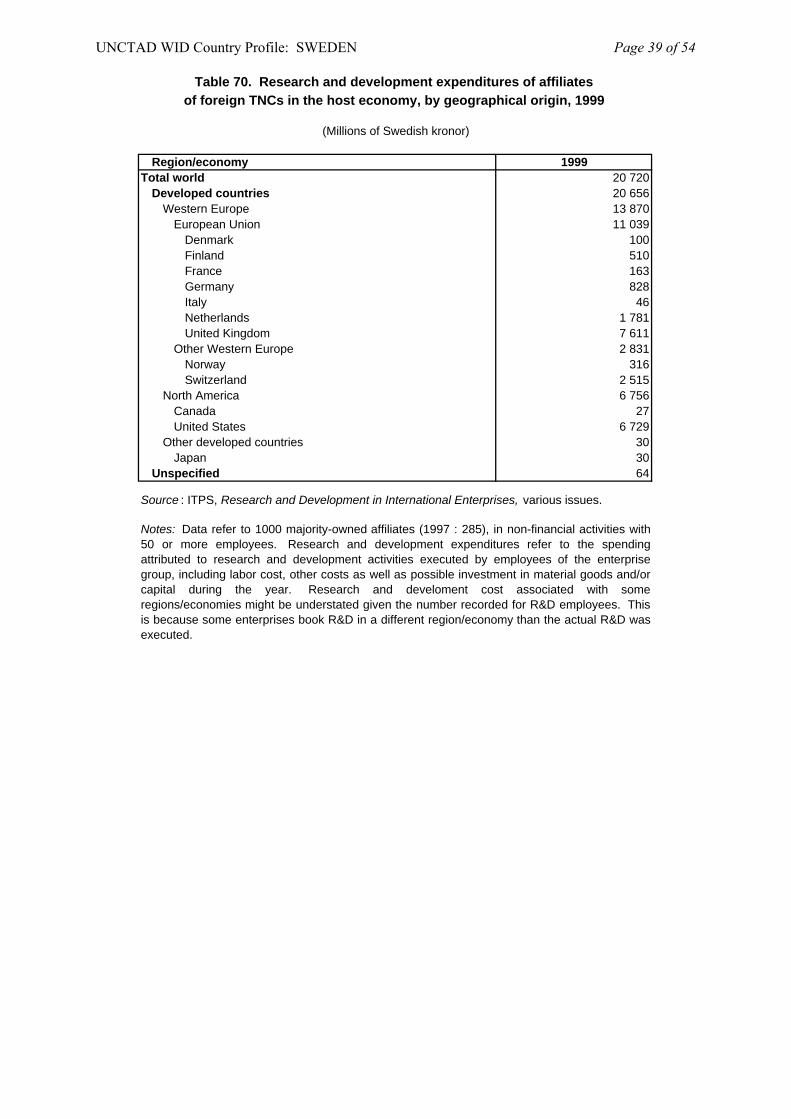
Table 70. Research and development expenditures of affiliates of foreign TNCs in the host economy, by geographical origin, 1999
(Millions of Swedish kronor)
Region/economy 1999Total world 20 720
Developed countries 20 656Western Europe 13 870
European Union 11 039Denmark 100Finland 510France 163Germany 828Italy 46Netherlands 1 781United Kingdom 7 611
Other Western Europe 2 831Norway 316Switzerland 2 515
North America 6 756Canada 27United States 6 729
Other developed countries 30Japan 30
Unspecified 64
Source : ITPS, Research and Development in International Enterprises, various issues.
Notes: Data refer to 1000 majority-owned affiliates (1997 : 285), in non-financial activities with50 or more employees. Research and development expenditures refer to the spendingattributed to research and development activities executed by employees of the enterprisegroup, including labor cost, other costs as well as possible investment in material goods and/orcapital during the year. Research and develoment cost associated with someregions/economies might be understated given the number recorded for R&D employees. Thisis because some enterprises book R&D in a different region/economy than the actual R&D wasexecuted.
UNCTAD WID Country Profile: SWEDEN Page 39 of 54
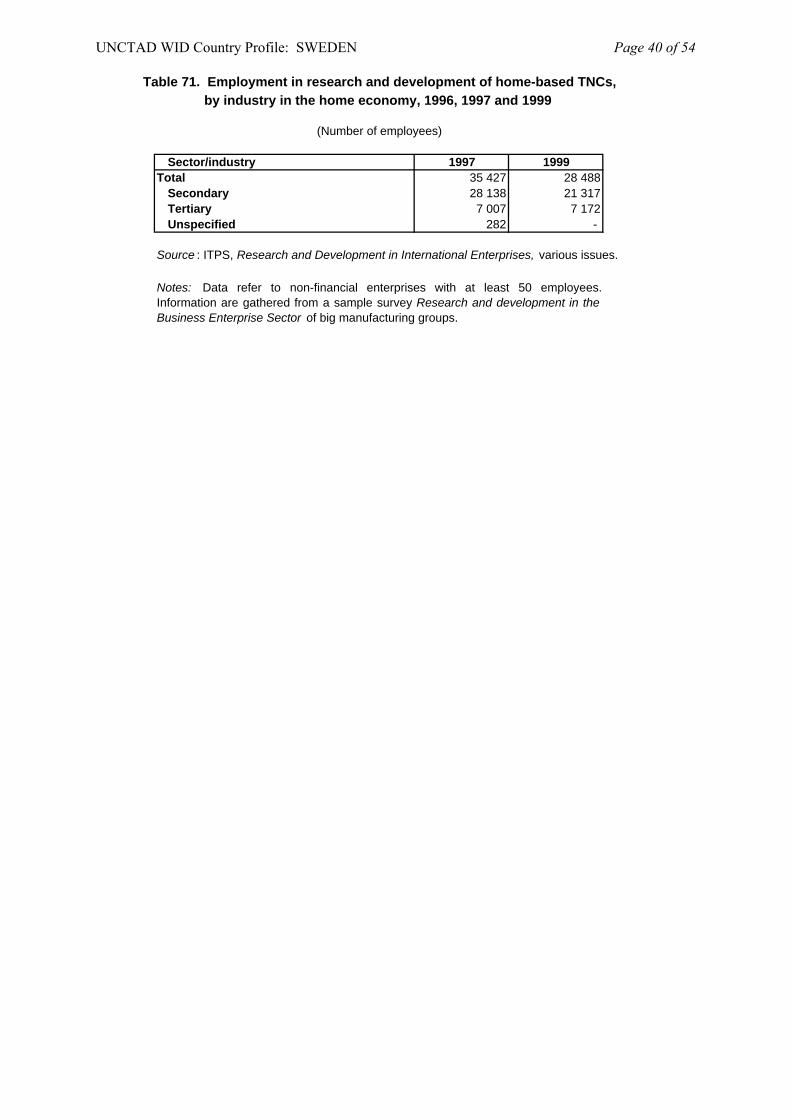
Table 71. Employment in research and development of home-based TNCs,by industry in the home economy, 1996, 1997 and 1999
(Number of employees)
Sector/industry 1997 1999Total 35 427 28 488
Secondary 28 138 21 317Tertiary 7 007 7 172Unspecified 282 -
Source : ITPS, Research and Development in International Enterprises, various issues.
Notes: Data refer to non-financial enterprises with at least 50 employees.Information are gathered from a sample survey Research and development in theBusiness Enterprise Sector of big manufacturing groups.
UNCTAD WID Country Profile: SWEDEN Page 40 of 54
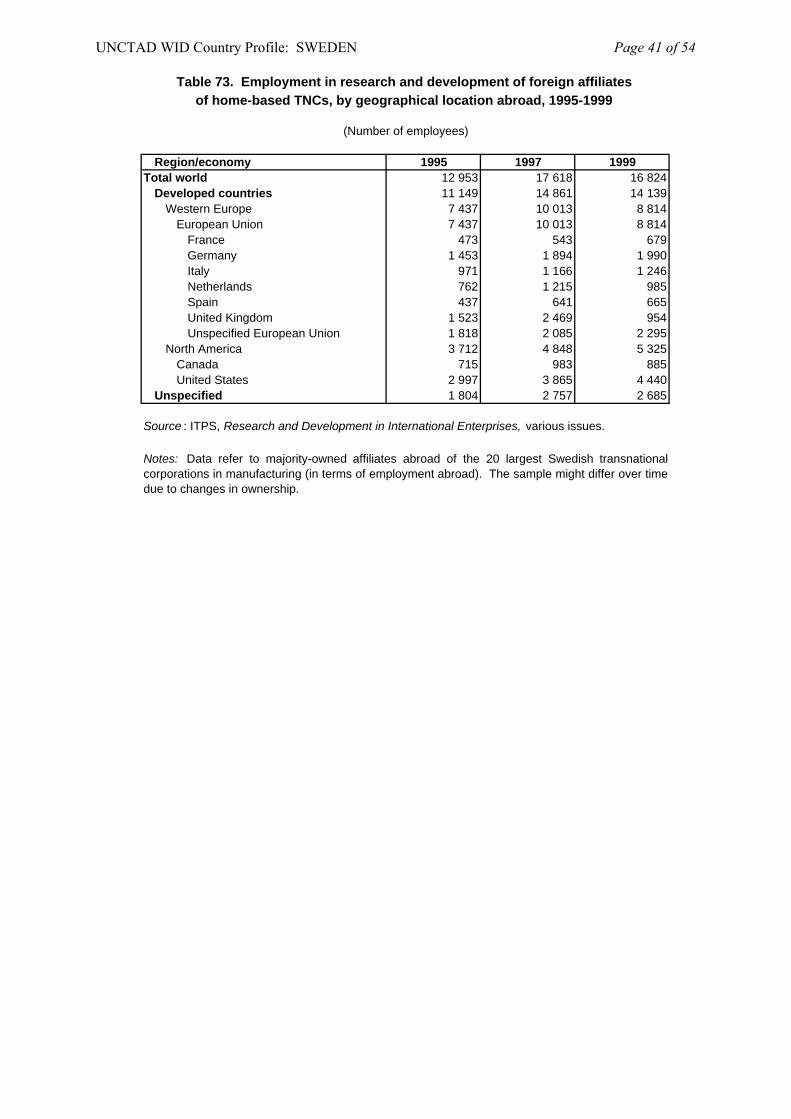
Table 73. Employment in research and development of foreign affiliates of home-based TNCs, by geographical location abroad, 1995-1999
(Number of employees)
Region/economy 1995 1997 1999Total world 12 953 17 618 16 824
Developed countries 11 149 14 861 14 139Western Europe 7 437 10 013 8 814
European Union 7 437 10 013 8 814France 473 543 679Germany 1 453 1 894 1 990Italy 971 1 166 1 246Netherlands 762 1 215 985Spain 437 641 665United Kingdom 1 523 2 469 954Unspecified European Union 1 818 2 085 2 295
North America 3 712 4 848 5 325Canada 715 983 885United States 2 997 3 865 4 440
Unspecified 1 804 2 757 2 685
Source : ITPS, Research and Development in International Enterprises, various issues.
Notes: Data refer to majority-owned affiliates abroad of the 20 largest Swedish transnationalcorporations in manufacturing (in terms of employment abroad). The sample might differ over timedue to changes in ownership.
UNCTAD WID Country Profile: SWEDEN Page 41 of 54
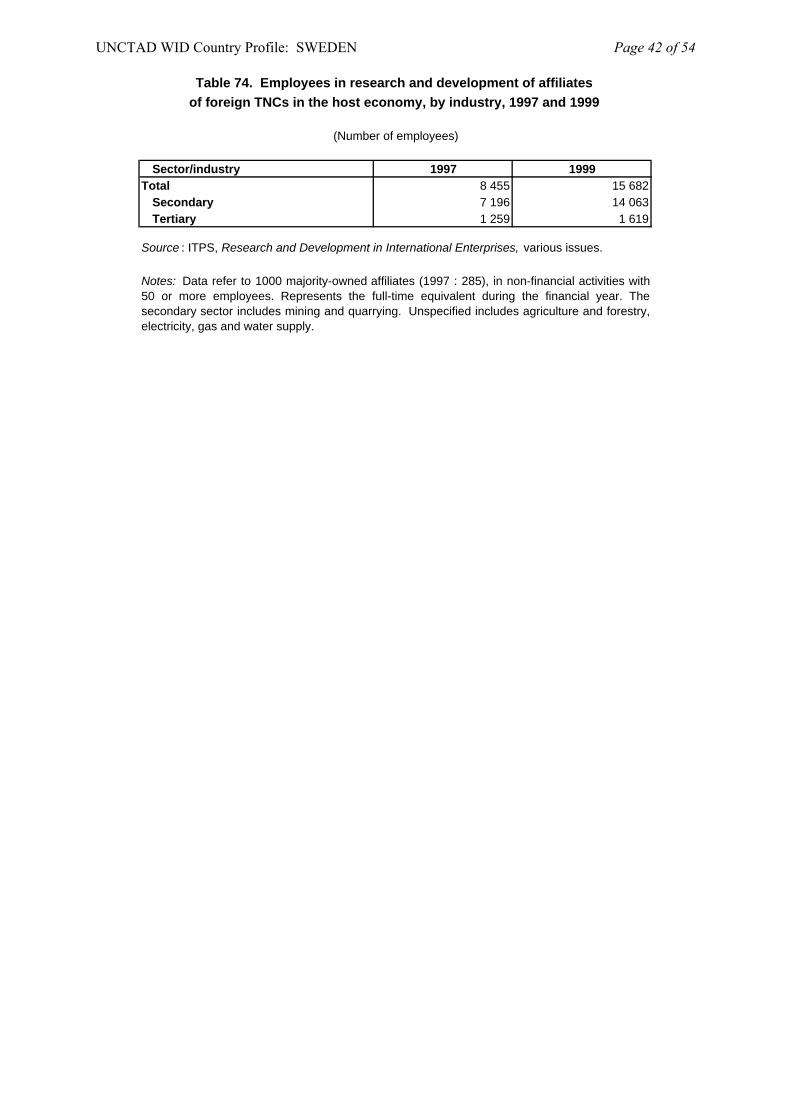
Table 74. Employees in research and development of affiliates of foreign TNCs in the host economy, by industry, 1997 and 1999
(Number of employees)
Sector/industry 1997 1999Total 8 455 15 682
Secondary 7 196 14 063Tertiary 1 259 1 619
Source : ITPS, Research and Development in International Enterprises, various issues.
Notes: Data refer to 1000 majority-owned affiliates (1997 : 285), in non-financial activities with50 or more employees. Represents the full-time equivalent during the financial year. Thesecondary sector includes mining and quarrying. Unspecified includes agriculture and forestry,electricity, gas and water supply.
UNCTAD WID Country Profile: SWEDEN Page 42 of 54
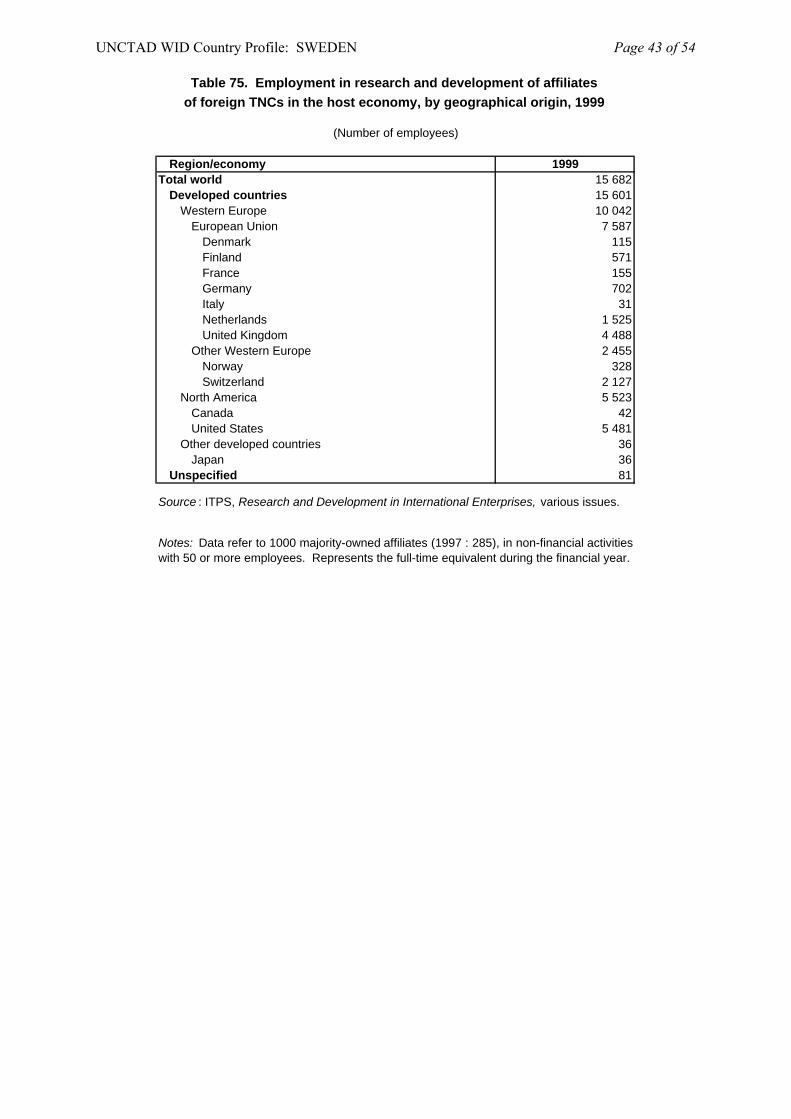
Table 75. Employment in research and development of affiliates of foreign TNCs in the host economy, by geographical origin, 1999
(Number of employees)
Region/economy 1999Total world 15 682
Developed countries 15 601Western Europe 10 042
European Union 7 587Denmark 115Finland 571France 155Germany 702Italy 31Netherlands 1 525United Kingdom 4 488
Other Western Europe 2 455Norway 328Switzerland 2 127
North America 5 523Canada 42United States 5 481
Other developed countries 36Japan 36
Unspecified 81
Source : ITPS, Research and Development in International Enterprises, various issues.
Notes: Data refer to 1000 majority-owned affiliates (1997 : 285), in non-financial activitieswith 50 or more employees. Represents the full-time equivalent during the financial year.
UNCTAD WID Country Profile: SWEDEN Page 43 of 54
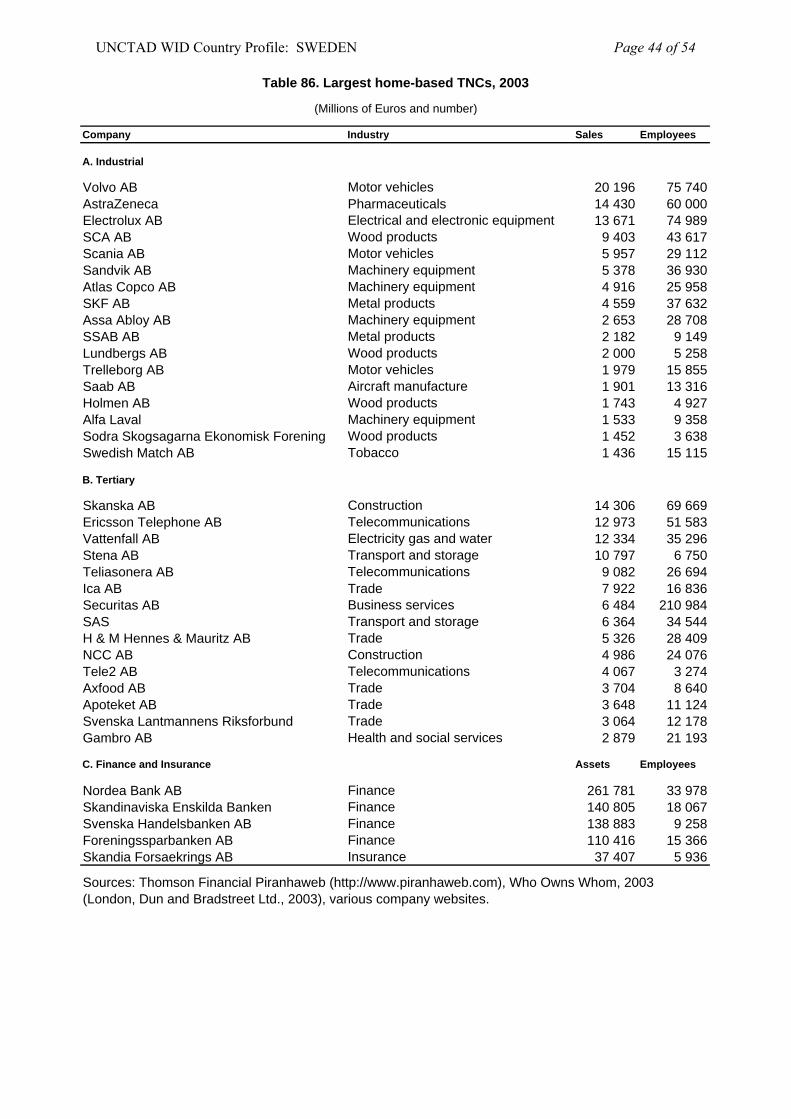
Company Industry Sales Employees
A. Industrial
Volvo AB Motor vehicles 20 196 75 740AstraZeneca Pharmaceuticals 14 430 60 000Electrolux AB Electrical and electronic equipment 13 671 74 989SCA AB Wood products 9 403 43 617Scania AB Motor vehicles 5 957 29 112Sandvik AB Machinery equipment 5 378 36 930Atlas Copco AB Machinery equipment 4 916 25 958SKF AB Metal products 4 559 37 632Assa Abloy AB Machinery equipment 2 653 28 708SSAB AB Metal products 2 182 9 149Lundbergs AB Wood products 2 000 5 258Trelleborg AB Motor vehicles 1 979 15 855Saab AB Aircraft manufacture 1 901 13 316Holmen AB Wood products 1 743 4 927Alfa Laval Machinery equipment 1 533 9 358Sodra Skogsagarna Ekonomisk Forening Wood products 1 452 3 638Swedish Match AB Tobacco 1 436 15 115
B. Tertiary
Skanska AB Construction 14 306 69 669Ericsson Telephone AB Telecommunications 12 973 51 583Vattenfall AB Electricity gas and water 12 334 35 296Stena AB Transport and storage 10 797 6 750Teliasonera AB Telecommunications 9 082 26 694Ica AB Trade 7 922 16 836Securitas AB Business services 6 484 210 984SAS Transport and storage 6 364 34 544H & M Hennes & Mauritz AB Trade 5 326 28 409NCC AB Construction 4 986 24 076Tele2 AB Telecommunications 4 067 3 274Axfood AB Trade 3 704 8 640Apoteket AB Trade 3 648 11 124Svenska Lantmannens Riksforbund Trade 3 064 12 178Gambro AB Health and social services 2 879 21 193
C. Finance and Insurance Assets Employees
Nordea Bank AB Finance 261 781 33 978Skandinaviska Enskilda Banken Finance 140 805 18 067Svenska Handelsbanken AB Finance 138 883 9 258Foreningssparbanken AB Finance 110 416 15 366Skandia Forsaekrings AB Insurance 37 407 5 936
Table 86. Largest home-based TNCs, 2003
(Millions of Euros and number)
Sources: Thomson Financial Piranhaweb (http://www.piranhaweb.com), Who Owns Whom, 2003 (London, Dun and Bradstreet Ltd., 2003), various company websites.
UNCTAD WID Country Profile: SWEDEN Page 44 of 54
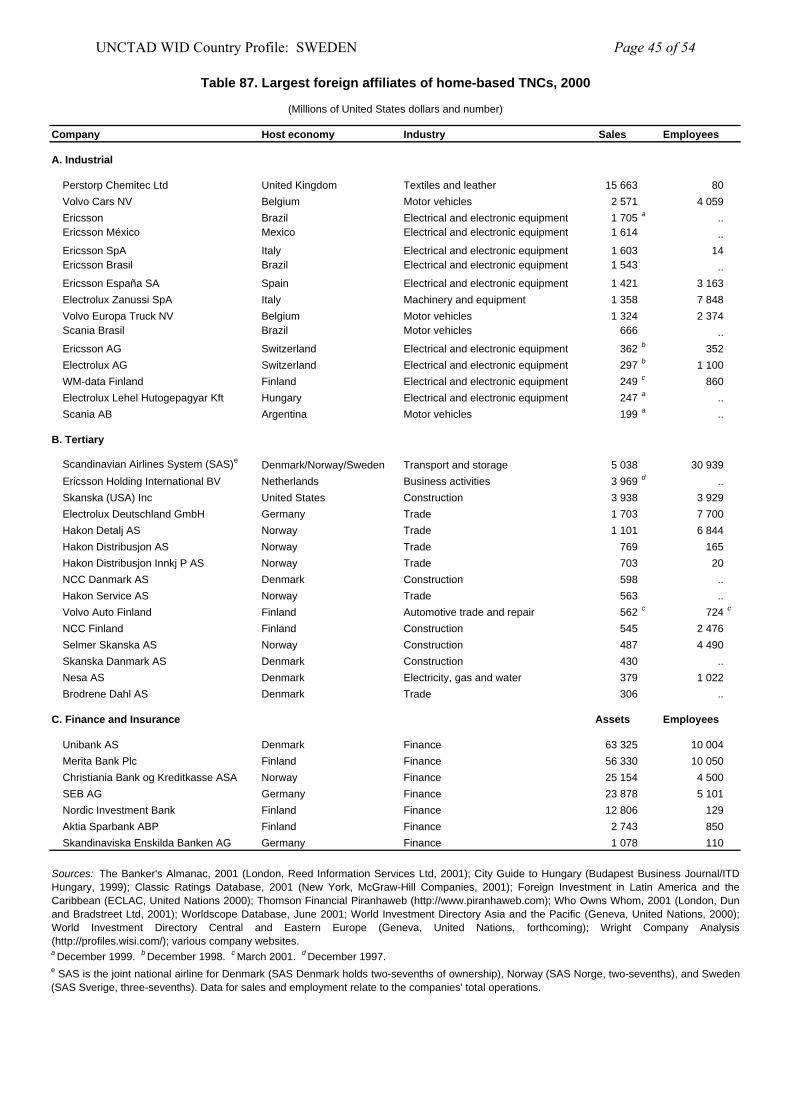
Table 87. Largest foreign affiliates of home-based TNCs, 2000
(Millions of United States dollars and number)
Company Host economy Industry Sales Employees
A. Industrial
Perstorp Chemitec Ltd United Kingdom Textiles and leather 15 663 80Volvo Cars NV Belgium Motor vehicles 2 571 4 059Ericsson Brazil Electrical and electronic equipment 1 705 a ..
Ericsson México Mexico Electrical and electronic equipment 1 614 ..Ericsson SpA Italy Electrical and electronic equipment 1 603 14Ericsson Brasil Brazil Electrical and electronic equipment 1 543 ..Ericsson España SA Spain Electrical and electronic equipment 1 421 3 163Electrolux Zanussi SpA Italy Machinery and equipment 1 358 7 848Volvo Europa Truck NV Belgium Motor vehicles 1 324 2 374Scania Brasil Brazil Motor vehicles 666 ..Ericsson AG Switzerland Electrical and electronic equipment 362 b 352
Electrolux AG Switzerland Electrical and electronic equipment 297 b 1 100
WM-data Finland Finland Electrical and electronic equipment 249 c 860
Electrolux Lehel Hutogepagyar Kft Hungary Electrical and electronic equipment 247 a ..
Scania AB Argentina Motor vehicles 199 a ..
B. Tertiary
Scandinavian Airlines System (SAS)e Denmark/Norway/Sweden Transport and storage 5 038 30 939
Ericsson Holding International BV Netherlands Business activities 3 969 d ..Skanska (USA) Inc United States Construction 3 938 3 929Electrolux Deutschland GmbH Germany Trade 1 703 7 700Hakon Detalj AS Norway Trade 1 101 6 844Hakon Distribusjon AS Norway Trade 769 165Hakon Distribusjon Innkj P AS Norway Trade 703 20NCC Danmark AS Denmark Construction 598 ..Hakon Service AS Norway Trade 563 ..Volvo Auto Finland Finland Automotive trade and repair 562 c 724 c
NCC Finland Finland Construction 545 2 476Selmer Skanska AS Norway Construction 487 4 490Skanska Danmark AS Denmark Construction 430 ..Nesa AS Denmark Electricity, gas and water 379 1 022Brodrene Dahl AS Denmark Trade 306 ..
C. Finance and Insurance Assets Employees
Unibank AS Denmark Finance 63 325 10 004Merita Bank Plc Finland Finance 56 330 10 050Christiania Bank og Kreditkasse ASA Norway Finance 25 154 4 500SEB AG Germany Finance 23 878 5 101Nordic Investment Bank Finland Finance 12 806 129Aktia Sparbank ABP Finland Finance 2 743 850Skandinaviska Enskilda Banken AG Germany Finance 1 078 110
a December 1999. b December 1998. c March 2001. d December 1997.
Sources: The Banker's Almanac, 2001 (London, Reed Information Services Ltd, 2001); City Guide to Hungary (Budapest Business Journal/ITDHungary, 1999); Classic Ratings Database, 2001 (New York, McGraw-Hill Companies, 2001); Foreign Investment in Latin America and theCaribbean (ECLAC, United Nations 2000); Thomson Financial Piranhaweb (http://www.piranhaweb.com); Who Owns Whom, 2001 (London, Dunand Bradstreet Ltd, 2001); Worldscope Database, June 2001; World Investment Directory Asia and the Pacific (Geneva, United Nations, 2000);World Investment Directory Central and Eastern Europe (Geneva, United Nations, forthcoming); Wright Company Analysis(http://profiles.wisi.com/); various company websites.
e SAS is the joint national airline for Denmark (SAS Denmark holds two-sevenths of ownership), Norway (SAS Norge, two-sevenths), and Sweden(SAS Sverige, three-sevenths). Data for sales and employment relate to the companies' total operations.
UNCTAD WID Country Profile: SWEDEN Page 45 of 54
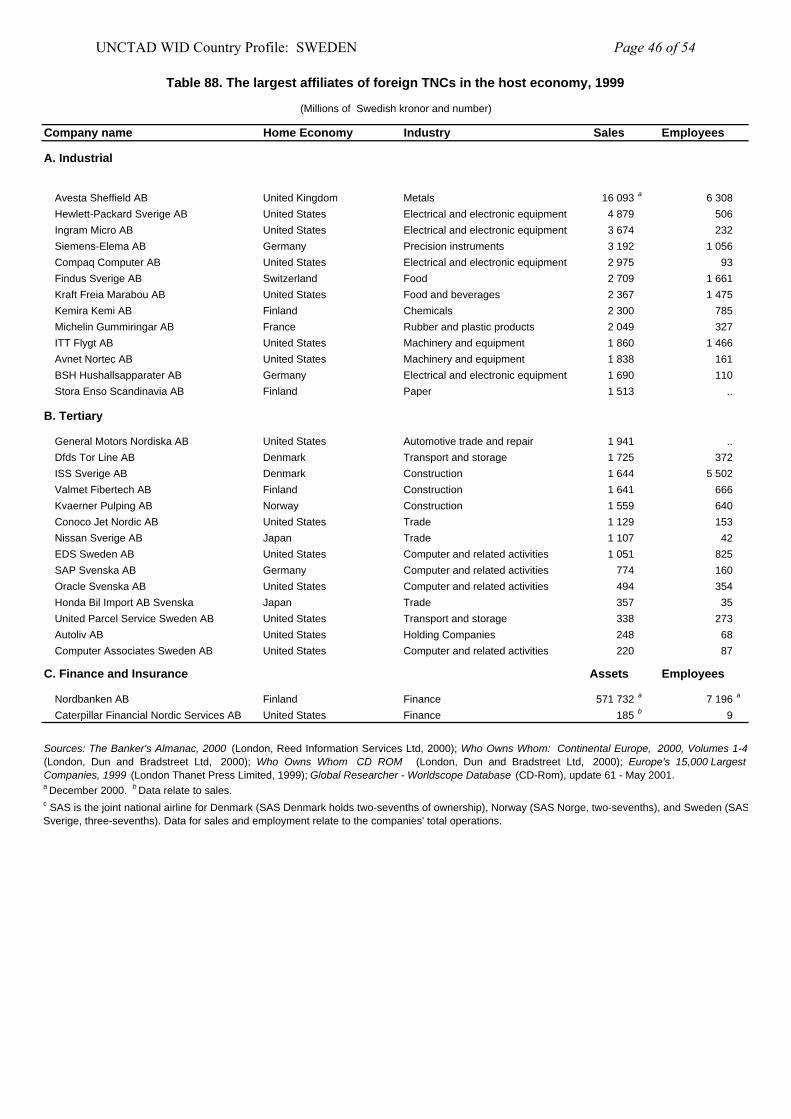
Table 88. The largest affiliates of foreign TNCs in the host economy, 1999
(Millions of Swedish kronor and number)
Company name Home Economy Industry Sales Employees
A. Industrial
Avesta Sheffield AB United Kingdom Metals 16 093 a 6 308
Hewlett-Packard Sverige AB United States Electrical and electronic equipment 4 879 506Ingram Micro AB United States Electrical and electronic equipment 3 674 232Siemens-Elema AB Germany Precision instruments 3 192 1 056Compaq Computer AB United States Electrical and electronic equipment 2 975 93Findus Sverige AB Switzerland Food 2 709 1 661Kraft Freia Marabou AB United States Food and beverages 2 367 1 475Kemira Kemi AB Finland Chemicals 2 300 785Michelin Gummiringar AB France Rubber and plastic products 2 049 327ITT Flygt AB United States Machinery and equipment 1 860 1 466Avnet Nortec AB United States Machinery and equipment 1 838 161BSH Hushallsapparater AB Germany Electrical and electronic equipment 1 690 110Stora Enso Scandinavia AB Finland Paper 1 513 ..
B. Tertiary
General Motors Nordiska AB United States Automotive trade and repair 1 941 ..Dfds Tor Line AB Denmark Transport and storage 1 725 372ISS Sverige AB Denmark Construction 1 644 5 502Valmet Fibertech AB Finland Construction 1 641 666Kvaerner Pulping AB Norway Construction 1 559 640Conoco Jet Nordic AB United States Trade 1 129 153Nissan Sverige AB Japan Trade 1 107 42EDS Sweden AB United States Computer and related activities 1 051 825SAP Svenska AB Germany Computer and related activities 774 160Oracle Svenska AB United States Computer and related activities 494 354Honda Bil Import AB Svenska Japan Trade 357 35United Parcel Service Sweden AB United States Transport and storage 338 273Autoliv AB United States Holding Companies 248 68Computer Associates Sweden AB United States Computer and related activities 220 87
C. Finance and Insurance Assets Employees
Nordbanken AB Finland Finance 571 732 a 7 196 a
Caterpillar Financial Nordic Services AB United States Finance 185 b 9
a December 2000. b Data relate to sales.
Sources: The Banker's Almanac, 2000 (London, Reed Information Services Ltd, 2000); Who Owns Whom: Continental Europe, 2000, Volumes 1-4(London, Dun and Bradstreet Ltd, 2000); Who Owns Whom CD ROM (London, Dun and Bradstreet Ltd, 2000); Europe's 15,000 LargestCompanies, 1999 (London Thanet Press Limited, 1999); Global Researcher - Worldscope Database (CD-Rom), update 61 - May 2001.
c SAS is the joint national airline for Denmark (SAS Denmark holds two-sevenths of ownership), Norway (SAS Norge, two-sevenths), and Sweden (SASSverige, three-sevenths). Data for sales and employment relate to the companies' total operations.
UNCTAD WID Country Profile: SWEDEN Page 46 of 54
C. Legal framework for FDI 1. National policy framework Sweden’s policy environment for FDI improved considerably during the 1990s. As of February 2004, the main features of the FDI regime include the following. Entry and establishment: With the abolition of the rule that required foreign investors to obtain permission to do business in Sweden, investing is Sweden - both in the form of greenfield and or mergers and acquisitions - has been greatly facilitated. There are no general restrictions to entry and establishment. The Invest in Sweden Agency (ISA) provides information about economic and legal requirements for the establishment of FDI projects and facilitates the process. Ownership and control: There are no ownership restrictions except in companies involved in defence and other sensitive areas. Operational requirements: Sweden requires permits and authorisations to engage in many activities. Foreign investors are subject to the same operational conditions and rights as domestic investors. There are no performance requirements imposed on foreign investors. Approval from the Board of Trade is required if more than half of the board members or the managing director of a company are not residents in the EEA. Exchange controls: There are no restrictions on remittances of profits, capital, proceeds from the liquidation of an investment, or of royalties and license fees. A foreign affiliate may also raise foreign currency loans both from its parent corporation and from credit institutions abroad. Incentives: A range of incentives are granted for various purposes including support for research and development, export promotion, employment and training, and environmental friendly energy systems. Incentives are also available to set up businesses in various targeted depressed areas. These include a range of regional support programmes which provide loans on favourable terms, location and employment grants, reduced payroll taxes, low-rent industrial parts and economic free zones. Source: The Economist Intelligence Unit. Country Commerce Sweden, February 2004, Internet. Main legislations relating to FDI National Tax Law No. 576 of 26 July 1947 as amended in 1997. Foreign Exchange Control Act No. 1602 of 1992. Obligation to File Information Concerning Price and Competition Conditions Law No. 245 of 1 June 1956. Marketing Practices Act No. 1,418 of 15 December 1975. Antitrust Law No. 729 of 30 June 1982. Competition Act No. 20 of 1993, amended in 1995.
UNCTAD WID Country Profile: SWEDEN Page 47 of 54
Copyright in Literary and Artistic Works Act No. 396 of 1 June 1989 amends Act No. 729 of 1960. Trademark Law No. 644 of 2 December 1960. Foreign Trademarks Ordinance No. 495 of 29 June 1970. Design Registration Act of 1970. Industrial Design Protection Act of 1970. Trade Names Act No. 156 of 1974. Patent Act of 1967, amended in 1978; Decree on Patent formalities of 1967; Act relating to Board of the Patent and registry Office of 1967; Act on Secret Patents of 1946-67; Patent Law No. 433 of 19 May 1983 Protection of the Layout-Design of the Circuitry in Semiconductor Products Act No. 1425 of 18 December 1986. Disclosure of Stock Ownership in Publicly Traded Companies Law No. 827 of 26 November 1971. Expropriation Act No. 719 of 1972. Banking Business Act No. 617 of 1987. Insurance Business Act No. 713 of 1982. Companies Act No. 1385 of 15 December 1975. Companies Ordinance No. 1387 of 1975. Act on the Implementation of the Companies Act No. 1386 of 1975. Branches of Foreign Companies Act No. 160 of 1992. Branches of Foreign Companies Ordinance No. 308 of 1992. Act to Amend the Companies Act No. 1238 of 1992. The Partnership and Non-registered Partnership Act No. 1102 of 1980. Certain Restrictions on the Right to Acquire Real Property Law No. 618 of 17 June 1982. Permission for Some Property Acquisitions Act No. 1,368 of 1992. Maritime Law No. 176 of 28 March 1985. Economic Associations Act No. 667 of 11 June 1987. Mineral Act No. 45 of 1995.
UNCTAD WID Country Profile: SWEDEN Page 48 of 54
Banking and Financing Business Act of July 2004. New Controlled Foreign Companes (CFC) Regulations; effective 1 Jan 2004. 2. International framework a. Multilateral instruments Paris Convention for the Protection of Industrial Property of 20 March 1883, as amended and revised. New York Convention on the Recognition and Enforcement of Foreign Arbitral Awards of 10 June 1958. Convention on the Settlement of Investment Disputes between States and Nationals of Other States of 18 March 1965, signed on 25 September 1965, effective 28 January 1967.
Convention Establishing the Multilateral Investment Guarantee Agency of 11 October 1985, signed on 2 April 1987. ILO Tripartite Declaration of Principles Concerning Multinational Enterprises and Social Policy, adopted on 16 November 1977. The Set of Multilaterally Agreed Equitable Principles and Rules for the Control of Restrictive Business Practices, adopted on 5 December 1980 by the General Assembly of the United Nations (resolution 35/63). Agreement on Trade-Related Investment Measures, signed on 15 April 1994; in force on 1 January 1995. Agreement on Trade-Related Aspects of Intellectual Property Rights, signed on 15 April 1994; in force on 1 January 1995. General Agreement on Trade in Services, signed on 15 April 1994; in force on 1 January 1995.
Fourth Protocol to the General Agreement on Trade in Services of 15 February 1997. Fifth Protocol to the General Agreement on Trade in Services of 12 December 1997.
b. Regional instruments Code of Liberalisation of Capital Movements, adopted by the Council of the Organization for Economic Cooperation and Development on 12 December 1961. The Code was amended on several occasions. Code of Liberalisation of Current Invisible Operations, adopted by the Council of the Organisation for Economic Cooperation and Development on 12 December 1991. The Code has been amended on several occasions. Declaration on International Investment and Multilateral Enterprises, adopted by the Council of the Organisation for Economic Cooperation and Development on 21 June 1976. The Declaration and the Guidelines for Multinational Enterprises attached to the Declaration were revised on several occasions (1979, 1984, 1991 and 2000).
UNCTAD WID Country Profile: SWEDEN Page 49 of 54
Treaty Establishing the European Community (Treaty of Rome), adopted on 25 March 1957 and in force on 1 January 1958. It was subsequently amended by the Single European Act (singed on 17 and 28 February 1986) and by the Treaty on European Union (Treaty of Maastricht) (signed on 7 February 1992). Agreement on the European Economic Area of 2 May 1992; entered into force on 1 January 1994. Energy Charter Treaty of 17 December 1994; effective since 16 April 1998. c. Bilateral treaties 1. Bilateral investment treaty for the protection and promotion of investments with Albania 31
March 1995; Argentina 22 Nov 1991; Belarus 20 Dec 1994; Bolivia 20 Sept 1990; Bosnia and Herzegovina 31 Oct 2000; Bulgaria 19 April 1994; Chile 24 May 1993; China 29 March 1982; Côte d'Ivoire 27 Aug 1965; Croatia 10 Nov 1978; and 23 Nov 2000; Czech Republic 13 Nov 1990; Ecuador 31 May 2001; Egypt 15 July 1978; Estonia 31 March 1992; Hong Kong, China 27 May 1994; Hungary 21 April 1987; India 4 July 2000; Indonesia 17 Sept 1992; Korea, Republic of 30 Aug 1995; Kyrgyzstan 8 March 2002; Lao People's Democratic Republic 29 Aug 1996; Latvia 10 March 1992; Lebanon 15 June 2001; Lithuania 17 March 1992; Macedonia, the Former Yugoslav Republic of 7 May 1998; Madagascar 2 April 1966; Malaysia 3 March 1979; Malta 24 Aug 1999; Mexico 3 Oct 2000; Mongolia 20 Oct 2003; Morocco 26 Sept 1990; Nigeria 18 April 2002; Oman 13 July 1995; Pakistan 12 March 1981; Peru 3 May 1994; Philippines 17 Aug 1999; Poland 13 Oct 1989; Romania 29 May 2002; Russian Federation 19 April 1995; Senegal 24 Feb 1967; Serbia and Montenegro 10 Nov 1978; Slovakia 13 Nov 1990; Slovenia 10 Nov 1978; Slovenia 5 Oct 1999; South Africa 25 May 1998; Sri Lanka 30 April 1982; Tanzania, United Republic of 1 Sept 1999; Thailand 18 Feb 2000; Tunisia 15 Sept 1984; Turkey 11 April 1997; Ukraine 15 Aug 1995; Uruguay 17 June 1997; Uzbekistan 29 May 2001; Venezuela 25 Nov 1996; Viet Nam 8 Sept 1993; Yemen 29 Oct 1983; Zimbabwe 6 Oct 1997.
2. Bilateral treaties for the avoidance of double taxation with Albania 26 March 1998; Anguilla 19
Jan 1972; Antigua and Barbuda 19 Jan 1972; Argentina 3 Sept 1962; Argentina 31 May 1995; Australia 14 Jan 1981; Austria 14 May 1959; 6 April 1970; 5 Nov 1991; and 21 Nov 1962; Bangladesh 3 May 1982; Barbados 1 July 1991; Belarus 10 March 1994; Belgium 2 July 1965; 5 Feb 1991; and 18 Jan 1956; Belize 19 Jan 1972; Bolivia 14 Jan 1994; Botswana 19 Oct 1992; Brazil 25 April 1975; British Virgin Islands 19 Jan 1972; Bulgaria 21 June 1988; Canada 14 Oct 1983; and 27 Aug 1996; China 16 May 1986; Cyprus 25 Oct 1988; Czech Republic 16 Feb 1979; Dominica 19 Jan 1972; Egypt 29 July 1958; and 26 Dec 1994; Estonia 5 April 1993; France 24 Dec 1936; 27 Nov 1990; 24 Dec 1936; and 8 June 1994; Gambia 8 Dec 1993; Germany 17 April 1959; and 14 July 1992; Greece 6 Oct 1961; Hong Kong, China 14 March 2000; Hungary 12 Oct 1981; and 20 Nov 1936; India 30 July 1958; 7 June 1988; and 24 June 1997; Indonesia 28 Feb 1989; Ireland 6 Nov 1959; and 8 Oct 1986; Israel 22 Dec 1959; Italy 6 March 1980; Italy 20 Dec 1956; Jamaica 13 March 1985; Japan 21 Jan 1983; and 19 Feb 1999; Kazakhstan 19 March 1997; Kenya 28 June 1973; Kiribati 19 Jan 1972; Korea, Republic of 27 May 1981; Latvia 5 April 1993; Liberia 29 April 1969; Lithuania 27 Sept 1993; Luxembourg 14 July 1983; and 14 Oct 1996; Macedonia, the Former Yugoslav Republic of 17 Feb 1998; Malawi 25 Nov 1954; Malaysia 12 March 2002; and 21 Nov 1970; Malta 30 May 1975; and 9 Oct 1995; Mauritius 23 April 1992; Mexico 21 Sept 1992; Montserrat 19 Jan 1972; Morocco 30 March 1961; Namibia 16 July 1993; Netherlands 12 March 1968; 18 June 1991; and 25 April 1952; New Zealand 21 Feb 1979; Pakistan 22 Dec 1985; Peru 17 Sept 1966; Philippines 12 April 1966; 7 May 1987; and 24 June 1998; Poland 5 June 1975; Portugal 29 Aug 2002; Romania 22 Dec 1976; Russian
UNCTAD WID Country Profile: SWEDEN Page 50 of 54
Federation 13 Oct 1981; and 14 June 1993; Saint Kitts and Nevis 19 Jan 1972; Saint Lucia 19 Jan 1972; Saint Vincent and the Grenadines 19 Jan 1972; Singapore 17 June 1968; Slovakia 16 Feb 1979; South Africa 28 July 1955; 24 May 1995; and 29 May 1961; Spain 16 June 1976; and 25 April 1963; Sri Lanka 18 May 1957; and 23 Jan 1983; Swaziland 19 Jan 1972; Switzerland 7 May 1965; 10 March 1992; and 7 Feb 1979; Taiwan Province of China 5 Sept 1990; Tanzania, United Republic of 2 May 1976; Thailand 20 Oct 1961; and 19 Oct 1988; Trinidad and Tobago 17 Feb 1984; Tunisia 7 May 1981; Turkey 21 Jan 1988; Tuvalu 19 Jan 1972; Ukraine 14 Aug 1995; United Kingdom 28 July 1960; 30 Aug 1983; and 8 Oct 1980; United States 24 July 1987; 23 March 1939; United States 1 Sept 1994; and 13 June 1983; Venezuela 8 Sept 1993; Viet Nam 24 March 1994; Yugoslavia (former) 18 June 1980; Zambia 18 March 1974; Zimbabwe 10 March 1989.
UNCTAD WID Country Profile: SWEDEN Page 51 of 54
D. Sources of information Official Sveriges Riksbank Swedish Institute for Growth Policy Studies Secondary
1. Alterstave, Ulrika and Anna Karin Karlsson, “Why foreign service companies invest in Sweden”, Reports in ISA studies on Foreign Direct Investment, 1997/2 (Stockholm: ISA).
2. Andersson, Thomas and Roger Svensson, “Entry modes for direct investment determined by the composition of firm specific skills”, Scandinavian Journal of Economics, 96(4), 1994, pp. 551-560.
3. Blomberg, Gunnar and Johan Östberg, “Market valuation of external position” , Quarterly Review, Sveriges Riksbank (Stockholm: 1999), pp. 29-42.
4. Blomström, Magnus and Robert E. Lipsey, "The export performance of U.S. and Swedish multinationals", Review of Income and Wealth, 35(3), September 1989, pp. 245-264.
5. Blomström, M. and A. Kokko, “Foreign Direct Investment and Politics: The Swedish Model”, Working paper no. 66, EFI, Handelshögskolan i Stockholm, 1995.
6. Blomström, Magnus and Ari Kokko, "Outward investment, employment, and wages in Swedish multinationals", Oxford Review of Economic Policy, Autumn 2000, 16 (3), p. 76.
7. Blomstrom, Magnus and Linda S. Goldberg (eds.), Topics in Empirical International Economics: A festschrift in honor of Robert E. Lipsey, NBER Conference Report Series, (Chicago: University of Chicago Press, 2001), pp. 272.
8. Braconier, Henrik, K. Ekholm, K. K. H. Midelfart, “In search of FDI-Transmitted R&D spillovers: A study based on Swedish data”, Weltwirtschaftliches Archiv/Review of World Economics, 2001, 137(4), pp. 644-65.
9. Braunerhjelm, Pontus and Roger Svensson, “Host country characteristics and agglomeration in foreign direct investment”, Applied Economics, July 1996, 28(7), pp. 833-840.
10. Braunerhjelm, Pontus, and Lars Oxelheim, “Structural implications of the investment response by Swedish multinational firms to the EC 1992 Program”, in Hirsch, Seev and Tamar Almor, eds. Outsiders’ Response to European Integration (Copenhagen: Handelshojskolens, Copenhagen Business School Press), 1996, pp. 99-118.
11. Braunerhjelm, P., K. Ekholm, L. Grundberg and P. Karpaty, Swedish Multinational Corporations: Recent Trends in Foreign Activities, IUI Working Paper No. 462, 1996.
12. Braunerhjelm, P. and Robert E. Lipsey, “Geographical specialization of US and Swedish FDI activity”, in P. Braunerhjelm and K. Ekholm (eds.), The Geography of Multinational Firms (Boston, Dordrecht, London: Kluwer Academic Publishers Group, 1998), pp. 33-57.
13. Braunerhjelm, Pontus and L. Oxelheim, “Does foreign direct investment replace home country investment? The effect of European integration on the location of Swedish investment”, Journal of Common Market Studies, June 2000, 38(12), pp. 199-221.
14. Burton, John, “Volvo: test case of foreign investment policy”, case study, Financial Times Survey: South Korea, 20 October, 1999, p.3.
15. Clegg, Jeremy, “The determinants of multinational enterprise: A comparative study of the U.S., Japan, U.K., Sweden and West Germany”, in Casson, Mark, ed. Multinational corporations, (Aldershot, U.K. and Brookfield, Vt.: Elgar, 1990), pp. 578-609.
16. Dufwenberg, Martin, Heikki Koskenkyla, and Jan Sodersten, “Manufacturing investment and taxation in the Nordic countries”, Scandinavian Journal of Economics, 96(3), 1994, pp. 443-61.
17. Economist Intelligence Unit (EIU) ViewsWire, "Sweden economy: Investment prospects", (New York, May 23, 2003).
UNCTAD WID Country Profile: SWEDEN Page 52 of 54

18. Economist Intelligence Unit (EIU) ViewsWire, "Sweden: 5-year forecast - Foreign direct investment", (New York, Feb 5, 2003).
19. Fors, Gunnar and Roger Svensson, “R&D in Swedish multinational corporations”, Working paper 406 (Stockholm: The Industrial Institute for Economic and Social Research, January, 1994), mimeo.
20. Fors, Gunnar, “Utilization of R&D results in the home and foreign plants of multinationals”, Journal of Industrial Economics, 45(3), September 1997, pp. 341-358.
21. Funck, Carina, “Jämförande studie av anställningsskyddet i Sverige och Denmark”, Reports in ISA studies on Foreign Direct Investment, 1998/1 (Stockholm:ISA).
22. Ghauri, Pervez N., “Emergence of new structures in Swedish multinationals”, in Prasad, Benjamin, ed. Advances in International Comparative Management (Greenwich, Conn. and London: JAI Press, 1990), pp. 227-243.
23. Håkanson, Lars and R. Nobel, “Foreign research and development in Swedish multinationals”, Research Policy, 22, 1993, pp. 373-396.
24. Håkanson, Lars, “Organization and evolution of foreign R&D in Swedish multinationals”, in Casson, Mark, ed. Multinational Corporations (Aldershot, U.K. and Brookfield, Vt.: Elgar), 1990, pp. 273-282.
25. Hatzius, J., Domestic Jobs and Foreign Wages: Labor Demand in Swedish Multinationals, Center for Economic Performance, Discussion Paper No. 333 (London, 1997).
26. ILO, The Nordic Countries and Multinational Enterprises – Employment Effects and Foreign Direct Investment (Geneva: ILO), 1989.
27. Ivarsson, I., Integrated International Production. A Survey of Foreign Transnational Corporations in Sweden (Department of Geography: University of Göteborg, 1996), series B, no. 90.
28. Ivarsson, Inge, “Competitive industry clusters and inward TNC investment: the case of Sweden”, Reports in ISA studies on Foreign Direct Investment, 1998/4, (Stockholm: ISA).
29. Jonsson, T. (1995), Value creation in M&A: A Study of Swedish Domestic and Foreign Takeovers (Uppsala: Uppsala Universtitet, 1995).
30. Lundberg, Lars, "European Economic Integration and the Nordic Countries' Trade", Journal of Common Market Studies, 30(2), June 1992, pp. 157-173.
31. Magnusson, Ake, “Swedish trade and investment links with Southern Africa”, in Oden, Bertil, ed. Southern Africa After Apartheid: Regional Integration and External Resources (Uppsala: Scandinavian Institute of African Studies, 1993), pp. 247-259.
32. Mathä, Thomas, “European integration and geographical concentration of Swedish multinationals”, Stockholm School of Economics, Working paper no. 305, February 1999, 29 p.
33. Mauwet-Hunt, Christiane, Practical Guide to Foreign Direct Investment in the European Union: Austria, Belgium, Britain, Denmark, Finland, France, Germany, Greece, Ireland, Italy, Luxembourg, Netherlands, Portugal, Spain, Sweden (Genval: Euroconfidential S.A, 1997), p. 385.
34. Modén, Karl-Markus, “Foreign acquisitions of Swedish companies – effects on R&D and productivity”, Reports in ISA studies on Foreign Direct Investment, 1998/2 (Stockholm: ISA).
35. Modén, Karl-Markus, “Patterns of foreign direct investment into Sweden”, in P. Braunerhjelm and K. Ekholm (eds.), The Geography of Multinational Firms (Boston, Dordrecht, London: Kluwer Academic Publishers Group, 1998), pp. 135-155.
36. OECD, OECD Reviews of Foreign Direct Investment: Sweden (Paris: OECD,1993).
37. Olsson, Ulf, “Securing the Markets. Swedish multinationals in historical perspective”, in Jones, Geoffrey and Schroter, Harm G. (eds.), The Rise of Multinationals in Continental Europe (Aldershot, U.K.: Elgar), 1993, pp. 99-127.
38. Östberg, Johan, “Direct investment – interpretations and implications”, Quarterly Review”, Sveriges Riskbank
UNCTAD WID Country Profile: SWEDEN Page 53 of 54
(Stockholm, 1994).
39. Ouazzani, Z. A., A. Sundström and A. Ålenius, Study of the Largest Swedish Manufacturing Groups R&D Activities Abroad 1997. Summary of Experience, A paper prepared for the workshop on “Internationalization of R&D, Comparing Small Countries in a European Perspective”, 1999.
40. Röckert, Fredrika, “Reinvested earnings and direct investment assets”, Quarterly Review, Sveriges Riksbank (Stockholm: 1990).
41. Russell-Walling, Edward, "Acronymic integration: EFTA and the EU", International Business, 7(8), August 1994, pp. 50-57.
42. Samuelsson, H., F. Utländska direktinvesteringar I Sverige (Stockholm: The Industrial Institute for Economic and Social Research (IUI), 1977).
43. Singer, Andrew, “Sweden”, in Dreyer, Jacob S. et al., Industrialized Countries’ Policies Affecting Foreign Direct Investment in Developing Countries (Washington, D.C.: World Bank, 1991), pp. 185-210.
44. Skog, Rolf, “Foreign acquisitions of shares in Swedish companies”, Quarterly Review, Sveriges Riksbank (Stockhom, 1992).
45. Strandell, A., R&D Activities of Swedish Firms Abroad and of Foreign Affiliates in Sweden, A paper prepared for the workshop on “Internationalization of R&D, Comparing Small Countires in a European Perspective”, 1999, mimeo.
46. Ström, Per Arne, “Foreign ownership”, Quarterly Review, Sveriges Riksbank (Stockholm, 1990).
47. Svenska Bankfilialgruppen, Utländska Bankfilialer i Sverige: Förslag (Stockholm, Allmänna Förlaget, 1989), 129 p.
48. Svensson, Roger, “Domestic and foreign investment by Swedish multinationals”, Working paper no. 391 (Stockholm: The Industrial Institute for Economic and Social Research (IUI), 1993), mimeo.
49. Svensson, Roger, “Effects of overseas production on home country exports: evidence based on Swedish multinationals”, Weltwirtschaftliches Archiv, 132(2), 1996, pp. 304-329.
50. Swedenborg, B., The Multinational Operations of Swedish Firms: An Analysis of Determinants and Effects (Stockholm: The Industrial Institute for Economic and Social Research (IUI), 1979).
51. Swedenborg, B., "Sweden", in Dunning, J. (ed.), Multinationals, Market Structure and International Competitiveness (Chichester, United Kingdom, J. Wiley, 1985).
52. Swedenborg, B., Göran Johansson-Grahn and Mats Kinnwall, Den Svenska Industrins Utlandsinvesteringar 1960-1986 (Stockholm, Industriens Utredningsinstitut, 1988).
53. Thunmann. Carl G., Techonology Licensing to Distant Markets : Interaction Between Swedish and Indian Firms (Uppsala, Sweden, Uppsala University, 1988), 144 p.
54. Vahlne, Jan Erik, Kjell Nordstrom and Styrbjorn Torbacke, “Swedish multinationals in Central and Eastern Europe. Entry and subsequent development”, Journal of East-West Business, 1(4), 1996, pp. 1-16.
55. WTO, Trade Policy Review: Sweden (Geneva: WTO, 1995).
56. Zejan, Mario C., “New ventures of acquisitions. The choice of Swedish multinational enterprises”, Journal of Industrial Economics, 38(3), March 1990, pp. 349-355.
57. Zejan, Mario Carlos, “R&D activities in affiliates of Swedish multinational enterprises”, Scandinavian Journal of Economics, 92(3), 1990, pp. 487-500.
58. Zejan, Mario Carlos, Studies in the Behavior of Swedish Multinationals (Ekonomiska studier utgivna av Nationalekonomiska Institutionen, Handelshögskolan vid Göteborgs universitet, 1988), 167 p.
UNCTAD WID Country Profile: SWEDEN Page 54 of 54