Embed Size (px)
Citation preview

NBER WORKING PAPER SERIES
WHY DO FIRMS HOLD SO MUCH CASH? A TAX-BASED EXPLANATION
C. Fritz FoleyJay C. Hartzell
Sheridan TitmanGarry Twite
Working Paper 12649http://www.nber.org/papers/w12649
NATIONAL BUREAU OF ECONOMIC RESEARCH1050 Massachusetts Avenue
Cambridge, MA 02138October 2006
The statistical analysis of firm-level data on U.S. multinational companies was conducted at the InternationalInvestment Division, Bureau of Economic Analysis, U.S. Department of Commerce under arrangementsthat maintain legal confidentiality requirements. The views expressed are those of the authors anddo not reflect official positions of the U.S. Department of Commerce. The authors thank Amy Dittmar,Linda Krull, Ed Outslay, Brad McPhail, John Robinson, Connie Weaver, and seminar participantsat the 2006 American Finance Association Meetings, Australian Graduate School of Management,Chinese University of Hong Kong, the 2005 Tax Symposium at the University of North Carolina atChapel Hill, and the University of Texas at Austin. We would also like to thank John Graham forsupplying tax rate data. All errors are our own. The views expressed herein are those of the author(s)and do not necessarily reflect the views of the National Bureau of Economic Research.
© 2006 by C. Fritz Foley, Jay C. Hartzell, Sheridan Titman, and Garry Twite. All rights reserved.Short sections of text, not to exceed two paragraphs, may be quoted without explicit permission providedthat full credit, including © notice, is given to the source.

Why do firms hold so much cash? A tax-based explanationC. Fritz Foley, Jay C. Hartzell, Sheridan Titman, and Garry TwiteNBER Working Paper No. 12649October 2006JEL No. F23,F3,G32,G35,H25
ABSTRACT
U.S. corporations hold significant amounts of cash on their balance sheets, and these cash holdingshave been justified in the existing empirical literature by transaction costs and precautionary motives.An additional explanation, considered in this study, is that U.S. multinational firms hold cash in theirforeign subsidiaries because of the tax costs associated with repatriating foreign income. Consistentwith this hypothesis, firms that face higher repatriation tax burdens hold higher levels of cash, holdthis cash abroad, and hold this cash in affiliates that trigger high tax costs when repatriating earnings.Estimates indicate that a one standard deviation increase in the tax burden from repatriating foreignincome is associated with a 7.9% increase in the ratio of cash to net assets. In addition, certain firms,specifically those that are less financially constrained domestically and those that are more technologyintensive, exhibit a higher sensitivity of affiliate cash holdings to repatriation tax burdens.
C. Fritz FoleyHarvard Business SchoolSoldiers FieldBoston, MA 02163and [email protected]
Jay C. HartzellFinance DepartmentMcCombs School of BusinessUniversity of Texas at AustinAustin, TX [email protected]
Sheridan TitmanFinance DepartmentMcCombs School of BusinessUniversity of Texas at AustinAustin, TX 78712-1179and [email protected]
Garry TwiteAustralian Graduate School of ManagementUniversity of New South WalesSyndey, NSW [email protected]

1
1. Introduction U.S. corporations hold significant amounts of cash. At the end of fiscal 2004,
cash represented 10.5% of the aggregate assets of all Compustat firms. While this is a
large percentage, for many firms, the dollar value of cash holdings was also large. For
example, at the end of 2004 cash holdings of Microsoft, General Motors, Ford, General
Electric, Exxon Mobil, and Pfizer were respectively $60.6 billion, $36.0 billion, $33.4
billion, $23.2 billion, $23.1 billion, and $19.9 billion. This paper develops and tests the
hypothesis that the magnitude of corporate cash holdings is, in part, a consequence of the
tax incentives faced by U.S. multinational companies. The U.S. and many other
countries tax the foreign income of their firms, but these taxes can be deferred until
earnings are repatriated. As a result, U.S. multinational firms have an incentive to retain
earnings abroad, and to a large extent, these firms hold these funds in cash.
The existing academic literature on cash holdings has paid little attention to the
potential impact of the incentives created by taxes associated with repatriations. The
earliest explanations offered by academic research were based on trade-offs motivated by
transactions costs. These theories suggest that firms hold cash to avoid the cost of being
short liquid assets. Baumol (1952), Tobin (1956), Meltzer (1963), Miller and Orr (1966),
and Karni (1973) develop this argument. Building on this work, Mulligan (1997) finds
evidence of economies of scale in cash holdings. Opler, Pinkowitz, Stulz, and
Williamson (1999) provide evidence that the precautionary incentive to hold cash is
increased when asymmetric information or agency costs make it difficult for firms to
raise external capital and Bates, Kahle, and Stulz (2006) argue that recent increases in
cash holdings can be explained by increases in the precautionary motives for holding
cash. More recent work links changes in cash holdings to these motives. In particular,
Almeida, Campello, and Weisbach (2004) show that financially constrained firms
increase cash holdings by larger amounts when cash flow is high, or, put differently, that
constrained firms have a higher cash flow sensitivity of cash.1
1 Another related line of research examines cash from an agency perspective. Jensen (1986), and Blanchard, Lopez-de-Silanes and Shleifer (1994) consider the hypothesis that managers who have access to liquid assets employ these assets in a manner that is not in the interests of the shareholders. Other studies present evidence of an association between shareholder rights and cash holdings [Dittmar, Mahrt-Smith, and Servaes (2003)], differences in the market value of cash due to agency problems [Dittmar and Mahrt-
2
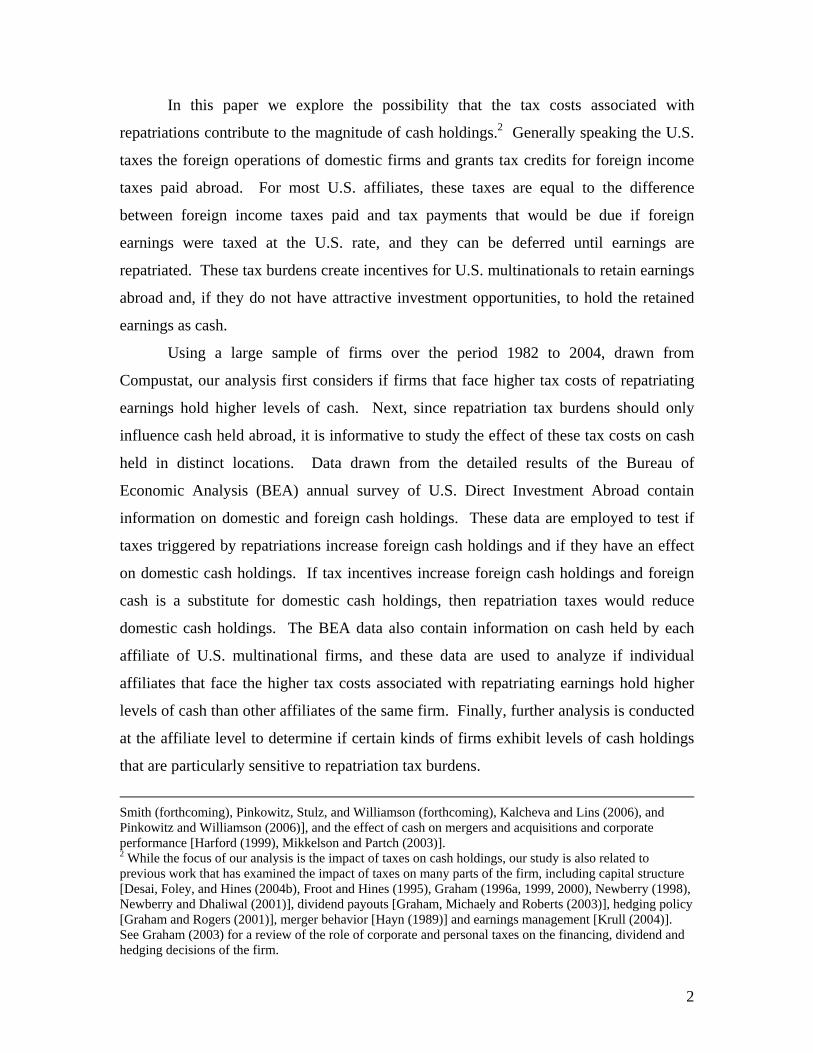
In this paper we explore the possibility that the tax costs associated with
repatriations contribute to the magnitude of cash holdings.2 Generally speaking the U.S.
taxes the foreign operations of domestic firms and grants tax credits for foreign income
taxes paid abroad. For most U.S. affiliates, these taxes are equal to the difference
between foreign income taxes paid and tax payments that would be due if foreign
earnings were taxed at the U.S. rate, and they can be deferred until earnings are
repatriated. These tax burdens create incentives for U.S. multinationals to retain earnings
abroad and, if they do not have attractive investment opportunities, to hold the retained
earnings as cash.
Using a large sample of firms over the period 1982 to 2004, drawn from
Compustat, our analysis first considers if firms that face higher tax costs of repatriating
earnings hold higher levels of cash. Next, since repatriation tax burdens should only
influence cash held abroad, it is informative to study the effect of these tax costs on cash
held in distinct locations. Data drawn from the detailed results of the Bureau of
Economic Analysis (BEA) annual survey of U.S. Direct Investment Abroad contain
information on domestic and foreign cash holdings. These data are employed to test if
taxes triggered by repatriations increase foreign cash holdings and if they have an effect
on domestic cash holdings. If tax incentives increase foreign cash holdings and foreign
cash is a substitute for domestic cash holdings, then repatriation taxes would reduce
domestic cash holdings. The BEA data also contain information on cash held by each
affiliate of U.S. multinational firms, and these data are used to analyze if individual
affiliates that face the higher tax costs associated with repatriating earnings hold higher
levels of cash than other affiliates of the same firm. Finally, further analysis is conducted
at the affiliate level to determine if certain kinds of firms exhibit levels of cash holdings
that are particularly sensitive to repatriation tax burdens.
Smith (forthcoming), Pinkowitz, Stulz, and Williamson (forthcoming), Kalcheva and Lins (2006), and Pinkowitz and Williamson (2006)], and the effect of cash on mergers and acquisitions and corporate performance [Harford (1999), Mikkelson and Partch (2003)]. 2 While the focus of our analysis is the impact of taxes on cash holdings, our study is also related to previous work that has examined the impact of taxes on many parts of the firm, including capital structure [Desai, Foley, and Hines (2004b), Froot and Hines (1995), Graham (1996a, 1999, 2000), Newberry (1998), Newberry and Dhaliwal (2001)], dividend payouts [Graham, Michaely and Roberts (2003)], hedging policy [Graham and Rogers (2001)], merger behavior [Hayn (1989)] and earnings management [Krull (2004)]. See Graham (2003) for a review of the role of corporate and personal taxes on the financing, dividend and hedging decisions of the firm.

3
Our empirical work confirms results presented in the existing literature and yields
four main findings on the relation between taxes and cash holdings. First, firms that
incur higher tax costs when repatriating earnings hold more cash. Estimates predict that a
one standard deviation increase in the tax costs associated with repatriations is associated
with a 7.9% increase in the ratio of cash to net assets (defined as total assets minus cash).
This result is robust across a variety of measures for the repatriation tax burden and
specifications that analyze levels of cash holdings as well as changes in cash holdings.
Second, repatriation tax burdens induce firms to hold more cash abroad. The
median firm facing an above average repatriation tax burden holds 47% of its cash
abroad, but the median firm facing a below average repatriation tax burden holds only
26% of its cash abroad. Measures of increased repatriation tax burdens derived from the
BEA data are associated with increases in foreign cash holdings, but they are
insignificant in explaining domestic cash holdings. Our tests therefore do not have
sufficient power to conclude that these tax burdens reduce domestic cash holdings.
Third, affiliates that trigger high tax costs when repatriating earnings hold higher
levels of cash than other affiliates of the same firm. Nuanced tests compare the cash
holdings of incorporated affiliates to that of foreign branch affiliates, which are not
separate legal entities from their parents. This comparison is enlightening because the
earnings of branches are taxed by the U.S. as they are earned, not as they are repatriated.
Therefore, multinationals do not have a tax incentive to retain earnings in the form of
cash in branches located abroad. Our findings indicate that incorporated affiliates in
lower tax jurisdictions have higher cash holdings but that affiliates that are organized as
branches hold lower levels of cash that do not vary with host country tax rates. These
results are robust to the inclusion of parent firm fixed effects that control for
unobservable time invariant firm characteristics that might affect cash holdings.
Finally, certain types of firms exhibit distinctive sensitivities of affiliate cash
holdings to repatriation tax burdens. Firms that are financially constrained domestically
in the sense of having high levels of domestic leverage and below investment grade (or
no) debt ratings are less likely to defer taxes associated with repatriations by holding cash
abroad. Their affiliate cash holdings are low and are not related to host country tax rates
in a statistically significant way. Technology intensive firms, however, appear to have

4
affiliate cash holdings that are particularly sensitive to the tax costs triggered by
repatriations. Previous work suggests that these firms have more flexibility to shift
profits to low tax locations, and this flexibility appears to increase the sensitivity of the
cash holdings of the affiliates of these firms to host country tax rates.
The remainder of the paper is organized as follows. Section II provides details
about how the U.S. tax code applies to the foreign earnings of U.S. multinational firms
and its implications for corporate cash holdings. Section III describes the data and
defines the proxies for repatriation tax burdens used in the empirical tests. Section IV
presents the empirical results, and Section V concludes.
2. Repatriation Tax Burdens and Cash Holdings
The U.S. tax code affects the incentives of firms to hold foreign earnings abroad
or to repatriate them, and in addition, it influences the decision of whether investments in
liquid securities should be made domestically or abroad. This section describes the tax
rules that apply to the international activities of U.S. multinationals and explains their
implications for corporate cash holdings.
2.1. Taxation of U.S. Multinationals
Nearly all countries tax the income of corporations that operate within their
borders. In addition, the U.S. and other countries tax the foreign income of their
residents. However, to avoid double taxation of foreign income, U.S. law grants tax
credits for foreign income taxes paid abroad. U.S. multinationals are permitted to defer
U.S. tax liabilities on certain foreign profits until they are repatriated. This deferral is
available only on the profits of foreign affiliates that are separately incorporated in
foreign countries. The profits of branches, which are unincorporated foreign affiliates,
are taxed immediately by the U.S.
Generally speaking, the taxes due upon repatriation are equal to the difference
between foreign income taxes paid and tax payments that would be due if earnings were
taxed at the U.S. rate. For example, if the U.S. tax rate is 35% and a U.S. multinational

5
earns $100 abroad and pays $20 in host country income taxes, an additional $15 would be
due in U.S. taxes when the earnings are repatriated. If foreign income taxes paid exceed
the amount that would be due if earnings were taxed at the U.S. rate, then no additional
taxes are due.
There are some important caveats to this generalization. First, the extent to which
firms can avoid U.S. taxes through deferral is limited. Under the Subpart F provisions of
the U.S. law certain kinds of income, classified as “passive income,” are “deemed
distributed” and therefore immediately taxable by the U.S. even if it is not repatriated.
Passive income includes interest income and dividends received from investment in
securities. While firms have discretion in classifying foreign cash holdings as being
necessary for their business operations and thus not subject to passive income tax
treatment, considerations related to Subpart F provisions are salient when considering
where firms should hold liquid, interest bearing securities.
It should also be noted that total U.S. tax obligations are determined by
worldwide averaging. This approach allows firms that pay tax rates above the U.S. tax
rate in a particular jurisdiction to use the foreign tax credits from this jurisdiction to
shield income repatriated from low tax locations from U.S. taxation. However, these
foreign tax credits cannot be used to reduce tax obligations related to income earned
within the U.S. Firms that have total foreign tax payments that exceed the amount that
would be due if U.S. tax rates were applied to total taxable foreign income are
characterized as having excess foreign tax credits. Excess credits from one year can be
used to reduce U.S. taxable income related to foreign earnings in either of two previous
years or five subsequent years.
Other aspects of a firm’s tax status may reduce payments required for U.S. tax
obligations on foreign source income. Tax credits associated with net operating losses
(or investment tax credits earned prior to their repeal) can be used to offset payments due
on foreign source income. Generally speaking, firms that face the alternative minimum
tax (AMT) also have lower repatriation costs than they would if they were to face regular

6
taxes as a consequence of the lower statutory rate applied under the AMT.3 These
considerations indicate the relevance of using a firm’s marginal tax rate when considering
the effects of tax incentives on aggregated repatriations from all affiliates to a parent.
2.2. Implications for Corporate Cash Holdings
Existing empirical evidence indicates that multinational firms are more likely to
retain earnings in low tax jurisdictions.4 Hines and Hubbard (1990) find that in a sample
of U.S. multinational firms drawn from 1984 tax return data, a one percent decrease in
the repatriation tax is associated with a four percent increase in dividend payments by
foreign subsidiaries. Similarly, Grubert (1998) and Grubert and Mutti (2001), using 1990
and 1992 tax return data, find that repatriations are sensitive to tax considerations. Desai,
Foley, and Hines (2001, forthcoming) find that affiliates of U.S. multinationals located in
low tax jurisdictions have lower dividend payout ratios. Specifically, the payout ratios of
incorporated affiliates vary with host country tax rates, but the payout ratios of branches
do not.
Furthermore, despite the tax treatment of passive income, firms choosing to invest
earnings from a low tax foreign jurisdiction in cash either at home or in the low tax
jurisdiction often have an incentive to hold this cash in the low tax jurisdiction. To
illustrate this point, consider the case of an incorporated affiliate that earned $100 and
pays $20 in foreign income taxes. If the firm repatriates these earnings immediately, it
pays an additional $15 in U.S. taxes and then can invest the remaining $65 in the liquid
security. Any earnings associated with this investment are taxed at the U.S. rate.
However, if the firm does not repatriate the earnings, it will be able to invest $80 in the
liquid security. While Subpart F regulations require the firm to pay U.S. taxes on
3 Although there are situations in which the AMT can increase the cost of repatriating earnings, in most cases the costs are identical or lower under the AMT. Lyon and Silverstein (1995) explain the effects of the AMT on multinational behavior in detail. 4 Under a restrictive set of assumptions, U.S. tax code would not affect the decision to repatriate earnings immediately or at a later time. Applying the trapped equity view of dividend taxation, Hartman (1985) illustrates that retaining earnings for a finite period of time would not avoid tax obligations. Although retaining foreign earnings might reduce immediate U.S. tax obligations, future U.S. tax obligations would be higher. Empirical evidence suggests that the assumptions in Hartman (1985) do not reflect the realities of the experience of U.S. multinationals. Changes in corporate tax rates and changes in the excess foreign tax credit of multinationals give rise to incentives to retain earnings in low tax jurisdictions.

7
earnings associated with this investment, the firm will be better off holding cash abroad
because by doing so it defers the repatriation taxes on the original $100 of earnings which
are active earnings.
Taken together, the findings of previous work and the principles of the U.S. tax
code suggest that multinational firms that face high repatriation tax burdens should retain
a greater share of their earnings abroad. Unless there are immediate funding needs, some
part of these earnings is likely to be held in the form of cash. Within firms, the tax
incentives giving rise to these patterns of behavior should be operative for separately
incorporated affiliates, but they should not have effects on the behavior of affiliates that
are organized as branches. Affiliates with this organizational form should therefore have
lower cash holdings and their cash holdings should not be a function of the tax rates of
their host countries.
Finally, multinationals have incentives to shift income to low tax jurisdictions
through their production location decisions and transfer pricing choices.5 Anecdotal
evidence suggests that technology intensive firms can shift income to low-tax
jurisdictions more easily than other types of firms for at least two reasons. First,
technology intensive firms typically have high profit margins and intangible assets like
intellectual property that are easy to transfer within the firm. Affiliates in low tax
jurisdictions can purchase intellectual property from the parent while it is under
development, thus allowing firms to avoid taxes on profits generated by technologies that
prove to be successful. Secondly, even if the U.S. parent retains ownership of the
intellectual property, technology firms are likely to have significant latitude in allocating
earnings to countries with low taxes through royalty payments or transfer pricing.
If affiliates produce goods that make use of intangible property developed by the U.S.
parent, tax law requires the affiliate to make a royalty payment to the parent that reflects
5 An extensive literature indicates that multinationals are able to shift profits to low tax jurisdictions. This literature analyzes patterns of reported profitability and intrafirm trade of U.S. multinational firms. See, for example, Grubert and Mutti (1991); Harris, Morck, Slemrod and Yeung (1993); Klassen, Lang and Wolfson (1993); Hines and Rice (1994); Collins, Kemsley, and Lang (1998); Clausing (2001); and Desai, Foley, and Hines (2004a); this literature is critically reviewed in Hines (1999). Some low-tax jurisdictions are so valuable to multinationals from a tax avoidance standpoint that they have been identified by the IRS and other sources as being “tax havens.” Desai, Foley, Hines (2006) analyzes the use of havens by U.S. multinationals and finds that nearly 60% of U.S. firms with substantial foreign operations had an affiliate presence in a tax-haven country.

8
that market value of the intangible property and that covers some of the fixed costs of
producing it, but tax authorities find it particularly difficult to assess if firms assign fair
values in these cases. Similarly, when an affiliate buys a good produced by the parent to
distribute it elsewhere, it is supposed to pay a transfer price that would be paid by
unrelated parties, but these transfer prices can also be difficult to assess. As a
consequence, technology intensive firms are likely to have higher levels of retained
earnings held as cash and to exhibit a higher sensitivity of affiliate cash holdings to host
country tax rates. This argument suggests that the observed tendency of R&D intensive
firms to hold cash may be generated from tax considerations rather than the precautionary
or transactions costs motivations discussed in the existing literature.
While these arguments predict that repatriation tax burdens will affect corporate
cash holdings, the tax on repatriated earnings may have no effect on cash balances for a
variety of reasons. First, even if the tax law leads firms to retain earnings in their
overseas subsidiaries, firms may increase investment rather than cash holdings.6 Second,
if firms target an overall cash balance, they may hold less cash in the U.S. to offset the
cash they view as trapped overseas. Third, firms have various tax avoidance strategies at
their disposal, and they may use them to make repatriation taxes irrelevant. For example,
affiliates in low tax environments can lend to or invest in another foreign affiliate. When
an affiliate buys the equity of another affiliate that was owned by the parent, the firm can
return cash to the U.S. without triggering repatriation taxes. If these kinds of strategies
are effective and not too costly, one would find no relation between firms' cash holdings
and their tax costs due to repatriation. These possibilities form the basis for our null
hypothesis of no relation between taxes and cash holdings.
6 As discussed in Section 2, U.S. tax law contains provisions designed to encourage re-investment of earnings rather than holding cash. These provisions prevent U.S. multinational firms from deferring the taxes due on earnings of passive investments like interest and dividends received from investments in securities. Passive income is deemed distributed, and therefore immediately taxable in the U.S., even if not repatriated as dividend payments. Earnings reinvested in active business operations are not subject to these provisions.

9
3. Data
The data used in the analysis below are drawn from two primary sources. This
section begins by describing these two sources and the measures of cash holdings that are
computed using them. Then it explains in detail how proxies for the tax burden of
repatriations are calculated.
3.1. Cash Holdings and Multinational Activity
Our initial sample is drawn from Compustat. It covers the period 1982 through
2004 and includes all firm-years with at least $100 million in assets in 1984 real dollar
terms. Firms that are not incorporated in the U.S. are excluded from the sample because
U.S. repatriation tax obligations do not apply to them. To be consistent with previous
work, financial firms are excluded because these firms must meet statutory capital
requirements and hold inventories of marketable securities that are included in cash.
Utility firms are also excluded because their cash holdings are subject to regulatory
supervision in many jurisdictions.
Following Opler et al. (1999), the primary dependent variable used in the analysis
below is the natural logarithm of the ratio of cash to net assets (defined as total assets less
cash), Ln(Cash/Net Assets). When using the Compustat data, we employ Data Item 1,
defined as cash and short-term investments, as our cash measure. This measure is a
consolidated measure of cash holdings.
Our analysis of the Compustat sample also accounts for several variables that
have been shown to affect cash holdings in the existing literature. In illustrating the
importance of transactions cost and precautionary motives for holding cash, Opler et al.
(1999) show that firms with strong growth opportunities and riskier cash flows hold more
cash. As proxies for the former, we use the ratio of the book value of equity to the
market value of equity (shares outstanding times price per share), labeled Book Value of

10
Equity/Market Value of Equity,7 and the ratio of research and development expenses to
total assets, R&D Expenditures/Total Assets. Following Opler et al. (1999), we set this
variable to zero if the numerator is missing in Compustat. To measure the volatility of
cash inflows, we follow Opler et al. (1999) and calculate the Standard Deviation of
Operating Income, which is equal to the standard deviation, over the sample period, of
the ratio of the firm's earnings before interest, taxes, and depreciation to total assets.8
Opler et al. (1999) also shows that firms that have the greatest access to capital,
like large firms and firms that pay a dividend, hold less cash. To control for this
consideration, we include the Log of Assets, the natural logarithm of total assets as a
proxy for firm size and Dividend Dummy, an indicator variable that equals one if the firm
pays a dividend in a given year and zero otherwise. In addition to these variables, Opler
et al. (1999) also control for capital expenditures and leverage. As a measure of
investment, we include Capital Expenditure/Total Assets, the ratio of capital expenditures
to total assets, and as a measure of leverage we include Market Leverage, which is equal
to the ratio of total debt to the sum of total debt and the market value of equity.
At the overall corporate level, Compustat covers both multinational and purely
domestic firms. The two data items of particular value to the analysis presented below
are Pretax Income—Foreign (Data Item 273) and Income Taxes—Foreign Current (Data
Item 64). Pretax Income—Foreign represents the income of a company’s foreign
operations before taxes. Income Taxes—Foreign Current represents the current amount
of income taxes payable to foreign governments. These data items are only reported by
some firms, and there are no other indicators of the extent of a firm’s foreign operations.9
The analyses presented in Tables 2 and 3 are therefore conducted using two samples that
are constructed making distinct assumptions—one sample is generated without adjusting
7 To reduce the potential impact of outliers we winsorize this variable at the 1% level in each tail of the distribution. Even though most of our other independent variables are also calculated as ratios, upon inspection they are not subject to outlier problems. 8 Opler et al. (1999) estimate both industry and firm-level cash flow standard deviation using the previous twenty years. Limitations on the duration of our sample prevent us from adopting the same approach; rather, we estimate a contemporaneous standard deviation over the full sample period. To obtain cross-sectional variation, we construct this at the firm level. 9 Security and Exchange Commission regulations stipulate that firms should separately report foreign activities in each year that foreign assets or revenues or income exceed 10% of total activities. These regulations also require firms to report foreign income taxes if these exceed 5% of total income before taxes.

11
the raw data and the other is generated assuming that missing values of foreign income
and taxes are equal to zero, as would be the case if firms with missing values were purely
domestic firms without foreign operations.
In our tests, we recognize that firms with more foreign income, all else equal, may
hold more cash, even in the absence of our tax effect. First, a delay between when the
cash from earnings is received and when it is used generates a mechanical positive
relation between cash holdings and income. Second, firms with more foreign businesses
may require more precautionary cash holdings if investment opportunities abroad are
greater or more volatile than domestic opportunities, or alternatively, if raising capital for
foreign operations is more difficult. To control for these effects, we include the ratios of
pre-tax foreign and domestic income to total assets, Foreign Income/Total Assets and
Domestic Income/Total Assets, in our regression tests. The first panel of Table 1 presents
descriptive statistics for all of the variables that are computed from Compustat data and
used in the analysis below.
[Table 1 about here]
More detailed data on multinationals are drawn from the Bureau of Economic
Analysis (BEA) annual survey of U.S. Direct Investment Abroad. These data provide a
panel of data on the financial and operating characteristics of U.S. multinational firms
operating abroad. U.S. direct investment abroad is defined as the direct or indirect
ownership or control by a single U.S. legal entity of at least ten percent of the voting
securities of an incorporated foreign business enterprise or the equivalent interest in an
unincorporated foreign business enterprise. A U.S. multinational entity is the
combination of a single U.S. legal entity that has made the direct investment, called the
U.S. parent, and at least one foreign business enterprise, called the foreign affiliate. As a
result of confidentiality assurances and penalties for noncompliance, BEA believes that
coverage is close to complete and levels of accuracy are high.
The survey forms that U.S. multinational enterprises are required to complete
cover both domestic and foreign operations, and they vary depending on the year, the size
of the affiliate, and the U.S. parent’s percentage of ownership of an affiliate. Although

12
many data items like net income and assets are collected for a broad sample on an annual
basis, data on cash holdings are only available for larger affiliates and their parents in
1982, 1989, 1994, and 1999, when BEA conducted benchmark surveys. In these years,
surveys captured information on the cash holdings of individual subsidiaries located in
different countries and the domestic cash holdings of U.S. multinationals.10 Cash is
defined to include deposits in financial institutions and other cash items. In order to
analyze the BEA data in conjunction with Compustat data these data sets are merged
using IRS issued employer identification numbers.
In addition to providing information on cash holdings in distinct locations, the
BEA data are also the source of the detailed controls used in the analysis of affiliate cash
holdings. The controls include identifiers indicating if individual affiliates are organized
as branches and therefore subject to unique tax treatment. They also provide domestic
parent and affiliate level data on the scale of operations, R&D expenditures, capital
expenditures, leverage, and returns.11 These variables are used to control for factors that
affect cash holdings through alternative channels than the channel of repatriation taxes.
The bottom panel of Table 1 presents descriptive statistics for the variables constructed
using the BEA data.
3.2. The Tax Burden of Repatriations
Ideally, in order to identify the impact of repatriation taxes on cash holdings, one
would like to know if affiliates are organized as branches, the value of accumulated
foreign affiliate earnings, and the tax costs of repatriating these accumulated earnings.
Large sample systematic data on these items are not available, so it is necessary to
employ proxies and conduct a variety of indirect tests. 12
10 In 1982, 1989, and 1994, all affiliates with an absolute value of sales, assets, or net income in excess of $3, $15, and $50 million respectively and their parents were required to report cash holdings. In 1999, all majority owned affiliates and parents with an absolute value of sales, assets, or net income in excess of $100 million were required to report cash holdings. 11 To reduce the potential impact of outliers, Affiliate Net Income/Affiliate Assets, the Standard Deviation of Affiliate Net Income/Affiliate Assets, Domestic R&D/Domestic Assets, Affiliate R&D/Affiliate Assets, Affiliate Capital Expenditures/Affiliate Assets, and Affiliate Leverage are winsorized at the 1% level in each tail of the distribution. 12 In their tax footnotes, many firms do report the value of accumulated earnings that they do not anticipate repatriating. These are classified as permanently reinvested earnings. Krull (2004) uses hand collected

13
The Compustat data do not provide detailed information about where
multinationals have foreign operations, but they do include information about the levels
of foreign income taxes paid and foreign pretax income. With these data, it is possible to
compute a proxy for the tax burden associated with repatriations that we refer to as the
Tax Costs of Repatriating Earnings. This variable is computed by first subtracting
foreign taxes paid from the product of a firm's foreign pretax income and its marginal
effective tax rate as calculated in Graham (1996b). Then the maximum of this difference
or zero is scaled by total firm assets. This proxy for the repatriation tax burden is
appropriate for use in analysis of levels of cash holdings if accumulated earnings are
proportional to current earnings and foreign tax rates are similar to those charged when
accumulated earnings were taxed abroad. However, these assumptions may not hold.
Earnings or foreign tax rates may change so that the Tax Costs of Repatriating Earnings
best reflect the tax costs of repatriating earnings in only a single period. To address this
issue, the analysis in the next section studies the effects of the Tax Costs of Repatriating
Earnings on changes in cash holdings in addition to levels of cash holdings. For the Tax
Costs of Repatriating Earnings to be a reasonable proxy, most affiliates must also be
incorporated entities and not branches. The descriptive statistics in Table 1 show that,
according to the BEA data, only 6.4% of affiliate observations are observations of
affiliates organized as branches.
Although Section 2.1. indicates that a firm’s marginal tax rate is the relevant rate
to consider when computing the Tax Costs of Repatriating Earnings, estimates of these
rates require making a number of assumptions, as explained in Graham (1996b). It is
therefore informative to compute proxies for repatriation tax burdens using U.S. statutory
rates. The Alternative Tax Cost of Repatriating Earnings is computed in the same way as
the Tax Costs of Repatriating Earnings, but with U.S. statutory tax rates used in place of
marginal tax rates.
The BEA data include detailed information about where firms have foreign
operations, so it is possible to use these data in conjunction with data on subsidiary host
country tax rates to compute the effective tax rate a firm would face if it were to
data on earnings retained abroad and classified as permanently reinvested for 267 firms and shows that this designation is used to manage earnings. Collins, Hand, and Shackelford (2001) collect permanently reinvented earnings data on 340 firms and study how the market values these earnings.

14
repatriate its earnings. The Effective Repatriation Tax Rate is computed by first taking
the maximum of zero and the difference between the weighted foreign tax rate a firm
faces and its marginal effective tax rate as calculated in Graham (1996b), and then
multiplying this value by the share of firm activity that is generated abroad. Assets and
other accounting items do not provide clean bases for weighting tax rates and computing
the share of firm activity abroad because of potential double counting problems. For
example, part of a subsidiary’s assets is financed by equity invested by the parent, which
appears as an asset on a parent’s balance sheet. Therefore, the analysis employs two
variables for weighting and computing shares that are not subject to double counting: net
property plant and equipment and employment.
Unlike the Tax Cost of Repatriating Earnings variable, the Effective Repatriation
Tax Rate is not based on a single year of foreign earnings. It is related to stocks of firm
activity, and therefore it is reasonable to analyze how it affects levels of cash holdings.
In addition, because the BEA data on parent and subsidiary cash holdings are not
collected on an annual basis, it is not possible to study changes in parent and subsidiary
cash. The Effective Repatriation Tax Rate is an appropriate measure of the repatriation
tax burden if accumulated earnings are proportional to the level of firm activity in distinct
jurisdictions. Accumulated earnings may, however, be higher in low tax locations,
reflecting the incentives of multinationals to engage in transfer pricing.13 The Tax Costs
of Repatriating Earnings proxy for the repatriation tax burden is not subject to this
concern because it is computed using measures of foreign income. The Alternative
Effective Repatriation Tax Rate variables are computed using U.S. statutory tax rates in
place of marginal tax rates. Descriptive statistics for all the proxies for the repatriation
tax burden appear in Table 1.
Fig. 1 presents the median ratio of consolidated cash holdings to consolidated
total assets less consolidated cash holdings for firms that face above and below average
Effective Repatriation Tax Rates. As is evident from the figure, firms facing higher
repatriation tax burdens hold more cash. The median firm facing above average effective 13 The Effective Repatriation Tax Rate might be a poor proxy for the tax burden of repatriation if levels of affiliate activity do not indicate levels of accumulated earnings because of differences in affiliate age. Robustness tests address this possibility. This proxy is also imperfect if foreign tax rates differ from those charged when accumulated earnings are taxed. The analysis of changes in cash holdings below is not subject to this concern.

15
repatriation tax rates holds 6.7% of net assets in cash, while the median firm facing below
average effective repatriation tax rates holds only 4.6% of net assets in cash. While
illustrative, the comparison in Fig. 1 does not control for a variety of other factors that
have been shown to affect cash holdings. The analysis in the next section attempts to do
so.
[Fig. 1 about here]
4. Results
The analysis in this section first considers the effects of repatriation tax burdens
on consolidated cash holdings. Then it explores the extent to which these tax costs affect
foreign and domestic cash holdings. Finally, it studies the effects of these costs on the
cash holdings of individual affiliates of the same firm and conducts tests that reveal if
certain types of firms exhibit distinctive response to repatriation tax costs.
4.1. Consolidated Cash Holdings
Table 2 presents the results of specifications that include the above mentioned
proxies for the precautionary motives that were considered in Opler et al. (1999) along
with proxies for the repatriation tax burden. The dependent variable is the natural
logarithm of the ratio of consolidated cash holdings to consolidated total assets less
consolidated cash holdings.14 Each specification includes fixed effects for each industry
(using two-digit SIC codes) and each year. The sample used in columns 1 and 3 covers
all Compustat firms, assuming that firms that do not report foreign income or foreign
14 Similar results are obtained if instead the dependent variable is computed as the natural logarithm of one plus the ratio of consolidated cash holdings to consolidated total assets less consolidated cash holdings, which would mitigate the effect of taking the log of ratios that are very close to zero. Similar results are also obtained if one addresses outliers by winsorizing the ratio of consolidated cash holdings to consolidated total assets less consolidated cash holdings at the 1% level in each tail of the distribution.

16
income taxes do not have foreign income or pay foreign taxes, and the sample used in
columns 2 and 4 includes only those firms that report foreign income and foreign taxes.15
[Table 2 about here]
The coefficient on the Tax Costs of Repatriating Earnings variable in columns 1
and 2 is positive and significant. The 16.56 coefficient on the Tax Costs of Repatriating
Earnings in column 2 implies that a one standard deviation increase in the Tax Costs of
Repatriating Earnings is associated with a 7.9% increase in the ratio of cash to net assets.
Very similar results are also obtained if the Alternative Tax Costs of Repatriating
Earnings (computed using U.S. statutory rates) is used, as in columns 3 and 4. Tax costs
associated with repatriating foreign earnings appear to increase corporate cash holdings.
Across the specifications in Table 2, the coefficients on Domestic Income/Total
Assets and Foreign Income/Total Assets are positive, indicating that firms that are more
profitable hold more cash. However, the coefficients on Foreign Income/Total Assets are
of a much larger magnitude, and they all differ from zero by a statistically significant
amount while those on Domestic Income/Total Assets do not. Therefore, aggregate cash
holdings appear to be especially sensitive to fluctuations in foreign income.
The other variables in Table 2 have coefficients that are similar to those estimated
elsewhere. Large firms and firms that pay dividends hold less cash. These results have
been interpreted as indicating that firms with a greater ability to access capital—because
they are larger or can cut their dividend—have less of a need to hold cash. Firms with
strong growth opportunities (or low Book Value of Equity/Market Value of Equity) and
higher standard deviations of operating income hold more cash. Firms with high levels
of R&D expenditures also hold more cash. These results are consistent with the
hypothesis that cash is especially valuable to firms with high investment needs and
volatile earnings because external finance is costly. The coefficient on Capital
Expenditures/Total Assets is negative and significant, which may reflect that as firms
pursue profitable investment opportunities, cash holdings are depleted, giving rise to a
15 Only a limited number of firms report foreign income and foreign income taxes in 1982 and 1983, so missing values are not replaced with zeros in these years when creating the sample used in columns 1 and 3.

17
negative contemporaneous relationship. The coefficient on Market Leverage is also
negative and significant, suggesting that firms that make extensive use of debt also hold
low levels of cash.
The Tax Cost of Repatriating Earnings provides a direct measure of the tax costs
associated with earnings in just a single year, and it may not reflect the tax burden of
repatriating accumulated earnings. In order to address this issue, the specifications in
Table 3 analyze marginal changes in cash over a single year, using the change in the ratio
of consolidated cash holdings to consolidated total assets less consolidated cash
holdings.16 As in Table 2, all the specifications include industry and year fixed effects,
and the first and third specifications are run on samples that include all Compustat firms
and the second and fourth are run on samples of just firms reporting foreign pretax
income and foreign income taxes.
[Table 3 about here]
The coefficients on the Tax Cost of Repatriating Earnings in specifications 1 and
2 are again positive and significant. The 1.0540 coefficient on the Tax Cost of
Repatriating Earnings reported in column 2 indicates that a one standard deviation
increase in the Tax Cost of Repatriating Earnings is associated with a 0.0050 change in
the ratio of cash to net assets. This estimate implies that a one standard deviation
increase in the Tax Cost of Repatriating Earnings increases the level of Cash/Net Assets
by 7.7% of its median value of 0.0650. The economic significance of the results
presented in Table 3 is therefore very similar to the economic significance of the results
presented in Table 2. The results presented in columns 3 and 4 of Table 3 show that
proxies for repatriation tax burdens that use U.S. statutory rates instead of U.S. marginal
tax rates are also positive and significantly related to changes in cash holdings.
The BEA data include detailed information on where firms have foreign
operations, so it is possible to use data on subsidiary host country tax rates to compute an
alternative proxy for repatriation tax burdens, the Effective Repatriation Tax Rate. Table
4 presents results of specifications that include this variable in regressions on the cash
16 This variable is winsorized at the 1% level in each tail of the distribution.

18
holdings variable used in the Table 2 regressions. Since the Effective Repatriation Tax
Rate is a measure of exposures to tax costs based on stocks of multinational activity, it is
appropriate to use it in specifications explaining levels of cash holdings. The sample is
drawn from the 1982, 1989, 1994, and 1999 BEA benchmark years, and it includes only
those observations in which Compustat can be matched with BEA data.
[Table 4 about here]
The positive and significant coefficient on the Effective Repatriation Tax Rate
(Net PPE Weighted) in column 1 indicates that firms facing higher tax consequences of
repatriating earnings hold more cash. The coefficient on the Alternative Effective
Repatriation Tax Rate (Net PPE Weighted) is also positive and significant and slightly
larger in magnitude. Measures of effective repatriation tax rates computed with
employment to weight foreign tax rates and the share of firm activity abroad also have a
positive impact on consolidated cash holdings, as indicated in columns 3 and 4.17 In each
of the specifications presented in Table 4, the controls have effects that are very similar to
the effects estimated in Table 2.
Taken together, Tables 2, 3, and 4 present consistent evidence that the tax costs of
repatriating foreign earnings significantly increase consolidated cash holdings. This
finding appears in our analysis of the levels of cash holdings as well as changes in cash
holdings, and it is robust across a variety of measures of the tax burden of repatriations.
4.2. Domestic and foreign cash holdings
If repatriation tax burdens increase cash holdings, they should increase cash held
abroad, and if cash held abroad substitutes for cash held domestically, then higher
repatriation tax burdens could reduce domestic cash holdings. The results in Tables 2, 3, 17 As noted in footnote 13, the Effective Repatriation Tax Rate might be a poor proxy for the tax burden of repatriation if levels of affiliate activity do not indicate levels of accumulated earnings because of differences in affiliate age. To consider this possibility, specifications that include average affiliate age and average affiliate age interacted with measures of effective repatriation tax rates are included in the specifications presented in Table 4. The coefficients on these variables are not significant, and their inclusion does not change the size or significance of coefficients on the effective repatriation tax rates in a meaningful way.

19
and 4 indicate that repatriation tax costs increase consolidated cash holdings, which is
inconsistent with the hypothesis that U.S. cash reductions completely offset higher
foreign cash holdings. The data shown in Fig. 2 and the specifications presented in
Tables 5 and 6 shed further light on these hypotheses. Fig. 2 shows the median share of
cash held abroad by U.S. multinationals that face above and below average effective
repatriation tax rates, computed using net PPE weights. The median firm facing above
average rates holds 47% of its cash abroad, but the median firm facing below average
rates holds only 26% of its cash abroad. This figure suggests that repatriation tax burdens
increase foreign cash holdings relative to domestic cash holdings. Tables 5 and 6 present
results of studying the effects of repatriation tax burdens on cash holdings in each of
these locations in a regression framework.
[Fig. 2 about here]
[Table 5 about here]
The specifications presented in Tables 5 and 6 are identical to those presented in
Table 4, except the numerator of the dependent variable is foreign cash holdings for the
analysis presented in Table 5 and domestic cash holdings for the analysis presented in
Table 6. The sample used for these tests is the subset of observations that appear in both
Compustat and the BEA data that report both domestic and foreign cash holdings.18 In
Table 5, the coefficients on the effective repatriation tax rate variables are all positive,
statistically significant, and larger in magnitude than the coefficients on these variables in
Table 4. In fact, each measure of effective tax rates has an effect on foreign cash
holdings that is more than twice as large as its effect on consolidated cash holdings.
Thus, repatriation tax burdens appear to affect where the cash is held.
[Table 6 about here]
18 Because only certain affiliates and parents report cash holdings, the sample is smaller than the sample used in the analysis presented in Table 4.

20
The tests presented in Table 6 estimate the effect of repatriation tax burdens on
domestic cash holdings. Although the point estimates of the coefficients on the effective
repatriation tax rate variables are all negative, which is consistent with lower U.S. cash
holdings offsetting higher foreign cash holdings, they are not statistically significant.
Therefore, it is not possible to conclude that firms facing higher tax costs of repatriation
hold less cash domestically. Several factors limit the extent to which cash held abroad
can substitute for cash held domestically. As a consequence of the tax costs of
repatriations and the limits on other methods of relocating cash to the U.S., foreign
retained earnings are costly to access. In addition, capital providers to the domestic
operations of a multinational are skeptical about the extent to which cash held abroad is a
pledgeable asset because of the territorial nature of bankruptcy law. There is a
remarkable void in the laws governing multinational bankruptcies, but respect for the
laws of the country in which a firm is operating implies that local bankruptcy rules apply
to the resolution of insolvency proceedings involving a multinational affiliate and that
lenders to the U.S. parent may have trouble obtaining assets held abroad.19
Other variables have distinct effects in explaining cash held abroad and
domestically. The regressions indicate that Foreign Income/Total Assets has a large
positive effect on cash held abroad while Domestic Income/Total Assets has a large
positive effect on cash held domestically. These results provide evidence that more
profitable operations hold more cash even within firms. The results also indicate that
firms with high levels of leverage hold less cash both domestically and abroad. In
addition, most firm characteristics computed using consolidated firm data, like the Log of
Assets, the Dividend Dummy, the Standard Deviation of Operating Income, and Capital
Expenditures/Total Assets, significantly affect domestic cash holdings, but have smaller
and often statistically insignificant effects on foreign cash holdings. The estimates of the
coefficients on these variables may simply reflect the relatively large importance of
domestic activity for most firms.
19 Desai, Foley, and Hines (2003) offers a detailed discussion of the workings of multinational bankruptcies and the reasons why local laws should dictate the bankruptcy terms of multinational affiliates. Additionally, Bebchuk and Guzman (1999) provide a useful analysis of the tension between local and universal principles for multinational bankruptcies with particular reference to the United States, and Tagashira (1994), Gitlin and Flaschen (1987), and Powers (1994) discuss various efforts at international bankruptcy cooperation and their shortcomings.

21
The coefficients on R&D Expenditures/Total Assets are positive and significant in
both Tables 5 and 6, illustrating that R&D intensive firms hold more cash both abroad
and at home. These results suggest that the high cash holdings of these firms are at least
partially tax motivated. Previous work interprets the effects of R&D expenditures on
cash holdings as indicating that firms with higher costs of obtaining external finance hold
more cash for precautionary reasons. However, because the average U.S. multinational
firm in the sample conducts 89.8% of its R&D in the U.S., the precautionary motive is
likely to result in high domestic, not foreign, cash holdings. The effects of R&D on
foreign cash holdings is consistent with the hypothesis that R&D intensive firms are
better able to shift profits to low tax foreign locations. This hypothesis is analyzed in
more detail in the next section.
4.3. Affiliate cash holdings
The results in Tables 2-6 show that firms facing higher repatriation tax burdens
hold more cash and that repatriation tax burdens specifically affect the level of cash held
abroad. The analysis presented in Tables 7 and 8 looks across affiliates and explores if
firms hold more cash in foreign locations from which it is very costly to repatriate
earnings. In addition, our tests consider whether financial constraints limit the ability of
firms to avoid repatriation tax burdens and if, given their ability to relocate profits,
technology intensive firms have cash holdings that are particularly sensitive to
repatriation tax burdens.
4.3.1 The effect of taxes
Individual affiliates face tax costs of repatriation that vary inversely with their
host country tax rates. These tax costs are not relevant to branch affiliates as the U.S.
taxes the foreign income of these affiliates as it is earned, not as earnings are repatriated.
The specifications presented in Table 7 regress affiliate level cash holdings on measures
of the affiliate’s host country tax rate, a dummy equal to one for affiliates organized as
branches and zero otherwise, and a set of controls. The dependent variable in these

22
specifications is the natural logarithm of the ratio of affiliate cash holdings to affiliate
total assets less affiliate cash holdings. The sample includes all affiliates that report cash
holdings. The specifications in columns 1 and 2 include fixed effects for each three digit
BEA industry code and each year, and those in columns 3 and 4 include fixed effects for
each parent firm and each year.
[Table 7 about here]
The -0.8908 coefficient on Country Tax Rate in column one indicates that
affiliates in countries with low tax rates, which imply high tax costs of repatriating
earnings, hold more cash. This estimate indicates that a one standard deviation decrease
in the Country Tax Rate is associated with 10.6% higher ratio of affiliate cash holdings to
affiliate assets less affiliate cash holdings. Branch Dummy is significantly negative in
this specification, consistent with the hypothesis that affiliates organized as branches hold
lower levels of cash because they do not have repatriation tax incentives to hold cash.
The specification in column 2 adds the interaction of the Branch Dummy and the
Country Tax Rate as an explanatory variable. The coefficient on this variable captures
the marginal difference in the effect of host country tax rates on affiliate cash holdings
for affiliates organized as branches, relative to the effect for affiliates with other
organizational forms. It is of roughly the same magnitude and the opposite sign of the
coefficient on the Country Tax Rate variable. This implies that unlike the cash holdings
of incorporated affiliates, cash holdings of branches are not sensitive to the affiliate’s host
country tax rate, as one would expect given that there are no tax costs associated with
repatriations for branches. Instead of industry and year fixed effects, the specifications
presented in columns 3 and 4 of Table 7 include parent and year fixed effects, and the
results are very similar in these specifications. Parent fixed effects control for time
invariant firm characteristics that could affect cash holdings. These specifications
identify the effect of taxes by comparing levels of cash holdings of different affiliates of
the same firm.
23
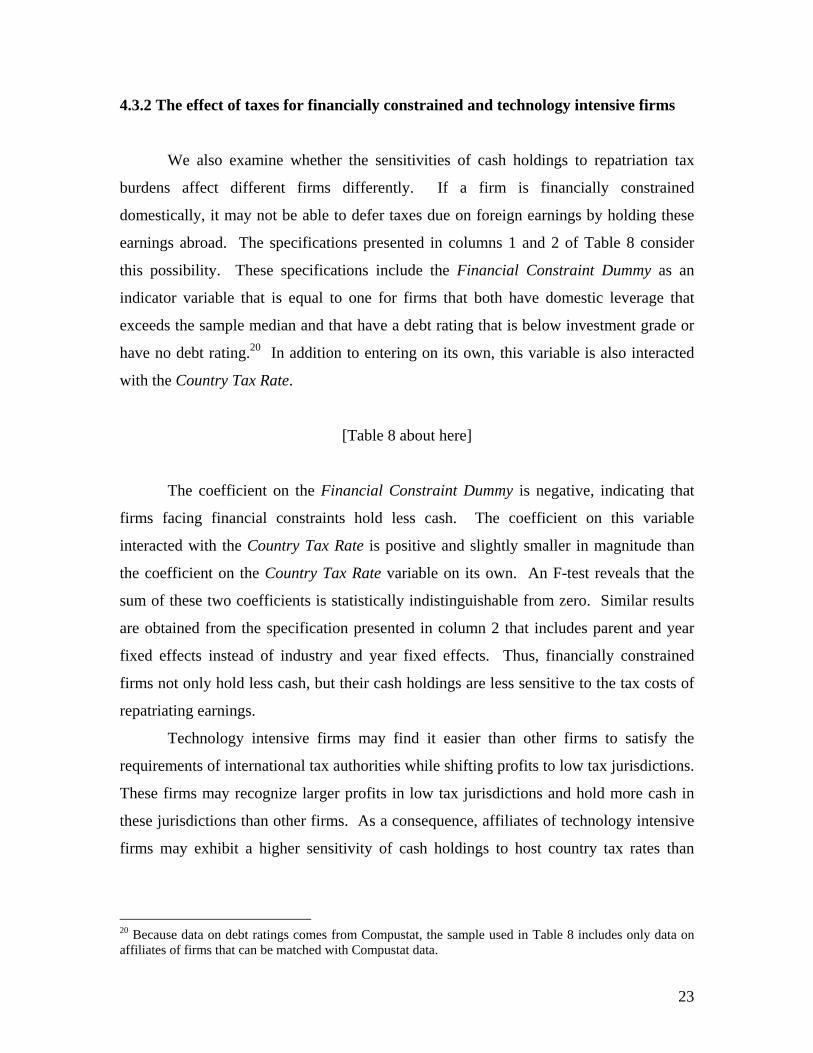
4.3.2 The effect of taxes for financially constrained and technology intensive firms
We also examine whether the sensitivities of cash holdings to repatriation tax
burdens affect different firms differently. If a firm is financially constrained
domestically, it may not be able to defer taxes due on foreign earnings by holding these
earnings abroad. The specifications presented in columns 1 and 2 of Table 8 consider
this possibility. These specifications include the Financial Constraint Dummy as an
indicator variable that is equal to one for firms that both have domestic leverage that
exceeds the sample median and that have a debt rating that is below investment grade or
have no debt rating.20 In addition to entering on its own, this variable is also interacted
with the Country Tax Rate.
[Table 8 about here]
The coefficient on the Financial Constraint Dummy is negative, indicating that
firms facing financial constraints hold less cash. The coefficient on this variable
interacted with the Country Tax Rate is positive and slightly smaller in magnitude than
the coefficient on the Country Tax Rate variable on its own. An F-test reveals that the
sum of these two coefficients is statistically indistinguishable from zero. Similar results
are obtained from the specification presented in column 2 that includes parent and year
fixed effects instead of industry and year fixed effects. Thus, financially constrained
firms not only hold less cash, but their cash holdings are less sensitive to the tax costs of
repatriating earnings.
Technology intensive firms may find it easier than other firms to satisfy the
requirements of international tax authorities while shifting profits to low tax jurisdictions.
These firms may recognize larger profits in low tax jurisdictions and hold more cash in
these jurisdictions than other firms. As a consequence, affiliates of technology intensive
firms may exhibit a higher sensitivity of cash holdings to host country tax rates than
20 Because data on debt ratings comes from Compustat, the sample used in Table 8 includes only data on affiliates of firms that can be matched with Compustat data.

24
affiliates of other firms. To test this possibility, the specifications in columns 3 and 4 of
Table 8 include Domestic R&D/Domestic Assets interacted with Country Tax Rate.
In these specifications, the coefficient on Domestic R&D/Domestic Assets
interacted with host country tax rates is negative, large in magnitude, and statistically
significant. In the specification in column 4, the coefficient on Country Tax Rate is
-0.7350, and this coefficient indicates the effects of host country tax rates for firms with
zero domestic R&D. The -15.4390 coefficient on the interaction of Domestic
R&D/Domestic Assets and Country Tax Rate, together with the 0.0456 standard deviation
of Domestic R&D/Domestic Assets, implies that increasing Domestic R&D/Domestic
Assets from zero by one standard deviation changes the sensitivity of affiliate cash
holdings to country tax rates by -0.7048, or nearly doubles the sensitivity of affiliate cash
holdings to host country tax rates. In other words, technology intensive firms appear to
be particularly sensitive to repatriation tax burdens.
5. Conclusion
Understanding the extent to which firms hold cash has been a part of the academic
research agenda in finance for more than fifty years. Much of the work in this field
emphasizes transactions costs, the difficulties associated with obtaining external finance,
and agency considerations. This study indicates that taxes also have significant effects on
the cash balances of U.S. firms.
We find that U.S. multinational firms that would trigger larger tax expenses by
repatriating earnings have higher consolidated cash holdings. Analysis of detailed data
on the domestic and foreign operations of these firms shows that repatriation tax burdens
increase cash held abroad and that these higher foreign cash holdings are not directly
offset by lower domestic cash holdings. Furthermore, affiliates in countries with low tax
rates, which imply high tax costs of repatriating earnings, hold more cash than other
affiliates of the same firm. The sensitivity of affiliate cash holdings to repatriation taxes
is particularly pronounced for technology intensive firms but is not observed for
financially constrained firms.
25
While this tax-based explanation for cash holdings has not received much
attention in prior academic literature, it has captured the attention of policy makers. In
October of 2004, the American Job Creation Act was passed by Congress and signed into
law by President Bush. This Act provides for a one-time, 85 percent tax deduction for
repatriated earnings. This deduction implies that eligible repatriated earnings face a
maximum U.S. rate of 5.25 percent instead of 35 percent.21 Proponents of the Act argued
that U.S. multinationals hold large sums of cash abroad as a consequence of the methods
used to tax foreign earnings and that the repatriation of these funds would spur
investment and job growth in the U.S. Although it is still too early to tell if the American
Job Creation Act of 2004 is having the effects its proponents argue it should, it does
appear that high repatriation tax burdens encourage firms to hold cash abroad.
21 The act allows U.S. multinational firms to deduct 85% of cash dividends received from foreign subsidiaries, where the dividends are received in either the year preceding or subsequent to the enactment of the act. To be eligible, the dividend must (i) exceed the average dividend received over three out of the last five tax years, (ii) be reinvested in the U.S. for defined purposes, including, job creation, infrastructure development, research and development, and capital investment, and (iii) be less than $500 million, unless an amount greater than this is reported as permanently reinvested earnings in the prior year's financial statements.

26
References
Almeida, H., Campello, M., Weisbach, M.S., 2004. The cash flow sensitivity of cash.
Journal of Finance 59, 1777-1804.
Bates, T. W, Kahle, K. M., Stulz, R. M., 2006. Why do U.S. firms hold so much more
cash than they used to? Unpublished Working Paper 12534, National Bureau of
Economic Research, Cambridge, MA.
Baumol, W. J., 1952. The transactions demand for money: an inventory theoretic
approach. Quarterly Journal of Economics 66, 545-556.
Bebchuck, L. A., Guzman, A. T., 1999. An economic analysis of transnational
bankruptcies. Journal of Law and Economics 42, 775-806.
Blanchard, O., Lopez-de-Silanes, F., Shleifer, A., 1994. What do firms do with cash
windfalls? Journal of Financial Economics 36, 337-360.
Clausing, K. A., 2001. The impact of transfer pricing on intrafirm trade. In: Hines Jr., J.
R. (Ed.), International Taxation and Multinational Activity. The University of Chicago
Press, Chicago, 173-194.
Collins, J., Hand, J. R. M., Shackelford, D., 2001. Valuing deferral: the effect of
permanently reinvested foreign earnings on stock prices. In: Hines Jr., J. R. (Ed.),
International Taxation and Multinational Activity. The University of Chicago Press,
Chicago, 143-166.
Collins, J., Kemsley, D., Lang, M., 1998. Cross-jurisdictional income shifting and
earnings valuation. Journal of Accounting Research 36, 209-230.

27
Desai, M. A., Foley, C. F., Hines Jr., J. R., 2001. Repatriation taxes and dividend
distortions. National Tax Journal 54, 829-851.
Desai, M. A., Foley, C. F., Hines Jr., J. R., 2003. A multinational perspective on capital
structure choice and internal capital markets. Unpublished Working Paper 9715, National
Bureau of Economic Research, Cambridge, MA.
Desai, M. A., Foley, C. F., Hines Jr., J. R., 2004a. The costs of shared ownership:
evidence from international joint ventures. Journal of Financial Economics 73, 323-374.
Desai, M. A., Foley, C. F., Hines Jr., J. R., 2004b. A multinational perspective on capital
structure choice and internal capital markets. Journal of Finance 59, 2451-2488.
Desai, M. A., Foley, C. F., Hines Jr., J. R., 2006. The demand for tax havens. Journal of
Public Economics 90, 513-531.
Desai, M. A., Foley, C. F., Hines Jr., J. R., Forthcoming. Dividend policy inside the firm.
Financial Management.
Dittmar, A., Mahrt-Smith, J., Forthcoming. Corporate governance and the value of cash
holdings. Journal of Financial Economics.
Dittmar, A., Mahrt-Smith, J., Servaes, H., 2003. International corporate governance and
corporate cash holdings. Journal of Financial and Quantitative Analysis 28, 111-133.
Froot, K., Hines Jr., J.R., 1995. Interest allocation rules, financing patterns, and the
operations of U.S. multinationals. Unpublished Working Paper 4924, National Bureau of
Economic Research, Cambridge, MA.
Gitlin, R. A., Flaschen, E. D., 1987. The international void in the law of multinational
bankruptcies. Business Law 42, 307-323.

28
Graham, J. R., 1996a. Debt and the marginal tax rate. Journal of Financial Economics 41,
41-74.
Graham, J. R., 1996b. Proxies for the corporate marginal tax rate. Journal of Financial
Economics 42, 187-221.
Graham, J. R., 1999. Do personal taxes affect corporate financing decisions? Journal of
Public Economics 73, 147-185.
Graham, J. R., 2000. How big are the tax benefits of debt? Journal of Finance 55, 1901-
1941.
Graham, J.R., 2003. Taxes and corporate finance: a review. Review of Financial Studies,
16, 1075-1129.
Graham, J.R., Michaely, R., Roberts, M., 2003. Do price discreteness and transaction
costs affect stock returns? Comparing ex-dividend pricing before and after
decimilization. Journal of Finance 58, 2613-2637.
Graham, J.R., Rogers, D., 2001, Do firms hedge in response to tax incentives? Journal of
Finance 57, 815-839.
Grubert, H., 1998. Taxes and the division of foreign operating income among royalties,
interest, dividends and retained earnings. Journal of Public Economics 68, 269–90.
Grubert, H., Mutti, J., 1991. Taxes, tariffs and transfer pricing in multinational corporate
decision making. Review of Economics and Statistics 73, 285-293.
Grubert, H., Mutti, J., 2001. Taxing International Business Income: Dividend Exemption
versus the Current System. American Enterprise Institute, Washington, D.C.

29
Harford, J., 1999. Corporate cash reserves and acquisitions. Journal of Finance 54, 1969-
1997.
Harris, D., Morck, R., Slemrod, J., Yeung, B., 1993. Income shifting in U.S.
multinational corporations. In: Giovannini, A., Hubbard, R. G., Slemrod, J. (Eds.).,
Studies in International Taxation. The University of Chicago Press, Chicago, 277-307.
Hartman, D. G., 1985. Tax policy and foreign direct investment. Journal of Public
Economics 26, 107-121.
Hayn, C., 1989, Tax attributes as determinants of shareholder gains in corporate
acquisitions. Journal of Financial Economics 23, 121-154.
Hines Jr., J. R., 1999. Lessons from behavioral responses to international taxation.
National Tax Journal 52, 305-322.
Hines Jr., J. R., Hubbard, R. G., 1990. Coming home to America: dividend repatriations
by U.S. multinationals. In: Razin, A., Slemrod, J. (Eds.), Taxation in the Global
Economy. The University of Chicago Press, Chicago, 161-200.
Hines Jr., J. R., Rice, E. M., 1994. Fiscal paradise: foreign tax havens and American
business. Quarterly Journal of Economics 109:149-182.
Jensen, M., 1986, Agency costs of free cash flow, corporate finance and takeovers,
American Economic Review 76, 323-329.
Kalcheva, I., Lins, K., 2006. International evidence on cash holdings and expected
managerial agency problems. Unpublished Working Paper.
30
Karni, E., 1973. The transactions demand for cash: incorporation of the value of time into
the inventory approach. Journal of Political Economy 81: 1216-1225.
Klassen, K., Lang, M., Wolfson, M., 1993. Geographic income shifting by multinational
corporations in response to tax rate changes. Journal of Accounting Research 31, 141-
173.
Krull, L., 2004. Permanently reinvested foreign earnings, taxes, and earnings
management. Accounting Review 79, 745-767.
Lyon, A. B., Silverstein, G., 1995. The alternative minimum tax and the behavior of
multinational corporations. In: Feldstein, M., Hines Jr., J. R., Hubbard, R. G. (Eds.), The
Effects of Taxation on Multinational Corporations. The University of Chicago Press,
Chicago, 153-177.
Meltzer, A. H., 1963. The demand for money: A cross-section study of business firms.
Quarterly Journal of Economics 79, 405-422.
Mikkelson, W. H., Partch, M., 2003. Do persistent large cash reserves hinder
performance? Journal of Financial and Quantitative Analysis 38, 257-294.
Miller M. H., Orr, D., 1966. A model of demand for money by firms. Quarterly Journal
of Economics 80, 413-435.
Mulligan, C. B., 1997. Scale economies, the value of time, and the demand for money:
longitudinal evidence from firms. Journal of Political Economy 105, 1061-1079.
Newberry, K., 1998, Foreign tax credit limitations and capital structure decisions. Journal
of Accounting Research 36, 157-66.

31
Newberry, K., Dhaliwal, D. S. 2001. Cross-jurisdictional income shifting by U.S.
multinationals: evidence from international bond offerings, Journal of Accounting
Research 39, 643-62.
Opler, T., Pinkowitz, L., Stulz, R., Williamson, R., 1999. The determinants and
implications of corporate cash holdings. Journal of Financial Economics 52, 3-46.
Powers, T. E., 1994. The model international insolvency co-operation act: a 21st century
proposal for international insolvency co-operation. In: Ziegel, J. S. (Ed.), Current
Developments in International and Comparative Corporate Insolvency Law, Clarendon
Press, Oxford, 687-700.
Pinkowitz, L., Stulz, R., Williamson, R., forthcoming. Does the contribution of cash
holdings and dividends to firm value depend on corporate governance? A cross-country
analysis. Journal of Finance.
Pinkowitz, L., Williamson, R., 2006. What is a dollar worth? The market value of cash
holdings. Unpublished Working Paper.
Tagashira, S., 1994. International effects of foreign insolvency proceedings: an analysis
of ‘ancillary’ proceedings in the United States and Japan. Texas International Law
Journal 29, 1-38.
Tobin, J., 1956. The interest-elasticity of the transactions demand for money. The Review
of Economics and Statistics 48, 241-247.

Fig. 1: Median Cash/Net Assets and Repatriation Tax Rates: This figure displays the median ratio of cash to totalassets less cash for firms with above and below average Effective Repatriation Tax Rates . The Effective RepatriationTax Rate is computed by first taking the maximum of zero and the difference between the weighted foreign tax rate a firmfaces and its marginal effective tax rate as calculated in Graham (1996b). Then this value is multiplied by the share offirm activity abroad. Weighted foreign tax rates are computed using net property plant and equipment in each country asweights and the share of net property plant and equipment abroad as the share of firm activity abroad.
0
0.01
0.02
0.03
0.04
0.05
0.06
0.07
Above Average Effective RepatriationTax Rate
Below Average Effective RepatriationTax Rate

Fig. 2: Median Share of Cash Held Abroad and Repatriation Tax Rates: This figure displays the median ratio of cash held abroad to total cash for firms with above and below average Effective Repatriation Tax Rates . The Effective Repatriation Tax Rate is computed by first taking the maximum of zero and the difference between the weighted foreign tax rate a firm faces and its marginal effective tax rate as calculated in Graham (1996b). Then this value is multiplied by the share of firm activity abroad. Weighted foreign tax rates are computed using net property plant and equipment in each country as weights and the share of net property plant and equipment abroad as the share of firm activity abroad.
0
0.05
0.1
0.15
0.2
0.25
0.3
0.35
0.4
0.45
0.5
Above Average Effective Repatriation TaxRate
Below Average Effective Repatriation TaxRate

Mean MedianStandard Deviation
Variables Computed Using Compustat Data
Ln (Cash/Net Assets) -2.8687 -2.8728 1.7244
Change in Cash/Net Assets -0.0110 -0.0005 0.1537
Tax Cost of Repatriating Earnings (Full Compustat sample) 0.0008 0.0000 0.0038
Tax Cost of Repatriating Earnings (Firms reporting foreign income) 0.0017 0.0000 0.0048
Alternative Tax Cost of Repatriating Earnings (Full Compustat sample) 0.0011 0.0000 0.0045
Alternative Tax Cost of Repatriating Earnings (Firms reporting foreign income) 0.0026 0.0000 0.0064
Domestic Income/Total Assets 0.0106 0.0447 0.0305
Foreign Income/Total Assets 0.0404 0.0000 0.2174
Log of Assets 6.4908 6.1968 1.2911
Dividend Dummy 0.5507 1.0000 0.4974
Book Value of Equity/Market Value of Equity 0.5925 0.4963 0.7427
Standard Deviation of Operating Income 0.0559 0.0450 0.0453
R&D Expenditures/Total Assets 0.0262 0.0000 0.0538
zero and the difference between the weighted foreign tax rate a firm faces and its marginal effective tax rate as calculated in Graham (1996b). Then this value is multiplied by the share of firm activity abroad. For Net PPE weighted measures, weighted foreign tax rates are computed using net property plant and equipment in each country as weights and the share of net property plant and equipment abroad as the share of firm activity abroad. Employment weighted measures use employment in place of Net PPE. Alternative Effective Repatriation Tax Rates are computed similarly, but U.S. statutory tax rates are used in place of marginal tax rates. Country Tax Rate is the annual median income tax rate paid by affiliates in a particular host country. Branch Dummy takes a value of one if the affiliate is organized as a branch and zero otherwise. Affiliate Net Income/Affiliate Assets is the ratio of affiliate net income to affiliate assets. Log of Affiliate Assets is the natural logarithm of affiliate assets. Standard Deviation of Affiliate Net Income/Affiliate Assets is the standard deviation of the ratio of affiliate net income to affiliate assets measured over the entire 1982-1999 period using annual data. Domestic R&D/Domestic Assets is the ratio of domestic R&D expenditures to domestic assets, and Affiliate R&D/Affiliate Assets is the ratio of affiliate R&D expenditures affiliate assets. Affiliate Capital Expenditures/Affiliate Assets is the ratio of affiliate capital expenditures to affiliate assets. Affiliate Leverage is the ratio of affiliate current liabilities and long term debt to affiliate assets. Financial Constraint Dummy is a dummy equal to one if the firm's domestic leverage is above the sample median and the firm has a below investment grade debt rating or has no debt rating and zero otherwise.
Table 1Descriptive Statistics
The top panel of this table provides descriptive statistics for variables computed using Compustat data and the bottom panel for variables computed using BEA data. Ln(Cash/Net Assets) is the natural logarithm of the ratio of cash to total assets less cash. Change in Cash/Net Assets is the first difference in the ratio of cash to total assets less cash. The Tax Cost of Repatriating Earnings is computed by first subtracting foreign taxes paid from the product of a firm's foreign pretax income and its marginal effective tax rate as calculated in Graham (2000). Then the maximum of this difference or zero is scaled by total firm assets. The Alternative Tax Cost of Repatriating Earnings is computed similarly, but U.S. statutory tax rates are used in place of marginal tax rates. Domestic Income/Total Assets and Foreign Income/Total Assets are ratios of domestic and foreign pretax income to total assets, respectively. Log of Assets is the natural logarithm of total firm assets. Dividend Dummy is a dummy equal to one if the firm pays cash dividends and zero otherwise. Book Valueof Equity/Market Value of Equity is the ratio of the book value of common equity to the market value of common equity. Standard Deviation of Operating Income is the standard deviation of the ratio of operating income before depreciation to total assets, measured by firm over the entire sample period. R&D Expenditures/Total Assets and Capital Expenditures/Total Assets are ratios of research and development expenditures and capital expenditures to total assets, respectively. Market Leverage is the ratio of long and short term debt to the sum of long and short term debt and the market value of equity. Ln(Foreign Cash/Net Assets) is the natural logarithm of the ratio of cash held abroad to total assets less total cash. Ln(Domestic Cash/Net Assets) is the natural logarithm of the ratio of cash held domestically to total assets less total cash. Ln(Affiliate Cash/Affiliate Net Assets) is measured as the natural logarithm of the ratio of affiliate cash to affiliate total assets less affiliate cash. The Effective Repatriation Tax Rate is computed by first taking the maximum of

Capital Expenditures/Total Assets 0.0724 0.0523 0.0741
Market Leverage 0.2629 0.1974 0.2482
Variables Computed Using BEA Data
Ln (Foreign Cash/Net Assets) -4.9414 -4.6323 1.8424
Ln (Domestic Cash/Net Assets) -4.0555 -4.0322 1.7235
Ln (Affiliate Cash/Affiliate Net Assets) -3.9495 -3.5589 2.3580
Effective Repatriation Tax Rate (Net PPE Weighted) 0.0054 0.0000 0.0149
Alternative Effective Repatriation Tax Rate (Net PPE Weighted) 0.0092 0.0015 0.0201
Effective Repatriation Tax Rate (Employment Weighted) 0.0068 0.0000 0.0177
Alternative Effective Repatriation Tax Rate (Employment Weighted) 0.0117 0.0024 0.0240
Country Tax Rate 0.3512 0.3777 0.1190
Branch Dummy 0.0644 0.0000 0.2455
Affiliate Net Income/Affiliate Assets 0.0604 0.0564 0.1711
Log of Affiliate Assets 10.5161 10.4337 1.5433
Standard Deviation of Affiliate Net Income/Affiliate Assets 0.1032 0.0764 0.0899
Domestic R&D/Domestic Assets 0.0369 0.0202 0.0456
Affiliate R&D/Affiliate Assets 0.0070 0.0000 0.0196
Affiliate Capital Expenditures/Affiliate Assets 0.0619 0.0316 0.0974
Affiliate Leverage 0.5580 0.5327 0.3254
Financial Constraint Dummy 0.1972 0.0000 0.3979

Dependent Variable:
(1) (2) (3) (4)
Constant -0.0686 -0.2270 -0.0602 -0.2018(0.1194) (0.1596) (0.1193) (0.1534)
Tax Cost of Repatriating Earnings 14.0746 *** 16.5610 ***(2.7850) (3.7931)
14.5401 *** 13.7678 ***(2.6357) (2.6352)
Domestic Income/Total Assets 0.0715 0.0360 0.0749 0.0479(0.0514) (0.0562) (0.0519) (0.0624)
Foreign Income/Total Assets 1.2989 *** 1.9875 *** 0.9394 * 1.3320 ***(0.4738) (0.5501) (0.5020) (0.5044)
Log of Assets -0.1206 *** -0.0908 *** -0.1205 *** -0.0908 ***(0.0157) (0.0208) (0.0157) (0.0201)
-0.3107 *** -0.3549 *** -0.3081 *** -0.3336 ***(0.0402) (0.0585) (0.0402) (0.0529)
-0.0737 *** -0.0980 *** -0.0738 *** -0.0552 *(0.0180) (0.0349) (0.0180) (0.0286)
Standard Deviation of Operating Income 3.1214 *** 3.7011 *** 3.0903 *** 3.5940 ***(0.4572) (0.6746) (0.4557) (0.5741)
R&D Expenditures/Total Assets 7.0555 *** 6.3412 *** 7.0379 *** 6.4816 ***(0.6448) (0.5334) (0.6437) (0.4914)
Capital Expenditures/Total Assets -2.1115 *** -2.7585 *** -2.1150 *** -2.4299 ***(0.2944) (0.5965) (0.2946) (0.4922)
Market Leverage -1.8573 *** -1.8919 *** -1.8628 *** -1.8334 ***(0.0799) (0.1210) (0.0800) (0.1058)
Industry and Year Fixed Effects? Y Y Y YNo. of Obs. 34,319 12,337 34,319 15,231R-Squared 0.3287 0.3780 0.3290 0.3742
Table 2
Ln(Cash/Net Assets)
Dividend Dummy
Book Value of Equity/Market Value of Equity
Alternative Tax Cost of Repatriating Earnings
This table presents estimated coefficients from regressions explaining a firm's cash holdings as a function of the tax costs of repatriating earnings, along with other variables. The dependent variable is the natural logarithm of the ratio of cash to total assets less cash. The Tax Cost of Repatriating Earnings is computed by first subtracting foreign taxes paid from the product of a firm's foreign pretax income and its marginal effective tax rate as calculated in Graham (1996b). Then the maximum of this difference or zero is scaled by total firm assets. The Alternative Tax Cost of Repatriating Earnings is computed similarly, but U.S. statutory tax rates are used in place of marginal tax rates. Domestic Income/Total Assets and Foreign Income/Total Assets are ratios of domestic and foreign pretax income to total assets, respectively. Log of Assets is the natural logarithm of total firm assets. Dividend Dummy is a dummy equal to one if the firm pays cash dividends and zero otherwise. Book Value of Equity/Market Value of Equity is the ratio of the book value of common equity to the market value of common equity. Standard Deviation of Operating Income is the standard deviation of the ratio of operating income before depreciation to total assets, measured by firm over the entire sample period. R&D Expenditures/Total Assets and Capital Expenditures/Total Assets are ratios of research and development expenditures and capital expenditures to total assets, respectively. Market leverage is the ratio of long and short term debt to the sum of long and short term debt and the market value of equity. Each specification includes industry and year fixed effects. Standard errors that correct for clustering of errors by firm are presented in parentheses. *, ** and *** indicate statistical significance at the 10%, 5% and 1% level, respectively.
Cash Holdings and Tax Costs of Repatriating Earnings

Dependent Variable:
(1) (2) (3) (4)
Constant 0.0183 *** 0.0004 0.0183 *** 0.0087 ***(0.0044) (0.0063) (0.0044) (0.0038)
Tax Cost of Repatriating Earnings 1.2650 *** 1.0540 ***(0.3031) (0.3418)
0.8362 *** 0.7246 ***(0.3248) (0.3342)
Domestic Income/Total Assets -0.0042 -0.0063 -0.0039 -0.0067(0.0073) (0.0070) (0.0073) (0.0074)
Foreign Income/Total Assets 0.1346 *** 0.0649 0.1379 *** 0.0575(0.0363) (0.0459) (0.0343) (0.0387)
Change in Log of Assets -0.0318 *** -0.0325 *** -0.0318 *** -0.0360 ***(0.0077) (0.0108) (0.0077) (0.0102)
0.0053 0.0009 0.0053 -0.0004(0.0041) (0.0068) (0.0041) (0.0058)
-0.0070 *** -0.0036 -0.0071 *** -0.0050 **(0.0014) (0.0024) (0.0014) (0.0023)
Standard Deviation of Operating Income -0.0219 -0.0313 -0.0224 -0.0585(0.0343) (0.0501) (0.0345) (0.0414)
Change in R&D Expenditures/Total Assets -0.8011 *** -1.0978 *** -0.7988 *** -1.0820 ***(0.1548) (0.1727) (0.1544) (0.1512)
Capital Expenditures/Total Assets -0.2192 *** -0.2342 *** -0.2191 *** -0.2317 ***(0.0222) (0.0427) (0.0222) (0.0376)
Change in Market Leverage -0.0367 *** -0.0450 *** -0.0365 *** -0.0443 ***(0.0082) (0.0128) (0.0081) (0.0125)
Industry and Year Fixed Effects? Y Y Y YNo. of Obs. 31,083 11,785 31,083 14,304R-Squared 0.0468 0.0573 0.0465 0.0542
Alternative Tax Cost of Repatriating Earnings
Table 3Changes in Cash Holdings and Tax Costs of Repatriating Earnings
This table presents estimated coefficients from regressions explaining changes in a firm's cash holdings as a function of the tax costs of repatriating earnings, along with other variables. The dependent variable is the first difference in the ratio of cash to total assets less cash. The Tax Cost of Repatriating Earnings is computed by first subtracting foreign taxes paid from the product of a firm's foreign pretax income and its marginal effective tax rate as calculated in Graham (1996b). Then the maximum of this difference or zero is scaled by total firm assets. The Alternative Tax Cost of Repatriating Earnings is computed similarly, but U.S. statutory tax rates are used in place of marginal tax rates. Domestic Income/Total Assets and Foreign Income/Total Assets are ratios of domestic and foreign pretax income to total assets, respectively. Change in Log of Assets is the first difference in the natural logarithm of total firm assets. Dividend Dummy is a dummy equal to one if the firm pays cash dividends and zero otherwise, and the change in this variable is its first difference. Change in Book Value of Equity/Market Value of Equity is the first difference in the ratio of the book value of common equity to the market value of common equity, measured as of year end. The Standard Deviation of Operating Income is the standard deviation of the ratio of operating income before deprciation to total assets, measured by firm over the entire sample period. The Change in R&D Expenditures/Total Assets is the first difference in the ratio of research and development expenditures to total assets. Capital Expenditures/Total Assets is the ratio of capital expenditures to total assets. Change in Market leverage is the first difference in the ratio of long and short term debt to the sum of long and short term debt and the market value of equity. Each specification includes industry and year fixed effects. Standard errors that correct for clustering of errors by firm are presented in parentheses. *, ** and *** indicate statistical significance at the 10%, 5% and 1% level, respectively.
Change in Cash/Net Assets
Change in Dividend Dummy
Change in Book Value of Equity/Market Value of Equity

Dependent Variable:
(1) (2) (3) (4)
Constant -2.1456 *** -1.9655 *** -1.7861 *** -1.7823 ***(0.1952) (0.1892) (0.1954) (0.1872)
Effective Repatriation Tax Rate 3.6561 **(Net PPE Weighted) (1.7083)
4.5226 ***(1.3970)
2.8584 *(1.4659)
4.4228 ***(1.1127)
Domestic Income/Total Assets 0.3655 0.3869 0.3767 0.4679(0.3872) (0.3531) (0.3893) (0.3575)
Foreign Income/Total Assets 3.1768 *** 2.3863 *** 3.1780 *** 2.2402 ***(0.8601) (0.7859) (0.8716) (0.7888)
Log of Assets -0.0997 *** -0.0953 *** -0.0988 *** -0.0964 ***(0.0242) (0.0231) (0.0242) (0.0231)
-0.1865 ** -0.1929 ** -0.1841 ** -0.1832 **(0.0807) (0.0756) (0.0811) (0.0758)
-0.0258 -0.0288 -0.0261 -0.0334(0.0586) (0.0499) (0.0590) (0.0502)
Standard Deviation of Operating Income 5.0798 *** 4.8521 *** 5.1459 *** 4.8186 ***(1.0161) (0.9193) (1.0201) (0.9230)
R&D Expenditures/Total Assets 6.8751 *** 6.8508 *** 6.8913 *** 6.8978 ***(0.8549) (0.8216) (0.8560) (0.8257)
Capital Expenditures/Total Assets -3.1005 *** -2.9402 *** -2.9706 *** -2.8622 ***(0.7813) (0.7243) (0.7828) (0.7271)
Market Leverage -2.0465 *** -2.0561 *** -2.0437 *** -2.0419 ***(0.1751) (0.1559) (0.1762) (0.1565)
Industry and Year Fixed Effects? Y Y Y YNo. of Obs. 2,374 2,658 2,360 2,644R-Squared 0.3325 0.3308 0.3300 0.3297
Table 4Cash Holdings and Effective Repatriation Tax Rates
This table presents estimated coefficients from regressions explaining a firm's cash holdings as a function of the tax costs of repatriating earnings, along with other variables. The dependent variable is the natural logarithm of the ratio of cash to total assets less cash. The Effective Repatriation Tax Rate is computed by first taking the maximum of zero and the difference between the weighted foreign tax rate a firm faces and its marginal effective tax rate ascalculated in Graham (1996b). Then this value is multiplied by the share of firm activity abroad. For Net PPE weighted measures, weighted foreign tax rates are computed using net property plant and equipment in each country as weights and the share of net property plant and equipment abroad as the share of firm activity abroad. Employment weighted measures use employment in place of Net PPE. Alternative Effective Repatriation Tax Rates are computed similarly, but U.S. statutory tax rates are used in place of marginal tax rates. Domestic Income/Total Assets and Foreign Income/Total Assetsare ratios of domestic and foreign pretax income to total assets, respectively. Log of Assets is the natural logarithm of total firm assets. Dividend Dummy is a dummy equal to one if the firm pays cash dividends and zero otherwise. Book Value of Equity/Market Value of Equity is the ratio of the book value of common equity to the market value of common equity. Standard Deviation of Operating Income is the standard deviation of the ratio of operating income before depreciation to total assets, measured by firm over the entire sample period. R&D Expenditures/Total Assets and Capital Expenditures/Total Assets are ratios of research and development expenditures and capital expenditures to total assets, respectively. Market leverage is the ratio of long and short term debt to the sum of long and short term debt and the market value of equity. Each specification includes industry and yeafixed effects. Standard errors that correct for clustering of errors by firm are presented in parentheses. *, ** and *** indicate statistical significance at the 10%, 5% and 1% level, respectively.
Alternative Effective Repatriation Tax Rate (Net PPE Weighted)
Effective Repatriation Tax Rate (Employment Weighted)
Dividend Dummy
Ln(Cash/Net Assets)
Book Value of Equity/Market Value of Equity
Alternative Effective Repatriation Tax Rate (Employment Weighted)

Dependent Variable:
(1) (2) (3) (4)
Constant -5.6081 *** -6.0029 *** -5.6204 *** -6.0022 ***(0.3491) (0.3253) (0.3376) (0.3170)
Effective Repatriation Tax Rate 8.0815 **(Net PPE Weighted) (3.3385)
11.9207 ***(2.3767)
6.8344 **(2.7865)
10.1640 ***(2.2675)
Domestic Income/Total Assets -1.5755 ** -1.8849 *** -1.7294 ** -1.8739 ***(0.7174) (0.6242) (0.6943) (0.6162)
Foreign Income/Total Assets 14.0884 *** 13.3924 *** 14.0474 *** 13.2301 ***(1.5911) (1.3892) (1.5832) (1.3638)
Log of Assets 0.0378 0.0640 * 0.0333 0.0569 *(0.0358) (0.0336) (0.0355) (0.0335)
-0.0198 0.0593 -0.0127 0.0729(0.1409) (0.1357) (0.1395) (0.1350)
0.1673 0.0641 0.1931 * 0.0809(0.1032) (0.0990) (0.1047) (0.1013)
Standard Deviation of Operating Income 0.8745 1.1667 0.8428 0.9819(1.4042) (1.3252) (1.3540) (1.2876)
R&D Expenditures/Total Assets 4.3818 *** 4.5577 *** 4.1430 *** 4.3603 ***(1.0921) (1.0718) (1.0745) (1.0465)
Capital Expenditures/Total Assets -2.1394 ** -2.0440 ** -1.1147 -1.1597(1.0481) (0.9782) (0.9727) (0.9091)
Market Leverage -1.1403 *** -1.0276 *** -1.1506 *** -1.0267 ***(0.3219) (0.2968) (0.3188) (0.2947)
Industry and Year Fixed Effects? Y Y Y YNo. of Obs. 1,497 1,681 1,491 1,675R-Squared 0.2579 0.2512 0.2573 0.2499
Table 5Foreign Cash Holdings and Effective Repatriation Tax Rates
This table presents estimated coefficients from regressions explaining a firm's foreign cash holdings as a function of the tax costs of repatriating earnings, along with other variables. The dependent variable is the natural logarithm of the ratio of cash held abroad to total assets less total cash. The Effective Repatriation Tax Rate is computed by first taking the maximum of zero and the difference between the weighted foreign tax rate a firm faces and its marginal effective tax rate as calculated in Graham (1996b). Then this value is multiplied by the share of firm activity abroad. For Net PPE weighted measures, weighted foreign tax rates are computed using net property plant and equipment in each country as weights and the share of net property plant and equipment abroad as the share of firm activity abroad. Employment weighted measures use employment in place of Net PPE. Alternative Effective Repatriation Tax Rates are computed similarly, but U.S. statutory tax rates are used in place of marginal tax ratesDomestic Income/Total Assets and Foreign Income/Total Assets are ratios of domestic and foreign pretax income to total assets, respectively. Log of Assets is the natural logarithm of total firm assets. Dividend Dummy is a dummy equal to one if the firm pays cash dividends and zero otherwise. Book Value of Equity/Market Value of Equity is the ratio of the book value of common equity to the market value of common equity. Standard Deviation of Operating Income is the standard deviation of the ratio of operating income before depreciation to total assets, measured by firm over the entire sample period. R&D Expenditures/Total Assets and Capital Expenditures/Total Assets are ratios of research and development expenditures and capital expenditures to total assets, respectively. Market leverage is the ratio of long and short term debt to the sum of long and short term debt and the market value of equity. Each specification includes industry and year fixed effects. Standard errors that correct for clustering of errors by firm are presented in parentheses. *, ** and *** indicate statistical significance at the 10%, 5% and 1% level, respectively.
Alternative Effective Repatriation Tax Rate (Net PPE Weighted)
Effective Repatriation Tax Rate (Employment Weighted)
Ln(Foreign Cash/Net Assets)
Alternative Effective Repatriation Tax Rate (Employment Weighted)
Dividend Dummy
Book Value of Equity/Market Value of Equity

Dependent Variable:
(1) (2) (3) (4)
Constant -3.1223 *** -3.1315 *** -3.1324 *** -3.1850 ***(0.3559) (0.3323) (0.3586) (0.3337)
Effective Repatriation Tax Rate -1.8132(Net PPE Weighted) (2.8195)
-1.8386(1.9919)
-1.3194(2.6342)
-0.0120(1.6333)
Domestic Income/Total Assets 1.7692 ** 1.6839 ** 1.7741 ** 1.7346 **(0.7492) (0.7078) (0.7552) (0.7184)
Foreign Income/Total Assets -2.4822 -2.4861 * -2.4940 -2.6926 *(1.5156) (1.4603) (1.5242) (1.4829)
Log of Assets -0.1004 *** -0.1114 *** -0.0989 ** -0.1093 ***(0.0387) (0.0353) (0.0388) (0.0353)
-0.4595 *** -0.4208 *** -0.4656 *** -0.4192 ***(0.1331) (0.1295) (0.1349) (0.1312)
0.0949 0.0760 0.0989 0.0791(0.1067) (0.0950) (0.1075) (0.0958)
Standard Deviation of Operating Income 7.2124 *** 7.3555 *** 7.2407 *** 7.2955 ***(2.0636) (1.8981) (2.0767) (1.9031)
R&D Expenditures/Total Assets 6.0204 *** 6.1519 *** 5.9727 *** 6.1638 ***(1.6051) (1.5451) (1.6130) (1.5568)
Capital Expenditures/Total Assets -3.1667 *** -2.5673 *** -3.1413 *** -2.5359 ***(0.8884) (0.8553) (0.9043) (0.8696)
Market Leverage -1.5487 *** -1.3538 *** -1.5534 *** -1.3530 ***(0.3074) (0.2800) (0.3113) (0.2826)
Industry and Year Fixed Effects? Y Y Y YNo. of Obs. 1,497 1,681 1,491 1,675R-Squared 0.2090 0.1985 0.2079 0.1972
Table 6Domestic Cash Holdings and Effective Repatriation Tax Rates
This table presents estimated coefficients from regressions explaining a firm's domestic cash holdings as a function of the tax costs of repatriating earnings, along with other variables. The dependent variable is the natural logarithm of the ratio of cash held domestically to total assets less total cash. The Effective Repatriation Tax Rate is computed by first taking the maximum of zero and the difference between the weighted foreign tax rate a firm faces and its marginal effective tax rate as calculated in Graham (1996b). Then this value is multiplied by the share of firm activity abroad. For Net PPE weighted measures, weighted foreign tax rates are computed using net property plant and equipment in each country as weights and the share of neproperty plant and equipment abroad as the share of firm activity abroad. Employment weighted measures use employment in place of Net PPE. Alternative Effective Repatriation Tax Rates are computed similarly, but U.S. statutory tax rates are used in place of marginal tax rates. Domestic Income/Total Assets and Foreign Income/Total Assets are ratios of domestic and foreign pretax income to total assets, respectively. Log of Assets is the natural logarithm of total firm assets. Dividend Dummy is a dummy equal to one if the firm pays cash dividends and zero otherwise. Book Value of Equity/Market Value of Equity is the ratio of the book value of common equity to the market value of common equity. Standard Deviation of Operating Income is the standard deviation of the ratio of operating income before depreciation to total assets, measured by firm over the entire sample period. R&D Expenditures/Total Assets and Capital Expenditures/Total Assets are ratios of research and development expenditures and capital expenditures to total assets, respectively. Market leverage is the ratio of long and short term debt to the sum of long and short term debt and the market value of equity. Each specification includes industry and year fixed effects. Standard errors that correct for clustering of errors by firm are presented in parentheses. *, ** and *** indicate statistical significance at the 10%, 5% and 1% level, respectively.
Alternative Effective Repatriation Tax Rate (Net PPE Weighted)
Effective Repatriation Tax Rate (Employment Weighted)
Ln(Domestic Cash/Net Assets)
Alternative Effective Repatriation Tax Rate (Employment Weighted)
Dividend Dummy
Book Value of Equity/Market Value of Equity

Dependent Variable:
(1) (2) (3) (4)
Constant -0.1275 -0.0733 0.1709 0.2164(0.1763) (0.1775) (0.2160) (0.2157)
Country Tax Rate -0.8908 *** -1.0343 *** -0.9643 *** -1.1031 ***(0.1715) (0.1818) (0.1714) (0.1801)
Branch Dummy -0.2623 *** -0.7139 *** -0.2092 *** -0.6228 ***(0.0741) (0.1702) (0.0755) (0.1728)
Branch Dummy*Country Tax Rate 1.3113 *** 1.2096 ***(0.4408) (0.4492)
Affiliate Net Income/Affiliate Assets 1.1595 *** 1.1658 *** 0.9134 *** 0.9200 ***(0.1119) (0.1117) (0.1107) (0.1105)
Log of Affiliate Assets -0.3373 *** -0.3376 *** -0.3329 *** -0.3329 ***(0.0158) (0.0158) (0.0164) (0.0164)
1.0906 *** 1.0719 *** 0.9515 *** 0.9386 ***(0.2115) (0.2112) (0.2164) (0.2161)
Domestic R&D/Domestic Assets 1.3504 ** 1.3613 ** 1.6320 * 1.6210 *(0.5665) (0.5665) (0.9069) (0.9066)
Affiliate R&D/Affiliate Assets -1.4872 -1.4671 -0.8816 -0.8709(0.9502) (0.9502) (0.9134) (0.9132)
-1.0998 *** -1.1116 *** -1.3119 *** -1.3203 ***(0.1765) (0.1762) (0.1824) (0.1822)
Affiliate Leverage -0.4867 *** -0.4833 *** -0.4096 *** -0.4066 ***(0.0608) (0.0608) (0.0622) (0.0621)
Industry and Year Fixed Effects? Y Y N NParent and Year Fixed Effects? N N Y YNo. of Obs. 19,647 19,647 19,647 19,647R-Squared 0.1030 0.1034 0.2580 0.2584
Table 7Affiliate Cash Holdings and Host Country Tax Rates
This table presents regressions of affiliate cash holdings on proxies for the tax costs of repatriating affiliate earnings along with other variables. The dependant variable is measured as the natural log of the ratio of affiliate cash to affiliate total assets less affiliate cash. Country Tax Rate is the annual median income tax rate paid by affiliates in a particular host country. Branch Dummy takes a value of one if the affiliate is organized as a branch and zero otherwise. Affiliate Net Income/Affiliate Assets is the ratio of affiliate net income to affiliate assets. Log of Affiliate Assets is the natural logarithm of affiliate assets. Standard Deviation of Affiliate Net Income/Affiliate Assets in the standard deviation of the ratio of affiliate net income to affiliate assets measured over the entire 1982-1999 period using annual data. Domestic R&D/Domestic Assets is the ratio of domestic R&D expenditures to domestic assets, and Affiliate R&D/Affiliate Assets is the ratio of affiliate R&D expenditures affiliate assets. Affiliate Capital Expenditures/Affiliate Assets is the ratio of affiliate capital expenditures to affiliate assets. Affiliate Leverage is the ratio of affiliate current liabilities and long term debt to affiliate assets. The specifications in columns 1 and 2 include industry and year fixed effects and those in columns 3 and 4 include parent and year fixed effects. Standard errors that correct for clustering of errors by affiliate are presented in parentheses. *, ** and *** indicate statistical significance at the 10%, 5% and 1% level, respectively.
Ln(Affiliate Cash/Affiliate Net Assets)
Standard Deviation of Affiliate Net Income/Affiliate Assets
Affiliate Capital Expenditures/Affiliate Assets

Dependent Variable:
(1) (2) (3) (4)
Constant -0.2907 -0.2515 -0.5646 ** -0.4618 **(0.2174) (0.2206) (0.2237) (0.2272)
Country Tax Rate -1.3415 *** -1.4333 *** -0.4709 -0.7350 **(0.2238) (0.2210) (0.2876) (0.2888)
Financial Constraint Dummy -0.4567 *** -0.2604 -0.3864 ** -0.2241(0.1747) (0.1783) (0.1728) (0.1783)
0.8793 ** 0.8896 ** 0.6857 0.7972 *(0.4404) (0.4380) (0.4367) (0.4373)
Domestic R&D/Domestic Assets -0.0672 0.9447 6.6857 *** 6.2115 ***(0.6726) (1.0435) (1.4882) (1.6745)
-19.3482 *** -15.4390 ***(3.8715) (3.9137)
Branch Dummy -0.1962 ** -0.1935 ** -0.2112 ** -0.2064 **(0.0892) (0.0899) (0.0894) (0.0899)
Affiliate Net Income/Affiliate Assets 1.2669 *** 0.9912 *** 1.2468 *** 0.9735 ***(0.1318) (0.1294) (0.1314) (0.1291)
Log of Affiliate Assets -0.3105 *** -0.3184 *** -0.3127 *** -0.3204 ***(0.0190) (0.0191) (0.0190) (0.0191)
0.9135 *** 0.8742 *** 0.8850 *** 0.8517 ***(0.2654) (0.2701) (0.2650) (0.2696)
Affiliate R&D/Affiliate Assets -0.6708 -0.2102 -0.5576 -0.0745(1.0600) (1.0047) (1.0605) (1.0048)
-0.8830 *** -1.1388 *** -0.8813 *** -1.1486 ***(0.2137) (0.2162) (0.2139) (0.2163)
-0.3136 *** -0.2788 *** -0.3108 *** -0.2789 ***(0.0705) (0.0693) (0.0700) (0.0689)
Industry and Year Fixed Effects? Y N Y NParent and Year Fixed Effects? N Y N YNo. of Obs. 13,694 13,694 13,694 13,694R-Squared 0.1046 0.2375 0.1065 0.2386
Financial Constraint Dummy*Country Tax Rate
Domestic R&D/Domestic Assets*Country Tax Rate
Table 8
The Sensitivity of Affiliate Cash Holdings to Host Country Tax Rates:Effects of Financial Constraints and R&D Intensity
This table presents regressions of affiliate cash holdings on proxies for the tax costs of repatriating affiliate earnings along with other variables. The dependant variable is measured as the natural log of the ratio of affiliate cash to affiliate total assets less affiliate cash. Country Tax Rate is the annual median income tax rate paid by affiliates in a particular host country. Financial Constraint Dummy is a dummy equal to one if the firm's domestic leverage is above the sample median and the firm has a below investment grade debt rating or has no debt rating and zero otherwise. Domestic R&D/Domestic Assets is the ratio of domestic R&D expenditures to domestic assets. Branch Dummy takes a value of one if the affiliate is organized as a branch and zero otherwise. Affiliate Net Income/Affiliate Assets is the ratio of affiliate net income to affiliate assets. Log of Affiliate Assets is the natural logarithm of affiliate assets. Standard Deviation of Affiliate NetIncome/Affiliate Assets in the standard deviation of the ratio of affiliate net income to affiliate assets measured over the entire 1982-1999 period using annual data. Affiliate R&D/Affiliate Assets is the ratio of affiliate R&D expenditures to affiliate assets. Affiliate Capital Expenditures/Affiliate Assets is the ratio of affiliate capital expenditures to affiliate assets. Affiliate Leverage is the ratio of affiliate current liabilities and long term debt to affiliate assets. The specifications in columns 1 and 3 include industry and year fixed effects and those in columns 2 and 4 include parent and year fixed effects. Standard errors that correct for clustering of errors by affiliate are presented in parentheses. *, ** and *** indicate statistical significance at the 10%, 5% and 1% level, respectively.
Ln(Affiliate Cash/Affiliate Net Assets)
Affiliate Leverage
Standard Deviation of Affiliate Net Income/Affiliate Assets
Affiliate Capital Expenditures/Affiliate Assets