Embed Size (px)
Citation preview
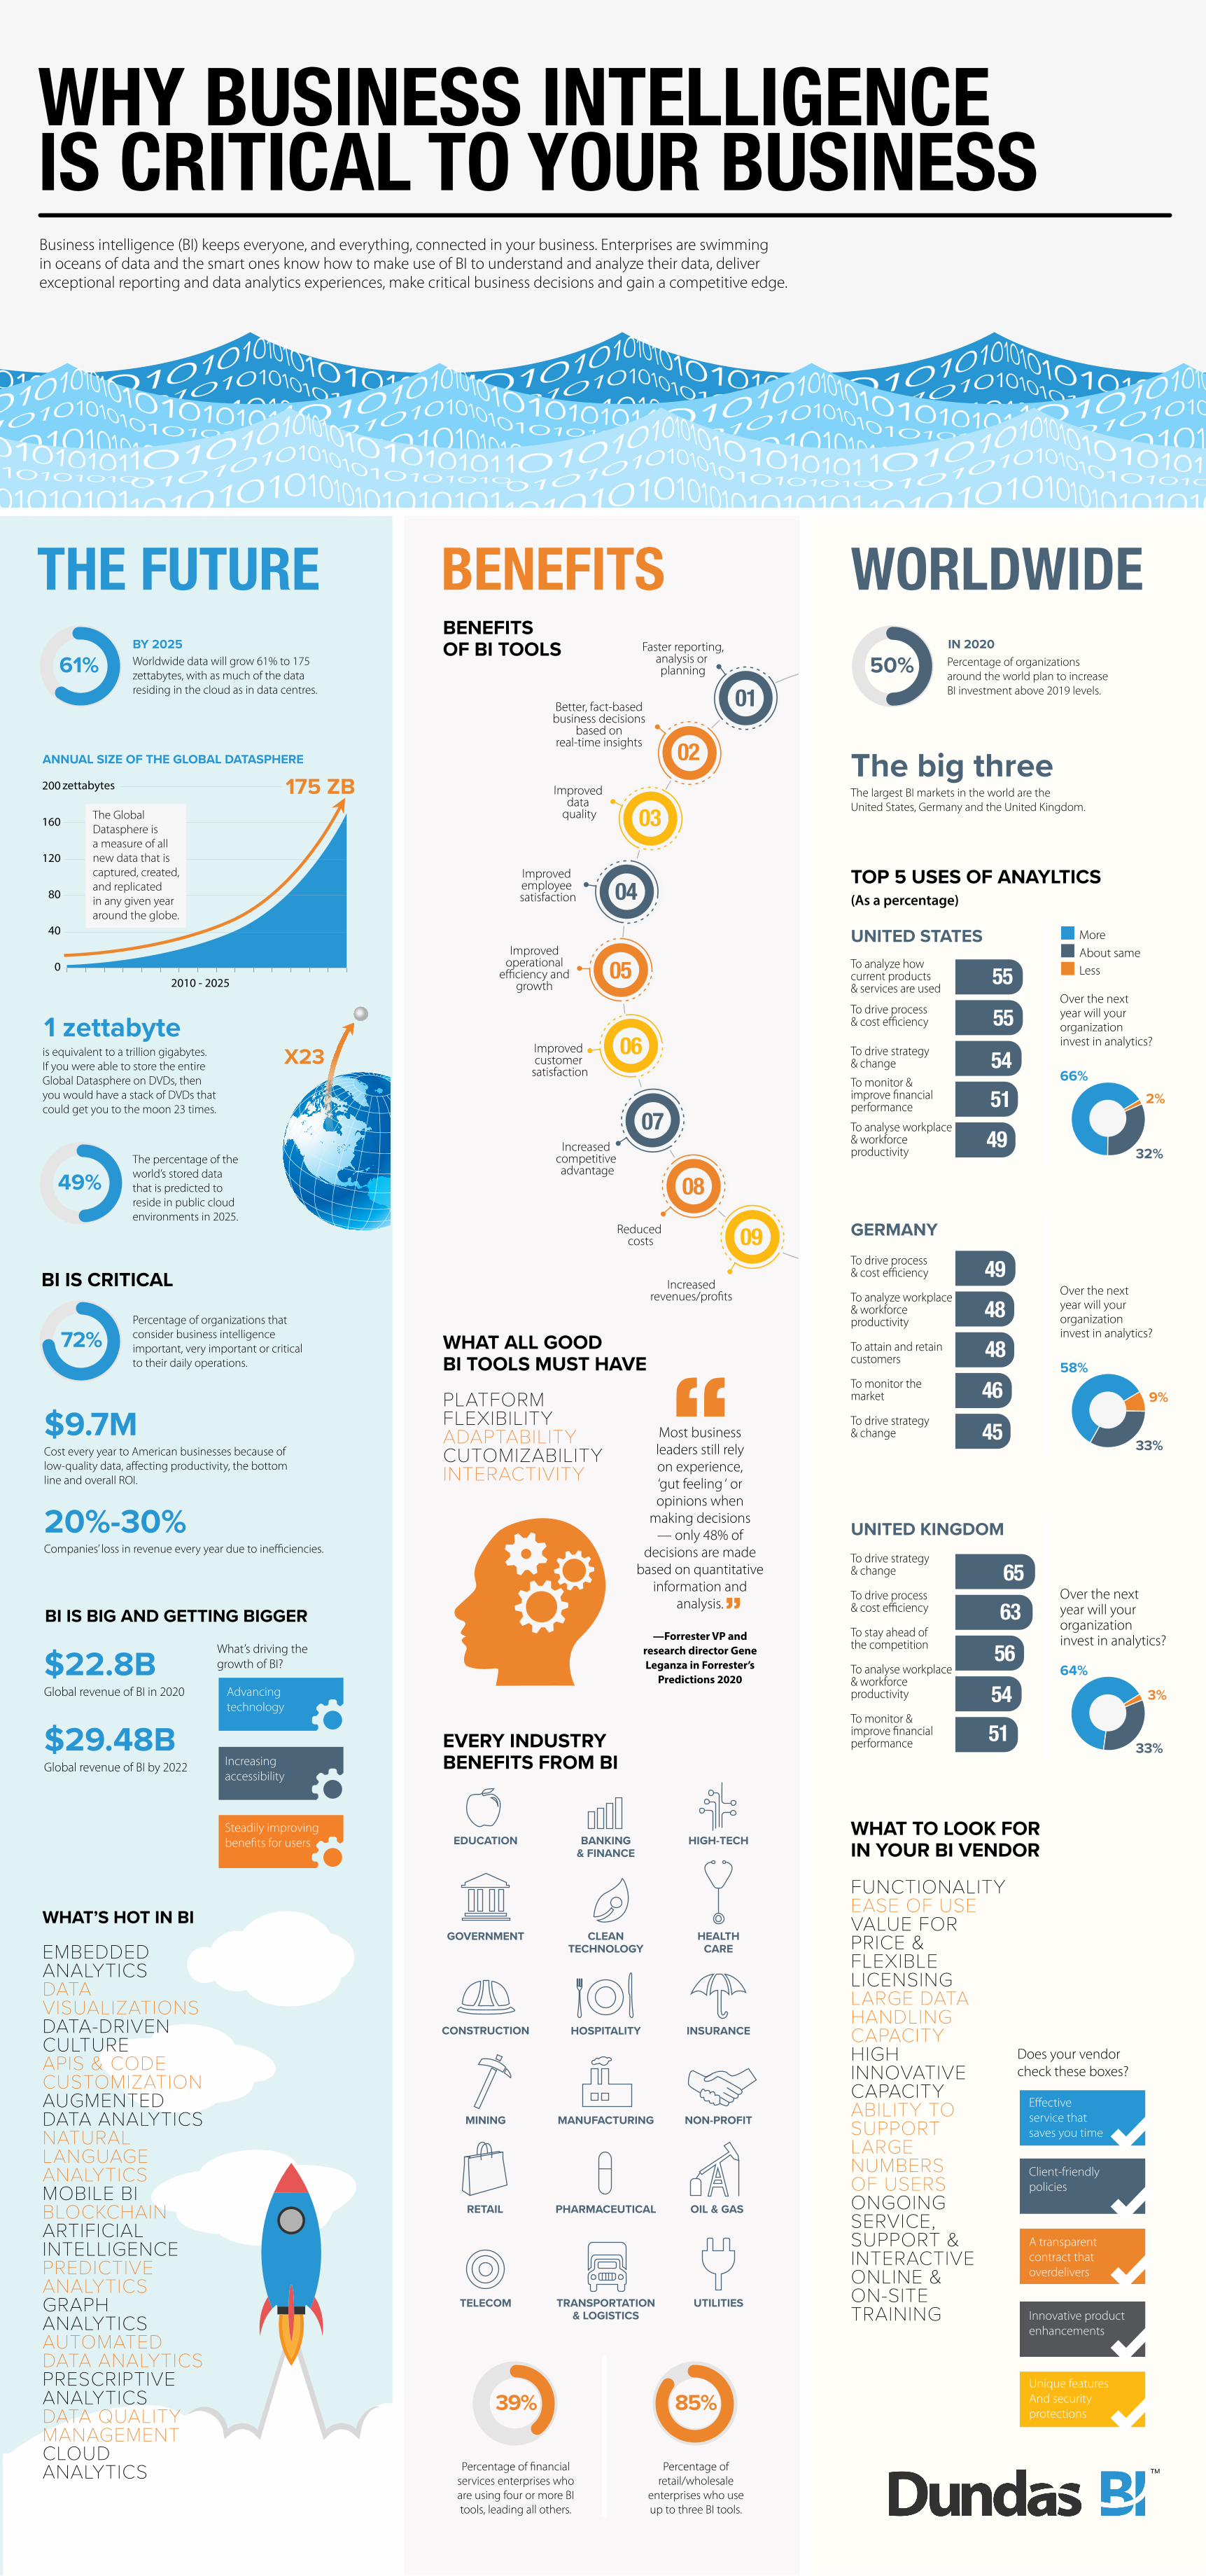
Business intelligence (BI) keeps everyone, and everything, connected in your business. Enterprises are swimming in oceans of data and the smart ones know how to make use of BI to understand and analyze their data, deliver exceptional reporting and data analytics experiences, make critical business decisions and gain a competitive edge.
WHY BUSINESS INTELLIGENCEIS CRITICAL TO YOUR BUSINESS
WITH ALL THAT DATA, BI IS ESSENTIAL
BI IS BIG AND GETTING BIGGER
BY 2025 IN 2020Worldwide data will grow 61% to 175 zettabytes, with as much of the data residing in the cloud as in data centres.
1 zettabyte
Percentage of organizations that consider business intelligence important, very important or critical to their daily operations.
BI IS CRITICAL
ANNUAL SIZE OF THE GLOBAL DATASPHERE
200
160
120
80
40
02010 - 2025
175 ZBzettabytes
The Global Datasphere is a measure of all new data that is captured, created, and replicated in any given year around the globe.
is equivalent to a trillion gigabytes. If you were able to store the entire Global Datasphere on DVDs, then you would have a stack of DVDs that could get you to the moon 23 times.
The percentage of the world’s stored data that is predicted to reside in public cloud environments in 2025.
$9.7MCost every year to American businesses because of low-quality data, a�ecting productivity, the bottom line and overall ROI.
20%-30%Companies’ loss in revenue every year due to ine�ciencies.
$22.8BGlobal revenue of BI in 2020
$29.48BGlobal revenue of BI by 2022
What’s driving the growth of BI?
Advancing technology
Increasing accessibility
Steadily improving bene�ts for users
X23
WHAT’S HOT IN BI
72%
61%
THE FUTURE
49%
TOP 5 USES OF ANAYLTICS
WHAT TO LOOK FOR IN YOUR BI VENDOR
Does your vendor check these boxes?
UNITED STATES
UNITED KINGDOM
GERMANY
Percentage of organizationsaround the world plan to increase BI investment above 2019 levels.
The big threeThe largest BI markets in the world are theUnited States, Germany and the United Kingdom.
Over the next year will your organization invest in analytics?
FUNCTIONALITYEASE OF USEVALUE FOR PRICE & FLEXIBLE LICENSINGLARGE DATA HANDLING CAPACITYHIGH INNOVATIVE CAPACITYABILITY TO SUPPORT LARGE NUMBERSOF USERSONGOING SERVICE, SUPPORT & INTERACTIVE ONLINE & ON-SITE TRAINING
E�ective service that saves you time
Client-friendly policies
A transparent contract that overdelivers
Innovative product enhancements
Unique features And security protections
To drive process & cost e�ciency
To analyze workplace & workforce productivity
To attain and retain customers
To monitor the market
To drive strategy & change
To drive strategy & change
To drive process & cost e�ciency
To stay ahead of the competition
To analyse workplace & workforce productivity
To monitor & improve �nancial performance
MoreAbout sameLess
2%66%
32%
Over the next year will your organization invest in analytics?
9%
58%
33%
Over the next year will your organization invest in analytics?
3%
64%
33%
WORLDWIDE
55
55
545149
49
4848
46
45
6563
56
5451
50%
To analyze how current products & services are used
To drive process & cost e�ciency
To drive strategy & change
To monitor & improve �nancial performance
To analyse workplace & workforce productivity
(As a percentage)
BENEFITSOF BI TOOLS
WHAT ALL GOOD BI TOOLS MUST HAVE
PLATFORMFLEXIBILITYADAPTABILITYCUTOMIZABILITYINTERACTIVITY
Most business leaders still rely on experience, ‘gut feeling ‘ or opinions when
making decisions — only 48% of
decisions are made based on quantitative
information and analysis.
—Forrester VP and research director Gene Leganza in Forrester’s
Predictions 2020
EVERY INDUSTRY BENEFITS FROM BI
BENEFITS
Increased revenues/pro�ts
Faster reporting,analysis or planning
Better, fact-based business decisions
based on real-time insights
Improved data
quality
Improved employee satisfaction
Improved customer
satisfaction
Increased competitive advantage
Reduced costs
Improved operational
e�ciency and growth
02
03
04
05
06
07
08
01
09
Percentage of retail/wholesale
enterprises who use up to three BI tools.
85%
Percentage of �nancial services enterprises who are using four or more BI tools, leading all others.
39%
EDUCATION
GOVERNMENT
CONSTRUCTION
MINING
RETAIL
TELECOM
PHARMACEUTICAL
BANKING& FINANCE
CLEANTECHNOLOGY
HOSPITALITY
MANUFACTURING
TRANSPORTATION& LOGISTICS
OIL & GAS
HIGH-TECH
HEALTHCARE
INSURANCE
NON-PROFIT
UTILITIES
EMBEDDED ANALYTICSDATA VISUALIZATIONSDATA-DRIVEN CULTUREAPIS & CODE CUSTOMIZATIONAUGMENTED DATA ANALYTICSNATURAL LANGUAGE ANALYTICSMOBILE BIBLOCKCHAINARTIFICIAL INTELLIGENCEPREDICTIVE ANALYTICSGRAPH ANALYTICSAUTOMATEDDATA ANALYTICSPRESCRIPTIVE ANALYTICSDATA QUALITY MANAGEMENTCLOUD ANALYTICS