Embed Size (px)
Citation preview

WHITE PAPER
UNDERGROUND WIRELESS DESIGN FOR RAPID RAIL TRANSIT: CHALLENGES AND BEST PRACTICESby Vladan Jevremovic, PhD

2UNDERGROUND WIRELESS DESIGN FOR RAPID RAIL TRANSIT: CHALLENGES AND BEST PRACTICES
01. INTRODUCTION
Rapid rail transit is a common term for the type of local passenger train service found in many large cities throughout the world. As of 2013, 178 cities worldwide had rapid rail transit, with 7,000 train stations and 8,000 kilometers of rail. The world’s busiest systems are Tokyo with 3.2 billion passengers annually, followed by Seoul and Beijing with 2.5 billion each. The largest system is in New York, which has 468 rail transit stations, closely followed by Seoul with 429, with Paris a distant third with 300 [1].
While rapid rail transit differs from city to city, there are some common characteristics. A rapid rail transit system always covers the core urban area of the city (“downtown”), the main commercial and/or tourist area, and must also reach major surrounding areas where commuters live (“suburbs”). As most traffic occurs when commuters travel to and from work, the busiest times (“rush hours”) are in the morning hours and in the late afternoon and early evening. In a typical system, most stations in the core urban area are located below ground and interconnected with tunnels while, in suburban areas, some stations may be below ground and others at ground level. Distances between urban stations are generally shorter than distances between suburban stations.
A train station in a core urban area typically serves more than one rail line. Some stations operate two rail lines from a single platform. Other stations accommodate more rail lines by digging deeper underground, and have multiple platforms, one stacked above the other. These platforms are interconnected by stairs, escalators and elevators. A simplified view of a station with multiple platforms is shown in Figure 1.
Figure 1: Underground rail station with multiple train platforms
3UNDERGROUND WIRELESS DESIGN FOR RAPID RAIL TRANSIT: CHALLENGES AND BEST PRACTICES
There are many examples worldwide of rapid transit stations sharing facilities with regional passenger train service; among the best known are Union station in Washington DC, Amsterdam Centraal railway station and London Victoria station. These stations also have a large number of retail shops and cafés located in the general access area between the station entrance and the entrance to the train platforms. This must be taken into account when sizing the wireless networks, as the shopping and dining opportunities cause commuters to spend more time at the station than they would otherwise.
02. PROBLEM
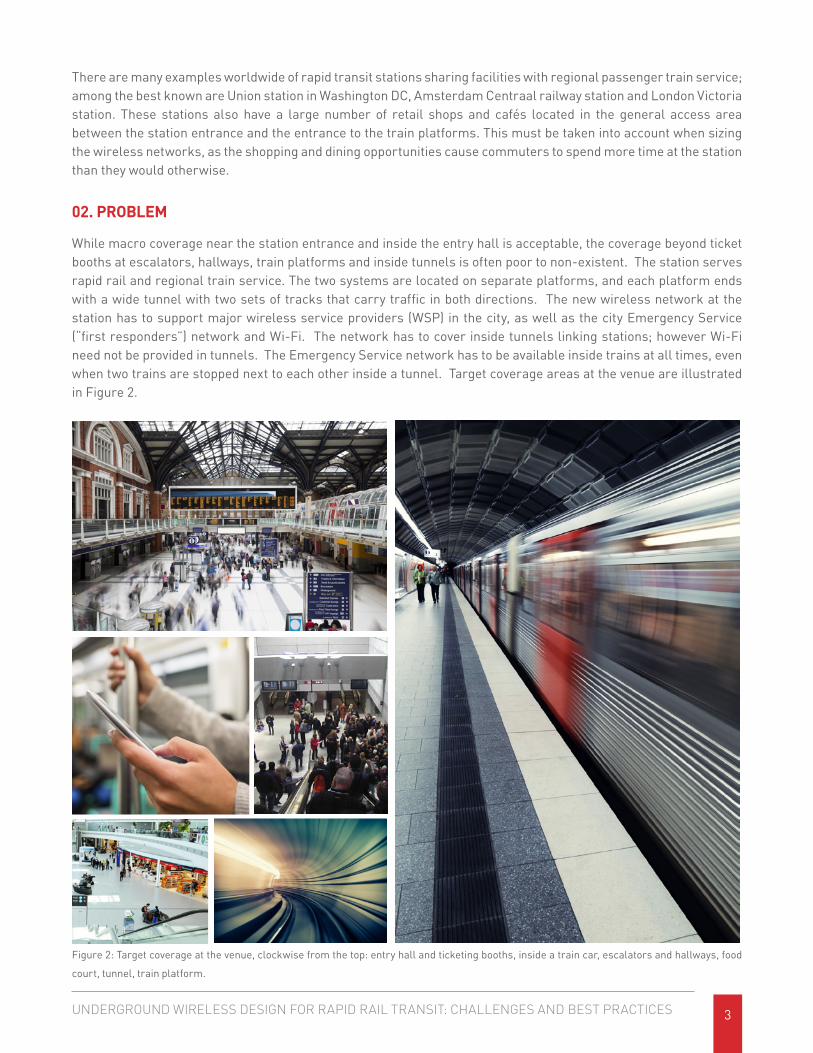
While macro coverage near the station entrance and inside the entry hall is acceptable, the coverage beyond ticket booths at escalators, hallways, train platforms and inside tunnels is often poor to non-existent. The station serves rapid rail and regional train service. The two systems are located on separate platforms, and each platform ends with a wide tunnel with two sets of tracks that carry traffic in both directions. The new wireless network at the station has to support major wireless service providers (WSP) in the city, as well as the city Emergency Service (“first responders”) network and Wi-Fi. The network has to cover inside tunnels linking stations; however Wi-Fi need not be provided in tunnels. The Emergency Service network has to be available inside trains at all times, even when two trains are stopped next to each other inside a tunnel. Target coverage areas at the venue are illustrated in Figure 2.
Figure 2: Target coverage at the venue, clockwise from the top: entry hall and ticketing booths, inside a train car, escalators and hallways, food
court, tunnel, train platform.

4UNDERGROUND WIRELESS DESIGN FOR RAPID RAIL TRANSIT: CHALLENGES AND BEST PRACTICES
03. DESIGN REQUIREMENTS
Specific design requirements for the venue are as follows:
3.1 RF COVERAGE
RF Coverage at the station should be provided for the following wireless technologies:
\ GMS
\ UMTS
\ LTE
\ Trunked Radio (Public Safety)
\ Wi-Fi (802.11n)
The following frequency bands should be included in the network:
\ 700 MHz
\ SMR band (800 MHz)
\ Cellular band (850 MHz)
\ PCS band (1900 MHz)
\ AWS band (2100 MHz)
\ 2.4 GHz
The coverage at the station must include the entry hall with retail shops, train platforms, ticket booths, stairs, escalators and hallways. A 3D view is shown in Figure 3. The coverage must also extend into tunnels for all technologies except Wi-Fi and for all bands except the 2.4 GHz band. An important requirement is that Emergency Service coverage inside trains must be present even when trains are stopped in a tunnel next to each other.
Train platform
Train platform
Escalators
Escalators
Tunnel entryTunnel entry
HallwayHallway
Figure 3: 3D view of the train station

5UNDERGROUND WIRELESS DESIGN FOR RAPID RAIL TRANSIT: CHALLENGES AND BEST PRACTICES
Target RF signal strength values are as follows:
\ GSM BCCH -85 dBm
\ UMTS CPICH -85 dBm
\ LTE RSRP -95 dBm
\ Trunked Radio Rx -95 dBm
\ Wi-Fi Rx -75 dBm
For trunked radio, coverage is required at 100% of the station and tunnels. For cellular technologies, coverage is required over 95% of the station and tunnels. For Wi-Fi, coverage is required over 95% of the station only. These design values are typical for wireless networks.
3.2 CAPACITY
During rush hour there are 120 train stops at the station. On average, a train spends 30 seconds at the station loading and unloading passengers. A typical train has 10 cars, and each car can carry up to 150 passengers. At the entry hall are a dozen retail stores and several small restaurants. During rush hour there are 1,000 commuters, shopkeepers and restaurant staff in the entry hall area. In this example, four WSPs require coverage at the venue, and their technology and customer penetration breakdown is as follows:
\ WSP A: 30% penetration rate - GSM 5% - UMTS 35% - LTE 60%
\ WSP B: 25% penetration rate - GSM 5% - UMTS 40% - LTE 55%
\ WSP C: 25% penetration rate - GSM 5% - UMTS 45% - LTE 50%
\ WSP D: 20% penetration rate - GSM 10% - UMTS 60% - LTE 30%
A WSP network is sized to support rush hour traffic with specified call blocking rates. For a voice-only network such as GSM, the target voice call blocking rate is between 1% and 5%, with 2% most commonly used. For voice and data networks such as UMTS and LTE, call blocking rate varies with data rate; an application that requires a high data rate, such as data download or video streaming, will have a higher call blocking rate. In such cases, a composite call blocking rate is calculated that takes into account call blocking rates for individual applications. A typical composite call blocking rate is 5% or more.

6UNDERGROUND WIRELESS DESIGN FOR RAPID RAIL TRANSIT: CHALLENGES AND BEST PRACTICES
3.3 HANDOFF MANAGEMENT
The goal of handoff management is to establish a clear handoff area between two sectors. Two types of handoff exist: handoffs between macro networks and the in-building network; and those between in-building network sectors. As most of the station is underground, there is very little residual macro network signal overlap, mostly near the station entrance where the retail shops and restaurants are located. Depending on the number of subscribers at the station, a WSP may require multiple sectors to support subscriber traffic. In such cases, the handoff area between the sectors should be confined to transit areas such as walkways, escalators or stairways. Another potential handoff area is inside tunnels where handoff must be completed while the train is moving at full speed. Section 5.1 provides more on this topic.
04. SOLUTION
As the in-building system has to include multiple WSPs and the Emergency Service (ES) network, an optimum solution is the use of a neutral host Distributed Antenna System (DAS). ES and WSPs may be deployed in a converged DAS, or two separate DAS may be built, one for ES and one for all WSPs. The decision whether to deploy the converged or the discrete DAS architecture should be based on EIRP, spectrum bands and technologies that are being deployed. At the station, DAS amplifiers (Remote Units) are connected via coax cables to point-source antennas. In tunnels, coverage is provided by radiating cables, sometimes called leaky feeders, which are connected to Remote Units. Wi-Fi access points are deployed throughout the station but do not share antennas and cabling with the DAS. Because Wi-Fi does not support full mobility, there is no requirement for Wi-Fi coverage in tunnels. As a general principle, Wi-Fi coverage can be provided inside train cars only if Wi-Fi access points use a cellular network as wireless backhaul. In that case, the cellular network shares capacity with the Wi-Fi network and the maximum achievable data rate of the Wi-Fi inside cars is limited by the maximum achievable data rate for the network in tunnels.
05. BEST PRACTICES
5.1 RF COVERAGE
Coverage at the station is best achieved with multiple point-source antennas. At a long platform with a high or open ceiling, it is best to use directional antennas placed at opposite ends. In locations with low ceilings, such as walkways, entry halls and stairs like those shown in Figure 2, omnidirectional antennas are best. Antenna equivalent isotropically radiated power (EIRP) should be kept under 30 dBm so as to limit Passive Intermodulation (PIM). The subject of PIM is covered in greater detail in section 5.4.
As outlined in section 2, the station has two platforms. The Regional Rail platform (Platform 1), equipped with two directional antennas, is shown in Figure 4.
Figure 4: Platform 1 with directional antennas at opposite ends

7UNDERGROUND WIRELESS DESIGN FOR RAPID RAIL TRANSIT: CHALLENGES AND BEST PRACTICES
A 3D illustration of Platform 1 with two trains stopped next to each other is shown in Figure 5.
Figure 5: Platform 1 with two trains present
A 3D illustration of the Rapid Rail Transit platform (Platform 2) with one train at the platform is shown in Figure 6.
Figure 6: Platform 2 with One Train Present
If Line of Sight (LOS) exists between tunnel exits, directional point-source antennas mounted at opposite ends may provide sufficient coverage. If not, radiating cables are recommended. In a tunnel with two tracks, radiating cables carrying public safety signal should be mounted along opposite walls to provide coverage even when trains are stopped next to each other. Figure 7 illustrates this case, with radiating cables mounted on opposite walls.

8UNDERGROUND WIRELESS DESIGN FOR RAPID RAIL TRANSIT: CHALLENGES AND BEST PRACTICES
Figure 7: Radiating cables mounted along opposite walls in a tunnel
Let us now examine radiating cable length limits. Eupen RMC 78-HLFR cable has 69 dB coupling loss at 1900 MHz, and 6.4 dB loss per 100 meters [2]. Assuming that a high-power (10 W) Remote Unit (RU) is used to feed the cable, and also assuming -85 dBm receive power inside the train and approximately 5 dB penetration loss for 1 cm thick windows [3], the maximum path loss is 40 + 85 - 5 = 120 dB. Taking into account the 69 dB coupling loss, the maximum permissible loss due to cable length is 120 - 69 = 51 dB. At 6.4 dB loss per 100 meters, this maximum cable loss of 51 dB is reached after only 800 meters. Two cable runs from each end can provide coverage for tunnels up to 1.6 km long.
In a tunnel longer than 1.6 kilometers, cascading RUs may be used to extend coverage. However, the use of cascading RUs increases uplink noise per channel which degrades uplink data rate and capacity. To maintain uplink performance, carrier-to-noise ratio (C/N) for the sector with cascaded RUs must be calculated and compared against target uplink C/N.
“Search window” is a UMTS parameter that defines the maximum path distance that can be resolved at the receiver. According to the 3GPP RRC Protocol Specification [4], UMTS search window has one of 3 values: 40 chips (± 20 chips), 256 chips (± 128 chips), and 2560 chips (± 1,280 chips). Taking into account UMTS chip duration (0.26 ms), the maximum resolvable path difference if the search window is set at 40 chips is 1,560 meters; if the search window is set at 256 chips then the maximum path difference is 10 kilometers, and for 2560 chips it is 100 kilometers. If multipath is greater than the maximum path difference, it is treated as interference. To combat interference caused by excessive signal delay, the search window size must be adjusted. For example, a UMTS sector that connects to a radiating cable longer than 1.5 kilometers should have a search window time set at 256 chips, not 40.
LTE technology counters multipath by introducing a “guard period”, a downlink transmission gap between consecutive OFDM symbols. This transmission gap is called the “cycle prefix” (CP) and, according to the 3GPP standard [5], the guard period is 5.2 ms for normal CP and 16.7 ms for extended CP if sub-channel spacing is 15 kHz. A CP duration of 5.2 ms is equivalent to a maximum path difference of 1,560 meters, while a 16.7 ms CP duration is equivalent to a 5-kilometer path difference. Therefore an LTE sector that connects to cascaded radiating cables longer than 1.56 kilometers should have extended CP. Cascaded radiating cables longer than 5 kilometers should not be used with this technology.

9UNDERGROUND WIRELESS DESIGN FOR RAPID RAIL TRANSIT: CHALLENGES AND BEST PRACTICES
If multiple sectors are used in a tunnel, a sufficient coverage overlap must be maintained to allow for multiple handover tries. When calculating coverage overlap, one should take into account train speed at the handover area, and that the signal strength from both sectors must be above the target level during consecutive handoff attempts [6]. As a handoff attempt takes 2-3 seconds, and at least 3 handoff attempts should be possible in the overlapping area, a train should spend at least 10 seconds in the handoff zone. For example, if train speed is 36 km/h, the handoff zone should be 100 meters long and the last 100 meters of the radiating cable connected to one tunnel sector should overlap with first 100 meters of the radiating cable connected to the next.
5.3 CAPACITY SIZING
Capacity sizing determines the number of sectors required to support peak traffic at the venue. As given in section 3.2, on average there are two trains per minute and each train spends 30 seconds at the station. This implies that there are at least two trains at the station during rush hour. However, these are average numbers, and to calculate maximum peak capacity one must take into account that occasionally as many as four trains may be at the station simultaneously. Each train has up to 10 cars, and each car has up to 150 passengers, so four trains may carry up to 6,000 rush hour commuters. When we take into account the presence of 1,000 more people in the entry hall shopping and food area, the maximum number of people at the station during rush hour is 7,000.
During rush hour, according to the customer penetration breakdown given in section 3.2, WSP A has 2,100 subscribers at the station, WSP B and C have 1,750 subscribers each, and WSP D has 1,400. If we assume two trains in the tunnel during rush hour, there are another 3,000 commuters there; that is, WSP A has 900 subscribers in the tunnel, WSP B and C have 750 each, and WSP D has 600.
The next step is to break down the number of subscribers per technology, both inside tunnels and at the station. Taking into account the technology percentage distribution given in section 3.2, the breakdown is as shown in Table 1.
station tunnel station tunnel station tunnelWSP A 105 45 735 315 1260 540WSP B 88 38 700 300 962 413WSP C 88 38 787 337 875 375WSP D 140 60 840 360 420 180
GSM UMTS LTE
Table 1: Number of subscribers by technology and location
5.3.1 DATA CAPACITY SIZING
The first step is to define subscriber profiles for each technology and each WSP. For each service type, the duration of the network connection during busy hour is expressed in milliErlangs (mE) per subscriber. It is important to note that a subscriber is not limited to one service attempt per busy hour; rather, he or she may attempt to use all of the service types listed. A fixed data rate (in kbps) must be defined for each service type. An example of subscriber profile with data traffic distribution at a subway station is shown in Table 2.

10UNDERGROUND WIRELESS DESIGN FOR RAPID RAIL TRANSIT: CHALLENGES AND BEST PRACTICES
Service type mE/User kbpsEmails 50 100Browsing 100 200Video conf 20 600
Data Download 150 1000Video Streaming 100 2000
Table 2: Data Traffic Distribution at the Venue during Busy Hour by Service Type: Call Duration (milliErlangs per user) Data Rate (Kbps)
It is assumed that voice traffic is carried over WCDMA (R99) protocol, while 3G and 4G data are carried over HSPA and LTE protocols respectively. LTE SINR coverage in the venue is calculated and broken down into intervals based on the modulation scheme that can be achieved in each interval. The relationship between SINR, modulation and spectral efficiency was taken from a research paper [7]. The example in Table 3 shows that, in the region where LTE PDSCH SINR ≥ 20 dB, 64-QAM modulation with coding rate R = 0.93 is possible, which gives a spectral efficiency of 5.5 bit/s/Hz. With SINR between 15 and 20 dB, spectral efficiency is 3.9 bit/s/Hz, with SINR between 9 and 15 dB, the efficiency is 2.4 bit/s/Hz, etc. These MCS efficiency values assume SISO configuration.
Modulation MCS efficiency SINRQPSK 1.18 316 QAM 2.40 964 QAM 3.90 1564 QAM 5.55 20
Table 3: LTE Example Showing the Relationship between Modulation Scheme, MCS Efficiency (bit/s/Hz), and SINR (dB)
By knowing the relationship between the signal modulation scheme, spectral efficiency and SINR, the number of resources needed to support each service type listed in Table 2 can be calculated. These “resources” are different for different technologies: LTE resources are Physical Resource Blocks (PRB); UMTS resources are HSPA orthogonal codes; etc. As spectral efficiency varies with SINR, so does the number of resources needed to support a certain service type in each SINR zone. For example, if SINR is high, fewer PRB may be required to support email than if SINR is low.
Next, we produce the downlink LTE SINR coverage map. As sector overlap affects SINR, an assumption must be made about the number of sectors in the network. The station has two train platform levels and two additional levels. It is reasonable to assume that one sector is needed for each train platform. We will also assume that each sector covers one additional level. The resultant LTE SINR coverage at the station is shown in Figure 8.

11UNDERGROUND WIRELESS DESIGN FOR RAPID RAIL TRANSIT: CHALLENGES AND BEST PRACTICES
Figure 8: LTE PDSCH SINR Coverage used for Data Capacity Sizing Example
LTE SINR Range 1, (3 ≤ SINR ≤ 9), covers 10% of the area, SINR Range 2 (9 ≤ SINR ≤ 15) covers 20% of the area, SINR Range 3 (15 ≤ SINR ≤ 20) covers 20% of the area, and SINR Range 4 (SINR > 20) covers 50% of the area. Assuming a uniform distribution of commuters (a reasonable assumption), the percentage of LTE users within each SINR range is the same as the SINR coverage percentage for that range.
Let us assume that LTE has a 10 MHz channel and that there are 500 subscribers per LTE sector for a total of 1,000 LTE subscribers at the station. LTE busy-hour traffic (in Erlangs) is calculated based on the number of subscribers per SINR Range and on busy-hour traffic per subscriber as given in Table 2. The results are shown in Table 4.
Metrics Range 1 Range 2 Range 3 Range 4
SNIR 3 9 15 20Distribution 10.0% 20.0% 20.0% 50.0%Subscribers 100 200 200 500emails 5.0 10.0 10.0 25.0browsing 10.0 20.0 20.0 50.0video conf 2.0 4.0 4.0 10.0data download 15.0 30.0 30.0 75.0video streaming 10.0 20.0 20.0 50.0
Table 4: Offered LTE Busy-Hour Traffic (Erlangs) by Service Type and SINR Range
The number of resources needed to support the service types across the ranges is calculated next. Table 5 shows, for this example, the distribution of LTE PRBs for each SINR range.

12UNDERGROUND WIRELESS DESIGN FOR RAPID RAIL TRANSIT: CHALLENGES AND BEST PRACTICES
Service Type Range 1 Range 2 Range 3 Range 4
Emails 1 1 1 1Web Browsing 2 1 1 1
Video Conferencing 4 2 2 1Data Download 6 3 2 2Video Streaming 12 6 4 3
Table 5: Number of LTE PRBs by Service Type and SINR Range
Based on Table 4 and Table 5, and given the total number of PRBs in 10 MHz channel, the blocking rate for each service type can be calculated. Blocking rate is defined as the percentage of attempted network connections that are denied due to insufficient network resources. The blocking rate formula for multiple services used for this the calculation is taken from the ITU-R recommendation [8]. Encountered blocking rate for each service type and SINR range is shown in Table 6. An implicit assumption was made that LTE packet delay is equal to one frame length (10 ms) for all services.
Service Type Range 1 Range 2 Range 3 Range 4
Emails 2.1% 2.1% 2.1% 2.1%Browsing 4.2% 2.1% 2.1% 2.1%Video conf 8.3% 4.2% 4.2% 2.1%Data Download 12.2% 6.2% 4.2% 4.2%Video Streaming 23.5% 12.2% 8.3% 6.2%
Table 6: Encountered LTE Blocking Rate (%) during Busy Hour by Service Type and SINR Range
Table 6 is the key for sizing the network as it shows the blocking rate for all service types throughout the station (Range 1-4). For example, we see that 6.2% of the attempts to stream video using LTE from the area where LTE SINR > 20 dB (Range 4) are blocked due to insufficient LTE resources.
If the calculated blocking rates shown in Table 6 are deemed unacceptable, then the number of sectors must be increased, the SINR map recalculated, and the capacity calculations repeated. This is an iterative process that is continued until acceptable blocking rates are found.
Carried busy-hour traffic is calculated next based on offered traffic (Table 4) and encountered blocking rate (Table 6) for each service type. Results are shown in Table 7.
Service Type Range 1 Range 2 Range 3 Range 4 Total
Emails 4.9 9.8 9.8 2.48 24.5Browsing 9.6 19.6 19.6 7.42 48.9Video conf 1.8 3.8 3.8 4.88 9.8Data Download 13.2 28.1 28.7 7.22 71.9Video Streaming 7.6 17.6 18.3 4.62 46.9
Table 7: Carried LTE Busy-Hour Traffic (Erlangs) by Service Type and SINR Range
To determine total offered busy-hour traffic at the venue, the entries in Table 4 are summed. To determine carried busy-hour traffic, the entries in Table 7 are summed. Offered LTE traffic is 420 Erlangs while carried LTE traffic is 398 Erlangs. The composite call blocking rate (BR) is calculated as:
BR = (1 – {carried traffic /offered traffic})
which, for this example, gives 5.2%.

13UNDERGROUND WIRELESS DESIGN FOR RAPID RAIL TRANSIT: CHALLENGES AND BEST PRACTICES
Duty cycle is defined as the ratio of carried traffic to theoretical maximum traffic when all resources are used for the full busy hour, and is calculated to be 39.8%. Data usage is carried traffic during busy hour, and is calculated to be 150.4 Gigabytes (GB).
If the capacity statistics for two LTE sectors carrying traffic for 1,000 subscribers are deemed acceptable, then WSP B and WSP C may use this same sectorization plan as they have close to 1,000 LTE subscribers. For WSP A (1,200 subscribers), the SINR coverage map and capacity statistics need to be recalculated for three LTE sectors. As WSP D has only 500 subscribers, its sectorization plan calls for one sector only.
The same exercise can be repeated for HSPA. As was the case with LTE, we assume HSPA packet delay of 10 ms. Assuming the same two-sector configuration, the HSPA SINR coverage map is as shown in Figure 9.
Figure 9: HSPA SINR Coverage used for Data Capacity Sizing Example
HSPA SINR Range 1 (5 ≤ SINR ≤ 11) covers 6% of the area, SINR Range 2 (11 ≤ SINR ≤ 22) covers 19% of the area, SINR Range 3 (22 ≤ SINR ≤ 24) covers 17% of the area, and SINR Range 4 (SINR > 24) covers 58% of the area. Let us assume one 5 MHz RF channel and 800 HSPA subscribers. We then calculate busy-hour traffic (in Erlangs) based on the number of subscribers per SINR Range and on busy-hour traffic per subscriber as given in Table 2. The results are shown in Table 8.

14UNDERGROUND WIRELESS DESIGN FOR RAPID RAIL TRANSIT: CHALLENGES AND BEST PRACTICES
Metrics Range 1 Range 2 Range 3 Range 4
SINR 5 11 22 24Percentage coverage 6.0% 19.0% 17.0% 58.0%Users 48 152 136 464Emails 0.24 0.76 0.68 2.32Web Browsing 0.72 2.28 2.04 6.96Video Conferencing 0.48 1.52 1.36 4.64Data Download 0.72 2.28 2.04 6.96Video Streaming 0.48 1.52 1.36 4.64
Table 8: Offered HSPA Busy-Hour Traffic (Erlangs) by Service Type and SINR Range
The number of HSPA codes needed to support the service types across the zones are calculated in a similar manner to that used for LTE Resource Blocks (RB). The distribution of HSPA codes per SINR range is shown in Table 9.
Service Type Range 1 Range 2 Range 3 Range 4
Emails 3 1 1 1Web Browsing 6 3 1 1
Video Conferencing 19 8 1 1Data Download 31 13 2 1Video Streaming 63 25 4 2
Table 9: Number of HSPA Codes by Service Type and SINR Range
Based on Table 8 and Table 9, and given the total number of HSPA codes in the two sectors, the blocking probabilities for each service type are calculated next. Encountered blocking rate values for each service type and SINR range are as shown in Table 10.
Service Type Range 1 Range 2 Range 3 Range 4
Emails 84.5% 46.1% 46.1% 46.1%Browsing 97.7% 84.5% 46.1% 46.1%Video conferencing 100.0% 99.4% 46.1% 46.1%Data Download 100.0% 100.0% 71.0% 46.1%Video Streaming 100.0% 100.0% 91.8% 71.0%
Table 10: Encountered HSPA Blocking Rate by Service Type and SINR Range
Carried busy-hour traffic is calculated based on offered traffic (Table 8) and encountered blocking rate (Table 10) for each service type. Results are shown in Table 11.
Service Type Range 1 Range 2 Range 3 Range 4
Emails 0.37 4.10 3.67 12.51Browsing 0.11 2.35 7.33 25.02Video conf 0.00 0.02 1.47 4.54Data Download 0.00 0.01 5.91 6.80Video Streaming 0.00 0.00 1.12 13.43
Table 11: Carried HSPA Busy-Hour Traffic (Erlangs) by Service Type and SINR Range
Offered HSPA traffic (Table 8) is 336 Erlangs and carried traffic (Table 11) is 120 Erlangs. Composite blocking rate is 64.3%, duty cycle is 80%, and data usage is 35.8 Gigabytes (GB). Clearly, blocking is too high, as high data rate service such as video streaming and data download have more than 50% call blocking almost everywhere. This means that 2 HSPA sectors with one RF channel each are not sufficient to support 800 subscribers. Either more HSPA sectors or more RF channels per sector need to be added to improve the statistics.

15UNDERGROUND WIRELESS DESIGN FOR RAPID RAIL TRANSIT: CHALLENGES AND BEST PRACTICES
5.3.2 VOICE CAPACITY SIZING
Voice capacity sizing is based on the assumption that voice traffic will be carried over the WCDMA (R99) part of the UMTS signal. As an assumption was made that VoIP is not implemented in the LTE network, voice capacity has to account for both 3G and 4G subscribers. The number of voice subscribers is shown in Table 12.
station tunnelWSP A 1995 855WSP B 1662 713WSP C 1662 712WSP D 1260 540
Voice
Table 12: Number of 3G and 4G Voice Subscribers
When defining the subscriber profile for R99, we take into account that data traffic will switch to R99 data only if both HSPA and LTE are unavailable. Therefore, the probability of an R99 data call is very low as is reflected in the R99 traffic distribution shown in Table 13.
Service type mE/User kbpsVoice 33 12.2
Emails 3 64Browsing 3 128Data download 3 384
Table 13: R99 Traffic Distribution at the Venue during Busy Hour by Service Type: Call Duration (milliErlangs per user), Data Rate (kbps)
As we did for the data capacity calculations, we first determine Eb/No coverage (Eb/No is the ratio of energy per bit to noise power spectral density), separate the coverage into four different Eb/No ranges, and identify service types that can be used in each range. The resulting Eb/No coverage map is shown in Figure 10, assuming a two-sector configuration.
Figure 10: Eb/No Coverage Map Used for Voice Sizing Example

16UNDERGROUND WIRELESS DESIGN FOR RAPID RAIL TRANSIT: CHALLENGES AND BEST PRACTICES
The coverage area in which a subscriber may connect to video telephony (dark blue in Figure 10) is also the area in which a connection to switched data and voice is possible. Assuming a uniform subscriber distribution, the percentage of subscribers connecting to the service in a particular Eb/No range is the same as the percentage of coverage for that range. If we assume 1,000 R99 subscribers per sector for a total of 2,000 subscribers in the venue, the resulting user distribution and R99 traffic per Eb/No range (in Erlangs) are as shown in Table 14.
Metrics Range 1 Range 2 Range 3 Range 4
Eb/No 9 8 7 6Distribution 0.1% 0.5% 4.5% 95.0%Users 2 10 90 1900Voice 0.1 0.3 3.0 62.7
Emails - 0.0 0.3 5.7Browsing - - 0.3 5.7Data download - - - 5.7
Table 14: R99 Busy-Hour Traffic (Erlangs) by Service Type and Eb/No Range
Only OVSF codes with a spreading factor up to SF128 are used for the service types shown in Table 14. The required numbers of OVSF codes for each service type and Eb/No range are as shown in Table 15.
Service type Range 1 Range 2 Range 3 Range 4
Voice 1 1 1 1
Emails - 4 4 4Browsing - - 8 8
Data download - - - 16
Table 15: Number of OVSF Codes by Service Type and Eb/No Range
As was the case with HSPA and LTE technologies, call blocking rates are calculated as per [8]. Results are as shown in Table 16.
Service Type Range 1 Range 2 Range 3 Range 4
Voice 1.1% 1.1% 1.1% 1.1%Emails - 4.4% 4.4% 4.4%Browsing - - 8.9% 8.9%Data download - - - 18.6%
Table 16: R99 Encountered Blocking Rates (%) by Eb/No Range
R99 blocking rate is the percentage of attempted network connections that are denied during busy hour due to insufficient network resources. For two sectors with 2,000 subscribers, the R99 voice blocking rate is just over 1% throughout the venue. Most macro UMTS networks use a busy-hour call blocking rate target between 1% and 5%, with 2% being most common. Other R99 service types have higher blocking rates, but this is not of much concern because they are supported with better rates in HSPA and LTE networks. The conclusion is that the call blocking rate for R99 traffic is acceptable and therefore the two-sector configuration is sufficient to support voice traffic for both 3G and 4G subscribers.
As mentioned in section 4, although Wi-Fi coverage need not be provided in tunnels because Wi-Fi technology does not support high speed and handoff, Wi-Fi can be provided inside the train by placing an access point inside each car. These access points may use the existing cellular signal in the tunnel and at the station as wireless backhaul. This is known as “train Wi-Fi”, and is separate from the Wi-Fi provided at the station. The “train Wi-Fi” shares capacity with the WSP that provides wireless backhaul and its maximum achievable data rate is limited by the backhaul data rate.

17UNDERGROUND WIRELESS DESIGN FOR RAPID RAIL TRANSIT: CHALLENGES AND BEST PRACTICES
5.4 ENVIRONMENTAL CHALLENGES
Train station and tunnels are some the most challenging environments to deploy an in-building wireless system. At these types of venues, more than at any other venue, the environment dictates RF design and network maintenance. Some of the best practices born out of environmental challenges are as follows:
\ Equipment location has to be chosen with ease of access in mind, not with ease of installation. If a choice is to be made between having one DAS Remote Unit in the middle of the tunnel to feed a bidirectional antenna, or having one RU and one point source antenna at each entrance, the latter should be chosen as two RUs at tunnel entrance are cheaper to maintain than one RU inside the tunnel.
\ A small room that has 24/7 access is preferable to a bigger room accessible only when the station is closed to the public.
\ When choosing RU locations, consider whether vandals can easily spot and damage or steal the equipment.
\ Each RU should have battery backup power, as power outages at stations and in tunnels are common. When sizing battery backup power, it should be taken into account that these power outages are frequent but short.
\ If radiating cable is used inside a tunnel, it needs to be properly attached to walls, as wall vibrations caused by passing trains may make the cable loose and degrade its performance.
\ Tunnels occasionally get exposed to water leaks, so all connections should be waterproofed as rust may cause Passive Intermodulation (PIM). Passive components with high ingress protection (IP) liquid rating are preferred, as they are more resistant to water [9].
\ Another source of PIM is dust, of which there is plenty inside tunnels.
\ Some stations may experience AC instabilities, which may reduce the lifetime of the equipment. Power converters should be used to convert from AC to DC and back to AC, to filter the instabilities out.
\ Point source antennas at the station should be placed away from any metallic objects, as those are known source of PIM. Train stations have such objects hanging from ceiling or attached to walls. However, the most significant metallic object is the train itself, which has metal walls. Therefore, antennas that cover platforms should not be mounted immediately above the train tracks.
06. DETAILED RF COVERAGE DESIGN
GSM coverage for WSP A in a tunnel, at both train platforms and throughout the station is shown in Figure 11 through Figure 14. Note that signal strength inside trains is at -85 dBm or greater, even when trains are next to each other, the worst-case scenario.

18UNDERGROUND WIRELESS DESIGN FOR RAPID RAIL TRANSIT: CHALLENGES AND BEST PRACTICES
Figure 11: GSM coverage in a tunnel and inside trains (radiating cables at both walls)
Figure 12: GSM coverage at platform 1 with two trains at the platform

19UNDERGROUND WIRELESS DESIGN FOR RAPID RAIL TRANSIT: CHALLENGES AND BEST PRACTICES
Figure 13: GSM coverage at platform 2 with a train at the platform
Figure 14: GSM coverage at the station

20UNDERGROUND WIRELESS DESIGN FOR RAPID RAIL TRANSIT: CHALLENGES AND BEST PRACTICES
For data-centric networks, signal-to-interference-plus-noise ratio (SINR) coverage is the key because good SINR coverage facilitates high data rates. Figure 15 shows LTE SINR at the station.
Figure 15: LTE SINR coverage
LTE coverage at the station is provided with 14 antennas. At opposite sides of train platforms, directional antennas are used (Amphenol Jaybeam model 7478000 with 11.5 dBi gain); omnidirectional antennas are used elsewhere (Kathrein model 741 572 with 2.15 dBi gain). Macro network interference is limited to the station entry hall, not shown. SINR is very high at the platforms and lower where In-building sectors overlap. Consequently, maximum achievable data rate (MADR) is also very high at the platforms, and lower elsewhere, as shown in Figure 16.

21UNDERGROUND WIRELESS DESIGN FOR RAPID RAIL TRANSIT: CHALLENGES AND BEST PRACTICES
Figure 16: LTE MADR coverage
07. CONCLUSION
A rail station providing service to both regional trains and local rapid transit trains has poor existing macro coverage and is in need of a dedicated in-building wireless system. As an example, at this station four WSPs must be included in the in-building network, as well as Wi-Fi and a First Responders (public safety) network. Wi-Fi coverage at the station does not extend into the tunnels, while all other wireless services require coverage in connecting tunnels as well. All four WSPs support 2G, 3G and 4G technologies across different frequency bands, which dictates the use of a neutral-host DAS as the solution. Since the station is a multi-level structure, 3D modeling of the venue is essential. Inside tunnels, the network has to provide coverage inside trains even when trains are stopped next to each other. For most tunnels, this requirement dictates the use of radiating cables, also known as leaky feeders.
There are several environmental factors specific to such venues that make design and maintenance a challenge. Rail stations have many metallic objects and, because proximity to metal objects causes PIM, it is often challenging to find good locations for antennas. In tunnels, damp conditions may cause connectors to rust and vibrations caused by passing trains may loosen radiating cables; both conditions generate PIM and therefore degrade network performance. Long tunnels may require cascaded amplifiers to maintain coverage; however cascading amplifiers may increase uplink noise which affects uplink capacity and data rate. Another way to maintain coverage in tunnels is to install multiple sectors; however, sufficient sector coverage overlap must be provided to allow for multiple handoff attempts at nominal train speed.
As a rule, it is preferable to locate equipment so that it is easy to access rather than less expensive to deploy, as the equipment requires frequent maintenance. One must also be mindful of vandalism, and make the equipment as inconspicuous as possible. The numerous requirements make this venue type one of the most expensive to design and operate.

22UNDERGROUND WIRELESS DESIGN FOR RAPID RAIL TRANSIT: CHALLENGES AND BEST PRACTICES
REFERENCES:
1. iBwave webinar: “Designing Seamless Networks in Subway Systems”, 2013
2. Eupen Technical Data Sheet, Radiating Cables, RMC 78 (RMC 78-HLFR), 2012, http://www.eupen.com/weimages/rf/radiating/data_sheet/01_cable/rmc/RMC-78___Rev09_2012-10-09.pdf
3. B. De Backer, H. Borjeson, F. Olyslager, and D. De Zutter: “The Study of Wave-Propagation through a Windowed Wall at 1.8 GHz”, IEEE 46th Vehicular Technology Conference on Mobile Technology for the Human Race, Volume 1, 1996
4. 3GPP TS 25.331 V3.5.0 (2000-12) “RRC Protocol Specification” (Release 1999), page 397, section 10.3.7.60
5. S. Sesia, I. Toufik, M. Baker: “LTE - The UMTS Long Term Evolution: From Theory to Practice”, first edition, Wiley and Sons, 2009, pages 131-132
6. Morten Tolstrup: “Indoor Radio Planning: A Practical Guide for GSM, DCS, UMTS, HSPA and LTE”, second edition, Wiley and Sons, 2011, page 394
7. “System Level Simulation of LTE Networks”, J.C. Ikuno, M. Wrulich, M. Rupp, IEEE 71st Vehicular Technology Conference (VTC 2010-Spring), 2010-May
8. “Methodology for calculation of spectrum requirements for the terrestrial component of International Mobile Telecommunications”, ITU-R M.1768-1, 2013-April
9. Maxim Integrated Application Note 4126, “Understanding the IP (Ingress Protection) Ratings of iButton Data Loggers and Capsule”, October, 2007, http://www.maximintegrated.com/en/app-notes/index.mvp/id/4126
About iBwave
iBwave develops solutions to help wireless operators, system integrators and equipment manufacturers, essentially anyone who has a stake in the network, bring strong, reliable voice and data wireless communications indoors, profitably. Our customers are trying to bring the full value of voice and data networks indoors, for revenue generation and a satisfied subscriber base. Our software and professional services are used by nearly 700 global leading telecom operators, system integrators and equipment manufacturers in 87 countries worldwide. We help customers realize the full value of wireless voice and data networks, increasing competitiveness by improving the user experience, reducing churn and generating revenue through data applications to maintain ARPU. Our in-building design solutions optimize capital expenditure and let the network live up to its full potential. Our team is made up of seasoned radiofrequency engineers, business visionaries and technology gurus, plus a host of service professionals to guide and support you. Our leaders are in-building wireless technology veterans, whose vision is what drives the company to remain at the cutting edge in the field.