Embed Size (px)
Citation preview

av.vc
The Case for Diversification into Venture Capital
WHITE PAPER REPORT • April 2020
Lacey Farrell Johnson Partner, Green D Ventures Alumni Ventures

av.vc
The Case for Adding Private Investments
Private investments can add diversity to your portfolio and lead to increased returns over the long run.
To generate higher returns and to hedge against mark-to-market volatility in the public markets, institutional investors turn to private investments to diversify their portfolios of stocks and bonds. Research conducted by Cambridge Associates, a leading investment advisory firm, has identified allocations to private investments as a major driver of long-term outperformance for institutional investors. More specifically, it found that institutions that allocated 15% or more of their port-folios to private investments saw a median annualized return of 7.6%, which was 1.5% higher than institutions that allocated less than 5% of capital to private invest-ments.1
When compounded over a 10-year period, this differ-ential can have a meaningful impact on the health of a financial institution.
Executive Summary
Since its founding in 2013, Alumni Ventures has been revolutionizing the venture capital industry. We believe that investing in VC can allow investors to diversify their investment portfolios by providing a different, potentially higher source of return by giving them access to the most entrepreneurial (and therefore high-growth) segments of the economy. Investing in VC has long been a practice of institutional investors and the ultra-rich. We think that accredited individuals should also consider adding this asset class in moderation in order to take advantage of its diversity and return characteristics.
2Alumni Ventures • The Case for Diversification into Venture Capital
1 http://www.cambridgeassociates.com/wp-content/up-loads/2016/07/The-15-Percent-Frontier.pdf
Research conducted by Cambridge Associates has identified allocations to private investments as a major driver of long-term outperformance for institutional investors.

av.vc
3
Why do private investments tend to outperform the public markets? One key reason many researchers point to for private investments’ performance advantage is the “ illiquidity premium.” The illiquidity premium refers to the addi-tional compensation investors demand for taking on the added risk of investing in assets that cannot be easily converted into cash for their fair market value. Or put more succinctly: It’s the benefit you receive for the added risk of not being able to get your money back on command. According to data compiled by Cambridge Associates, the average outperformance of global Private Equity relative to the MSCI All Country World Index (a general proxy for the global stock market) typi-cally hovers around 4.0%-5.0%.2
It’s important to note that this outperformance does not occur every year. In the past 30 years, there have been 10 years when private equity underperformed public equities, with an average underperformance of 8.2%. Yet even given those 10 years, private equity has still generated a positive return over the last 30 years.
A key fact to consider: Private equity tends to under-perform in strong markets and outperform in weaker markets. Using 2017 as an example: The MSCI All Country World Index was up +24.6% for the year, with global private equity returning just +20.1%.3 Historical performance shows that private equity can provide a balance to a portfolio of stocks and bonds.
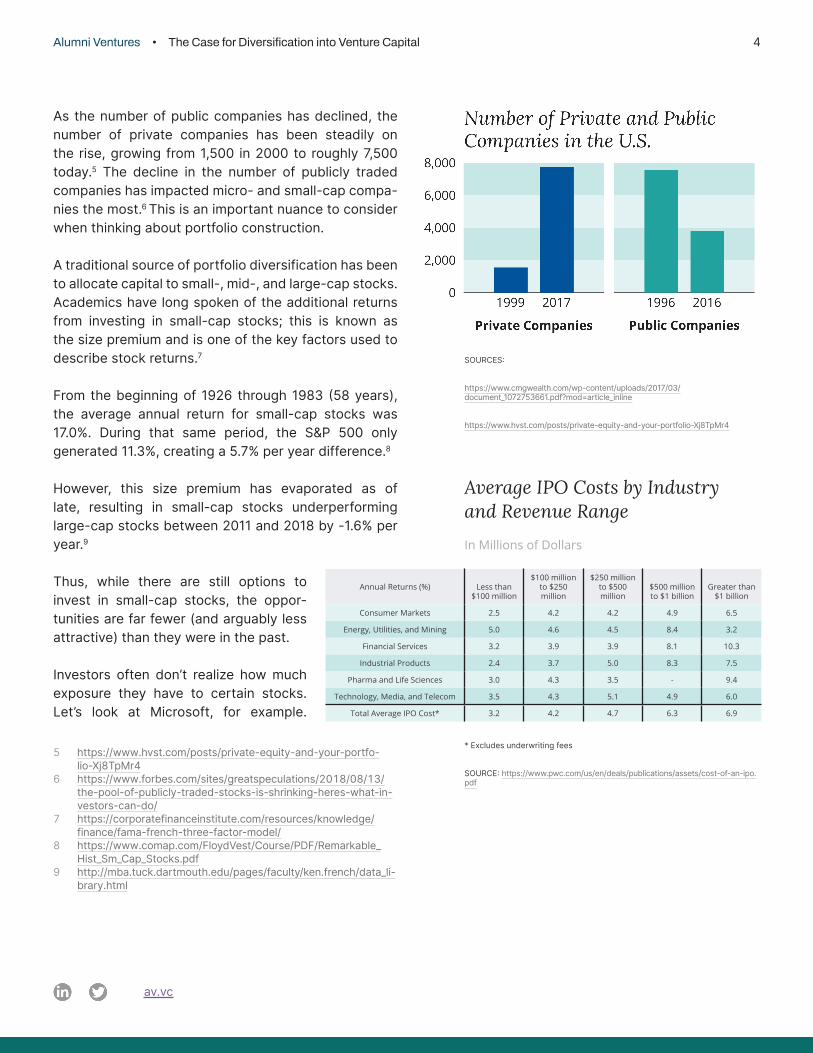
Public market equities are no longer as diverse as they once were. The number of companies listed on U.S. stock exchanges has declined by 50% from its peak of 7,322 companies in 1996 to roughly 3,700 companies in 2016, despite a dramatic increase in aggregate market capitalization.4
Alumni Ventures • The Case for Diversification into Venture Capital
2 https://www.kkr.com/global-perspectives/publications/rethink-ing-asset-allocation
3 https://www.kkr.com/global-perspectives/publications/rethink-ing-asset-allocation
4 https://www.wsj.com/articles/where-have-all-the-public-com-panies-gone-1510869125
Annual Returns (%)
Global Private Equity
MSCI AC World TR Gross USD
Global PE — MSCI ACWI Gross USD
1988 10.8 24.0 (13.2)
1989 9.0 17.6 (8.6)
1991 8.7 19.9 (11.2)
1993 24.2 24.9 (0.7)
1998 15.2 22.0 (6.8)
2003 23.9 34.6 (10.7)
2009 16.8 35.4 (18.6)
2012 13.4 16.8 (3.4)
2013 19.0 23.4 (4.5)
2017 20.1 24.6 (4.5)
Avg. 16.1 24.3 (8.2)
Data as of 4Q2017. MSCI ACWI = MSCI All Country World Index. SOURCE: Data Cambridge Associates, MSCI, Bloomberg. Compiled at https://www.kkr.com/global-perspectives/publications/rethinking-asset-allocation
Periods of Private Equity Underperformance Are Usually Periods of Overall Strong Public Equity Market Performance
SOURCES: Endowment and foundation data as reported to Cambridge Associates LLC.NOTE: Each institution’s private investment allocation is as of 6/30/15.
av.vc
As the number of public companies has declined, the number of private companies has been steadily on the rise, growing from 1,500 in 2000 to roughly 7,500 today.5 The decline in the number of publicly traded companies has impacted micro- and small-cap compa-nies the most.6 This is an important nuance to consider when thinking about portfolio construction.
A traditional source of portfolio diversification has been to allocate capital to small-, mid-, and large-cap stocks. Academics have long spoken of the additional returns from investing in small-cap stocks; this is known as the size premium and is one of the key factors used to describe stock returns.7
From the beginning of 1926 through 1983 (58 years), the average annual return for small-cap stocks was 17.0%. During that same period, the S&P 500 only generated 11.3%, creating a 5.7% per year difference.8
However, this size premium has evaporated as of late, resulting in small-cap stocks underperforming large-cap stocks between 2011 and 2018 by -1.6% per year.9
Thus, while there are still options to invest in small-cap stocks, the oppor-tunities are far fewer (and arguably less attractive) than they were in the past.
Investors often don’t realize how much exposure they have to certain stocks. Let’s look at Microsoft, for example.
Alumni Ventures • The Case for Diversification into Venture Capital 4
Annual Returns (%) Less than $100 million
$100 million to $250 million
$250 million to $500 million
$500 million to $1 billion
Greater than $1 billion
Consumer Markets 2.5 4.2 4.2 4.9 6.5
Energy, Utilities, and Mining 5.0 4.6 4.5 8.4 3.2
Financial Services 3.2 3.9 3.9 8.1 10.3
Industrial Products 2.4 3.7 5.0 8.3 7.5
Pharma and Life Sciences 3.0 4.3 3.5 - 9.4
Technology, Media, and Telecom 3.5 4.3 5.1 4.9 6.0
Total Average IPO Cost* 3.2 4.2 4.7 6.3 6.9
Average IPO Costs by Industry and Revenue Range
In Millions of Dollars
* Excludes underwriting fees
SOURCE: https://www.pwc.com/us/en/deals/publications/assets/cost-of-an-ipo.pdf
SOURCES:
https://www.cmgwealth.com/wp-content/uploads/2017/03/document_1072753661.pdf?mod=article_inline
https://www.hvst.com/posts/private-equity-and-your-portfolio-Xj8TpMr4
5 https://www.hvst.com/posts/private-equity-and-your-portfo-lio-Xj8TpMr4
6 https://www.forbes.com/sites/greatspeculations/2018/08/13/the-pool-of-publicly-traded-stocks-is-shrinking-heres-what-in-vestors-can-do/
7 https://corporatefinanceinstitute.com/resources/knowledge/finance/fama-french-three-factor-model/
8 https://www.comap.com/FloydVest/Course/PDF/Remarkable_Hist_Sm_Cap_Stocks.pdf
9 http://mba.tuck.dartmouth.edu/pages/faculty/ken.french/data_li-brary.html

av.vc
Microsoft currently makes up 4.3%10 of the S&P 500 and 2.1%11 of the MSCI All Country World Index. The stock also ranks in the top 15 holdings of 189 ETFs,12 giving many investors significant exposure to the company whether they realize it or not.
Private companies are staying private for longer, and public market investors are being shut out of meaningful value creation.While public companies today are older, bigger, and fewer, promising startups are staying private for longer. Traditionally, up-and-coming young companies turned to the public markets to raise capital in order to expand their operations. This gave individual investors a shot at owning a piece of these companies’ hoped-for success, either by buying their stocks directly or — more commonly — by holding them in a mutual fund or index fund.
Things are different today as more and more startup companies secure funding from private investors, cutting most Americans out of the equation. For context, the average number of annual IPOs between 1993 and 2000 was 451, compared to an average of just 108 per year between 2000 and 2016.13
Explaining the Increase in Privately Held Companies
There are a few key reasons driving the increase in privately held companies.
1. High cost of going public. The 2002 passage of the Sarbanes-Oxley Act brought much-needed oversight to the financial markets by helping to protect investors from the fraudulent reporting by corporations. However, it also greatly increased the compliance costs associated with being a publicly traded company. According to PwC’s “Costs of an IPO” report, two-thirds of public company CFOs surveyed estimated spending $1-1.9 million annually on the costs of being public. In addition, PwC’s
Alumni Ventures • The Case for Diversification into Venture Capital 5
87%of executives and directors feel most pressured to demonstrate strong financial performance within 2 years or less
65%of executives and directors say short-term pressure has in-creased over the past five years
55%of executives and directors at companies without a strong long-term culture say their company would delay a new project to hit quarterly targets even if it sacrificed some value
SOURCE: https://www.mckinsey.com/~/media/mckinsey/featured%20insights/long%20term%20capitalism/where%20companies%20with%20a%20long%20term%20view%20outperform%20their%20peers/mgi-measuring-the-economic-impact-of-short-termism.ashx
report revealed that the average cost of an IPO for a company generating between $100 million and $250 million in revenue is $4.2 million. No wonder compa-nies, especially those investing heavily in growth, elect to forgo the expenses of public offering and on-going compliance fees to instead raise money in the private markets at limited additional cost!
2. Short-termism of the public markets. A successful IPO is dependent on a company’s ability to attract investors that understand its business model and see value in its trajectory over the long term. Yet many publicly traded companies feel the pressure
10 https://www.slickcharts.com/sp50011 https://www.msci.com/documents/10199/8d97d244-4685-
4200-a24c-3e2942e3adeb12 https://etfdb.com/stock/MSFT/13 https://openviewpartners.com/blog/why-are-we-seeing-
fewer-venture-capital-backed-ipos/#.XPawqNNKjBI

av.vc
Alumni Ventures • The Case for Diversification into Venture Capital 6
to optimize their businesses to meet quar-terly earnings, making it challenging to focus on longer-term, strategic plans that might take time to materialize. A study conducted by McKinsey of 615 large- and mid-cap U.S. publicly listed compa-nies between 2001 and 2015 found that 87% of this group felt pressure to demonstrate strong financial performance within two years or less.14 For a high-growth startup still figuring out many aspects of its underlying business model (often through trial and error), the scrutiny of the public markets can be too much to bear.
3. Availability of private capital. Private assets under management totaled less than $1 trillion in 2000; they surpassed $5 trillion in 2017.15 In this climate, many companies no longer need an IPO to raise capital. Since 2010, companies have been going public more than nine years after founding, compared to around five years in the mid- to late-1990s.16
Conclusion: The Case for Adding Venture Capital
As startup companies stay private longer, investors with a portfolio of just publicly traded stocks are largely shut out of much of the value creation. This wasn’t always the case. Amazon was founded in 1994 and quickly went public three years later in 1997 at a $380 million valuation. On a simplistic level, a position purchased at the IPO and still held today would have generated a 2,500x+ return.
More recently, individual investors are being cut out of participating in this growth trajectory. Facebook, for example, went public in 2012, eight years after its founding in 2004, at a $81 billion valuation. The company currently has a market cap of approximately $575 billion, giving investors at the IPO a 7x return on their investment if still held today. This return pales in comparison, however, to the Series A investors who invested in Facebook in 2005 at a $100 million valua-tion. At time of IPO, these investors had an 800x return, not accounting for dilution.
In closing, we all acknowledge that venture capital is not without its risks. For every Google and Facebook success story, there are thousands of companies that don’t succeed. In fact, two-thirds of all startups stall at some point in the VC process and fail to exit or raise follow-on funding.17 But, given changes in the market dynamics, adding exposure to venture-backed private companies is something to consider to augment and diversify a traditional portfolio of stocks and bonds.
14 https://www.mckinsey.com/~/media/mckinsey/featured%20insights/long%20term%20capitalism/where%20companies%20with%20a%20long%20term%20view%20outperform%20their%20peers/mgi-measuring-the-economic-impact-of-short-termism.ashx
15 https://www.theatlantic.com/magazine/archive/2018/11/pri-vate-inequity/570808/
16 https://pitchbook.com/news/articles/private-vs-public-market-investors-whos-reaping-the-gains-from-the-rise-of-unicorns
17 https://www.cbinsights.com/research/venture-capital-funnel-2/

av.vc
Alumni Ventures • The Case for Diversification into Venture Capital 7
About the Author
Lacey Farrell JohnsonInvesting Partner at The Yard Ventures
Lacey is an Investing Partner with The Yard Ventures and was previously a Partner at Green D Ventures. She joined AV from CareGroup Investment Office, a $3B manager of combined endowment and pension assets. As a member of the investment team, Lacey was responsible for investment sourcing and due diligence. Lacey managed investment opportunities across asset classes and strategies, including venture capital, growth equity, buyout, private credit, and hedge fund vehicles. Previously, she was an Associate at J.P. Morgan Asset Management and an Analyst in the Securities Division of Goldman Sachs. Lacey has a BA in History from Middlebury College and an MBA from Tuck.
Important Disclosure Information
The manager of the AV Funds is Alumni Ventures (AV), a venture capital firm. AV and the funds are not affiliated with or endorsed by any college or university. These materials are provided for informational purposes only. Offers of securities are made only to accredited investors pursuant to each fund’s offering documents, which describe among other things the risks and fees associated with the Fund that should be considered before investing. The funds are long-term investments that involve a substantial risk of loss, including the loss of all capital invested. Past performance is not indicative of future results. Opportunities to invest in any security (of a Fund, of AV or in a syndication offering) is not a guarantee that you will be able to invest and are subject to all terms of the specific offering.
All private placements of securities and other broker dealer activities are currently offered through a partnership with Independent Brokerage Solutions LLC MEMBER: FINRA / SIPC (“IndieBrokers”), which is located at 485 Madison Avenue 15th Floor New York, NY 10022. (212) 751-4424. AV and its affiliates are independent and unaffiliated with IndieBrokers. Any securities transactions or related activities offered by AV associated persons are conducted in their capacities as registered representatives of IndieBrokers. To check the background of IndieBrokers and its representatives, visit FINRA’s BrokerCheck, where you can also find our Form CRS.
AV offers smart, simple venture investing to accredited investors. Specifically, AV provides a path for individuals to own an actively managed diversified venture portfolio with a single investment co-investing alongside experienced VC firms. Traditionally, with limited invest-ment capital and contacts, individual investors have had limited access to desirable deals alongside experienced VC firms, and even if they could access one or more such deals, it would take an inordinate amount of time, money and negotiation to build a diversified port-folio. With AV Funds, investors can choose from a number of funds to make a single invest-ment to gain exposure to a diversified portfolio of investments selected by an experienced manager. AV Funds’ simple fee mechanism permits investors to avoid constant capital calls throughout the life of the fund as found in other private investment vehicles.
Cambridge Associates data is compiled and reported by Cambridge Associates based on self-reporting from institutional investors, VC firms, and other financial services firms. As that data is self-reported, it will likely be subject to reporting bias, including self-selection or other biases.
Contact us at [email protected] with questions or requests for additional information.
F04-X0080-211215.01
av.vc