Embed Size (px)
Citation preview
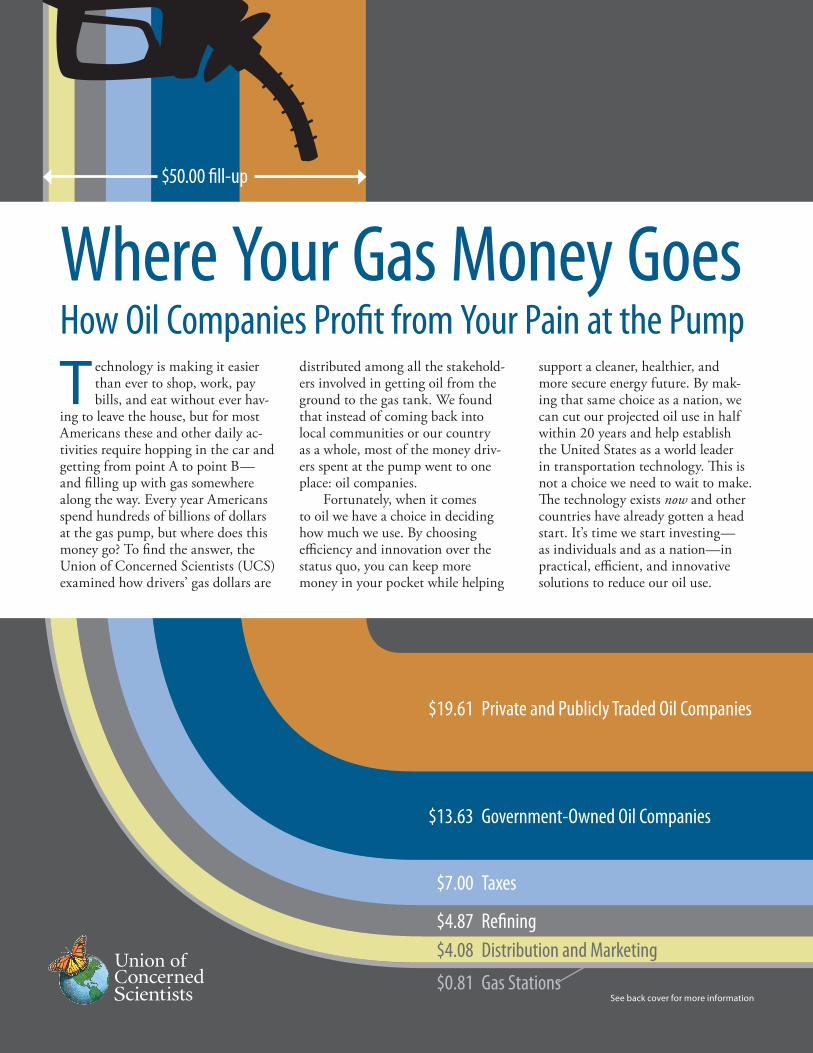
$19.61 Private and Publicly Traded Oil Companies
$13.63 Government-Owned Oil Companies
$7.00 Taxes
$4.87 Refining $4.08 Distribution and Marketing
$0.81 Gas StationsSee back cover for more information
$50.00 fill-up
Where Your Gas Money Goes How Oil Companies Profit from Your Pain at the Pump
T echnology is making it easier than ever to shop, work, pay bills, and eat without ever hav-
ing to leave the house, but for most Americans these and other daily ac-tivities require hopping in the car and getting from point A to point B—and filling up with gas somewhere along the way. Every year Americans spend hundreds of billions of dollars at the gas pump, but where does this money go? To find the answer, the Union of Concerned Scientists (UCS) examined how drivers’ gas dollars are
distributed among all the stakehold-ers involved in getting oil from the ground to the gas tank. We found that instead of coming back into local communities or our country as a whole, most of the money driv-ers spent at the pump went to one place: oil companies.
Fortunately, when it comes to oil we have a choice in deciding how much we use. By choosing efficiency and innovation over the status quo, you can keep more money in your pocket while helping
support a cleaner, healthier, and more secure energy future. By mak-ing that same choice as a nation, we can cut our projected oil use in half within 20 years and help establish the United States as a world leader in transportation technology. This is not a choice we need to wait to make. The technology exists now and other countries have already gotten a head start. It’s time we start investing— as individuals and as a nation—in practical, efficient, and innovative solutions to reduce our oil use.
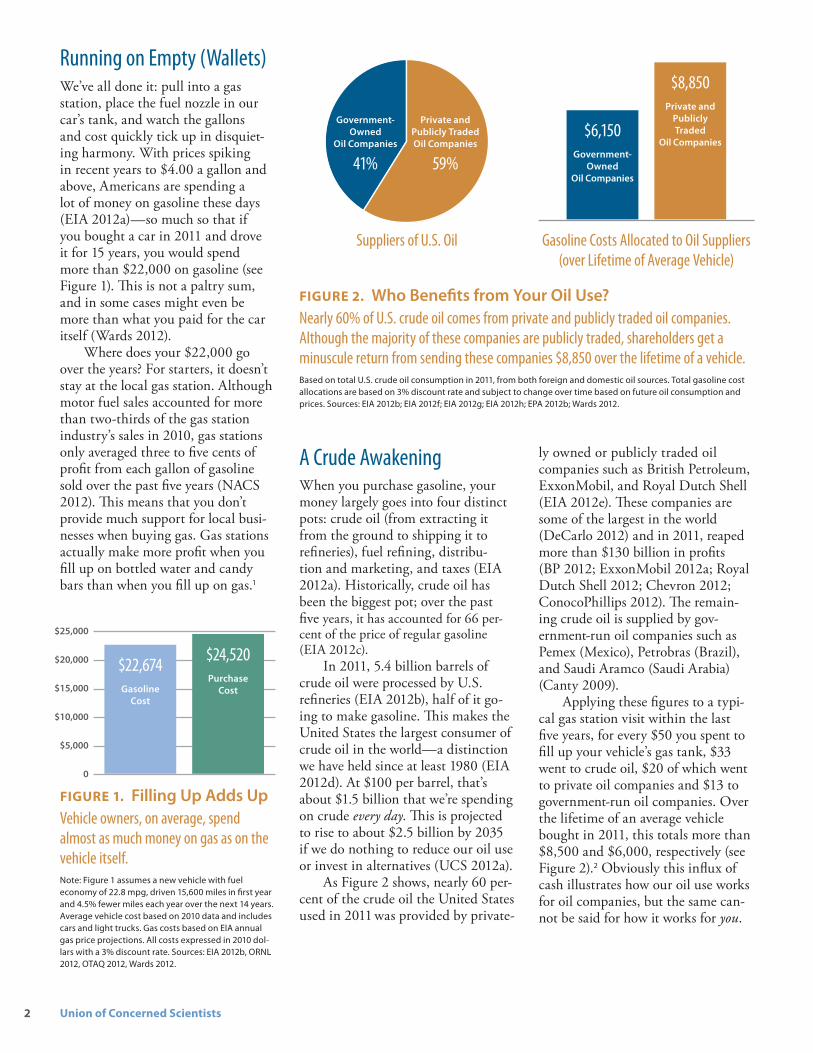
Running on Empty (Wallets)We’ve all done it: pull into a gas station, place the fuel nozzle in our car’s tank, and watch the gallons and cost quickly tick up in disquiet-ing harmony. With prices spiking in recent years to $4.00 a gallon and above, Americans are spending a lot of money on gasoline these days (EIA 2012a)—so much so that if you bought a car in 2011 and drove it for 15 years, you would spend more than $22,000 on gasoline (see Figure 1). This is not a paltry sum, and in some cases might even be more than what you paid for the car itself (Wards 2012).
Where does your $22,000 go over the years? For starters, it doesn’t stay at the local gas station. Although motor fuel sales accounted for more than two-thirds of the gas station industry’s sales in 2010, gas stations only averaged three to five cents of profit from each gallon of gasoline sold over the past five years (NACS 2012). This means that you don’t provide much support for local busi-nesses when buying gas. Gas stations actually make more profit when you fill up on bottled water and candy bars than when you fill up on gas.1
A Crude AwakeningWhen you purchase gasoline, your money largely goes into four distinct pots: crude oil (from extracting it from the ground to shipping it to refineries), fuel refining, distribu-tion and marketing, and taxes (EIA 2012a). Historically, crude oil has been the biggest pot; over the past five years, it has accounted for 66 per-cent of the price of regular gasoline (EIA 2012c).
In 2011, 5.4 billion barrels of crude oil were processed by U.S. refineries (EIA 2012b), half of it go-ing to make gasoline. This makes the United States the largest consumer of crude oil in the world—a distinction we have held since at least 1980 (EIA 2012d). At $100 per barrel, that’s about $1.5 billion that we’re spending on crude every day. This is projected to rise to about $2.5 billion by 2035 if we do nothing to reduce our oil use or invest in alternatives (UCS 2012a).
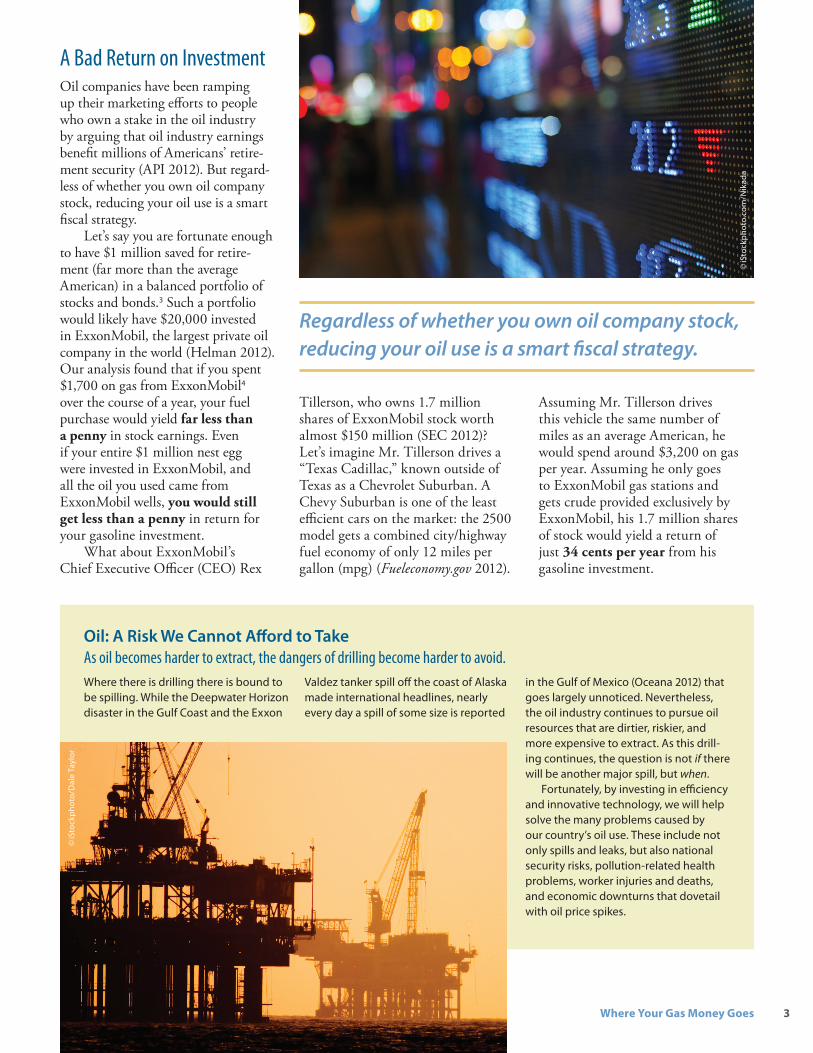
As Figure 2 shows, nearly 60 per-cent of the crude oil the United States used in 2011 was provided by pri vate-
ly owned or publicly traded oil companies such as British Petroleum, ExxonMobil, and Royal Dutch Shell (EIA 2012e). These companies are some of the largest in the world (DeCarlo 2012) and in 2011, reaped more than $130 billion in profits (BP 2012; ExxonMobil 2012a; Royal Dutch Shell 2012; Chevron 2012; ConocoPhillips 2012). The remain-ing crude oil is supplied by gov-ernment-run oil companies such as Pemex (Mexico), Petrobras (Brazil), and Saudi Aramco (Saudi Arabia) (Canty 2009).
Applying these figures to a typi-cal gas station visit within the last five years, for every $50 you spent to fill up your vehicle’s gas tank, $33 went to crude oil, $20 of which went to private oil companies and $13 to government-run oil companies. Over the lifetime of an average vehicle bought in 2011, this totals more than $8,500 and $6,000, respectively (see Figure 2).2 Obviously this influx of cash illustrates how our oil use works for oil companies, but the same can-not be said for how it works for you.
FIGURE 1. Filling Up Adds UpVehicle owners, on average, spend almost as much money on gas as on the vehicle itself.Note: Figure 1 assumes a new vehicle with fuel economy of 22.8 mpg, driven 15,600 miles in first year and 4.5% fewer miles each year over the next 14 years. Average vehicle cost based on 2010 data and includes cars and light trucks. Gas costs based on EIA annual gas price projections. All costs expressed in 2010 dol-lars with a 3% discount rate. Sources: EIA 2012b, ORNL 2012, OTAQ 2012, Wards 2012.
$24,520Purchase
Cost
$22,674Gasoline
Cost
$25,000
$20,000
$15,000
$10,000
$5,000
0
Suppliers of U.S. Oil Gasoline Costs Allocated to Oil Suppliers (over Lifetime of Average Vehicle)
Private and Publicly Traded Oil Companies
59%
Government- Owned
Oil Companies
41%
FIGURE 2. Who Benefits from Your Oil Use?Nearly 60% of U.S. crude oil comes from private and publicly traded oil companies. Although the majority of these companies are publicly traded, shareholders get a minuscule return from sending these companies $8,850 over the lifetime of a vehicle. Based on total U.S. crude oil consumption in 2011, from both foreign and domestic oil sources. Total gasoline cost allocations are based on 3% discount rate and subject to change over time based on future oil consumption and prices. Sources: EIA 2012b; EIA 2012f; EIA 2012g; EIA 2012h; EPA 2012b; Wards 2012.
$8,850Private and
Publicly Traded
Oil Companies$6,150
Government- Owned
Oil Companies
2 Union of Concerned Scientists
A Bad Return on InvestmentOil companies have been ramping up their marketing efforts to people who own a stake in the oil industry by arguing that oil industry earnings benefit millions of Americans’ retire-ment security (API 2012). But regard-less of whether you own oil company stock, reducing your oil use is a smart fiscal strategy.
Let’s say you are fortunate enough to have $1 million saved for retire-ment (far more than the average American) in a balanced portfolio of stocks and bonds.3 Such a portfolio would likely have $20,000 invested in ExxonMobil, the largest private oil company in the world (Helman 2012). Our analysis found that if you spent $1,700 on gas from ExxonMobil4 over the course of a year, your fuel purchase would yield far less than a penny in stock earnings. Even if your entire $1 million nest egg were invested in ExxonMobil, and all the oil you used came from ExxonMobil wells, you would still get less than a penny in return for your gasoline investment.
What about ExxonMobil’s Chief Executive Officer (CEO) Rex
Tillerson, who owns 1.7 million shares of ExxonMobil stock worth almost $150 million (SEC 2012)? Let’s imagine Mr. Tillerson drives a “Texas Cadillac,” known outside of Texas as a Chevrolet Suburban. A Chevy Suburban is one of the least efficient cars on the market: the 2500 model gets a combined city/highway fuel economy of only 12 miles per gallon (mpg) (Fueleconomy.gov 2012).
Assuming Mr. Tillerson drives this vehicle the same number of miles as an average American, he would spend around $3,200 on gas per year. Assuming he only goes to ExxonMobil gas stations and gets crude provided exclusively by ExxonMobil, his 1.7 million shares of stock would yield a return of just 34 cents per year from his gasoline investment.
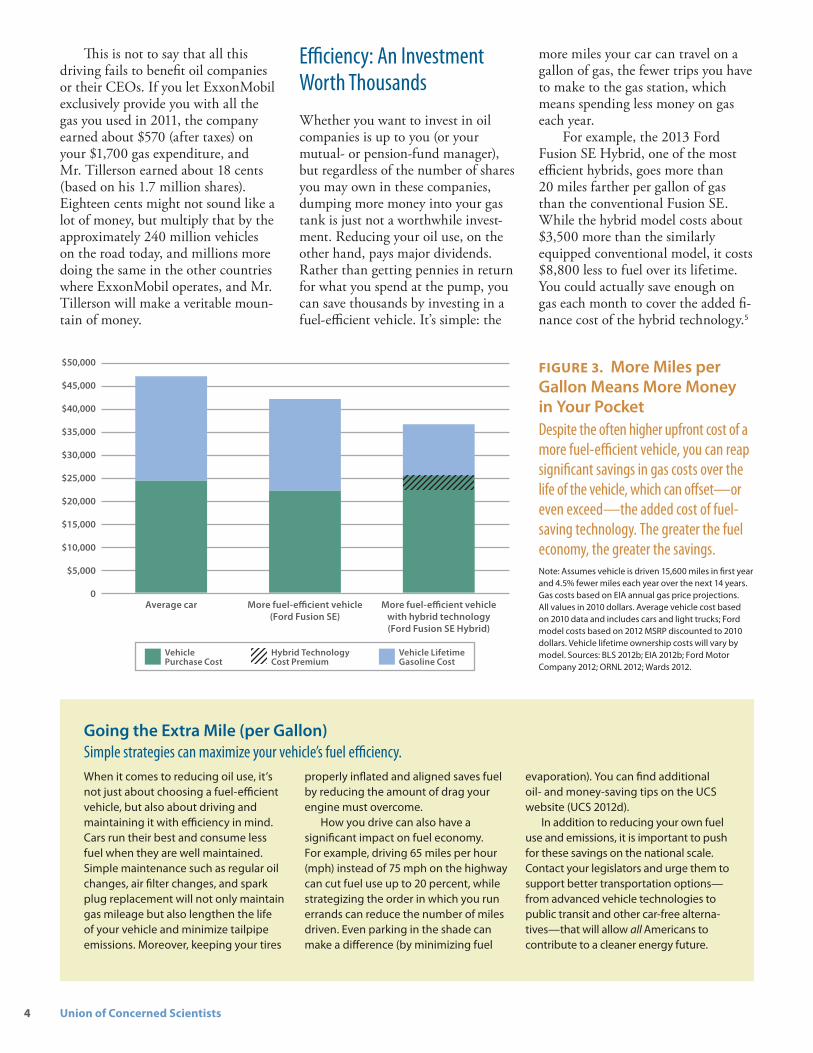
Oil: A Risk We Cannot Afford to TakeAs oil becomes harder to extract, the dangers of drilling become harder to avoid.Where there is drilling there is bound to be spilling. While the Deepwater Horizon disaster in the Gulf Coast and the Exxon
Valdez tanker spill off the coast of Alaska made international headlines, nearly every day a spill of some size is reported
in the Gulf of Mexico (Oceana 2012) that goes largely unnoticed. Nevertheless, the oil industry continues to pursue oil resources that are dirtier, riskier, and more expensive to extract. As this drill-ing continues, the question is not if there will be another major spill, but when.
Fortunately, by investing in efficiency and innovative technology, we will help solve the many problems caused by our country’s oil use. These include not only spills and leaks, but also national security risks, pollution-related health problems, worker injuries and deaths, and economic downturns that dovetail with oil price spikes.
Regardless of whether you own oil company stock, reducing your oil use is a smart fiscal strategy.
3Where Your Gas Money Goes
© iS
tock
phot
o.co
m/N
ikad
a
© iS
tock
phot
o/D
ale
Tayl
or
more miles your car can travel on a gallon of gas, the fewer trips you have to make to the gas station, which means spending less money on gas each year.
For example, the 2013 Ford Fusion SE Hybrid, one of the most efficient hybrids, goes more than 20 miles farther per gallon of gas than the conventional Fusion SE. While the hybrid model costs about $3,500 more than the similarly equipped conventional model, it costs $8,800 less to fuel over its lifetime. You could actually save enough on gas each month to cover the added fi-nance cost of the hybrid technology.5
This is not to say that all this driving fails to benefit oil companies or their CEOs. If you let ExxonMobil exclusively provide you with all the gas you used in 2011, the company earned about $570 (after taxes) on your $1,700 gas expenditure, and Mr. Tillerson earned about 18 cents (based on his 1.7 million shares). Eighteen cents might not sound like a lot of money, but multiply that by the approximately 240 million vehicles on the road today, and millions more doing the same in the other countries where ExxonMobil operates, and Mr. Tillerson will make a veritable moun-tain of money.
Going the Extra Mile (per Gallon)Simple strategies can maximize your vehicle’s fuel efficiency.When it comes to reducing oil use, it’s not just about choosing a fuel-efficient vehicle, but also about driving and maintaining it with efficiency in mind. Cars run their best and consume less fuel when they are well maintained. Simple maintenance such as regular oil changes, air filter changes, and spark plug replacement will not only maintain gas mileage but also lengthen the life of your vehicle and minimize tailpipe emissions. Moreover, keeping your tires
properly inflated and aligned saves fuel by reducing the amount of drag your engine must overcome.
How you drive can also have a significant impact on fuel economy. For example, driving 65 miles per hour (mph) instead of 75 mph on the highway can cut fuel use up to 20 percent, while strategizing the order in which you run errands can reduce the number of miles driven. Even parking in the shade can make a difference (by minimizing fuel
evaporation). You can find additional oil- and money-saving tips on the UCS website (UCS 2012d).
In addition to reducing your own fuel use and emissions, it is important to push for these savings on the national scale. Contact your legislators and urge them to support better transportation options—from advanced vehicle technologies to public transit and other car-free alterna-tives—that will allow all Americans to contribute to a cleaner energy future.
FIGURE 3. More Miles per Gallon Means More Money in Your PocketDespite the often higher upfront cost of a more fuel-efficient vehicle, you can reap significant savings in gas costs over the life of the vehicle, which can offset—or even exceed—the added cost of fuel-saving technology. The greater the fuel economy, the greater the savings.Note: Assumes vehicle is driven 15,600 miles in first year and 4.5% fewer miles each year over the next 14 years. Gas costs based on EIA annual gas price projections. All values in 2010 dollars. Average vehicle cost based on 2010 data and includes cars and light trucks; Ford model costs based on 2012 MSRP discounted to 2010 dollars. Vehicle lifetime ownership costs will vary by model. Sources: BLS 2012b; EIA 2012b; Ford Motor Company 2012; ORNL 2012; Wards 2012.
Efficiency: An Investment Worth ThousandsWhether you want to invest in oil companies is up to you (or your mutual- or pension-fund manager), but regardless of the number of shares you may own in these companies, dumping more money into your gas tank is just not a worthwhile invest-ment. Reducing your oil use, on the other hand, pays major dividends. Rather than getting pennies in return for what you spend at the pump, you can save thousands by investing in a fuel-efficient vehicle. It’s simple: the
$50,000
$45,000
$40,000
$35,000
$30,000
$25,000
$20,000
$15,000
$10,000
$5,000
0More fuel-efficient vehicle
(Ford Fusion SE)More fuel-efficient vehicle
with hybrid technology (Ford Fusion SE Hybrid)
Average car
4 Union of Concerned Scientists
Hybrid Technology Cost Premium
Vehicle Purchase Cost
Vehicle Lifetime Gasoline Cost
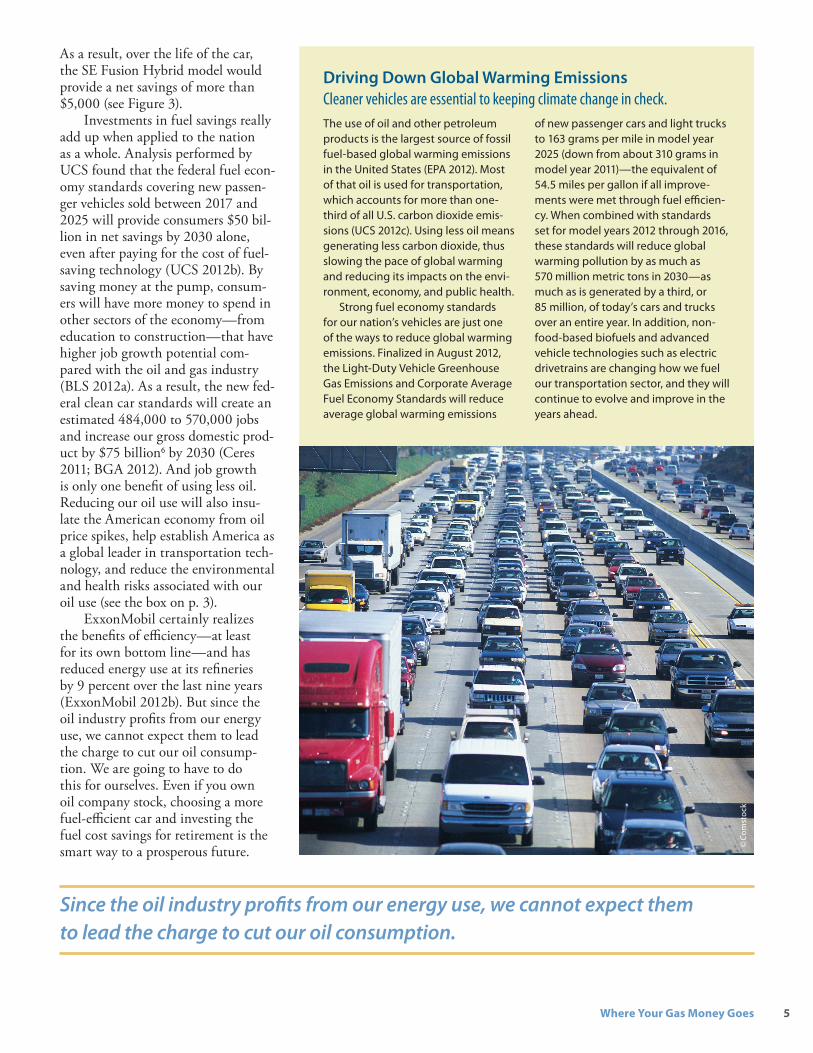
As a result, over the life of the car, the SE Fusion Hybrid model would provide a net savings of more than $5,000 (see Figure 3).
Investments in fuel savings really add up when applied to the nation as a whole. Analysis performed by UCS found that the federal fuel econ-omy standards covering new passen-ger vehicles sold between 2017 and 2025 will provide consumers $50 bil-lion in net savings by 2030 alone, even after paying for the cost of fuel-saving technology (UCS 2012b). By saving money at the pump, consum-ers will have more money to spend in other sectors of the economy—from education to construction—that have higher job growth potential com-pared with the oil and gas industry (BLS 2012a). As a result, the new fed-eral clean car standards will create an estimated 484,000 to 570,000 jobs and increase our gross domestic prod-uct by $75 billion6 by 2030 (Ceres 2011; BGA 2012). And job growth is only one benefit of using less oil. Reducing our oil use will also insu-late the American economy from oil price spikes, help establish America as a global leader in transportation tech-nology, and reduce the environmental and health risks associated with our oil use (see the box on p. 3).
ExxonMobil certainly realizes the benefits of efficiency—at least for its own bottom line—and has reduced energy use at its refineries by 9 percent over the last nine years (ExxonMobil 2012b). But since the oil industry profits from our energy use, we cannot expect them to lead the charge to cut our oil consump-tion. We are going to have to do this for ourselves. Even if you own oil company stock, choosing a more fuel-efficient car and investing the fuel cost savings for retirement is the smart way to a prosperous future.
Driving Down Global Warming EmissionsCleaner vehicles are essential to keeping climate change in check.The use of oil and other petroleum products is the largest source of fossil fuel-based global warming emissions in the United States (EPA 2012). Most of that oil is used for transportation, which accounts for more than one-third of all U.S. carbon dioxide emis-sions (UCS 2012c). Using less oil means generating less carbon dioxide, thus slowing the pace of global warming and reducing its impacts on the envi-ronment, economy, and public health.
Strong fuel economy standards for our nation’s vehicles are just one of the ways to reduce global warming emissions. Finalized in August 2012, the Light-Duty Vehicle Greenhouse Gas Emissions and Corporate Average Fuel Economy Standards will reduce average global warming emissions
of new passenger cars and light trucks to 163 grams per mile in model year 2025 (down from about 310 grams in model year 2011)—the equivalent of 54.5 miles per gallon if all improve-ments were met through fuel efficien-cy. When combined with standards set for model years 2012 through 2016, these standards will reduce global warming pollution by as much as 570 million metric tons in 2030—as much as is generated by a third, or 85 million, of today’s cars and trucks over an entire year. In addition, non-food-based biofuels and advanced vehicle technologies such as electric drivetrains are changing how we fuel our transportation sector, and they will continue to evolve and improve in the years ahead.
Since the oil industry profits from our energy use, we cannot expect them to lead the charge to cut our oil consumption.
5Where Your Gas Money Goes
© C
omst
ock
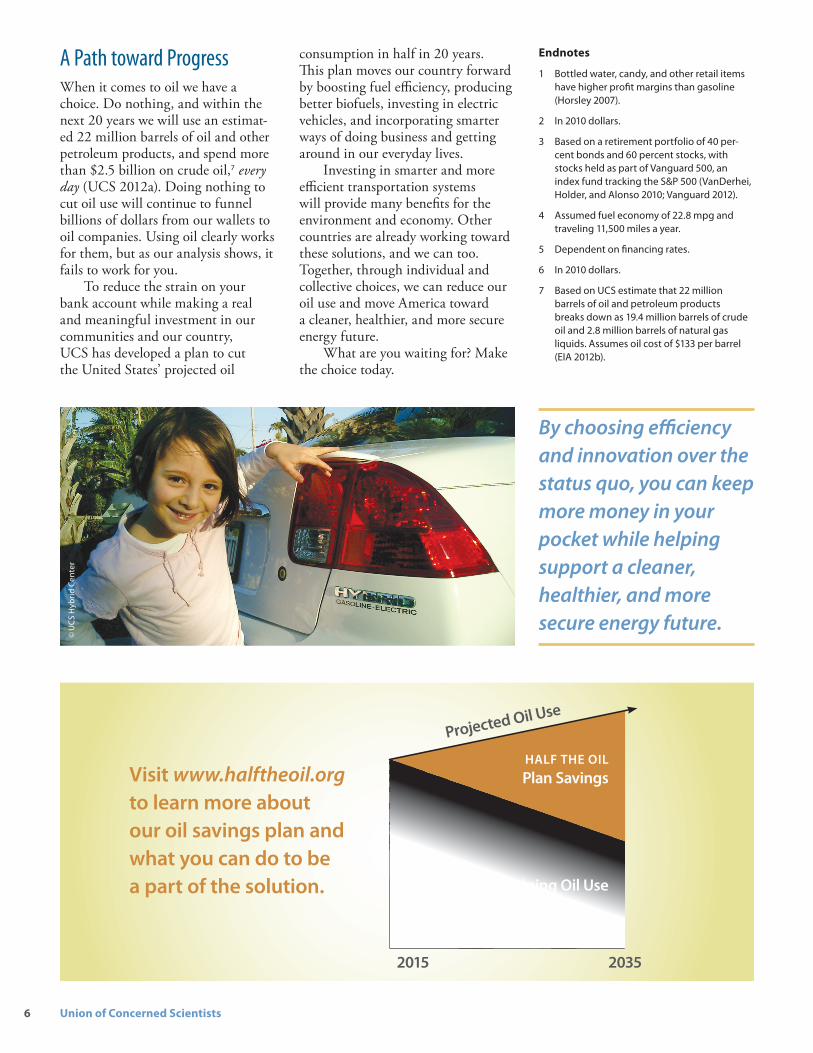
A Path toward ProgressWhen it comes to oil we have a choice. Do nothing, and within the next 20 years we will use an estimat-ed 22 million barrels of oil and other petroleum products, and spend more than $2.5 billion on crude oil,7 every day (UCS 2012a). Doing nothing to cut oil use will continue to funnel billions of dollars from our wallets to oil companies. Using oil clearly works for them, but as our analysis shows, it fails to work for you.
To reduce the strain on your bank account while making a real and meaningful investment in our communities and our country, UCS has developed a plan to cut the United States’ projected oil
consumption in half in 20 years. This plan moves our country forward by boosting fuel efficiency, producing better biofuels, investing in electric vehicles, and incorporating smarter ways of doing business and getting around in our everyday lives.
Investing in smarter and more efficient transportation systems will provide many benefits for the environment and economy. Other countries are already working toward these solutions, and we can too. Together, through individual and collective choices, we can reduce our oil use and move America toward a cleaner, healthier, and more secure energy future.
What are you waiting for? Make the choice today.
Endnotes
1 Bottled water, candy, and other retail items have higher profit margins than gasoline (Horsley 2007).
2 In 2010 dollars.
3 Based on a retirement portfolio of 40 per-cent bonds and 60 percent stocks, with stocks held as part of Vanguard 500, an index fund tracking the S&P 500 (VanDerhei, Holder, and Alonso 2010; Vanguard 2012).
4 Assumed fuel economy of 22.8 mpg and traveling 11,500 miles a year.
5 Dependent on financing rates.
6 In 2010 dollars.
7 Based on UCS estimate that 22 million barrels of oil and petroleum products breaks down as 19.4 million barrels of crude oil and 2.8 million barrels of natural gas liquids. Assumes oil cost of $133 per barrel (EIA 2012b).
By choosing efficiency and innovation over the status quo, you can keep more money in your pocket while helping support a cleaner, healthier, and more secure energy future.
Visit www.halftheoil.org to learn more about our oil savings plan and what you can do to be a part of the solution.
HALF THE OIL Plan Savings
2015 2035
Projected Oil Use
Remaining Oil Use
6 Union of Concerned Scientists
© U
CS H
ybrid
Cen
ter

ReferencesAmerican Petroleum Institute (API). 2012. Who owns big oil? Online at http://www.whoownsbigoil.org, accessed December 12, 2012.
BlueGreen Alliance (BGA). 2012. Gearing up: Smart standards create good jobs building cleaner cars. June. Online at http://www.bluegreenalliance.org/news/publications/document/AutoReport_Final.pdf, accessed November 8, 2012.
British Petroleum (BP). 2012. Summary review 2011. Online at http://www.bp.com/bodycopyarticle.do?categoryId=1&contentId= 7052055, accessed on November 9, 2012.
Bureau of Labor Statistics (BLS). 2012a. Employ-ment and output by industry. Washington, DC: Department of Labor. Online at http://www.bls.gov/emp/ep_table_207.htm, accessed November 8, 2012.
Bureau of Labor Statistics (BLS). 2012b. CPI Infla-tion Calculator. Washington, DC: Department of Labor. Online at http://www.bls.gov/data/inflation_calculator.htm, accessed December 10, 2012.
Bureau of Transportation Statistics (BTS). 2010. Number of U.S. aircraft, vehicles, vessels, and other conveyances. Table 1-11. Washington, DC: Department of Transportation, U.S. Research and Innovative Technology Administration. Online at http://www.bts.gov/publications/national_transportation_statistics/html/table_01_11.html, accessed November 8, 2012.
Canty, D. 2009. Top 10 national oil companies by production. May. Online at http://www.arabianoilandgas.com/article-5460-top-10- national-oil-companies-by-production, accessed November 8, 2012.
Ceres. 2011. Higher MPG = More Jobs and a Stronger US Economy. November. Online at http://www.ceres.org/files/report-fact-sheets/more-jobs-fact-sheets/national-fact-sheet, accessed November 8, 2012.
Chevron. 2012. 2011 annual report. Online at http://www.chevron.com/annualreport/2011/documents/pdf/Chevron2011AnnualReport.pdf, accessed November 8, 2012.
ConocoPhillips. 2012. Growing value: 2011 summary annual report. Online at http://www.conocophillips.com/EN/about/company_reports/annual_report/Documents/ConocoPhillips%202011%20Summary%20Annual%20Report.pdf, accessed October 16, 2012.
DeCarlo, S. 2012. The world’s biggest public com-panies. Forbes, April 18. Online at http://www.forbes.com/global2000, accessed November 9, 2012.
Energy Information Administration (EIA). 2012a. Gasoline and diesel fuel update. Online at http://www.eia.gov/petroleum/gasdiesel, accessed Octo-ber 18, 2012.
Energy Information Administration (EIA). 2012b. Annual energy outlook 2012. Online at http://www.eia.gov/forecasts/aeo/topic_prices_all.cfm, accessed November 13, 2012.
Energy Information Administration (EIA). 2012c. Gasoline and diesel fuel update: Gasoline com-ponents history. Online at http://www.eia.gov/
petroleum/gasdiesel/gaspump_hist.cfm, accessed November 9, 2012.
Energy Information Administration (EIA). 2012d. Frequently asked questions. Online at http://www.eia.gov/ cfapps/ipdbproject/IEDIndex3.cfm?tid=5&pid=5&aid=2, accessed October 18, 2012.
Energy Information Administration (EIA). 2012e. Who are the major players supplying the world oil market? Online at http://www.eia.gov/energy_in_brief/world_oil_market.cfm, accessed October 18, 2012.
Energy Information Administration (EIA). 2012f. Petroleum & other liquids: Imports by area of entry. Online at http://www.eia.gov/dnav/pet/pet_move_imp_dc_NUS-Z00_mbbl_a.htm, accessed October 18, 2012.
Energy Information Administration (EIA). 2012g. Petroleum & other liquids: Product supplied. Online at http://www.eia.gov/dnav/pet/pet_cons_psup_dc_nus_mbbl_a.htm, accessed October 18, 2012.
Energy Information Administration (EIA). 2012h. Countries. Online at http://www.eia.gov/countries, accessed November 13, 2012.
Environmental Protection Agency (EPA). 2012. CO2 emissions from fossil fuel combustion by fuel type and sector. Table 3.5. In Inventory of U.S. greenhouse gas emissions and sinks: 1990–2010. Washington, DC. Online at http://www.epa.gov/climatechange/Downloads/ghgemissions/US-GHG-Inventory-2012-Chapter-3-Energy.pdf, accessed November 9, 2012.
ExxonMobil. 2012a. 2011 summary annual report. Online at http://thomson.mobular.net/thomson/7/3184/4612, accessed November 9, 2012.
ExxonMobil. 2012b. 2011 financial & operating review. Online at http://www.exxonmobil.com/Corporate/files/news_pub_fo_2011.pdf, accessed December 7, 2012.
Ford Motor Company. 2012. 2013 Fusion Hybrid. Online at http://www.ford.com/cars/fusion/trim/hybrid, accessed November 13, 2012.
Fueleconomy.gov. 2012. Fuel economy of 2013 Chevrolet Suburban. Washington, DC: Depart-ment of Energy and Environmental Protection Agency. Online at http://www.fueleconomy.gov/feg/bymodel/2013_Chevrolet_Suburban.shtml, accessed October 18, 2012.
Helman, C. 2012. The world’s biggest oil com-panies. Forbes, July 16. Online at http://www.forbes.com/sites/christopherhelman/2012/07/16/the-worlds-25-biggest-oil-companies, accessed November 9, 2012.
Horsley, S. 2007. Gas stations profit from more than just gas. National Public Radio, June 5. Online at http://www.npr.org/templates/story/story.php?storyId=10733468, accessed November 26, 2012.
National Association of Convenience Stores (NACS). 2012. Motor fuel sales. Fact sheet, February. Online at http://www.nacsonline.com/NACS/News/FactSheets/Motor%20Fuels/Pages/MotorFuelSales.aspx, accessed October 18, 2012.
Oak Ridge National Laboratory (ORNL). 2012. Transportation energy data book: Edition 31.
Washington, DC: Department of Energy. Online at http://cta.ornl.gov/data/index.shtml, accessed December 4, 2012.
Oceana. 2012. Real time oil spill map. Online at http://oceana.org/en/our-work/climate-energy/offshore-drilling/stop-the-drill/real-time-oil-spill-map, accessed October 18, 2012.
Office of Transportation and Air Quality (OTAQ). 2012. Light-duty automotive technology, carbon dioxide emissions, and fuel economy trends: 1975 through 2011. Washington, DC: Environmental Protection Agency. Online at http://www.epa.gov/otaq/cert/mpg/fetrends/2012/420r12001a.pdf, accessed November 13, 2012.
Royal Dutch Shell. 2012. Shell annual review 2011. Online at http://reports.shell.com/annual-review/2011/servicepages/downloads/files/entire_shell_review_11.pdf, accessed November 9, 2012.
Securities and Exchange Commission (SEC). 2012. Insider trading information—ExxonMobil Corpo-ration. Online at http://www.nasdaq.com/symbol/xom/insider-trades#ixzz29Zn22Q2D, accessed October 16, 2012.
Tillerson, R. 2012. “The new North American energy paradigm: Reshaping the future.” Speech given at Council on Foreign Relations meeting, June 27. Online at http://www.cfr.org/united states/new-north-american-energy-paradigm-reshaping-future/p28630, accessed October 18, 2012.
Union of Concerned Scientists (UCS). 2012a. Half the oil: A realistic plan to cut the United States’ projected oil use in half in 20 years. Online at http://www.ucsusa.org/clean_vehicles/smart-trans-portation-solutions/vehicle-policy/current-policies-and-legislation/how-to-reduce-us-oil-use.html, accessed October 18, 2012.
Union of Concerned Scientists (UCS). 2012b. Clean car and truck standards (MY2017–2025). Fact sheet, August. Online at http://www.ucsusa.org/assets/documents/clean_vehicles/Clean-Car-and-Truck-Standards-Model-Years-2017-2025.pdf, accessed December 12, 2012.
Union of Concerned Scientists (UCS). 2012c. Car emissions and global warming. Online at http://www.ucsusa.org/clean_vehicles/why-clean-cars/global-warming, accessed October 18, 2012.
Union of Concerned Scientists (UCS). 2012d. How to maximize your vehicle’s fuel economy. Online at http://www.ucsusa.org/clean_vehicles/smart-transportation-solutions/better-fuel-efficiency/how-to-maximize-your.html, accessed October 18, 2012.
VanDerhei, J., S. Holder, and L. Alonso. 2010. 401(k) plan asset allocation, account balances, and loan activity in 2009. Issue Brief No. 350. Washington, DC: Employee Benefit Research Institute. Online at http://www.ebri.org/pdf/briefspdf/EBRI_IB_011-2010_No350_401k_Update-092.pdf, accessed October 18, 2012.
The Vanguard Group, Inc. (Vanguard). 2012. Van-guard 500 Index Fund annual report. December. Online at http://www.vanguard.com/funds/reports/q400.pdf, accessed October 17, 2012.
WardsAuto Group (Wards). 2012. U.S. average expenditure per new car, 1967–2011. Online at http://wardsauto.com/datasheet/us-average-expenditure-new-car-1967-2011, accessed Decem-ber 10, 2012.
7Where Your Gas Money Goes
National HeadquartersTwo Brattle SquareCambridge, MA 02138-3780Phone: (617) 547-5552Fax: (617) 864-9405
Washington, DC, Office1825 K St. NW, Ste. 800Washington, DC 20006-1232Phone: (202) 223-6133Fax: (202) 223-6162
West Coast Office2397 Shattuck Ave., Ste. 203 Berkeley, CA 94704-1567Phone: (510) 843-1872Fax: (510) 843-3785
Midwest Office One N. LaSalle St., Ste. 1904 Chicago, IL 60602-4064 Phone: (312) 578-1750 Fax: (312) 578-1751
Printed on recycled paper© January 2013 Union of Concerned Scientists
The Union of Concerned Scientists puts rigorous, independent science to work to solve our planet’s most pressing problems. Joining with citizens across the country, we combine technical analysis and effective advocacy to create innovative, practical solutions for a healthy, safe, and sustainable future.
For a fully referenced version of this report, as well as our methodology and assumptions, visit www.ucsusa.org/gasmoney.
Where Your Gas Money GoesHow Oil Companies Profit from Your Pain at the Pump
Front cover graphic: Distributions based on spending $50 on gasoline at a typical gas station. Totals for crude oil, taxes, refining, and distribution/marketing based on five-year average (2007–2012). Gas station total represents profit after taxes and other expenses related to motor fuels sales (which are included in the distribution/marketing total).
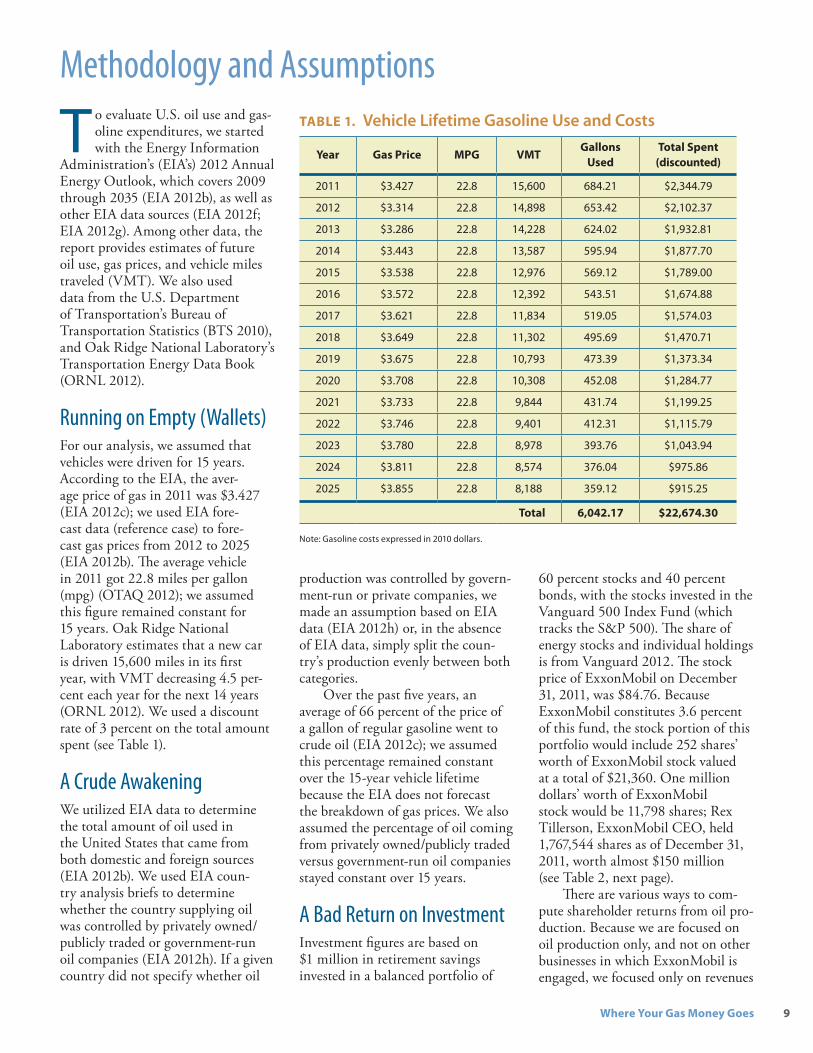
Methodology and AssumptionsTABLE 1. Vehicle Lifetime Gasoline Use and Costs
Year Gas Price MPG VMTGallons
UsedTotal Spent
(discounted)
2011 $3.427 22.8 15,600 684.21 $2,344.79
2012 $3.314 22.8 14,898 653.42 $2,102.37
2013 $3.286 22.8 14,228 624.02 $1,932.81
2014 $3.443 22.8 13,587 595.94 $1,877.70
2015 $3.538 22.8 12,976 569.12 $1,789.00
2016 $3.572 22.8 12,392 543.51 $1,674.88
2017 $3.621 22.8 11,834 519.05 $1,574.03
2018 $3.649 22.8 11,302 495.69 $1,470.71
2019 $3.675 22.8 10,793 473.39 $1,373.34
2020 $3.708 22.8 10,308 452.08 $1,284.77
2021 $3.733 22.8 9,844 431.74 $1,199.25
2022 $3.746 22.8 9,401 412.31 $1,115.79
2023 $3.780 22.8 8,978 393.76 $1,043.94
2024 $3.811 22.8 8,574 376.04 $975.86
2025 $3.855 22.8 8,188 359.12 $915.25
Total 6,042.17 $22,674.30
Note: Gasoline costs expressed in 2010 dollars.
T o evaluate U.S. oil use and gas-oline expenditures, we started with the Energy Information
Administration’s (EIA’s) 2012 Annual Energy Outlook, which covers 2009 through 2035 (EIA 2012b), as well as other EIA data sources (EIA 2012f; EIA 2012g). Among other data, the report provides estimates of future oil use, gas prices, and vehicle miles traveled (VMT). We also used data from the U.S. Department of Transportation’s Bureau of Transportation Statistics (BTS 2010), and Oak Ridge National Laboratory’s Transportation Energy Data Book (ORNL 2012).
Running on Empty (Wallets)For our analysis, we assumed that vehicles were driven for 15 years. According to the EIA, the aver-age price of gas in 2011 was $3.427 (EIA 2012c); we used EIA fore-cast data (reference case) to fore-cast gas prices from 2012 to 2025 (EIA 2012b). The average vehicle in 2011 got 22.8 miles per gallon (mpg) (OTAQ 2012); we assumed this figure remained constant for 15 years. Oak Ridge National Laboratory estimates that a new car is driven 15,600 miles in its first year, with VMT decreasing 4.5 per-cent each year for the next 14 years (ORNL 2012). We used a discount rate of 3 percent on the total amount spent (see Table 1).
A Crude AwakeningWe utilized EIA data to determine the total amount of oil used in the United States that came from both domestic and foreign sources (EIA 2012b). We used EIA coun-try analysis briefs to determine whether the country supplying oil was controlled by privately owned/publicly traded or government-run oil companies (EIA 2012h). If a given country did not specify whether oil
production was controlled by govern-ment-run or private companies, we made an assumption based on EIA data (EIA 2012h) or, in the absence of EIA data, simply split the coun-try’s production evenly between both categories.
Over the past five years, an average of 66 percent of the price of a gallon of regular gasoline went to crude oil (EIA 2012c); we assumed this percentage remained constant over the 15-year vehicle lifetime because the EIA does not forecast the breakdown of gas prices. We also assumed the percentage of oil coming from privately owned/publicly traded versus government-run oil companies stayed constant over 15 years.
A Bad Return on InvestmentInvestment figures are based on $1 million in retirement savings invested in a balanced portfolio of
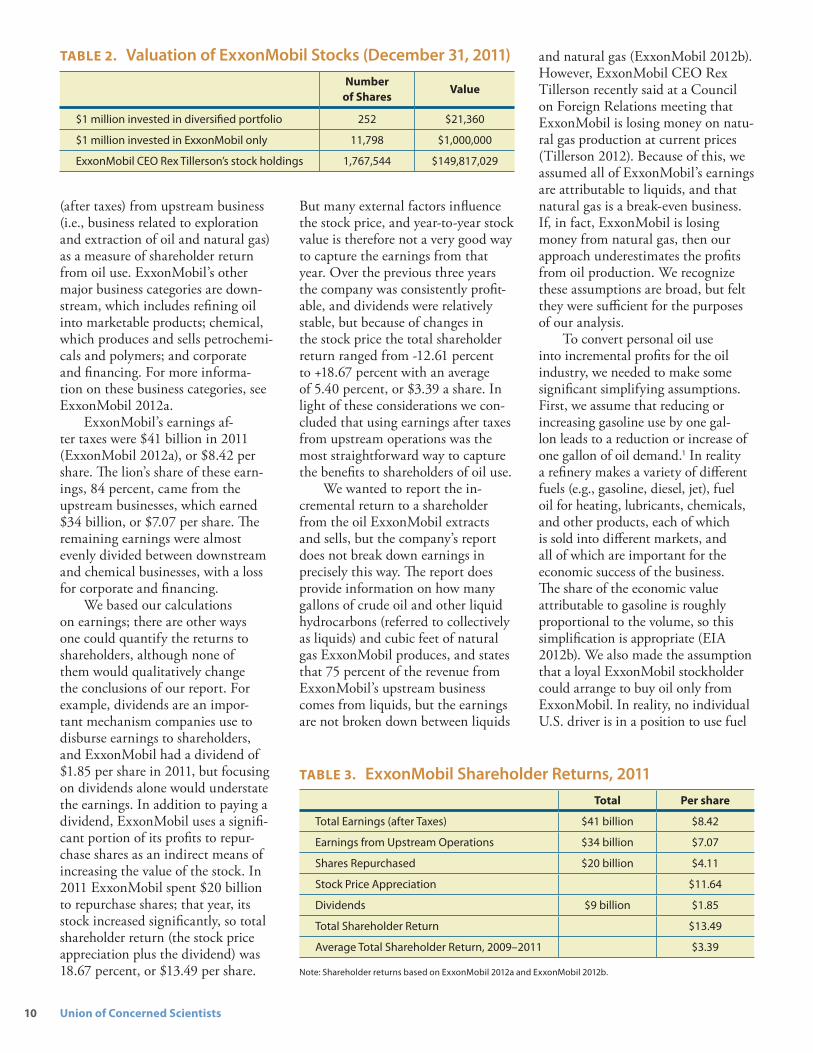
60 percent stocks and 40 percent bonds, with the stocks invested in the Vanguard 500 Index Fund (which tracks the S&P 500). The share of energy stocks and individual holdings is from Vanguard 2012. The stock price of ExxonMobil on December 31, 2011, was $84.76. Because ExxonMobil constitutes 3.6 percent of this fund, the stock portion of this portfolio would include 252 shares’ worth of ExxonMobil stock valued at a total of $21,360. One million dollars’ worth of ExxonMobil stock would be 11,798 shares; Rex Tillerson, ExxonMobil CEO, held 1,767,544 shares as of December 31, 2011, worth almost $150 million (see Table 2, next page).
There are various ways to com-pute shareholder returns from oil pro-duction. Because we are focused on oil production only, and not on other businesses in which ExxonMobil is engaged, we focused only on revenues
9Where Your Gas Money Goes
(after taxes) from upstream business (i.e., business related to exploration and extraction of oil and natural gas) as a measure of shareholder return from oil use. ExxonMobil’s other major business categories are down-stream, which includes refining oil into marketable products; chemical, which produces and sells petrochemi-cals and polymers; and corporate and financing. For more informa-tion on these business categories, see ExxonMobil 2012a.
ExxonMobil’s earnings af-ter taxes were $41 billion in 2011 (ExxonMobil 2012a), or $8.42 per share. The lion’s share of these earn-ings, 84 percent, came from the upstream businesses, which earned $34 billion, or $7.07 per share. The remaining earnings were almost evenly divided between downstream and chemical businesses, with a loss for corporate and financing.
We based our calculations on earnings; there are other ways one could quantify the returns to shareholders, although none of them would qualitatively change the conclusions of our report. For example, dividends are an impor-tant mechanism companies use to disburse earnings to shareholders, and ExxonMobil had a dividend of $1.85 per share in 2011, but focusing on dividends alone would understate the earnings. In addition to paying a dividend, ExxonMobil uses a signifi-cant portion of its profits to repur-chase shares as an indirect means of increasing the value of the stock. In 2011 ExxonMobil spent $20 billion to repurchase shares; that year, its stock increased significantly, so total shareholder return (the stock price appreciation plus the dividend) was 18.67 percent, or $13.49 per share.
But many external factors influence the stock price, and year-to-year stock value is therefore not a very good way to capture the earnings from that year. Over the previous three years the company was consistently profit-able, and dividends were relatively stable, but because of changes in the stock price the total shareholder return ranged from -12.61 percent to +18.67 percent with an average of 5.40 percent, or $3.39 a share. In light of these considerations we con-cluded that using earnings after taxes from upstream operations was the most straightforward way to capture the benefits to shareholders of oil use.
We wanted to report the in-cremental return to a shareholder from the oil ExxonMobil extracts and sells, but the company’s report does not break down earnings in precisely this way. The report does provide information on how many gallons of crude oil and other liquid hydrocarbons (referred to collectively as liquids) and cubic feet of natural gas ExxonMobil produces, and states that 75 percent of the revenue from ExxonMobil’s upstream business comes from liquids, but the earnings are not broken down between liquids
and natural gas (ExxonMobil 2012b). However, ExxonMobil CEO Rex Tillerson recently said at a Council on Foreign Relations meeting that ExxonMobil is losing money on natu-ral gas production at current prices (Tillerson 2012). Because of this, we assumed all of ExxonMobil’s earnings are attributable to liquids, and that natural gas is a break-even business. If, in fact, ExxonMobil is losing money from natural gas, then our approach underestimates the profits from oil production. We recognize these assumptions are broad, but felt they were sufficient for the purposes of our analysis.
To convert personal oil use into incremental profits for the oil industry, we needed to make some significant simplifying assumptions. First, we assume that reducing or increasing gasoline use by one gal-lon leads to a reduction or increase of one gallon of oil demand.1 In reality a refinery makes a variety of different fuels (e.g., gasoline, diesel, jet), fuel oil for heating, lubricants, chemicals, and other products, each of which is sold into different markets, and all of which are important for the economic success of the business. The share of the economic value attributable to gasoline is roughly proportional to the volume, so this simplification is appropriate (EIA 2012b). We also made the assumption that a loyal ExxonMobil stockholder could arrange to buy oil only from ExxonMobil. In reality, no individual U.S. driver is in a position to use fuel
TABLE 2. Valuation of ExxonMobil Stocks (December 31, 2011)Number
of SharesValue
$1 million invested in diversified portfolio 252 $21,360
$1 million invested in ExxonMobil only 11,798 $1,000,000
ExxonMobil CEO Rex Tillerson’s stock holdings 1,767,544 $149,817,029
TABLE 3. ExxonMobil Shareholder Returns, 2011Total Per share
Total Earnings (after Taxes) $41 billion $8.42
Earnings from Upstream Operations $34 billion $7.07
Shares Repurchased $20 billion $4.11
Stock Price Appreciation $11.64
Dividends $9 billion $1.85
Total Shareholder Return $13.49
Average Total Shareholder Return, 2009–2011 $3.39
Note: Shareholder returns based on ExxonMobil 2012a and ExxonMobil 2012b.
10 Union of Concerned Scientists
only from ExxonMobil wells. Even the oil being processed into gasoline at ExxonMobil refineries is a combi-nation of oil from ExxonMobil wells and oil from other sources. Earnings from our oil use are thus spread around among a variety of private and government-run oil companies, regardless of which gas stations drivers patronize. This means the real return on ExxonMobil stock attributable to drivers’ patronage of ExxonMobil gas stations is likely to be less than the estimates in our report.
With these assumptions, we were able to get a return to share-holders from oil use by dividing ExxonMobil’s total earnings from oil production by the quantity of total production and the number of shares of ExxonMobil stock. This gives us a return per gallon per share.
To get total returns from the oil use associated with a particular driver we multiplied the upstream earnings per gallon per share by the amount of fuel used and number of shares held by that driver. Share holdings for dif-ferent portfolios are described above, and calculations of vehicle fuel use
and cost were based on a current fleet average fuel economy of 22.8 mpg (for cars and light trucks combined), assuming that the average driver logs 11,500 miles per year (ORNL 2012) and the average gasoline price is $3.427.
Efficiency: An Investment Worth ThousandsTo compare the fuel costs of a conventional and hybrid vehicle, we chose the Ford Fusion SE and Ford Fusion SE Hybrid for two reasons. First, the Fusion SE is available in both conventional and hybrid versions; some hybrids (such as the Toyota Prius) do not have a con-ventional counterpart. Second, the Fusion SE Hybrid’s price premium includes only the cost of hybrid tech-nology and not additional features (such as heated seats) that are not standard in the conventional SE mod-el. According to Ford’s website, the 2013 Fusion SE costs $23,700 and the Fusion SE Hybrid costs $27,200 (Ford Motor Company 2012). We
converted both of these costs to 2010 dollars—$22,342 and $25,641, respectively—using the Bureau of Labor Statistics’ inflation calculator (BLS 2012b).
The SE Hybrid gets 47 mpg for both highway and city driving, and the conventional SE gets 22 mpg city and 34 mpg highway. UCS assumed 55 percent of driving was city and 45 percent was highway; applying these percentages to the conven-tional SE fuel economy numbers, we found the average efficiency to be 26.15 mpg, giving a fuel economy difference of 20.85 mpg. When calculating lifetime gas costs for each model, we used gas prices as forecast by the EIA, assumed 15,600 VMT for the first year, decreasing by 4.5 percent each year over the next 14 years, and applied a 3 percent discount rate to the total spent on gas each year.
Endnote
1 Since gasoline is about 10 percent less dense than oil, but gasoline production consumes 10 percent more oil to provide the needed refining energy, the ratio of oil demand to gasoline demand is roughly one to one. For example, nearly half of each gallon of oil is turned into gasoline, so two gallons of oil will yield one gallon of gasoline and one gallon of other products. If that one gallon of gasoline is no longer needed, oil use will go down by roughly one gallon, with the remaining one gallon being converted to other products. In reality, large-scale shifts in demand for gasoline have a more complex impact and will require refineries to shift their mix of outputs, potentially saving more or less oil depending on the efficiency of producing the other petroleum outputs.
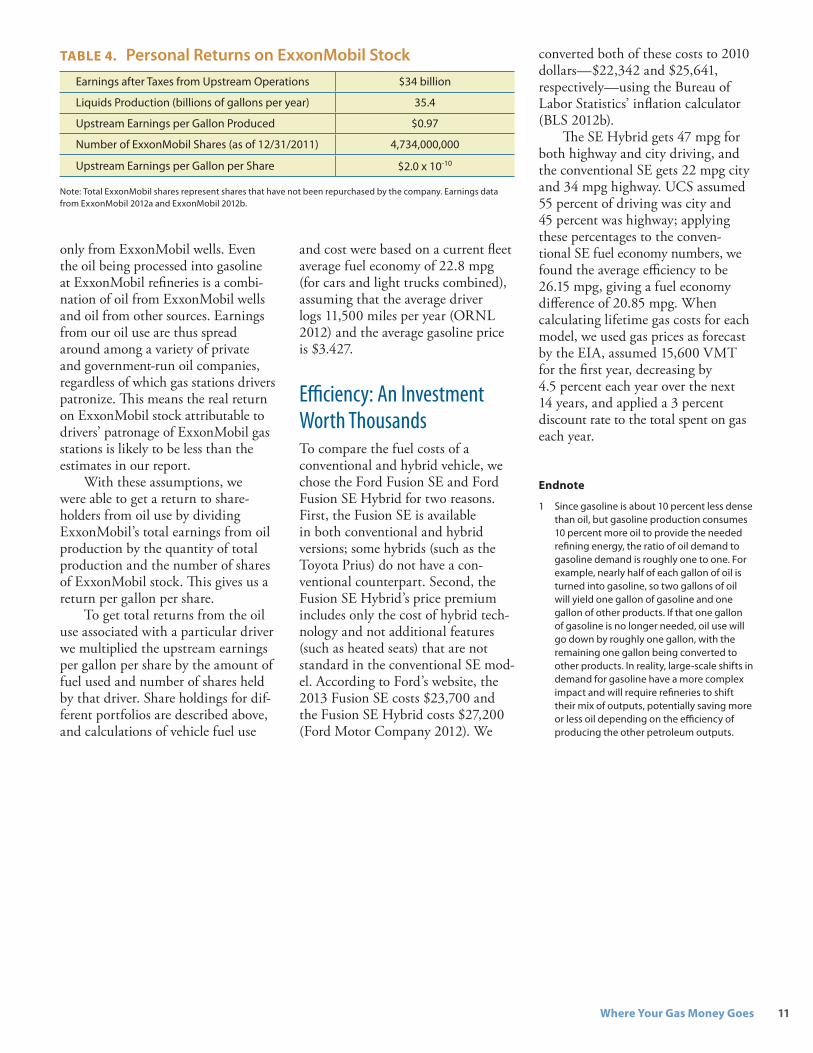
TABLE 4. Personal Returns on ExxonMobil StockEarnings after Taxes from Upstream Operations $34 billion
Liquids Production (billions of gallons per year) 35.4
Upstream Earnings per Gallon Produced $0.97
Number of ExxonMobil Shares (as of 12/31/2011) 4,734,000,000
Upstream Earnings per Gallon per Share $2.0 x 10⁻¹⁰
Note: Total ExxonMobil shares represent shares that have not been repurchased by the company. Earnings data from ExxonMobil 2012a and ExxonMobil 2012b.
11Where Your Gas Money Goes