Embed Size (px)
Citation preview

State of Charge:
Technical Appendix

2
Contents Appendix A: Calculating Emissions from EV Charging .................................................................................. 3
Average vs. Marginal Emissions ................................................................................................................ 3
Regional Emissions Estimates: Data Sources and Calculations................................................................. 4
Hourly Emissions Estimates: Dispatch Modeling with ORCED ................................................................ 10
Appendix B: Calculating the Cost of EV Charging ....................................................................................... 15
Collecting Electricity Rate Data ............................................................................................................... 15
Amount of Electricity Used for EV Charging ........................................................................................... 17
Handling of Electricity Rate Data ............................................................................................................ 18
Results of Charging-Cost Calculations ..................................................................................................... 23
3
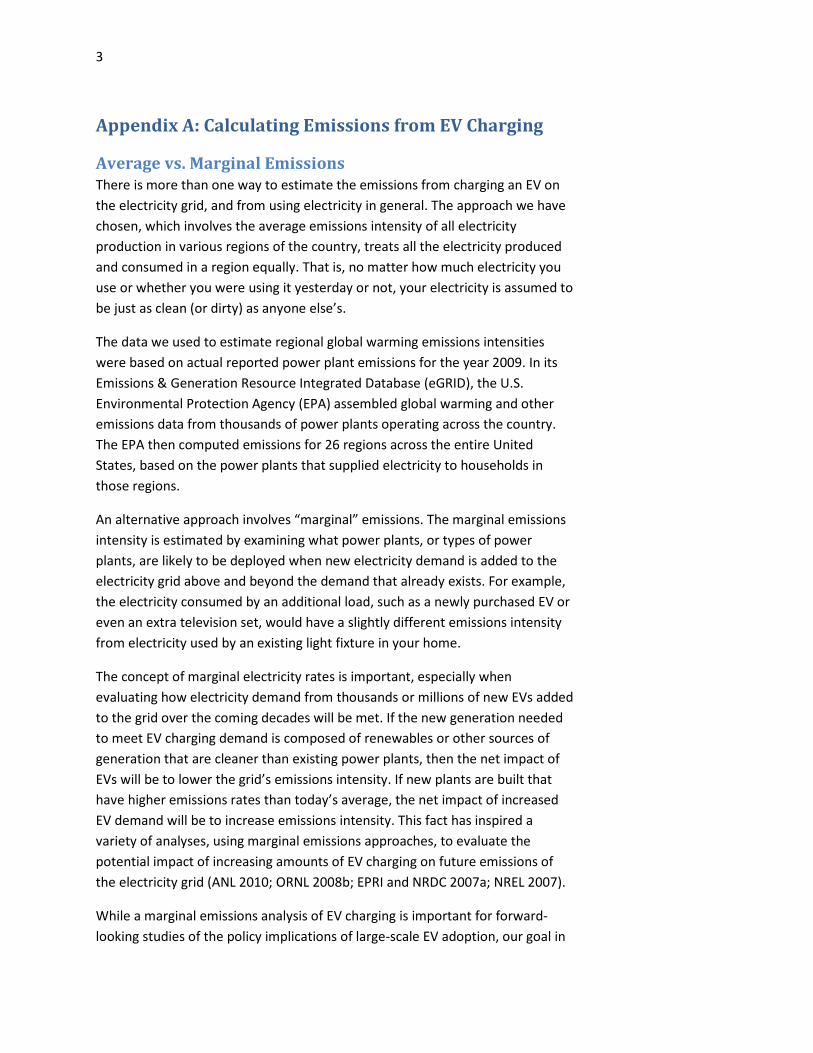
Appendix A: Calculating Emissions from EV Charging
Average vs. Marginal Emissions
There is more than one way to estimate the emissions from charging an EV on
the electricity grid, and from using electricity in general. The approach we have
chosen, which involves the average emissions intensity of all electricity
production in various regions of the country, treats all the electricity produced
and consumed in a region equally. That is, no matter how much electricity you
use or whether you were using it yesterday or not, your electricity is assumed to
be just as clean (or dirty) as anyone else’s.
The data we used to estimate regional global warming emissions intensities
were based on actual reported power plant emissions for the year 2009. In its
Emissions & Generation Resource Integrated Database (eGRID), the U.S.
Environmental Protection Agency (EPA) assembled global warming and other
emissions data from thousands of power plants operating across the country.
The EPA then computed emissions for 26 regions across the entire United
States, based on the power plants that supplied electricity to households in
those regions.
An alternative approach involves “marginal” emissions. The marginal emissions
intensity is estimated by examining what power plants, or types of power
plants, are likely to be deployed when new electricity demand is added to the
electricity grid above and beyond the demand that already exists. For example,
the electricity consumed by an additional load, such as a newly purchased EV or
even an extra television set, would have a slightly different emissions intensity
from electricity used by an existing light fixture in your home.
The concept of marginal electricity rates is important, especially when
evaluating how electricity demand from thousands or millions of new EVs added
to the grid over the coming decades will be met. If the new generation needed
to meet EV charging demand is composed of renewables or other sources of
generation that are cleaner than existing power plants, then the net impact of
EVs will be to lower the grid’s emissions intensity. If new plants are built that
have higher emissions rates than today’s average, the net impact of increased
EV demand will be to increase emissions intensity. This fact has inspired a
variety of analyses, using marginal emissions approaches, to evaluate the
potential impact of increasing amounts of EV charging on future emissions of
the electricity grid (ANL 2010; ORNL 2008b; EPRI and NRDC 2007a; NREL 2007).
While a marginal emissions analysis of EV charging is important for forward-
looking studies of the policy implications of large-scale EV adoption, our goal in
4
this analysis is to give consumers an idea of what the typical global warming
emissions of the electricity used to charge their EV will be on today’s electricity
grid. Therefore we use the average emissions intensity of the electricity,
essentially treating all electricity on the grid at a given time as a shared
resource, or pool of electrons, available to all electricity consumers. This
approach ignores the impact of any changes in electricity production that may
be caused by a single individual plugging in an EV—an impact that is virtually
imperceptible.1
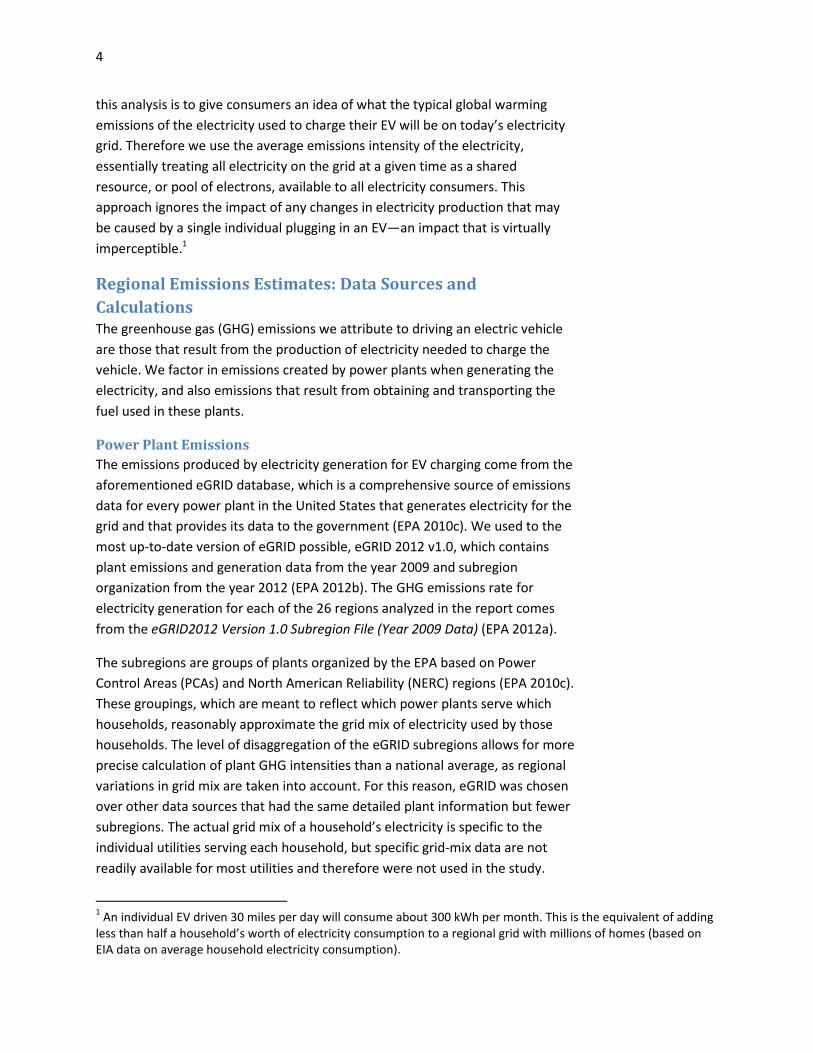
Regional Emissions Estimates: Data Sources and
Calculations
The greenhouse gas (GHG) emissions we attribute to driving an electric vehicle
are those that result from the production of electricity needed to charge the
vehicle. We factor in emissions created by power plants when generating the
electricity, and also emissions that result from obtaining and transporting the
fuel used in these plants.
Power Plant Emissions
The emissions produced by electricity generation for EV charging come from the
aforementioned eGRID database, which is a comprehensive source of emissions
data for every power plant in the United States that generates electricity for the
grid and that provides its data to the government (EPA 2010c). We used to the
most up-to-date version of eGRID possible, eGRID 2012 v1.0, which contains
plant emissions and generation data from the year 2009 and subregion
organization from the year 2012 (EPA 2012b). The GHG emissions rate for
electricity generation for each of the 26 regions analyzed in the report comes
from the eGRID2012 Version 1.0 Subregion File (Year 2009 Data) (EPA 2012a).
The subregions are groups of plants organized by the EPA based on Power
Control Areas (PCAs) and North American Reliability (NERC) regions (EPA 2010c).
These groupings, which are meant to reflect which power plants serve which
households, reasonably approximate the grid mix of electricity used by those
households. The level of disaggregation of the eGRID subregions allows for more
precise calculation of plant GHG intensities than a national average, as regional
variations in grid mix are taken into account. For this reason, eGRID was chosen
over other data sources that had the same detailed plant information but fewer
subregions. The actual grid mix of a household’s electricity is specific to the
individual utilities serving each household, but specific grid-mix data are not
readily available for most utilities and therefore were not used in the study.
1 An individual EV driven 30 miles per day will consume about 300 kWh per month. This is the equivalent of adding
less than half a household’s worth of electricity consumption to a regional grid with millions of homes (based on
EIA data on average household electricity consumption).

5
eGRID’s methodology treats the subregions as closed systems, calculating the
emissions intensity of generation for each one based on the emissions
intensities of the plants it contains. This methodology ignores imports and
exports of electricity between subregions, which harms the accuracy of the
regional emissions estimates. Further disaggregation of these subregions would
increase the precision of the emissions estimates, but would exacerbate the loss
of accuracy due to the omission of imports and exports. Therefore, the 26
eGRID subregions are recommended by the eGRID’s designers as the level of
disaggregation best suited for GHG emissions estimates of electricity use, as
they achieve the best balance between the precision gained by disaggregation
and the accuracy lost by omitting imports and exports (EPA 2009).
Transmission Loss Factors
The eGRID emissions rates do not account for transmission and distribution
losses between the power plant and the household. To account for these losses,
so we could calculate emissions per unit of energy used (rather than energy
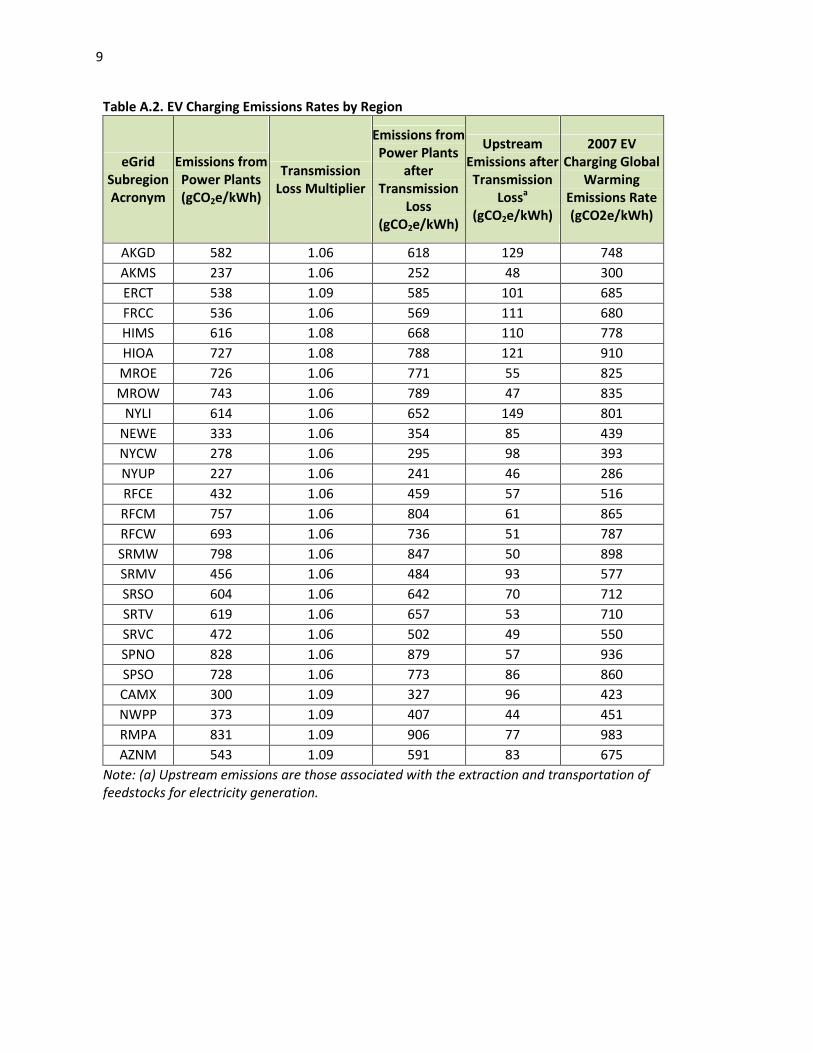
produced), we followed eGRID’s recommendation (EPA 2010c) to increase the
emissions rates using grid loss factors found in the file eGRID2012 Version 1.0
Grid Gross Loss (Year 2009 Data) (EPA 2012a), shown in Table A.2. There are five
grid loss factors that vary by regions called interconnect power grids, and each
state is given a grid loss factor based on the interconnect power grid it belongs
to in the file eGRID2010 Version 1.1 State Import-Export File (Year 2007 Data)
(EPA 2010a). Although eGRID subregions are based on utility service territories
that do not coincide with state boundaries, we assigned each subregion one of
these factors based on those of the states. The purpose of doing this was to
avoid having multiple emissions rates for a single subregion that serves two or
more states with different grid loss factors. The determination of which state
grid loss factors were assigned to a subregion was based on a rough
representational map of approximate subregion boundaries superimposed over
state boundaries.2 For subregions that encompass parts of multiple states with
different grid loss factors, the most prevalent grid loss factor—based on
geographic area of the portions of the states comprising the subregion—was
used.
Upstream Emissions Factors
The eGRID subregion emissions rates include only those emissions produced at
the plant generating the electricity, and they exclude upstream emissions
resulting from the mining and transport of the power plant feedstock (EPA
2010c). Therefore we calculated a feedstock emissions rate for each subregion;
2 This map is found in The Emissions & Generation Resource Integrated Database for 2010 (eGRID2010) Technical
Support Document. Online at
www.epa.gov/cleanenergy/documents/egridzips/eGRID2010TechnicalSupportDocument.pdf.
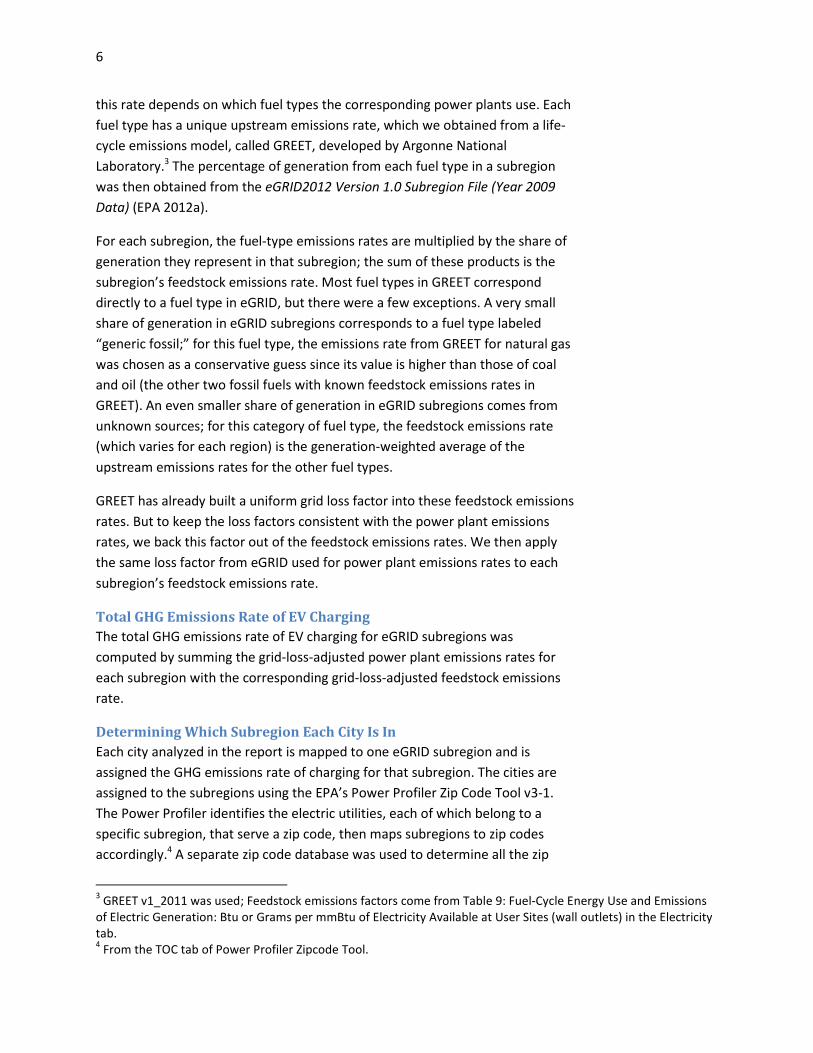
6
this rate depends on which fuel types the corresponding power plants use. Each
fuel type has a unique upstream emissions rate, which we obtained from a life-
cycle emissions model, called GREET, developed by Argonne National
Laboratory.3 The percentage of generation from each fuel type in a subregion
was then obtained from the eGRID2012 Version 1.0 Subregion File (Year 2009
Data) (EPA 2012a).
For each subregion, the fuel-type emissions rates are multiplied by the share of
generation they represent in that subregion; the sum of these products is the
subregion’s feedstock emissions rate. Most fuel types in GREET correspond
directly to a fuel type in eGRID, but there were a few exceptions. A very small
share of generation in eGRID subregions corresponds to a fuel type labeled
“generic fossil;” for this fuel type, the emissions rate from GREET for natural gas
was chosen as a conservative guess since its value is higher than those of coal
and oil (the other two fossil fuels with known feedstock emissions rates in
GREET). An even smaller share of generation in eGRID subregions comes from
unknown sources; for this category of fuel type, the feedstock emissions rate
(which varies for each region) is the generation-weighted average of the
upstream emissions rates for the other fuel types.
GREET has already built a uniform grid loss factor into these feedstock emissions
rates. But to keep the loss factors consistent with the power plant emissions
rates, we back this factor out of the feedstock emissions rates. We then apply
the same loss factor from eGRID used for power plant emissions rates to each
subregion’s feedstock emissions rate.
Total GHG Emissions Rate of EV Charging
The total GHG emissions rate of EV charging for eGRID subregions was
computed by summing the grid-loss-adjusted power plant emissions rates for
each subregion with the corresponding grid-loss-adjusted feedstock emissions
rate.
Determining Which Subregion Each City Is In
Each city analyzed in the report is mapped to one eGRID subregion and is
assigned the GHG emissions rate of charging for that subregion. The cities are
assigned to the subregions using the EPA’s Power Profiler Zip Code Tool v3-1.
The Power Profiler identifies the electric utilities, each of which belong to a
specific subregion, that serve a zip code, then maps subregions to zip codes
accordingly.4 A separate zip code database was used to determine all the zip
3 GREET v1_2011 was used; Feedstock emissions factors come from Table 9: Fuel-Cycle Energy Use and Emissions
of Electric Generation: Btu or Grams per mmBtu of Electricity Available at User Sites (wall outlets) in the Electricity
tab. 4 From the TOC tab of Power Profiler Zipcode Tool.

7
codes served by a city; these zip codes were then input to the Power Profiler so
the corresponding eGRID subregions could be displayed.
In the large majority of cases, all zip codes are served by utilities that belong to
the same subregion. In these cases it was straightforward to assign the city to
that eGRID subregion. In a few cities (Jacksonville, El Paso, and Louisville), all zip
codes are served by a primary utility belonging to the same subregion, but some
of the minor utilities belong to a different subregion. In these cases only the
subregion served by the primary utility was used, so that only one subregion
was mapped to that city. In a few other cities (Memphis, District of Columbia,
Kansas City, and Mesa), the predominant utility in some zip codes belongs to
one subregion, while the predominant utility in other zip codes belongs to a
different subregion. In these cases the predominant utility for the entire city
was chosen, and whichever subregion it belongs to was mapped to that city.
GHG Emissions Rate Assumptions and Results by Subregion
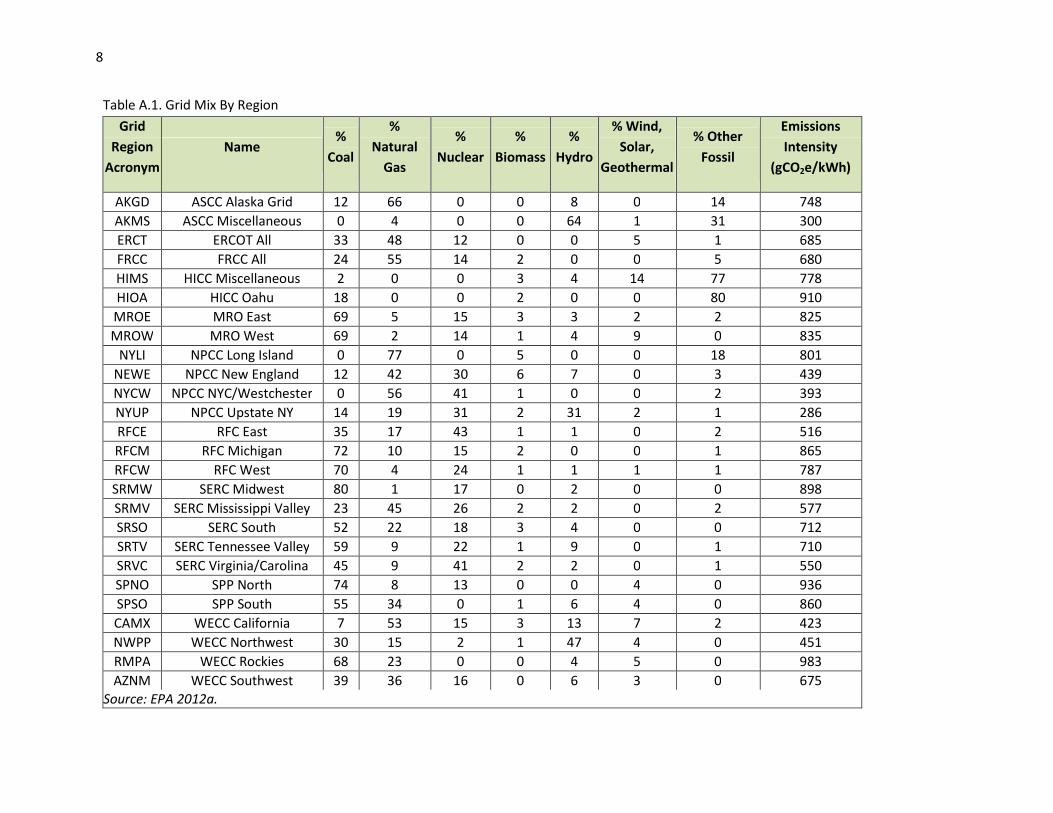
The regional grid mix and estimated emissions intensity for all eGRID
subregions, with adjustments for upstream emissions and grid losses, are shown
in Tables A.1 and A.2.
8
Table A.1. Grid Mix By Region
Grid
Region
Acronym
Name %
Coal
%
Natural
Gas
%
Nuclear
%
Biomass
%
Hydro
% Wind,
Solar,
Geothermal
% Other
Fossil
Emissions
Intensity
(gCO2e/kWh)
AKGD ASCC Alaska Grid 12 66 0 0 8 0 14 748
AKMS ASCC Miscellaneous 0 4 0 0 64 1 31 300
ERCT ERCOT All 33 48 12 0 0 5 1 685
FRCC FRCC All 24 55 14 2 0 0 5 680
HIMS HICC Miscellaneous 2 0 0 3 4 14 77 778
HIOA HICC Oahu 18 0 0 2 0 0 80 910
MROE MRO East 69 5 15 3 3 2 2 825
MROW MRO West 69 2 14 1 4 9 0 835
NYLI NPCC Long Island 0 77 0 5 0 0 18 801
NEWE NPCC New England 12 42 30 6 7 0 3 439
NYCW NPCC NYC/Westchester 0 56 41 1 0 0 2 393
NYUP NPCC Upstate NY 14 19 31 2 31 2 1 286
RFCE RFC East 35 17 43 1 1 0 2 516
RFCM RFC Michigan 72 10 15 2 0 0 1 865
RFCW RFC West 70 4 24 1 1 1 1 787
SRMW SERC Midwest 80 1 17 0 2 0 0 898
SRMV SERC Mississippi Valley 23 45 26 2 2 0 2 577
SRSO SERC South 52 22 18 3 4 0 0 712
SRTV SERC Tennessee Valley 59 9 22 1 9 0 1 710
SRVC SERC Virginia/Carolina 45 9 41 2 2 0 1 550
SPNO SPP North 74 8 13 0 0 4 0 936
SPSO SPP South 55 34 0 1 6 4 0 860
CAMX WECC California 7 53 15 3 13 7 2 423
NWPP WECC Northwest 30 15 2 1 47 4 0 451
RMPA WECC Rockies 68 23 0 0 4 5 0 983
AZNM WECC Southwest 39 36 16 0 6 3 0 675
Source: EPA 2012a.
9
Table A.2. EV Charging Emissions Rates by Region
eGrid
Subregion
Acronym
Emissions from
Power Plants
(gCO2e/kWh)
Transmission
Loss Multiplier
Emissions from
Power Plants
after
Transmission
Loss
(gCO2e/kWh)
Upstream
Emissions after
Transmission
Lossa
(gCO2e/kWh)
2007 EV
Charging Global
Warming
Emissions Rate
(gCO2e/kWh)
AKGD 582 1.06 618 129 748
AKMS 237 1.06 252 48 300
ERCT 538 1.09 585 101 685
FRCC 536 1.06 569 111 680
HIMS 616 1.08 668 110 778
HIOA 727 1.08 788 121 910
MROE 726 1.06 771 55 825
MROW 743 1.06 789 47 835
NYLI 614 1.06 652 149 801
NEWE 333 1.06 354 85 439
NYCW 278 1.06 295 98 393
NYUP 227 1.06 241 46 286
RFCE 432 1.06 459 57 516
RFCM 757 1.06 804 61 865
RFCW 693 1.06 736 51 787
SRMW 798 1.06 847 50 898
SRMV 456 1.06 484 93 577
SRSO 604 1.06 642 70 712
SRTV 619 1.06 657 53 710
SRVC 472 1.06 502 49 550
SPNO 828 1.06 879 57 936
SPSO 728 1.06 773 86 860
CAMX 300 1.09 327 96 423
NWPP 373 1.09 407 44 451
RMPA 831 1.09 906 77 983
AZNM 543 1.09 591 83 675
Note: (a) Upstream emissions are those associated with the extraction and transportation of
feedstocks for electricity generation.

10
Hourly Emissions Estimates: Dispatch Modeling with ORCED
UCS used a modified version of the Oak Ridge Competitive Electricity Dispatch
Model to determine the emissions intensity of regional electricity generation on
an hourly basis.
Estimation of Average Hourly Emissions
A modified version of the Oak Ridge Competitive Electricity Dispatch Model
(ORCED), developed by Stanton Hadley at Oak Ridge National Laboratory, was
used to determine the emissions intensity in 2010 of regional electricity
generation in the United States on an hourly basis. Unlike the EPA’s eGRID2012
Version 1.0 database,5 which only reports how much electricity each power
plant generates over the course of the year, our modified version of the ORCED
model estimates the mix of power plants generating electricity at any given
hour of the year. Like the eGRID database, the ORCED model makes use of
subregions, each of which represents a network of power plants dedicated to
meeting the electricity demand of a specific group of customers. The ORCED
model, which uses a greater level of aggregation than the eGRID database,
contains 13 regions that correspond to electricity-market module regions found
in versions of the Annual Energy Outlook released before 2011. A different
hourly grid mix is determined for each of the 13 subregions.
Below is a description of how the model was utilized and updated for this
analysis. For a more in-depth presentation on the ORCED model, see The Oak
Ridge Competitive Electricity Dispatch (ORCED) Model, online at
apps.ornl.gov/~pts/prod/pubs/ldoc9472_orced_modelfinal.pdf.
ORCED Facilitates the Determination of an Hourly Grid Mix
The hourly estimate of the mix of generating units is made possible by an
algorithm in the ORCED model that estimates the likely order in which utilities in
each region will dispatch power plants to meet incremental increases in
electricity demand. The dispatch order for each region is fixed throughout the
year, but the level of demand at any given time, along with how much electricity
each plant can produce, will determine how many plants need to be run. When
electricity demand is high, more plants are running than when electricity
demand is low; therefore the grid mix will be slightly different for different
levels of demand. The grid mix at any given hour can therefore be estimated as
long as one knows the demand at that hour; plants will be “turned on”
sequentially following the dispatch order until the demand is met.
5 See www.epa.gov/cleanenergy/energy-resources/egrid/index.html.

11
ORCED Was Modified to Display the Hourly Grid Mix
The original ORCED model was not equipped with the capability to output the
average emissions rate of the grid at a certain hour; instead, it generates output
representative of an entire year. Nonetheless, the yearly results are based on
predicted mixes of power plants based on a distribution of hourly demand levels
built into the model. The ORCED model does not explicitly display the
relationship between hourly demand and the mix of power plants that run.
Instead, ORCED displays for each plant the percentage of time during the year
that demand is high enough to require that plant be run. These percentages
vary for summer, winter, and off-peak seasons,6 so they are displayed
separately for each season. An exception exists for hydro power plants, as
discussed below. ORCED also displays the percentage of time during the year
that each level of demand is seen in each region for each season.
Using the aforementioned data, we were able to modify the model to link each
power plant to the minimum level of demand in each season that would require
the plant be run. Given that the demand level and season at every hour of the
year in a region is built into the ORCED model, we added additional code in
order to link each hour to the plants that would need to be run that hour, based
on demand and season. Once complete, the modified version of the ORCED
model was able to display the mix of all non-hydro plants running at every hour
of the year in each region.
Hydro power plants are modeled by ORCED to generate power as a function of
demand. As demand in a region increases, hydro plants in that region generate
more power. For each season in each region, ORCED displays the different levels
of hydro power possible and the percentage of time during the year that
demand is high enough to result in each level of production. Because a
procedure for linking these percentages to hours of the year was already
established for the other types of plants, we added code to the model so that
this same procedure could be applied to hydro power.
Our calculations do not include the impacts of intermittent and random outages
on hourly grid mixes, yet such outages are incorporated into the model when it
is run in its unmodified state. Stanton Hadley (ORCED’s creator), however,
assured us that the accuracy of our results was not significantly affected by our
omission.
Plants Were Linked to Emissions Data in ORCED to Determine CO2 Intensity
Once the mix of plants running at each hour of the year was determined, plant
emissions data were used to compute the weighted-average CO2 intensity of
6 This is because plant capacity factors are different for each season. Fewer plants are needed when capacity
factors are higher, and vice versa. Within each season, we assume that plants are run at a constant level.
12
power generation in each region at each hour. Once the emissions intensities of
electricity generation were computed, the emissions rates were aggregated
over the year, keeping each hour separate so a yearly-average emissions rate
for each hour of the day could be obtained. This procedure was performed for
each of the 13 regions analyzed in the ORCED model.
Updates Made to Data in the Model
Because exogenous data used in the ORCED model were from 2007, we updated
much of these data using more recent sources. Data on regional electricity
demand, power plant feedstock prices,7 and the prices of SO2 and NOx
allowances (all of which came from the 2007 version of the Annual Energy
Outlook) were replaced with calendar year 2010 data from AEO 2010.
The version of the ORCED model available for download contained power plant
data used for a year 2020 simulation, which means these data include power
plants expected to be built between 2010 and 2020 and omit power plants
expected to be retired between those same years. Because our analysis was for
the year 2010, we needed to remove any power plants built after 2010 from the
plant inventory, and we also needed to add power plants scheduled for
retirement between 2010 and 2020. Deleting plants built after 2010 was
straightforward, but power plant data from a 2010 National Energy Modeling
System input file were needed to identify and replace those plants scheduled
for retirement between 2010 and 2020 that had been removed from the
original ORCED model.
Aside from the changes noted in the paragraph above, the power plant data
were not updated from the year 2007. We estimated that the impact of
updating the remaining plants with 2010 data would have been minimal.
Hourly Emissions Results
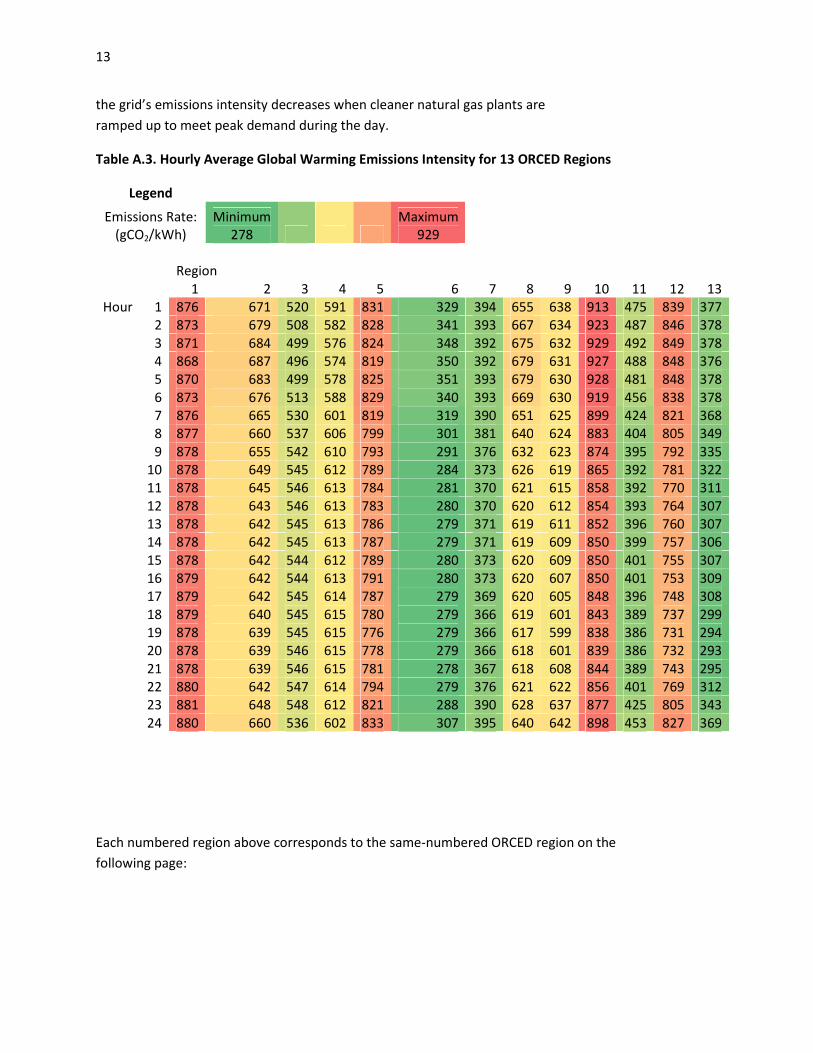
Table A.3 shows the estimated average hourly emissions intensity for each
ORCED region. The emissions intensities are displayed in grams of CO2 per
kilowatt-hour of electricity generated, and are color-coded on a scale that shifts
from dark green to dark red as the CO2 intensity of electricity generation
increases. In general, most regions have slightly higher average emissions
intensities during non-peak hours. The reasons for this vary by region. In areas
such as California, which have a high percentage of hydro sources, evening
emissions intensities can be higher because dams are controlled to generate
more power during peak demand (i.e., daytime) and less at night. In many areas
where coal-fired power plants provide a significant fraction of electricity needs,
7 The price for biomass actually came from the 2009 version of the National Energy Modeling System, as this price
was not included in the 2009 or 2010 versions of the Annual Energy Outlook.
13
the grid’s emissions intensity decreases when cleaner natural gas plants are
ramped up to meet peak demand during the day.
Table A.3. Hourly Average Global Warming Emissions Intensity for 13 ORCED Regions
Legend
Emissions Rate:
(gCO2/kWh)
Minimum
278
Maximum
929
Region
1 2 3 4 5 6 7 8 9 10 11 12 13
Hour 1 876 671 520 591 831 329 394 655 638 913 475 839 377
2 873 679 508 582 828 341 393 667 634 923 487 846 378
3 871 684 499 576 824 348 392 675 632 929 492 849 378
4 868 687 496 574 819 350 392 679 631 927 488 848 376
5 870 683 499 578 825 351 393 679 630 928 481 848 378
6 873 676 513 588 829 340 393 669 630 919 456 838 378
7 876 665 530 601 819 319 390 651 625 899 424 821 368
8 877 660 537 606 799 301 381 640 624 883 404 805 349
9 878 655 542 610 793 291 376 632 623 874 395 792 335
10 878 649 545 612 789 284 373 626 619 865 392 781 322
11 878 645 546 613 784 281 370 621 615 858 392 770 311
12 878 643 546 613 783 280 370 620 612 854 393 764 307
13 878 642 545 613 786 279 371 619 611 852 396 760 307
14 878 642 545 613 787 279 371 619 609 850 399 757 306
15 878 642 544 612 789 280 373 620 609 850 401 755 307
16 879 642 544 613 791 280 373 620 607 850 401 753 309
17 879 642 545 614 787 279 369 620 605 848 396 748 308
18 879 640 545 615 780 279 366 619 601 843 389 737 299
19 878 639 545 615 776 279 366 617 599 838 386 731 294
20 878 639 546 615 778 279 366 618 601 839 386 732 293
21 878 639 546 615 781 278 367 618 608 844 389 743 295
22 880 642 547 614 794 279 376 621 622 856 401 769 312
23 881 648 548 612 821 288 390 628 637 877 425 805 343
24 880 660 536 602 833 307 395 640 642 898 453 827 369
Each numbered region above corresponds to the same-numbered ORCED region on the
following page:
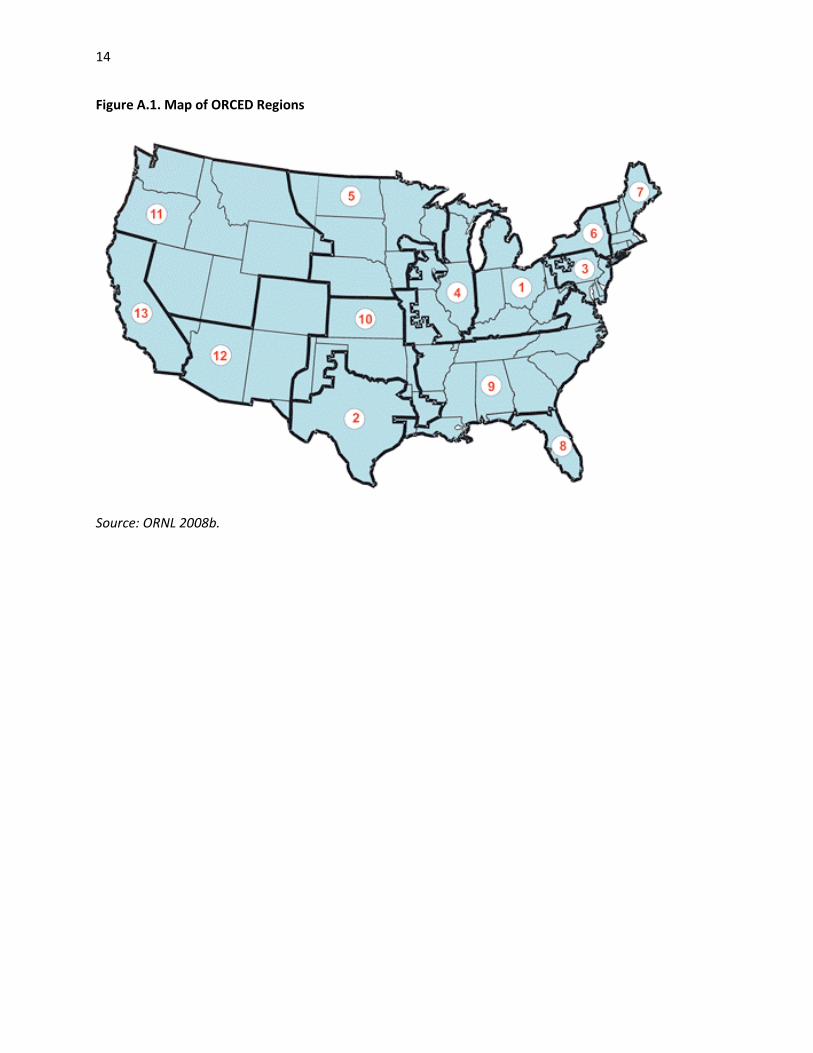
14
Figure A.1. Map of ORCED Regions
Source: ORNL 2008b.
15
Appendix B: Calculating the Cost of EV Charging
Collecting Electricity Rate Data
The cost of electricity for home EV charging in each of the cities in our analysis
was estimated from electricity rate data gathered from utilities.
How Utilities Were Chosen
The cost analysis for this report focuses on 50 cities, chosen because they were
the largest in the United States as measured by city-proper population. In cities
with regulated electricity markets, the analysis includes every utility available to
the inhabitants of those cities. In cities with deregulated electricity markets, the
main delivery providers are included and are assumed to provide electricity only
from their default supplier(s). Therefore, some electricity suppliers serving
deregulated markets are not included in the analysis. In addition, when
information on a delivery provider’s default supplier could not be found, the
delivery provider was omitted from the analysis.
How Data Were Collected
Utility rate data were collected by the consulting firm TIAX LLC, with almost all
the information coming from publicly available rate sheets posted on utility
websites. When the data available online proved to be insufficient, additional
information was gathered through phone and email correspondence with
utilities. These data were compiled over the period from March 2011 to January
2012. Some of the rate plans included in this report have been updated by
utilities since the data were initially gathered, and many of these changes were
incorporated into the analysis between September 2011 and January 2012.
There is still the possibility, however, that the rate data from some utilities have
undergone changes that are not included in this analysis.
Treatment of Zones within Utility Service Territories
The territories of Con Edison, LADWP, and SDG&E, which encompass New York
City, Los Angeles, and San Diego, respectively, are divided into zones. One
component of Con Edison’s electricity rates varies by zone, while LADWP’s and
SDG&E’s baseline quantities—the amounts of electricity consumption available
at the cheapest tier—vary by zone as well. For each city, the rate information
from the utility’s zone that corresponded most directly to the city proper was
chosen. This was Con Edison Zone J for New York City, LADWP Zone 1 for Los
Angeles, and SDG&E Inland Zone for San Diego.
PG&E’s service territory (which includes the cities of San Jose, San Francisco,
Fresno, and Oakland) is also divided into zones as well. As is the case with
SDG&E and LADWP, baseline quantities vary by PG&E’s zones, so we used the

16
zone-appropriate baseline quantities for each city. San Jose is located in Zone X,
San Francisco and Oakland are located in Zone T, and Fresno is located in Zone
R.
Types of Information Gathered
Utility Rate Data
For the utilities included in the analysis, information was gathered about every
residential rate plan under which a household can charge an electric vehicle. If
language in a plan’s rate sheet suggested that EV charging would not be
allowed, that rate plan was omitted from consideration. Separate rates or
baseline quantities for customers with electric heating, which are offered by
some utilities, were not included in the analysis. Customers with electric heat
should check with their utilities for rates if they charge their EVs on the same
plan as their household, given that the rates and tier structures for such
customers are often different.
All data necessary to assess the cost to a household of charging an EV were
collected. These data were of two types: (1) costs that depend on how much
energy is used in a month (consumption), and (2) costs that depend on the peak
amount of energy used in a given instant (demand).
For the first component, all costs imposed per kilowatt-hour of electricity
used—which include items such as energy charges, fuel adjustment factors, and
transmission charges—were summed to develop one single marginal rate in
cents per kilowatt-hour. The marginal rate indicates how much money the
consumer pays for each additional kilowatt-hour used to charge an EV; the total
consumption cost of EV charging over a period of time can therefore be found
by multiplying this rate by the number of kilowatt-hours used for EV charging
during that time. Fixed costs, such as a five-dollar monthly service fee, are
omitted because the household would be paying them regardless of whether or
not they charge an EV.
The second component, which was found only in three rates included in the
analysis, consists of a monthly charge imposed per kilowatt of peak electricity
demand. The more electricity a customer uses at once, the higher this cost will
be. Therefore the contribution of EV charging to demand costs is found by
multiplying the demand cost by the power drawn to charge an EV. This
procedure is straightforward for rate plans in which an EV is metered by itself,
as the vehicle is the only load drawing power. For rates in which a household
and EV are billed together on a single meter, however, this approach assumes
that the household’s peak demand is the sum of EV charging demand and peak
demand from the rest of the household. This assumption is only true if at some
17
time during a given month, EV charging coincides with the peak demand from
the household’s other appliances. Therefore the assumption represents the
worst-case scenario, providing the maximum demand charge possible due to EV
charging. In practice, the demand charge may be less if EV charging never
coincides with a household’s peak demand for other appliances over the course
of a month, and in extreme cases the demand charge may be zero if EVs are
charged exclusively during off-peak times and never contribute to a household’s
peak demand.
Tax and Franchise Fees
For each utility, we gathered information on any taxes or franchise fees (monies
paid to municipalities for the right to operate locally) not already factored into
the utility’s electricity rates. This information came from sample utility bills,
government websites, and phone conversations with utility customer-service
representatives. These taxes (which can occur at the state, local, or county level)
or franchise fees (which increase the marginal cost of electricity for the utility’s
customers) were factored into our rate calculations to determine the actual cost
one would pay for electricity.
Amount of Electricity Used for EV Charging
Consumption
For the sake of simplicity, we assume every EV owner drives his or her EV the
same number of miles each day. In this analysis we use 30 miles of daily driving
for each EV, based on the average daily mileage per vehicle8 determined by the
2009 National Household Transportation Survey. We also assume each mile
driven in an EV requires 0.34 kWh of electricity from the outlet, based on the
0.34 kWh/mile plug-to-wheel efficiency of the first-generation Nissan LEAF,
which is the most prevalent plug-in EV on the road today. Other such EVs have
slightly different electric-drive efficiencies and therefore may require more or
less electricity to operate, but the efficiencies of the Tesla Roadster and Chevy
Volt, two other well-known EVs, are very similar to that of the LEAF. Thus our
analysis assumes that 10.2 kWh (30 miles x 0.34 kWh/mile) of electricity are
used to charge every EV each day of the year. We assume all EV charging is done
at home, where the majority of EV charging is likely to occur. Any charging done
at the workplace or other locations would lower household energy
consumption.
Capacity
In this analysis, we assume all EV charging is done at 3.3 kW, which is the power
level for a Level 2 charge using the onboard chargers of both the LEAF and Volt.
8 The actual number is 31.1 miles per vehicle.
18
EV owners also have the option of using a Level 1 charge, which only draws 1.4
kW but takes more than twice as long. When charging on one of the few utility
rates that include demand costs, Level 1 charging might be cheaper because of
its lower power level.
Handling of Electricity Rate Data
Tiered Rates
For many utility rates, the consumption component of the costs has a tiered
structure—costs vary according to how much electricity is used. A certain
number of kilowatt-hours are allocated to each tier, and once those kilowatt-
hours are used the consumer moves into the next tier. When an EV is metered
separately from the rest of the household, calculating EV charging consumption
costs on a tiered rate plan is straightforward; the cost per kilowatt-hour is the
average of the tiered rates, weighted by the amount of electricity consumed in
each tier. When a household and EV are billed together on a single meter,
however, a slightly different methodology must be used. Each month’s EV
charging consumption is treated as the “last” electricity used by the household
that month, regardless of when the charging actually took place. The result is
that EV charging will incur the highest-tiered electricity rates paid by the
household each month. An estimate of monthly home (non-EV) electricity
consumption is used to determine the specific tier(s) in which EV charging
occurs.
For most cities, this estimate comes from state-based data on average monthly
residential electricity consumption, available from the U.S. Energy Information
Administration.9 By using average electricity consumption, we assume all
households in a given state use the same amount of energy. Customers who use
less electricity than average will therefore usually pay a lower rate to charge
their EVs on tiered single-meter rates than our analysis shows, and customers
who use more electricity than average will probably pay a higher rate. But in
some cities, where electricity rates become lower with higher monthly
consumption, this trend is actually reversed.
Using monthly average electricity consumption also assumes household energy
consumption is the same for each month. But because of seasonal variations in
energy consumption, these estimates of household consumption may be too
high for some months and too low for others. Such variations may not cancel
out—sometimes only one season is tiered, and sometimes the seasons have
9 See Table 5: Residential Average Monthly Bill by Census Division and State, online at
www.eia.gov/cneaf/electricity/esr/table5.html.
19
different baselines that don’t directly reflect the differences in seasonal
consumption.
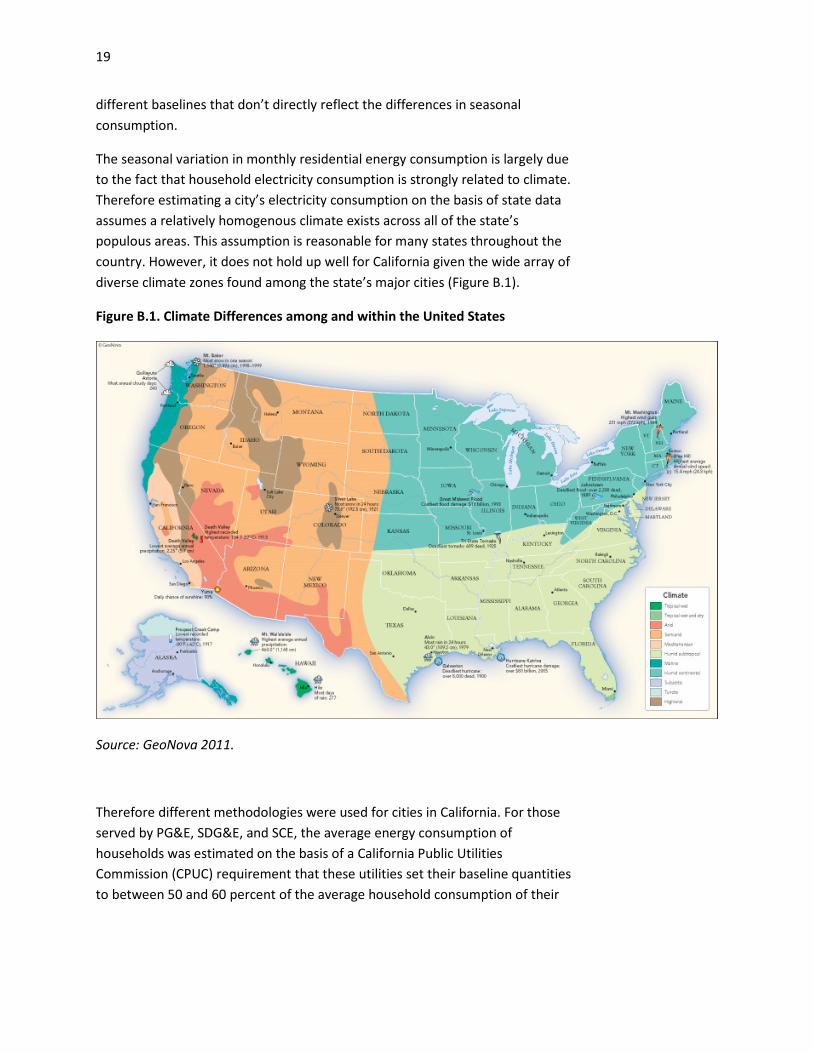
The seasonal variation in monthly residential energy consumption is largely due
to the fact that household electricity consumption is strongly related to climate.
Therefore estimating a city’s electricity consumption on the basis of state data
assumes a relatively homogenous climate exists across all of the state’s
populous areas. This assumption is reasonable for many states throughout the
country. However, it does not hold up well for California given the wide array of
diverse climate zones found among the state’s major cities (Figure B.1).
Figure B.1. Climate Differences among and within the United States
Source: GeoNova 2011.
Therefore different methodologies were used for cities in California. For those
served by PG&E, SDG&E, and SCE, the average energy consumption of
households was estimated on the basis of a California Public Utilities
Commission (CPUC) requirement that these utilities set their baseline quantities
to between 50 and 60 percent of the average household consumption of their
20
customers.10 PG&E claims on its website that it sets its baseline levels using the
highest end of this range, so we computed our estimate of the average
household energy consumption for each city served by PG&E (San Jose, San
Francisco, Fresno, and Oakland) as 167 percent (the inverse of 60 percent) of
the PG&E baseline quantities for that city.
We did not come across similar claims from SDG&E and SCE, so the median of
the CPUC’s range was used to estimate the average household consumption in
cities served by these utilities. The estimated average household consumption
for Long Beach was computed as 182 percent (the inverse of 55 percent) of
SCE’s baseline quantities, and the estimated average household consumption
for San Diego is computed as 182 percent of SDG&E’s baseline quantities. We
were unable to ascertain a relationship between the baseline values and
electricity consumption for California cities served by SMUD and LADWP, so we
contacted these utilities to learn the average yearly electricity consumption of
their customers. The yearly average was then divided by 12 to compute a
monthly estimate of the average household energy consumption in those
locales.
Rate Variation
Our analysis estimates the cost of EV charging on a given rate plan over the
course of an entire year; to do so we calculate one single electricity rate
representative of that whole year of charging. In reality, utility rates often vary
by season, month, day, and even hour. By assuming the same amount of EV
charging each day, we are able to address most temporal variations on rate; we
take averages of the varied rates weighted by the amount of time to which each
rate applies.
Seasonal and Daily Variations
Seasonal rates are weighted and averaged based on the fraction of the year
each season comprises. For example, if summer and winter each spanned six
months they would contribute equally to the yearly rate. Monthly and daily rate
variations are addressed in the same way. For example, weekend days often
differ from weekdays because their peak hours are different or nonexistent. In
these cases, the weekly average rate is found by weighting the weekday rate by
five-sevenths and the weekend rate by two-sevenths.
10
An unintended advantage of using this methodology for these PG&E cities is that the known relationship
between baseline values and electricity consumption allows the estimates of household electricity usage to track
seasonal variations in the baseline values. Many of the cities in our analysis have separate baseline values for
summer and winter, but only the cities to which this methodology is applied have distinct estimates of household
consumption for these seasons as well.
21
Time-of-Use Variations
When charging an EV under a time-of-use plan, in which electricity rates vary by
hour, we assume more charging will occur at some hours than at others.
Therefore the rates at the most common hours for charging will factor more
into the calculation of charging costs than the rates during hours when less
charging occurs.
We assume EV drivers on time-of-use plans will try to maximize the amount of
charging they are able to do during off-peak times. Because off-peak hours vary
among different utilities, we did not attempt to assign a share of charging time
to any particular hours of the day. Instead, we assume 70 percent of charging is
always done at off-peak rates over the course of a year, whatever those hours
may be—reflecting the idea that 70 percent of charging demand can be flexible
enough to be done at optimal times. We then assume the other 30 percent of
charging occurs at random times, based on need, and therefore the rate at each
hour of the day contributes an equal share to this 30 percent of charging costs.
This scheme allows our charging profile to reflect a preference for off-peak
charging, while making sure that all components of the time-of-use rate are
factored into the charging-cost calculation.
Off-peak times under TOU plans comprise anywhere from 5 to 19 hours of the
day, depending on the utility, so when combined with the 70 percent of
charging we assume always occurs at off-peak times, 76 to 94 percent of the
charging under a given utility’s TOU plan will incur off-peak rates. These figures
are consistent with what a charging profile developed by the Electric Power
Research Institute and the Natural Resources Defense Council (EPRI and NRDC
2007a) would indicate for the share of off-peak charging, if one was to
redistribute the public/workplace charging (which is not pertinent to residential
charging) proportionally among the other hours. The figures are also supported
by preliminary data from an SDG&E rate study, which found that for 360
customers with EVs on separately metered TOU rates, 84 percent of their
charging was done at the lowest off-peak rates (Haddow 2012). Although an
individual’s EV charging will likely vary from day to day, we assume this charging
will fit our distribution over the course of a year.
To determine the cost of charging an EV on a TOU rate, we compute a single
average electricity rate by multiplying the off-peak TOU rate by 70 percent,
multiplying the rate at each hour of the day both by one-twenty-fourth (that
hour’s fraction of the day) and 30 percent, then summing the resulting 25
products. It is important to remember that our charging profile is just an
estimate; EV owners can save more than what we calculate by always charging
at off-peak times, (or save less if they frequently have to charge during the day).

22
Fuel-Price Variations
Another type of monthly rate variation that occurs in some utility rate plans is
marginal cost, based on the changing price of the fuel that power plants use to
produce electricity. These marginal rates are calculated for each month’s
electricity bill, as they are not predictable. To reduce the uncertainty associated
with these costs, utilities publish historic monthly rates, which help give the
customer an idea of what the rate might be for upcoming months. For our
analysis, we take the average monthly marginal cost over the most recent year
and treat it as a single (constant) rate that will apply to the upcoming year.
Residential Rates Omitted from the Analysis
Many residential rates offered by utilities in our analysis were excluded, even
though one could charge an EV on them:
- TOU rates were sometimes excluded (PG&E’s, for example) when the
same utility offered a similar EV rate that was clearly cheaper at all
times of the day.
- TOU rates with capacity charges were always excluded when the same
utility offered a TOU rate without demand charges. This was done
because capacity charges incurred from EV charging are difficult to
estimate, and also because TOU rates with capacity charges are
generally unfavorable for fueling an EV, given the high power draw of
Level 2 charging.
- TOU rates with “surprise” peak times set at the discretion of the utility
were also excluded. The peak times for such rates are not posted in
advance; instead, the utility warns customers shortly before the peak
goes into effect, often with lead times as short as 30 minutes. Because it
is impossible to predict how much EV charging will cost without
knowing when the peak hours are, we did not feel it was useful to
include these rates.
23
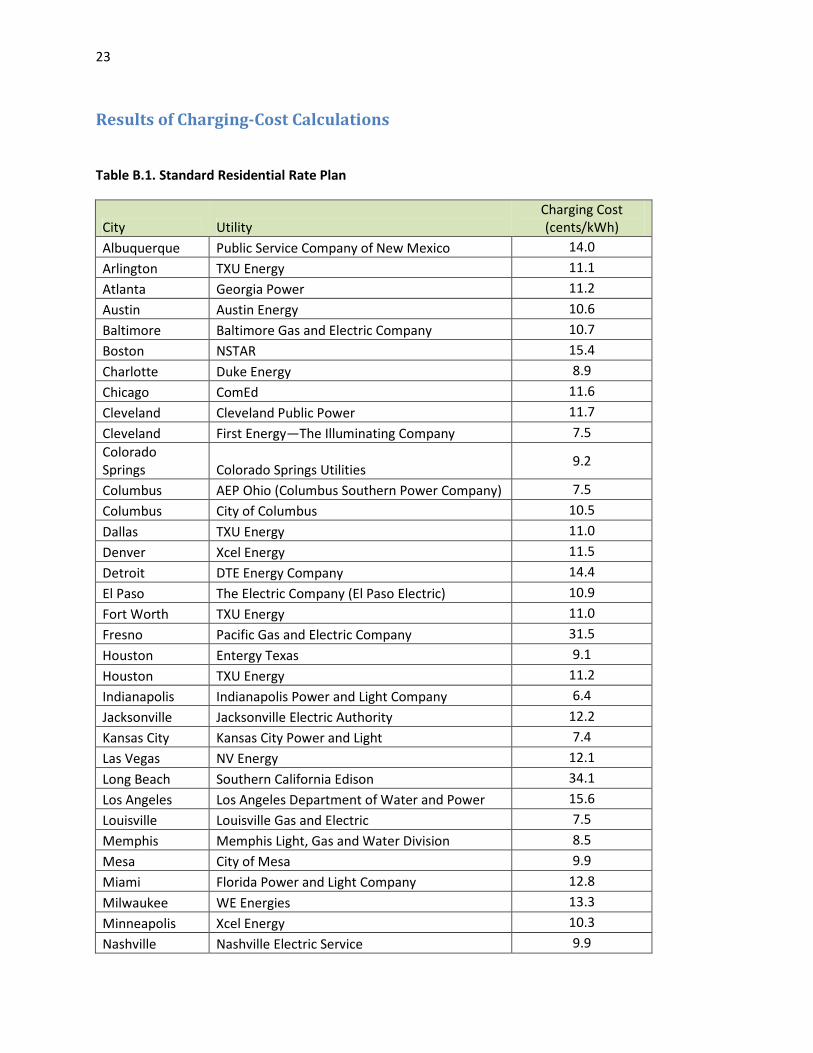
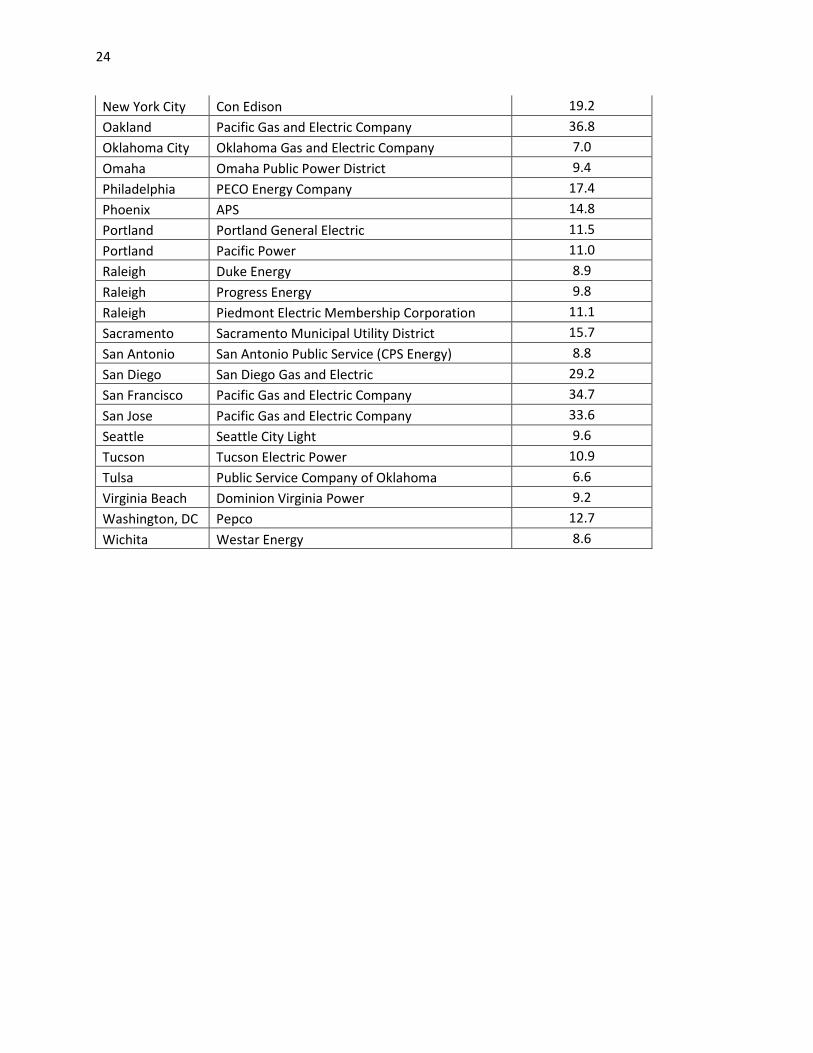
Results of Charging-Cost Calculations
Table B.1. Standard Residential Rate Plan
City Utility
Charging Cost
(cents/kWh)
Albuquerque Public Service Company of New Mexico 14.0
Arlington TXU Energy 11.1
Atlanta Georgia Power 11.2
Austin Austin Energy 10.6
Baltimore Baltimore Gas and Electric Company 10.7
Boston NSTAR 15.4
Charlotte Duke Energy 8.9
Chicago ComEd 11.6
Cleveland Cleveland Public Power 11.7
Cleveland First Energy—The Illuminating Company 7.5
Colorado
Springs Colorado Springs Utilities 9.2
Columbus AEP Ohio (Columbus Southern Power Company) 7.5
Columbus City of Columbus 10.5
Dallas TXU Energy 11.0
Denver Xcel Energy 11.5
Detroit DTE Energy Company 14.4
El Paso The Electric Company (El Paso Electric) 10.9
Fort Worth TXU Energy 11.0
Fresno Pacific Gas and Electric Company 31.5
Houston Entergy Texas 9.1
Houston TXU Energy 11.2
Indianapolis Indianapolis Power and Light Company 6.4
Jacksonville Jacksonville Electric Authority 12.2
Kansas City Kansas City Power and Light 7.4
Las Vegas NV Energy 12.1
Long Beach Southern California Edison 34.1
Los Angeles Los Angeles Department of Water and Power 15.6
Louisville Louisville Gas and Electric 7.5
Memphis Memphis Light, Gas and Water Division 8.5
Mesa City of Mesa 9.9
Miami Florida Power and Light Company 12.8
Milwaukee WE Energies 13.3
Minneapolis Xcel Energy 10.3
Nashville Nashville Electric Service 9.9
24
New York City Con Edison 19.2
Oakland Pacific Gas and Electric Company 36.8
Oklahoma City Oklahoma Gas and Electric Company 7.0
Omaha Omaha Public Power District 9.4
Philadelphia PECO Energy Company 17.4
Phoenix APS 14.8
Portland Portland General Electric 11.5
Portland Pacific Power 11.0
Raleigh Duke Energy 8.9
Raleigh Progress Energy 9.8
Raleigh Piedmont Electric Membership Corporation 11.1
Sacramento Sacramento Municipal Utility District 15.7
San Antonio San Antonio Public Service (CPS Energy) 8.8
San Diego San Diego Gas and Electric 29.2
San Francisco Pacific Gas and Electric Company 34.7
San Jose Pacific Gas and Electric Company 33.6
Seattle Seattle City Light 9.6
Tucson Tucson Electric Power 10.9
Tulsa Public Service Company of Oklahoma 6.6
Virginia Beach Dominion Virginia Power 9.2
Washington, DC Pepco 12.7
Wichita Westar Energy 8.6
25
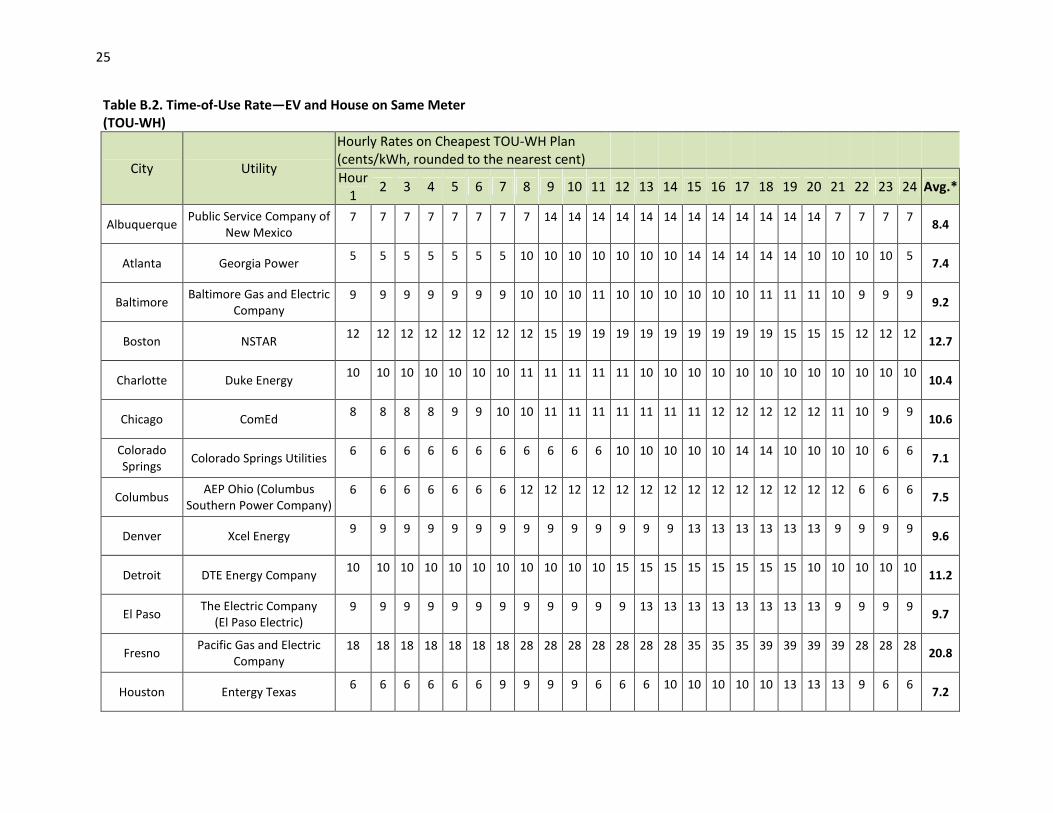
Table B.2. Time-of-Use Rate—EV and House on Same Meter
(TOU-WH)
City Utility
Hourly Rates on Cheapest TOU-WH Plan
(cents/kWh, rounded to the nearest cent)
Hour
1 2 3 4 5 6 7 8 9 10 11 12 13 14 15 16 17 18 19 20 21 22 23 24 Avg.*
Albuquerque Public Service Company of
New Mexico
7 7 7 7 7 7 7 7 14 14 14 14 14 14 14 14 14 14 14 14 7 7 7 7 8.4
Atlanta Georgia Power 5 5 5 5 5 5 5 10 10 10 10 10 10 10 14 14 14 14 14 10 10 10 10 5
7.4
Baltimore Baltimore Gas and Electric
Company
9 9 9 9 9 9 9 10 10 10 11 10 10 10 10 10 10 11 11 11 10 9 9 9 9.2
Boston NSTAR 12 12 12 12 12 12 12 12 15 19 19 19 19 19 19 19 19 19 15 15 15 12 12 12
12.7
Charlotte Duke Energy 10 10 10 10 10 10 10 11 11 11 11 11 10 10 10 10 10 10 10 10 10 10 10 10
10.4
Chicago ComEd 8 8 8 8 9 9 10 10 11 11 11 11 11 11 11 12 12 12 12 12 11 10 9 9
10.6
Colorado
Springs Colorado Springs Utilities
6 6 6 6 6 6 6 6 6 6 6 10 10 10 10 10 14 14 10 10 10 10 6 6 7.1
Columbus AEP Ohio (Columbus
Southern Power Company)
6 6 6 6 6 6 6 12 12 12 12 12 12 12 12 12 12 12 12 12 12 6 6 6 7.5
Denver Xcel Energy 9 9 9 9 9 9 9 9 9 9 9 9 9 9 13 13 13 13 13 13 9 9 9 9
9.6
Detroit DTE Energy Company 10 10 10 10 10 10 10 10 10 10 10 15 15 15 15 15 15 15 15 10 10 10 10 10
11.2
El Paso The Electric Company
(El Paso Electric)
9 9 9 9 9 9 9 9 9 9 9 9 13 13 13 13 13 13 13 13 9 9 9 9 9.7
Fresno Pacific Gas and Electric
Company
18 18 18 18 18 18 18 28 28 28 28 28 28 28 35 35 35 39 39 39 39 28 28 28 20.8
Houston Entergy Texas 6 6 6 6 6 6 9 9 9 9 6 6 6 10 10 10 10 10 13 13 13 9 6 6
7.2
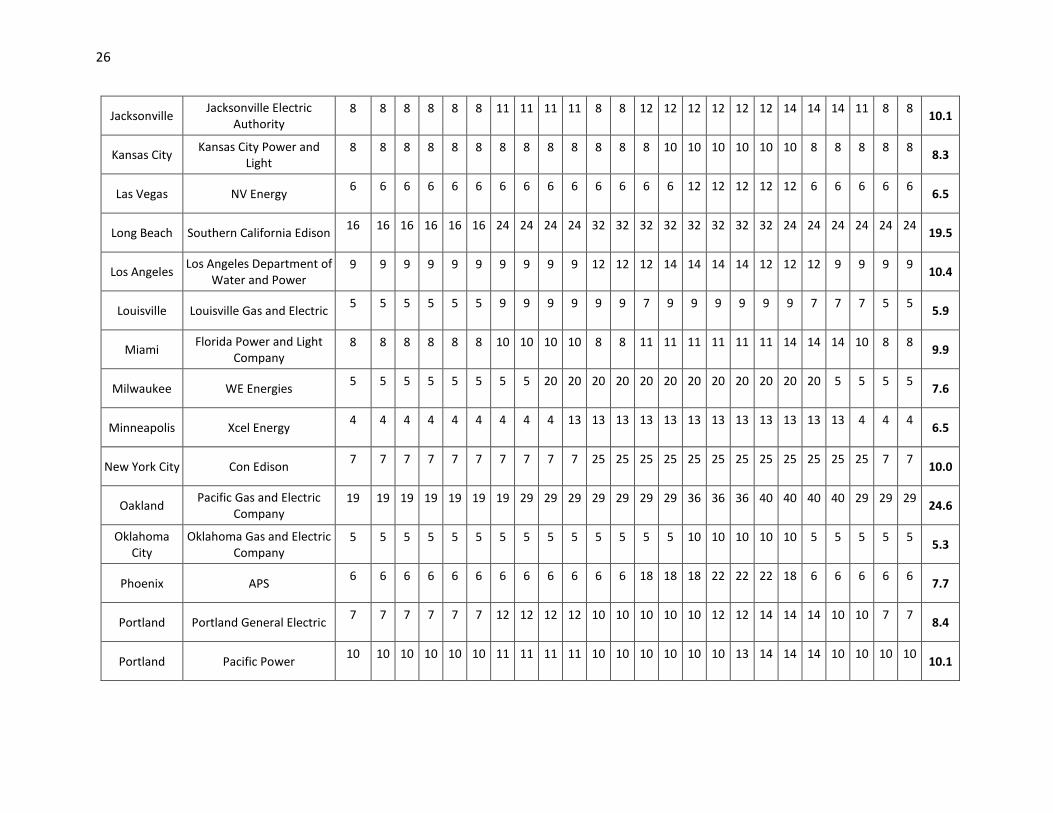
26
Jacksonville Jacksonville Electric
Authority
8 8 8 8 8 8 11 11 11 11 8 8 12 12 12 12 12 12 14 14 14 11 8 8 10.1
Kansas City Kansas City Power and
Light
8 8 8 8 8 8 8 8 8 8 8 8 8 10 10 10 10 10 10 8 8 8 8 8 8.3
Las Vegas NV Energy 6 6 6 6 6 6 6 6 6 6 6 6 6 6 12 12 12 12 12 6 6 6 6 6
6.5
Long Beach Southern California Edison 16 16 16 16 16 16 24 24 24 24 32 32 32 32 32 32 32 32 24 24 24 24 24 24
19.5
Los Angeles Los Angeles Department of
Water and Power
9 9 9 9 9 9 9 9 9 9 12 12 12 14 14 14 14 12 12 12 9 9 9 9 10.4
Louisville Louisville Gas and Electric 5 5 5 5 5 5 9 9 9 9 9 9 7 9 9 9 9 9 9 7 7 7 5 5
5.9
Miami Florida Power and Light
Company
8 8 8 8 8 8 10 10 10 10 8 8 11 11 11 11 11 11 14 14 14 10 8 8 9.9
Milwaukee WE Energies 5 5 5 5 5 5 5 5 20 20 20 20 20 20 20 20 20 20 20 20 5 5 5 5
7.6
Minneapolis Xcel Energy 4 4 4 4 4 4 4 4 4 13 13 13 13 13 13 13 13 13 13 13 13 4 4 4
6.5
New York City Con Edison 7 7 7 7 7 7 7 7 7 7 25 25 25 25 25 25 25 25 25 25 25 25 7 7
10.0
Oakland Pacific Gas and Electric
Company
19 19 19 19 19 19 19 29 29 29 29 29 29 29 36 36 36 40 40 40 40 29 29 29 24.6
Oklahoma
City
Oklahoma Gas and Electric
Company
5 5 5 5 5 5 5 5 5 5 5 5 5 5 10 10 10 10 10 5 5 5 5 5 5.3
Phoenix APS 6 6 6 6 6 6 6 6 6 6 6 6 18 18 18 22 22 22 18 6 6 6 6 6
7.7
Portland Portland General Electric 7 7 7 7 7 7 12 12 12 12 10 10 10 10 10 12 12 14 14 14 10 10 7 7
8.4
Portland Pacific Power 10 10 10 10 10 10 11 11 11 11 10 10 10 10 10 10 13 14 14 14 10 10 10 10
10.1
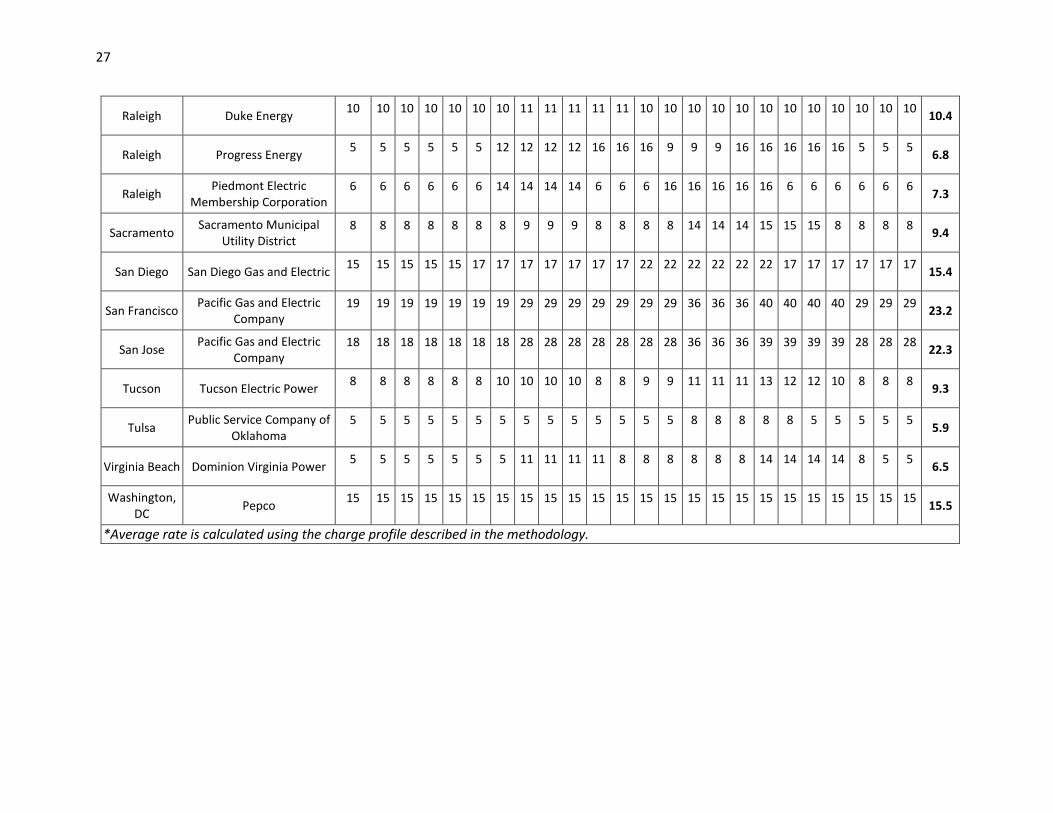
27
Raleigh Duke Energy 10 10 10 10 10 10 10 11 11 11 11 11 10 10 10 10 10 10 10 10 10 10 10 10
10.4
Raleigh Progress Energy 5 5 5 5 5 5 12 12 12 12 16 16 16 9 9 9 16 16 16 16 16 5 5 5
6.8
Raleigh Piedmont Electric
Membership Corporation
6 6 6 6 6 6 14 14 14 14 6 6 6 16 16 16 16 16 6 6 6 6 6 6 7.3
Sacramento Sacramento Municipal
Utility District
8 8 8 8 8 8 8 9 9 9 8 8 8 8 14 14 14 15 15 15 8 8 8 8 9.4
San Diego San Diego Gas and Electric 15 15 15 15 15 17 17 17 17 17 17 17 22 22 22 22 22 22 17 17 17 17 17 17
15.4
San Francisco Pacific Gas and Electric
Company
19 19 19 19 19 19 19 29 29 29 29 29 29 29 36 36 36 40 40 40 40 29 29 29 23.2
San Jose Pacific Gas and Electric
Company
18 18 18 18 18 18 18 28 28 28 28 28 28 28 36 36 36 39 39 39 39 28 28 28 22.3
Tucson Tucson Electric Power 8 8 8 8 8 8 10 10 10 10 8 8 9 9 11 11 11 13 12 12 10 8 8 8
9.3
Tulsa Public Service Company of
Oklahoma
5 5 5 5 5 5 5 5 5 5 5 5 5 5 8 8 8 8 8 5 5 5 5 5 5.9
Virginia Beach Dominion Virginia Power 5 5 5 5 5 5 5 11 11 11 11 8 8 8 8 8 8 14 14 14 14 8 5 5
6.5
Washington,
DC Pepco
15 15 15 15 15 15 15 15 15 15 15 15 15 15 15 15 15 15 15 15 15 15 15 15 15.5
*Average rate is calculated using the charge profile described in the methodology.
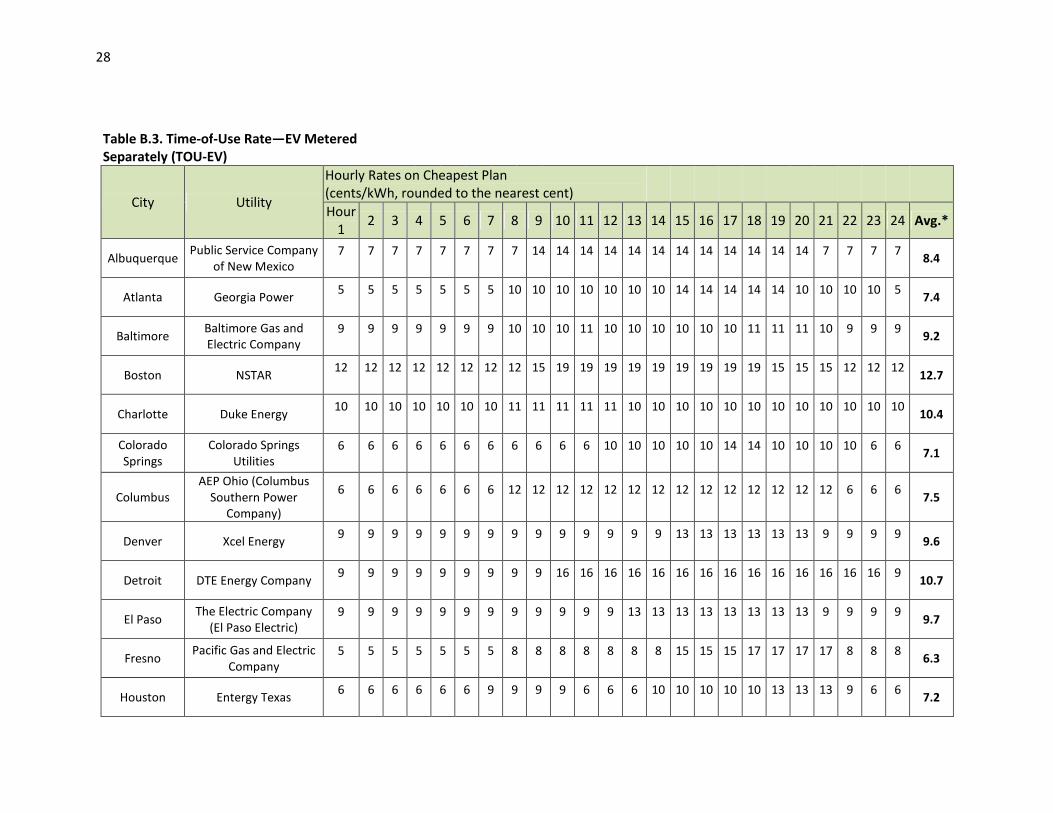
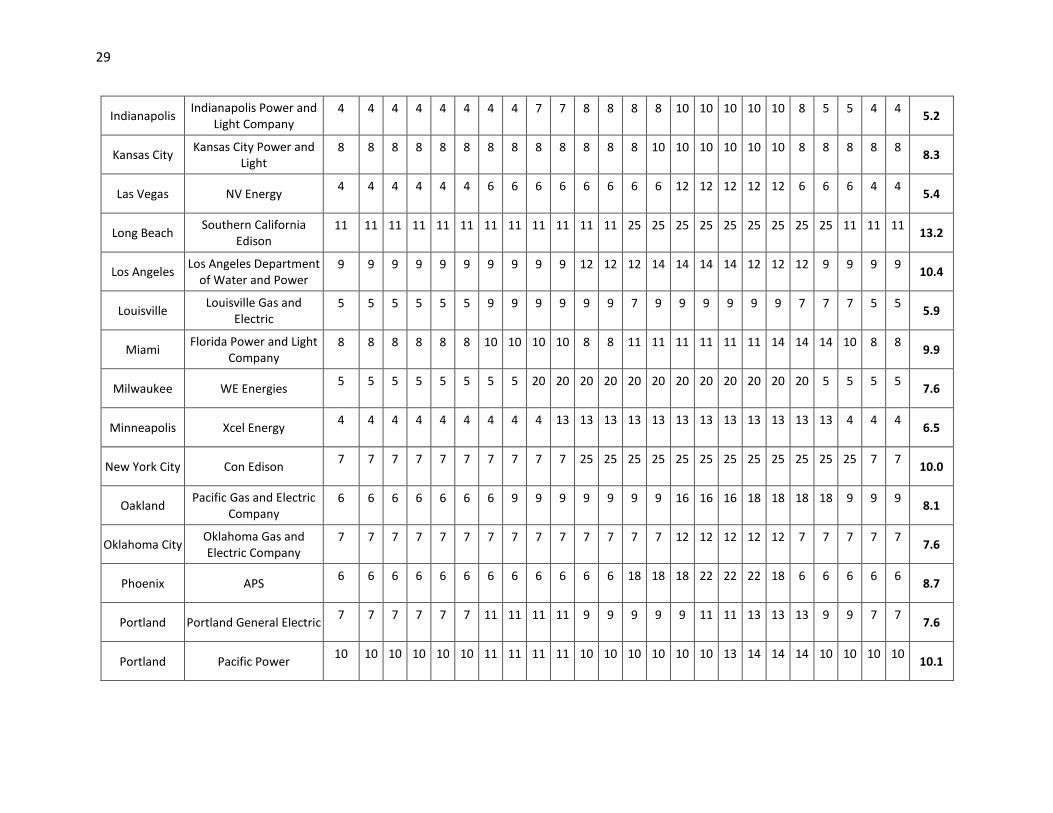
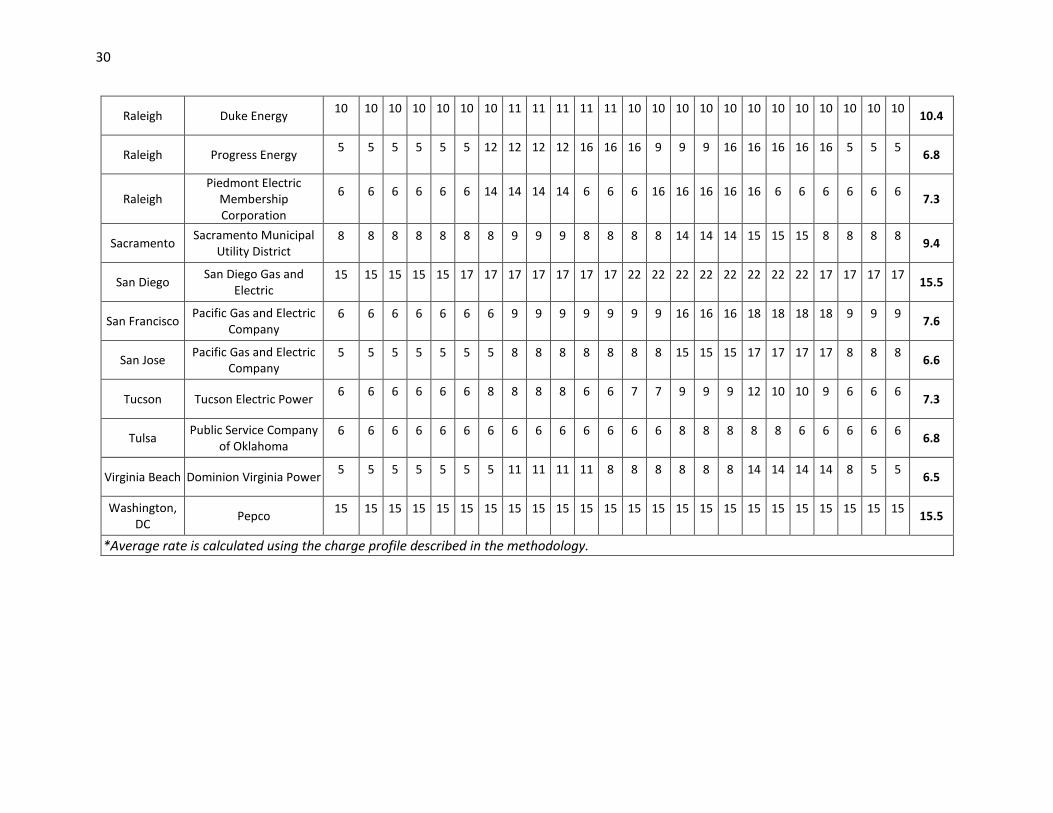
28
Table B.3. Time-of-Use Rate—EV Metered
Separately (TOU-EV)
City Utility
Hourly Rates on Cheapest Plan
(cents/kWh, rounded to the nearest cent)
Hour
1 2 3 4 5 6 7 8 9 10 11 12 13 14 15 16 17 18 19 20 21 22 23 24 Avg.*
Albuquerque Public Service Company
of New Mexico
7 7 7 7 7 7 7 7 14 14 14 14 14 14 14 14 14 14 14 14 7 7 7 7 8.4
Atlanta Georgia Power 5 5 5 5 5 5 5 10 10 10 10 10 10 10 14 14 14 14 14 10 10 10 10 5
7.4
Baltimore Baltimore Gas and
Electric Company
9 9 9 9 9 9 9 10 10 10 11 10 10 10 10 10 10 11 11 11 10 9 9 9 9.2
Boston NSTAR 12 12 12 12 12 12 12 12 15 19 19 19 19 19 19 19 19 19 15 15 15 12 12 12
12.7
Charlotte Duke Energy 10 10 10 10 10 10 10 11 11 11 11 11 10 10 10 10 10 10 10 10 10 10 10 10
10.4
Colorado
Springs
Colorado Springs
Utilities
6 6 6 6 6 6 6 6 6 6 6 10 10 10 10 10 14 14 10 10 10 10 6 6 7.1
Columbus
AEP Ohio (Columbus
Southern Power
Company)
6 6 6 6 6 6 6 12 12 12 12 12 12 12 12 12 12 12 12 12 12 6 6 6 7.5
Denver Xcel Energy 9 9 9 9 9 9 9 9 9 9 9 9 9 9 13 13 13 13 13 13 9 9 9 9
9.6
Detroit DTE Energy Company 9 9 9 9 9 9 9 9 9 16 16 16 16 16 16 16 16 16 16 16 16 16 16 9
10.7
El Paso The Electric Company
(El Paso Electric)
9 9 9 9 9 9 9 9 9 9 9 9 13 13 13 13 13 13 13 13 9 9 9 9 9.7
Fresno Pacific Gas and Electric
Company
5 5 5 5 5 5 5 8 8 8 8 8 8 8 15 15 15 17 17 17 17 8 8 8 6.3
Houston Entergy Texas 6 6 6 6 6 6 9 9 9 9 6 6 6 10 10 10 10 10 13 13 13 9 6 6
7.2
29
Indianapolis Indianapolis Power and
Light Company
4 4 4 4 4 4 4 4 7 7 8 8 8 8 10 10 10 10 10 8 5 5 4 4 5.2
Kansas City Kansas City Power and
Light
8 8 8 8 8 8 8 8 8 8 8 8 8 10 10 10 10 10 10 8 8 8 8 8 8.3
Las Vegas NV Energy 4 4 4 4 4 4 6 6 6 6 6 6 6 6 12 12 12 12 12 6 6 6 4 4
5.4
Long Beach Southern California
Edison
11 11 11 11 11 11 11 11 11 11 11 11 25 25 25 25 25 25 25 25 25 11 11 11 13.2
Los Angeles Los Angeles Department
of Water and Power
9 9 9 9 9 9 9 9 9 9 12 12 12 14 14 14 14 12 12 12 9 9 9 9 10.4
Louisville Louisville Gas and
Electric
5 5 5 5 5 5 9 9 9 9 9 9 7 9 9 9 9 9 9 7 7 7 5 5 5.9
Miami Florida Power and Light
Company
8 8 8 8 8 8 10 10 10 10 8 8 11 11 11 11 11 11 14 14 14 10 8 8 9.9
Milwaukee WE Energies 5 5 5 5 5 5 5 5 20 20 20 20 20 20 20 20 20 20 20 20 5 5 5 5
7.6
Minneapolis Xcel Energy 4 4 4 4 4 4 4 4 4 13 13 13 13 13 13 13 13 13 13 13 13 4 4 4
6.5
New York City Con Edison 7 7 7 7 7 7 7 7 7 7 25 25 25 25 25 25 25 25 25 25 25 25 7 7
10.0
Oakland Pacific Gas and Electric
Company
6 6 6 6 6 6 6 9 9 9 9 9 9 9 16 16 16 18 18 18 18 9 9 9 8.1
Oklahoma City Oklahoma Gas and
Electric Company
7 7 7 7 7 7 7 7 7 7 7 7 7 7 12 12 12 12 12 7 7 7 7 7 7.6
Phoenix APS 6 6 6 6 6 6 6 6 6 6 6 6 18 18 18 22 22 22 18 6 6 6 6 6
8.7
Portland Portland General Electric 7 7 7 7 7 7 11 11 11 11 9 9 9 9 9 11 11 13 13 13 9 9 7 7
7.6
Portland Pacific Power 10 10 10 10 10 10 11 11 11 11 10 10 10 10 10 10 13 14 14 14 10 10 10 10
10.1
30
Raleigh Duke Energy 10 10 10 10 10 10 10 11 11 11 11 11 10 10 10 10 10 10 10 10 10 10 10 10
10.4
Raleigh Progress Energy 5 5 5 5 5 5 12 12 12 12 16 16 16 9 9 9 16 16 16 16 16 5 5 5
6.8
Raleigh
Piedmont Electric
Membership
Corporation
6 6 6 6 6 6 14 14 14 14 6 6 6 16 16 16 16 16 6 6 6 6 6 6 7.3
Sacramento Sacramento Municipal
Utility District
8 8 8 8 8 8 8 9 9 9 8 8 8 8 14 14 14 15 15 15 8 8 8 8 9.4
San Diego San Diego Gas and
Electric
15 15 15 15 15 17 17 17 17 17 17 17 22 22 22 22 22 22 22 22 17 17 17 17 15.5
San Francisco Pacific Gas and Electric
Company
6 6 6 6 6 6 6 9 9 9 9 9 9 9 16 16 16 18 18 18 18 9 9 9 7.6
San Jose Pacific Gas and Electric
Company
5 5 5 5 5 5 5 8 8 8 8 8 8 8 15 15 15 17 17 17 17 8 8 8 6.6
Tucson Tucson Electric Power 6 6 6 6 6 6 8 8 8 8 6 6 7 7 9 9 9 12 10 10 9 6 6 6
7.3
Tulsa Public Service Company
of Oklahoma
6 6 6 6 6 6 6 6 6 6 6 6 6 6 8 8 8 8 8 6 6 6 6 6 6.8
Virginia Beach Dominion Virginia Power 5 5 5 5 5 5 5 11 11 11 11 8 8 8 8 8 8 14 14 14 14 8 5 5
6.5
Washington,
DC Pepco
15 15 15 15 15 15 15 15 15 15 15 15 15 15 15 15 15 15 15 15 15 15 15 15 15.5
*Average rate is calculated using the charge profile described in the methodology.
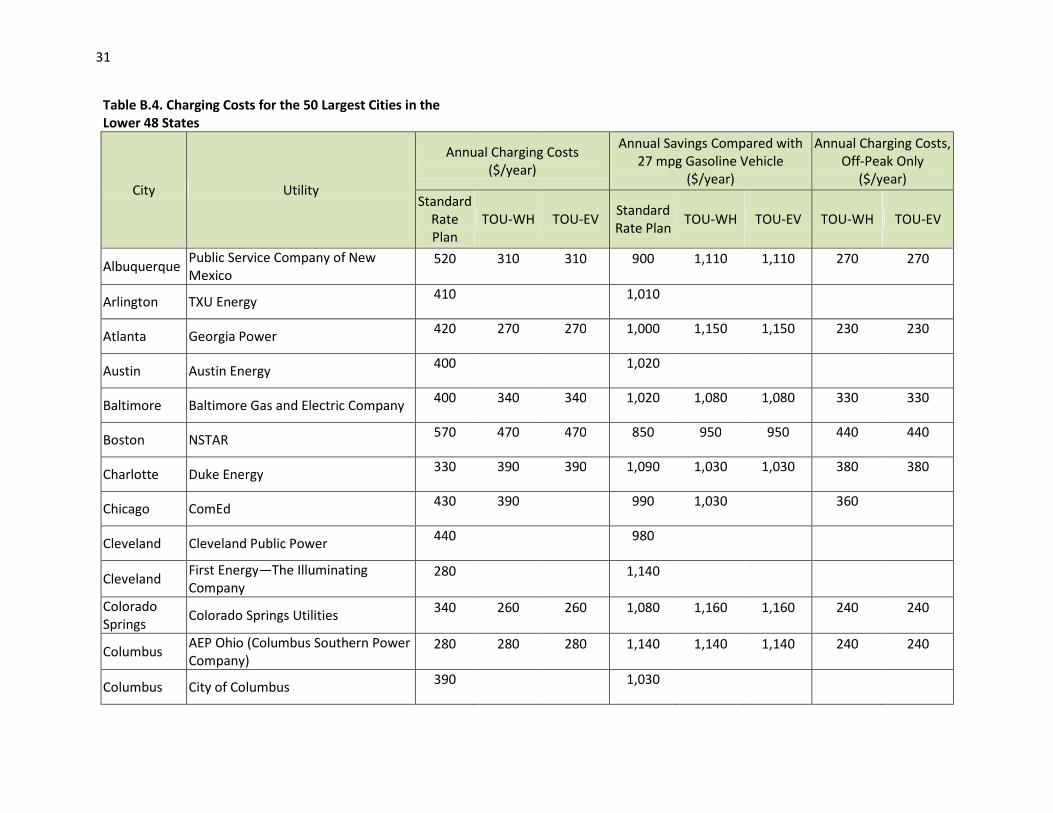
31
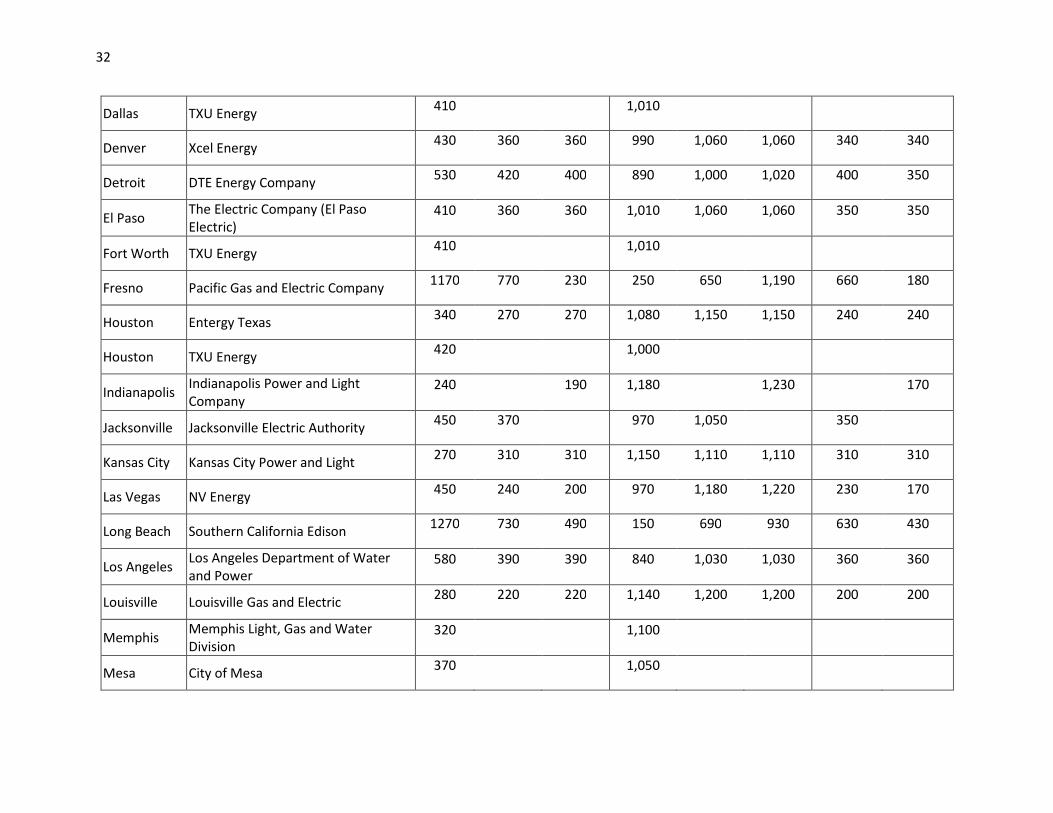
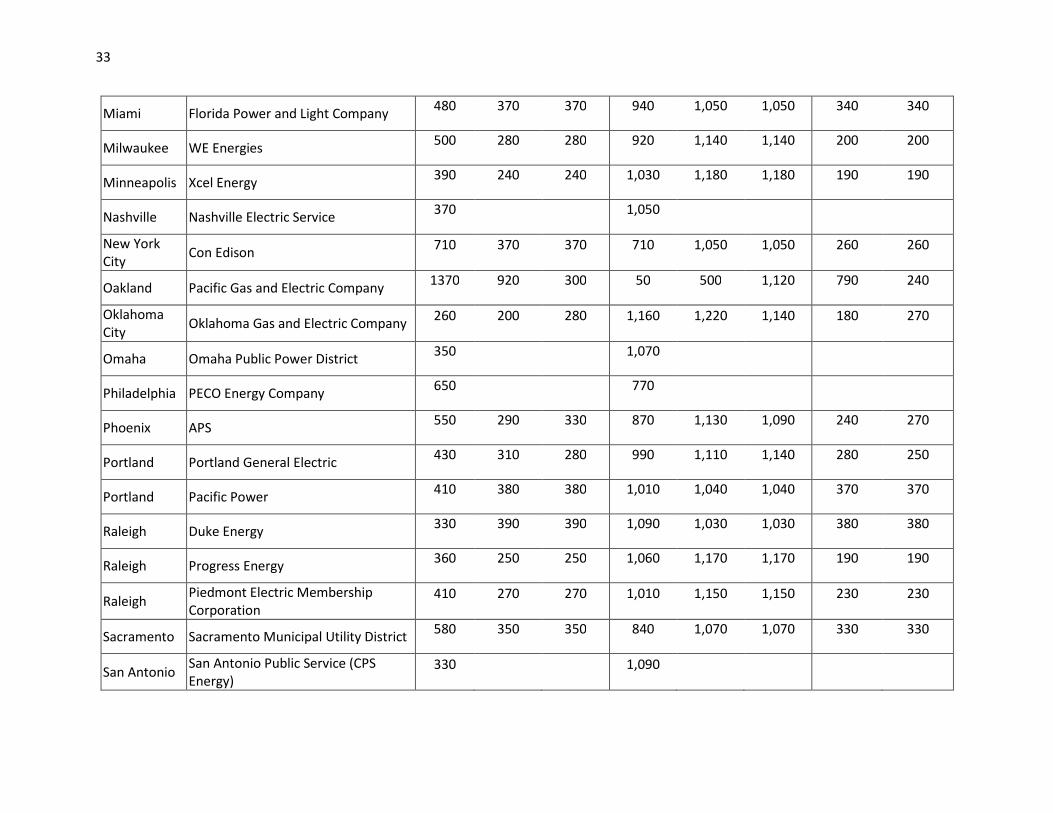
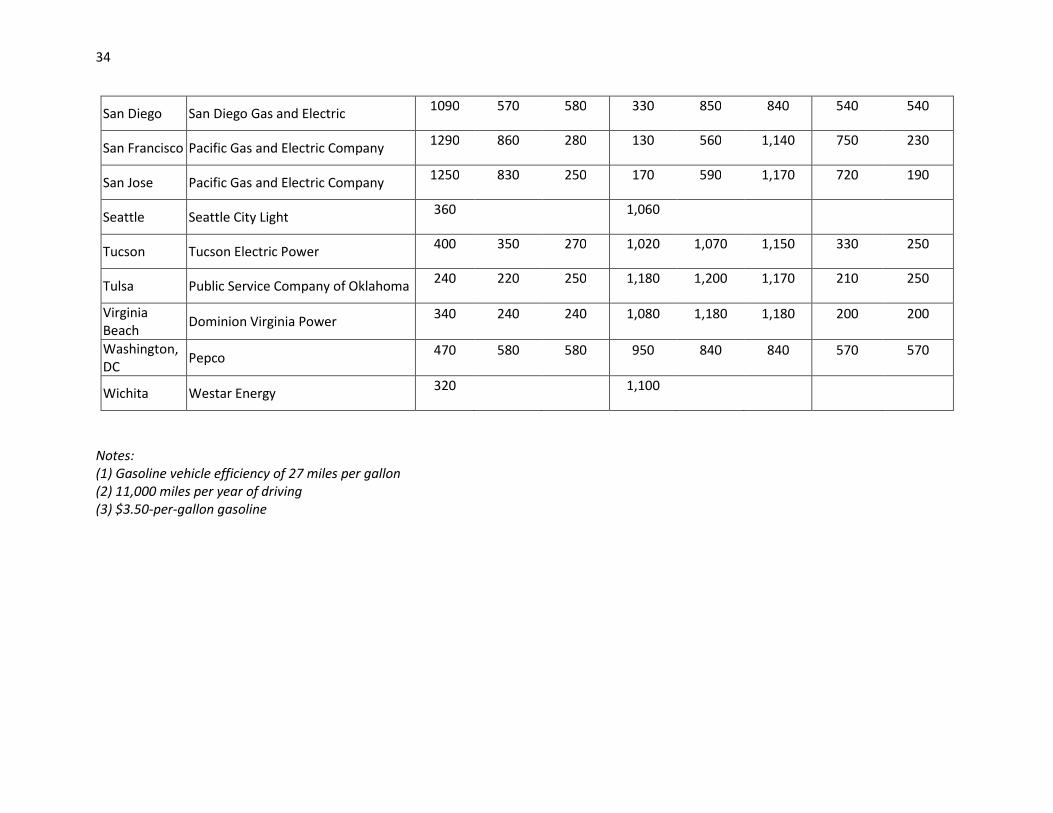
Table B.4. Charging Costs for the 50 Largest Cities in the
Lower 48 States
City Utility
Annual Charging Costs
($/year)
Annual Savings Compared with
27 mpg Gasoline Vehicle
($/year)
Annual Charging Costs,
Off-Peak Only
($/year)
Standard
Rate
Plan
TOU-WH TOU-EV Standard
Rate Plan TOU-WH TOU-EV TOU-WH TOU-EV
Albuquerque Public Service Company of New
Mexico 520 310 310 900 1,110 1,110 270 270
Arlington TXU Energy 410
1,010
Atlanta Georgia Power 420 270 270 1,000 1,150 1,150 230 230
Austin Austin Energy 400
1,020
Baltimore Baltimore Gas and Electric Company 400 340 340 1,020 1,080 1,080 330 330
Boston NSTAR 570 470 470 850 950 950 440 440
Charlotte Duke Energy 330 390 390 1,090 1,030 1,030 380 380
Chicago ComEd 430 390
990 1,030
360
Cleveland Cleveland Public Power 440
980
Cleveland First Energy—The Illuminating
Company 280
1,140
Colorado
Springs Colorado Springs Utilities
340 260 260 1,080 1,160 1,160 240 240
Columbus AEP Ohio (Columbus Southern Power
Company) 280 280 280 1,140 1,140 1,140 240 240
Columbus City of Columbus 390
1,030
32
Dallas TXU Energy 410
1,010
Denver Xcel Energy 430 360 360 990 1,060 1,060 340 340
Detroit DTE Energy Company 530 420 400 890 1,000 1,020 400 350
El Paso The Electric Company (El Paso
Electric) 410 360 360 1,010 1,060 1,060 350 350
Fort Worth TXU Energy 410
1,010
Fresno Pacific Gas and Electric Company 1170 770 230 250 650 1,190 660 180
Houston Entergy Texas 340 270 270 1,080 1,150 1,150 240 240
Houston TXU Energy 420
1,000
Indianapolis Indianapolis Power and Light
Company 240
190 1,180
1,230
170
Jacksonville Jacksonville Electric Authority 450 370
970 1,050
350
Kansas City Kansas City Power and Light 270 310 310 1,150 1,110 1,110 310 310
Las Vegas NV Energy 450 240 200 970 1,180 1,220 230 170
Long Beach Southern California Edison 1270 730 490 150 690 930 630 430
Los Angeles Los Angeles Department of Water
and Power 580 390 390 840 1,030 1,030 360 360
Louisville Louisville Gas and Electric 280 220 220 1,140 1,200 1,200 200 200
Memphis Memphis Light, Gas and Water
Division 320
1,100
Mesa City of Mesa 370
1,050
33
Miami Florida Power and Light Company 480 370 370 940 1,050 1,050 340 340
Milwaukee WE Energies 500 280 280 920 1,140 1,140 200 200
Minneapolis Xcel Energy 390 240 240 1,030 1,180 1,180 190 190
Nashville Nashville Electric Service 370
1,050
New York
City Con Edison
710 370 370 710 1,050 1,050 260 260
Oakland Pacific Gas and Electric Company 1370 920 300 50 500 1,120 790 240
Oklahoma
City Oklahoma Gas and Electric Company
260 200 280 1,160 1,220 1,140 180 270
Omaha Omaha Public Power District 350
1,070
Philadelphia PECO Energy Company 650
770
Phoenix APS 550 290 330 870 1,130 1,090 240 270
Portland Portland General Electric 430 310 280 990 1,110 1,140 280 250
Portland Pacific Power 410 380 380 1,010 1,040 1,040 370 370
Raleigh Duke Energy 330 390 390 1,090 1,030 1,030 380 380
Raleigh Progress Energy 360 250 250 1,060 1,170 1,170 190 190
Raleigh Piedmont Electric Membership
Corporation 410 270 270 1,010 1,150 1,150 230 230
Sacramento Sacramento Municipal Utility District 580 350 350 840 1,070 1,070 330 330
San Antonio San Antonio Public Service (CPS
Energy) 330
1,090
34
San Diego San Diego Gas and Electric 1090 570 580 330 850 840 540 540
San Francisco Pacific Gas and Electric Company 1290 860 280 130 560 1,140 750 230
San Jose Pacific Gas and Electric Company 1250 830 250 170 590 1,170 720 190
Seattle Seattle City Light 360
1,060
Tucson Tucson Electric Power 400 350 270 1,020 1,070 1,150 330 250
Tulsa Public Service Company of Oklahoma 240 220 250 1,180 1,200 1,170 210 250
Virginia
Beach Dominion Virginia Power
340 240 240 1,080 1,180 1,180 200 200
Washington,
DC Pepco
470 580 580 950 840 840 570 570
Wichita Westar Energy 320
1,100
Notes: (1) Gasoline vehicle efficiency of 27 miles per gallon
(2) 11,000 miles per year of driving (3) $3.50-per-gallon gasoline

35
See the main report for references.