Embed Size (px)
Citation preview
IZA DP No. 1231
Where Immigrants Settle in the United States
Barry R. ChiswickPaul W. Miller
DI
SC
US
SI
ON
PA
PE
R S
ER
IE
S
Forschungsinstitutzur Zukunft der ArbeitInstitute for the Studyof Labor
August 2004
Where Immigrants Settle
in the United States
Barry R. Chiswick University of Illinois at Chicago
and IZA Bonn
Paul W. Miller University of Western Australia
Discussion Paper No. 1231 August 2004
IZA
P.O. Box 7240 53072 Bonn
Germany
Phone: +49-228-3894-0 Fax: +49-228-3894-180
Email: [email protected]
Any opinions expressed here are those of the author(s) and not those of the institute. Research disseminated by IZA may include views on policy, but the institute itself takes no institutional policy positions. The Institute for the Study of Labor (IZA) in Bonn is a local and virtual international research center and a place of communication between science, politics and business. IZA is an independent nonprofit company supported by Deutsche Post World Net. The center is associated with the University of Bonn and offers a stimulating research environment through its research networks, research support, and visitors and doctoral programs. IZA engages in (i) original and internationally competitive research in all fields of labor economics, (ii) development of policy concepts, and (iii) dissemination of research results and concepts to the interested public. IZA Discussion Papers often represent preliminary work and are circulated to encourage discussion. Citation of such a paper should account for its provisional character. A revised version may be available directly from the author.
IZA Discussion Paper No. 1231 August 2004
ABSTRACT
Where Immigrants Settle in the United States∗
This paper is concerned with the location of immigrants in the United States, as reported in the 1990 Census. Where they settle has implications for the economic, social and political impact of immigrants. Immigrants are highly geographically concentrated. Compared to the native born they are more likely to live in the central parts of Metropolitan Areas in “gateway (major international airport) cities” in six states (California, New York, Texas, Florida, New Jersey and Illinois). The shift away from the east coast metropolitan areas to California reflects the change in the origins of immigrants from Europe/Canada to Asia, Mexico and other parts of Latin America. Differences by linguistic origin and period of arrival are also considered. JEL Classification: J15, J61, R21 Keywords: immigrants, residential location, language Corresponding author: Barry R. Chiswick Department of Economics (M/C 144) University of Illinois at Chicago 601 South Morgan Street (Room 2103 UH) Chicago, IL 60607-7121 USA Email: [email protected]
∗ Partial support for this project was provided by a HUD/Urban Institute grant for research on the impact of immigration on housing markets.
1
I. INTRODUCTION
A common characteristic of immigrants in various destinations and in various
time periods is that they tend to be geographically concentrated.1 Immigrants from a
particular origin tend to live in areas where others from the same origin live, rather than
distributing themselves across the regions of the destination in the same proportion as the
native-born population. The result of this tendency to settle among others from their
country of origin is the formation of ethnic concentrations or ethnic enclaves.
If these geographic concentrations were without consequences they would be of
little interest. Yet, they do have consequences.2 The geographic concentration appears to
have adverse effects on immigrants acquiring destination language skills, but they may
have favorable effects on immigrant groups maintaining and passing on to their children
their mother tongue and ethnic culture. Enclaves may facilitate immigrant
entrepreneurship, although they appear to depress the nominal earnings of immigrants.
Enclaves have an effect on the demand for “ethnic goods”, as well as on the demand for
publicly provided goods and services.3 Enclaves affect the demand for housing among
1 For econometric studies of the location choice of immigrants in the U.S. see Bartel (1989), Funkhouser (2000) and Zavodny (1999). For econometric analyses of the location choice of immigrants in Australia and Canada, see Chiswick, Lee and Miller (2001) and McDonald (2002), respectively. For an analysis of the residential patterns of the population of the U.S., without regard for nativity, see Frey (1995). 2 See, for example, Case and Katz (1991), Chiswick and Miller (1995, 2000), Goddard, Sparkes and Haydon (1985), Le (1999), and Veltman (1983). 3 “Ethnic goods” are market and non-market goods and services consumed by members of an immigrant or ethnic group that are not consumed, or not consumed in the same manner or to the same extent, by members of other groups. These include ethnic churches and marriage markets, as well as food, clothing, and festivals specific to immigrant or ethnic groups. For the development and an application of this concept, see Chiswick and Miller (2000).
2
immigrants and are sometimes associated with slum or ghetto neighborhoods. Finally,
enclaves may affect the political strength of immigrant groups at local and national
levels. Even a small immigrant group may be able to wield considerable political
influence if it is strategically located in the host country.
The purpose of this paper is to analyze immigrant concentrations in the United
States in comparison to the native born. It does this using a very large sample from the
1990 Census Public Use Microdata file, a one percent sample of the population.4
II. DISTRIBUTION ACROSS STATES
Perhaps the easiest way of illustrating the way immigrants are geographically
concentrated in the United States is to consider their distribution across the States. One of
the factors that research has shown as being important in influencing the settlement
pattern of immigrants is language spoken at home. The Spanish language is so dominant
among the languages other than English spoken at home in the U.S. it is analyzed
separately from all other languages (see, for example, Chiswick and Miller, 1996, Table
2). In 1990, about 80 percent of the foreign-born population in the United States age five
and over spoke a language other than or in addition to English at home (Table 1). Of
those who did so, nearly half spoke Spanish, and are primarily immigrants from Mexico,
Central and South America and the Caribbean. The next most frequently spoken
language was French, but it constitutes only about five percent of the non-English
4 Excluded from the analysis are those born in Puerto Rico or other Outlying Areas of the United States or born abroad of American parents. At the time of the completion of this paper the Public Use Microdata Sample from the 2000 Census was not available. Anecdotal evidence suggests that the trends reported here have continued in the 1990’s.
3
speaking immigrants. The French speakers had a variety of origins, Quebec, Haiti,
France, North Africa, etc. In contrast, only about seven percent of the adult population
born in the United States spoke another language at home.
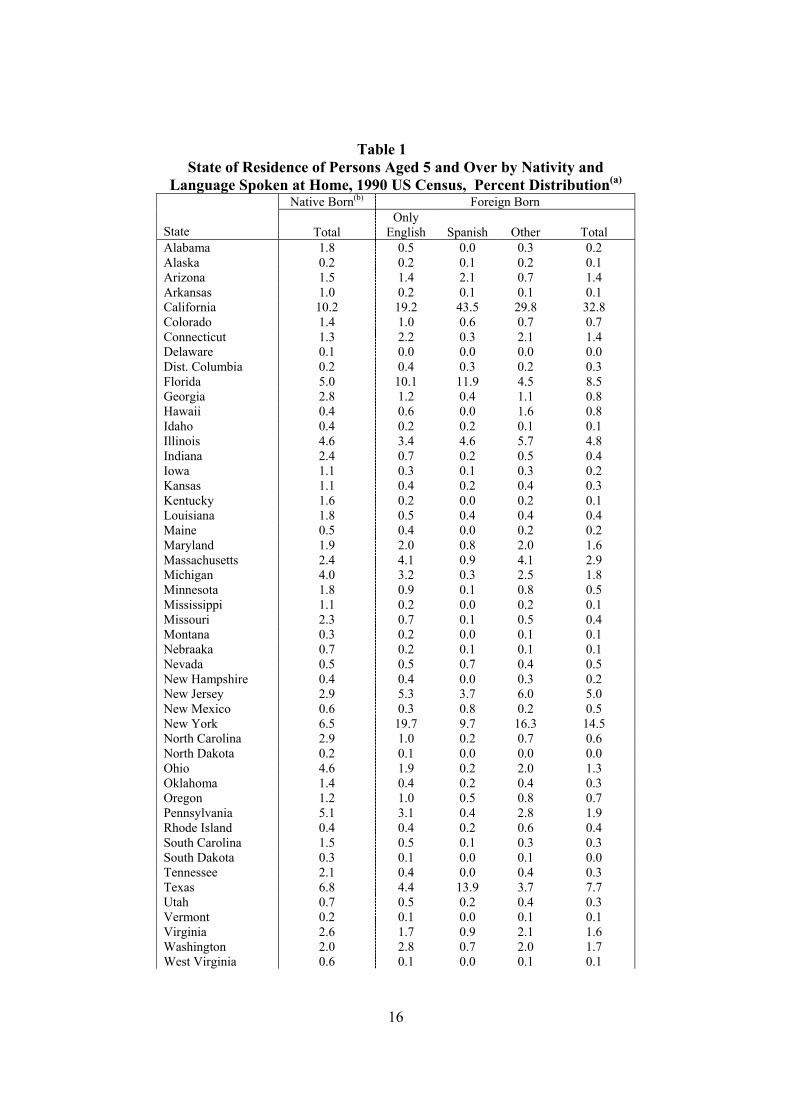
Table 1 lists the distribution of the native born and the foreign born across the
states of the United States. For the foreign born there are three sub-groups: those who
speak only English, those who speak Spanish at home and those who speak a language
other than English or Spanish at home. Totals for the foreign born are also presented.
The distribution of the native born across states serves as the benchmark against
which concentrations of the foreign born may be assessed. It is seen that, according to
the 1990 Census, 10.2 percent of the native born live in California, 6.5 percent in New
York, 6.8 percent in Texas, and close to 5.0 percent in each of Florida, Illinois and
Pennsylvania. Thus, 36 percent of the native born live in these six states. In
comparison, almost one-third of the foreign born live in California (32.8 percent), 14.5
percent live in New York, 7.7 percent in Texas and 8.5 percent in Florida. These four
states are thus home to 64 percent of the foreign born. A further 5.0 percent of the
foreign born live in New Jersey and 4.8 percent in Illinois. Thus, the six states with the
largest number of the foreign born account for close to three quarters (74 percent) of all
foreign-born residents in the U.S. in 1990. Hence, the first fact to emerge from this
analysis is that immigrants are highly geographically concentrated compared to the
native born. Moreover, they are concentrated in or near the major international (airport)
gateways for entry into the U.S. (New York, Los Angeles, San Francisco, Chicago and
Miami).
4
It is also known that the “Big 6” immigrant states, California, Texas, New York,
Florida, Illinois and New Jersey, have high concentrations of foreign language speakers.
Chiswick and Miller (1996, Table 3), for example, show that these states account for
almost three-fourths of native-born Spanish speakers. It is therefore of interest to assess
the extent of the geographic concentration of the foreign born according to the language
spoken at home. This may show whether the geographic concentration at the aggregate
level is simply a “gateway” effect, that is, immigrants who speak only English are as
geographically concentrated as those who speak other languages at home. Or whether the
geographic concentration is more likely to have its origin in the geographic concentration
of foreign language speakers, that is, the geographic concentration of immigrants who
speak only English is less intense than for those who speak other languages a home.
Approximately 21 percent of the foreign born speak only English, 38 percent speak
Spanish at home and 41 percent speak another language at home.
The data in Table 1, column 2 for the foreign born who speak only English show
that while there is a high degree of geographic concentration among this group of the
foreign born, it is less intense than for foreign language speakers. For example, 62
percent of immigrants who speak only English live in the Big 6 immigrant states,
compared to around 74 percent for all the foreign born and 36 percent for the native born.
Fully 87 percent of the foreign born who speak Spanish at home are located in these six
states, for the immigrants who speak a language other than English or Spanish at home,
66 percent are located in the above six states. Clearly, both gateway and language
factors are important in determining the location of immigrants.
5
Yet these data also show that the states differ in importance as destinations for the
foreign born according to their language usage. For example, whereas 57 percent of
immigrant Spanish speakers live in California and Texas, only 24 percent of the
monolingual English-speaking immigrants and 17 percent of the native born live in these
two states. Whereas 10 percent of foreign-born Spanish speakers live in New York, and a
further 4 percent in New Jersey, 20 percent of the foreign born who speak only English
live in New York and a further 5 percent live in New Jersey. For the foreign born who
speak a language other than English or Spanish at home, 16 percent live in New York and
6 percent in New Jersey. Similarly, Florida has high proportions of immigrants who
speak either only English (10 percent of the U.S. population of this group) or Spanish (12
percent), but relatively low proportions of the foreign born who speak another language
at home. Both New York and New Jersey have relatively high proportions of the native-
born who speak languages other than English or Spanish at home. This suggests that
knowledge of the language mix of all residents in a location is required in order to
understand the location decisions of immigrants.5
5 This has been the basis of research on the effects of immigrant concentrations on dominant language skills (see Chiswick and Miller 2000). In this research, a key focus is on the impact of minority language concentrations. It would appear that the same type of factor would be useful in the analysis of where immigrants locate.
6
III. RURAL-URBAN DISTINCTION
Immigrants’ choice of location will extend over regional dimensions other than
the state of residence. Immigrants live in rural or urban areas, and, if in an urban area,
different parts of the city.
The Census Bureau defined “urban” in the 1990 Census as comprising all
territory, population and housing units in “urbanized areas” and in places of 2,500 or
more persons outside urbanized areas. Rural-farm areas comprise all rural households
and housing units on farms (places from which $1,000 or more of agricultural products
were sold in 1989). Rural non-farm comprises the remaining rural units. Table 2 lists
data on the distribution of immigrants by location defined by “urban”, “rural-farm” and
“rural-non farm”.
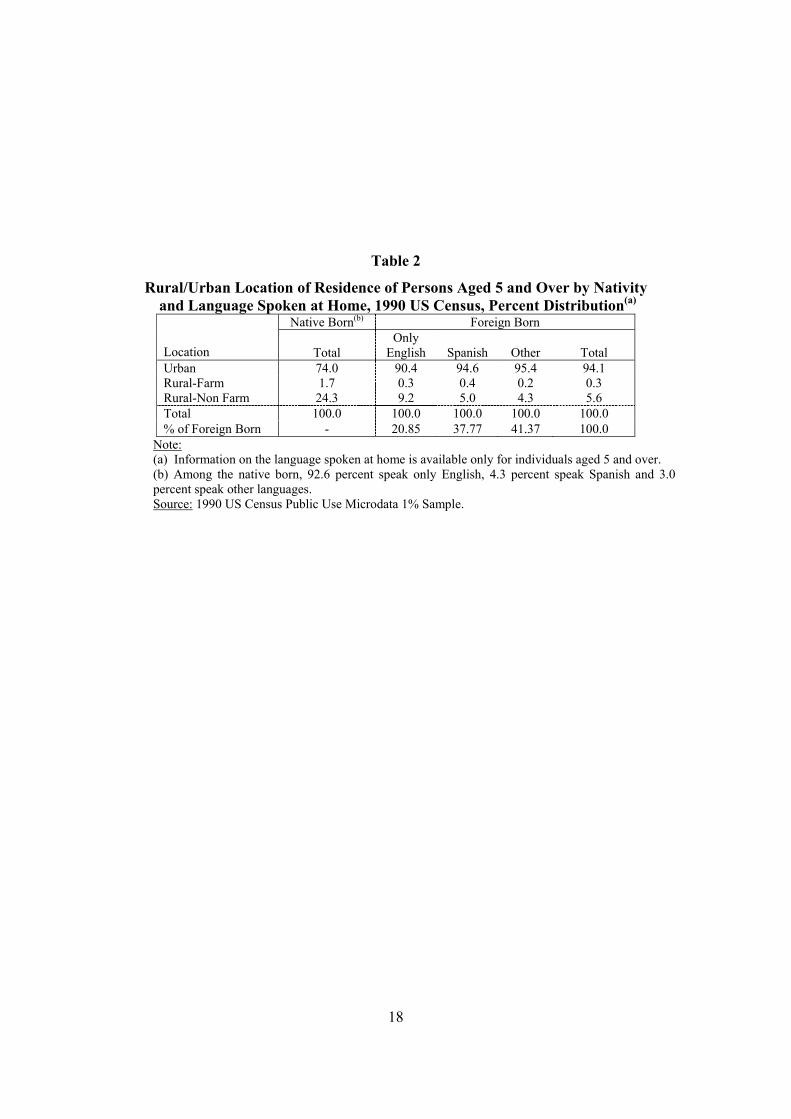
According to the data presented in Table 2, 74 percent of the native-born
population aged 5 or more lived in urban areas in 1990. Only around 2 percent lived on
farms, with the remaining 24 percent living in rural non-farm areas. In comparison, the
foreign born are much more likely to live in an urban area. Fully 94 percent of the total
foreign born live in urban areas. This higher degree of urbanization is observed for each
of the three sub-groups of the foreign born identified by language spoken at home in the
table. Thus, 90 percent of immigrants who speak only English live in urban areas, as do
around 95 percent of those who speak Spanish and those who speak other languages at
home. The higher degree of urbanization or concentration in urban areas of the foreign-
born who speak languages other than English at home supports the view that immigrants
choose their location partly on the basis of the presence of those with whom they share a
mother tongue. Concentrations of these origin language speakers are much more likely to
be found in urban areas. Hence, Table 2 shows that there is a higher degree of
7
urbanization among the foreign born, and this tendency to concentrate in urban areas is
more intense among those who speak a language other than English at home.
IV. THE ROLE OF TYPE OF AREA
It is apparent that the measured degree of geographic concentration of immigrants
varies according to the concept of region upon which the analysis is based. When the
State is the unit of analysis, quite high degrees of geographic concentration are recorded.
Even higher degrees of concentration are recorded with simple measures of urbanization.
The Census provides additional information on the type of area in which individuals live,
and this information can be used to explore further the idea that immigrants are
geographically concentrated.
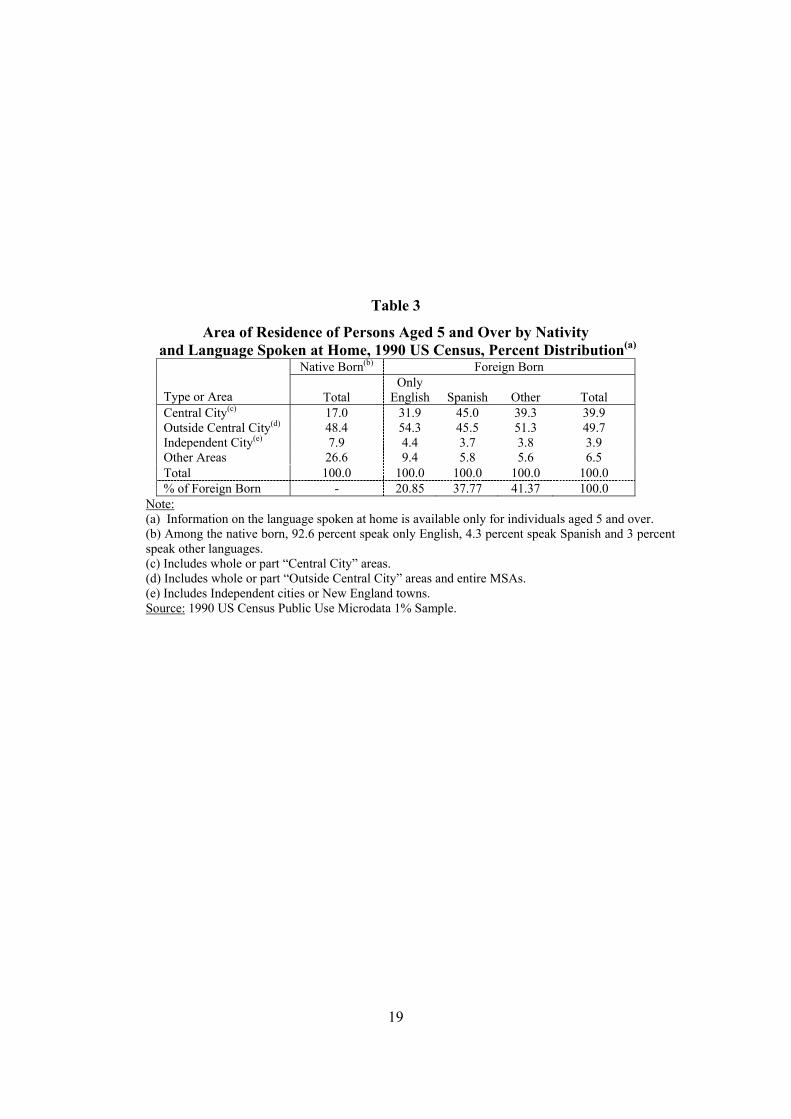
One of the areas identified in the census is the Metropolitan Area (MA), which is
defined as a large population nucleus, together with adjacent communities that have a
high degree of economic and social integration with that nucleus. The territory,
population and housing units in MAs are referred to as “metropolitan”. The metropolitan
category is subdivided into “inside central city” and “outside central city”. The
territory, population and housing units outside the MAs are referred to as “non-
metropolitan”. MAs are composed of counties in all regions other than New England; in
New England they are composed of cities and towns. These data permit the following
areas to be distinguished: Central City; MA Outside Central City; Independent city or
New England Town; Other areas.
Table 3 reveals that 17 percent of the native born live in central city areas, 48
percent in metropolitan areas outside the central city, 8 percent in independent cities and
8
27 percent in other areas. In comparison, the foreign born are more likely to cluster in
central city areas (40 percent), though they are just as likely as the native born to live in
metropolitan areas outside the central city (50 percent). This tendency towards
clustering in the central city areas is more intense among the foreign born who speak a
language other than English at home, with 45 percent of those who speak Spanish at
home and 39 percent of those who speak a language other than English or Spanish at
home living in central city areas, compared to only 32 percent for English-only speakers.
These data show, therefore, that immigrants are concentrated over a range of
geographic dimensions, especially in the central city of Metropolitan areas in the “Big
6” states, with the intensity greater for those who speak a language other than English at
home.
V. LOCATION AND DURATION OF RESIDENCE OF THE FOREIGN BORN
In empirical research on the integration of immigrants into the U.S. economy,
duration of residence in the United States is generally used as a yardstick for the degree
of assimilation (Chiswick, 1978). The longer the immigrants have lived in the United
States, the more assimilated, or like the native born, they generally become. This is
particularly the case when measures of economic success, such as earnings, employment
or occupational status, are examined. It is of interest, therefore, to see if the length of
residence is related to the degree of regional concentration of the foreign born. The data
for this analysis are presented in Table 4. Only the six states with the largest number of
the foreign born are separately identified in Table 4. Five period of arrival categories are
distinguished for the foreign born. It is seen that by the time of the Census in April 1990,
9
almost one-quarter of the foreign born arrived in the U.S. in the period 1985-90. The
proportional representation in the three other five-year intervals of 1980-84, 1975-79 and
1970-74 are 19 percent, 14 percent and 11 percent, respectively. The remaining
immigrants (32 percent) arrived before 1970.
As noted above, whereas one-third of the native born live in the six states
separately identified in Table 4, almost three-quarters of the foreign-born live in these
states. While there is some variation in the proportion of the foreign born living in the
six states for each of the arrival cohorts in Table 4, the proportion is relatively high for
each group, ranging from 78 percent for the 1980-1985 cohort to 67 percent for the
“Before 1970” cohort.
Examination of the percentage representation of the foreign-born in each of the
six major immigrant-receiving states for each of the arrival cohorts shows two main
patterns. The first pattern is that there has been a slight decline in the percentage of
immigrants locating in Florida or New York/New Jersey between the “Before 1970”
arrival cohort and other arrival cohorts. The second pattern is that there has been a
rise in the proportion of immigrants locating in California since 1970.
These patterns could be due to a number of factors. First, economic conditions in
the states may have varied over time so that California was a relatively more prosperous
state, and hence a more popular destination for the foreign born in the 1970’s, 1980’s and
1990’s than before 1970. Second, modes of transport have changed. Whereas many
immigrants would have arrived by sea before 1970, most will have arrived by air since
the 1980s. Major seaports, especially New York Harbor, have declined in relative
importance as a destination for immigrants. Third, the patterns may be a consequence of
10
variations across states and across time in the relative availability of public infrastructure
and in the affordability of housing. Fourth, the data may be a reflection of internal
migration. That is, immigrants may move from their state of initial settlement. For
example, this may reflect the movement of the pre-1970 immigrants who upon becoming
aged often moved to Florida. Fifth, and perhaps most importantly, the countries of origin
of the immigrants to the U.S. have changed in recent decades (see Chiswick and Sullivan
1995 for a discussion).
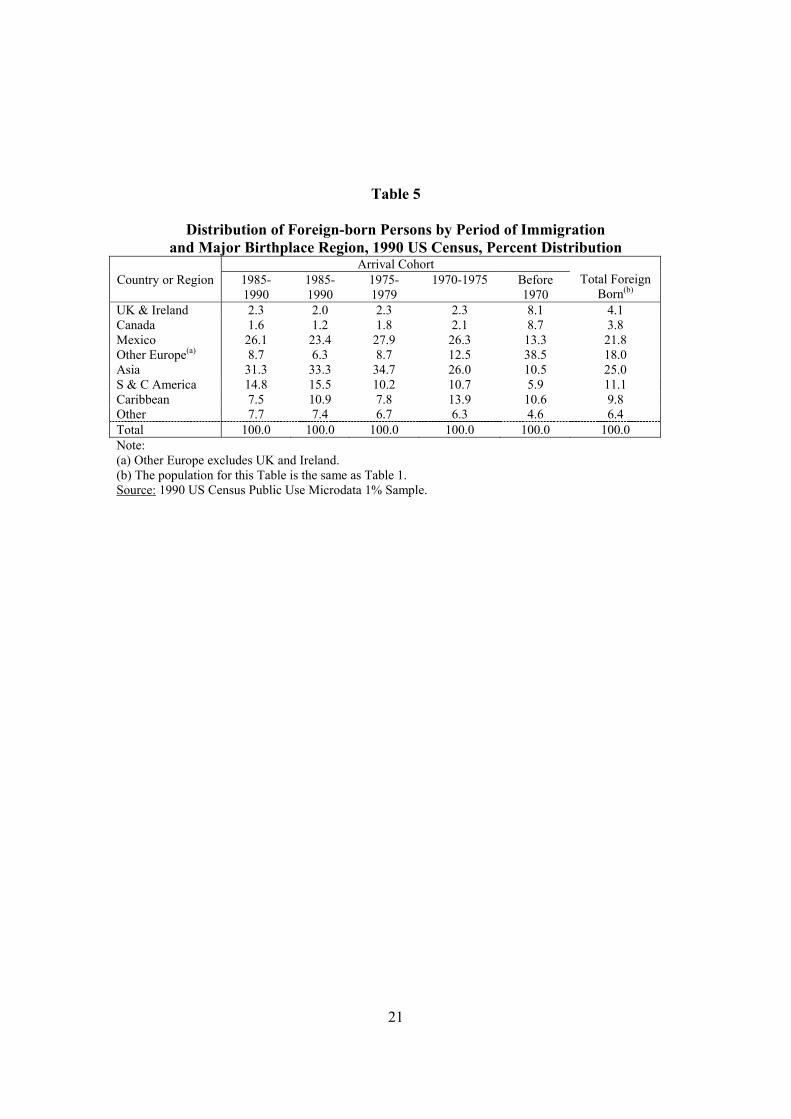
Some data on the birthplace mix of the immigrants are presented in Table 5.
Immigrants in the “Before 1970” cohort are mostly from the area referred to as Other
Europe (39 percent), the British Isles (8 percent), Canada (9 percent) and Mexico (13
percent).6 The 1970s and 1980s and into the 1990s have seen a strong growth in the
importance of Asia, Mexico and South and Central America as immigrant source regions,
and a decrease in the relative importance of immigrants from the UK and Ireland,
Canada and Other Europe. Among the immigrants who arrived over the period 1985-
1990, 31 percent were from Asia (compared to 11 percent in the “Before 1970” cohort),
26 percent from Mexico (13 percent in the “Before 1970” cohort) and 15 percent from
South and Central America (6 percent in the “Before 1970” cohort). Only 9 percent of
this arrival cohort were from Other Europe (compared to 39 percent for the “Before 1970
cohort”), 2 percent from the UK and Ireland (8 percent in the “Before 1970” cohort), and
1.6 percent from Canada (9 percent in the “Before 1970” cohort).
2.4
6 The main threshold period in terms of the countries of origin of the immigrants in the U.S. data is associated with the Immigration and Nationality Act of 1965, which abolished discriminatory “national origins” restrictions on migration that disadvantaged potential immigrants from Southern and Eastern Europe and especially from Asia.
11
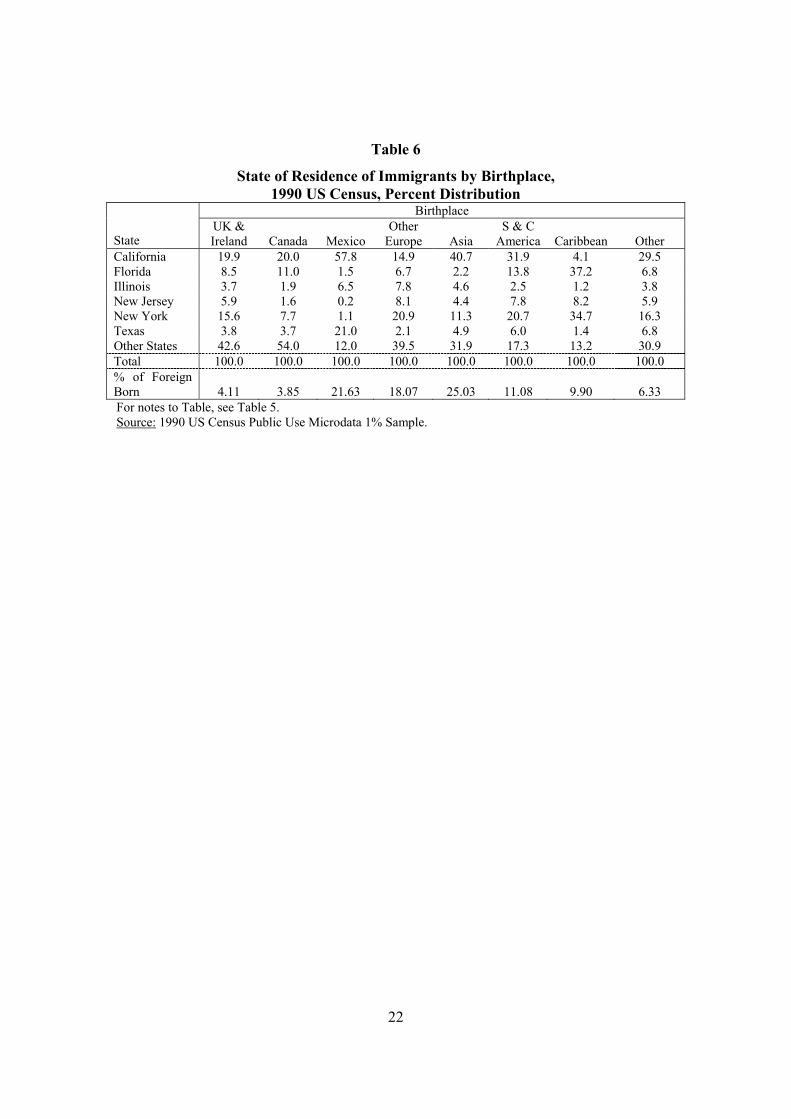
2.5 LOCATION AND BIRTHPLACE
Given the size of these shifts in the country of origin of the immigrants, the
change in birthplace mix would impact on the data on state of residence by arrival cohort.
Table 6 lists data on the distribution across state of residence for the world divided into
eight birthplace regions. Only the eight birthplace regions identified in Table 5 are
considered. The state detail is limited to the six states identified above as the destination
for three-quarters of all immigrants, plus all other states combined.
It is apparent from Table 6 that the extent of geographic concentration by state
varies by birthplace group. At the most aggregate level, the concentration among
immigrants from the British Isles and Canada is quite low, with 43 percent of immigrants
from the UK and Ireland living outside the Big 6 states, and 54 percent of immigrants
from Canada living in states other than these six. In comparison, only 12 percent of
immigrants from Mexico, 13 percent of those from the Caribbean and 17 percent of those
from South and Central America live in states other than the Big 6 immigrant
destinations.
Consider immigrants from Mexico. Almost 60 percent live in California. A
further 21 percent live in Texas. The other two states that border Mexico (Arizona and
New Mexico) are, respectively, home to only 3.3 percent and 1.3 percent of immigrants
from Mexico (1.5 percent of the native born live in Arizona and 0.6 percent in New
Mexico). Hence, 83 percent of immigrants from Mexico are found in the four states that
border Mexico. This compares with just 19 percent of the native-born population. Thus,
although this clustering of Mexican immigrants involves a complex set of factors,
proximity to the origin country appears to be very important.
12
Among immigrants from the Caribbean, 37 percent live in Florida, while 43
percent live in the other eastern seaboard states in Table 6, New York and New Jersey.
Only 4 percent live in California. Immigrants from South and Central America are
concentrated in California (32 percent), New York (21 percent) and Florida (14 percent).
It is interesting to note that the Asian immigrants, who have dominated recent
immigration flows, are also heavily concentrated in California (41 percent are located
there).
The geographic distance between the country of origin and the states in the
United States, as well as ports of entry, are important to immigrants’ location decisions.
Summary and Conclusions This paper shows that there is both an intense geographic concentration of
immigrants in the United States, and that where in the United States immigrants settle
does matter.
It has identified several key findings:
1) Immigrants are highly geographically concentrated compared to the
native-born population in six states: California, New York, Texas,
Florida, New Jersey and Illinois.
2) This distribution of the foreign born is not independent of language
usage as the concentration is more intense among those who speak a
language other than English at home.
13
3) Being a gateway (major international airport) city, proximity to the
country of origin, and the language characteristics of an area, as well as
job opportunities, influence location choice.
4) There is a higher degree of urbanization among the foreign born than
among the native born, and among the foreign born this is more intense
among those who speak a language other than English at home.
5) The foreign born are more likely to live in the Central City in
Metropolitan areas and equally likely to live outside central cities in
Metropolitan areas compared to the native born. The intensity of
residence in Central cities is greater for those who speak a language
other than English at home. The foreign born are less likely to live
outside Metropolitan areas or in rural areas.
6) Examined by cohort of arrival there has been a shift among more recent
immigrant cohorts away from New York/New Jersey and Florida and
toward California.
7) There has been a sharp increase in immigration in recent decades from
Latin America (especially Mexico) and Asia and a decrease from
Europe and Canada. This can, in part, account for the change in the
state of residence of the more recent immigrant cohorts.
These patterns of immigrant concentration influence both the life experiences of
immigrants in the United States and their political, social, and economic impact on this
country. Immigrants live disproportionately in the central cities of the metropolitan areas
within six states. Hence, much of their direct impart, including their impact on the
14
health, education, housing and social services provided by government occurs at the local
level of government in a small number of jurisdictions, since these issues are viewed as
primarily local responsibilities in the U.S. Yet, immigration policy, that is policies
regarding the number and characteristics of those lawfully admitted and policies
regarding the enforcement of immigration law, are made at the national level.
As another example, the apportionment across the states of the 435 seats in the
U.S. House of Representatives, and hence the number of votes each state has in the
Electoral College in the Presidential election, is based on the decennial Census count of
all of the people in the state, including both legal and illegal aliens, with a minimum of
one seat per state.7 Moreover, the courts have required a roughly equal number of people
living in each congressional district in states with more than one representative. Thus,
where immigrants live affects the number of representatives for each state. However,
immigrants who are not naturalized citizens do not have the legal right to vote. As a
result, U.S. citizens living in (recent) immigrant concentration areas have a greater voice
in the election process than otherwise identical citizens living in areas with few
immigrants.8
The pattern of immigrant settlement in the United States has implications for other
countries as well. The intense geographic concentration by country of origin in particular
regions in the U.S. is not due to coercion by the government or the hostile actions of the
native-born population. Indeed, because of the free mobility of people within the United 7 Each state has Electoral College votes equal to the number of seats in the House of Representatives plus the two Senate seats. The District of Columbia has three votes. 8 Assume there are approximately M people living in each congressional district, and ki is the proportion of the population in the ith congressional district who are citizens and hence eligible to vote. Then each citizen has 1/Mki share of the vote in that district, or the smaller is ki the larger is each citizen’s relative voting power.
15
States, even the few attempts by the government to encourage a dispersal of new
refugees, such as those from Cuba and Vietnam, have not been successful. Immigrants
choose to live where they do because of the economic, social and cultural factors of their
lives.
Other destination countries also witness a similar desire on the part of their
immigrants to concentrate. In the absence of very strong economic incentives to do
otherwise, immigrant groups in these other liberal democracies will also tend to
concentrate. Yet, as in the United States, the extent of this concentration will diminish
the longer the immigrant group is in the destination and the greater the extent of its
linguistic, social and cultural assimilation.
In the separate countries of Europe it might appear that there is a greater
degree of concentration of people of particular origins in some countries than in others.
Thus, it might appear that some countries “specialize” in Moroccans, others in Turks,
while others in Russians or ethnic Germans, while some countries may have fewer
immigrants. This would appear to be the case in the U.S. as well if the 50 states were
viewed as separate nations. Over time the greater economic and political integration of
the European nations, even if it never reaches the extent of integration of the United
States, will ease the adjustment to immigrant inflows through a greater sharing of both
the burdens (costs) and the benefits of immigration.
16
Table 1 State of Residence of Persons Aged 5 and Over by Nativity and
Language Spoken at Home, 1990 US Census, Percent Distribution(a) Native Born(b) Foreign Born
State
Total
Only English
Spanish
Other
Total
Alabama 1.8 0.5 0.0 0.3 0.2 Alaska 0.2 0.2 0.1 0.2 0.1 Arizona 1.5 1.4 2.1 0.7 1.4 Arkansas 1.0 0.2 0.1 0.1 0.1 California 10.2 19.2 43.5 29.8 32.8 Colorado 1.4 1.0 0.6 0.7 0.7 Connecticut 1.3 2.2 0.3 2.1 1.4 Delaware 0.1 0.0 0.0 0.0 0.0 Dist. Columbia 0.2 0.4 0.3 0.2 0.3 Florida 5.0 10.1 11.9 4.5 8.5 Georgia 2.8 1.2 0.4 1.1 0.8 Hawaii 0.4 0.6 0.0 1.6 0.8 Idaho 0.4 0.2 0.2 0.1 0.1 Illinois 4.6 3.4 4.6 5.7 4.8 Indiana 2.4 0.7 0.2 0.5 0.4 Iowa 1.1 0.3 0.1 0.3 0.2 Kansas 1.1 0.4 0.2 0.4 0.3 Kentucky 1.6 0.2 0.0 0.2 0.1 Louisiana 1.8 0.5 0.4 0.4 0.4 Maine 0.5 0.4 0.0 0.2 0.2 Maryland 1.9 2.0 0.8 2.0 1.6 Massachusetts 2.4 4.1 0.9 4.1 2.9 Michigan 4.0 3.2 0.3 2.5 1.8 Minnesota 1.8 0.9 0.1 0.8 0.5 Mississippi 1.1 0.2 0.0 0.2 0.1 Missouri 2.3 0.7 0.1 0.5 0.4 Montana 0.3 0.2 0.0 0.1 0.1 Nebraaka 0.7 0.2 0.1 0.1 0.1 Nevada 0.5 0.5 0.7 0.4 0.5 New Hampshire 0.4 0.4 0.0 0.3 0.2 New Jersey 2.9 5.3 3.7 6.0 5.0 New Mexico 0.6 0.3 0.8 0.2 0.5 New York 6.5 19.7 9.7 16.3 14.5 North Carolina 2.9 1.0 0.2 0.7 0.6 North Dakota 0.2 0.1 0.0 0.0 0.0 Ohio 4.6 1.9 0.2 2.0 1.3 Oklahoma 1.4 0.4 0.2 0.4 0.3 Oregon 1.2 1.0 0.5 0.8 0.7 Pennsylvania 5.1 3.1 0.4 2.8 1.9 Rhode Island 0.4 0.4 0.2 0.6 0.4 South Carolina 1.5 0.5 0.1 0.3 0.3 South Dakota 0.3 0.1 0.0 0.1 0.0 Tennessee 2.1 0.4 0.0 0.4 0.3 Texas 6.8 4.4 13.9 3.7 7.7 Utah 0.7 0.5 0.2 0.4 0.3 Vermont 0.2 0.1 0.0 0.1 0.1 Virginia 2.6 1.7 0.9 2.1 1.6 Washington 2.0 2.8 0.7 2.0 1.7 West Virginia 0.6 0.1 0.0 0.1 0.1

17
Wisconsin 2.1 0.9 0.2 0.9 0.6 Wyoming 0.2 0.1 0.0 0.0 0.0 Total 100.0 100.0 100.0 100.0 100.0 % of Foreign Born - 20.85 37.77 41.37 100.0
Note: (a) Information on the language spoken at home is available only for individuals aged 5 and over. (b) Among the native born, 92.6 percent speak only English, 4.3 percent speak Spanish and 3.0 percent speak other languages. Source: 1990 US Census Public Use Microdata 1% Sample.
18
Table 2
Rural/Urban Location of Residence of Persons Aged 5 and Over by Nativity and Language Spoken at Home, 1990 US Census, Percent Distribution(a)
Native Born(b) Foreign Born Location
Total
Only English
Spanish
Other
Total
Urban 74.0 90.4 94.6 95.4 94.1 Rural-Farm 1.7 0.3 0.4 0.2 0.3 Rural-Non Farm 24.3 9.2 5.0 4.3 5.6 Total 100.0 100.0 100.0 100.0 100.0 % of Foreign Born - 20.85 37.77 41.37 100.0
Note: (a) Information on the language spoken at home is available only for individuals aged 5 and over. (b) Among the native born, 92.6 percent speak only English, 4.3 percent speak Spanish and 3.0 percent speak other languages. Source: 1990 US Census Public Use Microdata 1% Sample.
19
Table 3
Area of Residence of Persons Aged 5 and Over by Nativity and Language Spoken at Home, 1990 US Census, Percent Distribution(a)
Native Born(b) Foreign Born Type or Area
Total
Only English
Spanish
Other
Total
Central City(c) 17.0 31.9 45.0 39.3 39.9 Outside Central City(d) 48.4 54.3 45.5 51.3 49.7 Independent City(e) 7.9 4.4 3.7 3.8 3.9 Other Areas 26.6 9.4 5.8 5.6 6.5 Total 100.0 100.0 100.0 100.0 100.0 % of Foreign Born - 20.85 37.77 41.37 100.0
Note: (a) Information on the language spoken at home is available only for individuals aged 5 and over. (b) Among the native born, 92.6 percent speak only English, 4.3 percent speak Spanish and 3 percent speak other languages. (c) Includes whole or part “Central City” areas. (d) Includes whole or part “Outside Central City” areas and entire MSAs. (e) Includes Independent cities or New England towns. Source: 1990 US Census Public Use Microdata 1% Sample.
20
Table 4
State of Residence of Persons Aged 5 and Over by Nativity and Duration of Residence, 1990 US Census, Percent Distribution
Native Born
Foreign Born: Arrival Year State
Total
1985-1990
1980-1985
1975-1979
1970-1974
Before 1970
Total
California 10.2 37.7 37.9 40.1 32.1 23.0 32.8 Florida 5.0 7.0 8.6 5.8 8.2 10.8 8.5 Illinois 4.6 4.5 4.1 5.0 5.8 5.0 4.8 New Jersey 2.9 4.7 4.5 4.0 5.8 5.6 5.0 New York 6.5 13.9 13.3 11.7 15.8 16.5 14.5 Texas 6.8 6.8 9.9 10.0 8.4 5.8 7.7 Other States 64.0 25.4 21.6 23.5 23.8 33.3 26.7 Total 100.0 100.0 100.0 100.0 100.0 100.0 100.0 % of Foreign Born
-
23.91
19.39
13.95
10.87
31.89
100.0
Source: 1990 US Census Public Use Microdata 1% Sample.
21
Table 5
Distribution of Foreign-born Persons by Period of Immigration and Major Birthplace Region, 1990 US Census, Percent Distribution
Arrival Cohort Country or Region 1985-
1990 1985-1990
1975-1979
1970-1975 Before 1970
Total Foreign
Born(b) UK & Ireland 2.3 2.0 2.3 2.3 8.1 4.1 Canada 1.6 1.2 1.8 2.1 8.7 3.8 Mexico 26.1 23.4 27.9 26.3 13.3 21.8 Other Europe(a) 8.7 6.3 8.7 12.5 38.5 18.0 Asia 31.3 33.3 34.7 26.0 10.5 25.0 S & C America 14.8 15.5 10.2 10.7 5.9 11.1 Caribbean 7.5 10.9 7.8 13.9 10.6 9.8 Other 7.7 7.4 6.7 6.3 4.6 6.4 Total 100.0 100.0 100.0 100.0 100.0 100.0 Note: (a) Other Europe excludes UK and Ireland. (b) The population for this Table is the same as Table 1. Source: 1990 US Census Public Use Microdata 1% Sample.
22
Table 6
State of Residence of Immigrants by Birthplace, 1990 US Census, Percent Distribution
Birthplace State
UK & Ireland
Canada
Mexico
Other Europe
Asia
S & C America
Caribbean
Other
California 19.9 20.0 57.8 14.9 40.7 31.9 4.1 29.5 Florida 8.5 11.0 1.5 6.7 2.2 13.8 37.2 6.8 Illinois 3.7 1.9 6.5 7.8 4.6 2.5 1.2 3.8 New Jersey 5.9 1.6 0.2 8.1 4.4 7.8 8.2 5.9 New York 15.6 7.7 1.1 20.9 11.3 20.7 34.7 16.3 Texas 3.8 3.7 21.0 2.1 4.9 6.0 1.4 6.8 Other States 42.6 54.0 12.0 39.5 31.9 17.3 13.2 30.9 Total 100.0 100.0 100.0 100.0 100.0 100.0 100.0 100.0 % of Foreign Born
4.11
3.85
21.63
18.07
25.03
11.08
9.90
6.33
For notes to Table, see Table 5. Source: 1990 US Census Public Use Microdata 1% Sample.
23
REFERENCES
Bartel, Ann P., (1989). “Where Do the New U.S. Immigrants Live?” Journal of Labor Economics, Vol. 7, No. 4, pp. 371-391.
Case, Anne C. and Lawrence F. Katz, (1991). “The Company You Keep: The Effects of
Family and Neighborhood on Disadvantaged Youths,” Harvard Institute of Economic Research, Discussion Paper Number 1555.
Chiswick, Barry R., (1978). “The Effect of Americanization on the Earnings of Foreign
Born Men,” Journal of Political Economy, October, pp. 897-922. Chiswick, Barry R., Yew Liang Lee and P.W. Miller (2001). “Geographical
Concentration Among Immigrants in Australia,” Australasian Journal of Regional Studies, Vol. 7, No. 2, 2001, pp.125-150.
Chiswick, Barry R. and Paul W. Miller, (1995). “The Endogeneity Between Language
and Earnings: An International Analysis,” Journal of Labor Economics, Vol. 13, No. 2, pp. 246-288.
Chiswick, Barry R. and Paul W. Miller, (1996). “The Languages of the United States: Who
Speaks What and What it Means,” READ Perspectives, Vol. 3, No. 2, 1996, pp. 5-41.
Chiswick, Barry R. and Paul W. Miller, (2000). “Do Enclaves Matter in Immigrant
Adjustment?” IZA Working Paper, Bonn. Chiswick, Barry R. and Teresa Sullivan (1995). “The New Immigrants,” in Reynolds
Farley, State of the Union: America in the 1990s, Vol. 2, Social Trends, New York. Russell Sage Foundation.
Cutler, David M., Edward L. Glaeser and Jacob L.Vigdor (1999). “The Rise and Decline of
the American Ghetto,” Journal of Political Economy, Vol. 107, No. 3, pp. 455-506. Frey, William H. (1995). “The New Geography of Population Shifts,” in Reynolds Farley,
ed., State of the Union: America in the 1990’s, Volume Two: Social Trends, New York: Russell Sage Foundation, pp. 271-336.
Funkhouser, Edward (2000). “Changes in the Geographic Concentration and Location of
Residence of Immigrants,” International Migration Review, Vol. 34, No. 2, pp. 480-510.
24
Goddard, R.F., L.H. Sparkes and J.A. Haydon, (1985). “Demographic Consequences of Immigration” in Neville R. Norman and Kathryn F. Meikle (eds.,) The Economic Effects of Immigration on Australia, Melbourne: Committee for Economic Development of Australia,” pp.47-161.
Le, Ahn Tram, (1999). “Empirical Studies of Self Employment,” Journal of Economic
Surveys, Vol. 13, No. 4, pp. 381-416. McDonald, James Ted (2002). “The Location Choice of New Immigrants to Canada:
The Role of Ethnic Networks,” Department of Economics, University of New Brunswick, September, mimeo.
Veltman, Calvin (1983). Language Shift in the United States, Berlin: Moulton Publishers. Zavodny, Madeline (1999). “Determinants of Recent Immigrants' Locational Choices,”
International Migration Review, Vol. 33, No. 4, pp.1014-1030.