Embed Size (px)
Citation preview

The Great British Brain DrainWhere graduates move and whyPaul Swinney & Maire WilliamsNovember 2016
About Centre for Cities
Centre for Cities is a research and policy institute, dedicated to improving the economic success of UK cities.
We are a charity that works with cities, business and Whitehall to develop and implement policy that supports the performance of urban economies. We do this through impartial research and knowledge exchange.
For more information, please visit www.centreforcities.org/about
About the author
Paul Swinney is Principal Economist at Centre for Cities
[email protected] / 020 7803 4305
Maire Williams is a Researcher at Centre for Cities
[email protected] / 020 7803 4317
Acknowledgements
The authors would like to thank their colleagues Rebecca McDonald and Gabriele Piazza for their help with the data analysis and former colleagues Elli Thomas and Karen-Marie Wells for their contributions during the early stages of the research.
This work contains statistical data from ONS which is Crown Copyright. The use of the ONS statistical data in this work does not imply the endorsement of the ONS in relation to the interpretation or analysis of the statistical data. This work uses research datasets which may not exactly reproduce National Statistics aggregates.
All views expressed in this report are those of Centre for Cities. All mistakes are the authors’ own.
Picture credits
Cover top left: ‘University of Manchester’ by Giuseppe Moscato. Page 4: ‘Birmingham University’ by Tim Ellis.

1
The Great British Brain Drain • November 2016
www.centreforcities.org
Executive Summary
Attracting and retaining talent is increasingly critical for the success of city economies as the UK continues to specialise in ever more high-skilled, knowledge-intensive activities. And this is a big challenge for many of our cities. While the UK’s great universities are spread around the country, many graduates head straight for the bright lights of the capital after completing their studies.
London is not only more attractive to new graduates generally; it is especially attractive to high achievers. The capital accounts for around 19 per cent of all jobs. But six months after graduation, of the graduates who moved city, London employed 22 per cent of all working new graduates, and 38 per cent of those working new graduates with a first or upper second class degree from a Russell Group university.
Yet there is more nuance to this picture than is generally understood. Cities outside London do retain graduates – but they do not retain most of the students that move to their city to study.
Almost half of new graduates are ‘bouncers’, moving to one city to study, then leaving for another city straight after graduation. In Manchester, for example, 67 per cent of the students who went to study in the city left upon graduation. In Birmingham this figure was 76 per cent. And in Southampton it was 86 per cent. It is these people that drive the migration flows to the capital.
Setting the ‘bouncer’ cohort to one side shows that the majority of cities still experience a graduate brain gain. This is for two reasons. First, they attract more graduates to their city – either graduates who came to study and remain in the city for work, or who move in after graduation for work – than they lose when local people leave the city to work elsewhere as graduates.
Second, universities, to a varying degree, play an important role in cities by ‘growing their own’ – educating students who grew up in the city and who then stay in the city after graduation to work.
The patterns of graduate migration appear to be primarily driven by a mix of short- and long-term job opportunities. The fact that there is no relationship between moving graduates and wages suggests that future career opportunities play an important role in influencing where graduates move to and why.
From a policy perspective, if a city wants to attract and retain a greater number of graduates, then it needs to support economic growth, rather than rely on narrower policies specifically targeted at graduate attraction

2
The Great British Brain Drain • November 2016
www.centreforcities.org
and retention. Cities should aim to support the creation of more jobs, and particularly high-skilled knowledge jobs. This would mean:
• Boosting educational attainment to improve skills throughout the workforce,
• Putting in place good economic fundamentals that underpin successful city economies – transport, housing and planning,
• Helping to boost demand for high-skilled workers among businesses by concentrating on innovation, inward investment and enterprise policies,
• Making the most of universities as part of a wider economic strategy.

3
The Great British Brain Drain • November 2016
www.centreforcities.org
Introduction
Human capital is now firmly regarded as the foundation of cities’ economic success. A substantial body of research has shown that the skills of the workforce are a strong predictor of current and future economic success, with cities with higher shares of graduates performing well and cities with high shares of people with few formal qualifications struggling.1
As the UK economy continues to specialise in higher-skilled, knowledge intensive activities, the availability of high-skilled workers is an increasingly important asset for cities trying to nurture growth in the modern economy.
Cities have introduced a range of policies to try and keep new graduates once they have graduated. Examples include setting specific graduate retention targets, creating graduate intern schemes and offering wage subsidies to businesses if they hire new graduates. Box 6 provides more details.
Yet there remains a long-standing concern among commentators, politicians and cities themselves that nothing can stop the so-called ‘brain drain’ to London, with London variously described as a ‘giant sucking machine’ and a ‘dark star’.2
In part, these concerns are warranted. While London loses population to the rest of England and Wales - a fact often missed by many commentators - this is not the full story. Breaking migration patterns down by age shows that the capital experiences a large inflow of people aged 22-30, and an outflow of people aged 31 and older. Meanwhile other large cities such as Manchester and Birmingham experience a big inflow of people aged 18-21 – students – but then see outflows of people aged 22 and above.3
But we know little about the qualifications of these migrants. Given the importance of skills to UK city economies, it is vital that cities understand more about where students and then graduates move and why, and how policy should respond to this.
This report fills the existing research gap by bringing together a number of datasets to analyse migration patterns within England and Wales by qualification.4 Firstly, it looks at the total flows of people cut by their highest qualification. Then it looks at the movements of students to university and new graduates to work.
1 Glaeser E L and Resseger M G (2010) ‘The complementarity between cities and skills’, Journal of Regional Science 50 221–244; de la Roca J and Puga D (2012) Learning by working in big cities, DP 9243, Centre for Economic Policy Research, London; Moretti E (2012) New Geography of Jobs, New York: Houghton Mifflin Harcourt; Swinney P and Thomas E (2014) A Century of Cities, London, Centre for Cities ; Cheshire P, Nathan M and Overman H (2014) Urban Economics and Urban Policy: Challenging conventional policy wisdom, Cheshire, Edward Elgar; Glaeser E & Saiz A (2003) ‘The Rise of the Skilled City’, NBER Working Papers 10191;
2 Vince Cable, Today Programme, BBC Radio 4, 19th December 2013.3 Centre for Cities (2014) Cities Outlook 2014, London: Centre for Cities4 For more on the data and methodology in the report, go here: http://www.centreforcities.org/reader/great-british-brain-drain/
data-methodology-note/

4
The Great British Brain Drain • November 2016
www.centreforcities.org
The nature of migration within England and Wales
Many millions of people have moved between regions within England and Wales in recent years. Between 2009 and 2015, 8 million people moved from one part of England and Wales to another, with over 1 million people choosing to make a significant geographic move each year.5
These movers tended to be much younger than the population overall. As Figure 1 shows, over half (52 per cent) of these movements were made by people aged 16 to 30, despite them only accounting for 20 per cent of the English and Welsh population in 2015. Of this, 16 to 21 year olds made up the largest share of migration, accounting for 22 per cent of the total (compared to just 7 per cent of the total population). Meanwhile those aged 46 and over made up much smaller shares of movers than their corresponding share of the population.
Figure 1: Migration by age group, 2009-2015
Source: ONS
Migrants tend to be more highly skilled than the population overall. While standard ONS data on migration does not give information on the qualifications of migrants, the 2011 Census does allow us to look at this data for movers between 2010 and 2011.
In 2011, 27 per cent of people over 16 had a degree. But for those who moved, this share was 38 per cent. As Figure 2 shows, this was even higher for younger migrants - for those aged between 22 and 30, 57 per cent had a degree. Meanwhile 30 per cent of movers had A-level or equivalent qualifications, relative to 12 per cent of the population overall. This is especially apparent for the 16 to 21 age group, many of whom are likely to have been moving to go to university.
5 If the definition included more local moves – within a region – then this number would be significantly higher.
0
5
10
15
20
25
0-15 16-21 22-25 26-30 31-45 46-64 65+
Shar
e of
tot
al (%
)
Age group
Share of population,2015 (%)
Share of all regionalmigration, 2009-2015 (%)

5
The Great British Brain Drain • November 2016
www.centreforcities.org
Figure 2: Qualifications of movers by age, 2010-2011
0
10
20
30
40
50
60
70
80
90
100
Total 16-21 22-25 26-30 31-45 46-64 65+
NVQ4 (Degree)
NVQ3 (A-Level)
Other
Shar
e (%
)
Source: Census 2011
Where these movers go tends to depend on the highest qualification they achieve. Figure 3 groups cities into four categories – London, large cities, medium-sized cities and small cities.6 It shows that overall, London loses population to the rest of England and Wales, while as a group large and medium cites gain population overall.
But looking at qualifications gives an important nuance to the story. While London loses population overall, it experiences a net gain of people with a degree, while the majority of its net population loss is made up of people whose highest qualification is five good GCSEs or equivalent.
Figure 3: Destination of movers by qualification for city groups, 2010-2011
Source: Census 2011
6 Small cities are defined as those with population below 250,000, medium cities have populations below 550,000, and large cities include all other cities except London.
-50,000
-40,000
-30,000
-20,000
-10,000
10,000
0
20,000
30,000
40,000
50,000
London Large Medium Small
Net
mig
rati
on b
y qu
alifi
cati
on
NVQ4 (Degree)
NVQ3 (A-Level)
Other
6
The Great British Brain Drain • November 2016
www.centreforcities.org
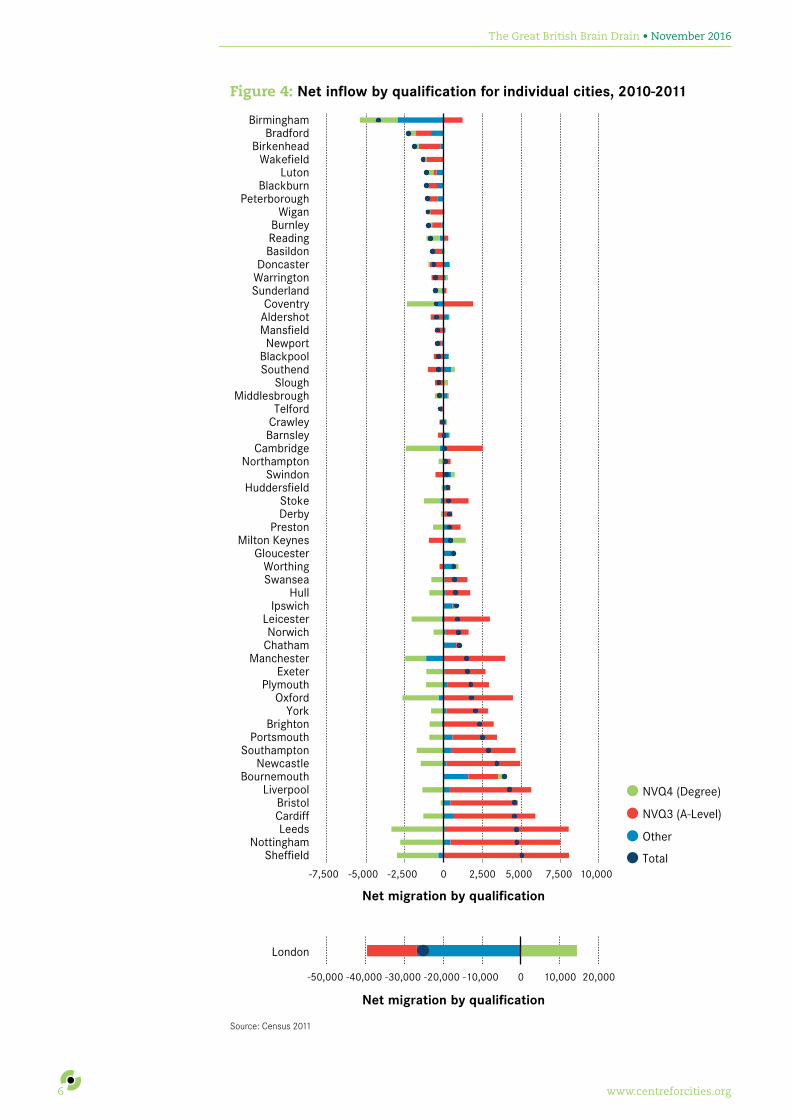
Figure 4: Net inflow by qualification for individual cities, 2010-2011
Source: Census 2011
-5,000 -2,500-7,500 0 5,000 7,5002,500 10,000
Sheffield
London
NottinghamLeeds
CardiffBristol
LiverpoolBournemouth
NewcastleSouthampton
PortsmouthBrighton
YorkOxford
PlymouthExeter
ManchesterChathamNorwich
LeicesterIpswich
HullSwanseaWorthing
GloucesterMilton Keynes
PrestonDerbyStoke
HuddersfieldSwindon
NorthamptonCambridge
BarnsleyCrawleyTelford
MiddlesbroughSlough
SouthendBlackpool
NewportMansfieldAldershotCoventry
SunderlandWarringtonDoncaster
BasildonReadingBurnley
WiganPeterborough
BlackburnLuton
WakefieldBirkenhead
BradfordBirmingham
Net migration by qualification
Net migration by qualification
NVQ4 (Degree)
NVQ3 (A-Level)
Other
Total
-50,000 -40,000 -30,000 -20,000 -10,000 0 10,000 20,000

7
The Great British Brain Drain • November 2016
www.centreforcities.org
All other city groups see a net loss of degree holders. Instead their overall net inflows of movers are driven by those that hold A-levels or equivalent – many of whom are moving for university (investigated in the next section). Excluding London, just 14 cities had a net inflow of degree holders. And of these 14, eight were located in the Greater South East (see Figure 4).
Migration patterns also vary with age. Figure 5 shows three key changes in the flow of movers according to their stage of life:
• Large, medium and small cities saw a net inflow of people aged 16 to 21, with this being clearest for large cities. The vast majority of these migrants were educated to A-level or equivalent, once again pointing to an inflow of university students. London, on the other hand, saw a net outflow.
• This trend reversed for those aged between 22 and 30. Degree-educated movers led the charge, with London seeing a large net inflow and other cities seeing a net outflow.
• For movers aged 31 to 45 the position changed again, with all cities seeing a net outflow. This again was led by degree holders. But while they quit the city, these people did not move far – for the vast majority of cities, over 50 per cent remained within the same region.
Previous Centre for Cities research suggests these moves are related to lifestyle choices. Young students and professionals tend to live in cities to be close to restaurants, leisure and cultural facilities, to public transport, and to their workplace. People living in suburbs tend to be over 30 with children and live there because of the cost, size and type of housing, to be close to good schools, and because of the safety and security of the neighbourhood. Those living in rural areas tend to be over 55 and live there to be close to countryside and green spaces.7
Figure 5: Net inflow by age and qualification for city groups, 2010-2011
7 Thomas E, Serwicka I and Swinney P (2015) Urban Demographics: Where do people live and work in England and Wales? London, Centre for Cities
-20,000
-10,000
0
10,000
20,000
30,000
40,000
50,000
London Large Medium Small
Net
mig
rati
on b
y qu
alifi
cati
on
NVQ4 (Degree)
NVQ3 (A-Level)
Other
-15,000
-10,000
-5,000
0
5,000
10,000
15,000
20,000
25,000
30,000
London Large Medium Small
Net
mig
rati
on b
y qu
alifi
cati
on
NVQ4 (Degree)
NVQ3 (A-Level)
Other
-4,000
-3,000
-2,000
-1,000
0
1,000
2,000
3,000
4,000
5,000
6,000
7,000
London Large Medium Small
Net
mig
rati
on b
y qu
alifi
cati
on
NVQ4 (Degree)
NVQ3 (A-Level)
Other
-25,000
-20,000
-15,000
-10,000
-5,000
0
London Large Medium Small
Net
mig
rati
on b
y qu
alifi
cati
on
NVQ4 (Degree)
NVQ3 (A-Level)
Other
16-21 years old
22-25 years old
26-30 years old
31-45 years old

8
The Great British Brain Drain • November 2016
www.centreforcities.org
Source: Census 2011
-20,000
-10,000
0
10,000
20,000
30,000
40,000
50,000
London Large Medium Small
Net
mig
rati
on b
y qu
alifi
cati
on
NVQ4 (Degree)
NVQ3 (A-Level)
Other
-15,000
-10,000
-5,000
0
5,000
10,000
15,000
20,000
25,000
30,000
London Large Medium Small
Net
mig
rati
on b
y qu
alifi
cati
on
NVQ4 (Degree)
NVQ3 (A-Level)
Other
-4,000
-3,000
-2,000
-1,000
0
1,000
2,000
3,000
4,000
5,000
6,000
7,000
London Large Medium Small
Net
mig
rati
on b
y qu
alifi
cati
on
NVQ4 (Degree)
NVQ3 (A-Level)
Other
-25,000
-20,000
-15,000
-10,000
-5,000
0
London Large Medium Small
Net
mig
rati
on b
y qu
alifi
cati
on
NVQ4 (Degree)
NVQ3 (A-Level)
Other
16-21 years old
22-25 years old
26-30 years old
31-45 years old

9
The Great British Brain Drain • November 2016
www.centreforcities.org
Summary
The findings in this section highlight three important characteristics that define migration within England and Wales:
• Internal migration in England and Wales is relatively large. Over one million people a year move from one region to another.
• Those moving tend to be young and higher skilled. A significant share of migration is accounted for by those aged between 16 and 30 and those moving tend to have A-Levels and degrees.
• Older degree holders move out of cities but not out of the region. This means that they still live within a commutable distance of the city they leave.
Given the higher-skilled nature of migration, and the important role that universities play as catalysts for this migration, the next section looks in more detail at the migration of students and new graduates.
It uses the Higher Education Statistics Authority (HESA) survey of its graduates to find out where they are working six months after they leave university and combines this data on the destinations of graduates for 2013/14 and 2014/15 with data on all students at university in 2014/15. Unlike the Census and ONS internal migration data above, this data covers the whole of the UK.

10
The Great British Brain Drain • November 2016
www.centreforcities.org
The migration of students and graduates
Students make up a large share of overall internal migration. Those moving from one region to another to go to university accounted for approximately one fifth of all movements in 2014 in England and Wales. As Figure 6 shows, these movements caused a shift in this population away from non-urban areas of the country into cities, with large and medium-sized cities seeing the largest inflows from non-urban areas.8
Figure 6: Share of all students at university in 2014/15 by their home and university town
Source: HESA
Large cities were the biggest winners from these moves. As Figure 7 shows, Leeds, Nottingham and Sheffield saw the largest net inflows, with an influx of around 30,000 students to each city. Meanwhile there were 23 cities that saw a net outflow of students. Unsurprisingly, the majority of these cities have no large university campus in them, for example Aldershot and Wakefield.
The one exception was London, which despite its 49 higher education institutions experienced by far the largest net outflow. Of all the students at university in 2014/15, 50,000 more students moved from London to somewhere else in the UK than those doing the reverse move. The capital did not lose students overall though, as this outflow was more than offset by an inflow of over 100,000 students from the rest of the world.
8 Cities as defined by Primary Urban Areas (PUA), full definition here http://www.centreforcities.org/puas/
0
5
10
15
20
25
30
35
40
45
London Large Medium Small Non-city
Shar
e of
tot
al (%
)
Share of all studentsprior to university
Share of all studentsat university

11
The Great British Brain Drain • November 2016
www.centreforcities.org
Figure 7: Net flows of students at university in 2014/15
City
Net inflow of students at
university 2014/15 City
Net inflow of students at
university 2014/15
1 Leeds 32,845 54 Barnsley -4,090
2 Nottingham 32,675 54 Swindon -4,090
3 Edinburgh 32,550 55 Aldershot -4,700
4 Cardiff 28,895 56 Blackpool -4,830
5 Sheffield 28,010 57 Doncaster -5,560
6 Oxford 26,485 58 Southend -5,855
7 Glasgow 24,935 59 Wakefield -6,180
8 Coventry 24,920 60 Milton Keynes -6,700
9 Liverpool 24,915 61 Wigan -6,740
10 Bristol 22,925 62 Birkenhead -8,930
63 London -50,130
Source: HESA
The result was that these movements caused a shift of UK students away from London to the rest of the country, as shown in Figure 8. Large cities were the biggest winners, but medium and small cities saw a net inflow too.
Figure 8: Where students at university in 2014/15 came from
Source: HESA
Graduation signals a stark change in movements, with London the big winner
These patterns reverse once students graduate. Among cities, London went from experiencing the largest net outflow of students to experiencing the largest net inflow
London
Largecities
Smallcities
Non-city
Medium-sizedcities
180,940
160,690
65,890
13,980
30,490
13,535 11
,675
23,980
9,685
9,67
0
12
The Great British Brain Drain • November 2016
www.centreforcities.org
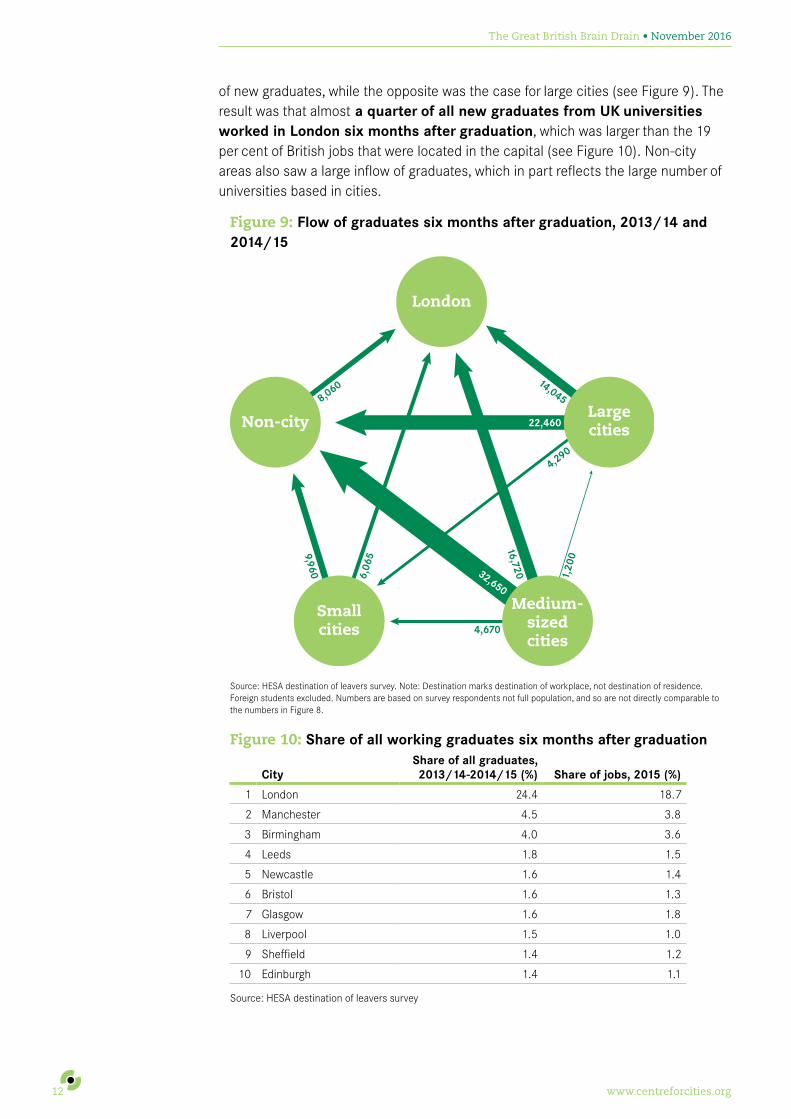
of new graduates, while the opposite was the case for large cities (see Figure 9). The result was that almost a quarter of all new graduates from UK universities worked in London six months after graduation, which was larger than the 19 per cent of British jobs that were located in the capital (see Figure 10). Non-city areas also saw a large inflow of graduates, which in part reflects the large number of universities based in cities.
Figure 9: Flow of graduates six months after graduation, 2013/14 and 2014/15
Source: HESA destination of leavers survey. Note: Destination marks destination of workplace, not destination of residence. Foreign students excluded. Numbers are based on survey respondents not full population, and so are not directly comparable to the numbers in Figure 8.
Figure 10: Share of all working graduates six months after graduation
CityShare of all graduates, 2013/14-2014/15 (%) Share of jobs, 2015 (%)
1 London 24.4 18.7
2 Manchester 4.5 3.8
3 Birmingham 4.0 3.6
4 Leeds 1.8 1.5
5 Newcastle 1.6 1.4
6 Bristol 1.6 1.3
7 Glasgow 1.6 1.8
8 Liverpool 1.5 1.0
9 Sheffield 1.4 1.2
10 Edinburgh 1.4 1.1
Source: HESA destination of leavers survey
1,20
0
8,060
32,650
4,290
22,460
9,960
4,670
16,7206,06
514,045
London
Largecities
Smallcities
Non-city
Medium-sizedcities

13
The Great British Brain Drain • November 2016
www.centreforcities.org
London’s success is based on its ability to both retain and attract graduates
London’s over representation of new graduates is a result of two factors – its ability to retain its students, and to attract in graduates from elsewhere.
Looking first at retention, Figure 11 shows that London had by far the highest retention rate of any city, with 77 per cent of its students staying to work in the capital. Of cities with at least one substantial university campus, Manchester, Belfast and Birmingham had the next highest rates, with around 50 per cent of students who studied in these cities also working in them six months later. As a group, large cities (at 38 per cent) had higher retention rates than medium (26 per cent) and small cities (23 per cent).
Figure 11: Graduate retention rate by city, 2013/14 and 2014/15
City Retention rate, 2013/14-2014/15 (%)
1 London 76.9
2 Manchester 51.5
3 Belfast 50.4
4 Birmingham 49.4
5 Glasgow 46.1
6 Aberdeen 43.1
7 Edinburgh 42.2
8 Middlesbrough 38.4
9 Newcastle 36.1
10 Swansea 33.3
Source: HESA destination of leavers survey. Note: Cities with fewer than 100 responses were not included. This applied to cities that have small campuses associated to a university elsewhere, such as Mansfield.
Second, looking at the movement of students after graduation shows that London was also very successful at attracting in graduates from elsewhere. Of all the graduates who moved city after university, 22 per cent moved to London (see Figure 12). Part of this was a result of London’s success in attracting back students that grew up there but went to study elsewhere (Box 1). As Figure 13 shows, London also saw a net inflow from virtually every other city in the UK.
Figure 12: Distribution of those who worked in a different city after graduation to where they studied, 2013/14-2014/15
City
Share of all moving graduates, 2013/14-
2014/15 (%)
Share of all moving Russell Group graduates achieving
First and Upper Second degrees, 2013/14-2014/15 (%)
Share of all jobs, 2015 (%)
1 London 21.6 38.0 18.7
2 Manchester 3.8 3.2 3.8
3 Birmingham 2.9 2.3 3.6
4 Leeds 1.8 2.0 1.5
5 Bristol 1.7 2.1 1.3
6 Belfast 1.2 0.3 0.9
7 Newcastle 1.2 0.9 1.4
8 Edinburgh 1.2 0.8 1.1
9 Liverpool 1.1 0.5 1.0
10 Nottingham 1.1 0.7 1.1

14
The Great British Brain Drain • November 2016
www.centreforcities.org
Figure 12: Distribution of those who worked in a different city after graduation to where they studied, 2013/14-2014/15
Source: HESA destination of leavers survey. Note: This data includes graduates who moved from a non-city area to a city and vice versa, but does not include graduates who moved from one non-city area, such as Chester, to another, such as Carlisle.
Share of all graduate movers
0.2% - 0.5%
0.6% - 0.9%
1% - 1.8%
1.9% - 3.8%
London: 21.6%Dundee
EdinburghGlasgow
Belfast
NewcastleSunderland
Middlesbrough
Hull
York
Leeds
Swansea
Cardiff
Newport
Bristol
Gloucester
Exeter
Plymouth
Portsmouth
Aberdeen
Southampton
BournemouthBrightonWorthing
SouthendBasildon
Chatham
Crawley
Norwich
Ipswich
London
Peterborough
AldershotReading
Swindon
Oxford
Milton Keynes
Northampton
Luton
Cambridge
Stoke
Telford
Birmingham Coventry
Leicester
Nottingham
Mansfield
Derby
Sheffield
DoncasterWakefield
Bradford
Birkenhead
LiverpoolWigan
Manchester
Burnley
BlackpoolPrestonBlackburn
Warrington
Barnsley
Slough
Huddersfield

15
The Great British Brain Drain • November 2016
www.centreforcities.org
Figure 13: Net flow of graduates from other cities to London, 2013/14-2014/15
!
!
!
!
!
!
!
!
!
!
!
!
!
!
!
!
!
!
!
!
!
!
!
!
!
!
!
!
!
!
!
!
!
!
!
!
!
!
!
!
!
!
!
Dundee
EdinburghGlasgow
Belfast
NewcastleSunderland
Middlesbrough
Hull
YorkLeeds
Swansea
Cardiff
Newport
Bristol
Exeter
Plymouth
Portsmouth
Aberdeen
Southampton
Bournemouth
Brighton
ChathamLondon
Norwich
Ipswich
Reading
Oxford
Northampton
Luton
Cambridge
Stoke
Birmingham
Coventry
Leicester
NottinghamDerby
Sheffield
Bradford
LiverpoolWarrington
Manchester
Preston
Huddersfield
Net flow of graduates to London
1,801 - 2,500
851 - 1,800
1 - 850-
-35 - 0
Nottingham (3,115)
Source: HESA destination of leavers survey. Note: Cities with fewer than 100 responses were not included. This applied to cities that have small campuses associated to a university elsewhere, such as Mansfield.
16
The Great British Brain Drain • November 2016
www.centreforcities.org
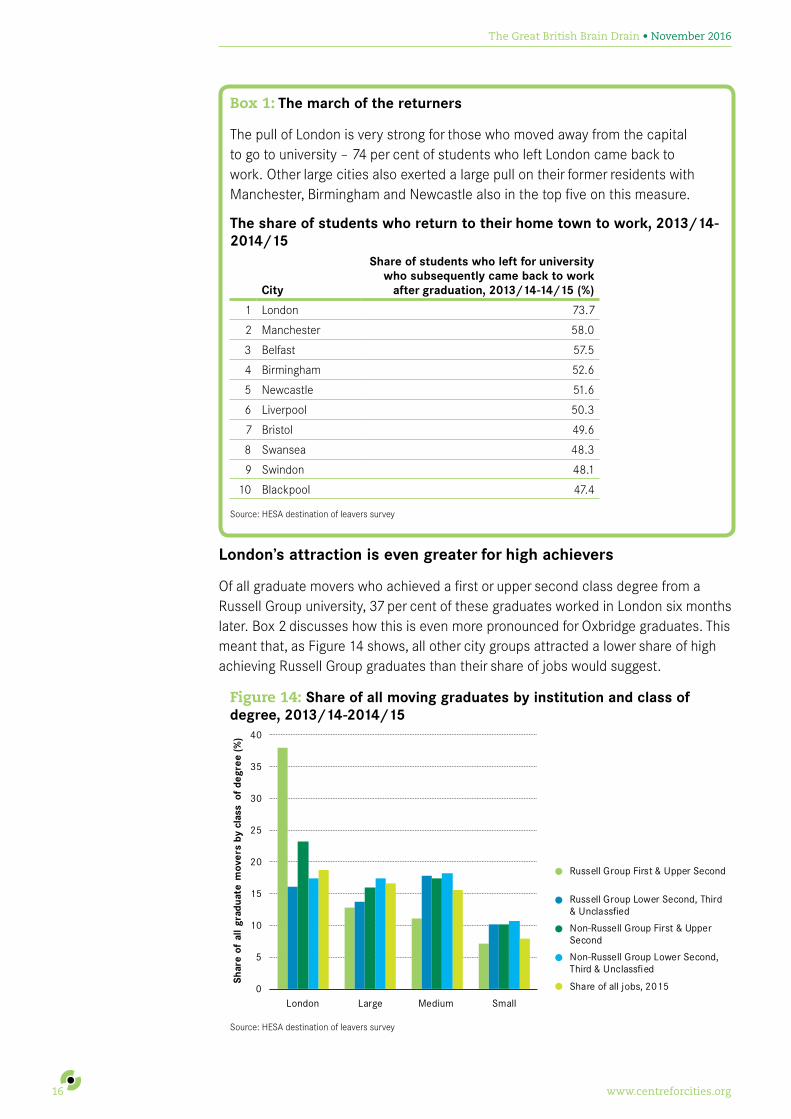
Box 1: The march of the returners
The pull of London is very strong for those who moved away from the capital to go to university – 74 per cent of students who left London came back to work. Other large cities also exerted a large pull on their former residents with Manchester, Birmingham and Newcastle also in the top five on this measure.
The share of students who return to their home town to work, 2013/14-2014/15
City
Share of students who left for university who subsequently came back to work
after graduation, 2013/14-14/15 (%)
1 London 73.7
2 Manchester 58.0
3 Belfast 57.5
4 Birmingham 52.6
5 Newcastle 51.6
6 Liverpool 50.3
7 Bristol 49.6
8 Swansea 48.3
9 Swindon 48.1
10 Blackpool 47.4
Source: HESA destination of leavers survey
London’s attraction is even greater for high achievers
Of all graduate movers who achieved a first or upper second class degree from a Russell Group university, 37 per cent of these graduates worked in London six months later. Box 2 discusses how this is even more pronounced for Oxbridge graduates. This meant that, as Figure 14 shows, all other city groups attracted a lower share of high achieving Russell Group graduates than their share of jobs would suggest.
Figure 14: Share of all moving graduates by institution and class of degree, 2013/14-2014/15
Source: HESA destination of leavers survey
0
5
10
15
20
25
30
35
40
London Large Medium Small
Shar
e of
all
grad
uate
mov
ers
by c
lass
of
degr
ee (%
)
Russell Group First & Upper Second
Russell Group Lower Second, Third& Unclassfied
Non-Russell Group First & UpperSecond
Non-Russell Group Lower Second,Third & Unclassfied
Share of all jobs, 2015
17
The Great British Brain Drain • November 2016
www.centreforcities.org
Large cities attracted a lower share of all working graduates, relative to share of jobs, irrespective of their degree and institution. However, they were most successful at attracting those students that achieved a lower second class degree or lower from a non-Russell Group university.
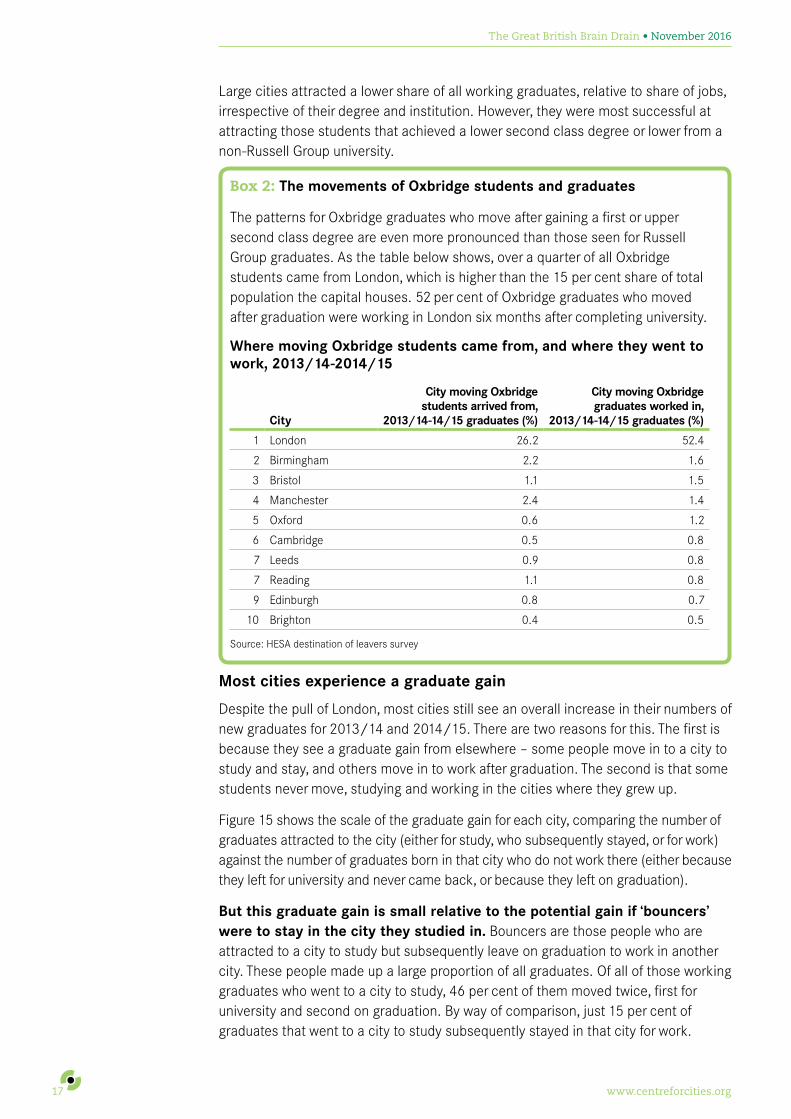
Box 2: The movements of Oxbridge students and graduates
The patterns for Oxbridge graduates who move after gaining a first or upper second class degree are even more pronounced than those seen for Russell Group graduates. As the table below shows, over a quarter of all Oxbridge students came from London, which is higher than the 15 per cent share of total population the capital houses. 52 per cent of Oxbridge graduates who moved after graduation were working in London six months after completing university.
Where moving Oxbridge students came from, and where they went to work, 2013/14-2014/15
City
City moving Oxbridge students arrived from,
2013/14-14/15 graduates (%)
City moving Oxbridge graduates worked in,
2013/14-14/15 graduates (%)
1 London 26.2 52.4
2 Birmingham 2.2 1.6
3 Bristol 1.1 1.5
4 Manchester 2.4 1.4
5 Oxford 0.6 1.2
6 Cambridge 0.5 0.8
7 Leeds 0.9 0.8
7 Reading 1.1 0.8
9 Edinburgh 0.8 0.7
10 Brighton 0.4 0.5
Source: HESA destination of leavers survey
Most cities experience a graduate gain
Despite the pull of London, most cities still see an overall increase in their numbers of new graduates for 2013/14 and 2014/15. There are two reasons for this. The first is because they see a graduate gain from elsewhere – some people move in to a city to study and stay, and others move in to work after graduation. The second is that some students never move, studying and working in the cities where they grew up.
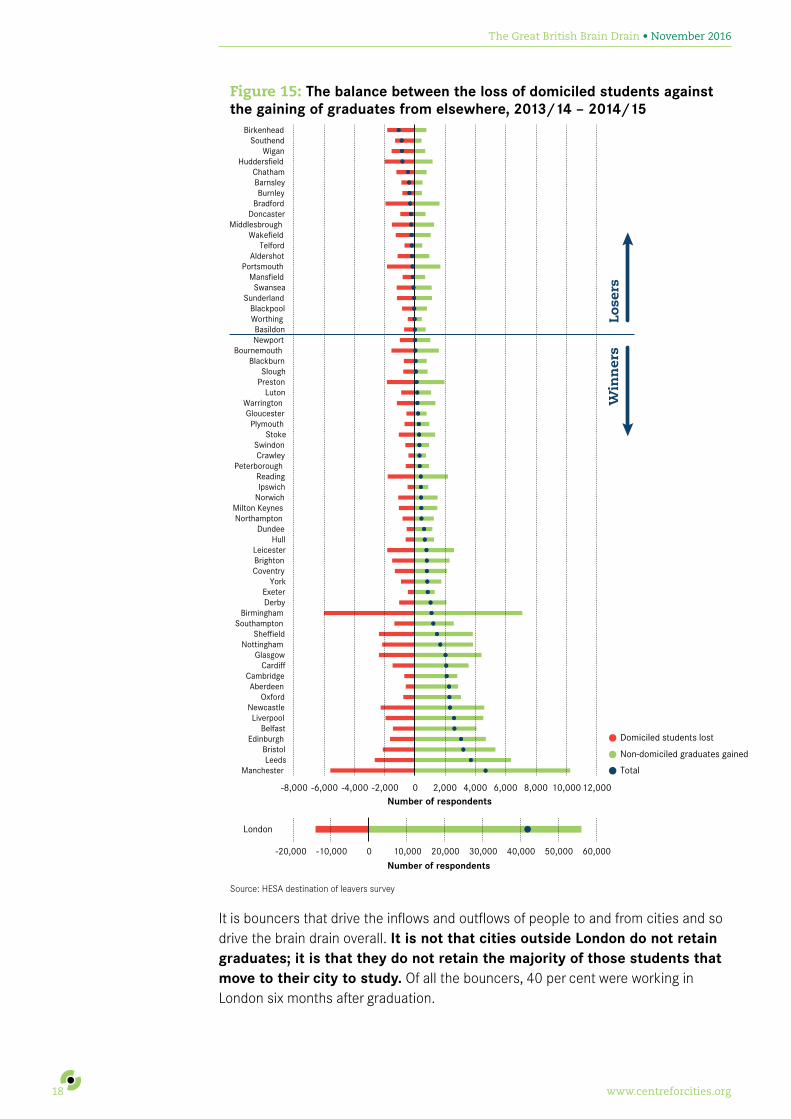
Figure 15 shows the scale of the graduate gain for each city, comparing the number of graduates attracted to the city (either for study, who subsequently stayed, or for work) against the number of graduates born in that city who do not work there (either because they left for university and never came back, or because they left on graduation).
But this graduate gain is small relative to the potential gain if ‘bouncers’ were to stay in the city they studied in. Bouncers are those people who are attracted to a city to study but subsequently leave on graduation to work in another city. These people made up a large proportion of all graduates. Of all of those working graduates who went to a city to study, 46 per cent of them moved twice, first for university and second on graduation. By way of comparison, just 15 per cent of graduates that went to a city to study subsequently stayed in that city for work.
18
The Great British Brain Drain • November 2016
www.centreforcities.org
Figure 15: The balance between the loss of domiciled students against the gaining of graduates from elsewhere, 2013/14 – 2014/15
Source: HESA destination of leavers survey
It is bouncers that drive the inflows and outflows of people to and from cities and so drive the brain drain overall. It is not that cities outside London do not retain graduates; it is that they do not retain the majority of those students that move to their city to study. Of all the bouncers, 40 per cent were working in London six months after graduation.
-8,000 -6,000 -4,000 -2,000 0 2,000 4,000 6,000 8,000 10,00012,000
ManchesterLeeds
BristolEdinburgh
BelfastLiverpool
NewcastleOxford
AberdeenCambridge
CardiffGlasgow
NottinghamSheffield
SouthamptonBirmingham
DerbyExeter
YorkCoventryBrightonLeicester
HullDundee
NorthamptonMilton Keynes
NorwichIpswichReading
PeterboroughCrawley
SwindonStoke
PlymouthGloucester
WarringtonLuton
PrestonSlough
BlackburnBournemouth
NewportBasildon
WorthingBlackpool
SunderlandSwansea
MansfieldPortsmouth
AldershotTelford
WakefieldMiddlesbrough
DoncasterBradford
BurnleyBarnsleyChatham
HuddersfieldWigan
SouthendBirkenhead
Number of respondents
Number of respondents
Domiciled students lost
Non-domiciled graduates gained
Total
-20,000 -10,000 0 10,000 20,000 30,000 40,000 50,000 60,000
London
Lose
rsW
inn
ers

19
The Great British Brain Drain • November 2016
www.centreforcities.org
Figure 16 shows how the number of bouncers overshadowed the graduate gain for all but London. In Manchester, for example, 67 per cent of the students who went to study in the city left upon graduation. In Birmingham this figure was 76 per cent. And in Southampton it was 86 per cent.
Figure 16: The bouncers and the graduate gain, 2013/14-2014/15
Source: HESA destination of leavers survey
-12,000-10,000 -8,000 -6,000 -4,000 -2,000 0 2,000 4,000 6,000
Southend
Warrington
Telford
Ipswich
Newport
Bradford
Chatham
Luton
Sunderland
Hull
Stoke
Northampton
Swansea
Belfast
Reading
Middlesbrough
Plymouth
Dundee
Huddersfield
Aberdeen
Norwich
Exeter
Derby
Edinburgh
York
Bournemouth
Glasgow
Portsmouth
Brighton
Leicester
Cambridge
Cardiff
Preston
Southampton
Oxford
Bristol
Coventry
Newcastle
Leeds
Liverpool
Manchester
Sheffield
Birmingham
Nottingham
Number of respondents
Number of respondents
Graduate gain
Bouncers
-20,000 -10,000 0 10,000 20,000 30,000 40,000 50,000
London

20
The Great British Brain Drain • November 2016
www.centreforcities.org
Box 3: City case studies
Nottingham – attracting students and losing graduates
In the 2013-2015 period 88 per cent of Nottingham student population came from elsewhere and both its universities were equally successful in attracting students. 14 per cent of the students not originally from Nottingham came from London. However, Nottingham is not so successful in retaining graduates. Only 21 per cent of its graduates remained in Nottingham to work. Whereas 66 per cent of the students originally from Nottingham stayed to work, only 14 per cent of the students who came from elsewhere to study remained to work in Nottingham. In particular, Nottingham loses graduates to London and it is the largest contributor to London’s graduate population.
Sheffield – attracting students and keeping graduates
Sheffield is another city that attracts a large number of students from other parts of the country, but it is also successful in retaining a considerable share of its graduates. In the 2013-2015 period, 81 per cent of its students were not from Sheffield. Unlike Nottingham, Sheffield retains a substantial share of its graduates – 31 per cent of its students remain in Sheffield to work. 75 per cent of the students who were living in Sheffield before university worked in the city after graduation, whereas 20 per cent of the graduates who came from elsewhere to study remained in Sheffield to work. Like Nottingham and many other cities, Sheffield loses students to London. But the share of graduates who moved to London is only 10 per cent.
Leeds - Attracting students, attracting graduates
Leeds also gains large number of students. In the 2013-2015 period 86 per cent of its students were not originally from Leeds. 29 per cent of Leeds graduates remained in the city for work. The share of graduates that moved to Leeds to study and stayed in the city to work is 23 per cent, higher than Nottingham and Sheffield. The share of graduates who lived in Leeds before university and stayed in the city after graduation is 68 per cent. Leeds also loses a considerable amount of graduates to London – 15 per cent move to London for work, but 97 per cent of these lived elsewhere before university. However, Leeds also attracts graduates from other cities with 1.8 per cent of all moving graduates heading to the city, the fourth largest share among UK cities.
Movement of students and graduates in and out of a city
Study
Work
School-leavers
Stay to study Leave to study New students
New graduates(‘graduate movers’)
Stay for work(‘retained’)
Leave for work(‘bouncers’)
Leave for workStay for work(‘home-grown’
graduates)
Return for work(‘returners’)
Do not returnfor work
In the city
Out of the city

21
The Great British Brain Drain • November 2016
www.centreforcities.org
Universities help cities retain home-grown graduates. The final component of the new graduate labour force in cities is the ‘home-grown’ element – those graduates who grow up, study and work in the same city. There is large variation in the significance of these home-grown graduates across cities. In London, they made up half of the new graduate workforce. In large cities this share was 38 per cent, while it fell to 21 per cent in medium cities and 12 per cent in small cities. Box 4 shows the composition of the new graduate labour market.
Cities without a university are least likely to attract back their students after they have graduated. Obviously cities without a university cannot benefit from the home-grown effect, as their students are forced to go elsewhere to study. They are also least likely to attract back their students after they have graduated. In cities such as Barnsley, Crawley and Basildon, less than one third of new working graduates grew up in these cities. This compares to three quarters of graduates in Birmingham, Manchester and Liverpool.
But having a university does not guarantee that a city will see a net gain in new graduates from elsewhere. As shown in Figure 15, 20 cities lost more graduates who grew up in their cities than they gained in graduates who grew up elsewhere. Amongst these were the university cities of Sunderland, Middlesbrough, Portsmouth, Bradford and Huddersfield. Meanwhile cities such as Milton Keynes, Swindon and Crawley, all of which do not have a campus university, experienced a graduate gain, so that the number of new graduates attracted in to work was bigger than the outflow of students moving to other cities to study.
Overall universities pull students into cities. The overall outcome for cities from these student and graduate movements is shown in Figure 17. The movements of the ‘bouncers’ meant that large, medium and small cities all had a smaller share of working graduates than students at their universities. But this share was still greater than their shares of students originally from these cities.
Figure 17: The distribution of where students live, where they study and where they move to after graduation, 2013/14 – 2014/15
Source: HESA destination of leavers survey. Notes: Excludes foreign students. Data for students prior to and at university is for all students at a higher education institution in 2014/15. Data for working graduates is for those who graduated in 2013/14 and 2014/15.
0
5
10
15
20
25
30
35
40
45
50
London Large Medium Small Non-city
Shar
e of
tot
al (%
)
Share of school-leavers who go to university
Share of students at university
Share of graduates at work

22
The Great British Brain Drain • November 2016
www.centreforcities.org
Box 4: The composition of cities’ new graduate workforces
The chart below provides a detailed breakdown of the components of the new graduate workforce for every city.
The components of the new graduate workforce, 2013/14-2014/15
Source: HESA destination of leavers survey
Stay for university and workCome for university, stay for workLeave for university, return for workMove in for work, not from city
0 20 40 60 80 100
MiddlesbroughBirmingham
GlasgowSwanseaLondon
SheffieldManchester
DundeePlymouth
NewcastlePreston
LiverpoolAberdeen
StokeHull
SunderlandLeicester
BournemouthHuddersfield
BrightonPortsmouth
BradfordNottingham
NorthamptonEdinburgh
NorwichBelfastLuton
IpswichCoventry
DerbyBristol
NewportLeeds
ChathamCardiff
SouthamptonYork
OxfordExeter
ReadingCambridge
BurnleyMansfieldSouthend
WarringtonPeterborough
TelfordMilton Keynes
BirkenheadWakefieldBlackpoolSwindon
DoncasterWigan
AldershotBlackburn
SloughGloucester
BasildonCrawleyBarnsley
Worthing
Share of respondents working in city (%)

23
The Great British Brain Drain • November 2016
www.centreforcities.org
Summary
• Graduate migration is driven by students who ‘bounce’ – those who move into a city to study, but leave on graduation to work somewhere else. It is not that cities outside London do not retain graduates; it is that they do not retain the majority of those students that move to their city to study.
• The brain drain to London is not just about quantity, but about composition too. London pulls in many more graduates than its share of jobs would suggest, and this is even more prominent for high achievers from Russell Group universities.
• All university cities retain at least a small share of graduates who moved to the city to study, which means that when these are added to the home-grown graduates, most cities experience a graduate gain, despite losing large numbers of students upon graduation.
• Universities do help cities to develop and retain graduates who grew up in the city, but having a university does not guarantee that a city will see a graduate gain. A number of university cities see a graduate loss, while a number of cities without a university see a graduate gain.
There are a number of factors that influence the decisions made by graduates as to which cities to live and work in. The next section explores the relationship between graduate location decisions and the factors commonly identified as influencing those decisions.

24
The Great British Brain Drain • November 2016
www.centreforcities.org
What drives the geography of new graduates?
Jobs are the most important factor influencing graduate location decisions. Research on graduate movements shows that access to employment is the key determinant of graduate movements, with those areas experiencing higher levels of economic growth better placed to attract and retain increased numbers of recent graduates.9
But it is not just the availability of jobs that are important. Research in the UK and elsewhere also points to the importance of career progression opportunities – known as the ‘escalator’ effect – in bigger cities, with this effect being particularly strong in knowledge-based activities.10 Unsurprisingly the escalator effect is most prominent in London, as a result of its much greater size – the new graduate labour market in London is over five times the size of second place Manchester.
Big cities are attractive to graduates. These findings help to explain the patterns seen in the charts below. Figure 18 shows that the share of graduates who grew up in a city and work in that city increases as a city gets larger.
Figure 18: The size of the graduate labour market and the share of graduates that work in the city they grew up in, 2013/14-2014/15
Source: HESA destination of leavers survey.
9 Faggian A & McCann P (2009) Universities, agglomerations and graduate human capital mobility Tijdschrift voor Economische en Sociale Geografie 100 (2); Storper M, Kemeny T, Makarem N and Osman T (2015) The Rise and Fall of Urban Economies,: Lessons from San Francisco and Los Angeles, California, Stanford University Press
10 Gordon I, Champion T and Coombes M (2015) “Urban escalators and interregional elevators: the difference that location, mobility, and sectoral specialisation make to occupational progression” IN Environment and Planning A, Vol 47 No 3 Mar 2015, pp588-606; Fielding A J (1992) Migration and social mobility: South East England as an escalator region, Regional Studies 26 1–15
Aberdeen
Aldershot
Barnsley
Basildon
Belfast
Birkenhead
Birmingham
Blackburn
Blackpool
Bournemouth
Bradford
Brighton
Bristol
Burnley Cambridge
Cardiff
Chatham
Coventry
Crawley
Derby
Doncaster
Dundee
Edinburgh
Exeter
Glasgow
Gloucester
Huddersfield
Hull
Ipswich
LeedsLeicester
Liverpool
London
Luton
Manchester
Mansfield
Middlesbrough Newcastle
Newport
Northampton
Norwich
Nottingham
OxfordPeterborough
Plymouth
PortsmouthPreston
Reading
Sheffield
Slough
Southampton
Southend
Stoke
Sunderland
Swansea
Swindon
Telford
WakefieldWarrington
Wigan
Worthing
York
20
30
40
50
60
70
80
90
6 7 8 9 10 11 12
Shar
e of
all
grad
uate
s th
at w
ork
in t
he c
ity
they
gre
w u
p in
(%)
Log of number of respondents working in a city
Bubble size = number of graduates attracted to the city for university and decided to stay.

25
The Great British Brain Drain • November 2016
www.centreforcities.org
Figure 18 also shows that bigger cities are more attractive to outsiders. The size of the bubble, which shows the number of graduates that have been attracted in from elsewhere, gets larger as the size of the graduate labour market grows. In other words, bigger cities have greater appeal to graduates who grew up in the city and those who grew up elsewhere. Both the greater availability of jobs and career progression opportunities in these cities are two reasons that help explain this observation.
But interestingly, as Figure 19 shows, there is no relationship between the size of a city and the mean graduate wage on offer. This suggests that high graduate wages are not the main reason for people moving to big cities, and that other factors such as the opportunities for career progression are more important. In medium and smaller cities such as Basildon, Newport and Worthing, however, where career progression opportunities are more limited, higher graduate wages may be playing a compensating role and helping to attract graduates to work there.
Figure 19: The size of the graduate labour market and mean graduate wages, 2013/14-2014/15
Source: HESA destination of leavers survey.
Figure 20 shows that the graduate gain tended to be larger in cities where publicly funded jobs accounted for a smaller share of new graduate positions, while the opposite is the case for knowledge intensive business services (KIBS) jobs. This again would suggest the importance of career progression, especially given that even when looking at public administration more narrowly, there is a public sector pay premium to graduate jobs in almost every city.
Aberdeen
Aldershot
Barnsley
Basildon
Belfast
Birmingham
Blackburn
Bradford
Brighton
Bristol
Burnley
Cambridge
Cardiff
Chatham
Crawley
Derby
Dundee
Edinburgh
Exeter
GlasgowGloucester
Hull
Ipswich
Leeds
Leicester
Liverpool
London
Luton
ManchesterMansfield
Middlesbrough
Milton Keynes
Newcastle
Newport
Northampton
Norwich
Nottingham
Oxford
PlymouthPortsmouth
Preston
Reading
Sheffield
Slough
Southampton
Southend Stoke
Telford
Wakefield
Warrington
Wigan
Worthing
York
19,000
20,000
21,000
22,000
23,000
24,000
25,000
26,000
27,000
28,000
6 7 8 9 10 11 12
Mea
n gr
adua
te w
age
(£)
Log of the number of graduates working in city

26
The Great British Brain Drain • November 2016
www.centreforcities.org
Figure 20: Share of new graduate positions in publicly-funded jobs and KIBS and the graduate gain, 2013/14-2014/15
Source: HESA destination of leavers survey.
Aberdeen
Aldershot
Barnsley
Belfast
Birkenhead
Birmingham
Blackburn
Blackpool
Bournemouth
Bradford
Brighton
Bristol
Burnley
Cambridge
Cardiff
Chatham
Coventry
Crawley
Derby
Doncaster
Dundee
Edinburgh
Exeter
Glasgow
Gloucester
Huddersfield
HullIpswich
Leeds
Leicester
Liverpool
London
Luton
Manchester
Mansfield
Milton Keynes
Newcastle
Newport
Norwich
Nottingham
Oxford
Peterborough
PlymouthPortsmouth
Preston
Reading
Slough
Southampton
Southend
Stoke
Sunderland
Swansea
Swindon
Telford
Wakefield
Warrington
Wigan
Worthing
York
0
10
20
30
40
50
60
70
80
-1.5 -1 -0.5 0 0.5 1 1.5 2
Shar
e of
gra
duat
es w
orki
ng in
pub
licly
fun
ded
jobs
(%)
Log of the difference between number of students pre university and number of graduates
Sheffield
AberdeenAldershot
Barnsley
Basildon
Belfast
Birkenhead
Birmingham
BlackburnBlackpool
Bournemouth
Bradford
Brighton
Bristol
Burnley
Cambridge
Cardiff
Chatham
Coventry
Crawley
Derby
Doncaster
Dundee
Edinburgh
Exeter
Glasgow
GloucesterHuddersfield
Hull
Ipswich
Leeds
Leicester
Liverpool
London
Luton
Manchester
Mansfield
Middlesbrough
Milton Keynes
Newcastle
Newport
Northampton
Norwich
Nottingham
Oxford
Peterborough
Plymouth
Preston
Reading
Sheffield
Slough
Southampton
Southend
Stoke
SunderlandSwansea
Swindon
TelfordWakefield
Warrington
Wigan
Worthing
York
0
5
10
15
20
25
30
-1.5 -1 -0.5 0 0.5 1 1.5 2
Shar
e of
gra
duat
es w
orki
ng in
KIB
S (%
)
Log of the difference between number of students pre university and number of graduates

27
The Great British Brain Drain • November 2016
www.centreforcities.org
Many cities are reliant on the public sector for graduate-level jobs. As Figure 21 shows, the public sector tended to play a smaller role in southern cities and in bigger cities further north. In Crawley, the lowest, they accounted for one in three new graduate positions. But in Barnsley, the highest, they accounted for two in three new graduate positions. The opposite geographic pattern is seen for the share of jobs in KIBS industries.
Figure 21: Share of new graduates working in publicly-funded and KIBS jobs, 2013/14-2014/15
Source: HESA destination of leavers survey.
The dominance of publicly funded sectors in the new graduate labour market in cities such as Barnsley, Chatham and Blackburn reflects the weakness of the private sector in these areas, rather than an oversized public sector. Figure 22 shows that cities that are most reliant on publicly funded sectors for new graduate jobs also tend to have the lowest numbers of private-sector positions for university leavers.
If these cities are to attract and retain a greater number of graduates, they will need to focus on policies that support the private sector to create graduate-level opportunities to complement the positions available in public administration, education and health.
Graduates in KIBS jobs (%)20.1 - 27
15.1 - 20
10.1 - 15
7.1 - 10
4.3 - 7
Dundee
EdinburghGlasgow
NewcastleSunderland
Middlesbrough
Hull
York
Leeds
Swansea
Cardiff
Newport
Bristol
Gloucester
Exeter
Plymouth
Portsmouth
Aberdeen
Southampton
BournemouthBrightonWorthing
SouthendBasildon
Chatham
Crawley
London
Norwich
Ipswich
Peterborough
AldershotReading
Swindon
Oxford
Milton Keynes
Northampton
Luton
Cambridge
Stoke
Telford
BirminghamCoventry
Leicester
Nottingham
Mansfield
Derby
Sheffield
DoncasterWakefield
Bradford
BirkenheadLiverpool
Wigan
Manchester
Burnley
BlackpoolPrestonBlackburn
Warrington
Barnsley
Slough
Huddersfield
Dublin
Graduates in publicly funded jobs (%)
27.4 - 35
35.1 - 40
40.1 - 50
50.1 - 60
60.1 - 67.5
Dundee
EdinburghGlasgow
Dublin
NewcastleSunderland
Middlesbrough
Hull
York
Leeds
Swansea
Cardiff
Newport
Bristol
Gloucester
Exeter
Plymouth
Portsmouth
Aberdeen
Southampton
BournemouthBrightonWorthing
SouthendBasildon
Chatham
Crawley
London
Norwich
Ipswich
Peterborough
AldershotReading
Swindon
Oxford
Milton Keynes
Northampton
Luton
Cambridge
Stoke
Telford
BirminghamCoventry
Leicester
Nottingham
Mansfield
Derby
Sheffield
DoncasterWakefield
Bradford
Birkenhead
LiverpoolWigan
Manchester
Burnley
BlackpoolPrestonBlackburn
Warrington
Barnsley
Slough
Huddersfield

28
The Great British Brain Drain • November 2016
www.centreforcities.org
Figure 22: The publicly-funded and private sectors in the new graduate jobs market, 2013/14-2014/15
Source: HESA destination of leavers survey, ONS population estimates
Box 5: The role of publicly funded industries in the new graduate labour market
The public sector plays a significant role in the graduate labour market. Publicly-funded jobs make up around 27 per cent of all jobs in Britain. But for new graduates, they accounted for 46 per cent of all jobs the 2013/14 and 2014/15 cohort took up. This was dominated by education and health workers, who accounted for 37 per cent of all new graduate jobs.
Industries where new graduates worked, 2013/14-2014/15
Source: HESA destination of leavers survey
Aberdeen
Aldershot
Barnsley
Basildon
Belfast
Birkenhead
Birmingham
Blackburn
Blackpool
Bournemouth
Bradford
Brighton
Bristol
Cambridge
Cardiff
Chatham
Coventry
Crawley
Derby
Dundee
Edinburgh
Exeter
Glasgow
Gloucester
Huddersfield
Hull
Leeds
Leicester
Liverpool
London
Luton
Manchester
Mansfield
Middlesbrough
Milton Keynes
Newcastle
Newport
Northampton
Norwich
Nottingham
Oxford
Peterborough
PortsmouthPreston
Reading
Sheffield
Slough
Southampton
Southend
Stoke
Sunderland
Swansea
SwindonTelford
Wakefield
Warrington
Wigan
Worthing
York
25
30
35
40
45
50
55
60
65
70
0 20 40 60 80 100 120
Shar
e of
gra
duat
es w
orki
ng in
pub
licly
-fun
ded
jobs
(%)
-
Number of respondents working in the private sector per 10,000 population
2% 1%
15%
2%
5%
30%
46%
1%
Construction
Extraction
KIBS
Logistics and communications
Manufacturing
Other private services
Publicly funded services
Utilities
29
The Great British Brain Drain • November 2016
www.centreforcities.org
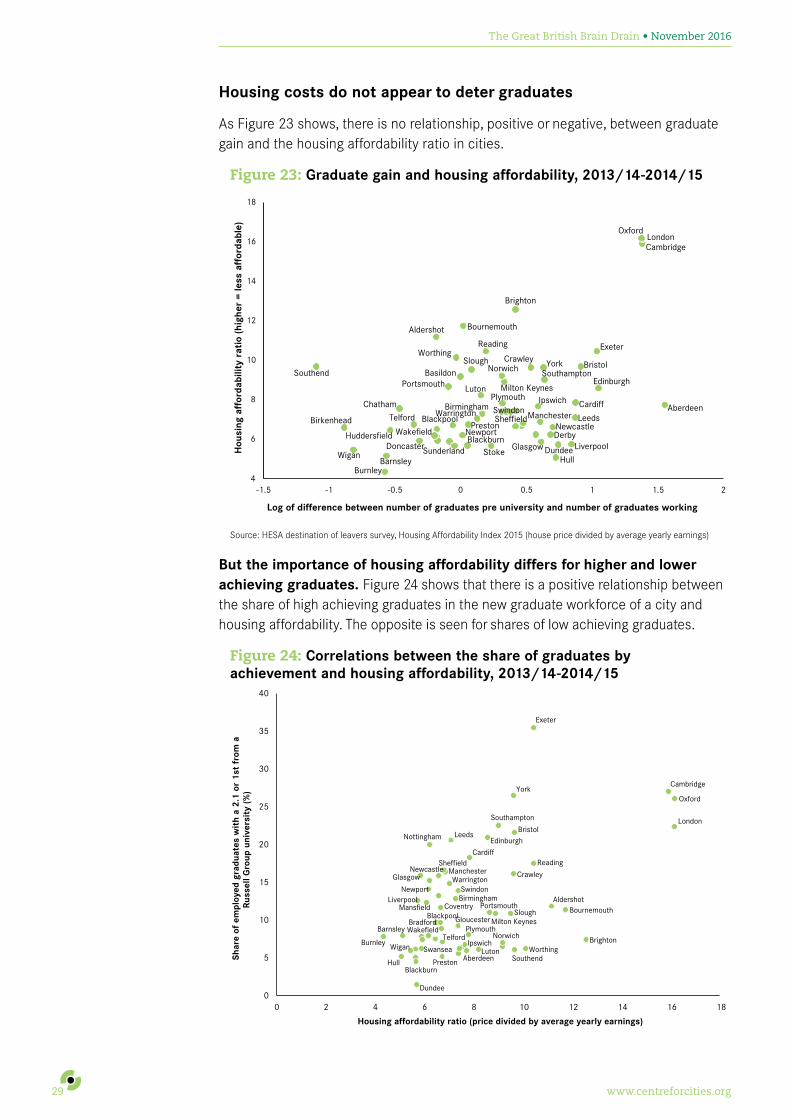
Housing costs do not appear to deter graduates
As Figure 23 shows, there is no relationship, positive or negative, between graduate gain and the housing affordability ratio in cities.
Figure 23: Graduate gain and housing affordability, 2013/14-2014/15
Source: HESA destination of leavers survey, Housing Affordability Index 2015 (house price divided by average yearly earnings)
But the importance of housing affordability differs for higher and lower achieving graduates. Figure 24 shows that there is a positive relationship between the share of high achieving graduates in the new graduate workforce of a city and housing affordability. The opposite is seen for shares of low achieving graduates.
Figure 24: Correlations between the share of graduates by achievement and housing affordability, 2013/14-2014/15
Aberdeen
Aldershot
Barnsley
Basildon
Birkenhead
Birmingham
Blackburn
Blackpool
Bournemouth
Brighton
Bristol
Burnley
Cambridge
CardiffChatham
Crawley
DerbyDoncaster Dundee
Edinburgh
Exeter
GlasgowHuddersfield
Hull
Ipswich
Leeds
Liverpool
London
Luton
Manchester
Milton Keynes
NewcastleNewport
Norwich
Oxford
Plymouth
Portsmouth
Preston
Reading
Sheffield
SloughSouthamptonSouthend
StokeSunderland
SwindonTelford
Wakefield
Warrington
Wigan
WorthingYork
4
6
8
10
12
14
16
18
-1.5 -1 -0.5 0 0.5 1 1.5 2
Hou
sing
aff
orda
bilit
y ra
tio
(hig
her
= le
ss a
ffor
dabl
e)
Log of difference between number of graduates pre university and number of graduates working
Shar
e of
em
ploy
ed g
radu
ates
wit
h a
2.1
or 1
st f
rom
aRu
ssel
l Gro
up u
nive
rsit
y (%
)
Housing affordability ratio (price divided by average yearly earnings)
Shar
e of
em
ploy
ed g
radu
ates
wit
h a
2.ii
or
less
fro
m a
non-
Russ
ell G
roup
uni
vers
ity
(%)
Housing affordability ratio (price divided by average yearly earnings)
Aberdeen
Aldershot
Barnsley
Birmingham
Blackburn
BlackpoolBournemouth
Bradford
Brighton
Bristol
Burnley
Cambridge
Cardiff
Coventry
Crawley
Dundee
Edinburgh
Exeter
Glasgow
Gloucester
Hull
Ipswich
Leeds
Liverpool
London
Luton
Manchester
Mansfield
Milton Keynes
Newcastle
Newport
Norwich
Nottingham
Oxford
Plymouth
Portsmouth
Preston
ReadingSheffield
Slough
Southampton
SouthendSwansea
Swindon
TelfordWakefield
Warrington
Wigan Worthing
York
0
5
10
15
20
25
30
35
40
0 2 4 6 8 10 12 14 16 18
Aberdeen
Aldershot
Barnsley
BasildonBirmingham
Blackburn
BournemouthBradford
Brighton
Bristol
Burnley
Cambridge
Cardiff
Crawley
Dundee
Edinburgh
Exeter
HullIpswich
LeedsLiverpool
London
Luton
Manchester
Middlesbrough
Milton KeynesNewcastle
MansfieldOxford
Portsmouth
Preston
ReadingSheffield
Slough
SouthendStoke
Sunderland
Swansea
WakefieldWigan
Worthing
York
0
10
20
30
40
50
60
0 2 4 6 8 10 12 14 16 18

30
The Great British Brain Drain • November 2016
www.centreforcities.org
Source: HESA destination of leavers survey, Housing affordability ratio 2015 (house price divided by average yearly earnings)
While conclusions must be drawn with caution, the charts suggest that the importance of accessing job opportunities in stronger economies may be a bigger driver for higher achieving graduates than lower achieving ones and that housing cost factors do deter lower achieving graduates from staying in or moving to cities with high housing costs relative to wages.
Amenities matter but not as much as employment factors
Commentators often highlight quality of place factors as key influences on the location decisions of graduates. However, research from Sweden showed that skilled migrants gave much greater weight to jobs than the availability of amenities.11 And these findings are echoed in specific studies on Brighton and Dublin.12
While amenities clearly have an effect it is important not to over-state their influence. Figure 25 shows the share of graduates working in higher level occupations13 in a city against its graduate gain. The only cities that have a graduate gain with a markedly lower share of graduates working in top occupations were Norwich, Ipswich, York and Cardiff (suggesting these graduates are ‘underemployed’ in lower skilled jobs). One reason for this could be the quality of life on offer in these cities. While these cities undoubtedly have good quality amenities their amenity offer does not appear to be exceptional compared to many other cities in the UK.14
11 Niedomysl, T and Hansen, H. (2010) ‘What Matters more for the Decision to Move: Jobs versus Amenities’ environ Plan A. Vol no. 7. PP. 1636-49.
12 Pollard E, Cowling M, Barber L, Millmore B and Hunt W (2008) ‘The Brighton factor: new graduates and their local labour market’ (Report 450) Institute for Employment Studies, Mantell Building, University of Sussex Campus; Lawton, P. Murphy, E. and Redmond, D. (2013) ‘Residential preferences of the ‘creative class’?’. Cities, 31 (2): 47-56
13 Defined as the Standard Industrial Codes managers, directors and senior officials, professional occupations and associate professional and technical occupations.
14 Another explanation could be that a number of students are choosing to remain in the city that they grew up in, but a relatively low share of working graduates in these cities grew up in them.
Shar
e of
em
ploy
ed g
radu
ates
wit
h a
2.1
or 1
st f
rom
aR
usse
ll G
roup
uni
vers
ity
(%)
Housing affordability ratio (price divided by average yearly earnings)
Shar
e of
em
ploy
ed g
radu
ates
wit
h a
2.ii
or
less
fro
m a
non-
Rus
sell
Gro
up u
nive
rsit
y (%
)
Housing affordability ratio (price divided by average yearly earnings)
Aberdeen
Aldershot
Barnsley
Birmingham
Blackburn
BlackpoolBournemouth
Bradford
Brighton
Bristol
Burnley
Cambridge
Cardiff
Coventry
Crawley
Dundee
Edinburgh
Exeter
Glasgow
Gloucester
Hull
Ipswich
Leeds
Liverpool
London
Luton
Manchester
Mansfield
Milton Keynes
Newcastle
Newport
Norwich
Nottingham
Oxford
Plymouth
Portsmouth
Preston
ReadingSheffield
Slough
Southampton
SouthendSwansea
Swindon
TelfordWakefield
Warrington
Wigan Worthing
York
0
5
10
15
20
25
30
35
40
0 2 4 6 8 10 12 14 16 18
Aberdeen
Aldershot
Barnsley
BasildonBirmingham
Blackburn
BournemouthBradford
Brighton
Bristol
Burnley
Cambridge
Cardiff
Crawley
Dundee
Edinburgh
Exeter
HullIpswich
LeedsLiverpool
London
Luton
Manchester
Middlesbrough
Milton KeynesNewcastle
MansfieldOxford
Portsmouth
Preston
ReadingSheffield
Slough
SouthendStoke
Sunderland
Swansea
WakefieldWigan
Worthing
York
0
10
20
30
40
50
60
0 2 4 6 8 10 12 14 16 18

31
The Great British Brain Drain • November 2016
www.centreforcities.org
Figure 25: Graduates employed in higher level occupations and the ‘graduate gain’, 2013/14-2014/15
Source: HESA destination of leavers survey
Summary
• The availability of jobs appears to be the biggest factor influencing new graduate mobility patterns, with the availability of career progression opportunities appearing to be more important than graduate wage levels.
• Big cities are particularly attractive to graduates because their labour markets are able to offer a wide range of job and career progression opportunities.
• Many cities are reliant on the public sector for graduate-level jobs. But those cities that are more reliant on publicly funded sectors for graduate jobs tend to see smaller inflows of new graduates. This is the result of a lack of job opportunities and career progression within the private sector rather than an over-sized public sector.
• Graduates do not seem to be detered from moving to cities with high housing costs. This is particularly the case for graduates that achieved a first or upper second class degree from a Russell Group university.
Aberdeen
AldershotBarnsley
Basildon
BelfastBirkenhead Birmingham
Blackburn
Blackpool
Bournemouth
Bradford
Brighton
Bristol
Burnley
Cambridge
Cardiff
Chatham
Coventry
Crawley
DerbyDoncaster Dundee
Edinburgh
Exeter
Glasgow
Gloucester
Huddersfield
Hull
Ipswich
Leeds
Leicester
Liverpool
London
Luton
Manchester
Mansfield
Middlesbrough
Milton KeynesNewcastle
NewportNorthampton
Norwich
Nottingham
Oxford
Plymouth
Portsmouth
Preston
Reading
Sheffield
Slough
Southampton
Southend
Stoke
Sunderland
Swansea
Swindon
Telford
Wakefield
Warrington
Wigan
Worthing
York
67
69
71
73
75
77
79
81
83
85
-1.5 -1 -0.5 0 0.5 1 1.5 2
Shar
e of
gra
duat
es in
hig
h-sk
illed
occ
upat
ions
(%)
Log of the difference between number of students pre university and number of graduates

32
The Great British Brain Drain • November 2016
www.centreforcities.org
Do graduates return home in later life?
Using Census data once again, Figure 26 shows the net flows between London and other cities in England and Wales by age. Between 22 and 25, the capital sees a net inflow from almost every other city. This changes for the 31 to 45 age group, when it loses population to a number of cities. There are several points to note from these patterns.
London still gained older degree-holders from some cities, including Birmingham and Leeds, but the majority of cities (37 out of 57) saw a net inflow of older graduates from London.
While overall London loses older degree-holders to the rest of the country, the majority of these do not tend to go very far. Of the older degree-holders who left London, 69 per cent remained in the Greater South East.
And because the majority of older degree-holders leaving London remain in the Greater South East, cities such as Aldershot, Basildon, Chatham, Crawley, Slough and Worthing gain a higher number of older degree-holders than they lose young graduates to the capital.
For many other cities, the number of older graduates they attract from London is dwarfed by the number of younger graduates they lose to the capital to work. Cities such as Bristol, Nottingham and Manchester each lose around 30 per cent of their young graduates to London, but do not attract older degree-holders back to their cities on anywhere near the same scale, attracting less than half the number in return.

33
The Great British Brain Drain • November 2016
www.centreforcities.org
Figure 26: Net flows to London of degree holders aged 22-25 and 31-45, 2011
!
!
!
!
!
!
!
!
!
!
!
!
!
!
!
!
!
!
!
!
!
!
!
!
!
!!
!
!
!
!
!
!
!
!
!
!
!
!
!
!
!
!
!!
!
!
!
!
!
!
!
!
!
!
!
!
!
Net flow of graduates toLondon 22-25, 2011
Manchester (1,251)
401 - 1100
176 - 400
66 - 175
1 - 65
Slough (-4)
NewcastleSunderland
Middlesbrough
HullYork
LeedsWakefield
Swansea
Cardiff
Newport
Bristol
Exeter
Plymouth
Portsmouth
Southampton
Bournemouth
Brighton
CrawleyAldershot
Worthing
Chatham
SouthendBasildon
Peterborough
London
Norwich
Ipswich
Reading
OxfordGloucester
Swindon
Northampton
Milton Keynes
Luton
Cambridge
Stoke
Birmingham
Telford
Coventry
Leicester
Nottingham
Mansfield
Derby
SheffieldDoncaster
Bradford
LiverpoolWigan
BirkenheadWarrington
MachesterBarnsley
PrestonBlackburn
BlackpoolHuddersfield
Burnley
Net flows to London of degreeholders aged 31-45, 2011
-523 – -300 -
-299 – -100 -
-99 – 0
1 – 50
51 – 100 -
NewcastleSunderland
Middlesbrough
HullYork
LeedsWakefield
Swansea
Cardiff
Newport
Bristol
Exeter
Plymouth
Portsmouth
Southampton
Bournemouth
Brighton
CrawleyAldershot
Worthing
Chatham
SouthendBasildon
Peterborough
London
Norwich
Ipswich
Reading
OxfordGloucester
Swindon
Northampton
Milton Keynes
Luton
Cambridge
Stoke
Birmingham
Coventry
Leicester
Nottingham
Mansfield
Derby
SheffieldDoncaster
Bradford
LiverpoolWigan
BirkenheadWarrington
MachesterBarnsley
PrestonBlackburn
BlackpoolHuddersfield
Burnley
Source: ONS
34
The Great British Brain Drain • November 2016
www.centreforcities.org
Box 6: Examples of graduate attraction and retention policies
Cities across the UK have introduced initiatives with the aim of retaining a greater share of graduates in their city after they have completed their studies, and attracting those graduates that studied elsewhere to move to their city for work.
Broadly, these graduate retention and attraction strategies utilise one or more of three main approaches: improving graduate employability, subsidising graduate wages, and matching graduates to jobs.
Improving graduate employability
Many universities run schemes for their students to help them develop their employment skills. These schemes involve work-related learning opportunities and tailored career development training on issues like communication, self-awareness and entrepreneurship.
• Graduate Advantage in the West Midlands aims to change the attitude of employers – SMEs in particular – who often see graduates as expensive and footloose. It helps SMEs to hire graduates on a temporary basis to demonstrate the value they can add and graduates in turn can see that small firms can make good use of their skills and offer career development opportunities. Through close links with local organisations and employers, the programme is able to stay aware of what skills and vacancies employers have, and to share feedback from firms that have taken on a new graduate with firms interested in doing so.
• World of Work was established in 2009 by Liverpool John Moores University (LJMU) and their partners. The initiative has a network of 400 firms that provide regular feedback to students on the core skills they want from new graduate hires. The employers’ engagement with students also means they are aware of the skills new graduates have and can encourage them to apply for positions in their firms.
• Knowledge Transfer Partnerships (KTPs) operate throughout the UK to bring local universities, businesses and graduates together to help businesses grow and provide graduates with work experience and jobs. Over 80 per cent of graduates who complete a KTP are offered a permanent job at the end of the programme. Graduates don’t have to have studied at the university or have lived in the area. Sheffield Hallam University, for example, promotes its KTPs to local businesses and graduates and the majority of the university’s KTPs are filled by graduates from the Yorkshire and Humber region.
• Coventry, Cranfield, Warwick and Loughborough Universities offer an MSc in Control Systems and Vehicle Engineering which has been designed with and for Jaguar Land Rover engineers, which has its UK base in the East Midlands.

35
The Great British Brain Drain • November 2016
www.centreforcities.org
Subsidising graduate wages
These schemes focus on reducing the costs to employers of hiring a graduate through offering a wage subsidy.
• In 2011, Glasgow City Council set up the Graduate Commonwealth Fund, targeted at graduates living in the city who have been unemployed for three months. The initiative funds 50 per cent of the graduate’s wages for one year (up to £10,000) on the condition that the new job is additional, permanent, and requires graduate-level or professional skills.
• The Plymouth Graduate Internship Programme (PGIP) connects Plymouth University with businesses based in the South West and is open to graduates of any UK university or FE college. Launched in 2010, PGIP offers employers financial assistance towards creating eight week minimum graduate internships paying at least £300 per week. By 2014 the scheme had supported 84 graduates to take up positions at 60 firms.
Matching graduates to jobs
Many initiatives, often led by universities, focus on improving the links between graduates and businesses within a city region, with the university often acting as a broker between the two. These initiatives help graduates to look for jobs within the city region and increase employers’ access to skilled workers.
• Gradsouthwest is an independent body that offers a brokerage role between graduates and employers to retain graduate-level skills in the South West. Employers contact the organisation when they have a graduate role to fill, and Gradsouthwest places the advertisement on their website. Careers departments in local universities also refer students and graduates to GradSouthWest. The organisation also helps graduates moving into the region.
• As part of its broader Careers Service, the University of Manchester has also launched the Manchester Graduate Programme (MGP) that helps source graduate-level jobs based in Greater Manchester and specifically targeted towards University of Manchester graduates. Last year around 200 places were found.
• The University of Liverpool runs the Graduate to Merseyside programme which is open to any student living in Merseyside and helps promote local job opportunities and internships to students. The focus is on SMEs in Merseyside, with the university providing a recruitment service for employers. This means vacancies are advertised through the University, and applications are sent to the University. The University then short-lists for the employer, reducing the time and resources employers need to devote to recruitment.
36
The Great British Brain Drain • November 2016
www.centreforcities.org
Conclusions and Policy Recommendations
The future economic success of the UK is increasingly dependent on the ability of its cities to both attract and retain talent. And this is a big challenge for many of our cities. While the UK’s great universities are spread around the country, many new graduates head straight for the bright lights of the capital.
London employs 22 per cent of all working new graduates who move after university, and 38 per cent of those working new graduates who have a first or upper second class degree from a Russell Group university.
But it is not that cities outside London do not retain graduates – it is that they do not retain the majority of those students who move to their city to study. In Manchester, for example, 67 per cent of the students who went to study in the city left upon graduation. In Birmingham this figure was 76 per cent. In Southampton it was 86 per cent. And it is these people that drive the migration flows to the capital.
Despite the pull of London, most cities still experience a brain gain. This is because they attract more graduates to their city than the number of graduates who grew up in their city but leave to work elsewhere. It is also because their universities, to a varying degree, play an important role in ‘growing their own’ – educating students who grew up in the city and who stay after graduation to work.
The patterns of graduate migration appear to be primarily driven by job opportunities. But this is not just about the jobs or level of wages available today. There is no relationship between moving graduates and wages, which suggests that future career opportunities play an important role in influencing where graduates move to and why.

37
The Great British Brain Drain • November 2016
www.centreforcities.org
Policy recommendations
If a city wants to attract and retain a greater number of graduates, then it needs to focus on wider economic growth and job creation policies that support the creation of more jobs, and particularly high-skilled knowledge jobs, rather than focus on policies that are specifically targeted at graduate attraction and retention. In particular this means cities need to:
Focus on educational attainment to improve skills throughout the workforce
Cities and their partners – including universities and businesses – should concentrate on increasing the supply and quality of home-grown talent. Efforts to increase educational attainment of residents and improve workforce development should take priority. Improving schools will also help make cities more attractive for skilled workers with young families.
Focus on the economic fundamentals
Cities need to ensure that the factors that underpin successful city economies are in place and working well. This involves:
• a transport system that allows for efficient movement of goods and people around and into and out of the place;
• a housing market that enables people (existing and new) to find somewhere to live that meets their expectations; and
• a planning system that is adaptable and responsive to changing employment and residential trends and preferences.
Focus on helping to boost demand for high-skilled workers among businesses
Cities and partners should coordinate efforts to boost demand for high-skilled workers by concentrating on innovation, inward investment and enterprise policies. Importantly, cities should ensure that any resources are being deployed to maximum effect, and regularly reviewed and evaluated to identify options for improvement.
Recognise that universities are important but not crucial
Those cities that have quality higher education institutions should look to make the most of them. Cities need to work with their universities and businesses to increase the demand for graduates, as well as helping graduates find existing graduate jobs. And those cities that do not have universities need to think carefully about the costs and benefits of trying to acquire one.

November 2016
Centre for CitiesSecond Floor
9 Holyrood StreetLondon SE1 2EL
020 7803 [email protected]
© Centre for Cities 2016
Centre for Cities is a registered charity (No 1119841) and a company limited by guarantee registered in England (No 6215397)


![ritish HIV Association/ ritish Infection Association …...the oral cavity, gastrointestinal tract and genital tract of up to 75% of individuals [1]. Surveillance studies have consistently](https://img.pdfslide.us/doc/110x75/5e5c9f13172fee0b1274ed03/ritish-hiv-association-ritish-infection-association-the-oral-cavity-gastrointestinal.jpg)