Embed Size (px)
Citation preview

1
What really is Brain Drain?
Location of Birth, Education and Migration Dynamics of
African Doctors1
September 2014
Çaglar Özden David Phillips
World Bank Hope College
Abstract
Proper analysis of skilled migration flows and their impact requires joint identification of where migrants were born,
where they were educated and at what age they moved to the destination country. We focus on African born and/or
trained doctors practicing in the United States as an example to highlight these issues and identify key patterns in
their career paths. We overcome data constraints by merging data from the American Medical Association (AMA)
and American Community Survey (ACS) via propensity score matching techniques. Our results show that the
standard assumptions on skilled migration lead to considerable overestimation of its extent and hide several
economically important migration patterns. We find that almost half of African-born doctors were trained outside
their birth country. On the flip side, around 15 percent of all doctors trained in Africa were actually born outside the
continent. There is significant variation across countries in terms of age of migration levels, implying that many
African doctors migrate after years of service and that their human capital is not completely lost to their birth
countries. In short, global labor and education markets for high-skilled professionals are integrated in more nuanced
and thought-provoking ways than assumed in the literature.
1 We thank American Medical Association for the data used in this paper. We are grateful to Erhan Artuc, Michel
Beine, Simone Bertoli, Michael Clemens, Frederic Docquier, Gordon Hanson, Robert Lucas, Manjula Luthria,
Aaditya Mattoo, David McKenzie, Hillel Rapoport, Andrew Viteritti, Mathis Wagner and seminar participants at
Georgetown University, the World Bank, CEPR Conference at Nottingham University, the 6th International
Conference on Migration and Development, Syracuse University, Western Michigan University for comments and
suggestions. Contact information: Ozden: [email protected], Phillips: [email protected]. The findings,
conclusions and views expressed in this paper are entirely those of the authors and should not be attributed to the
World Bank, its executive directors and the countries they represent.

2
1. Introduction
High-skilled migration from poorer to wealthier countries, commonly referred to as “brain drain”,
is viewed with significant unease due to the vital role played by human capital in economic growth and
development processes. The key questions that link the migration and growth/development literatures2
concern where human capital is created and where it is utilized. The literature makes several simplifying
assumptions, such as education being obtained in the birth country, to deal with the data constraints that
emerge in answering these questions. We follow a different route and develop an empirical methodology
that enables us to jointly identify where the migrant doctors are born, where they are educated and at what
age they migrate, using African born and/or educated doctors in the U.S. as an example. Our results show
that the standard assumptions lead to considerable overestimation of the extent of high skilled migration
and hide several economically important migration patterns.
Over the last decade, rigorous empirical research has begun to catch up with the earlier analytical
models3 and to aid policy evaluation (Hanson, 2010, Docquier & Rapoport, 2012). Newly available
migration databases and the subsequent economic analyses depend on two critical assumptions. First,
country of birth is generally equated with the country of education.4 This definition results from reliance
on census-type data sources where birth location is used as the main determinant of migration status. As a
result, human capital obtained in the destination country is generally attributed to the birth country.
Second, time spent in the country of education after graduation is almost always ignored. The literature
often assumes that a migrant moves right after graduation and that his human capital is only utilized in the
destination country. Since most skilled migration takes place from poor developing countries to wealthier
OECD countries, both of these assumptions are likely to lead to biases regarding its extent and impact.
However, an Ethiopian-born, British-educated professional who moved to the United States in the middle
of his career matters for the education, labor and fiscal policies of all three countries. We need more
detailed information on the educational and professional paths to properly identify skilled migration
patterns and their effect on all of the countries that these paths happen to cross.
Collection of extensive personal data through surveys is one option to address these issues, but
likely to be prohibitively costly. Instead, we develop a propensity score matching technique to merge two
different existing data sets with complementary types of information. The first is the administrative data
from the American Medical Association (AMA) that covers education histories of doctors. The second
2 We interpret “growth” literature very broadly to include a wide range of issues in development, labor market and
education. 3 Bhagwati and Yamada, (1974) and Stark, Helmenstein, and Prskawetz, (1997) are examples of the earlier
theoretical work. 4 See Docquier and Marfouk (2006), Ozden et. al. (2011), and Artuc et.al. (2014), as examples.

3
source is the census-type data from the American Community Survey (ACS) on the place of birth and age
of migration of a representative sample of African-born doctors. Our matching technique links doctors
that are similar in the two datasets to fully characterize their career paths. We are freed from making the
two assumptions listed above and are able to identify where our African doctors were born, where they
were educated and at what age they migrated to the U.S.
Our results identify complex migration patterns and detailed answers to the questions on where
human capital is created and utilized. For example, almost half of the African-born doctors were not
trained in Africa but in many different parts of the world, including South Asia and the Caribbean. These
patterns imply many existing studies might be overestimating brain drain levels and certain effects, such
as the fiscal burden on countries of birth. On the other hand, 15 percent of the African-trained doctors
came from countries outside Africa, including the West, challenging the widely shared belief that skilled
migration is a one-way drain from poorer to wealthier countries. In terms of when they migrate, we find
that many doctors spend quite a few years between their graduation at home and migration to the US,
implying that countries of education do not immediately and fully lose the human capital generated within
their borders. Finally, we observe substantial heterogeneity across African countries in terms of all of our
results. This should caution all policymakers against making generalizations based on evidence from a
single country.5
There are several reasons why we focus on doctors, especially those from Africa.6 The first is
data availability. Due to licensing requirements in medical professions, administrative data records on
medical training (school name and location) can be obtained for virtually every doctor in the United
States. No other profession has such requirements and extensive data availability. Second, migration of
health professionals holds a prominent place in the literature on skilled migration. There are few issues
that generate as much emotion and controversy as the impact of medical migration, especially of African
doctors to OECD countries (see for example Chen and Boufford, 2005). The concern is that the exodus of
African doctors will undermine the quality and delivery of healthcare services with long lasting negative
effects as many African countries struggle with crushing healthcare burdens. As a result, migration of
African doctors has become the symbol of brain drain in many policy debates. Former WHO Director
General Lee Jong-wook’s (2006) statement that migration of African doctors leads to “loss of hope and
years of investment” succinctly captures the existing sentiment.
The extent of this “loss”, however, depends crucially on where education is obtained. This is
especially true in the case of medical professions where education is expensive and publicly financed out
5 See Gibson and McKenzie, 2011 for a detailed discussion on brain drain.
6 See Easterly and Nyarklo (2009) for an interesting discussion on skilled migration from Africa.

4
of rather tight budgets, demand is outstripping supply in almost every country and provision of health
services generates important development spillovers. As an illustration, consider a radiologist who was
born in Ghana, came to the United States to complete his tertiary and medical education, and continues to
practice there. On the other hand, consider a surgeon who came to the US after completing her medical
school in Ghana. By the country of birth criteria, both are part of Ghanaian medical brain drain. However,
arguments against migration due to the fiscal burden imposed (e.g. Bhagwati and Hamada, 1974) would
imply that our surgeon creates more of a “loss” for Ghana since she was trained at home while the
radiologist did not impose any financial or opportunity costs since he was trained overseas. On the other
side of the coin, someone accounting for the effect of migration on overall skill levels, health care
staffing, or health outcomes in Ghana may want to use a country of birth definition, because a high-ability
student migrating at an early age could lead to reduced positive externalities. The situation becomes
further complicated if we extend our list to include a pediatrician who was born in Ghana, trained in
Canada and migrated to the US. For which does she exactly represent a “loss”: Canada or Ghana? A final
issue arises when we focus on the age at which our Ghanaian trained surgeon migrates to the United
States. In terms of human capital mobility and impact on Ghana, migrating right after medical school or at
age 45 after two decades of practice in Ghana differ significantly, with the latter presumably generating
social externalities that compensate for the public funds that paid for her education. The Ministry of
Health and the University of Ghana Medical School would need this information in order to better design
their long-term human resource and education policies. One of our goals is to highlight the importance of
the differences between our Ghanaian radiologist, surgeon and pediatrician with respect to public policy.
These differences are not captured and analyzed in the existing literature but matter greatly for welfare
analysis and policy discussion concerning origin, transit and destination countries.
Data constraints are the main obstacles in the high skilled migration literature, especially in
answering questions regarding location of education and timing of migration. Last decade witnessed an
impressive leap forward but there are many remaining challenges, as discussed by Hanson (2010) in
detail. Among the earlier work, the Docquier-Marfouk (2008) and OECD-DIOC bilateral skilled
migration databases include only OECD destinations and use a location of birth classification. These were
extended by OECD DIOC-E to cover numerous non-OECD destinations and predict skilled migration
levels for the whole world (Artuc et al, 2014). The shortcomings created by the location of birth
classification have received significant attention (Docquier and Rapoport, 2012). Realizing this dilemma,
Beine, Docquier and Rapoport (2007) and OECD extended their original database, dividing bilateral
migration stocks into several sub-categories based on age of migration cutoffs as a proxy for location of
education. This is a much needed advance in terms of the data but can still leave unresolved issues. For
example, we can classify tertiary educated migrants as birth (destination) country educated if they arrived

5
after (before) age 22, presumably the age at which most people complete their university education.
However, age of university graduation varies widely across countries and professions as we see in our
data. Furthermore, it is possible that many migrants were trained in a country other than their birth or
destination country, as confirmed by many African migrant doctors trained in Europe, South Asia and the
Caribbean.
Despite its importance, the literature on migration of healthcare professionals also ignores joint
identification of location of birth and training. Most existing studies prefer to choose one criteria or the
other, highlighting their reasons for their choices. For example, Clemens and Patterson (2006) use
country of birth; Mullan (2005) and Okeke (2009) use country of training; and the most ambitious cross-
country panels use a pragmatic mixture of the two depending on which is available from different
destination countries (Bhargava and Docquier, 2008; Bhargava, Docquier, and Moullan, 2011). The
empirical literature then uses these varied definitions to test common hypotheses regarding the
determinants of medical migration, the possibility of medical brain gain, and potential health effects of
physician migration using cross-country data (see above citations; Clemens, 2007; Kangasniemi, et. al.
2007).
Popular press and even policy analyses provide a relatively simplistic view of skilled migration,
in which a person is born and trained in a developing country and then migrates after graduation to a
wealthier country where incomes are higher. This story is undoubtedly true for many migrants. However,
examining the data on African born and/or trained doctors in the U.S. indicates that this view
oversimplifies reality. The lives and careers of African doctors, and likely other groups of skilled
migrants, follow many possible paths that all carry unique public policy implications. We focus on
African doctors due to availability of detailed education data and their prominent role in the brain drain
debate. However, it is important to note that our methods and conclusions can probably be applied to
other professions and regions. Further analysis will surely uncover other interesting patterns in the global
labor market for skills. Completing this picture remains the critical issue.
The next section explains the data used in the paper, followed by a detailed description of the
empirical methodology. We then present our main results, discussing the major distinctions between
location of birth and education numbers for various countries in Africa. We follow up with the age of
migration results and then conclude the paper.

6
2. Data
2.1. American Medical Association Data
Records from the American Medical Association’s (AMA) Physician Masterfile (AMA-PM) are
our main data source. The Masterfile provides academic, professional and basic demographic
information on all doctors who have either entered a medical school in the United States or who were
trained outside but obtained licenses in the United States. Since the Masterfile covers all points of entry
to the medical profession in the United States, the database provides a comprehensive source of data for
licensed doctors in the United States.7 In the data collection, AMA coordinates with many agencies,
institutions, and organizations, including medical schools, post-graduate programs, state licensing boards,
the Educational Commission for Foreign Medical Graduates (ECFMG), and the American Board of
Medical Specialties (ABMS).
We obtained an extract from the Masterfile in 2011 including all doctors for whom the AMA lists
(i) an African country as their country of birth or (ii) a medical school located in Africa as their location
of training. The list includes all countries in sub-Saharan Africa as well North Africa. From this extract,
we limit our focus to those doctors who are under the age of 65. This prevents counting retired doctors
(who may still be listed in the Masterfile). In addition, this cutoff assists in matching AMA data to the
American Community Survey (ACS) data that we describe later in this section. The individual records
from the Masterfile include name, gender, age, name of the medical school attended, year of graduation,
year of birth, current address and primary specialty.
Because training information is required for accreditation and professional licensing, the data for
school of medical training is complete. For each individual, we identify the geographic location of
medical school listed using International Medical Education Directory (IMED)8. For ease of presentation
and due to the data requirements of our methods (see section 3), we group all possible countries of
training into 19 regions, 13 of which are in Africa and 6 of which are regions outside Africa. Among the
13 regions in Africa, 10 are relatively larger individual countries: Egypt, Ethiopia, Ghana, Kenya, Liberia,
Nigeria, South Africa, Sudan, Uganda and Zimbabwe. The other three are geographic regions that capture
the rest of the African countries since they generally have small number of doctors in the US. These are
(i) Other East Africa, (ii) Other North Africa, (iii) Other West, Central, and Southern Africa. Finally, the
six regions outside Africa are the following: (i) United States, (ii) Other English speaking developed
7 See http://www.ama-assn.org/ama/pub/about-ama/physician-data-resources/physician-masterfile.page for a more
detailed description of the data. 8 International Medical Education Directory (IMED) is a public database of worldwide medical schools and is
published as a joint collaboration of the Educational Commission for Foreign Medical Graduates (ECFMG) and the
Foundation for Advancement of International Medical Education and Research (FAIMER).
7
countries (United Kingdom, Canada, Australia, New Zealand and Ireland), (iii) non-English speaking
Europe, (iv) the Caribbean, (v) South Asia and (vi) the rest of the world. In the rest of the paper that
follows, we refer to these 19 groupings interchangeably as countries, locations, and regions.
Summary statistics of the AMA Masterfile are presented in Table 1. Column 1 shows the location
of training. Among the countries in Africa, Egypt leads with 27 percent of the total (of 15,191 doctors in
the Masterfile) followed by Nigeria with 21 percent and South Africa with 9 percent. We should note that
there are also many African born doctors trained in the United States and they account for 17 percent of
the sample. In total, 26 percent of the AMA file is composed of African-born doctors who were trained
outside Africa. Column 3 lists the current mean age and Column 4 presents the fraction that is female for
each location of training.
Location of birth is one of the key variables in the migration literature, but, unfortunately, it is not
universally reported in the administrative AMA data. Non-response is quite common with only 55
percent of doctors in the sample answering this question even though the AMA strongly encourages it.
For instance, 63 percent of the African trained doctors and 47 percent of the total observations do not
report their country of birth.9 Finally, for those that report country of birth, we group the locations in the
same manner as with locations of training. As seen in Column 2, of the total number of observations in
the Masterfile, 17 percent were born in Egypt, 6 percent were born in Nigeria and 5 percent in each of
Ghana and Kenya.
At different points, we make use of other data from the AMA Masterfile. Current age, age at
graduation from medical school, and the census division in which the doctor practices are included in the
data. Gender and whether the doctor is D.O. or and M.D. are also listed. We group listed medical
specialties into 20 broad specialty groups.10
We also assign a variable for whether the doctor has an
ethnically Asian name. The fraction of the doctors with an Asian name is particularly high for Kenya,
Uganda and other East Africa, reflecting the historical ethnic composition of these countries due to their
colonial legacies. This variable is useful because African doctors of South Asian descent may behave
differently than other doctors in terms of their migration patterns.11
We assign this variable if the
9 Non-reporting is particularly high among Nigerian-trained doctors under the age of 45. Because response rates are
so low for this group, we code all such doctors as having missing country of birth. There are 204 such observations
out of 3,254 Nigerian-trained doctors. Due to unusually high reporting of the United States as a country of birth
among the few young Nigerians that do report country of birth, dropping these observations generates conservative
estimates of the number of African-trained but not African-born doctors. 10
They are anesthesiology, cardiovascular, emergency, family, gastroenterology, infectious disease, internal,
nephrology, neurology, OB/GYN, oncology, ophthalmology, orthopedics, pathology, pediatrics, psychiatry,
pulmonary, radiology, surgery, and other. 11
Nyarko (2010) points out that large fraction of the highly-skilled migrants in the United Kingdom from Southern
and Eastern Africa are Asian or white according to the 2001 census.

8
individual’s last name occurred at least 100 times in the 2000 US Census and at least 70 percent of
individuals with this name reported their ethnicity as Asian.12
Visual inspection confirms that these
names are almost entirely not only Asian, but also South Asian specifically.
2.2. American Community Survey Data
The second data source is the weighted five-year sample of the American Community Survey
(ACS) 2010 from the IPUMS. Our sample includes those individuals who report their birthplace to be in
Africa and physician as their current occupation. As with the AMA data, we limit the sample to those
under the age of 65. Most importantly for our purposes, the ACS data has complete information on
country of birth as well as additional data from which we can compute age at migration. On the other
hand, the ACS has two shortcomings. First, there is no information on training locations. Second, the
available data only cover a sample of the African-born doctors, rather than the AMA masterfile’s
complete universe of doctors.
We classify locations of birth into the same 13 groupings in Africa. Since the location of training
is not available, we cannot identify any doctor who was born outside but trained in Africa in the ACS.
This limitation forces us to use only the African born observations from the sample. A small number of
observations (36 out of 870) are only identified by region (for instance “East Africa, not stated/not
elsewhere classified”). We classify these observations in the various “other” categories according to the
region. An additional 30 observations are only listed as born in Africa. Our treatment of these
observations is described in the methods section. We also use current age and gender from the ACS data.
We can calculate age at migration as the difference between current age and how many years the person
has lived in the United States. Finally, we use state of residence to identify the census division in which
the person resides.
Table 2 provides the basic summary statistics for the ACS data in which there are 17,940 African-
born doctors. Among these, 23 percent were born in Egypt, 21 percent in Nigeria and 15 percent in South
Africa while the rest of Africa accounts for the remaining 41 percent. Column 3 presents the mean age,
column 4 lists the fraction that are female and the last column is the mean age of migration to the United
States. Egyptian and Sudanese doctors have the lowest ratio of females while Kenyans, Zimbabweans,
and Ghanaians have the lowest average age of migration.
12
Naming data can be found at http://www.census.gov/genealogy/www/data/2000surnames/index.html

9
3. Estimation Methods
Our goal is to estimate location of birth, location of training, and age at migration for all doctors
who are born and/or trained in Africa and are practicing in the U.S. as of the end of 2010. As described
above, the American Medical Association (AMA) Masterfile includes complete data on location of
training for all registered doctors but only partial data on location of birth and no data on age at migration.
The following Venn diagram helps in visualizing what data are available from the AMA.
Figure 1. Venn Diagram of the AMA dataset for location of birth and training
The left circle represents the doctors who were born in Africa while the right circle is for those
trained in Africa. Their intersection, areas B and E, represents the doctors born and trained in Africa. The
areas above the horizontal line denote the doctors who reported their country of birth in the AMA
Masterfile while the areas below the line are those who did not answer that question. In other words, we
know both the location of birth and training for those doctors in areas A, B and C. On the other hand,
doctors in areas E and F are in our file; we know that they were trained in an African country but we do
not know their actual country of birth. This implies we cannot differentiate whether if a doctor is in area E
or F, hence the presence of a dashed line between them. Finally, there is the area D which represents
doctors who were born in an African country but trained outside Africa and did not report their country of
birth to the AMA. These people are completely missing from the AMA file and are indistinguishable
from close to half a million other doctors in the database who did not report their country of birth.
FED
CBA
Trained in Africa .Born in Africa
Reported Country of birth
Did not report Country of birth

10
The American Community Survey (ACS) provides complete data on location of birth and age at
migration (along with numerous other demographic variables) but only for a nationally representative
sample of doctors. Unfortunately, ACS does not report country of education. To put it differently, we
observe a sample of the doctors in the circle on the left (areas A, B, D, E) but we do not know if these
people are in areas 𝐴 ∪ 𝐷 or they are in 𝐵 ∪ 𝐸, i.e trained outside or inside Africa.
Our key objective is to combine these different dimensions of information from the AMA
Masterfile and the ACS survey to construct a more precise picture of high skilled migration patterns. We
need to identify the location of birth, location of training and age of migration for these doctors by
matching the data as they are presented in different datasets. We proceed in three steps:
1. In the AMA data, we estimate the probability that an individual was born in each possible
location of birth for those who do not respond to the country of birth question (areas E and F in Figure 1).
We estimate these probabilities via propensity score matching which matches them to similar individuals
who do respond (areas B and C).
2. Second, we use the ACS data to estimate the size and distribution across countries of
“missing doctors” in the AMA data (area D). We first use totals from the ACS data to generate an
envelope that allows us to calculate the size of area D for each country of birth. Then we distribute these
missing doctors across (non-African) locations of training by matching ACS observations to similar AMA
observations with location of training data.
3. Finally, we estimate age at migration distributions. For African-trained doctors, we
match the AMA data (including estimated country of birth probabilities from step 1) to the ACS data to
estimate age at migration for each doctor in the AMA data. For doctors trained outside Africa, we simply
use the ACS data with estimated location of training from step 2.
3.1. Trained in Africa
Consider a doctor 𝑖 who lives in the United States, was born in location 𝐵𝑖 and received medical
education in location 𝐸𝑖. Define a series of indicator variables for whether that individual was born in
location 𝑏 and educated in location 𝑒.
𝐷𝑖𝑏𝑒 = 𝐼{𝐸𝑖 = 𝑒 𝑎𝑛𝑑 𝐵𝑖 = 𝑏}
For some individuals in the AMA data, 𝐷𝑖𝑏𝑒 can be observed but we do not observe it for others due to
missing location of birth data. As a result, the total number of immigrant doctors born in 𝑏 and trained in
𝑒, 𝑁𝑏𝑒, includes an observed and unobserved component:
11
𝑁𝑏𝑒 = ∑ 𝐷𝑖𝑏𝑒𝑖|𝐷𝑖𝑏𝑒 𝑜𝑏𝑠𝑒𝑟𝑣𝑒𝑑
+ ∑ 𝐷𝑖𝑏𝑒𝑖|𝐷𝑖𝑏𝑒 𝑢𝑛𝑜𝑏𝑠𝑒𝑟𝑣𝑒𝑑
= ∑ 𝐷𝑖𝑏𝑒𝑖|𝐷𝑖𝑏𝑒 𝑜𝑏𝑠𝑒𝑟𝑣𝑒𝑑
+𝑁𝑏𝑒∗
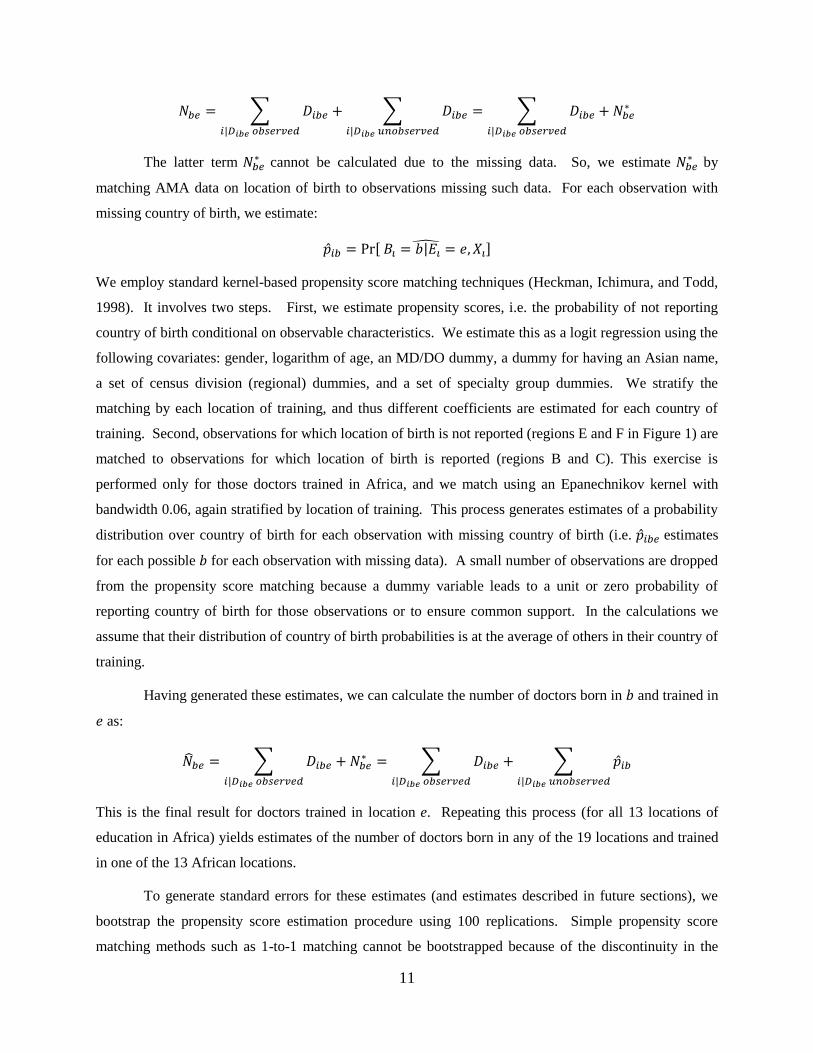
The latter term 𝑁𝑏𝑒∗ cannot be calculated due to the missing data. So, we estimate 𝑁𝑏𝑒
∗ by
matching AMA data on location of birth to observations missing such data. For each observation with
missing country of birth, we estimate:
�̂�𝑖𝑏 = Pr[ 𝐵𝑖 = 𝑏|𝐸𝑖 = 𝑒, 𝑋𝑖]̂
We employ standard kernel-based propensity score matching techniques (Heckman, Ichimura, and Todd,
1998). It involves two steps. First, we estimate propensity scores, i.e. the probability of not reporting
country of birth conditional on observable characteristics. We estimate this as a logit regression using the
following covariates: gender, logarithm of age, an MD/DO dummy, a dummy for having an Asian name,
a set of census division (regional) dummies, and a set of specialty group dummies. We stratify the
matching by each location of training, and thus different coefficients are estimated for each country of
training. Second, observations for which location of birth is not reported (regions E and F in Figure 1) are
matched to observations for which location of birth is reported (regions B and C). This exercise is
performed only for those doctors trained in Africa, and we match using an Epanechnikov kernel with
bandwidth 0.06, again stratified by location of training. This process generates estimates of a probability
distribution over country of birth for each observation with missing country of birth (i.e. �̂�𝑖𝑏𝑒 estimates
for each possible 𝑏 for each observation with missing data). A small number of observations are dropped
from the propensity score matching because a dummy variable leads to a unit or zero probability of
reporting country of birth for those observations or to ensure common support. In the calculations we
assume that their distribution of country of birth probabilities is at the average of others in their country of
training.
Having generated these estimates, we can calculate the number of doctors born in 𝑏 and trained in
𝑒 as:
�̂�𝑏𝑒 = ∑ 𝐷𝑖𝑏𝑒𝑖|𝐷𝑖𝑏𝑒 𝑜𝑏𝑠𝑒𝑟𝑣𝑒𝑑
+𝑁𝑏𝑒∗ = ∑ 𝐷𝑖𝑏𝑒
𝑖|𝐷𝑖𝑏𝑒 𝑜𝑏𝑠𝑒𝑟𝑣𝑒𝑑
+ ∑ �̂�𝑖𝑏𝑖|𝐷𝑖𝑏𝑒 𝑢𝑛𝑜𝑏𝑠𝑒𝑟𝑣𝑒𝑑
This is the final result for doctors trained in location e. Repeating this process (for all 13 locations of
education in Africa) yields estimates of the number of doctors born in any of the 19 locations and trained
in one of the 13 African locations.
To generate standard errors for these estimates (and estimates described in future sections), we
bootstrap the propensity score estimation procedure using 100 replications. Simple propensity score
matching methods such as 1-to-1 matching cannot be bootstrapped because of the discontinuity in the

12
matching process. However, kernel-based matching relies on continuous weights and thus does not suffer
from this particular problem. As such, the literature has generally supported using bootstrapping for
standard errors of kernel-based estimates (Abadie and Imbens, 2008).
3.2. Trained Outside Africa
We use the estimation in section 3.1 to fully construct the place of birth for doctors who are
trained in Africa (regions B, C, E, and F in Figure 1). However, there is still the issue of doctors who
were born in an African country but trained outside of Africa and declined to report their country of birth
to the AMA. As mentioned earlier, this group (area D in Figure 1) is not included in the extract from the
AMA masterfile used in this paper. We simply cannot observe their demographic and education
information or even know how many such individuals exist because they are observationally identical to
the larger population of doctors trained in the U.S., Europe, etc. who also refused to report their country
of birth. In order to identify this group, we combine the AMA Masterfile data with the 2010 file of the
ACS for all individuals who list “doctor” as their occupation and who report a birthplace in Africa.13
While the absence of education location information and the small sample make this dataset potentially
less reliable in counting African doctors, the data can be used to estimate how many African-born doctors
are missing from the AMA data extract, i.e. the size of area D in Figure 1. We do this in three steps.
First, we use ACS totals to provide an “envelope” for the number of immigrant doctors born in any
particular country. This corresponds to areas A, B, D, and E in Figure 1. Since we have the estimates of
areas A, B, and E from the AMA data and the previous section, we can determine the size of area D for
each country of birth in Africa. Second, we match the ACS data to the AMA data to determine how those
“missing doctors” should be distributed across countries of training outside Africa. Third, we implement
a Bayesian correction to the estimates that allows us to improve the estimates using variables not present
in both datasets.
Subject to sampling variation, the ACS data can measure the total number of doctors born in an
African country who are in the United States. Combined with the estimates from the AMA data (see
section 3.1), we can estimate the number of doctors born in a given country but trained outside of it as:
∑ �̂�𝑏𝑒𝑒|𝑒∉𝐴𝑓𝑟𝑖𝑐𝑎 = ∑ 𝜔𝑖𝑖|𝐵𝑖=𝑏 − ∑ �̂�𝑏𝑒𝑒|𝑒∈𝐴𝑓𝑟𝑖𝑐𝑎
The left side is the previously unknown number of doctors trained outside Africa but born in country
𝑏 (i.e. areas A+D); 𝜔𝑖 is the ACS sample weight of observation 𝑖 which is used in the first righthand side
13
There are some individuals for whom country of birth is vague. We categorize these with our “other” regional
groups when possible. For those listed as “Africa, not elsewhere counted/not specified” we omit them from the
propensity score matching but include them in the aggregate calculations by distributing them to the different
countries of birth according to the empirical distribution for observations where the location of birth is clear.

13
term to estimate the total number of doctors born in country 𝑏. The final righthand side term uses the
estimates from the previous section to net out the number of doctors trained within Africa. So, we obtain
an estimate for the total number of doctors born in any African country (areas A+D). An estimate of the
number of missing doctors (area D) can be obtained by subtracting off the number of doctors in the AMA
data who are trained outside Africa and report 𝑏 as country of birth. Due to sampling variation, this value
for “missing doctors” is slightly negative in two cases. For these two countries, we assume that there are
no missing observations in the AMA data, i.e. we estimate the total number of doctors trained outside of
Africa but born in these countries as the number of AMA respondents directly stating so.
This envelope method provides us with totals for the number of doctors born in each country and
trained outside of Africa. Next, we distribute these totals among different locations of training. We
perform a similar propensity score matching exercise to the one described above, but we use the ACS data
and flip the roles of location of birth and location of education. Since the location of education is not
observed for individuals in the ACS data, we match ACS observations to individuals in the AMA data
who were born in the same location (conditional on reporting country of birth). In other words, the ACS
observations will be now matched to areas A and B in Figure 1. All other details stay the same as above,
and we obtain estimated probabilities across location of training for each ACS observation:
p̂ie = Pr[𝐸𝑖 = 𝑒|𝐵𝑖 = 𝑏, 𝑋𝑖]̂
In the final stage, we implement a Bayesian correction to these propensity score estimates. Due
to the limited overlap between variables in the ACS and AMA datasets, the propensity score estimates
reflect matching on only three variables: age, gender, and census region of residence. While most of the
available variables in the ACS must thus be discarded, it is possible to improve the estimated location of
training probabilities by incorporating data on age of migration. In particular, we impose the restriction
that
1. If an ACS observation reports that an individual migrated to the United States at age 18 or earlier,
then it is the case that she was trained in the US.
2. If an ACS observation reports that an individual migrated to the United States at age 30 or later,
then it must be the case that he was trained outside the US.
These corrections are supported by the data. In the AMA Masterfile, there are no doctors who graduated
from medical school before the age of 18. Similarly, if an individual migrated to the US at age 30 (or
older) and then went to medical school, he would graduate, at the earliest, at age 34. There are few
African doctors in the AMA Masterfile who were born in Africa and graduated from an American
medical school after age 34. So, we assume that doctors arriving at age 30 or older were educated outside

14
the US. While this information cannot be directly matched to the AMA data, we implement a Bayesian
correction. We take the matching estimates �̂�𝑖𝑏𝑒 and update these probabilities to account for the age at
migration data. In particular, define �̃�𝑖𝑏𝑒 as the updated probability and 𝐴𝑖 as the age at migration. Then,
probability of being educated in the United States is:
�̃�𝑖,𝑈𝑆 = {
1 𝑖𝑓 𝐴𝑖 ≤ 180 𝑖𝑓 𝐴𝑖 ≥ 30�̂�𝑖,𝑈𝑆 𝑜𝑡ℎ𝑒𝑟𝑤𝑖𝑠𝑒
Conversely, the probability of being educated in country/location 𝑏 outside the United States is then:
�̃�𝑖𝑒 =
{
0 𝑖𝑓 𝐴𝑖 ≤ 18�̂�𝑖𝑒
1 − �̂�𝑖,𝑈𝑆 𝑖𝑓 𝐴𝑖 ≥ 30
�̂�𝑖𝑒 𝑜𝑡ℎ𝑒𝑟𝑤𝑖𝑠𝑒
where �̂�𝑖,𝑈𝑆 is the original estimated probability that observation 𝑖 was educated in the United States.
Updating our estimates with the age at migration information helps improve the estimates and counteract
the limited overlap between AMA and ACS variables.
Finally, we use the totals from the envelope and the updated probabilities �̃�𝑖𝑒 to generate
estimates of the aggregate number of doctors born in an African country 𝑏 and trained in a non-African
country 𝑒. We use the ACS data to calculate the aggregate probability of being educated in location 𝑒
(given that location of birth is 𝑏) as:
�̃�𝑒|𝑏 =1
𝑁𝑏∑ �̃�𝑖𝑒 ∗ 𝜔𝑖𝑖|𝐵𝑖=𝑏
where 𝜔𝑖 is the ACS survey weight of observation 𝑖 and 𝑁𝑏 is the sum of survey weights of ACS
observations born in location 𝑏. We then use these probabilities to distribute the envelope totals across
potential locations of training. For a non-African location of training 𝑒:
�̂�𝑏𝑒 = ( ∑ 𝜔𝑖𝑖|𝐵𝑖=𝑏
− ∑ �̂�𝑏𝑘𝑘|𝑘∈𝐴𝑓𝑟𝑖𝑐𝑎
) ∗�̃�𝑒|𝑏
∑ �̃�𝑘|𝑏𝑘∉𝐴𝑓𝑟𝑖𝑐𝑎
These results provide estimates on the number of doctors born in an African location and trained at a non-
African location for all such locations, i.e. country by country estimates of area A+D in Figure 1. This
completes joint estimation of country of birth and country of education for African immigrant doctors.

15
3.3. Estimating Age at Migration
The previous two sections describe how we estimate the relationship between location of birth
and location of training. Adding estimates of when African doctors migrate to the United States would
provide another critical piece of information about their career paths. The main complication is that the
ACS data has information on age at migration and location of birth, but it lacks information on location of
training, as noted previously. Meanwhile, the AMA data lacks data on age at migration while it has the
location of training. We combine these data again to estimate the age of migration distribution for each
location of birth-location of training (b,e) pair. There are three groups of doctors we need to be concerned
about and we approach each group differently:
1. For doctors born and trained in Africa (areas B and E in Figure 1), we estimate age at
migration in the AMA data by matching it to ACS observations.
2. For doctors born in Africa but trained outside (areas A and D), we simply use the ACS
data and the matched location of training from the previous section. We use separate methods for groups
1 and 2 to ensure that our age at migration estimates are based on the same data as the birth and training
location estimates.
3. For doctors trained in Africa but born outside Africa (areas C and F) we cannot estimate
age at migration. These doctors only appear in the AMA data but cannot be observed in the ACS and
thus their age at migration cannot be estimated.
3.3.1. Estimating Age at Migration for those Born and Trained in Africa
Since the AMA Masterfile does not include any information on age of migration, we must
estimate it by matching the AMA observations to similar ACS observations. As before, the matching
occurs only for observations within the same country of birth. In particular, the AMA data includes two
groups of people: those who report country of birth and those who do not. For those who did not report,
we estimated a probability distribution for country of birth over the 19 geographic locations in the first
section. When matching in this section, we include all AMA observations for which this probability is
greater than zero and match them to ACS observations born in country 𝑏. As before, we perform a
kernel-weighted matching based on gender, log of age, and census division dummies, and we estimate the
probability that age of migration for individual i:
�̂�𝑎𝑖 = Pr[𝐴𝑖 = 𝑎|𝑋𝑖, Pr{𝐵𝑖 = 𝑏} > 0]̂
This probability can be calculated for any value of 𝑎 to estimate the entire probability distribution of age
at migration for 𝑖.
16
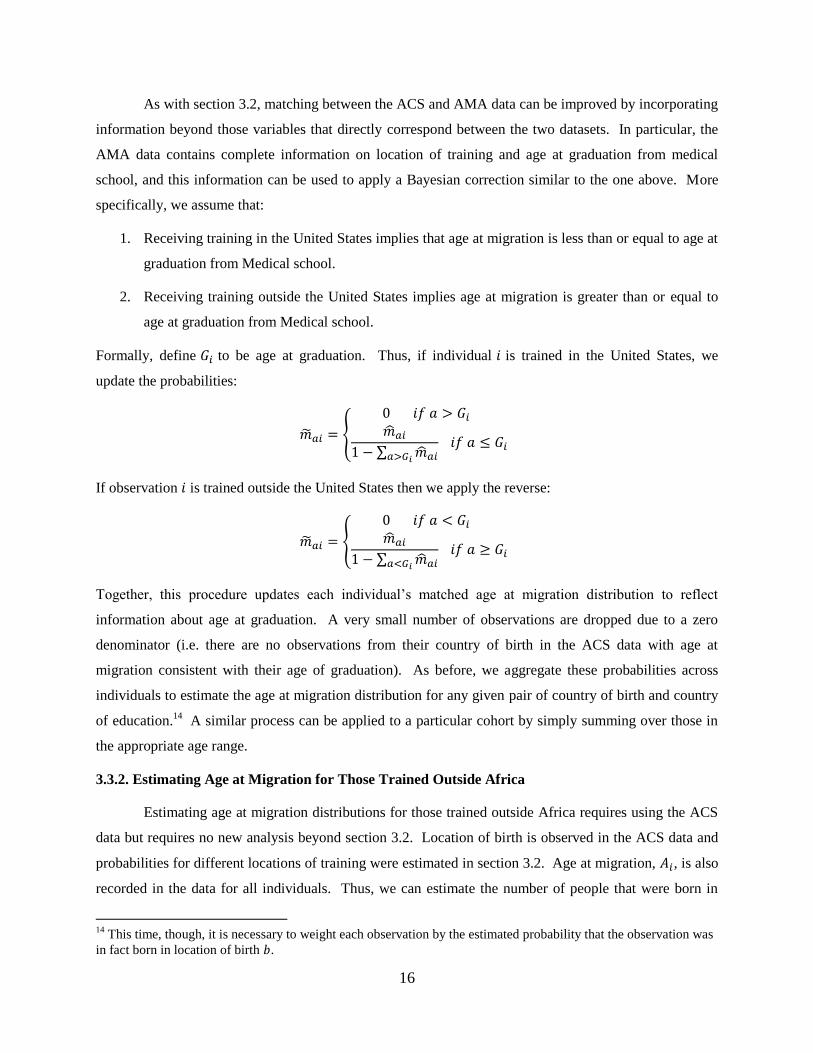
As with section 3.2, matching between the ACS and AMA data can be improved by incorporating
information beyond those variables that directly correspond between the two datasets. In particular, the
AMA data contains complete information on location of training and age at graduation from medical
school, and this information can be used to apply a Bayesian correction similar to the one above. More
specifically, we assume that:
1. Receiving training in the United States implies that age at migration is less than or equal to age at
graduation from Medical school.
2. Receiving training outside the United States implies age at migration is greater than or equal to
age at graduation from Medical school.
Formally, define 𝐺𝑖 to be age at graduation. Thus, if individual 𝑖 is trained in the United States, we
update the probabilities:
�̃�𝑎𝑖 = {
0 𝑖𝑓 𝑎 > 𝐺𝑖 �̂�𝑎𝑖
1 − ∑ �̂�𝑎𝑖𝑎>𝐺𝑖
𝑖𝑓 𝑎 ≤ 𝐺𝑖
If observation 𝑖 is trained outside the United States then we apply the reverse:
�̃�𝑎𝑖 = {
0 𝑖𝑓 𝑎 < 𝐺𝑖 �̂�𝑎𝑖
1 − ∑ �̂�𝑎𝑖𝑎<𝐺𝑖
𝑖𝑓 𝑎 ≥ 𝐺𝑖
Together, this procedure updates each individual’s matched age at migration distribution to reflect
information about age at graduation. A very small number of observations are dropped due to a zero
denominator (i.e. there are no observations from their country of birth in the ACS data with age at
migration consistent with their age of graduation). As before, we aggregate these probabilities across
individuals to estimate the age at migration distribution for any given pair of country of birth and country
of education.14
A similar process can be applied to a particular cohort by simply summing over those in
the appropriate age range.
3.3.2. Estimating Age at Migration for Those Trained Outside Africa
Estimating age at migration distributions for those trained outside Africa requires using the ACS
data but requires no new analysis beyond section 3.2. Location of birth is observed in the ACS data and
probabilities for different locations of training were estimated in section 3.2. Age at migration, 𝐴𝑖, is also
recorded in the data for all individuals. Thus, we can estimate the number of people that were born in
14
This time, though, it is necessary to weight each observation by the estimated probability that the observation was
in fact born in location of birth 𝑏.

17
location 𝑏, educated in location 𝑒, and migrated to the United States at age 𝑎 by simply counting up
observations with the appropriate age at migration and country of birth, weighting them by the survey
weights and the probability that the individual was trained in location 𝑒. This count can then be turned
into a probability by dividing by the total number of doctors born in 𝑏 and trained in 𝑒.
3.3.3. Combining Age at Migration Distributions
We then combine the results from sections 3.3.1 and 3.3.2. To be consistent with our previous
estimates, we use the ACS-based estimates from 3.3.2 to generate age at migration distributions when the
country of training is outside Africa. Meanwhile, we use the AMA-based estimates from 3.3.1 for those
with training inside Africa. As noted above, these estimates are only for those born in Africa.
Unfortunately, we cannot estimate age at migration distributions for those born outside of Africa but
trained in Africa. Finally, with these estimates in hand, we can convert the probabilities into age at
migration cumulative distribution functions for each location of birth-location of training pair.
4. Results
The previous section describes the three stages of the empirical strategy to construct a more precise
profile of migrant African doctors in the United States in terms of their location of birth, location of
training and age of migration. This section presents these results in the same sequence.
4.1 Propensity Score Matching Results
The first stage involves estimating the location of birth probabilities for the 19 regions for those
who did not report this information in the AMA data (areas E and F in Figure 1) by matching them to
those trained in the same region who reported this information (areas B and C). Table 3 presents the main
coefficients from estimating the propensity score by country of training. The displayed marginal effects
indicate how the probability of not reporting country of birth changes with observed characteristics. The
estimated coefficients are then used to compute propensity scores and complete the matching process, as
described above. For brevity, we do not report the coefficients of the medical specialization, census
region and DO dummy variables.
The second stage of our estimation involves the “missing doctors” from the AMA dataset (area D
in Figure 1) who were born in Africa, trained elsewhere and did not report their country of birth to the
AMA. In order to estimate the size and location of birth of this group, we use the ACS data as envelope to
determine the size of area D and match the ACS and AMA data as described in the previous section. The
results of the propensity score estimation are reported in Table 4. Again for space reasons, the marginal

18
effects for census regions in the US are not reported. We should note that gender coefficients are not
significant in most of the cases, indicating the migration and education patterns of male and female
physicians are quite similar. This is an important distinction with low-skilled migration patterns and
deserves additional scrutiny.
Our third and final estimation exercise determines age at migration by matching the AMA and the
ACS data one last time. We can perform this estimation only for those born in Africa since migration age
comes from ACS and we cannot identify those born outside but trained in Africa in the ACS. Recall that,
in the AMA data, we have a probability distribution over the birth location for every individual after the
first stage (see above). This is basically a vector of length 19. If the individual reported his birthplace, one
of these entries is equal to one and the rest are zeros. If he did not report and we estimated probabilities,
these 19 entries add up to 1. For every one of the 13 African birth locations, we take the individuals with
non-zero probability of being born there and match them to the observations with the same birth country
in the ACS data. The results of the estimation of the propensity scores from this process are reported in
Table 5. The marginal effects of census regions are not reported.
After the matching, we perform adjustments as discussed above and weigh matched age at
migration dummies using both the ACS population weights and the probability weights from our first
stage estimation. Our end result is a prediction over the age of migration for each individual. We then sum
these probabilities up to determine what percentage of the doctors born in location i and trained in
location j migrated to the United States at a given age.
4.2 Missing Location of Birth and Education in the Databases
This section presents the place of birth and education matrices from the first stage of our
estimation exercise. We start with those who actually report their location of birth to the AMA. Table 6
presents the matrix of location of training (columns) against location of birth (rows) for those 8,062
doctors who reported their country of birth. As an example, we see that a total of 2,520 people reported
Egypt as their birthplace and 1,816 of these were actually trained in Egypt while 558 were trained in the
United States.
Table 6 does not include the 47% of the AMA sample (7,129 doctors) that did not report their
country of birth; our predictions on their location of birth are reported in Table 7. Continuing with the
Egyptian example from above, we note that there were 1,964 Egyptian trained doctors who did not report
birth information and our estimation predicts that 1,712 of these were predicted to be born in Egypt. An
additional 252 of them were estimated to be born outside Egypt, mostly allocated to the “rest of the

19
world” category that includes Arabic speaking countries in the Middle East. We should note that the last
six columns (non-African regions) are left blank in this matrix as it would include our predictions for
people who were born in Africa but trained in the rest of the world. As mentioned earlier, these are not
included in our AMA sample unless country of birth was reported. Finally, Table 8 combines Tables 6
and 7 to give a full picture of the AMA data after our first stage predictions are completed.
Tables 8 reveals our first set of important results. Of the doctors recorded in the AMA database,
only 81 percent of those trained in an African country were born in the same country. Around 4 percent
were born in other African countries and a staggering 15 percent (1,730 doctors) were born outside Africa
but trained there. This number includes 539 doctors who were born in the US, went to medical school in
Africa and then returned to the US to practice their profession.
The second stage of our estimation predicts the number of doctors who were born in Africa,
trained outside Africa and did not report their country of birth to the AMA. Table 9 reports the resulting
matrix of allocating these missing doctors from 13 birth-regions in Africa to the 6 non-African regions of
training. We predict that almost 70 percent (6,000 out of 8,720) of these doctors were trained in the
United States, most likely children who migrated with their parents and students who came to attend
medical school.
Our final step is to combine these two stages to construct an overall matrix of training and birth.
In order to accomplish this, we use estimates from the AMA data when the location of training is one of
the 13 African regions (first 13 columns of Table 8) and from the ACS predictions for the six non-African
regions of training (last six columns of Table 9). The resulting final matrix, our ultimate objective, is
presented in Table 10.
4.3. Patterns in Location of Birth and Education
We identify several key patterns that arise from examining the results, especially in Table 10,
which should provide insights on global skilled migration flows. The education and birth matrices are
especially useful in identifying where the largest differences between location of birth versus education
numbers are likely to exist.
First, both in the aggregate and for many individual countries, the measured magnitude of
migration varies widely depending on whether country of birth or country of training is used as the main
criteria. Our empirical exercise estimates that there are 19,997 African born and/or trained doctors in the
United States (Table 10). Of this group, 9,547 (47.7 percent) were born and trained in Africa. On the
other hand, 8,720 (43.6 percent) were born in but trained outside Africa and 1,730 (8.7 percent) were born

20
outside but were trained in Africa (see Figure 2). In other words, there are 11,277 doctors trained and
18,267 doctors born in Africa. The overall size of medical migration from Africa to the US increases by
over 60 percent if we were to use place of birth instead of education criteria. However, the main value of
our exercise arises from the joint prediction of the birth and education dimensions in our discussions.
Figure 2. Distribution of African born and trained doctors in the United States
In Table 11, we present the details of the information from Table 10 in a compact format for the
five African countries with the largest number of doctors who were trained there: Egypt, Ethiopia, Ghana,
Nigeria and South Africa. Jointly, doctors trained in these five countries account for almost 65 percent of
the whole AMA sample and 87 percent of migrant doctors trained in Africa. Our empirical exercise
reveals further interesting patterns, especially the stark differences between countries on the same
continent. Of the 4,062 Egyptian trained doctors, the largest group of 3,528 doctors was born in Egypt (87
percent). We predict that 365 doctors born outside of either Africa or the United States, mostly in other
Arab countries, were also trained in Egypt. The two smallest countries of this group are Ghana and
Ethiopia, and they train very few foreign-born doctors; almost all of the doctors trained in these countries
were also born there. On the other hand, almost 40 percent of the doctors trained in South Africa and over
20 percent of those trained in Nigeria are born outside their borders. Both of these countries are important
training hubs for other African medical students as well as for many students from the United States and
other parts of the world.
Thus, our second result shows that a non-negligible number of doctors are born outside Africa,
train in Africa, and then migrate to the United States to work; a pattern that has not been identified before.

21
There are 1,730 such doctors, comprising slightly over 15 percent of the 11,277 doctors trained in Africa.
Almost a third of this group (532 people out of 1,730) was born in the United States; 14 percent (237
people) were born in other English speaking countries, 13 percent (225 people) were born in South Asia
and 11 percent (182 people) are from Europe. These patterns indicate that the mobility of highly educated
professionals starts at a very young age and we need careful distinction of birth and training locations to
identify such dynamics. Most analyses start with the assumption that African skilled migration is a one-
way flow. Our results, however, show that African medical schools attract a non-negligible number of
outsiders despite their limited resources. This fact has significant implications for health related education
and human resource policies in Africa.15
Our third result is on the location of education for African born doctors. Of the 9,547 doctors
born and trained in Africa, 9,111 (over 95 percent) were trained in their birth country and slightly over
400 moved internally within Africa for their education. When we look at those born in but trained outside
of Africa, we see that a majority of these 8,720 doctors chose the US for their education (almost 70
percent) as seen in Table 10. The age at which these people arrived to the US is explored further in the
next section. At the outset, we would expect many African doctors to go to European schools due to
colonial linkages and relative geographic proximity. Around 12 percent chose Europe and other non-US
English speaking OECD countries for their medical schools. Surprisingly, large numbers (8.5 percent) go
to South Asian countries. Such students tend to be descendants of the South Asian migrants who went to
East and South Africa during the British colonial rule of the previous century. These numbers prove that
diaspora bonds remain relatively strong as the grandchildren of Indian migrants of the 19th and early 20
th
centuries go back to their grandparents’ home countries to study. Then, like their grandparents, they
choose to cross an ocean to settle in a distant land.
In Table 12, we look at the largest five countries in terms of the numbers of doctors born and we
clearly see the importance of predicting the “missing” doctors from the AMA database. These are the
same countries as before – Egypt, Nigeria, South Africa, Ghana and Ethiopia in declining order of
number of doctors born. According to our estimates, there are 4,332 doctors in the US who were born in
Egypt, and as noted earlier, 3,528 (over 81 percent) were trained at home. However, there are over 800
Egyptian born doctors trained outside Egypt, with the majority trained in the US. Similar statistics are
significantly larger for the Sub-Saharan countries. For example, less than half of the doctors born in
Ethiopia or South Africa and practicing in the US were actually trained in their respective birth-countries.
44 percent of the Ethiopian-born and 47 percent of the South African born doctors were trained in the
15
It is important to know whether these students born outside Africa pay higher fees. In some countries they do but
there is no comprehensive data or analysis on this issue that we know of.

22
United States. Furthermore, 17 percent of Ethiopian-born, 14 percent of South African-born, 13 percent of
Nigerian-born and 11 percent of Ghanaian-born doctors were trained outside of Africa and the US. This
‘transit’ migration is an additional dimension of global skill flows that deserves more attention than it
currently receives.
Our last interesting observation is that around 7 percent of the group that trained outside Africa
actually has gone to the Caribbean countries as seen in Table 10. Since medical school capacity has not
kept up with the increased demand for doctors in the US, new private medical schools emerged in various
Caribbean countries. There is a significant debate on the quality and value of these medical schools as
they tend to attract students who seem to have failed to get into medical schools in the US. Our data
indicate that American students are not the only clients of the Caribbean medical schools. Significant
numbers of African born doctors are actually enrolling at these schools, in most likelihood, with the
intention of eventually migrating to the United States. There is a large brain gain literature, starting with
Stark, Helmenstein, and Prskawetz (1997) and Mountford (1997), on the incentives to acquire human
capital as a result of increased migration opportunities. African born doctors – mostly from Nigeria and
other West African countries – who go to schools in the Caribbean and practice in the US provide quite
an interesting example for this argument. Of course this cannot be truly considered brain gain for Africa,
as defined in the literature, since these students do not return home but migrate to an another destination.
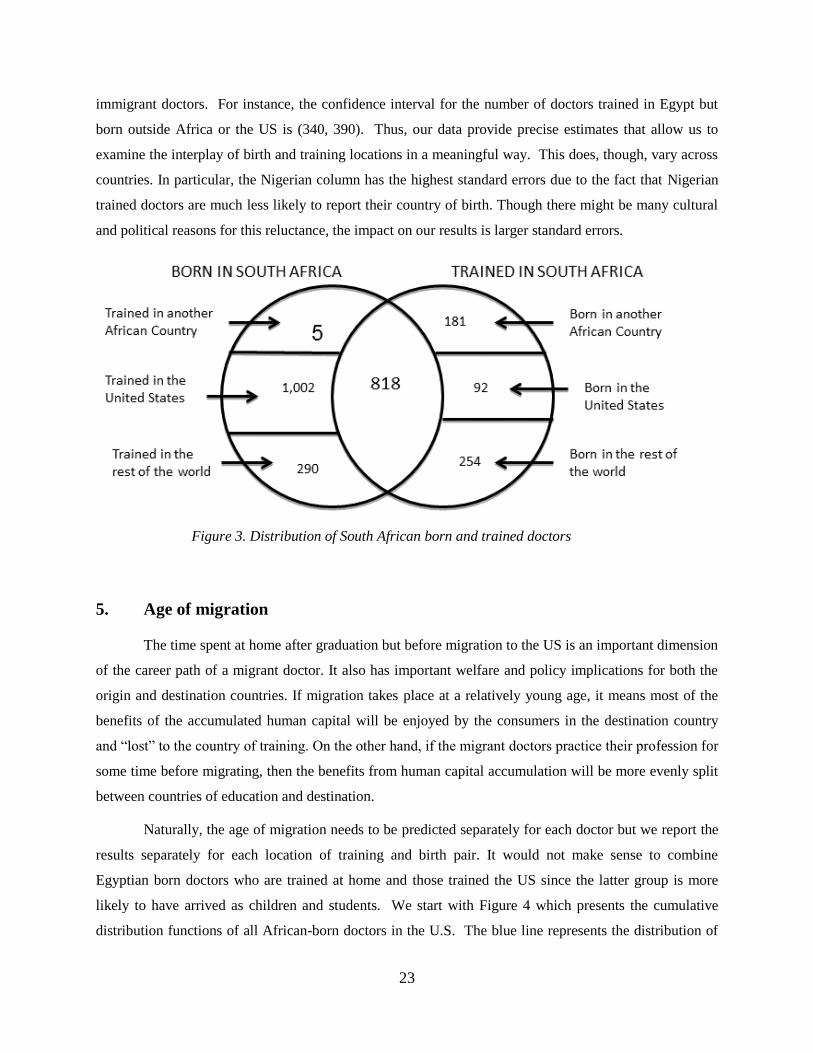
Our final discussion in this section will use South Africa as an example to highlight once more
the importance of the distinctions we discussed above. Who really is a South African doctor? Figure 3
provides a nuanced answer to this difficult question using the numbers from Tables 11 and 12 for South
Africa. We see that there are 818 doctors born and trained in South Africa who later moved to the US.
However, this represents only a minority of the 2,642 doctors who either were born or trained in South
Africa. 1,002 doctors were born in South Africa but were trained in the US while another 290 were
trained in other non-African countries around the world. On the other side of the coin, South Africa trains
a significant number of doctors from other African countries (181) and the United States (92) as well as
other countries in the world (254). Our analysis enables us to split the numbers further. We can identify
the other eight African regions these 181 doctors were born, as well as the non-Us and non-African
countries from which the other 254 doctors originated.
The standard errors of our estimates are provided below each number in Tables 11 and 12 for the
largest five countries and Table 13 for the whole sample. As can be seen, all of the estimates are
statistically different from zero except for a few cells with very low values – such as trained in Ethiopia
and born in the rest of the world. More importantly, these small standard errors imply tight confidence
intervals around estimates of the largest country of birth-country of training career paths for African
23
immigrant doctors. For instance, the confidence interval for the number of doctors trained in Egypt but
born outside Africa or the US is (340, 390). Thus, our data provide precise estimates that allow us to
examine the interplay of birth and training locations in a meaningful way. This does, though, vary across
countries. In particular, the Nigerian column has the highest standard errors due to the fact that Nigerian
trained doctors are much less likely to report their country of birth. Though there might be many cultural
and political reasons for this reluctance, the impact on our results is larger standard errors.
Figure 3. Distribution of South African born and trained doctors
5. Age of migration
The time spent at home after graduation but before migration to the US is an important dimension
of the career path of a migrant doctor. It also has important welfare and policy implications for both the
origin and destination countries. If migration takes place at a relatively young age, it means most of the
benefits of the accumulated human capital will be enjoyed by the consumers in the destination country
and “lost” to the country of training. On the other hand, if the migrant doctors practice their profession for
some time before migrating, then the benefits from human capital accumulation will be more evenly split
between countries of education and destination.
Naturally, the age of migration needs to be predicted separately for each doctor but we report the
results separately for each location of training and birth pair. It would not make sense to combine
Egyptian born doctors who are trained at home and those trained the US since the latter group is more
likely to have arrived as children and students. We start with Figure 4 which presents the cumulative
distribution functions of all African-born doctors in the U.S. The blue line represents the distribution of

24
age at migration to the U.S. for all doctors, regardless of their exact country of training. The other lines
split this out by location of training at home (red), in the U.S. (green), or somewhere else (purple). First,
we note that the age of migration profile is quite different for these three groups, as expected. These
differences once again stress the importance of differentiating high skilled migrants based on where their
human capital was obtained. Among those trained in the country of birth, the median age at migration is
30, and 90 percent arrive by age 39. However, those trained in the U.S. arrive much earlier. The median
age of migration is only 23, and 90 percent arrive by age 29. About 30 percent arrive as children and
most of the remainder arrived during the 18-29 age range since their migration is likely to be motivated
by schooling. Finally, those training elsewhere appear similar to those trained at their birth countries.
Figure 4. Cumulative probability distribution of Age of Migration, by location of training
The next step is to compare the migration behavior of the doctors trained in the main five
countries we analyzed earlier – Egypt, Ethiopia, Ghana, Nigeria and South Africa. Figure 5 presents
results for those doctors trained at home. Among those trained in Egypt, the median age of migration to
the US is 29.5, over 80 percent of them arrive by the age of 34, and 90 percent arrive by age 38. Doctors
born and trained in South Africa exhibit almost the same patterns as Egyptian doctors. The median age of
migration is around 30, and 90 percent migrate by the age of 38. Nigerian born doctors show a slightly
different pattern. For those trained at home, the median age of migration is 32, and 90 percent of
migration is completed only by age 40. In other words, Nigerian doctors who were trained at home delay

25
their migration significantly when compared to the other large groups. Our final group is composed of
doctors born and trained in Ghana who seem to migrate to the US relatively sooner after graduation. Their
median age of migration is 28, and 90 percent migrate by the age 32.
Figure 5. Cumulative probability distribution of Age of Migration of doctors trained in Five Countries.
Our next comparison is among those doctors trained in the US but born in these five countries.
Figure 6 shows these results. Egyptian born doctors are the earliest ones to migrate where the median age
is 17. On the other hand, Nigerian doctors are the latest to migrate with a median age at migration of 24.
This pattern indicates that most of the Nigerian doctors migrate specifically to attend medical school
while Egyptian doctors are more likely to migrate as children with their families. Among the other three
countries, the migration patterns are more gradual, indicating a mixture of these two processes.
The final graph presents the age at migration analysis for different age cohorts of doctors born
and trained in Sub-Saharan Africa (Figure 7). Since there are not many observations for each cohort, we
chose to represent all countries jointly. There are three age cohorts analyzed by their current age: 35-45
years, 45-55 years and 55-65 years. The critical observation is that younger (more recent birth) cohorts
seem to be arriving at an earlier age; the distribution functions are shifting to the left. For example, the
median age at migration is declining by one year with each cohort, from 31.5 to 29.5. Given that the
average service at home is only 7 years (assuming a graduation age of 22), this is a considerable decline.
0%
10%
20%
30%
40%
50%
60%
70%
80%
90%
100%
15 20 25 30 35 40 45 50
Egypt Ethiopia Ghana Nigeria South_Africa

26
For comparison, we do not observe the same shift among the doctors from Egypt and other North African
countries.
Figure 6. Cumulative probability distribution of Age of Migration for doctors trained in the US but born
in Five Countries
0%
10%
20%
30%
40%
50%
60%
70%
80%
90%
100%
0 5 10 15 20 25 30
Egypt Ethiopia Ghana Nigeria South_Africa
0%
10%
20%
30%
40%
50%
60%
70%
80%
90%
100%
202122232425262728293031323334353637383940414243444546474849505152535455
35-45 45-55 55-65

27
Figure 7. Cumulative probability distribution of Age of Migration for doctors from Sub-Saharan Africa
(trained at home) by age group
Different age of migration profiles have strong implications for education and labor market
policies. For a country such as Ghana, the classic story of medical brain drain may be accurate, at least
for those doctors who train at home. Ghanaian doctors tend to leave quickly after completion of medical
school, leaving little time for the public health system to recoup benefits from public subsidy of
education. On the other hand, doctors from Nigeria and South Africa tend to have a longer delay between
completing their education and migrating to the United States. While this is not observed in our data, it is
likely that this corresponds to time spent working in the country of training. As a result, public health
systems in these countries may very well benefit from several years of local medical service by the doctor
prior to migration.
6. Conclusion
There are over 20 other developing countries where more than half of their tertiary educated
citizens are abroad (Artuc, et.al, 2014,). Such widely-cited high-skilled migration or “brain drain”
numbers are inflated by our reliance on census-type data sources where migrants are classified according
to their countries of birth or citizenship, rather than their countries of education. If education was
completed in the destination (or a third country) and/or if the emigration took place at a later point in a
professional’s career, then the welfare and policy implications for both the origin and destination
countries would be quite different.
We explore these nuances by focusing on the African born and/or trained physicians who are
currently practicing in the U.S. We use propensity score matching techniques to merge education data
from AMA data with country of birth and age of migration data from the ACS. In the end, we predict the
location of birth, location of education and age of migration of close to 20,000 doctors. We find quite
surprising patterns. First, around 48 percent of these doctors were born and educated in Africa, mostly in
their home countries. Second, another 44 percent were born in Africa but were educated outside the
continent, including the Caribbean to South Asia. Finally, African medical schools trained 1,730 doctors
who were born outside Africa. In addition to identifying location of birth and education patterns, we
determine the age of migration profiles of various migrants and highlight widely heterogeneous patterns
across birth and training countries. How long various professionals, especially doctors, stay at home and
work before they migrate to the other countries is an important human resource issue for policymakers.

28
We perform the same analysis by age cohorts and find that more recent cohorts have migrated at an
earlier age, indicating the time spent at home after graduation is shrinking.
Together, our results indicate that skilled migration varies widely across countries. A country
like Egypt sends many native born and trained doctors abroad but also trains students from other
countries. In such a context, policymakers may reasonably discuss if admitting foreign students can
offset some of the financial loss incurred when native students receiving education subsidies migrate. A
country such as Ethiopia faces a different situation. Only 2 of 5 Ethiopian-born doctors in the U.S. were
trained in Ethiopia. Policymakers in this situation should avoid the factual error of conflating Ethiopian-
born doctors in the United States with Ethiopian-trained doctors and subsequent lost educational
subsidies. Nonetheless, such a fact suggests that public policy aimed at recruiting more doctors in
Ethiopia may reasonably need to focus on why the families of talented children emigrate.
There are three other important issues in the high-skilled migration literature that this paper
cannot address. The first one is on financing of education. While medical education is publicly financed
in most countries, it is generally privately funded in the US and especially in the Caribbean. However,
there are many exceptions. Some schools in Africa charge tuition to cover their costs, especially to
foreign students. Many African countries also provide scholarships to their students to study abroad,
especially in the West, with the expectation to return home (Clemens and Patterson, 2006). The second
issue is retention of high skilled workers. Antwi and Phillips (2013) show that higher wages can reduce
emigration of doctors trained in Ghana. But we need detailed information on doctors’ and students’
demographic and personal characteristic to assess the impact of different policy interventions. Third is
the issue of brain waste. Many people who were trained as doctors in their home countries fail to obtain a
medical license or choose not to practice in the US. As a result, they do not register with the AMA or
appear in the ACS sample. The extent and causes of brain waste have important policy implications
(Mattoo, Neagu and Ozden, 2008). Unfortunately, existing administrative and survey type data are not
sufficient to address these funding, retention and brain waste questions. Ideally, future work would
combine the results and methods of the present paper with more detailed data from personal surveys of
doctors to fully answer these questions.

29
References
Abadie, A. and G.W. Imbens (2008). On the failure of the bootstrap for matching estimators.
Econometrica, 76(6), 1537-1557.
Antwi, J. and D.C. Phillips. "Wages and health worker retention: Evidence from public sector wage
reforms in Ghana." Journal of Development Economics 102 (2013): 101-115.
Artuc, E. F. Docquier, C.Ozden and C. Parsons (forthcoming) A global assessment of human capital
mobility: the role of non-OECD destinations, World Development
Beine, M., F. Docquier and H. Rapoport (2007) “Measuring international skilled migration: new
estimates controlling for age of entry,” World Bank Economic Review vol. 21 p.249-254
Bhagwati, J., & Hamada, K. (1974). The brain drain, international integration of markets for professionals
and unemployment: a theoretical analysis. Journal of Development Economics, 1(1), 19-42.
Bhargava, A., & Docquier, F. (2008). HIV pandemic, medical brain drain, and economic development in
sub-saharan africa. The World Bank Economic Review, 22(2), 345-366.
Bhargava, A., Docquier, F., & Moullan, Y. (2011). Modeling the effects of physician emigration on
human development. Economics & Human Biology, 9(2), 172-183.
Chen, L. C., & Boufford, J. I. (2005). Fatal flows—doctors on the move. New England Journal of
Medicine, 353(17), 1850-1852.
Clemens, M. (2007) “Do Visas Kill: Health Effects of African Health Professional Emigration.” Center
for Global Development Working Paper No. 114.
Clemens, M. (2011). “The Financial Consequences of High-Skill Emigration: Lessons from African
Doctors Abroad.” In Diaspora for Development in Africa, ed. Sonia Plaza and Dilip Ratha, 165–82.
Washington, DC: World Bank
Docquier. F and A.Marfouk (2006) “International migration by educational attainment 1990-2000” In C.
Ozden and M. Schiff (eds). International Migration, Remittances and Development, Palgrave Macmillan:
New York.
Docquier, F. and H. Rapoport, (2012) “Globalization, brain drain and development,” Journal of Economic
Literature vol, 50 no.3, p.681-730
Easterly, W. and Y. Nyarko. (2009) “Is the Brain Drain Good for Africa?” In Skilled Migration Today:
Prospect, Problems and Policies, ed. Jagdish Bhagwati and Gordon Hanson, 316–60. Oxford University
Press.
Gibson, J. and D. McKenzie (2011). “Eight Questions about Brain Drain, “ Journal of Economic
Perspectives. Vol.25. no.3, 107-28

30
Grogger, J., and G. Hanson. (2011) “Income Maximization and the Selection and Sorting of International
Migrants.” Journal of Development Economics, 95(1): 42–57.
Hanson, G. (2010), "International Migration and the Developing World," in Dani Rodrik and Mark
Rosenzweig, eds., Handbook of Development Economics, Vol. 5, Amsterdam: North Holland, 4363-
4414.
Kangasniemi, M., L.A. Winters and S. Commander (2007) “Is the medical brain drain beneficial?
Evidence from overseas doctors in the UK.” Social Science and Medicine, 65(5).
Kapur, D., and J. McHale. (2005). Give Us Your Best and Brightest: The Global Hunt for Talent and its
Impact on the Developing World. Washington, DC: Center for Global Development and the Brookings
Institution
Lee J. (2006) “Message from the Director-General.” Working Together for Health: The World Health
Report, 2006. World Health Organization.
Mattoo, A., C. Neagu and C. Ozden (2008) “Brain Waste? Educated Immigrants in the US Labor
Market,” Journal of Development Economics, vol.87, no.2, p.255-69
Mountford, A. (1997): “Can a Brain Drain Be Good for Growth in the Source Economy?” Journal of
Development Economics, 53(2).
Mullan, F. (2005). The metrics of the physician brain drain. New England Journal of Medicine, 353(17),
1810-1818.
Nyarko, Y. (2010), “EU Policies and African Human Capital Development,” EUI-RSCAS Working Ppaer
No.30, Robert Schuman Center for Advanced Studies, EUI, Florence.
Okeke, E. (2009) “An Empirical Investigation of Why Doctors Migrate and Women Fail to Go For
Screening.” Unpublished dissertation, University of Michigan.
Ozden, C., C. Parsons, M. Schiff, & T. Walmsley, (2011). “Where on earth is everybody? The evolution
of global bilateral migration 1960–2000?” World Bank Economic Review, 25(1), 12–56.
Stark, O., Helmenstein, C., & Prskawetz, A. (1997). A brain gain with a brain drain. Economics letters,
55(2), 227-234.

31
Table 1. Summary Data from American Medical Association (AMA) on Country of Training and Birth
COUNTRY Fraction
Trained
Fraction
Born Mean Age
Fraction
Female
Mean Age
at
Migration
Fraction
Asian
Name
Total 1.00 1.00 47.0 0.27 26.0 0.05
Egypt 0.27 0.17 49.5 0.20 24.2 0.01
Ethiopia 0.03 0.04 44.7 0.17 25.1 0.01
Ghana 0.05 0.05 47.0 0.25 27.1 0.00
Kenya 0.01 0.05 46.4 0.22 25.5 0.22
Liberia 0.00 0.01 54.1 0.29 28.7 0.02
Nigeria 0.21 0.06 45.3 0.32 24.8 0.02
South Africa 0.09 0.03 52.8 0.19 24.1 0.02
Sudan 0.02 0.01 42.9 0.31 25.1 0.01
Uganda 0.01 0.01 44.9 0.42 26.3 0.14
Zimbabwe 0.01 0.01 46.2 0.25 24.8 0.08
Other East Africa 0.01 0.02 50.2 0.29 25.9 0.34
Other North Africa 0.03 0.02 42.7 0.32 26.0 0.01
Other West,
Central, and
Southern Africa 0.01 0.02 45.7 0.29 27.3 0.00
Caribbean 0.02 0.00 43.0 0.33 30.5 0.11
English Speaking 0.02 0.00 44.7 0.31 27.7 0.32
Europe 0.02 0.00 50.5 0.24 27.6 0.02
South Asia 0.02 0.01 54.4 0.28 25.0 0.69
United States 0.17 0.01 43.5 0.37 28.7 0.08
Rest of World 0.01 0.02 47.8 0.21 26.7 0.06
Missing 0.00 0.47
Source: American Medical Association Masterfile

32
Table 2. Summary Data from American Community Survey (ACS) on Country of Birth and Age of
Migration
COUNTRY Fraction
Trained
Fraction
Born Mean Age
Fraction
Female
Mean Age at
Migration
Egypt -- 0.24 47.8 0.19 27.5
Ethiopia -- 0.07 41.9 0.27 26.3
Ghana -- 0.05 42.8 0.22 24.5
Kenya -- 0.05 45.6 0.25 23.2
Liberia -- 0.02 47.4 0.30 25.6
Nigeria -- 0.24 43.0 0.35 27.5
South Africa -- 0.12 50.8 0.25 27.9
Sudan -- 0.02 44.2 0.09 29.8
Uganda -- 0.02 54.8 0.20 26.1
Zimbabwe -- 0.02 48.6 0.23 23.7
--
Other East Africa -- 0.06 44.2 0.35 23.0
Other North Africa -- 0.04 41.6 0.37 25.4
Other West,
Central, and
Southern Africa -- 0.05 38.9 0.24 25.5
Missing -- -- -- -- --
Source: American Community Survey

33
Table 3. Propensity Score Coefficients: Within AMA Match for Missing Location of Birth
Location of Training
Covariate EGYPT ETHIOPIA GHANA KENYA LIBERIA NIGERIA
OTHER
EAST
AFRICA
OTHER
NORTH
AFRICA
OTHER WEST
CENTRAL
AND
SOUTHERN
AFRICA
SOUTH
AFRICA SUDAN UGANDA ZIMBABWE
Female 0.015 -0.079 0.10** 0.069 -0.19 -0.020 0.057 0.100* 0.31** -0.0017 0.084 0.017 0.19
(0.021) (0.067) (0.048) (0.11) (0.27) (0.016) (0.12) (0.057) (0.15) (0.031) (0.064) (0.10) (0.16)
Log(Age) -0.15*** 0.43*** 0.16 0.29 -2.16* -0.91*** -0.53 0.21 0.68* 0.067 0.24 -0.70*** -0.94**
(0.042) (0.15) (0.12) (0.28) (1.21) (0.046) (0.34) (0.15) (0.41) (0.069) (0.17) (0.24) (0.38)
Asian Name Dummy -0.072 0.19 -0.20 -0.0015 -- -0.14** -0.0053 -0.15 -- -0.053 -- 0.15 0.14
(0.10) (0.19) (0.27) (0.12) (0.062) (0.12) (0.26) (0.084) (0.12) (0.20)
Census Division
Dummies YES YES YES YES YES YES YES YES YES YES YES YES YES
Specialty Dummies YES YES YES YES YES YES YES YES YES YES YES YES YES
DO Dummy YES NO NO NO NO NO NO NO NO NO NO NO NO
Observations 4061 518 695 164 46 3174 116 430 78 1345 318 141 86
Psuedo R2 0.01 0.08 0.03 0.12 0.25 0.14 0.17 0.06 0.15 0.03 0.06 0.11 0.33
The table reports average marginal effects from a logit model where the dependent variable is an indicator of whether data on the individual's location of birth is missing. Each column corresponds to a different
sample, in particular the sample of individuals in the AMA data with a location of training in the listed country. The full range of covariates includes 10 census divisions and twenty specialty groups. Statistical
significance at the 1, 5, and 10 percent levels are denoted respectively by *, **, and ***. Standard errors are in parentheses.
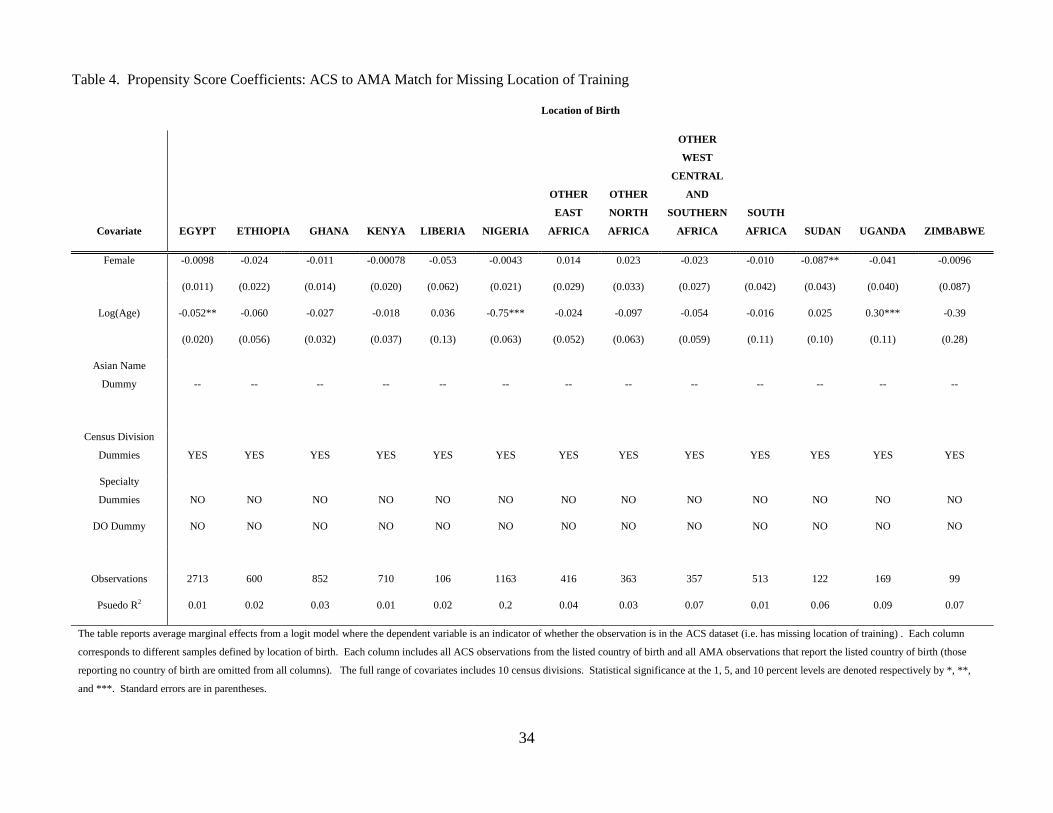
34
Table 4. Propensity Score Coefficients: ACS to AMA Match for Missing Location of Training
Location of Birth
Covariate EGYPT ETHIOPIA GHANA KENYA LIBERIA NIGERIA
OTHER
EAST
AFRICA
OTHER
NORTH
AFRICA
OTHER
WEST
CENTRAL
AND
SOUTHERN
AFRICA
SOUTH
AFRICA SUDAN UGANDA ZIMBABWE
Female -0.0098 -0.024 -0.011 -0.00078 -0.053 -0.0043 0.014 0.023 -0.023 -0.010 -0.087** -0.041 -0.0096
(0.011) (0.022) (0.014) (0.020) (0.062) (0.021) (0.029) (0.033) (0.027) (0.042) (0.043) (0.040) (0.087)
Log(Age) -0.052** -0.060 -0.027 -0.018 0.036 -0.75*** -0.024 -0.097 -0.054 -0.016 0.025 0.30*** -0.39
(0.020) (0.056) (0.032) (0.037) (0.13) (0.063) (0.052) (0.063) (0.059) (0.11) (0.10) (0.11) (0.28)
Asian Name
Dummy -- -- -- -- -- -- -- -- -- -- -- -- --
Census Division
Dummies YES YES YES YES YES YES YES YES YES YES YES YES YES
Specialty
Dummies NO NO NO NO NO NO NO NO NO NO NO NO NO
DO Dummy NO NO NO NO NO NO NO NO NO NO NO NO NO
Observations 2713 600 852 710 106 1163 416 363 357 513 122 169 99
Psuedo R2 0.01 0.02 0.03 0.01 0.02 0.2 0.04 0.03 0.07 0.01 0.06 0.09 0.07
The table reports average marginal effects from a logit model where the dependent variable is an indicator of whether the observation is in the ACS dataset (i.e. has missing location of training) . Each column
corresponds to different samples defined by location of birth. Each column includes all ACS observations from the listed country of birth and all AMA observations that report the listed country of birth (those
reporting no country of birth are omitted from all columns). The full range of covariates includes 10 census divisions. Statistical significance at the 1, 5, and 10 percent levels are denoted respectively by *, **,
and ***. Standard errors are in parentheses.

35
Table 5. Propensity Score Coefficients: AMA to ACS Match for Estimating Age at Migration
Covariate EGYPT ETHIOPIA GHANA KENYA LIBERIA NIGERIA
OTHER
EAST
AFRICA
OTHER
NORTH
AFRICA
OTHER WEST
CENTRAL AND
SOUTHERN
AFRICA
SOUTH
AFRICA SUDAN UGANDA ZIMBABWE
Female 0.0043 0.0014 0.0057 -0.0044 -0.0046 -0.0097* -0.0029 -0.0075 -0.00063 -0.0021 0.0052 0.016 -0.0038
-0.0059 -0.0055 -0.0045 -0.0061 -0.007 -0.0059 -0.0052 -0.0049 -0.0016 -0.012 -0.0041 -0.019 -0.0088
Log(Age) 0.036*** 0.053*** 0.039*** 0.034*** 0.016 0.19*** 0.039*** 0.027*** 0.020*** 0.11*** 0.012 -0.20*** 0.022
-0.012 -0.012 -0.012 -0.0098 -0.013 -0.015 -0.0099 -0.0081 -0.0046 -0.025 -0.01 -0.051 -0.016
Asian Name
Dummy -- -- -- -- -- -- -- -- -- -- -- -- --
Census Division
Dummies YES YES YES YES YES YES YES YES YES YES YES YES YES
Specialty
Dummies NO NO NO NO NO NO NO NO NO NO NO NO NO
DO Dummy NO NO NO NO NO NO NO NO NO NO NO NO NO
Observations 5,102 2,175 2,248 2,498 1,081 3,947 2,065 2,552 4,181 1,873 1,364 307 1,086
Psuedo R2 0.01 0.05 0.05 0.04 0.03 0.12 0.06 0.06 0.12 0.04 0.03 0.12 0.03
The table reports average marginal effects from a logit model where the dependent variable is an indicator of whether the observation is in the AMA dataset (i.e. has missing age at migration). Each column
corresponds to different samples defined by location of birth. Each column includes all ACS observations from the listed country of birth and all AMA observations that either report the listed country of birth or do
not report a country of birth but have a positive estimated probability of being born in the listed country. The full range of covariates includes 10 census divisions. Statistical significance at the 1, 5, and 10 percent
levels are denoted respectively by *, **, and ***. Standard errors are in parentheses.

36
TABLE 6. AMA DATA - COUNTRY OF TRAINING AND BIRTH WHEN REPORTED
LOCATION OF TRAINING
LOCATION OF
BIRTH E
GY
PT
ET
HIO
PIA
GH
AN
A
KE
NY
A
LIB
ER
IA
NIG
ER
IA
OT
HE
R E
AS
T
AF
RIC
A
OT
HE
R N
OR
TH
AF
RIC
A
OT
HE
R W
ES
T
CE
NT
RA
L
SO
UT
HE
RN
AF
RIC
A
SO
UT
H A
FR
ICA
SU
DA
N
UG
AN
DA
ZIM
BA
BW
E
CA
RIB
BE
AN
EN
GL
ISH
SP
EA
KIN
G
EU
RO
PE
RE
ST
OF
WO
RL
D
SO
UT
H A
SIA
UN
ITE
D S
TA
TE
S
TO
TA
L
EGYPT 1,816 1 0 0 0 0 1 10 0 0 2 0 0 47 15 31 37 2 558 2,520
ETHIOPIA 2 243 0 1 0 0 0 1 0 0 1 1 0 19 3 38 3 10 232 554
GHANA 0 0 325 0 1 4 1 0 0 0 0 0 0 35 3 40 17 3 384 813
KENYA 2 0 1 104 0 0 1 0 0 2 0 4 1 28 94 11 8 167 291 714
LIBERIA 1 0 0 0 14 0 0 1 0 0 0 0 0 3 0 7 5 4 91 126
NIGERIA 1 0 0 0 0 415 1 0 1 0 0 1 0 62 9 29 8 10 342 879
OTHER EAST
AFRICA 0 0 0 1 0 1 32 0 2 8 0 1 5 32 24 17 5 67 185 380
OTHER NORTH
AFRICA 7 0 0 0 0 0 0 127 1 0 0 0 0 9 7 19 23 15 121 329
OTHER WEST,
CENTRAL,
SOUTHERN 1 0 2 0 1 7 1 0 37 5 0 0 0 49 10 51 13 4 144 325
SOUTH AFRICA 1 0 0 0 1 0 0 0 0 190 0 1 0 4 10 4 13 4 172 400
SUDAN 8 0 0 0 0 0 0 0 0 0 122 0 0 4 3 10 1 2 31 181
UGANDA 0 1 0 0 0 0 3 0 0 0 0 37 0 9 27 8 3 45 69 202
ZIMBABWE 0 0 0 0 0 0 1 0 0 25 0 0 19 0 3 2 0 1 37 88
CARIBBEAN 0 0 0 0 0 0 0 1 1 0 0 0 0 0 0 0 0 0 0 2
ENGLISH
SPEAKING 6 0 3 0 0 19 4 2 0 16 0 0 3 0 0 0 0 0 0 53
EUROPE 7 1 3 0 0 11 1 3 0 4 1 0 0 0 0 0 0 0 0 31
REST OF
WORLD 165 0 1 0 0 5 1 12 0 36 0 3 2 0 3 0 0 0 0 228
SOUTH ASIA 18 0 1 1 0 28 20 4 0 3 0 2 1 0 1 0 0 0 0 79
UNITED STATES 63 1 0 0 3 21 3 28 0 21 2 7 2 0 7 0 0 0 0 158
TOTAL 2,098 247 336 107 20 511 70 189 42 310 128 57 33 301 219 267 136 334 2,657 8,062

37
TABLE 7. AMA DATA - COUNTRY OF TRAINING AND BIRTH PREDICTIONS
LOCATION OF TRAINING
LOCATION OF
BIRTH E
GY
PT
ET
HIO
PIA
GH
AN
A
KE
NY
A
LIB
ER
IA
NIG
ER
IA
OT
HE
R E
AS
T
AF
RIC
A
OT
HE
R N
OR
TH
AF
RIC
A
OT
HE
R W
ES
T
CE
NT
RA
L
SO
UT
HE
RN
AF
RIC
A
SO
UT
H A
FR
ICA
SU
DA
N
UG
AN
DA
ZIM
BA
BW
E
CA
RIB
BE
AN
EN
GL
ISH
SP
EA
KIN
G
EU
RO
PE
RE
ST
OF
WO
RL
D
SO
UT
H A
SIA
UN
ITE
D
ST
AT
ES
TO
TA
L
EGYPT 1,712 1 0 0 0 0 1 13 0 0 4 0 0 0 0 0 0 0 0 1,732
ETHIOPIA 2 267 0 0 0 0 0 2 0 0 0 1 0 0 0 0 0 0 0 272
GHANA 0 0 347 0 0 22 1 0 0 0 0 0 0 0 0 0 0 0 0 370
KENYA 1 0 1 65 0 0 2 0 0 8 0 2 1 0 0 0 0 0 0 80
LIBERIA 1 0 0 0 23 0 0 1 0 0 0 0 0 0 0 0 0 0 0 24
NIGERIA 1 0 0 0 0 2,061 0 0 0 0 0 1 0 0 0 0 0 0 0 2,063
OTHER EAST
AFRICA 0 0 0 1 0 6 23 0 4 28 0 1 22 0 0 0 0 0 0 84
OTHER NORTH
AFRICA 7 0 0 0 0 0 0 173 0 0 0 0 0 0 0 0 0 0 0 180
OTHER WEST,
CENTRAL,
SOUTHERN 1 0 2 0 4 40 3 0 50 17 0 0 0 0 0 0 0 0 0 116
SOUTH AFRICA 0 0 0 0 1 0 0 0 0 628 0 1 0 0 0 0 0 0 0 631
SUDAN 8 0 0 0 0 0 0 0 0 0 185 0 0 0 0 0 0 0 0 193
UGANDA 0 1 0 0 0 0 7 0 0 0 0 63 0 0 0 0 0 0 0 71
ZIMBABWE 0 0 0 0 0 0 0 0 0 88 0 0 33 0 0 0 0 0 0 122
CARIBBEAN 0 0 0 0 0 0 0 1 4 0 0 0 0 0 0 0 0 0 0 4
ENGLISH
SPEAKING 7 0 4 0 0 108 7 3 0 53 0 0 2 0 0 0 0 0 0 184
EUROPE 7 1 3 0 0 123 0 3 0 12 2 0 0 0 0 0 0 0 0 151
REST OF
WORLD 141 0 2 0 0 25 0 15 0 123 0 7 10 0 0 0 0 0 0 323
SOUTH ASIA 15 0 1 0 0 103 14 5 0 8 0 2 0 0 0 0 0 0 0 147
UNITED STATES 62 1 0 0 11 174 5 30 0 71 4 18 5 0 0 0 0 0 0 381
TOTAL 1,964 272 360 66 39 2,664 64 244 58 1,035 196 94 73 0 0 0 0 0 0 7,129

38
TABLE 8. AMA DATA - COUNTRY OF TRAINING AND BIRTH COMBINED
LOCATION OF TRAINING
LOCATION OF
BIRTH E
GY
PT
ET
HIO
PIA
GH
AN
A
KE
NY
A
LIB
ER
IA
NIG
ER
IA
OT
HE
R E
AS
T
AF
RIC
A
OT
HE
R N
OR
TH
AF
RIC
A
OT
HE
R W
ES
T
CE
NT
RA
L
SO
UT
HE
RN
AF
RIC
A
SO
UT
H A
FR
ICA
SU
DA
N
UG
AN
DA
ZIM
BA
BW
E
CA
RIB
BE
AN
EN
GL
ISH
SP
EA
KIN
G
EU
RO
PE
RE
ST
OF
WO
RL
D
SO
UT
H A
SIA
UN
ITE
D
ST
AT
ES
TO
TA
L
EGYPT 3,528 2 0 0 0 0 2 23 0 0 6 0 0 47 15 31 37 2 558 4,252
ETHIOPIA 4 510 0 1 0 0 0 3 0 0 1 2 0 19 3 38 3 10 232 826
GHANA 0 0 672 0 1 26 2 0 0 0 0 0 0 35 3 40 17 3 384 1,183
KENYA 3 0 2 169 0 0 3 0 0 10 0 6 2 28 94 11 8 167 291 794
LIBERIA 2 0 0 0 37 0 0 2 0 0 0 0 0 3 0 7 5 4 91 150
NIGERIA 2 0 0 0 0 2,476 1 0 1 0 0 2 0 62 9 29 8 10 342 2,942
OTHER EAST
AFRICA 0 0 0 2 0 7 55 0 6 36 0 2 27 32 24 17 5 67 185 464
OTHER NORTH
AFRICA 14 0 0 0 0 0 0 300 1 0 0 0 0 9 7 19 23 15 121 509
OTHER WEST,
CENTRAL,
SOUTHERN 2 0 4 0 5 47 4 0 87 22 0 0 0 49 10 51 13 4 144 441
SOUTH AFRICA 1 0 0 0 2 0 0 0 0 818 0 2 0 4 10 4 13 4 172 1,031
SUDAN 16 0 0 0 0 0 0 0 0 0 307 0 0 4 3 10 1 2 31 374
UGANDA 0 2 0 0 0 0 10 0 0 0 0 100 0 9 27 8 3 45 69 273
ZIMBABWE 0 0 0 0 0 0 1 0 0 113 0 0 52 0 3 2 0 1 37 210
CARIBBEAN 0 0 0 0 0 0 0 2 5 0 0 0 0 0 0 0 0 0 0 6
ENGLISH
SPEAKING 13 0 7 0 0 127 11 5 0 69 0 0 5 0 0 0 0 0 0 237
EUROPE 14 2 6 0 0 134 1 6 0 16 3 0 0 0 0 0 0 0 0 182
REST OF
WORLD 306 0 3 0 0 30 1 27 0 159 0 10 12 0 3 0 0 0 0 551
SOUTH ASIA 33 0 2 1 0 131 34 9 0 11 0 4 1 0 1 0 0 0 0 226
UNITED STATES 125 2 0 0 14 195 8 58 0 92 6 25 7 0 7 0 0 0 0 539
TOTAL 4,062 519 696 173 59 3,175 134 433 100 1,345 324 151 106 301 219 267 136 334 2,657 15,191

39
TABLE 9 ACS DATA - COUNTRY OF TRAINING PREDICTIONS WHEN COUNTRY OF BIRTH IS GIVEN
LOCATION OF TRAINING
LOCATION OF
BIRTH E
GY
PT
ET
HIO
PIA
GH
AN
A
KE
NY
A
LIB
ER
IA
NIG
ER
IA
OT
HE
R E
AS
T
AF
RIC
A
OT
HE
R N
OR
TH
AF
RIC
A
OT
HE
R W
ES
T
CE
NT
RA
L
SO
UT
HE
RN
AF
RIC
A
SO
UT
H A
FR
ICA
SU
DA
N
UG
AN
DA
ZIM
BA
BW
E
CA
RIB
BE
AN
EN
GL
ISH
SP
EA
KIN
G
EU
RO
PE
RE
ST
OF
WO
RL
D
SO
UT
H A
SIA
UN
ITE
D S
TA
TE
S
TO
TA
L
EGYPT 48 16 31 36 2 637
ETHIOPIA 62 10 115 9 25 577
GHANA 46 4 53 24 4 351
KENYA 23 72 7 6 135 380
LIBERIA 15 0 40 31 28 251
NIGERIA 145 16 168 19 225 1,235
OTHER EAST
AFRICA 80 63 45 10 164 639
OTHER NORTH
AFRICA 18 17 28 47 32 249
OTHER WEST,
CENTRAL,
SOUTHERN 109 20 144 35 8 381
SOUTH AFRICA 37 76 33 113 32 1,002
SUDAN 4 2 11 7 3 23
UGANDA 3 34 15 2 91 81
ZIMBABWE 0 10 6 0 2 194
CARIBBEAN
ENGLISH
SPEAKING
EUROPE
REST OF
WORLD
SOUTH ASIA
UNITED STATES
TOTAL 590 341 697 339 753 6,000

40
TABLE 10 – ALL PREDICTIONS COMBINED FOR COMPLETE LOCATION OF BIRTH AND EDUCATION MATRIX
LOCATION OF TRAINING
LOCATION OF
BIRTH E
GY
PT
ET
HIO
PIA
GH
AN
A
KE
NY
A
LIB
ER
IA
NIG
ER
IA
OT
HE
R E
AS
T
AF
RIC
A
OT
HE
R N
OR
TH
AF
RIC
A
OT
HE
R W
ES
T
CE
NT
RA
L
SO
UT
HE
RN
AF
RIC
A
SO
UT
H A
FR
ICA
SU
DA
N
UG
AN
DA
ZIM
BA
BW
E
CA
RIB
BE
AN
EN
GL
ISH
SP
EA
KIN
G
EU
RO
PE
RE
ST
OF
WO
RL
D
SO
UT
H A
SIA
UN
ITE
D S
TA
TE
S
TO
TA
L
EGYPT 3,528 2 0 0 0 0 2 23 0 0 6 0 0 48 16 31 36 2 637 4,332
ETHIOPIA 4 510 0 1 0 0 0 3 0 0 1 2 0 62 10 115 9 25 577 1,320
GHANA 0 0 672 0 1 26 2 0 0 0 0 0 0 46 4 53 24 4 351 1,183
KENYA 3 0 2 169 0 0 3 0 0 10 0 6 2 23 72 7 6 135 380 819
LIBERIA 2 0 0 0 37 0 0 2 0 0 0 0 0 15 0 40 31 28 251 405
NIGERIA 2 0 0 0 0 2,476 1 0 1 0 0 2 0 145 16 168 19 225 1,235 4,290
OTHER EAST
AFRICA 0 0 0 2 0 7 55 0 6 36 0 2 27 80 63 45 10 164 639 1,135
OTHER NORTH
AFRICA 14 0 0 0 0 0 0 300 1 0 0 0 0 18 17 28 47 32 249 708
OTHER WEST,
CENTRAL,
SOUTHERN 2 0 4 0 5 47 4 0 87 22 0 0 0 109 20 144 35 8 381 868
SOUTH AFRICA 1 0 0 0 2 0 0 0 0 818 0 2 0 37 76 33 113 32 1,002 2,115
SUDAN 16 0 0 0 0 0 0 0 0 0 307 0 0 4 2 11 7 3 23 374
UGANDA 0 2 0 0 0 0 10 0 0 0 0 100 0 3 34 15 2 91 81 339
ZIMBABWE 0 0 0 0 0 0 1 0 0 113 0 0 52 0 10 6 0 2 194 378
CARIBBEAN 0 0 0 0 0 0 0 2 5 0 0 0 0 6
ENGLISH
SPEAKING 13 0 7 0 0 127 11 5 0 69 0 0 5
237
EUROPE 14 2 6 0 0 134 1 6 0 16 3 0 0
182
REST OF
WORLD 306 0 3 0 0 30 1 27 0 159 0 10 12
548
SOUTH ASIA 33 0 2 1 0 131 34 9 0 11 0 4 1
225
UNITED STATES 125 2 0 0 14 195 8 58 0 92 6 25 7 532
TOTAL 4,062 519 696 173 59 3,175 134 433 100 1,345 324 151 106 590 341 697 339 753 6,000 19,997

41
Table 11. Location of Birth for Five Largest Countries in Terms of Training
EGYPT ETHIOPIA GHANA NIGERIA SOUTH AFRICA
Born at home 3,528 87% 510 98% 672 97% 2,476 78% 818 61%
(15) (2) (4) (97) (33)
Born in other African country 44 1% 5 1% 6 1% 80 3% 181 13%
(5) (2) (2) (30) (24)
Born in US 125 3% 2 0% 0 0% 195 6% 92 7%
(8) (1) (0) (58) (17)
Born in rest of the world 365 9% 2 0% 18 3% 424 13% 254 19%
(13) (1) (4) (69) (23)
TOTAL TRAINED 4,062 100% 519 100% 696 100% 3,175 100% 1,345 100%
The table reports estimated totals as described in the text for selected countries. Bootstrapped standard errors are in parentheses using 100 replications.
Table 12. Location of Training for Five Largest Countries in Terms of Birth Place
EGYPT ETHIOPIA GHANA NIGERIA SOUTH AFRICA
Trained at home 3,528 81% 510 39% 672 57% 2,476 58% 818 39%
(15) (2) (4) (97) (33)
Trained in other African country 33 1% 11 1% 29 2% 6 0% 6 0%
(6) (3) (22) (3) (6)
Trained in US 637 15% 577 44% 351 30% 1,235 29% 1,002 47%
(192) (174) (38) (219) (175)
Trained in rest of the world 133 3% 222 17% 131 11% 573 13% 290 14%
(52) (65) (33) (33) (64)
TOTAL BORN 4,332 100% 1,320 100% 1,183 100% 4,290 100% 2,115 100%
The table reports estimated totals as described in the text for selected countries. Bootstrapped standard errors are in parentheses using 100 replications.
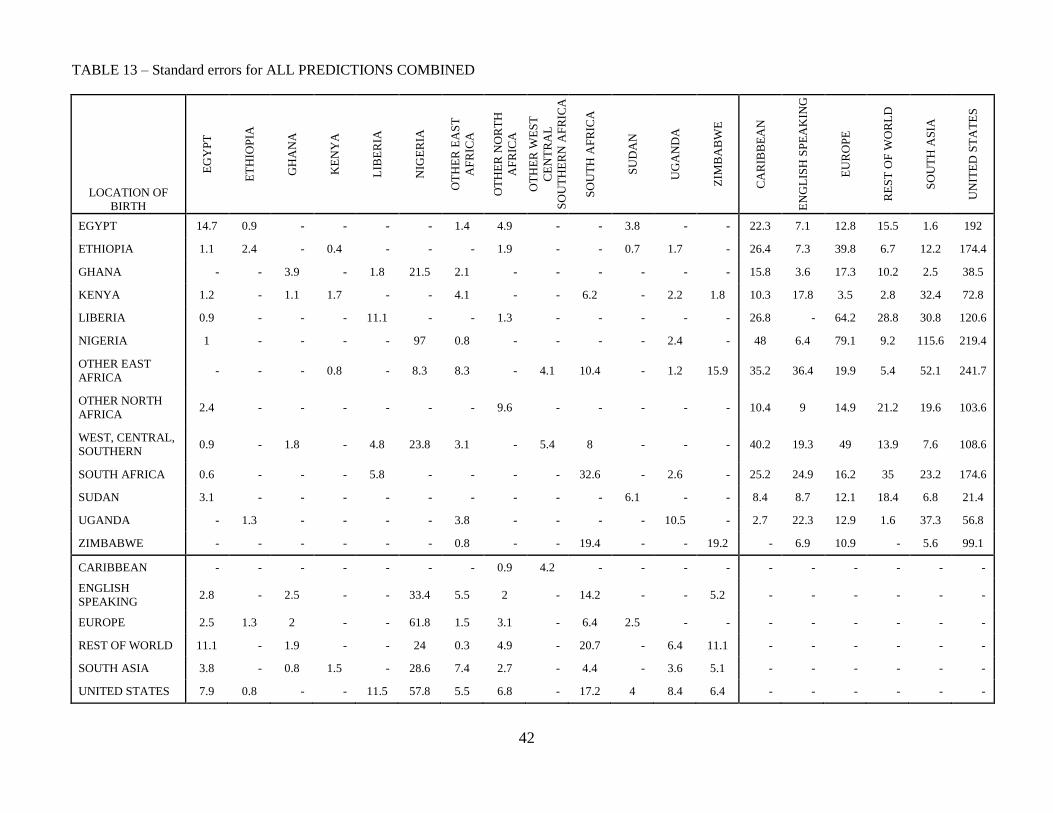
42
TABLE 13 – Standard errors for ALL PREDICTIONS COMBINED
LOCATION OF
BIRTH E
GY
PT
ET
HIO
PIA
GH
AN
A
KE
NY
A
LIB
ER
IA
NIG
ER
IA
OT
HE
R E
AS
T
AF
RIC
A
OT
HE
R N
OR
TH
AF
RIC
A
OT
HE
R W
ES
T
CE
NT
RA
L
SO
UT
HE
RN
AF
RIC
A
SO
UT
H A
FR
ICA
SU
DA
N
UG
AN
DA
ZIM
BA
BW
E
CA
RIB
BE
AN
EN
GL
ISH
SP
EA
KIN
G
EU
RO
PE
RE
ST
OF
WO
RL
D
SO
UT
H A
SIA
UN
ITE
D S
TA
TE
S
EGYPT 14.7 0.9 - - - - 1.4 4.9 - - 3.8 - - 22.3 7.1 12.8 15.5 1.6 192
ETHIOPIA 1.1 2.4 - 0.4 - - - 1.9 - - 0.7 1.7 - 26.4 7.3 39.8 6.7 12.2 174.4
GHANA - - 3.9 - 1.8 21.5 2.1 - - - - - - 15.8 3.6 17.3 10.2 2.5 38.5
KENYA 1.2 - 1.1 1.7 - - 4.1 - - 6.2 - 2.2 1.8 10.3 17.8 3.5 2.8 32.4 72.8
LIBERIA 0.9 - - - 11.1 - - 1.3 - - - - - 26.8 - 64.2 28.8 30.8 120.6
NIGERIA 1 - - - - 97 0.8 - - - - 2.4 - 48 6.4 79.1 9.2 115.6 219.4
OTHER EAST
AFRICA - - - 0.8 - 8.3 8.3 - 4.1 10.4 - 1.2 15.9 35.2 36.4 19.9 5.4 52.1 241.7
OTHER NORTH
AFRICA 2.4 - - - - - - 9.6 - - - - - 10.4 9 14.9 21.2 19.6 103.6
WEST, CENTRAL,
SOUTHERN 0.9 - 1.8 - 4.8 23.8 3.1 - 5.4 8 - - - 40.2 19.3 49 13.9 7.6 108.6
SOUTH AFRICA 0.6 - - - 5.8 - - - - 32.6 - 2.6 - 25.2 24.9 16.2 35 23.2 174.6
SUDAN 3.1 - - - - - - - - - 6.1 - - 8.4 8.7 12.1 18.4 6.8 21.4
UGANDA - 1.3 - - - - 3.8 - - - - 10.5 - 2.7 22.3 12.9 1.6 37.3 56.8
ZIMBABWE - - - - - - 0.8 - - 19.4 - - 19.2 - 6.9 10.9 - 5.6 99.1
CARIBBEAN - - - - - - - 0.9 4.2 - - - - - - - - - -
ENGLISH
SPEAKING 2.8 - 2.5 - - 33.4 5.5 2 - 14.2 - - 5.2 - - - - - -
EUROPE 2.5 1.3 2 - - 61.8 1.5 3.1 - 6.4 2.5 - - - - - - - -
REST OF WORLD 11.1 - 1.9 - - 24 0.3 4.9 - 20.7 - 6.4 11.1 - - - - - -
SOUTH ASIA 3.8 - 0.8 1.5 - 28.6 7.4 2.7 - 4.4 - 3.6 5.1 - - - - - -
UNITED STATES 7.9 0.8 - - 11.5 57.8 5.5 6.8 - 17.2 4 8.4 6.4 - - - - - -