Embed Size (px)
Citation preview
IAB Discussion PaperArticles on labour market issues
20/2017
Susanne Wanger
ISSN 2195-2663
What makes employees satisfied with their working time? The role of working hours, time-sovereignty and working conditions for working time and job satisfaction
Year
s
IAB-Discussion Paper 20/2017 2
What makes employees satisfied with their working time? The role of working hours, time-sovereignty and working conditions for working time and job satisfaction
Susanne Wanger (IAB)
IAB-Discussion Paper 20/2017 3
Content
Abstract .................................................................................................................... 4
Zusammenfassung ................................................................................................... 4
1 Introduction .......................................................................................................... 5
2 Review of Literature ............................................................................................. 6
3 Data and Empirical Analysis ................................................................................ 8
4 Modelling Working Time and Job Satisfaction .................................................... 12 4.1 Dependent Variables and Method ................................................................... 12 4.2 Control Variables ............................................................................................. 13
5 Estimation Results ............................................................................................. 15 5.1 Working Time Satisfaction ............................................................................... 16 5.2 Job Satisfaction ............................................................................................... 17 5.3 Average Marginal Effects ................................................................................. 21
6 Summary and Conclusions ................................................................................ 26
References ............................................................................................................. 28
Appendices ............................................................................................................ 32
A Data: German BiBB/BAuA-Employment Survey 2012 ........................................ 32
B Factor Analysis .................................................................................................. 34
C Average Marginal Effects ................................................................................... 36
IAB-Discussion Paper 20/2017 4
Abstract
Working time arrangements are key elements of working conditions and determine the possibilities for employees to balance work with their other life spheres. Therefore, this paper examines the level of working time satisfaction of employees and identifies the factors that may facilitate or impede satisfaction with working time using cross-sectional data from the German BIBB/BAuA-Employment Survey. The analytical ba-sis is a generalized ordered logistic regression model. The main results indicate that individual time-sovereignty is positively linked with a high level of working time satis-faction. Worker-friendly working time arrangements, which lead to less stress, inse-curity and mental pressure, increase satisfaction levels, whereas atypical working time arrangements, such as unpaid overtime and working shifts, weekends and under high intensity, reduce satisfaction levels.
Zusammenfassung
Die Arbeitszeit und ihre Ausgestaltung sind Kernelemente von Arbeitsbedingungen und geben den Rahmen vor, der Beschäftigten für die Vereinbarkeit von Beruf und Privatleben zur Verfügung steht. Wir analysieren auf Basis der BiBB/BAuA-Erwerbs-tätigenbefragung die Zufriedenheit von Beschäftigten mit ihrer Arbeitszeit und welche Bestimmungsfaktoren diese erhöht bzw. verschlechtert. Die Ergebnisse der Ordered-Logit-Modelle zeigen, dass das Zufriedenheitslevel deutlich höher liegt, wenn Be-schäftigte über eine hohe individuelle Zeitsouveränität verfügen und die Lage ihrer Arbeitszeit beeinflussen und mitgestalten können. Auch vorteilhafte Arbeitsbedingun-gen und -anforderungen mit einem geringen Maß an Stress, Unsicherheit und psy-chischen Druck erhöhen das Maß an Zufriedenheit, während atypische Arbeitszeitre-gelungen wie unbezahlte Überstunden, Schicht- und Wochenendarbeit sowie eine hohe Arbeitsintensität die Arbeitszeitzufriedenheit reduzieren.
JEL-Klassifikation: J22, J28, J81
Keywords: Working time satisfaction, time-sovereignty, working hour preferences, working time arrangements, flexibility, job satisfaction, Germany
IAB-Discussion Paper 20/2017 5
1 Introduction Recent decades have been marked by an overall trend towards a greater diversifica-tion in working time arrangements and flexibility in working hours (Absenger et al. 2014, Anttila et al. 2015, Plantenga et al. 2010). Working hours and working time ar-rangements are key elements of working conditions and determine the possibilities for employees to balance work with their other life spheres. This development has led to an increasing literature that suggests the impact that the changed work time pat-terns might have on the satisfaction, happiness and well-being of workers and their families (Merz 2002, Holly/Mohnen 2012, Golden/Okulicz-Kozaryn 2015, Rønsen/Kit-terød 2010, van der Meer/Wielers 2013, Hanglberger 2010).
However, the existing studies offer little evidence about the influence of working time arrangements on working time satisfaction in particular. Two studies have explicitly investigated the relationship between part-time work and working hour satisfaction in the UK and Australia (Booth/van Ours 2009; Booth/van Ours 2008). Men appear to have the highest hours of work satisfaction if they work full-time without overtime hours. For women, the findings on hour satisfaction indicate that woman prefer part-time jobs regardless of whether they are small or large. But both studies have focused on satisfaction with hours worked and not on satisfaction with working time as a broader concept.
The majority of the remaining literature has concentrated on working hour discrepan-cies as an expression of working hour dissatisfaction. In contrast, a close match of preferred and current working hours is interpreted to represent high satisfaction with working hours (Rønsen/Kitterød 2010; Bijwaard/van Djik/de Koning 2008; Merz 2002; Booth/van Ours 2013). Furthermore some papers analyze the effects on how well-being is related to working time mismatches (Wooden et al. 2009, Wunder/Heineck 2013). But the concept working time satisfaction includes more than a simple com-parison of preferred and current working hours. Whereas the satisfaction with hours worked measures only the satisfaction with the length of working time, working time satisfaction is more general and can provide additional information to other dimen-sions of working time such as location, distribution, work-intensity, flexibility or calcu-lability. Therefore the main purpose of the underlying study is to shed light on the factors that determine employee satisfaction with working time and to examine how important this determinant is for job satisfaction.
This paper contributes to the existing literature on working hour satisfaction in several ways. It is the first study to comprehensively examine the perceived working time sat-isfaction of employees with different kinds of flexible working time arrangements. I exploit a special data set that provides a unique opportunity to examine working time satisfaction in a broader context for Germany, because it contains a specific question on satisfaction with working time, going beyond satisfaction with hours worked. Up to now empirical studies are missing that take into account not only the length of hours worked but also the other dimensions of working time when analyzing the satisfaction with working time.
IAB-Discussion Paper 20/2017 6
In this respect, Germany provides an interesting role model, since flexible employ-ment forms and especially flexible working time arrangements have prevailed over the past decades and a wide range of flexible working time instruments is in use. The German labour market is characterized by relatively low external flexibility, though there also exists comparatively high internal flexibility, particularly by adjusting work-ing hours to demand fluctuations. This flexibility made a positive contribution to the development of the German Labor Market, but also to a growing dualization of em-ployment (Eichhorst 2015).
My analysis focuses on the following questions: What circumstances make employ-ees satisfied with their working time? Which factors associated with the household, the job or working time arrangements facilitate or impede working time satisfaction? In addition, I connect these results to the job satisfaction literature by analyzing whether the same factors that contribute to working time satisfaction are responsible for job satisfaction.
The paper is structured as follows: in section 2, I review the relevant literature on working time satisfaction, with a particular focus on the literature on working hour dis-crepancies. Next, I describe the data set and variables and provide some descriptive results. Section 4 outlines the methodological approach. The following section exam-ines the degree to which employees are satisfied with their current working time and their current job. Finally, section 6 presents my conclusions.
2 Review of Literature Working time satisfaction is a direct measure of the contentment that an employed worker derives from his current working time arrangements, and dissatisfaction may have behavioral consequences. For example, not being able to realize a desired work-ing time or working time arrangement may cause employees to change jobs (Bi-jwaard/van Djik/de Koning 2008). Unusual working hours can complicate participation in social life and work life balance (Greubel et al. 2016). As has been shown in studies on job satisfaction, aspects that are related to working hours have an impact on job satisfaction; persons who are satisfied with the length of their working hours tend to be more satisfied with their jobs in general (Boot/van Ours 2008, Jahn 2013). In ad-dition, working conditions that contribute to the satisfaction of workers lead to higher motivation and commitment (Wolter et al. 2016), which may positively affect produc-tivity. The well-being of employees in a workplace has been shown to lead to a return in productivity (Oswald/Proto/Sgroi 2015).
As mentioned before Booth/van Ours are the first and only to investigate working hour satisfaction in Great Britain (2008) and Australia (2009). The majority of the remaining studies focus on hour mismatches when they have sought a measure for working hour satisfaction. To quantify working hour mismatches, respondents are asked to nomi-nate the exact number of their preferred hours, thereby giving researchers a quanti-tative measure of the size of any discrepancy between current hours and preferred hours. Working time preference data are useful, and working hour mismatches help
IAB-Discussion Paper 20/2017 7
to focus attention on what workers want. However, they are weakened by the common instability of answers to simple working time preference questions because many workers are uncertain about their working hours (Campbell/van Wanrooy 2013; Golden 2015; Holst/Bringmann 2016). Researchers commonly use responses to pref-erence questions to classify employees into categories of either ‘match’ or ‘mismatch’. Often the greatest possible match of current working hours and preferred working hours is interpreted as a measure for high working time satisfaction (Rønsen/Kitterød 2010; Bijwaard/van Djik/de Koning 2008; Merz 2002; Booth/van Ours 2013). Hour mismatches are quite common in Germany and Europe (Wielers/Münderlein/Koster 2014). The number of employees with working hour mismatches varies among differ-ent national surveys (Holst/Bringmann 2016) due to differences in concept and ques-tion wording: the estimates for 2014 range from 12 percent (Wanger/Weber 2016) to almost 52 percent (Seifert et al. 2016).1
In general, the recent studies on working hours mismatch find worse health among mismatched workers than among those with matched working hours (Kugler/Wienci-erz/Wunder 2014). As with other countries, the preferences for working time changes in Germany depend strongly on personal characteristics such as age, sex, family background, qualifications or income (Merz 2002, Grözinger/Matiaske/Tobsch 2008, Pollmann-Schult 2009, Ehing 2014, Wanger 2011). Some studies also focus on work-place-related characteristics. Rønsen and Kitterød (2010) showed that the content-ment with full-time working hours is lower with non-standard working hours such as shift or rotating work. Employees who work several days a week or daily in a home office more frequently want to reduce working hours (Holly/Mohnen 2012).
Few studies take a longitudinal view and show that working time preferences strongly depend on family events such as the birth of children or the death of a partner (Reyn-olds/Johnson 2012, Wooden et al. 2009), divorce (Wooden 2006) or a partner’s deci-sion (Reynolds 2014, Wunder/Heineck 2013). A college degree or a change of em-ployer does not help to reduce cases of mismatch (Reynolds/Aletraris 2010). Knaus and Otterbach (2016) find, as do Bijwaard, van Djik and de Koning (2008), that job mobility seems to increase the probability of resolving a mismatch; however, many previously underemployed end up with working more hours than are desired.
International comparisons on working hour preferences show strong effects of the share of part-time jobs on overemployment among full-time workers. In contrast, the preference for an increase in working hours depends more on the income level of the GDP in a society (Wielers/Münderlein/Koster 2014).
1 An overview of studies on working hour mismatch can be found in Holly/Mohnen 2012 or
Kugler/Wiencierz/Wunder 2014.
IAB-Discussion Paper 20/2017 8
Thus far, there is no literature that discusses the satisfaction of employees with regard to their working time based on the reported levels for Germany. Most studies investi-gate the factors that are responsible for working hour discrepancies (Ehing 2014, Poll-mann-Schult 2009, Merz 2002). I expand the scarce literature concerning satisfaction with working hours (Booth/van Ours 2008, 2009) and provide the first results for Ger-many for a more general measure: working time satisfaction.
This article contributes, empirically, to our understanding of the influence factors for the level of working time satisfaction of employees. If we know what makes employees satisfied with their working time, policy and employers can identify which measures are needed to help them to avoid dissatisfaction and negative behavioral conse-quences. Especially for German employers, it is important to offer good working con-ditions in times of high competition for skilled workers. Further, high levels of satisfac-tion make significant contributions to the productivity of a company (Oswald/Proto/Sgroi 2015).
3 Data and Empirical Analysis My empirical analysis were based on data from the BIBB/BAuA-Employment Survey2 (Rohrbach-Schmidt/Hall 2013; Hall/Siefer/Tiemann 2015), which is a representative survey among fully employed persons in Germany. "Fully employed persons" are de-fined as being at least 15 years old and in paid employment for at least 10 hours per week. The survey is conducted at an interval of every 6 or 7 years and contains sev-eral questions on employee job history and on the working conditions of the current job. I use the cross-sectional data of the last survey 2012 for the analysis. Missing values for the variables working time satisfaction and weekly working hours (actual and preferred) are dropped from the descriptive analysis. I restricted the sample to persons who are aged between 15 and 64. Furthermore I dropped data from employ-ees in private households and those who were self-employed from the sample be-cause a lot of explanatory variables are missing for these groups, which reduces the number of persons who were available for the descriptive analysis to 16,706 in 2012.
An advantage of the BIBB/BAuA-Employment Survey is that it contains a direct ques-tion about working time satisfaction that is measured on a four-level scale. Time sat-isfaction was constructed from responses to the following question, in the individual questionnaire:
“I will now concentrate on various aspects of your work. Regarding your work, please tell me for each aspect whether you are very satisfied, satisfied, less satisfied or not satisfied with it.
2 The BIBB/BAuA-Employment Survey is conducted by the Federal Institute for Vocational
Education and Training (Bundesinstitut für Berufsbildung - BIBB) in cooperation with the Federal Institute for Occupational Safety and Health (Bundesanstalt für Arbeitsschutz und Arbeitsmedizin - BAuA).
IAB-Discussion Paper 20/2017 9
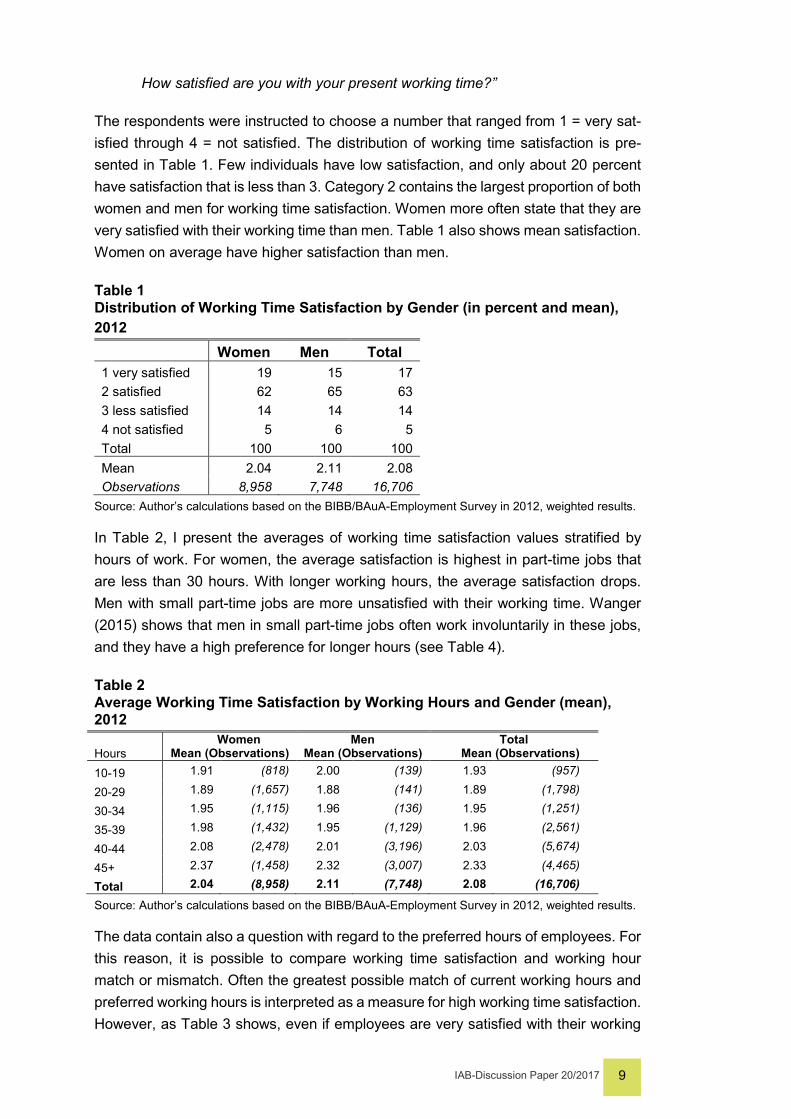
How satisfied are you with your present working time?”
The respondents were instructed to choose a number that ranged from 1 = very sat-isfied through 4 = not satisfied. The distribution of working time satisfaction is pre-sented in Table 1. Few individuals have low satisfaction, and only about 20 percent have satisfaction that is less than 3. Category 2 contains the largest proportion of both women and men for working time satisfaction. Women more often state that they are very satisfied with their working time than men. Table 1 also shows mean satisfaction. Women on average have higher satisfaction than men.
Table 1 Distribution of Working Time Satisfaction by Gender (in percent and mean), 2012
Women Men Total 1 very satisfied 19 15 17 2 satisfied 62 65 63 3 less satisfied 14 14 14 4 not satisfied 5 6 5 Total 100 100 100 Mean 2.04 2.11 2.08 Observations 8,958 7,748 16,706
Source: Author’s calculations based on the BIBB/BAuA-Employment Survey in 2012, weighted results.
In Table 2, I present the averages of working time satisfaction values stratified by hours of work. For women, the average satisfaction is highest in part-time jobs that are less than 30 hours. With longer working hours, the average satisfaction drops. Men with small part-time jobs are more unsatisfied with their working time. Wanger (2015) shows that men in small part-time jobs often work involuntarily in these jobs, and they have a high preference for longer hours (see Table 4).
Table 2 Average Working Time Satisfaction by Working Hours and Gender (mean), 2012
Hours Women
Mean (Observations) Men
Mean (Observations) Total
Mean (Observations) 10-19 1.91 (818) 2.00 (139) 1.93 (957)
20-29 1.89 (1,657) 1.88 (141) 1.89 (1,798)
30-34 1.95 (1,115) 1.96 (136) 1.95 (1,251)
35-39 1.98 (1,432) 1.95 (1,129) 1.96 (2,561)
40-44 2.08 (2,478) 2.01 (3,196) 2.03 (5,674)
45+ 2.37 (1,458) 2.32 (3,007) 2.33 (4,465)
Total 2.04 (8,958) 2.11 (7,748) 2.08 (16,706)
Source: Author’s calculations based on the BIBB/BAuA-Employment Survey in 2012, weighted results.
The data contain also a question with regard to the preferred hours of employees. For this reason, it is possible to compare working time satisfaction and working hour match or mismatch. Often the greatest possible match of current working hours and preferred working hours is interpreted as a measure for high working time satisfaction. However, as Table 3 shows, even if employees are very satisfied with their working
IAB-Discussion Paper 20/2017 10
time, they state preferences for less or more hours. As can be seen, the incidence of mismatch is considerable even if employees are very satisfied with their working time. Almost 28 percent of employed women are overemployed, and 18 percent are under-employed. For men, the respective percentages are 36 percent and 16 percent. Over-employment seems to be a bigger problem – the percentage of employees who want fewer hours increases strongly with the level of dissatisfaction, while the proportion of employees who want more hours seems to be nearly the same over the different sat-isfaction levels.
Table 3 Distribution of Working Time Satisfaction by Gender and Working Hour Preferences (percent and hours), 2012
Women wanting Total Men wanting Total
fewer hours
same hours
more hours
fewer hours
same hours
more hours
in percent 1 very satisfied 28 54 18 100 36 48 16 100 2 satisfied 40 44 16 100 48 42 10 100 3 less satisfied 61 23 16 100 75 19 7 100 4 not satisfied 65 16 19 100 70 20 10 100 Total 42 42 17 100 51 38 10 100 Mean 2.22 1.86 2.03 2.04 2.26 1.94 1.98 2.11 Observations 3,903 3,680 1,375 8,958 3,995 2,997 756 7,748
in hours 1 very satisfied -7.6 0 +10.0 -0.3 -7.6 0 +8.6 -1.4 2 satisfied -8.7 0 +9.7 -1.9 -8.4 0 +8.2 -3.2 3 less satisfied -10.5 0 +10.1 -4.8 -10.6 0 +11.4 -7.2 4 not satisfied -13.3 0 +11.5 -6.5 -14.0 0 +11.3 -8.6 Total -9.3 0 +9.9 -2.2 -9.2 0 +8.8 -3.8
Source: Author’s calculations based on the BIBB/BAuA-Employment Survey in 2012, weighted results.
Table 4 Average Working Time Satisfaction by Gender, Working Hours and Working Hour Pref-erences (mean and hours), 2012
Women wanting Men wanting fewer hours same hours more hours Fewer hours same hours more hours Hours mean hours mean hours mean hours mean hours mean hours mean hours 10-19 1.97 -3,8 1.74 - 2.06 +13.2 2.57 -5.2 1.86 - 2.02 +20.7 20-29 1.96 -5,1 1.79 - 2.02 +10.4 1.81 -6.8 1.71 - 2.02 +17.0 30-34 2.11 -7,4 1.81 - 2.07 +8.0 1.84 -5.8 1.70 - 2.36 +8.5 35-39 2.08 -7,8 1.87 - 1.99 +4.0 2.03 -5.2 1.89 - 1.96 +3.6 40-44 2.20 -7,9 1.93 - 1.90 +7.9 2.11 -5.8 1.92 - 1.90 +8.2 45+ 2.45 -14,1 2.06 - 2.32 +6.3 2.43 -12.7 2.06 - 2.03 +8.9 Total 2.22 -9,3 1.86 - 2.03 +9.9 2.26 -9.2 1.94 - 1.98 +8.8
Source: Author’s calculations based on the BIBB/BAuA-Employment Survey in 2012, weighted results.
The proportion that prefers longer working hours is considerably lower than the pro-portion that prefers shorter hours for women and men. This corresponds to the results of another national study on working hour preferences – the German Socio-Economic
IAB-Discussion Paper 20/2017 11
Panel3 (Seifert et al. 2016). Table 4 shows that people who want fewer hours are on average less satisfied with their working time than employees who want more hours; however, there are differences if the data are stratified by hours of work.
Furthermore, it is interesting how important working time satisfaction issues are for overall job satisfaction. Working time satisfaction can be correlated with the job satis-faction question because in the questionnaire, the job satisfaction question follows a series of satisfaction questions, i.e., on income, opportunities or working conditions with regard to the work of the employee and especially on the current working time satisfaction question (see page 8).
To summarize, the last question of this set of satisfaction questions is
“And now, as an overall summary:
How satisfied are you with your work as a whole?”
Table 5 Incidence of Working Time Arrangements and Average Satisfaction (Share in percent and mean), 2012
Working Time Arrangement Incidence (percent)
Average Working Time Satisfaction
(mean)
Average Job Satisfaction
(mean)
Shift work 18 2.30 1.93 Weekend work 66 2.15 1.85 Full-time work 77 2.12 1.83 Part-time work 19 1.91 1.79 Marginal work 4 1.97 1.87 Standby/on-call duty 17 2.17 1.83 No overtime 49 1.98 1.81 Overtime with compensation 42 2.13 1.84 Overtime without compensation 9 2.36 1.84 Work breaks are skipped 25 2.30 1.89 All employees 100 2.08 1.83
Source: Author’s calculations based on the BIBB/BAuA-Employment Survey in 2012, weighted results.
Table 5 presents the results of both questions. Average job satisfaction (1.83) is 0.25 points higher than average working time satisfaction (2.08), and, except for shift work, the values of average job satisfaction by working time arrangements show less vari-ation than the values of average working time satisfaction. What is remarkable is that part-time employees obtain the highest satisfaction values for working time as well as job satisfaction.
3 In 2012, approximately 42 percent wanted to work fewer hours, 46 percent wanted to work
the same hours, and 11 percent wanted to work more hours. The corresponding values in the 2012 German Socio-Economic Panel were 47 percent fewer hours, 40 percent the same hours and 13 percent more hours (Seifert et al. 2016).
IAB-Discussion Paper 20/2017 12
Based on these descriptive results I investigate the question of what makes employ-ees satisfied with their working time, and I connect this question to job satisfaction. Are the same factors that are accountable for the level of working time satisfaction the main drivers for the level of job satisfaction? Therefore, in the next section, I out-line my approach to the analysis of the two dependent variables: working time satis-faction and overall job satisfaction.
4 Modelling Working Time and Job Satisfaction 4.1 Dependent Variables and Method I dropped the missing values of the explanatory variables, which reduces my final sample to 14,061 persons. To gain more insight into what makes employees satisfied with their job and their working time and because of the ordinal structure of the de-pendent variables, a generalized ordered logit was applied. Ordinal variables are of-ten recoded to binary ones to facilitate an appropriate interpretation. I retain the or-dered structure of the dependent variable, and aside from the ordered logit, I base the estimates on a heterogeneous choice model, where the heteroscedasticity in choices is controlled for (Williams 2010). My two dependent variables in the estimations are self-reported working time satisfaction and job satisfaction levels. They measure sat-isfaction scored on a scale from 1 to 4. I transformed the original label into the inverse scale with a score of 4 described as “totally satisfied” and a score of 1 described as “totally dissatisfied”. That is because the model always takes the highest category as the reference category, and I want to know what increases the satisfaction level.
Assuming a latent satisfaction variable Y* exists,
𝑌𝑌∗ = 𝛽𝛽𝛽𝛽𝛽𝛽 + 𝛿𝛿𝛿𝛿𝛽𝛽 + 𝜃𝜃𝜃𝜃𝛽𝛽 + 𝜀𝜀
Where Y* is unobserved satisfaction and the explanatory variables 𝛽𝛽𝛽𝛽 represents so-cio-demographic characteristics, 𝛿𝛿𝛽𝛽 represents working time characteristics and 𝜃𝜃𝛽𝛽 represents general job characteristics. The coefficients 𝛽𝛽, 𝛿𝛿 𝑎𝑎𝑎𝑎𝑎𝑎 𝜃𝜃 give the effect of each explanatory variable on Y*. The last term 𝜀𝜀 represents a random disturbed that is assumed to be independent of the explanatory variables and this disturbance term is often assumed to have either a logistic or normal distribution.
Let Y* be divided by some cut points (thresholds): 𝛼𝛼1,𝛼𝛼2,𝛼𝛼𝑗𝑗 𝑎𝑎𝑎𝑎𝑎𝑎 𝛼𝛼1 < 𝛼𝛼2 < 𝛼𝛼𝑗𝑗. Con-sidering the observed satisfaction level is the ordinal outcome, y, ranging from 1 (not satisfied) to 4 (very satisfied):
𝑌𝑌 =
⎩⎨
⎧ 1 𝑖𝑖𝑖𝑖 𝑦𝑦∗ ≤ 𝛼𝛼12 𝑖𝑖𝑖𝑖 𝛼𝛼1 < 𝑦𝑦∗ ≤ 𝛼𝛼23 𝑖𝑖𝑖𝑖 𝛼𝛼2 < 𝑦𝑦∗ ≤ 𝛼𝛼34 𝑖𝑖𝑖𝑖 𝛼𝛼3 < 𝑦𝑦∗ ≤ 𝛼𝛼4
Therefore the probability of an employee at each satisfaction level can be computed:
IAB-Discussion Paper 20/2017 13
𝑃𝑃(𝑌𝑌 ≤ 𝑗𝑗) = 𝐹𝐹�𝛼𝛼𝑗𝑗 − 𝛽𝛽𝛽𝛽𝛽𝛽 − 𝛿𝛿𝛿𝛿𝛽𝛽 − 𝜃𝜃𝜃𝜃𝛽𝛽�, where 𝑗𝑗 = 1, 2, … 𝜃𝜃 − 1
General the model for the underlying 𝑦𝑦∗ can be written as:
𝑦𝑦𝑖𝑖∗ = 𝑎𝑎0 + 𝑎𝑎1𝑥𝑥𝑖𝑖1 + ⋯+ 𝑎𝑎𝑗𝑗𝑥𝑥𝑖𝑖𝑗𝑗 + 𝜎𝜎𝜀𝜀𝑖𝑖
where the 𝑥𝑥′𝑠𝑠 are the explanatory variables (𝛽𝛽𝛽𝛽,𝛿𝛿𝛽𝛽, 𝜃𝜃𝛽𝛽), the 𝛼𝛼′s are coefficients (𝛽𝛽, 𝛿𝛿,𝜃𝜃) that give the effect of each 𝑥𝑥 on 𝑦𝑦∗, 𝜀𝜀𝑖𝑖 is a residual term. The 𝜎𝜎 parameter allows the variance to be adjusted upward and downward. Because 𝑦𝑦∗ is a latent variable, its metric must be fixed in some way. Typically, this is done by scaling the
coefficients so that the residual variance is 𝜋𝜋2
3 as in logit. Note that in a logistic regres-
sion, the 𝛽𝛽′s rather than the 𝛼𝛼′s are estimated, which are related as follows:
ß𝑗𝑗 = 𝛼𝛼𝑗𝑗𝜎𝜎
, where 𝑗𝑗 = 1,2, … , 𝜃𝜃
As the above equation implies, it is not possible to estimate the 𝛼𝛼's and 𝜎𝜎 separately; all we can estimate are their ratios, the 𝛽𝛽's. This leads to a potential problem, when 𝜎𝜎 is the same for all cases – residuals are homoscedastic – the ratio between the 𝛼𝛼's and the 𝛽𝛽's is also the same for all cases. However, when 𝜎𝜎 differs across cases – there is heteroscedasticity – the ratio also differs. Because the coefficients are always scaled so that the residual variance is the same no matter what variables are in the model, the scaling of coefficients will differ across groups if the residual variances are different and will make the cross-group comparisons of effects invalid (see more de-tails in Williams 2010). For this reason, I estimate no separate models for females and males.
In a proportional odds model, the odds ratio of any predictor is assumed to be constant across all categories. To test the proportional odds assumption for the ordinal logisti-cal model, the Brant-test is proposed by examining the spate fits to the underlying binary logistical model (Long/Freese 2006). A nonsignificant test indicates that the proportional odds assumption is not violated (Xing 2009). Violating the proportional odds assumption can have a substantial effect on both the logit coefficients and the predicted probabilities (Fullerton/Xu 2012). To address these concerns I estimate het-erogeneous choice models and heteroscedastic logit models. Heterogeneous choice models (also known as location–scale models or heteroskedastic ordered models) explicitly specify the determinants of heteroscedasticity in an attempt to correct for it. Such models are also useful when the variance itself is of substantive interest (Wil-liams 2006, 2009, 2010). The heterogeneous choice model corrects for heterosce-dasticity by simultaneously fitting two equations: one for the determinants of the out-come, or choice, and another for the determinants of the residual variance, the vari-ance equation.
4.2 Control Variables When considering which explanatory variables to include in the models, I looked at the dimensions of working time and its different terms and at the general literature on
IAB-Discussion Paper 20/2017 14
satisfaction. Table A1 in the Supplementary Appendix presents the descriptive statis-tics for all of the variables that are used in the analysis.
I grouped the control variables into socio-demographic variables, working time char-acteristics and general job characteristics. The following variables were added as so-cio-demographic control variables: sex, age, squared age, years of school education, place of residence (West or East Germany), having a (working) partner and the num-ber of children below 18 years in the household. I included the hourly gross wage as an explanatory variable in my model. About 20 percent of the respondents in 2012 made no statement about their monthly gross income. The missing income data were therefore imputed by the data producers using a MNAR failure mechanism (for the algorithm, see more details in Alda/Rohrbach-Schmidt 2011). In addition to these per-sonal objective characteristics, I considered some personal subjective variables: I in-cluded a measure “desired profession”, which indicates that the employee is currently working in his chosen field and would not prefer to work in another profession. This measure also works as a proxy for “likes the nature and content of the work on its own merits”. In addition, I used a dummy to indicate whether the employee strongly pur-sues the goal of “having a secure job” as a measure for job-security.
In addition to the above-described socio-demographic measures, I considered work-ing time specific variables and measures for flexibility. An important variable that was included in the model is based on the question “How often do you succeed in taking your private interests and the interests of your family into account when planning your working hours?” The response option “often” indicates that the employee has a great autonomy over working time and this identifies good conditions to achieve a high work-life balance. Whereas the response option “sometimes” indicate lower levels of individual time-sovereignty and a lower degree of self-determined working hours and the response option “never” implies no time-sovereignty. In the same direction works the variable autonomy over work, where the employees could evaluate how often (of-ten, sometimes/rarely, never) they could plan and schedule their work on their own. Both variables are indicators for the employee’s ability to structure work and working time more or less autonomously. Weekly working hours were included as continuous variable. Furthermore, I controlled for working hour discrepancies by including whether the respondents want to work fewer, the same or more hours. Because of the different working time patterns of women and men (Jensen et al. 2017, Landivar 2015) I expect interactions for gender and working hour discrepancies with respect to working time satisfaction. Moreover I included the amount of the working hour dis-crepancy as absolute value. The measures for atypical working time arrangements and flexibility are working shifts, working on standby duty or on-call duty, working on Saturdays, Sundays and public holidays and working overtime. Overtime is differen-tiated depending on whether there is compensation for overtime, for example, whether remuneration and time off are paid. Furthermore, I control for work breaks that are often skipped on workdays, because the respondent has too much work to do. This measure works as a dummy variable for high intensity of work. In the same direction works the variable “workload”, where the respondent assesses if the amount
IAB-Discussion Paper 20/2017 15
of work complies with the requirements of the job or if the amount of work is rather overwhelming respectively sub-challenging the employee.
In addition to these working time characteristics, some variables characterize a job in general. I included the type of work contract, which addressed whether a respondent is employed at a temporary work agency, in the public service or is a blue- or white-collar employee. I control also if the respondent has a temporary contract and is in-terested in converting that into a permanent one. The two variables, short working-in period at the workplace and leading position, control for the complexity of the job and the replaceability of the employee. Furthermore, I control for variables that are con-nected with health and the working conditions of the job. The health status seems to play a major role for the rating of job satisfaction and therefore perhaps also for work-ing time satisfaction: a bad health status is connected with lower levels of job satis-faction (Lesch et al. 2013, Booth 2008, Booth 2009. However the causality is not clear, because some studies (Fischer/Sousa-Poza 2009, Faragher/Cass/Cooper 2005) found a reverse relationship of cause and effect. Therefore I didn’t include the re-ported subjective general state of health but rather the working conditions and work demands of the job as an index for work strains. The questionnaire contains approxi-mately 30 questions on working conditions and work demands. To reduce the number of variables, I performed a factor analysis and found three different scales (see Table B1 in the Supplementary Appendix): one that is related to physical working conditions (= proxy for health risks), a second one that is related to work demands (= proxy for work-intensity and stress), and a third one that is related to mental working conditions (= proxy for communication, openness and team-work). In my model, I considered the scores of these three scales: the higher the score, the more favorable the conditions. In addition to these scales, I included a dummy variable to determine whether work pressure and stress have increased in the last two years. Another dummy indicates whether a company is in a bad or less-good economic situation as an indication of job-uncertainty. Furthermore, I included other job-related variables, such as firm size coded in three categories and branches coded in six categories. This is an effort to control, at least in part, for unmeasured differences in other job characteristics.
5 Estimation Results The parameter estimates for working time satisfaction and job satisfaction that were obtained by the ordered logit model (ologit) and the heterogeneous choice model (oglm) are presented in Table 6. The table provides odds ratios, which gives the mul-tiplicative value for the odds if the independent variable increases by one unit. In com-paring the odds ratios of the regular ordered logit model (homoscedastic) and the heterogeneous choice model (heteroskedastic), I noticed that the results appear to be more or less the same. To answer the question of which model uses information in the data optimally, I performed information criteria comparisons between the models: a smaller value indicates a better fit while penalizing for the escalation of parameters. The AIC and BIC criteria are reported at the bottom of Table 6. As can be observed,
IAB-Discussion Paper 20/2017 16
these criteria suggest that the oglm model, which corrects for heteroscedasticity, should be favored over the other.
Some variables violate the proportional odds assumption. The oglm-model corrects for heteroscedasticity, therefore, in addition to the choice equations in the upper part, variance equations can be found in the lower part of Table 6. Significant variance equations show, for each variable, whether a group is more or less variable in its satisfaction than the reference group. Odds ratios > 1 reveal that a group is more variable, and odds ratios < 1 reveal that a group is less variable in its satisfaction than the reference group.
5.1 Working Time Satisfaction The upper part of the first column of Table 6 shows that there are no satisfaction effects on working time based on sex, age or a potential (employed) partner in the household. Working time satisfaction tends to be higher among employees in West Germany and when one child is living in the household although the effect is rarely statistically significant. In further analysis I found no interaction effects for partnership and children and the three-way-interaction partnership, children and gender was as well not significant. Years of school education shows a weak negative effect on work-ing time satisfaction, and increasing hourly gross wages have a positive impact on satisfaction. A review of the personal subjective variables reveals that, working in a desired profession and the preference of having a secure job have a positive effect on working time satisfaction.
Self-determined working hours with control over the timing of working hours are im-portant for working time satisfaction. With diminishing autonomy the level of working time satisfaction is strongly decreasing. This indicates the importance of time-sover-eignty and the ability to influence the timing of work for employees as preconditions to achieve a good work-life balance. Besides autonomy over working time also auton-omy over work planning is important: employees having less autonomy over work planning in their job report lower levels of satisfaction.
Reduced hours per week seems to have a positive effect on working time satisfaction. These findings are in line with Booth/van Ours (2009), where women and men who work part-time are found to be more satisfied. No interaction effects for gender and working hours were found, but for gender and working hour discrepancies. While over-employment leads to lower time satisfaction for men and women, underemployment shows the same effect only for women. Underemployed men seems to have higher satisfaction levels, but this effect is statistically not significant. Not surprisingly, also the extent of working hour discrepancy matters, working time satisfaction is negatively linked to a growing discrepancy between current and preferred working hours. Work-ing time satisfaction tends to be lower in atypical working time arrangements like work-ing shifts or on weekends. Jobs that are felt as stressful because of a high work-intensity characterized by breaks that are often skipped, unpaid overtime, increased
IAB-Discussion Paper 20/2017 17
stress at the workplace or an overwhelming amount of work have negative effects on working time satisfaction.
While white- and blue-collar employees were found to be significantly more satisfied with working times than civil servants, working at a work agency shows no statistically relevant effect as well as having a temporary contract. Good mental working condi-tions are evidence of a good and respectful work atmosphere in which teamwork, openness and communication in the workplace have a high priority; this variable pos-itively affects working time satisfaction, as does less stressful work demands. Em-ployees who can easily be replaced, as identified by a short working-in period report lower levels of satisfaction. In contrast being in a leading position shows no significant effect on satisfaction.
In general the results indicate that for working time satisfaction personal characteris-tics are less important. Satisfaction with working time is related not only with the actual working hours but also to the way working time is managed. Dissatisfaction is linked also to the increasing prevalence of unpaid overtime, atypical working time arrange-ments, less autonomy over timing of working hours, an overwhelming workload and increasing intensity of work. Finally, when looking at the job characteristics in general the work demands and mental working conditions are highly relevant for working time satisfaction.
5.2 Job Satisfaction This section will consider the estimates for job satisfaction. There is a great deal of research that addresses different aspects of job satisfaction and its correlates (for an overview, see, e.g., Haile 2015, Linz/Semykina 2012).The results of this study mostly accord with previous research on job satisfaction. I am especially interested as to whether the significant working time satisfaction determinants are also important for job satisfaction; therefore I focus in particular on just that aspect.
The third column of Table 6 shows that the relevant variables are in contrast to work-ing time satisfaction socio-demographic variables such as gender, age and squared age. Men as well as employees in the eastern part of Germany were found to be less satisfied with their job. Hauret/Williams (2017) find differences in occupational char-acteristics in particular appear to play an important part in explaining gender differ-ences in job satisfaction. The variable age is also included as a squared variable to determine the nature of its relationship with satisfaction. The significant squared age variable indicates that satisfaction increases are not linear with age. The estimates suggest that age is related to job satisfaction in a U-shaped pattern, as other studies also indicate (Perales/Tomaszewski 2016). Years of school education show a nega-tive effect on job satisfaction, Clark and Oswald (1996) explained that by the fact that education induces higher aspirations. An increasing hourly gross wage has a positive
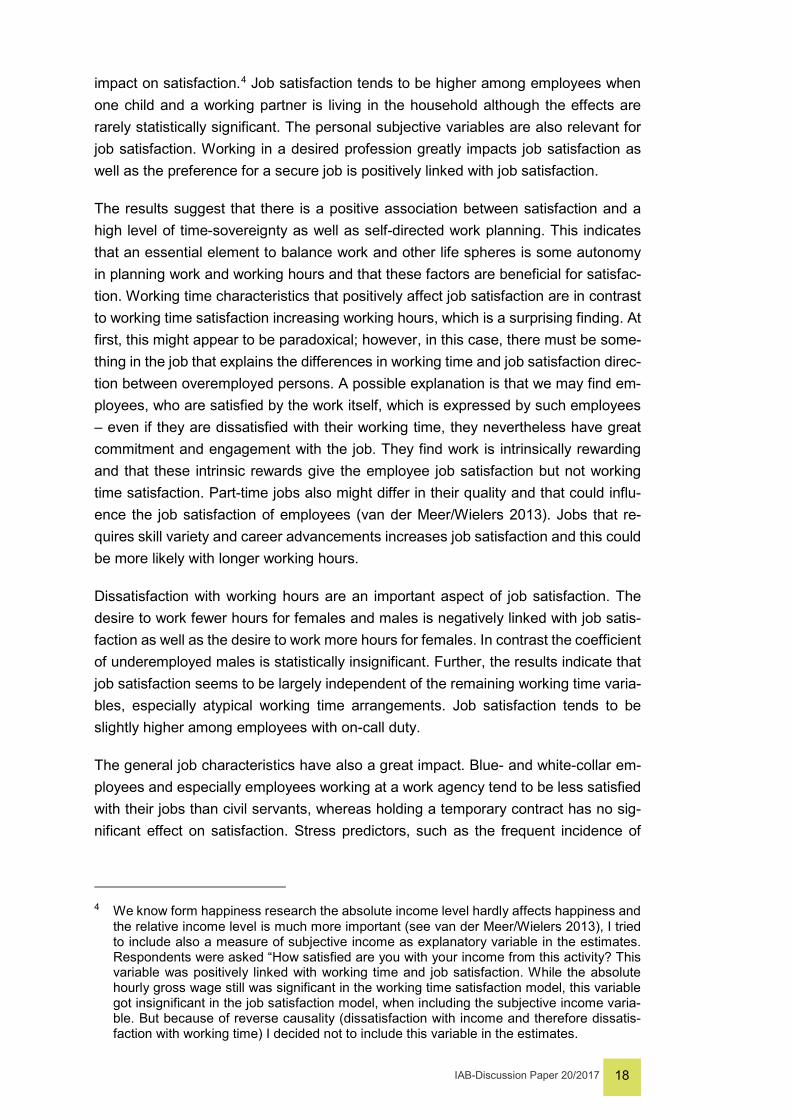
IAB-Discussion Paper 20/2017 18
impact on satisfaction.4 Job satisfaction tends to be higher among employees when one child and a working partner is living in the household although the effects are rarely statistically significant. The personal subjective variables are also relevant for job satisfaction. Working in a desired profession greatly impacts job satisfaction as well as the preference for a secure job is positively linked with job satisfaction.
The results suggest that there is a positive association between satisfaction and a high level of time-sovereignty as well as self-directed work planning. This indicates that an essential element to balance work and other life spheres is some autonomy in planning work and working hours and that these factors are beneficial for satisfac-tion. Working time characteristics that positively affect job satisfaction are in contrast to working time satisfaction increasing working hours, which is a surprising finding. At first, this might appear to be paradoxical; however, in this case, there must be some-thing in the job that explains the differences in working time and job satisfaction direc-tion between overemployed persons. A possible explanation is that we may find em-ployees, who are satisfied by the work itself, which is expressed by such employees – even if they are dissatisfied with their working time, they nevertheless have great commitment and engagement with the job. They find work is intrinsically rewarding and that these intrinsic rewards give the employee job satisfaction but not working time satisfaction. Part-time jobs also might differ in their quality and that could influ-ence the job satisfaction of employees (van der Meer/Wielers 2013). Jobs that re-quires skill variety and career advancements increases job satisfaction and this could be more likely with longer working hours.
Dissatisfaction with working hours are an important aspect of job satisfaction. The desire to work fewer hours for females and males is negatively linked with job satis-faction as well as the desire to work more hours for females. In contrast the coefficient of underemployed males is statistically insignificant. Further, the results indicate that job satisfaction seems to be largely independent of the remaining working time varia-bles, especially atypical working time arrangements. Job satisfaction tends to be slightly higher among employees with on-call duty.
The general job characteristics have also a great impact. Blue- and white-collar em-ployees and especially employees working at a work agency tend to be less satisfied with their jobs than civil servants, whereas holding a temporary contract has no sig-nificant effect on satisfaction. Stress predictors, such as the frequent incidence of
4 We know form happiness research the absolute income level hardly affects happiness and
the relative income level is much more important (see van der Meer/Wielers 2013), I tried to include also a measure of subjective income as explanatory variable in the estimates. Respondents were asked “How satisfied are you with your income from this activity? This variable was positively linked with working time and job satisfaction. While the absolute hourly gross wage still was significant in the working time satisfaction model, this variable got insignificant in the job satisfaction model, when including the subjective income varia-ble. But because of reverse causality (dissatisfaction with income and therefore dissatis-faction with working time) I decided not to include this variable in the estimates.
IAB-Discussion Paper 20/2017 19
mental working conditions, have a strong effect on job satisfaction and illustrate the important role of psychological stress on satisfaction. A good work atmosphere and got relation with colleagues improve satisfaction. The number of days of incapacity to work due to mental problems has increased in Germany over the last years, and men-tal illness has by far presented the highest absenteeism figures (Knieps/Pfaff 2016). Although physical working conditions also have a significant impact, they affect em-ployees to a lesser extent than psychological working conditions. In addition, employ-ees with increased stress in the workplace and where breaks are often skipped are less satisfied at work than those who have fewer of these conditions. The exception is overtime, which shows no significant impact on job satisfaction in the estimates. The results suggest that employees overwhelmed or sub-challenged by their work-load are also less satisfied with their job because jobs become stressful or boring if the amount of work as seen by the employee is unbalanced. The complexity of the job also has significant effects: a leading position has strong positive effects on job satisfaction. In contrast insecurity like working at a firm that facing a bad economic situation is negative for job satisfaction.
In general the results indicate that personal and job characteristics are most important for job satisfaction. When considering the working time characteristics especially de-creasing autonomy over work and working time, increasing working hours and the intensity of work was negatively and significantly linked with job satisfaction. Con-versely atypical working time arrangements do not appear to be detrimental to job satisfaction.
Regressing working time satisfaction and job satisfaction on the detailed socio-de-mographics, working time and job characteristics shows that when judging from the number of statistically significant coefficients, the working time characteristics mainly explain working time satisfaction, while the personal and job characteristics are more important for the explanation of job satisfaction.
Table 6 Ordered Logit Estimates of Satisfaction with Working Time and with the Job, Odds Ratios (Standard Errors)
Satisfaction with Working Time Satisfaction with Job Oglm Ologit Oglm Ologit Personal characteristics Male 1.031 (0.041) 1.027 (0.063) 0.886 ** (0.034) 0.817 ** (0.055) Age 0.997 (0.009) 0.990 (0.014) 0.960 *** (0.009) 0.925 *** (0.014) Age² 1.000 (0.000) 1.000 (0.000) 1.000 *** (0.000) 1.001 *** (0.000) Residence in West Germany 1.060 * (0.032) 1.102 * (0.050) 1.143 *** (0.034) 1.269 *** (0.062) Years of school education 0.982 ** (0.005) 0.976 ** (0.008) 0.981 *** (0.005) 0.962 *** (0.008) Hourly gross wage 1.005 ** (0.002) 1.008 * (0.003) 1.008 *** (0.002) 1.014 *** (0.003) Partnership
No partner (reference) Working partner 0.965 (0.026) 0.950 (0.039) 1.052 * (0.026) 1.089 * (0.047) No working partner 0.945 (0.036) 0.914 (0.053) 1.038 (0.038) 1.072 (0.071)
Number of children No children (reference) One child 1.072 * (0.038) 1.132 * (0.061) 1.064 * (0.033) 1.101 (0.062) Two children 0.999 (0.039) 1.027 (0.062) 1.048 (0.037) 1.076 (0.069)
IAB-Discussion Paper 20/2017 20
Satisfaction with Working Time Satisfaction with Job Oglm Ologit Oglm Ologit
More than three children 1.012 (0.070) 1.046 (0.114) 1.124 (0.074) 1.228 (0.148) Goal: Secure job 1.180 *** (0.033) 1.290 *** (0.046) 1.194 *** (0.034) 1.406 *** (0.054) Desired profession 1.238 *** (0.046) 1.387 *** (0.066) 2.410 *** (0.232) 4.590 *** (0.272) Working time characteristics Time-sovereignty
Often (reference) Sometimes 0.574 *** (0.035) 0.426 *** (0.018) 0.819 *** (0.026) 0.688 *** (0.030) Never 0.438 *** (0.045) 0.262 *** (0.023) 0.802 *** (0.048) 0.680 *** (0.065)
Self-directed work planning Often (reference) Sometimes/rarely 0.864 *** (0.029) 0.795 *** (0.037) 0.853 *** (0.028) 0.737 *** (0.037) Never 0.748 *** (0.050) 0.641 *** (0.058) 0.809 *** (0.047) 0.676 *** (0.065)
Weekly working hours 0.983 *** (0.002) 0.975 *** (0.002) 1.006 *** (0.002) 1.010 *** (0.003) Working hour discrepancies x gender (interactions)
Less hours x female 0.778 *** (0.038) 0.652 *** (0.041) 0.823 *** (0.035) 0.695 *** (0.046) Less hours x male 0.754 *** (0.037) 0.631 *** (0.039) 0.850 *** (0.035) 0.732 *** (0.050) Same hours (reference) More hours x female 0.747 *** (0.049) 0.605 *** (0.055) 0.875 * (0.046) 0.777 ** (0.072) More hours x male 1.058 (0.067) 1.053 (0.106) 0.939 (0.056) 0.880 (0.094)
Working hour discrepancy (ab-solute) 0.983 *** (0.003) 0.979 *** (0.004) 1.004 (0.002) 1.007 * (0.004) Overtime
No overtime (reference) Compensation for overtime 1.020 (0.027) 1.023 (0.043) 1.004 (0.024) 0.995 (0.044) Unpaid overtime 0.734 *** (0.039) 0.616 *** (0.041) 0.979 (0.040) 0.956 (0.070)
Shift work 0.666 *** (0.036) 0.535 *** (0.030) 0.959 (0.031) 0.941 (0.054) Standby/On-call duty 0.959 (0.031) 0.952 (0.047) 1.081 * (0.033) 1.149 * (0.062) Weekend work 0.835 *** (0.027) 0.737 *** (0.030) 0.991 (0.024) 0.991 (0.044) Breaks often skipped 0.741 *** (0.036) 0.629 *** (0.037) 0.898 ** (0.035) 0.831 ** (0.055) Workload
Complying (reference) Overwhelming 0.663 *** (0.034) 0.526 *** (0.026) 0.706 *** (0.034) 0.561 *** (0.031) Sub-challenging 1.093 (0.070) 1.131 (0.114) 0.843 ** (0.054) 0.720 ** (0.076)
Job characteristics general Occupational status
Civil servant (reference) White-collar employee 1.167 ** (0.059) 1.275 *** (0.094) 0.888 ** (0.038) 0.818 ** (0.062) Blue-collar employee 1.157 * (0.072) 1.278 ** (0.121) 0.845 ** (0.048) 0.766 ** (0.076) Work agency 1.104 (0.125) 1.197 (0.205) 0.672 ** (0.083) 0.493 *** (0.099)
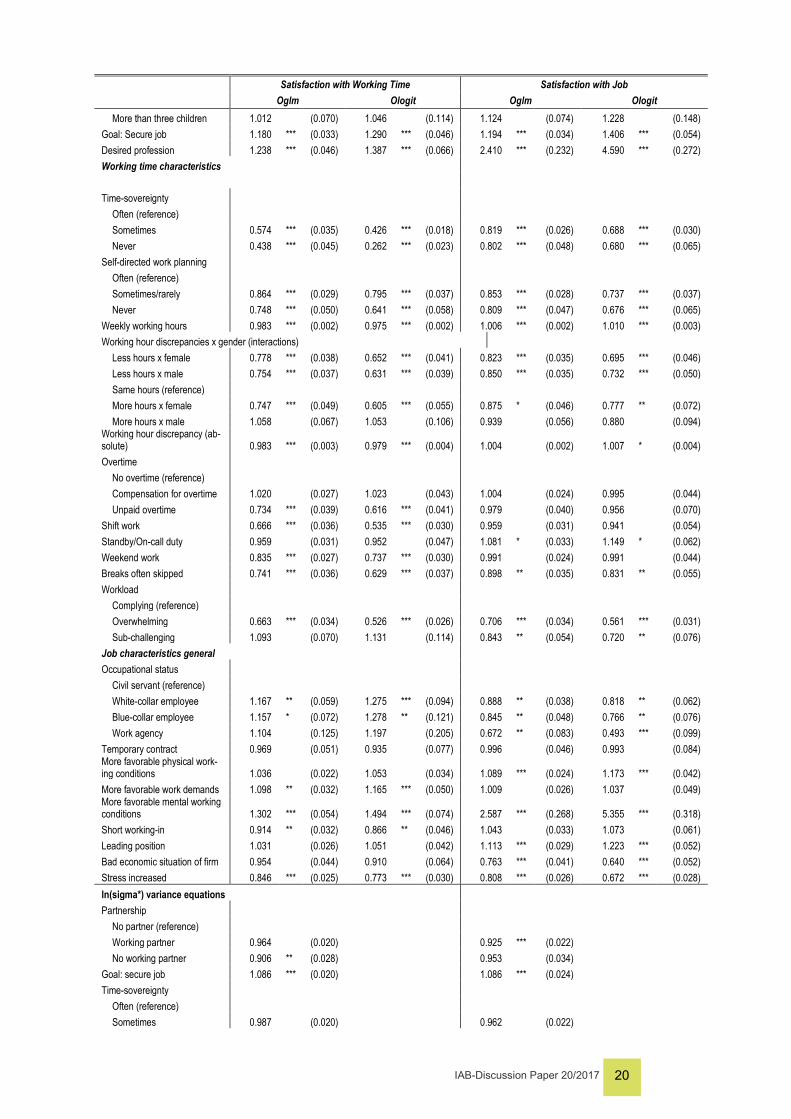
Temporary contract 0.969 (0.051) 0.935 (0.077) 0.996 (0.046) 0.993 (0.084) More favorable physical work-ing conditions 1.036 (0.022) 1.053 (0.034) 1.089 *** (0.024) 1.173 *** (0.042) More favorable work demands 1.098 ** (0.032) 1.165 *** (0.050) 1.009 (0.026) 1.037 (0.049) More favorable mental working conditions 1.302 *** (0.054) 1.494 *** (0.074) 2.587 *** (0.268) 5.355 *** (0.318) Short working-in 0.914 ** (0.032) 0.866 ** (0.046) 1.043 (0.033) 1.073 (0.061) Leading position 1.031 (0.026) 1.051 (0.042) 1.113 *** (0.029) 1.223 *** (0.052) Bad economic situation of firm 0.954 (0.044) 0.910 (0.064) 0.763 *** (0.041) 0.640 *** (0.052) Stress increased 0.846 *** (0.025) 0.773 *** (0.030) 0.808 *** (0.026) 0.672 *** (0.028) ln(sigma*) variance equations Partnership
No partner (reference) Working partner 0.964 (0.020) 0.925 *** (0.022) No working partner 0.906 ** (0.028) 0.953 (0.034)
Goal: secure job 1.086 *** (0.020) 1.086 *** (0.024) Time-sovereignty
Often (reference) Sometimes 0.987 (0.020) 0.962 (0.022)
IAB-Discussion Paper 20/2017 21
Satisfaction with Working Time Satisfaction with Job Oglm Ologit Oglm Ologit
Never 1.228 *** (0.052) 1.161 *** (0.052) Weekly working hours 0.994 *** (0.001) Working hour discrepancy (ab-solute) 1.012 *** (0.001) Shift work 1.148 *** (0.029) Workload
Complying (reference) Overwhelming 1.108 *** (0.026) 1.111 *** (0.028) Sub-challenging 1.216 *** (0.058) 1.221 *** (0.059)
Occupational status Civil servant (reference) White-collar employee 0.885 *** (0.030) Blue-collar employee 0.869 *** (0.035) Work agency 0.873 (0.075)
More favorable mental working conditions 0.934 ** (0.023) 0.860 *** (0.025) Desired profession 0.907 Overtime
No overtime (reference) Compensation for overtime 0.933 ** (0.022) Unpaid overtime 1.005 (0.038)
Bad economic situation of firm 1.105 ** (0.040) Cut point 1 0.070 *** (0.025) 0.018 *** (0.007) 0.602 * (0.150) 0.657 (0.289) Cut point 2 0.260 *** (0.074) 0.116 *** (0.045) 3.441 *** (0.926) 8.508 *** (3.699) Cut point 3 2.785 *** (0.755) 4.773 *** (1.848) 53.829 *** (25.342) 1015.117 *** (447.673) Industry dummies YES YES YES YES Firm size dummies YES YES YES YES Pseudo R2 0.154 0.144 0.188 0.182 Observations 14,061 14,061 14,061 14,061 Degrees of freedom 63 49 61 49 AIC 24,747.5 24,993.2 19,386.9 19,504.6 BIC 25,245.9 25,385.8 19,870.2 19,897.3
Notes: Data from the German BIBB/BAuA-Employment Survey 2012. Odds-Ratios and standard errors are in pa-rentheses. Oglm: Heterogeneous choice model. Ologit: Ordered logit model; Dependent variables: Working time satisfaction / Job satisfaction coded: score 1 = not satisfied, score 4 = very satisfied. Significant at * p<0.05; ** p<0.01; *** p<0.001
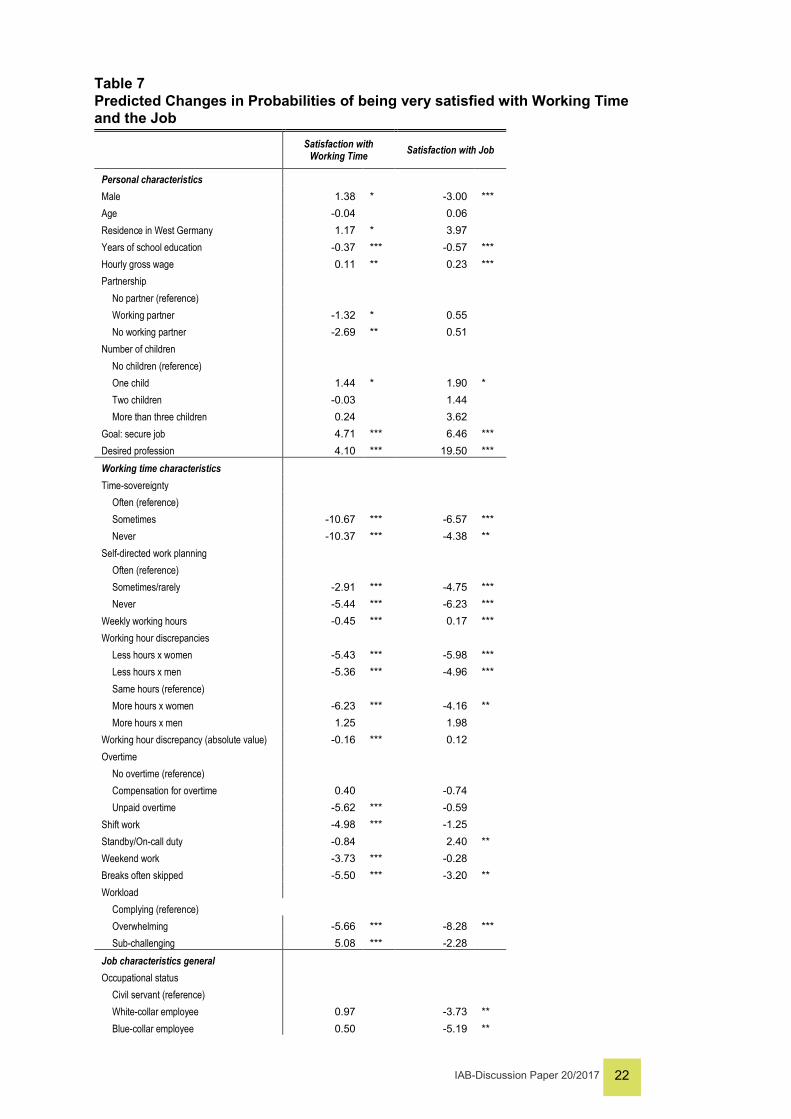
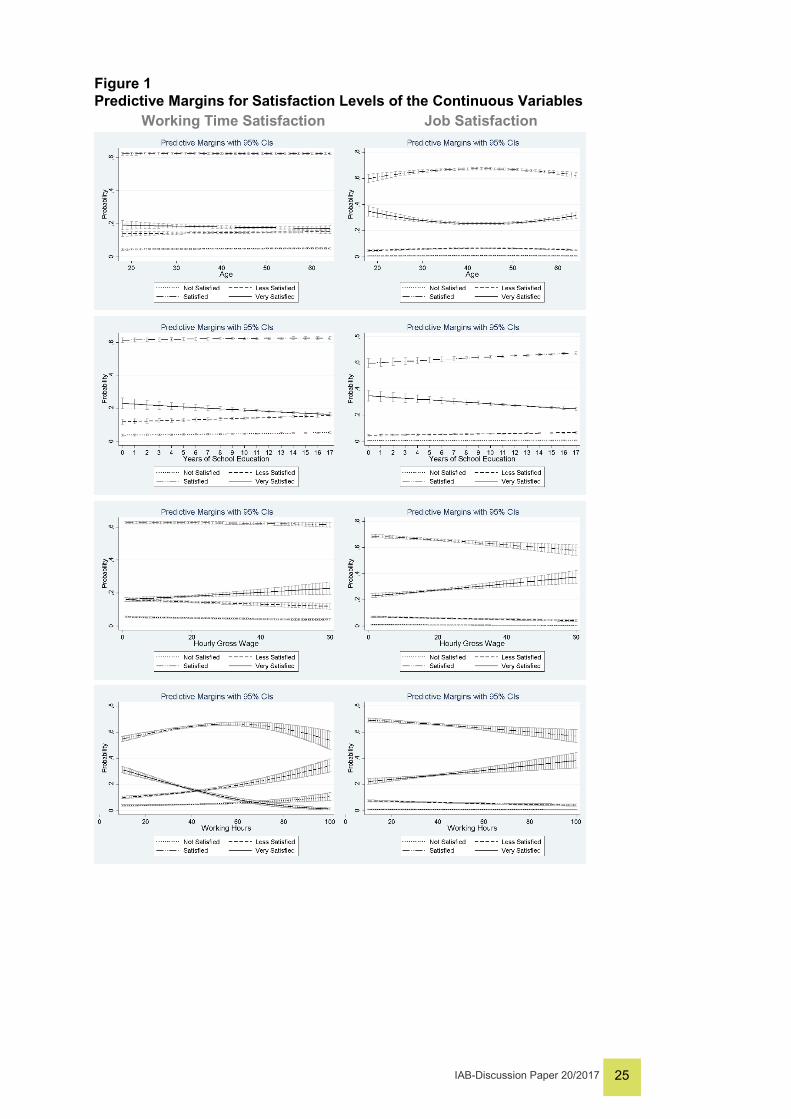
5.3 Average Marginal Effects Ordinal logit models can be difficult to interpret, and average marginal effects can make the results more plausible. To understand the substantive and practical signifi-cance of the different variables on working time and job satisfaction and how this impact changes across satisfaction levels, I present the predicted changes in proba-bilities to be very satisfied with working time and the job in general in Table 7. The average marginal effects of all satisfaction levels of the two oglm models can be found in Appendix Table C1. The average marginal effects also illustrate the results of the variance equations and the variation in the satisfaction levels.
IAB-Discussion Paper 20/2017 22
Table 7 Predicted Changes in Probabilities of being very satisfied with Working Time and the Job
Satisfaction with
Working Time Satisfaction with Job
Personal characteristics Male 1.38 * -3.00 *** Age -0.04 0.06 Residence in West Germany 1.17 * 3.97 Years of school education -0.37 *** -0.57 *** Hourly gross wage 0.11 ** 0.23 *** Partnership
No partner (reference) Working partner -1.32 * 0.55 No working partner -2.69 ** 0.51
Number of children No children (reference) One child 1.44 * 1.90 * Two children -0.03 1.44 More than three children 0.24 3.62
Goal: secure job 4.71 *** 6.46 *** Desired profession 4.10 *** 19.50 *** Working time characteristics Time-sovereignty
Often (reference) Sometimes -10.67 *** -6.57 *** Never -10.37 *** -4.38 **
Self-directed work planning Often (reference) Sometimes/rarely -2.91 *** -4.75 *** Never -5.44 *** -6.23 ***
Weekly working hours -0.45 *** 0.17 *** Working hour discrepancies
Less hours x women -5.43 *** -5.98 *** Less hours x men -5.36 *** -4.96 *** Same hours (reference) More hours x women -6.23 *** -4.16 ** More hours x men 1.25 1.98
Working hour discrepancy (absolute value) -0.16 *** 0.12 Overtime
No overtime (reference) Compensation for overtime 0.40 -0.74 Unpaid overtime -5.62 *** -0.59
Shift work -4.98 *** -1.25 Standby/On-call duty -0.84 2.40 ** Weekend work -3.73 *** -0.28 Breaks often skipped -5.50 *** -3.20 ** Workload
Complying (reference) Overwhelming -5.66 *** -8.28 *** Sub-challenging 5.08 *** -2.28
Job characteristics general Occupational status
Civil servant (reference) White-collar employee 0.97 -3.73 ** Blue-collar employee 0.50 -5.19 **
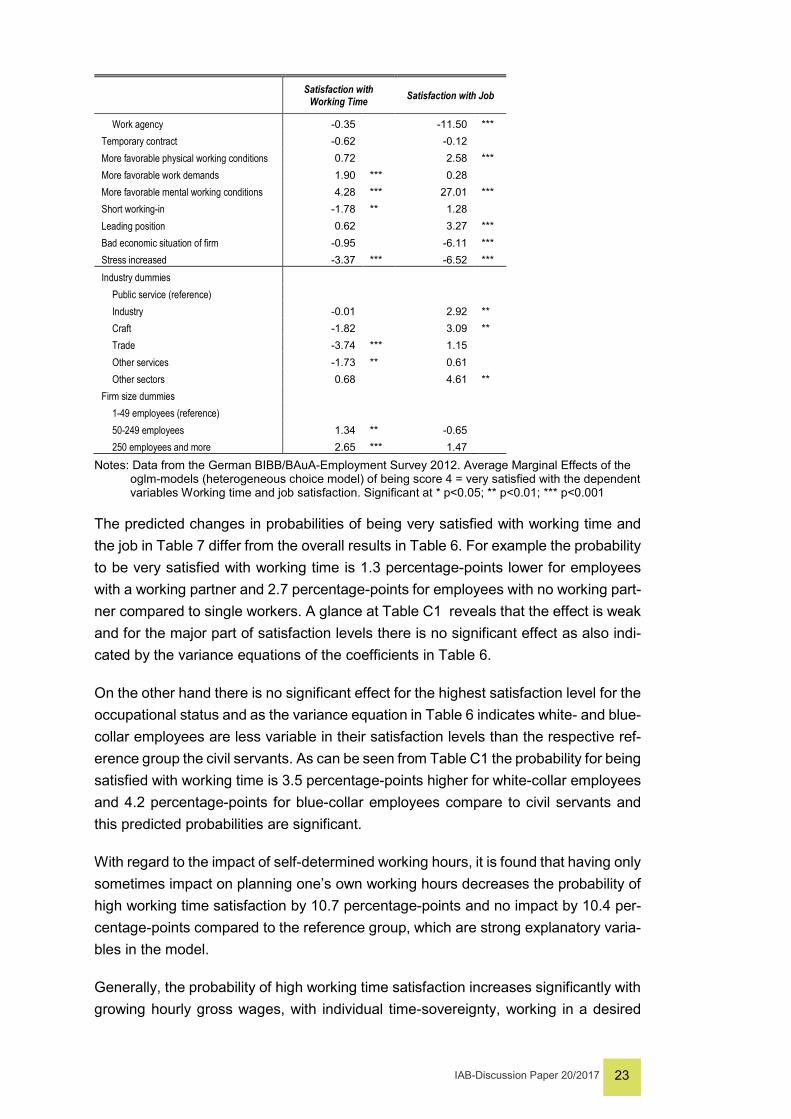
IAB-Discussion Paper 20/2017 23
Satisfaction with
Working Time Satisfaction with Job
Work agency -0.35 -11.50 *** Temporary contract -0.62 -0.12 More favorable physical working conditions 0.72 2.58 *** More favorable work demands 1.90 *** 0.28 More favorable mental working conditions 4.28 *** 27.01 *** Short working-in -1.78 ** 1.28 Leading position 0.62 3.27 *** Bad economic situation of firm -0.95 -6.11 *** Stress increased -3.37 *** -6.52 *** Industry dummies
Public service (reference) Industry -0.01 2.92 ** Craft -1.82 3.09 ** Trade -3.74 *** 1.15 Other services -1.73 ** 0.61 Other sectors 0.68 4.61 **
Firm size dummies 1-49 employees (reference) 50-249 employees 1.34 ** -0.65 250 employees and more 2.65 *** 1.47
Notes: Data from the German BIBB/BAuA-Employment Survey 2012. Average Marginal Effects of the oglm-models (heterogeneous choice model) of being score 4 = very satisfied with the dependent variables Working time and job satisfaction. Significant at * p<0.05; ** p<0.01; *** p<0.001
The predicted changes in probabilities of being very satisfied with working time and the job in Table 7 differ from the overall results in Table 6. For example the probability to be very satisfied with working time is 1.3 percentage-points lower for employees with a working partner and 2.7 percentage-points for employees with no working part-ner compared to single workers. A glance at Table C1 reveals that the effect is weak and for the major part of satisfaction levels there is no significant effect as also indi-cated by the variance equations of the coefficients in Table 6.
On the other hand there is no significant effect for the highest satisfaction level for the occupational status and as the variance equation in Table 6 indicates white- and blue-collar employees are less variable in their satisfaction levels than the respective ref-erence group the civil servants. As can be seen from Table C1 the probability for being satisfied with working time is 3.5 percentage-points higher for white-collar employees and 4.2 percentage-points for blue-collar employees compare to civil servants and this predicted probabilities are significant.
With regard to the impact of self-determined working hours, it is found that having only sometimes impact on planning one’s own working hours decreases the probability of high working time satisfaction by 10.7 percentage-points and no impact by 10.4 per-centage-points compared to the reference group, which are strong explanatory varia-bles in the model.
Generally, the probability of high working time satisfaction increases significantly with growing hourly gross wages, with individual time-sovereignty, working in a desired
IAB-Discussion Paper 20/2017 24
profession, and with more favorable mental working conditions; conversely, the prob-ability decreases if the employee faces working hour discrepancies, works unsocial working hours like shifts or on weekends, and under high work-intensity and stress.
The second column presents the estimates of the predictive margins of job satisfac-tion. The probability for very high job satisfaction decreases significantly with little or no impact on self-determined working hours and self-directed work planning, and in-creases with working in a desired profession (+ 19.5 percentage-points), and more favorable mental working conditions (+ 27.0 percentage-points). Surprisingly, the length of working hours show a positive significant effect on the job satisfaction level.
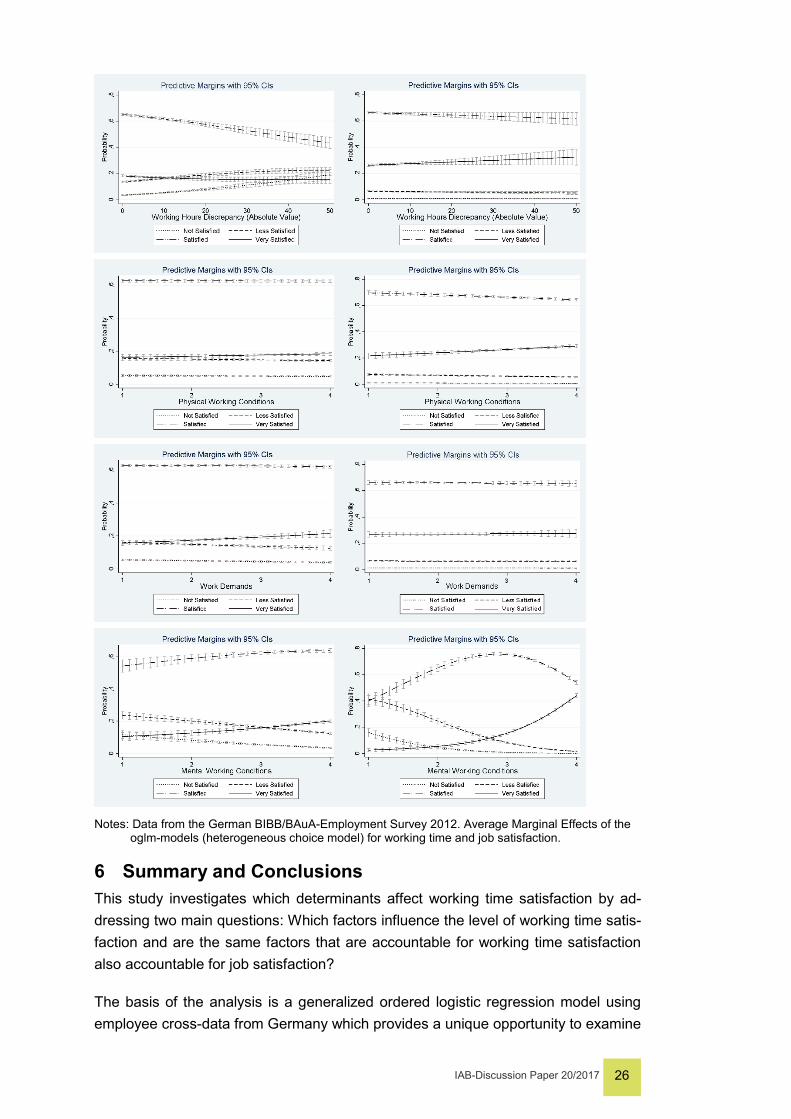
To better illustrate the average marginal effects for the continuous variables the pre-dictive margins for working time and job satisfaction are plotted in Figure 1. They measure the instantaneous rate of change (Long/Freese 2006), if for example the instantaneous rate of change is similar to the change in P(Y=1) as 𝑋𝑋𝑘𝑘 increases by one, this can be intuitive. Figure 1 shows the predicted margins of the continuous variables age, years of school education, hourly gross wage, weekly working hours, working hour discrepancy, working conditions and work demands for working time satisfaction on the left and for job satisfaction on the right side.
The predictive margins of age on the probability to be very satisfied with the job con-firm the U-shape: younger and older employees have higher satisfaction levels. As Figure 1 shows every year of school education decreases the probability to be very satisfied with working time and the job, while every Euro hourly gross wage more increases the probability to be very satisfied.
The Figure illustrates also the different directions of working hours on working time and job satisfaction: while the probability to be very satisfied with working time de-creases with every hour more the probability to be very satisfied with the job in-creases. The probability of high working time satisfaction increases significantly with more favorable work demands and mental working conditions whereas the probability of high overall job satisfaction increases significantly with more favorable physical and mental working conditions.
IAB-Discussion Paper 20/2017 25
Figure 1 Predictive Margins for Satisfaction Levels of the Continuous Variables Working Time Satisfaction Job Satisfaction
IAB-Discussion Paper 20/2017 26
Notes: Data from the German BIBB/BAuA-Employment Survey 2012. Average Marginal Effects of the
oglm-models (heterogeneous choice model) for working time and job satisfaction.
6 Summary and Conclusions This study investigates which determinants affect working time satisfaction by ad-dressing two main questions: Which factors influence the level of working time satis-faction and are the same factors that are accountable for working time satisfaction also accountable for job satisfaction?
The basis of the analysis is a generalized ordered logistic regression model using employee cross-data from Germany which provides a unique opportunity to examine
IAB-Discussion Paper 20/2017 27
working time satisfaction in a broader context. The main contribution of this study is shedding light on employees’ whishes regarding working time arrangements and working conditions. In general, the results indicate that individual time-sovereignty and autonomy over work planning are very important for the level of working time satisfaction. It is beneficial for satisfaction if employees are able to determine and organize their working hours and their work autonomously. Additionally, employees prefer reduced and paid working hours during the day. Worker-friendly working time arrangements with less stress, insecurity and mental pressure increase the level of satisfaction, whereas atypical working time arrangements such as unpaid overtime, working shifts and weekends and under high intensity reduce the level of working time satisfaction. But the results also show that job satisfaction seems to be largely inde-pendent of the location of working hours. Important working time variables for a high level of job satisfaction are also time-sovereignty, self-directed work planning and a good work atmosphere. Overemployment and a high work-intensity reduce the level of job satisfaction.
Finally, I also acknowledge that my interpretations must be considerate to the fact that the analysis is based on cross-sectional data. For an identification of causality and unobservable individual effects, I would require longitudinal data, which do not exist currently with respect to the working time satisfaction questionnaire for Germany or other countries. Thus, reversed causality cannot be excluded, for example in the as-sociation between working time satisfaction and the employee’s state of health. Therefore I didn’t include the reported subjective general state of health but rather the working conditions and work demands of the job as an index for work strains of the employee. Also unobserved heterogeneity could play a role. For instance, one may argue that more able persons both acquire more sovereignty in the job and are more satisfied. However, using concrete working time instead of general satisfaction, this argument seems less plausible. Indeed, the variable “having a leading position” as one indicator for an interesting activity for more able persons shows no significant impact on working time satisfaction.
Since the underlying study is the first on working time satisfaction, observed associa-tions have to be verified in continued further analysis and the results of this study should therefore be viewed as prima facie evidence. Future research may explore satisfaction with working time from a longitudinal perspective, if such panel data can be obtained, to sharpen the identification of causal effects.
Dissatisfaction with working time creates challenges for work-life balance, family and leisure time. While it is of course not always possible to avoid unfavorable working time regulations, a number of policy options or initiatives on the firm level may be considered for working time policies. The first step is to try to improve the quality of working time arrangements, especially the possibility for employees to have an impact on their working times and to increase their individual time-sovereignty. This includes the consideration of private matters and the non-exclusive priority of work-related in-terests. The second step is to reduce job strain and work-related stress, which have
IAB-Discussion Paper 20/2017 28
unhealthy consequences, to promote firm-level investments in job quality and internal health measures and to give greater attention to the health consequences of job stress.
The different interests and needs of employers and employees must be negotiated to ensure the necessary flexibility of firms and to protect employees against excessive workloads. A workplace that enables work-life-balance and reduces psychological stress increases the working time satisfaction and job satisfaction of employees, and this may also have positive effects on the firms’ performance in terms of lower absen-teeism, less staff turnover and the firm’s productivity.
References Absenger, Nadine; Ahlers, Elke; Bispinck, Reinhard; Kleinknecht, Alfred; Klenner, Christina; Lott, Yvonne; Pusch, Toralf; Seifert, Hartmut (2014): Arbeitszeiten in Deutschland. Entwicklungstendenzen und Herausforderungen für eine moderne Ar-beitszeitpolitik. WSI the Institute of Economic and Social Research at the Hans Böckler Foundation (ed.) Düsseldorf (WSI-Report).
Alda, Holger; Rohrbach-Schmidt, Daniela (2011): Imputation fehlender Werte für die Einkommensvariable in der BIBB/BAuA-Erwerbstätigenbefragung 2006. BIBB FDZ Daten- und Methodenbericht Nr. 2.
Anttila, Timo; Oinas, Tomi; Tammelin, Mia;Nätti, Jouko (2015): Working-Time Re-gimes and Work-Life Balance in Europe. In: European Sociological Review, 31(6), p. 713–724.
Bijwaard, Govert; van Dijk, Bram; de Koning, Jaap (2008): Working time prefer-ences, labour market transitions and job satisfaction. In: Muffels, Ruud J. A. (ed.): Flexibility and employment security in Europe. In: Labour markets in transition. Chel-tenham: Elgar, p. 255–277.
Booth, Alison L.; Van Ours, Jan C. (2013): Part-time jobs: what women want? In: Journal of Population Economics, 26(1), p. 263–283.
Booth, Alison L.; Van Ours, Jan C. (2009): Hours of Work and Gender Identity: Does Part‐Time Work Make the Family Happier? In: Economica, 76(301), p. 176–196.
Booth, Alison L.; Van Ours, Jan C. (2008): Job satisfaction and family happiness: the part‐time work puzzle. In: The Economic Journal, 118(526), p. F77–F99.
Campbell, Iain; Van Wanrooy, Brigid (2013): Long working hours and working-time preferences: Between desirability and feasibility. In: Human relations, 66(8), p. 1131–1155.
Clark, Andrew E.; Oswald, Andrew J. (1996): Satisfaction and comparison income. In: Journal of public economics 61(3), p. 359–381.
Ehing, Daniel (2014): Unter- und Überbeschäftigung in Deutschland: Eine Analyse der Arbeitszeitwünsche von Erwerbstätigen vor dem Hintergrund des demografi-schen Wandels. In: Zeitschrift für Sozialreform, 60(3), p. 247–272.
Eichhorst; Werner (2015): The Unexpected Appearance of a New German Model. In: British Journal of Industrial Relations, 53(1), p. 49–69.
IAB-Discussion Paper 20/2017 29
Faragher, E. Brian; Cass, Monica; Cooper; Cary L. (2005): The relationship between job satisfaction and health: a meta-analysis. In: Occupational and Environmental Medicine, 62(2), p. 105–112.
Fischer, Justina A. V.; Sousa‐Poza, Alfonso (2009): Does job satisfaction improve the health of workers? New evidence using panel data and objective measures of health. In: Health economics, 18(1), p. 71–89.
Fullerton, Andrew S.; Xu, Jun (2012): The proportional odds with partial proportion-ality constraints model for ordinal response variables. In: Social science research, 41(1), p. 182–198.
Golden, Lonnie (2015): FLSA Working Hours Reform: Worker Well-Being Effects in an Economic Framework. In: Industrial Relations: A Journal of Economy and Soci-ety, 54(4), p. 717–749.
Golden, Lonnie; Okulicz-Kozaryn, Adam (2015): Work Hours and Worker Happiness in the US: Weekly Hours, Hours Preferences and Schedule Flexibility. Working pa-per https://papers.ssrn.com/sol3/papers.cfm?abstract_id=2563374 [last downloaded 2017-02-16].
Greubel, Jana; Arlinghaus, Anna; Nachreiner, Friedhelm; Lombardi, David A. (2016): Higher risks when working unusual times? A cross-validation of the effects on safety, health, and work–life balance. In: International archives of occupational and environmental health, 89(8), p. 1205–1214.
Grözinger, Gerd; Matiaske, Wenzel; Tobsch, Verena (2008): Arbeitszeitwünsche, Arbeitslosigkeit und Arbeitszeitpolitik. SOEPpapers No. 103. DIW Berlin.
Haile, Getinet A. (2015): Workplace Job Satisfaction in Britain: Evidence from Linked Employer–Employee Data. In: Labour, 29(3), p. 225–242.
Hall, Anja; Siefer, Anke; Tiemann, Michael (2015): BIBB/BAuA Employment Survey of the Working Population on Qualification and Working Conditions in Germany 2012. suf_4.0; Research Data Center at BIBB (ed.); GESIS Cologne (data access); Bonn: Federal Institute for Vocational Education and Training.
Hanglberger, Dominik (2010): Arbeitszufriedenheit und flexible Arbeitszeiten. Empir-ische Analyse mit Daten des Sozio-oekonomischen Panels (Job Satisfaction and Flexible Working Hours-An Empirical Analysis with Data from the German Socio Economic Panel. SOEPpaper No. 304. DIW Berlin.
Hauret, Laetitiy; Williams, Donald R. (2017): Cross-National Analysis of Gender Dif-ferences in Job Satisfaction. In: Industrial Relations: A Journal of Economy and So-ciety, 56(2), p. 203–235.
Holly, Sarah; Mohnen, Alwine (2012): Impact of working hours on work-life balance. SOEPpapers No. 465. DIW Berlin.
Holst, Elke; Bringmann, Julia (2016): Arbeitszeitrealitäten und Arbeitszeitwünsche in Deutschland: Methodische Unterschiede ihrer Erfassung im SOEP und Mikrozensus (Desired and Actual Working Hours in Germany: Methodological Differences in Mea-surement between SOEP and Mikrozensus). Discussion Paper No. 1597. DIW Ber-lin.
Jahn, Elke (2013): Don’t worry, be flexible. Job satisfaction among flexible workers. LASER Discussion Papers-Paper, No. 71.
Jensen, Per H.;Møberg, Rasmus Juul; Och, Ralf; Pfau-Effinger, Birgit (2017): Ex-plaining differences in women’s working time in European cities. In: European Soci-eties, 19(2), p. 138–156.
IAB-Discussion Paper 20/2017 30
Knaus, Michael C.; Otterbach, Steffen (2016): Work Hour Mismatch and Job Mobil-ity: Adjustment Chanells and Resolution Rates. IZA Discussion Paper, No. 9735.
Knieps, Franz; Pfaff, Holger (Hg.) (2016): BKK Gesundheitsreport 2016. MWV Medi-zinisch Wissenschaftliche Verlagsgesellschaft, Berlin.
Kugler, Franziska; Wiencierz, Andrea; Wunder, Christoph (2014): Working hours mismatch and well-being: comparative evidence from Australian and German panel data. Labor and Socio-Economic Research Center, University of Erlangen-Nurem-berg.
Landivar, Liana Christin (2015): The gender gap in employment hours: do work-hour regulations matter? In: Work, Employment & Society 29(4), p. 550–570.
Lesch, Hagen; Schäfer, Holger; Schmidt, Jörg (2013): Gute Arbeit oder zufrieden mit der Arbeit? Konzeptionelle Überlegungen und empirische Befunde für Deutsch-land. In: Sozialer Fortschritt 62(5), p. 139–148.
Linz, Susan J.; Semykina; Anastasia (2012): What makes workers happy? Antici-pated rewards and job satisfaction. In: Industrial Relations: A Journal of Economy and Society 51(4), p. 811–844.
Long, J. Scott; Freese, Jeremy (2006): Regression models for categorical depend-ent variables using Stata. Stata press.
Merz, Joachim (2002): Time and economic well-being – a panel analysis of desired versus actual working hours. In: Review of Income and Wealth, 48(3), p. 317–346.
Oswald, Andrew J.; Proto, Eugenio; Sgroi, Daniel (2015): Happiness and productiv-ity. In: Journal of Labor Economics, 33(4), p. 789–822.
Perales, Francisco; Tomaszewski, Wojtek (2016): Happier with the same: job satis-faction of disadvantaged workers. In: British Journal of Industrial Relations, 54(4), p. 685–708.
Plantenga, Janneke; Remery, Chantal; Mairhuber, Ingrid; Meulders, Danièle; Beleva, Iskra; Ellina, Chrystalla; Křížková, Alena; Emerek, Ruth (2010): Flexible working time arrangements and gender equality. European Commission.
Pollmann-Schult, Matthias (2009): Arbeitszeitwunsch und –wirklichkeit im Familien-kontext. In: Soziale Welt, 60(2), p. 163–178.
Reynolds, Jeremy E. (2014): Prevailing preferences: actual work hours and work-hour preferences of partners. In: Industrial and Labour Relations Review, 67(3), p. 1017–1041.
Reynolds, Jeremy; Aletraris, Lydia (2010): Mostly Mismatched With a Chance of Settling: Tracking Work Hour Mismatches in the United States. In: Work and Occu-pations, 37(4), p. 476–511.
Reynolds, Jeremy; Johnson, David R. (2012): Don’t blame the Babies: Work Hour Mismatches and the Role of Children. In: Social Forces, 91(1), p. 131–155.
Rohrbach-Schmidt, Daniela; Hall, Anja (2013): BIBB/BAuA Employment Survey 2012. Federal Institute for Vocational Education and Training, Bonn, BIBB-FDZ Data and Methodological Reports 1.
Rønsen, Marit; Kitterød, Ragni Hege (2010): What makes full-time employed women satisfied with their working hours. Statistics Norway, Research Department, Discus-sion Papers No. 632.
IAB-Discussion Paper 20/2017 31
Seifert, Hartmut; Holst, Elke; Matiaske, Wenzel; Tobsch, Verena (2016): Arbeitszeit-wünsche und ihre kurzfristige Realisierung, WSI-Mitteilungen, No. 04, 300–308.
Van der Meer, Peter H.; Wielers, Rudi J. J. (2013): What makes workers happy? In: Applied Economics, 45(3), p. 357–368.
Wanger, Susanne (2015): Frauen und Männer am Arbeitsmarkt: Traditionelle Er-werbs- und Arbeitszeitmuster sind nach wie vor verbreitet. IAB-Kurzbericht, No. 04.
Wanger, Susanne (2011): Ungenutzte Potenziale in der Teilzeit: Viele Frauen wür-den gerne länger arbeiten. IAB-Kurzbericht, No. 09.
Wanger, Susanne; Weber, Enzo (2016): Erwerbspotenziale von Arbeitslosen und Erwerbstätigen: Das Stundenvolumen bringt zusätzliche Information. IAB-Kurzbericht, No. 08.
Wielers, Rudi; Münderlein, Maria; Koster, Ferry (2014): Part-Time Work and Work Hour Preferences. An International Comparison. In: European Sociological Review, 30 (1), p. 76–89.
Williams, Richard (2010): Fitting heterogeneous choice models with oglm. In: Stata Journal, 10(4), p. 540–567.
Williams, Richard (2009): Using heterogeneous choice models to compare logit and probit coefficients across groups. In: Sociological Methods & Research, 37(4), p. 531–559.
Williams, Richard (2006): Generalized ordered logit/partial proportional odds models for ordinal dependent variables. In: Stata Journal, 6(1), p. 58–82.
Wolter, Stefanie; Broszeit, Sandra; Frodermann, Corinna; Grunau, Philipp; Bell-mann, Lutz (2016): Befragung von Betrieben und Beschäftigten: Mehr Zufriedenheit und Engagement in Betrieben mit guter Personalpolitik. IAB-Kurzbericht, No. 16.
Wooden, Mark (2006): Who wants flexibility? Changing Work Hours Preferences and Life Events. IZA Discussion Paper No. 2404.
Wooden, Mark; Warren, Diana; Drago, Robert (2009): Working time Mismatch and Subjective Well-being. In: British Journal of Industrial Relations, 47(1), p. 147–179.
Wunder, Christoph; Heineck, Guido (2013): Working time preferences, hours mis-match and well-being of couples: Are there spillovers? In: Labour Economics, 24, p. 244–252.
Xing, Liu (2009): Ordinal regression analysis: Fitting the proportional odds model us-ing Stata, SAS and SPSS. In: Journal of Modern Applied Statistical Methods, 8(2), p. 632–645.
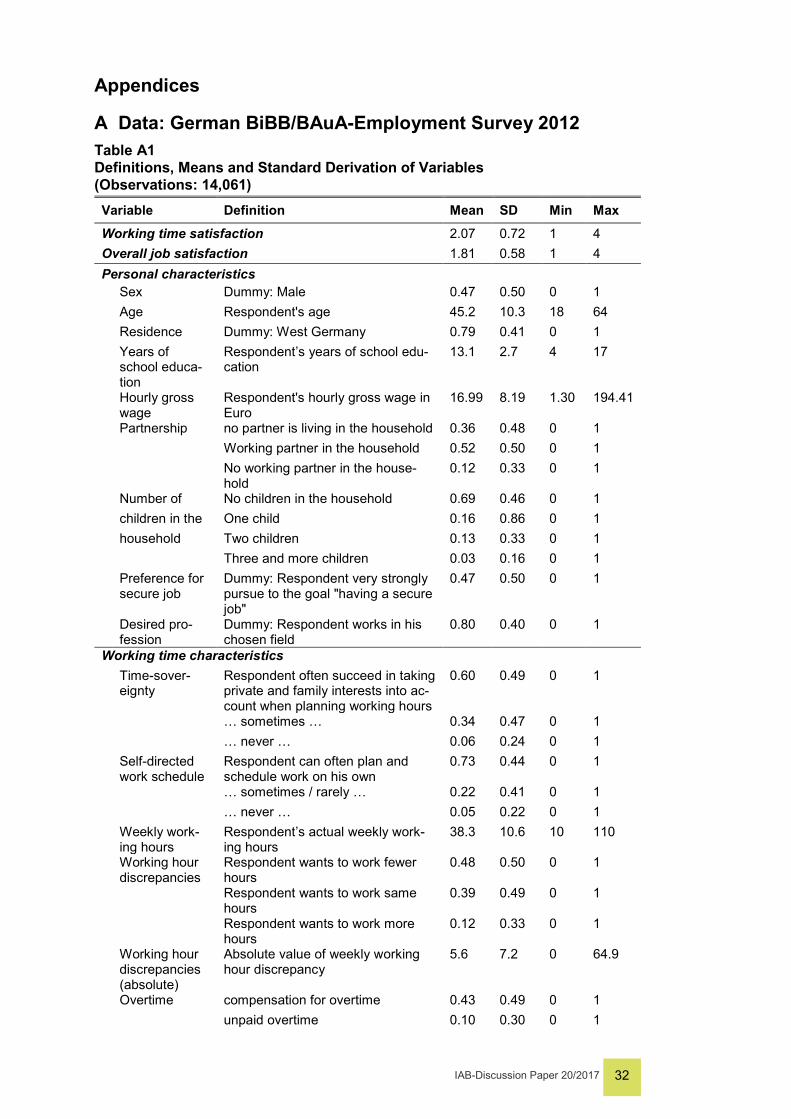
IAB-Discussion Paper 20/2017 32
Appendices
A Data: German BiBB/BAuA-Employment Survey 2012 Table A1 Definitions, Means and Standard Derivation of Variables (Observations: 14,061) Variable Definition Mean SD Min Max
Working time satisfaction 2.07 0.72 1 4 Overall job satisfaction 1.81 0.58 1 4 Personal characteristics Sex Dummy: Male 0.47 0.50 0 1
Age Respondent's age 45.2 10.3 18 64
Residence Dummy: West Germany 0.79 0.41 0 1
Years of school educa-tion
Respondent’s years of school edu-cation
13.1 2.7 4 17
Hourly gross wage
Respondent's hourly gross wage in Euro
16.99 8.19 1.30 194.41
Partnership no partner is living in the household 0.36 0.48 0 1
Working partner in the household 0.52 0.50 0 1
No working partner in the house-hold
0.12 0.33 0 1
Number of No children in the household 0.69 0.46 0 1
children in the One child 0.16 0.86 0 1
household Two children 0.13 0.33 0 1
Three and more children 0.03 0.16 0 1
Preference for secure job
Dummy: Respondent very strongly pursue to the goal "having a secure job"
0.47 0.50 0 1
Desired pro-fession
Dummy: Respondent works in his chosen field
0.80 0.40 0 1
Working time characteristics
Time-sover-eignty
Respondent often succeed in taking private and family interests into ac-count when planning working hours
0.60 0.49 0 1
… sometimes … 0.34 0.47 0 1
… never … 0.06 0.24 0 1
Self-directed work schedule
Respondent can often plan and schedule work on his own
0.73 0.44 0 1
… sometimes / rarely … 0.22 0.41 0 1
… never … 0.05 0.22 0 1
Weekly work-ing hours
Respondent’s actual weekly work-ing hours
38.3 10.6 10 110
Working hour discrepancies
Respondent wants to work fewer hours
0.48 0.50 0 1
Respondent wants to work same hours
0.39 0.49 0 1
Respondent wants to work more hours
0.12 0.33 0 1
Working hour discrepancies (absolute)
Absolute value of weekly working hour discrepancy
5.6 7.2 0 64.9
Overtime compensation for overtime 0.43 0.49 0 1
unpaid overtime 0.10 0.30 0 1
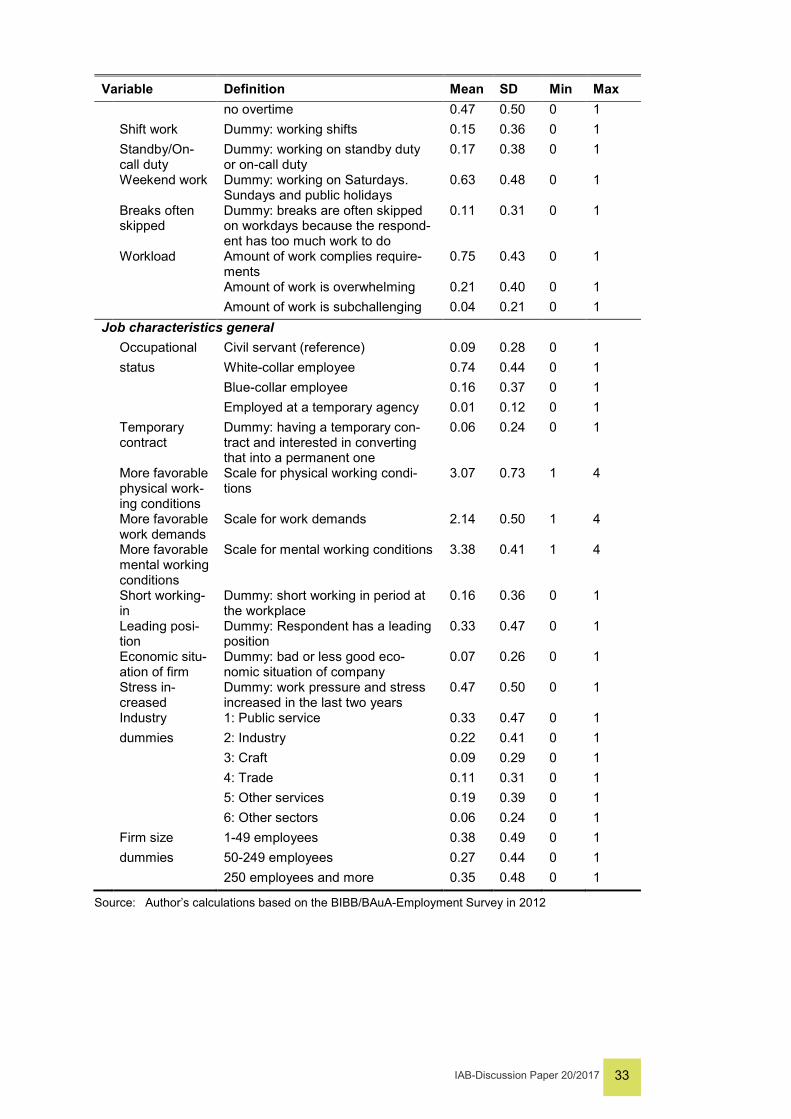
IAB-Discussion Paper 20/2017 33
Variable Definition Mean SD Min Max
no overtime 0.47 0.50 0 1
Shift work Dummy: working shifts 0.15 0.36 0 1
Standby/On-call duty
Dummy: working on standby duty or on-call duty
0.17 0.38 0 1
Weekend work Dummy: working on Saturdays. Sundays and public holidays
0.63 0.48 0 1
Breaks often skipped
Dummy: breaks are often skipped on workdays because the respond-ent has too much work to do
0.11 0.31 0 1
Workload Amount of work complies require-ments
0.75 0.43 0 1
Amount of work is overwhelming 0.21 0.40 0 1
Amount of work is subchallenging 0.04 0.21 0 1 Job characteristics general
Occupational Civil servant (reference) 0.09 0.28 0 1
status White-collar employee 0.74 0.44 0 1
Blue-collar employee 0.16 0.37 0 1
Employed at a temporary agency 0.01 0.12 0 1
Temporary contract
Dummy: having a temporary con-tract and interested in converting that into a permanent one
0.06 0.24 0 1
More favorable physical work-ing conditions
Scale for physical working condi-tions
3.07 0.73 1 4
More favorable work demands
Scale for work demands 2.14 0.50 1 4
More favorable mental working conditions
Scale for mental working conditions 3.38 0.41 1 4
Short working-in
Dummy: short working in period at the workplace
0.16 0.36 0 1
Leading posi-tion
Dummy: Respondent has a leading position
0.33 0.47 0 1
Economic situ-ation of firm
Dummy: bad or less good eco-nomic situation of company
0.07 0.26 0 1
Stress in-creased
Dummy: work pressure and stress increased in the last two years
0.47 0.50 0 1
Industry 1: Public service 0.33 0.47 0 1
dummies 2: Industry 0.22 0.41 0 1
3: Craft 0.09 0.29 0 1
4: Trade 0.11 0.31 0 1
5: Other services 0.19 0.39 0 1
6: Other sectors 0.06 0.24 0 1
Firm size 1-49 employees 0.38 0.49 0 1
dummies 50-249 employees 0.27 0.44 0 1
250 employees and more 0.35 0.48 0 1
Source: Author’s calculations based on the BIBB/BAuA-Employment Survey in 2012
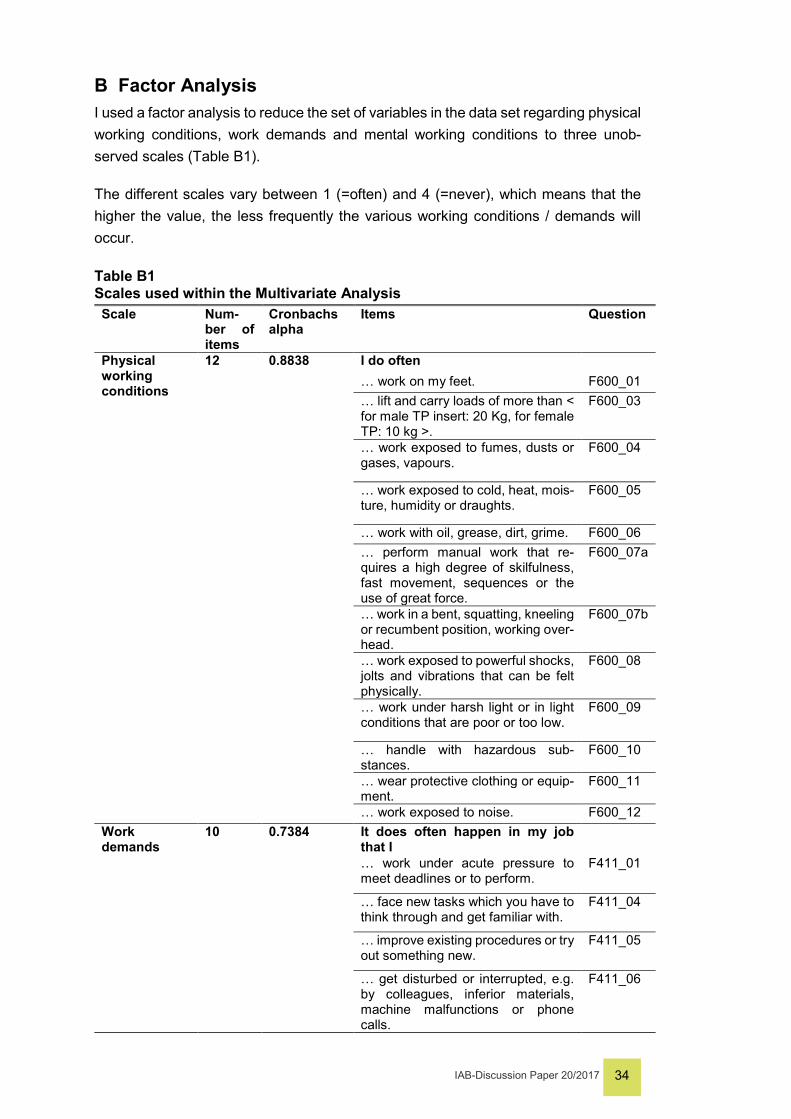
IAB-Discussion Paper 20/2017 34
B Factor Analysis I used a factor analysis to reduce the set of variables in the data set regarding physical working conditions, work demands and mental working conditions to three unob-served scales (Table B1).
The different scales vary between 1 (=often) and 4 (=never), which means that the higher the value, the less frequently the various working conditions / demands will occur.
Table B1 Scales used within the Multivariate Analysis Scale Num-
ber of items
Cronbachs alpha
Items Question
Physical working conditions
12 0.8838 I do often … work on my feet. F600_01 … lift and carry loads of more than < for male TP insert: 20 Kg, for female TP: 10 kg >.
F600_03
… work exposed to fumes, dusts or gases, vapours.
F600_04
… work exposed to cold, heat, mois-ture, humidity or draughts.
F600_05
… work with oil, grease, dirt, grime. F600_06 … perform manual work that re-quires a high degree of skilfulness, fast movement, sequences or the use of great force.
F600_07a
… work in a bent, squatting, kneeling or recumbent position, working over-head.
F600_07b
… work exposed to powerful shocks, jolts and vibrations that can be felt physically.
F600_08
… work under harsh light or in light conditions that are poor or too low.
F600_09
… handle with hazardous sub-stances.
F600_10
… wear protective clothing or equip-ment.
F600_11
… work exposed to noise. F600_12 Work demands
10 0.7384 It does often happen in my job that I
… work under acute pressure to meet deadlines or to perform.
F411_01
… face new tasks which you have to think through and get familiar with.
F411_04
… improve existing procedures or try out something new.
F411_05
… get disturbed or interrupted, e.g. by colleagues, inferior materials, machine malfunctions or phone calls.
F411_06
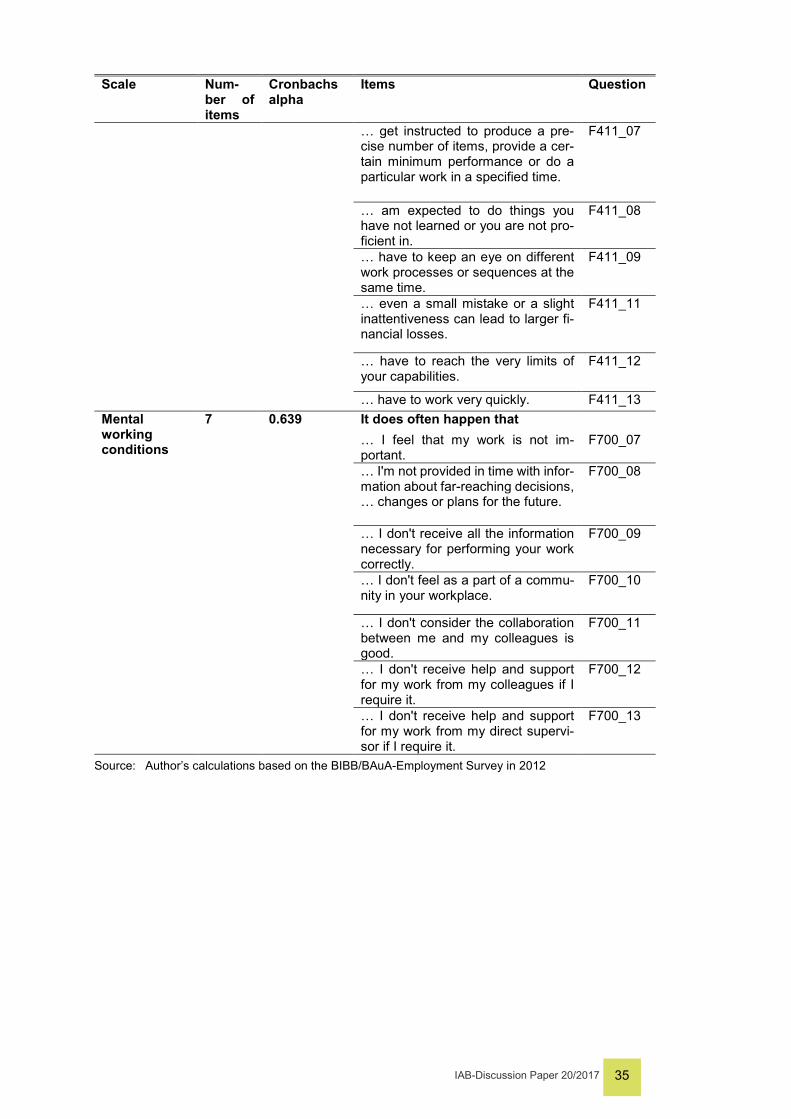
IAB-Discussion Paper 20/2017 35
Scale Num-ber of items
Cronbachs alpha
Items Question
… get instructed to produce a pre-cise number of items, provide a cer-tain minimum performance or do a particular work in a specified time.
F411_07
… am expected to do things you have not learned or you are not pro-ficient in.
F411_08
… have to keep an eye on different work processes or sequences at the same time.
F411_09
… even a small mistake or a slight inattentiveness can lead to larger fi-nancial losses.
F411_11
… have to reach the very limits of your capabilities.
F411_12
… have to work very quickly. F411_13 Mental working conditions
7 0.639 It does often happen that … I feel that my work is not im-portant.
F700_07
… I'm not provided in time with infor-mation about far-reaching decisions, … changes or plans for the future.
F700_08
… I don't receive all the information necessary for performing your work correctly.
F700_09
… I don't feel as a part of a commu-nity in your workplace.
F700_10
… I don't consider the collaboration between me and my colleagues is good.
F700_11
… I don't receive help and support for my work from my colleagues if I require it.
F700_12
… I don't receive help and support for my work from my direct supervi-sor if I require it.
F700_13
Source: Author’s calculations based on the BIBB/BAuA-Employment Survey in 2012
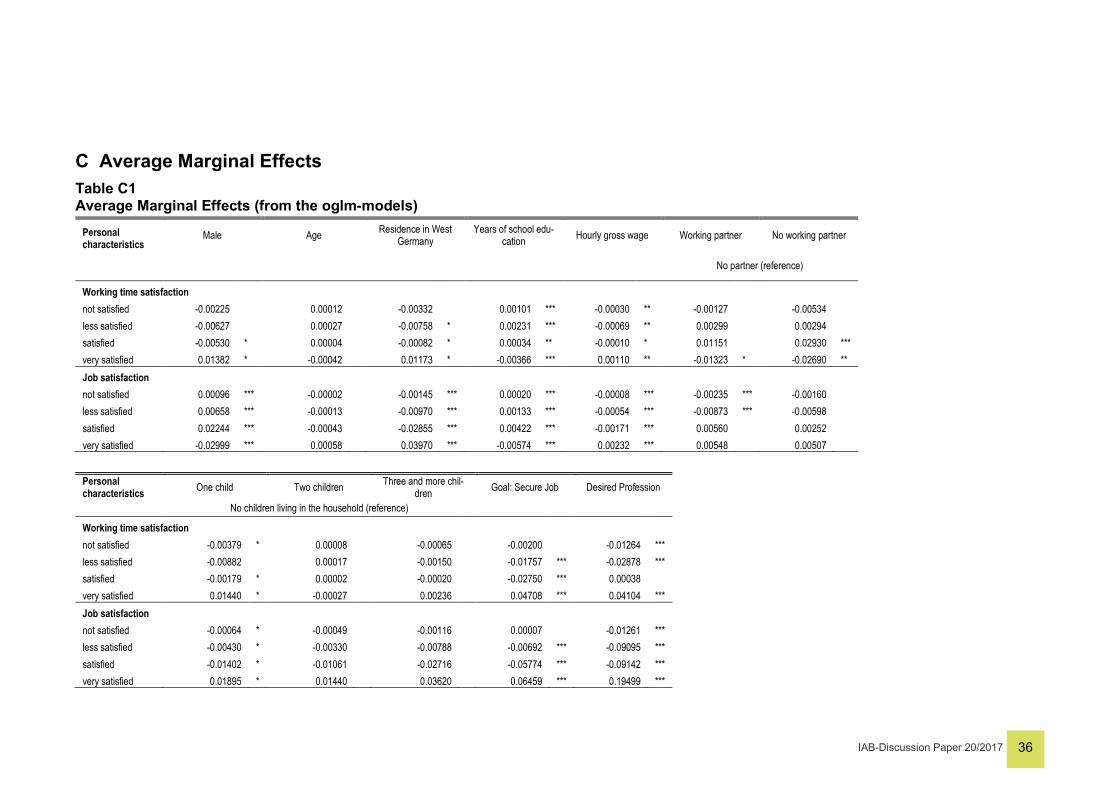
IAB-Discussion Paper 20/2017 36
C Average Marginal Effects Table C1 Average Marginal Effects (from the oglm-models)
Personal characteristics
Male Age Residence in West Germany
Years of school edu-cation Hourly gross wage Working partner No working partner
No partner (reference)
Working time satisfaction not satisfied -0.00225 0.00012 -0.00332 0.00101 *** -0.00030 ** -0.00127 -0.00534 less satisfied -0.00627 0.00027 -0.00758 * 0.00231 *** -0.00069 ** 0.00299 0.00294 satisfied -0.00530 * 0.00004 -0.00082 * 0.00034 ** -0.00010 * 0.01151 0.02930 *** very satisfied 0.01382 * -0.00042 0.01173 * -0.00366 *** 0.00110 ** -0.01323 * -0.02690 ** Job satisfaction not satisfied 0.00096 *** -0.00002 -0.00145 *** 0.00020 *** -0.00008 *** -0.00235 *** -0.00160 less satisfied 0.00658 *** -0.00013 -0.00970 *** 0.00133 *** -0.00054 *** -0.00873 *** -0.00598 satisfied 0.02244 *** -0.00043 -0.02855 *** 0.00422 *** -0.00171 *** 0.00560 0.00252 very satisfied -0.02999 *** 0.00058 0.03970 *** -0.00574 *** 0.00232 *** 0.00548 0.00507
Personal characteristics One child Two children Three and more chil-
dren Goal: Secure Job Desired Profession
No children living in the household (reference)
Working time satisfaction not satisfied -0.00379 * 0.00008 -0.00065 -0.00200 -0.01264 *** less satisfied -0.00882 0.00017 -0.00150 -0.01757 *** -0.02878 *** satisfied -0.00179 * 0.00002 -0.00020 -0.02750 *** 0.00038 very satisfied 0.01440 * -0.00027 0.00236 0.04708 *** 0.04104 *** Job satisfaction not satisfied -0.00064 * -0.00049 -0.00116 0.00007 -0.01261 *** less satisfied -0.00430 * -0.00330 -0.00788 -0.00692 *** -0.09095 *** satisfied -0.01402 * -0.01061 -0.02716 -0.05774 *** -0.09142 *** very satisfied 0.01895 * 0.01440 0.03620 0.06459 *** 0.19499 ***
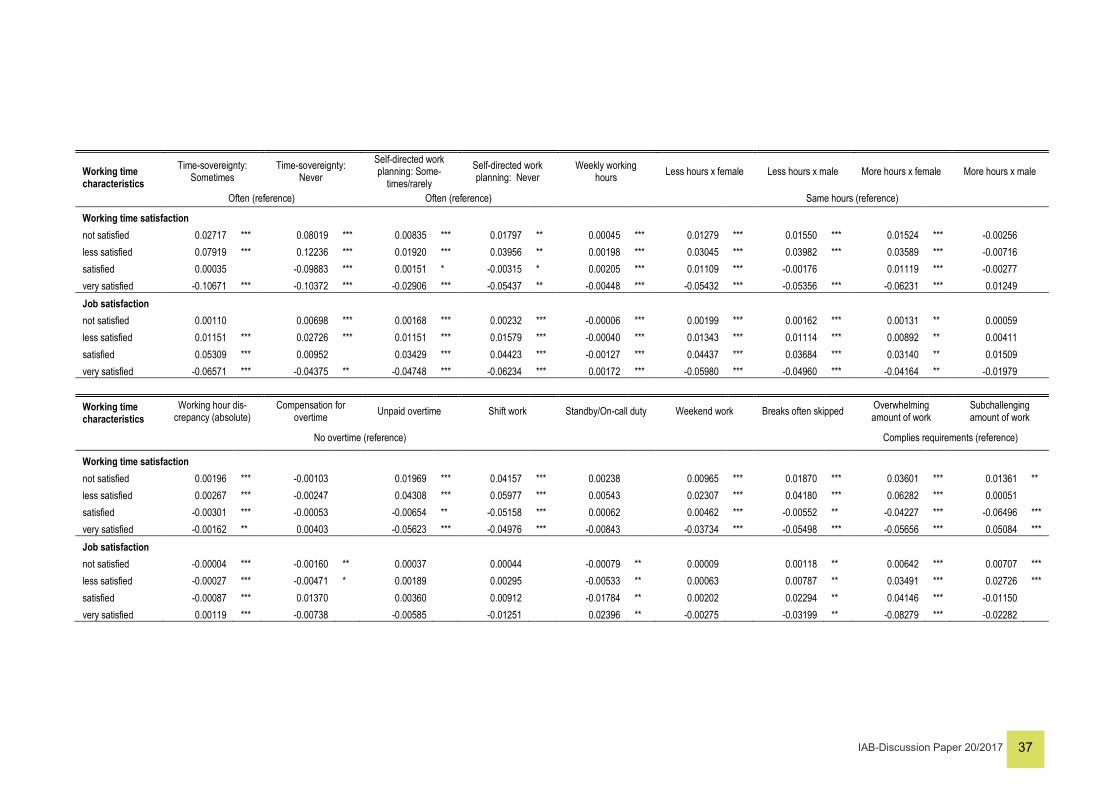
IAB-Discussion Paper 20/2017 37
Working time characteristics
Time-sovereignty: Sometimes
Time-sovereignty: Never
Self-directed work planning: Some-
times/rarely Self-directed work planning: Never
Weekly working hours Less hours x female Less hours x male More hours x female More hours x male
Often (reference) Often (reference) Same hours (reference)
Working time satisfaction not satisfied 0.02717 *** 0.08019 *** 0.00835 *** 0.01797 ** 0.00045 *** 0.01279 *** 0.01550 *** 0.01524 *** -0.00256 less satisfied 0.07919 *** 0.12236 *** 0.01920 *** 0.03956 ** 0.00198 *** 0.03045 *** 0.03982 *** 0.03589 *** -0.00716 satisfied 0.00035 -0.09883 *** 0.00151 * -0.00315 * 0.00205 *** 0.01109 *** -0.00176 0.01119 *** -0.00277 very satisfied -0.10671 *** -0.10372 *** -0.02906 *** -0.05437 ** -0.00448 *** -0.05432 *** -0.05356 *** -0.06231 *** 0.01249 Job satisfaction not satisfied 0.00110 0.00698 *** 0.00168 *** 0.00232 *** -0.00006 *** 0.00199 *** 0.00162 *** 0.00131 ** 0.00059 less satisfied 0.01151 *** 0.02726 *** 0.01151 *** 0.01579 *** -0.00040 *** 0.01343 *** 0.01114 *** 0.00892 ** 0.00411 satisfied 0.05309 *** 0.00952 0.03429 *** 0.04423 *** -0.00127 *** 0.04437 *** 0.03684 *** 0.03140 ** 0.01509 very satisfied -0.06571 *** -0.04375 ** -0.04748 *** -0.06234 *** 0.00172 *** -0.05980 *** -0.04960 *** -0.04164 ** -0.01979
Working time characteristics
Working hour dis-crepancy (absolute)
Compensation for overtime Unpaid overtime Shift work Standby/On-call duty Weekend work Breaks often skipped Overwhelming
amount of work Subchallenging amount of work
No overtime (reference) Complies requirements (reference)
Working time satisfaction not satisfied 0.00196 *** -0.00103 0.01969 *** 0.04157 *** 0.00238 0.00965 *** 0.01870 *** 0.03601 *** 0.01361 ** less satisfied 0.00267 *** -0.00247 0.04308 *** 0.05977 *** 0.00543 0.02307 *** 0.04180 *** 0.06282 *** 0.00051 satisfied -0.00301 *** -0.00053 -0.00654 ** -0.05158 *** 0.00062 0.00462 *** -0.00552 ** -0.04227 *** -0.06496 *** very satisfied -0.00162 ** 0.00403 -0.05623 *** -0.04976 *** -0.00843 -0.03734 *** -0.05498 *** -0.05656 *** 0.05084 *** Job satisfaction not satisfied -0.00004 *** -0.00160 ** 0.00037 0.00044 -0.00079 ** 0.00009 0.00118 ** 0.00642 *** 0.00707 *** less satisfied -0.00027 *** -0.00471 * 0.00189 0.00295 -0.00533 ** 0.00063 0.00787 ** 0.03491 *** 0.02726 *** satisfied -0.00087 *** 0.01370 0.00360 0.00912 -0.01784 ** 0.00202 0.02294 ** 0.04146 *** -0.01150 very satisfied 0.00119 *** -0.00738 -0.00585 -0.01251 0.02396 ** -0.00275 -0.03199 ** -0.08279 *** -0.02282
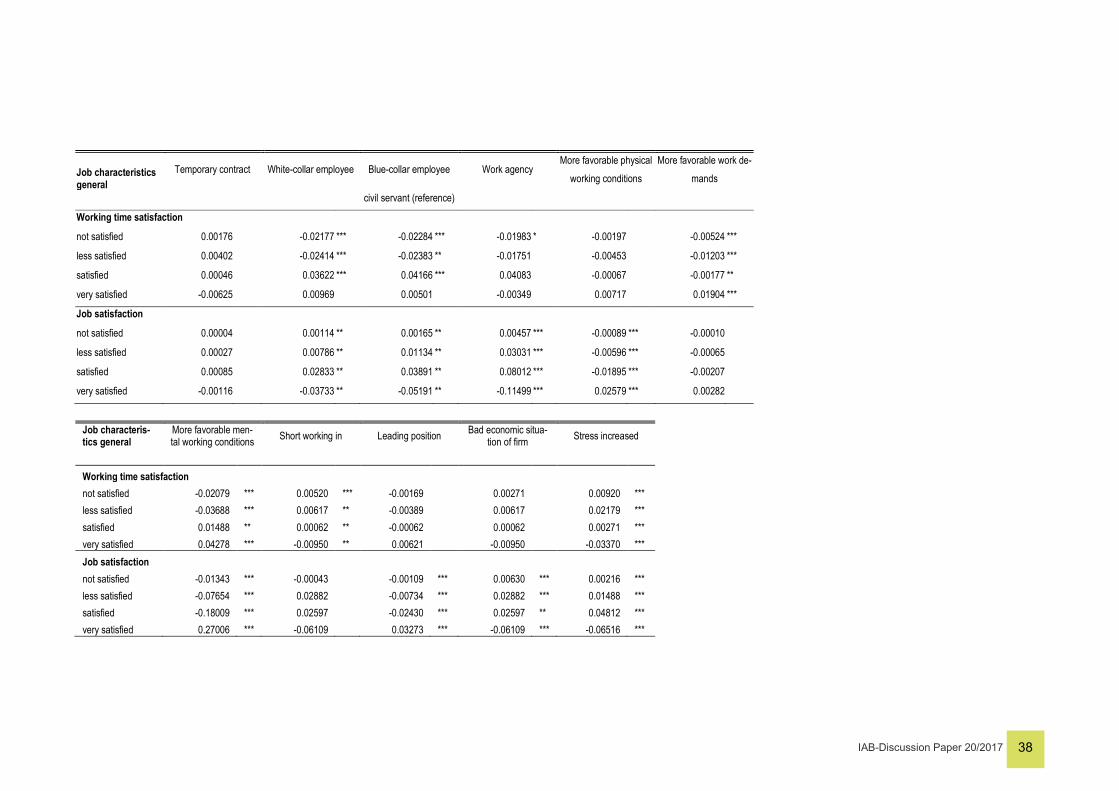
IAB-Discussion Paper 20/2017 38
Job characteristics general
Temporary contract White-collar employee Blue-collar employee Work agency More favorable physical
working conditions More favorable work de-
mands
civil servant (reference)
Working time satisfaction
not satisfied 0.00176 -0.02177 *** -0.02284 *** -0.01983 * -0.00197 -0.00524 ***
less satisfied 0.00402 -0.02414 *** -0.02383 ** -0.01751 -0.00453 -0.01203 ***
satisfied 0.00046 0.03622 *** 0.04166 *** 0.04083 -0.00067 -0.00177 **
very satisfied -0.00625 0.00969 0.00501 -0.00349 0.00717 0.01904 ***
Job satisfaction
not satisfied 0.00004 0.00114 ** 0.00165 ** 0.00457 *** -0.00089 *** -0.00010
less satisfied 0.00027 0.00786 ** 0.01134 ** 0.03031 *** -0.00596 *** -0.00065
satisfied 0.00085 0.02833 ** 0.03891 ** 0.08012 *** -0.01895 *** -0.00207
very satisfied -0.00116 -0.03733 ** -0.05191 ** -0.11499 *** 0.02579 *** 0.00282
Job characteris-tics general
More favorable men-tal working conditions Short working in Leading position Bad economic situa-
tion of firm Stress increased
Working time satisfaction not satisfied -0.02079 *** 0.00520 *** -0.00169 0.00271 0.00920 *** less satisfied -0.03688 *** 0.00617 ** -0.00389 0.00617 0.02179 *** satisfied 0.01488 ** 0.00062 ** -0.00062 0.00062 0.00271 *** very satisfied 0.04278 *** -0.00950 ** 0.00621 -0.00950 -0.03370 *** Job satisfaction not satisfied -0.01343 *** -0.00043 -0.00109 *** 0.00630 *** 0.00216 *** less satisfied -0.07654 *** 0.02882 -0.00734 *** 0.02882 *** 0.01488 *** satisfied -0.18009 *** 0.02597 -0.02430 *** 0.02597 ** 0.04812 *** very satisfied 0.27006 *** -0.06109 0.03273 *** -0.06109 *** -0.06516 ***
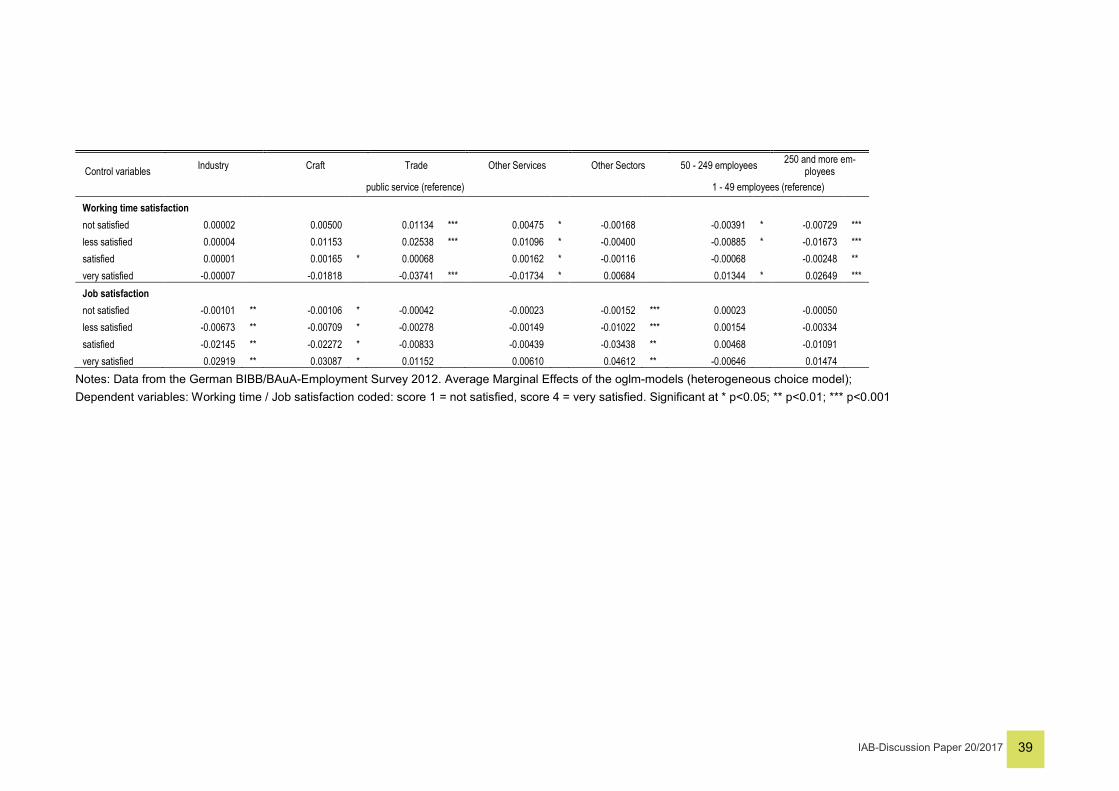
IAB-Discussion Paper 20/2017 39
Control variables Industry Craft Trade Other Services Other Sectors 50 - 249 employees 250 and more em-ployees
public service (reference) 1 - 49 employees (reference)
Working time satisfaction not satisfied 0.00002 0.00500 0.01134 *** 0.00475 * -0.00168 -0.00391 * -0.00729 *** less satisfied 0.00004 0.01153 0.02538 *** 0.01096 * -0.00400 -0.00885 * -0.01673 *** satisfied 0.00001 0.00165 * 0.00068 0.00162 * -0.00116 -0.00068 -0.00248 ** very satisfied -0.00007 -0.01818 -0.03741 *** -0.01734 * 0.00684 0.01344 * 0.02649 *** Job satisfaction not satisfied -0.00101 ** -0.00106 * -0.00042 -0.00023 -0.00152 *** 0.00023 -0.00050 less satisfied -0.00673 ** -0.00709 * -0.00278 -0.00149 -0.01022 *** 0.00154 -0.00334 satisfied -0.02145 ** -0.02272 * -0.00833 -0.00439 -0.03438 ** 0.00468 -0.01091 very satisfied 0.02919 ** 0.03087 * 0.01152 0.00610 0.04612 ** -0.00646 0.01474
Notes: Data from the German BIBB/BAuA-Employment Survey 2012. Average Marginal Effects of the oglm-models (heterogeneous choice model); Dependent variables: Working time / Job satisfaction coded: score 1 = not satisfied, score 4 = very satisfied. Significant at * p<0.05; ** p<0.01; *** p<0.001
IAB-Discussion Paper 20/2017 40
Recently published
No. Author(s) Title Date
2/2017 Roth, D. Cohort size and transitions into the labour market 01/17 3/2017 Wydra-Somag-
gio, G. Early termination of vocational training: dropout or stopout?
01/17
4/2017 Zapf, I. Weber, E.
The role of employer, job and employee charac-teristics for flexible working time
2/17
5/2017 Hutter, C. Weber, E.
Labour Market Effects of Wage Inequality and Skill-Biased Technical Change in Germany
2/17
6/2017 Capuano, S. Externe
Offshoring and Firm Overlap 2/17
7/2017 Dauth, C. Regional discontinuities and the effectiveness of further training subsidies for low-skilled employ-ees
3/17
8/2017 Stockinger, B. Extern
Apprentice Poaching in Regional Labor Markets 3/17
9/2017 Fendel, T. Extern
Child care reforms and labor participation of mi-grant and native mothers
3/17
10/2017 Kracke, N. Reichelt, M. Vicari, B.
Wage losses due to overqualification: The role of formal degrees and occupational skills
4/17
11/2017 Externe The relevance of personal characteristics and gender diversity for (eco) - innovation activities at the firm-level
4/17
12/2017 Promberger, M. Resilience among vulnerable households in Eu-rope
4/17
13/2017 Dauth, Ch. Lang, J.
Should the unemployed care for the elderly? 4/17
14/2017 Gehrke, B. extern
The German Labor Market in the Great Recession: Shocks and Institutions
4/17
15/2017 Bach, R Extern
Does Participating in a Panel Survey Change Respondent’s Labor Market Behavior?
5/17
16/2017 Kruppe, T. extern
Weiterbildungsbeteiligung in Deutschland 5/17
17/2017 Konle-Seidl, R, Retention and Re-integration of older workers into the labour market: What works?
6/17
18/2017 Rothe, T. extern
Where did all the unemployed go? 6/17
19/2017 Stockinger, B. The effect of broadband internet on establish-ments’ employment growth: evidence from Ger-many
6/17
As per: 2017-06-14
For a full list, consult the IAB website http://www.iab.de/de/publikationen/discussion-paper.aspx
ImprintIAB-Discussion Paper 20/2017
June 22, 2017
Editorial addressInstitute for Employment Research of the Federal Employment AgencyRegensburger Straße 104D-90478 Nuremberg
Editorial staffRicardo Martinez Moya, Jutta Palm-Nowak
Technical completionRenate Martin
All rights reservedReproduction and distribution in any form, also in parts, requires the permission of IAB Nuremberg
Websitehttp://www.iab.de
Download of this Discussion Paperhttp://doku.iab.de/discussionpapers/2017/dp2017.pdf
ISSN 2195-2663 For further inquiries contact the author:
Susanne WangerPhone +49.911.179.3024E-mail [email protected]