Embed Size (px)
Citation preview
Policy Brief
What a waste An analysis of household expenditure on food Policy Brief No. 6 November 2009 ISSN 1836-9014
David Baker, Josh Fear and Richard Denniss
1
Household food waste in Australia
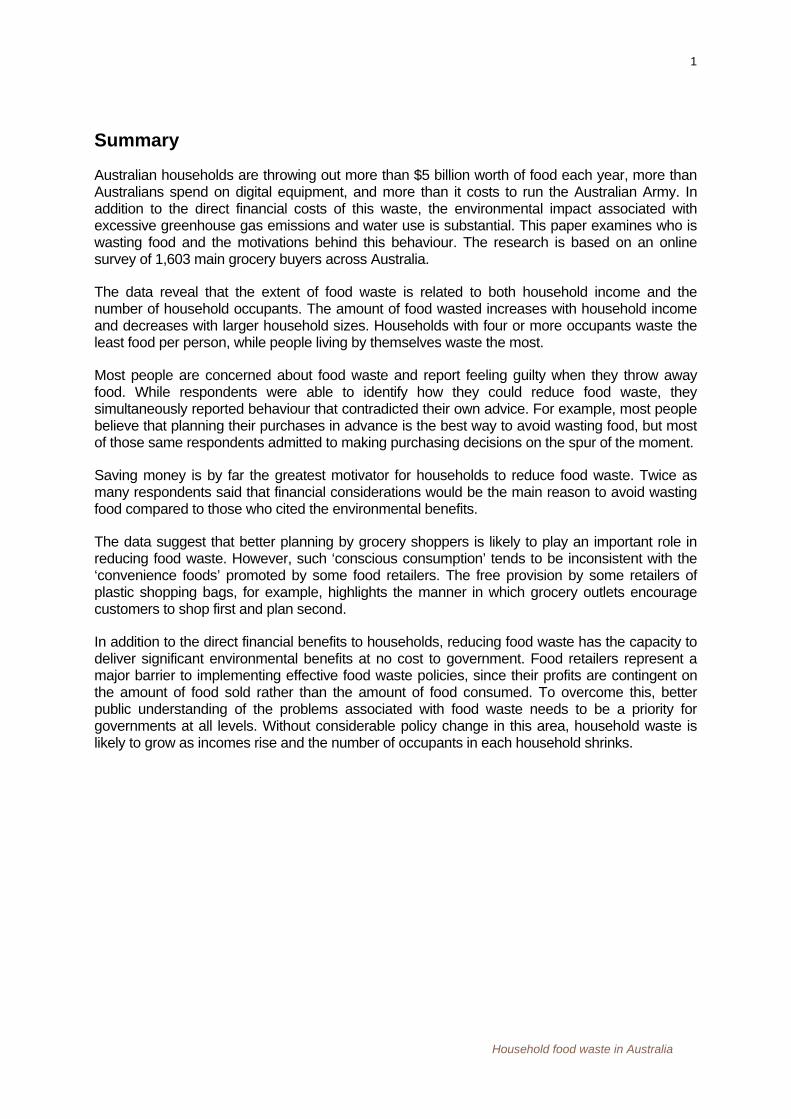
Summary
Australian households are throwing out more than $5 billion worth of food each year, more than Australians spend on digital equipment, and more than it costs to run the Australian Army. In addition to the direct financial costs of this waste, the environmental impact associated with excessive greenhouse gas emissions and water use is substantial. This paper examines who is wasting food and the motivations behind this behaviour. The research is based on an online survey of 1,603 main grocery buyers across Australia.
The data reveal that the extent of food waste is related to both household income and the number of household occupants. The amount of food wasted increases with household income and decreases with larger household sizes. Households with four or more occupants waste the least food per person, while people living by themselves waste the most.
Most people are concerned about food waste and report feeling guilty when they throw away food. While respondents were able to identify how they could reduce food waste, they simultaneously reported behaviour that contradicted their own advice. For example, most people believe that planning their purchases in advance is the best way to avoid wasting food, but most of those same respondents admitted to making purchasing decisions on the spur of the moment.
Saving money is by far the greatest motivator for households to reduce food waste. Twice as many respondents said that financial considerations would be the main reason to avoid wasting food compared to those who cited the environmental benefits.
The data suggest that better planning by grocery shoppers is likely to play an important role in reducing food waste. However, such ‘conscious consumption’ tends to be inconsistent with the ‘convenience foods’ promoted by some food retailers. The free provision by some retailers of plastic shopping bags, for example, highlights the manner in which grocery outlets encourage customers to shop first and plan second.
In addition to the direct financial benefits to households, reducing food waste has the capacity to deliver significant environmental benefits at no cost to government. Food retailers represent a major barrier to implementing effective food waste policies, since their profits are contingent on the amount of food sold rather than the amount of food consumed. To overcome this, better public understanding of the problems associated with food waste needs to be a priority for governments at all levels. Without considerable policy change in this area, household waste is likely to grow as incomes rise and the number of occupants in each household shrinks.
2
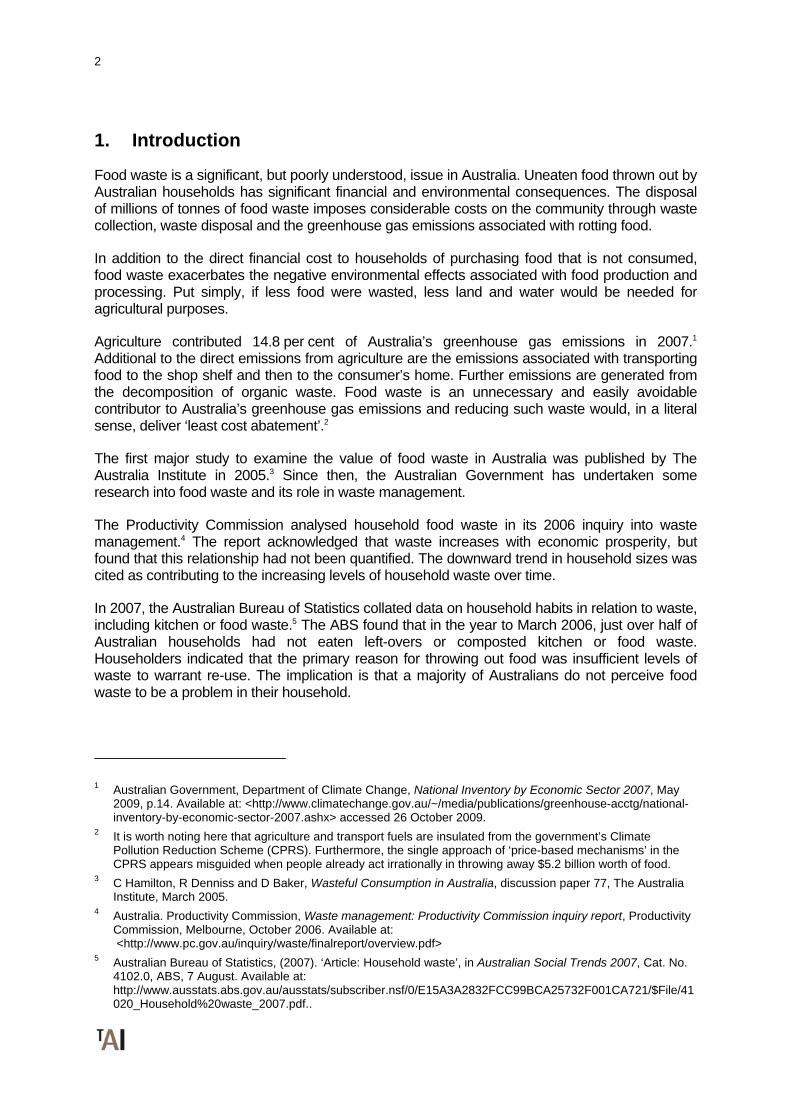
1. Introduction
Food waste is a significant, but poorly understood, issue in Australia. Uneaten food thrown out by Australian households has significant financial and environmental consequences. The disposal of millions of tonnes of food waste imposes considerable costs on the community through waste collection, waste disposal and the greenhouse gas emissions associated with rotting food.
In addition to the direct financial cost to households of purchasing food that is not consumed, food waste exacerbates the negative environmental effects associated with food production and processing. Put simply, if less food were wasted, less land and water would be needed for agricultural purposes.
Agriculture contributed 14.8 per cent of Australia’s greenhouse gas emissions in 2007.1 Additional to the direct emissions from agriculture are the emissions associated with transporting food to the shop shelf and then to the consumer’s home. Further emissions are generated from the decomposition of organic waste. Food waste is an unnecessary and easily avoidable contributor to Australia’s greenhouse gas emissions and reducing such waste would, in a literal sense, deliver ‘least cost abatement’.2
The first major study to examine the value of food waste in Australia was published by The Australia Institute in 2005.3 Since then, the Australian Government has undertaken some research into food waste and its role in waste management.
The Productivity Commission analysed household food waste in its 2006 inquiry into waste management.4 The report acknowledged that waste increases with economic prosperity, but found that this relationship had not been quantified. The downward trend in household sizes was cited as contributing to the increasing levels of household waste over time.
In 2007, the Australian Bureau of Statistics collated data on household habits in relation to waste, including kitchen or food waste.5 The ABS found that in the year to March 2006, just over half of Australian households had not eaten left-overs or composted kitchen or food waste. Householders indicated that the primary reason for throwing out food was insufficient levels of waste to warrant re-use. The implication is that a majority of Australians do not perceive food waste to be a problem in their household.
1 Australian Government, Department of Climate Change, National Inventory by Economic Sector 2007, May
2009, p.14. Available at: <http://www.climatechange.gov.au/~/media/publications/greenhouse-acctg/national-inventory-by-economic-sector-2007.ashx> accessed 26 October 2009.
2 It is worth noting here that agriculture and transport fuels are insulated from the government’s Climate Pollution Reduction Scheme (CPRS). Furthermore, the single approach of ‘price-based mechanisms’ in the CPRS appears misguided when people already act irrationally in throwing away $5.2 billion worth of food.
3 C Hamilton, R Denniss and D Baker, Wasteful Consumption in Australia, discussion paper 77, The Australia Institute, March 2005.
4 Australia. Productivity Commission, Waste management: Productivity Commission inquiry report, Productivity Commission, Melbourne, October 2006. Available at: <http://www.pc.gov.au/inquiry/waste/finalreport/overview.pdf>
5 Australian Bureau of Statistics, (2007). ‘Article: Household waste’, in Australian Social Trends 2007, Cat. No. 4102.0, ABS, 7 August. Available at: http://www.ausstats.abs.gov.au/ausstats/subscriber.nsf/0/E15A3A2832FCC99BCA25732F001CA721/$File/41020_Household%20waste_2007.pdf..
3
Household food waste in Australia
This paper presents findings from a recent survey of household food waste in Australia. A subsequent report will provide an analysis of the greenhouse gas emissions resulting from food waste by Australian households and the broader policy implications associated with those emissions.
4
2. Method
In an online survey, Australians were asked about the food they throw out and their attitudes and behaviour in relation to food waste. This paper presents findings about the financial value of household food waste and outlines the influence of personal attitudes to the amount of food that is thrown away.
The survey of 1,603 main grocery buyers was conducted during October 2009.6,7 The households included in the survey were representative of Australian households by size, with roughly even numbers sought in each state and territory to enable meaningful comparison. Sample categories were representative of the number of people living in each house and whether they were related or living in a group/share arrangement.
While the survey method used for this paper was similar to that employed by The Australia Institute in 20058 the results are not strictly comparable for a number of methodological reasons. The biggest difference between this study and the 2005 research is that an online survey was used instead of a phone poll, which meant that it was possible to target main grocery buyers more readily, as well as ask more detailed questions about attitudes and behaviour in relation to food waste.
The survey questions are listed at Appendix A.
6 Online survey panel provider Valued Opinions Panel recruited survey respondents from a wide variety of
sources to avoid bias associated with limited source requirement. 7 Main grocery buyers are well placed to make an informed assessment of the value of food waste at the
household rather than individual level. ‘Main grocery buyer’ was defined as someone who does all or most of the grocery shopping in the household, either jointly with someone else or by themselves.
8 Hamilton et al., Wasteful consumption in Australia.
Household food waste in Australia
5
3. Quantifying food waste in Australia
Australians are throwing away food worth $5.2 billion a year, enough money to meet the financial shortfall in the United Nations Emergency Relief Fund.9 It is also more than it costs to run the Australian Army every year ($4.8 billion).10 In household terms, the amount spent on food that is subsequently thrown away is more than the $5 billion Australians spent in 2007 on digital equipment from flat screen TVs to ink jet printers.11 While food waste may be an individual and household phenomenon, the collective impact of these decisions means that it is a substantial policy problem. In order to develop policy to address food waste in Australia, it is important to ascertain those who typically throw out more and less food and the reasons why.
3.1 How much is being wasted
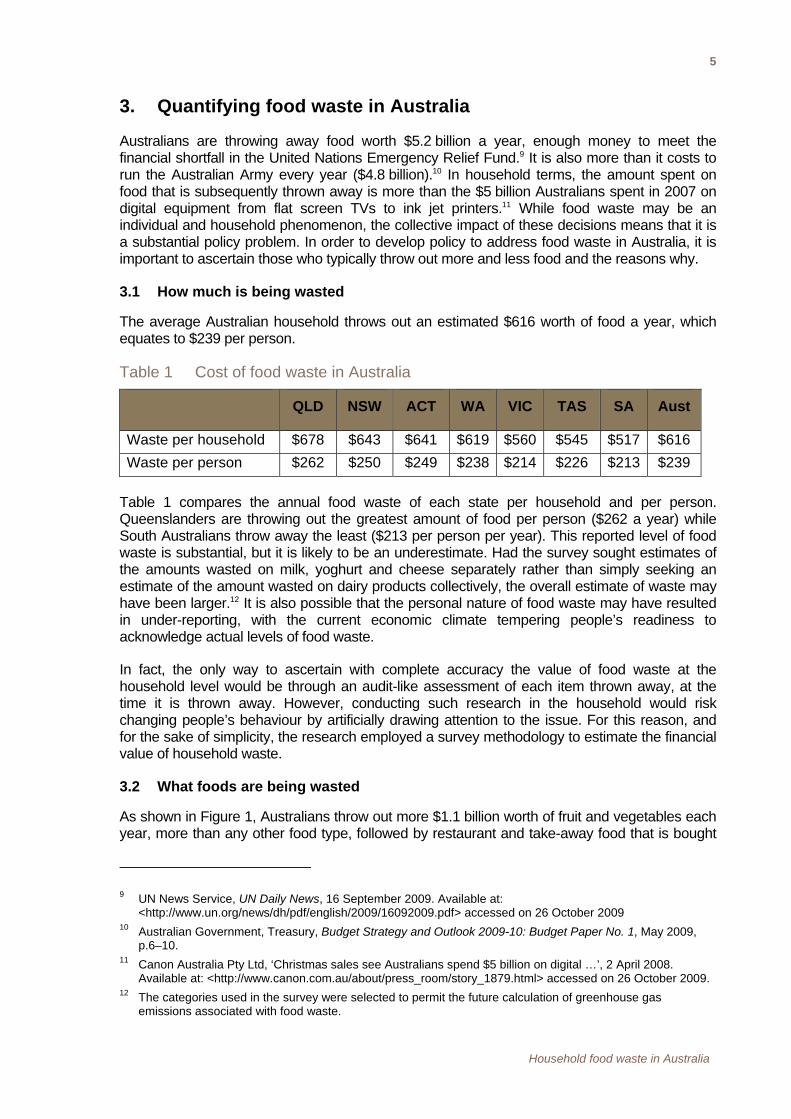
The average Australian household throws out an estimated $616 worth of food a year, which equates to $239 per person.
Table 1 Cost of food waste in Australia
QLD NSW ACT WA VIC TAS SA Aust
Waste per household $678 $643 $641 $619 $560 $545 $517 $616
Waste per person $262 $250 $249 $238 $214 $226 $213 $239
Table 1 compares the annual food waste of each state per household and per person. Queenslanders are throwing out the greatest amount of food per person ($262 a year) while South Australians throw away the least ($213 per person per year). This reported level of food waste is substantial, but it is likely to be an underestimate. Had the survey sought estimates of the amounts wasted on milk, yoghurt and cheese separately rather than simply seeking an estimate of the amount wasted on dairy products collectively, the overall estimate of waste may have been larger.12 It is also possible that the personal nature of food waste may have resulted in under-reporting, with the current economic climate tempering people’s readiness to acknowledge actual levels of food waste.
In fact, the only way to ascertain with complete accuracy the value of food waste at the household level would be through an audit-like assessment of each item thrown away, at the time it is thrown away. However, conducting such research in the household would risk changing people’s behaviour by artificially drawing attention to the issue. For this reason, and for the sake of simplicity, the research employed a survey methodology to estimate the financial value of household waste.
3.2 What foods are being wasted
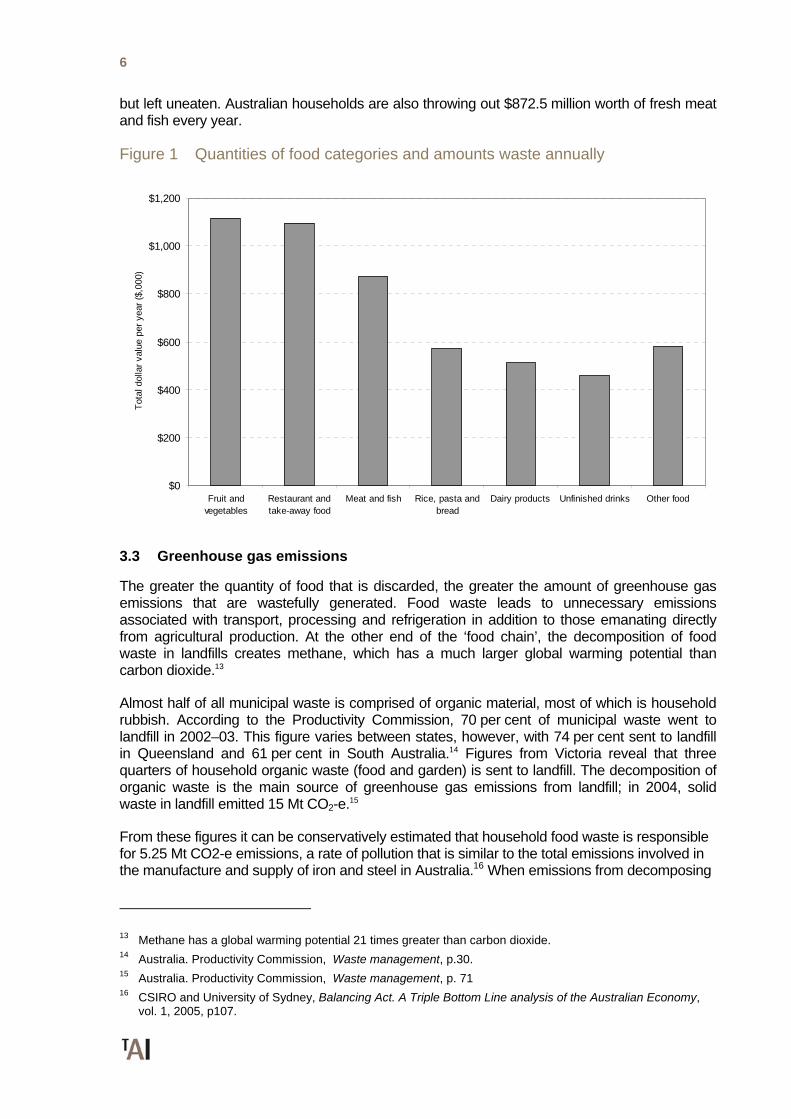
As shown in Figure 1, Australians throw out more $1.1 billion worth of fruit and vegetables each year, more than any other food type, followed by restaurant and take-away food that is bought
9 UN News Service, UN Daily News, 16 September 2009. Available at:
<http://www.un.org/news/dh/pdf/english/2009/16092009.pdf> accessed on 26 October 2009 10 Australian Government, Treasury, Budget Strategy and Outlook 2009-10: Budget Paper No. 1, May 2009,
p.6–10. 11 Canon Australia Pty Ltd, ‘Christmas sales see Australians spend $5 billion on digital …’, 2 April 2008.
Available at: <http://www.canon.com.au/about/press_room/story_1879.html> accessed on 26 October 2009. 12 The categories used in the survey were selected to permit the future calculation of greenhouse gas
emissions associated with food waste.
6
but left uneaten. Australian households are also throwing out $872.5 million worth of fresh meat and fish every year.
Figure 1 Quantities of food categories and amounts waste annually
$0
$200
$400
$600
$800
$1,000
$1,200
Fruit andvegetables
Restaurant andtake-away food
Meat and fish Rice, pasta andbread
Dairy products Unfinished drinks Other food
Tot
al d
olla
r va
lue
per
year
($,
000)
3.3 Greenhouse gas emissions
The greater the quantity of food that is discarded, the greater the amount of greenhouse gas emissions that are wastefully generated. Food waste leads to unnecessary emissions associated with transport, processing and refrigeration in addition to those emanating directly from agricultural production. At the other end of the ‘food chain’, the decomposition of food waste in landfills creates methane, which has a much larger global warming potential than carbon dioxide.13
Almost half of all municipal waste is comprised of organic material, most of which is household rubbish. According to the Productivity Commission, 70 per cent of municipal waste went to landfill in 2002–03. This figure varies between states, however, with 74 per cent sent to landfill in Queensland and 61 per cent in South Australia.14 Figures from Victoria reveal that three quarters of household organic waste (food and garden) is sent to landfill. The decomposition of organic waste is the main source of greenhouse gas emissions from landfill; in 2004, solid waste in landfill emitted 15 Mt CO2-e.15
From these figures it can be conservatively estimated that household food waste is responsible for 5.25 Mt CO2-e emissions, a rate of pollution that is similar to the total emissions involved in the manufacture and supply of iron and steel in Australia.16 When emissions from decomposing
13 Methane has a global warming potential 21 times greater than carbon dioxide. 14 Australia. Productivity Commission, Waste management, p.30. 15 Australia. Productivity Commission, Waste management, p. 71 16 CSIRO and University of Sydney, Balancing Act. A Triple Bottom Line analysis of the Australian Economy,
vol. 1, 2005, p107.
Household food waste in Australia
7
food in landfill are combined with those from the production and transport of food, the actual level of pollution will be even higher.17
3.4 Household income and food waste
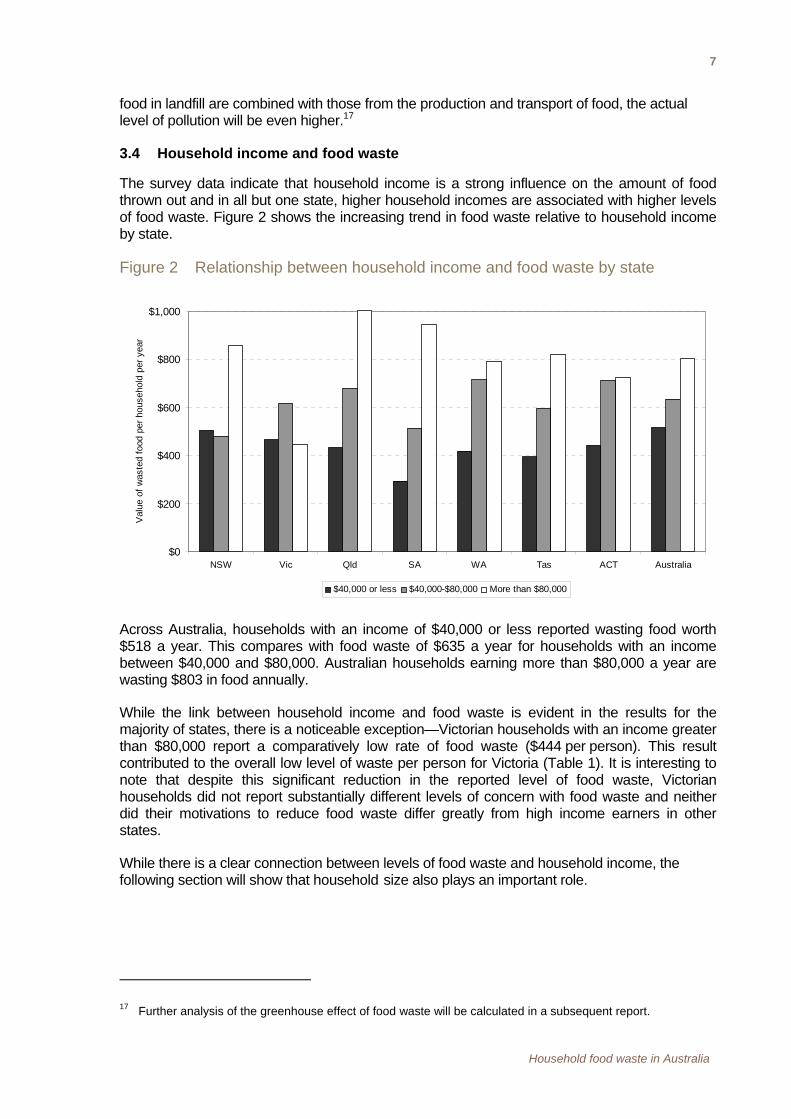
The survey data indicate that household income is a strong influence on the amount of food thrown out and in all but one state, higher household incomes are associated with higher levels of food waste. Figure 2 shows the increasing trend in food waste relative to household income by state.
Figure 2 Relationship between household income and food waste by state
$0
$200
$400
$600
$800
$1,000
NSW Vic Qld SA WA Tas ACT Australia
Val
ue o
f w
aste
d fo
od p
er h
ouse
hold
per
yea
r
$40,000 or less $40,000-$80,000 More than $80,000
Across Australia, households with an income of $40,000 or less reported wasting food worth $518 a year. This compares with food waste of $635 a year for households with an income between $40,000 and $80,000. Australian households earning more than $80,000 a year are wasting $803 in food annually.
While the link between household income and food waste is evident in the results for the majority of states, there is a noticeable exception—Victorian households with an income greater than $80,000 report a comparatively low rate of food waste ($444 per person). This result contributed to the overall low level of waste per person for Victoria (Table 1). It is interesting to note that despite this significant reduction in the reported level of food waste, Victorian households did not report substantially different levels of concern with food waste and neither did their motivations to reduce food waste differ greatly from high income earners in other states.
While there is a clear connection between levels of food waste and household income, the following section will show that household size also plays an important role.
17 Further analysis of the greenhouse effect of food waste will be calculated in a subsequent report.
8
3.5 Household size and food waste
Single-person households waste the least amount of food per household. However, as shown in Table 2, on a per person basis, single-person households waste by far the most food.
Table 2 Food waste by household size
Household size Average food waste ($/yr/household)
Average food waste per person ($/yr)
Single person $363 $363
Two persons $506 $253
Three persons $782 $261
Four persons $784 $196
Five or more persons $1,138 $190a
a Total average waste divided by six.
There are a number of possible explanations for why single-person households waste the most food. It may be because single householders are more likely to be young and have lifestyles less attuned to regular patterns of eating at home. Alternatively, the fact that food is not packaged for single-person households may result in more waste. For example, a loaf of bread is the same size irrespective of how many people are going to be eating it before it goes stale.
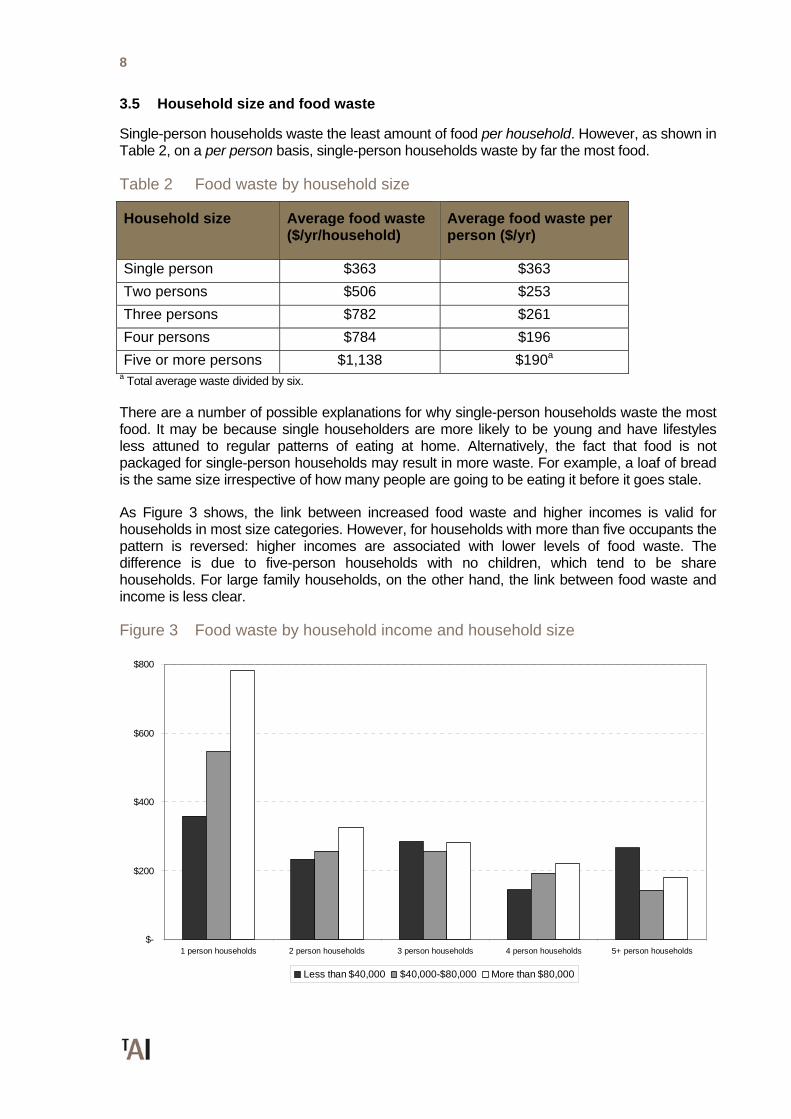
As Figure 3 shows, the link between increased food waste and higher incomes is valid for households in most size categories. However, for households with more than five occupants the pattern is reversed: higher incomes are associated with lower levels of food waste. The difference is due to five-person households with no children, which tend to be share households. For large family households, on the other hand, the link between food waste and income is less clear.
Figure 3 Food waste by household income and household size
$-
$200
$400
$600
$800
1 person households 2 person households 3 person households 4 person households 5+ person households
Less than $40,000 $40,000-$80,000 More than $80,000
Household food waste in Australia
9
While single-person households waste more than other households on a per person basis, there is a category of household that wastes even more: households in which two unrelated people live together. As shown in Table 3, two-person ‘share houses’ waste even more food per person than single-person households, possibly due to separate cooking habits, demarcation disputes over grocery ownership, or some other characteristic of small share households.
Table 3 Food waste by different small household types
Household size Average food waste ($/yr/household)
Average food waste per person ($/yr)
Single person $363 $363
Two-person family $471 $236
Two persons sharing $770 $385
These results complement the finding that household income influences levels of household food waste but household income and size alone are not sufficient to explain the level of waste. The role of attitudes towards food waste is discussed below.
10
4. Accounting for food waste in Australia
Despite the $5.2 billion worth of food wasted in Australia every year, the survey results suggest that food waste is not a significant concern for the majority of Australian households. This is evident in the relationship between stated attitudes to household waste and actual behaviour.
4.1 Household attitudes about food waste
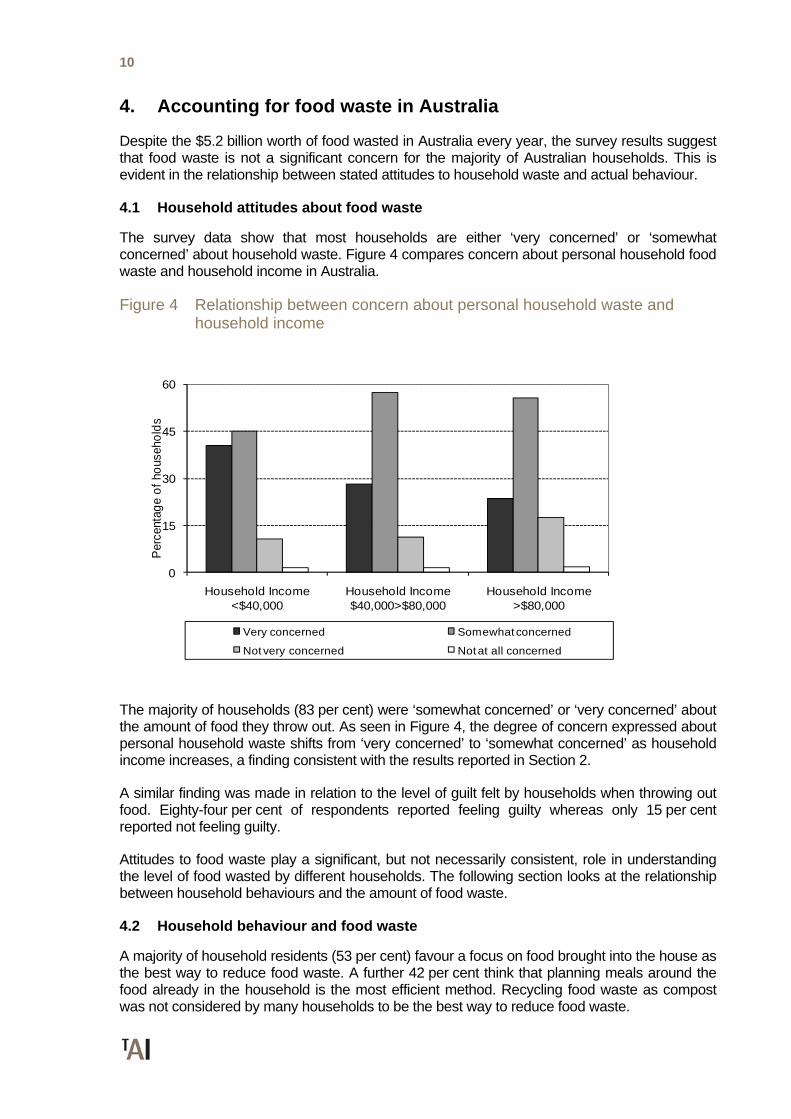
The survey data show that most households are either ‘very concerned’ or ‘somewhat concerned’ about household waste. Figure 4 compares concern about personal household food waste and household income in Australia.
Figure 4 Relationship between concern about personal household waste and household income
0
15
30
45
60
Household Income <$40,000
Household Income $40,000>$80,000
Household Income >$80,000
Per
cent
age
of
hous
eho
lds
Very concerned Somewhat concerned
Not very concerned Not at all concerned
The majority of households (83 per cent) were ‘somewhat concerned’ or ‘very concerned’ about the amount of food they throw out. As seen in Figure 4, the degree of concern expressed about personal household waste shifts from ‘very concerned’ to ‘somewhat concerned’ as household income increases, a finding consistent with the results reported in Section 2.
A similar finding was made in relation to the level of guilt felt by households when throwing out food. Eighty-four per cent of respondents reported feeling guilty whereas only 15 per cent reported not feeling guilty.
Attitudes to food waste play a significant, but not necessarily consistent, role in understanding the level of food wasted by different households. The following section looks at the relationship between household behaviours and the amount of food waste.
4.2 Household behaviour and food waste
A majority of household residents (53 per cent) favour a focus on food brought into the house as the best way to reduce food waste. A further 42 per cent think that planning meals around the food already in the household is the most efficient method. Recycling food waste as compost was not considered by many households to be the best way to reduce food waste.
Household food waste in Australia
11
Despite the widespread support for the idea of purchasing only food that is needed or for planning meals around the food that has already been purchased, household behaviour does not appear to be consistent with these approaches to reducing food waste. For example:
Householders who believe that buying only food that will be eaten is the best way to reduce food waste report that they usually take a list when they go shopping. However, many of these respondents also agreed that they often buy things on the spur of the moment.
Householders who believe that reducing food waste is best achieved by planning meals around the food they already have were also likely to think about how they might incorporate leftovers into a meal. However, many of these respondents said that they often plan meals based on what they want to eat rather than around the food that they already have.
This pattern of contradictory behaviour indicates that food waste is not always regarded by Australians to be sufficiently important to change behaviour. The following section examines what motivates householders to address their level of food waste.
4.3 Motivations to reduce food waste
Respondents were asked to prioritise the reasons that might motivate them to reduce their food waste, if they were to try. The options presented were: environmental; financial savings; concern about poverty and hunger; or other reasons. Respondents were able to select more than one motivating factor.
Financial savings were the primary reason (85 per cent) that respondents cited as their motivation to reduce the amount of food they waste. This motivation was twice as prevalent as protecting the environment (41 per cent) or humanitarian concerns (27 per cent).
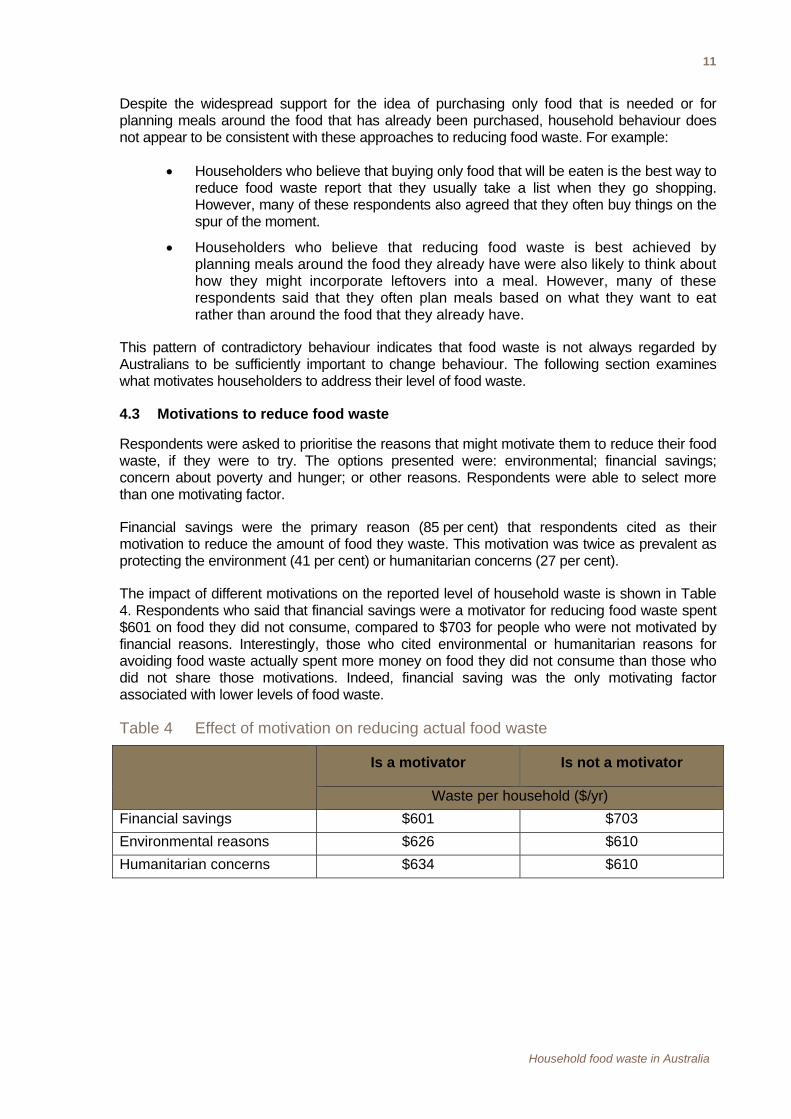
The impact of different motivations on the reported level of household waste is shown in Table 4. Respondents who said that financial savings were a motivator for reducing food waste spent $601 on food they did not consume, compared to $703 for people who were not motivated by financial reasons. Interestingly, those who cited environmental or humanitarian reasons for avoiding food waste actually spent more money on food they did not consume than those who did not share those motivations. Indeed, financial saving was the only motivating factor associated with lower levels of food waste.
Table 4 Effect of motivation on reducing actual food waste
Is a motivator Is not a motivator
Waste per household ($/yr)
Financial savings $601 $703
Environmental reasons $626 $610
Humanitarian concerns $634 $610
12
5. Conclusion
Most Australians report being concerned about food waste and confess to feeling guilty when they throw food away, yet their behaviour suggests otherwise. Collectively, they admit to throwing out $5.2 billion worth of food each year.
While there is no simple relationship between attitudes to food waste and behaviour, household size and income have a direct influence on levels of food waste. In general terms, the higher a household’s income and the lower its number of occupants, the greater the amount of food waste generated per person.
A considerable number of those who say that the best way to avoid waste is to take a shopping list admit to impulse purchases. In addition, many of those who think that the best way to avoid waste is to plan meals around the food that is already in the house admit that they often plan meals around what they want to eat and not the food they already have. A majority of survey respondents expressed concern about the amount of food thrown out by their household, and most also reported feeling guilty about it.
This research shows that the desire to reduce food waste is twice as likely to be motivated by financial concerns as by ‘altruistic’ factors such as the environment or poverty. Respondents motivated by the desire to save money reported wasting $100 less per household than those who were not motivated by money.
While it is possible to reduce food waste and, in turn, reduce the impact of food production on the environment, our results suggest that food wastage will continue to be a problem unless government takes steps to address it. In fact, without significant policy changes, it is likely to increase. The results presented in this paper reveal a strong link between household income and levels of food waste. Given expectations of continued increases in household income, it is likely that food waste will also increase.
A second reason to expect increased food waste is the trend towards smaller households; this research shows that smaller households tend to generate more food waste per person. When these two factors—rising incomes and declining household size—are combined with the projections of rapid population growth, the mountain of food waste generated in Australia will almost certainly grow unless significant policy changes are rapidly introduced.
While the policy implications of this research will be explored more fully in subsequent publications by The Australia Institute, some directions for policy reform are immediately apparent.
First, the fact that Australians readily admit to spending more than $5 billion a year on food that they throw away suggests that there is a clear role for government in helping to solve this problem, especially when the environmental effects of this waste are taken into account. It is in the direct financial interests of most households to reduce food waste, yet many households continue to throw away large quantities of food. It is only through government action that the causes and consequences of household waste can be properly addressed.
Second, simply informing people about the nature and extent of the problem and providing simple strategies to reduce waste is unlikely to be successful. Most people are aware that they waste a significant amount of food and know what kinds of behaviour are likely to help them reduce their waste. The problem is not a lack of awareness but of translating this into behaviour change.
Third, if government policy is to be effective in reducing food waste, it will need to focus on discouraging retailers from promoting wasteful purchasing activities. For example, the provision
Household food waste in Australia
13
of plastic shopping bags helps retailers to ensure that customers do not need to plan their purchases in advance. While the direct link between plastic bags, litter and landfill is well understood in Australia, the role of plastic bags in helping to promote wasteful shopping practices seems to be less well understood.
Many state governments suggest that they are committed to the notion of ‘reduce, reuse, recycle’. While there do not appear to be any particular interest groups with a strong incentive to prevent governments from encouraging recycling, the same cannot be said for government policies aimed at reducing wasteful consumption. The strong resistance from retailers to the banning of free plastic bags, for example, suggests that government policies aimed at ‘reduce’ may encounter bigger political obstacles than those experienced by the policies of ‘recycle’.
14
References
Australia, Productivity Commission, (2006). Waste management: Productivity Commission inquiry report, Productivity Commission, Melbourne. Available at: <http://www.pc.gov.au/inquiry/waste/finalreport/overview.pdf>
Australian Bureau of Statistics, (2007). ‘Article: Household waste’, in Australian Social Trends 2007, ‘Cat. No. 4102.0, ABS, 7 August. Available at: http://www.ausstats.abs.gov.au/ausstats/subscriber.nsf/0/E15A3A2832FCC99BCA25732F001CA721/$File/41020_Household%20waste_2007.pdf.
Australian Government, Treasury, (2009). Budget Strategy and Outlook 2009 10: Budget Paper No. 1, May.
Australian Government, Department of Climate Change, (2009). National Inventory by Economic Sector 2007, May.
Canon Australia Pty Ltd, (2008). ‘Christmas sales see Australians spend $5 billion on digital …’, (website), 2 April. Available at: http://www.canon.com.au/about/press_room/story_1879.html.
CSIRO and University of Sydney (2005). Balancing Act. A Triple Bottom Line analysis of the Australian Economy, vol. 1. Available at: www.cse.csiro.au/publications,
Hamilton, C Denniss, R and Baker, D, (2005). Wasteful Consumption in Australia, discussion paper 77, The Australia Institute, March.
UN News Service, (2009). UN Daily News, 16 September. Available at: <http://www.un.org/news/dh/pdf/english/2009/16092009.pdf> accessed on 26 October 2009
Household food waste in Australia
15
Appendix The following questions are about the ways that the people in your household buy and use food. Please think about your whole household when answering.
Q1. Do you think your household throws away too much food?
Yes – too much
No – not too much
Don’t throw out any food
Q2. In the past week, have you or anyone in your household thrown out any meat or fish, either raw or cooked?
Yes
No – skip Q12 and Q13
Not sure – skip Q12 and Q13
Q3. In the past week, have you or anyone in your household thrown out any fruit or vegetables, either raw or cooked?
Yes
No – skip Q14 and Q15
Not sure – skip Q14 and Q15
Q4. In the past week, have you or anyone in your household thrown out any dairy products?
Yes
No – skip Q16
Not sure – skip Q16
Q5. In the past week, have you or anyone in your household thrown out any rice, pasta or bread?
Yes
No – skip Q17
Not sure – skip Q17
Q6. In the past week, have you or anyone in your household bought any takeaway or restaurant food and not eaten all of it, and then discarded the rest?
Yes
No – skip Q18
Not sure – skip Q18
16
Q7. In the past week, have you or anyone in your household thrown away any unfinished drinks (alcoholic or non-alcoholic)? This could include half-finished bottles.
Yes
No – skip Q19
Not sure – skip Q19
Q8. In the past 3 months, have you or anyone in your household thrown out any food from your freezer because you were not going to use it?
Yes
No – skip Q20
Not sure – skip Q20
Q9. In the past 3 months, have you or anyone in your household thrown out any food from your pantry or cupboards because you were not going to use it?
Yes
No – skip Q21
Not sure – skip Q21
Q10. In the past 3 months, have you or anyone in your household thrown out any unused or partially used jars or bottles of food from your fridge because you were not going to use them?
Yes
No – skip Q22
Not sure – skip Q22
Q11. In the past 3 months, have you or anyone in your household thrown out any other kinds of food? Please think about any food not already mentioned.
Yes
No – skip Q23
Not sure – skip Q23
Q12. Please estimate the weight of any meat or fish that was thrown away in the past week. Please include both raw and cooked food.
Only a small amount (less than 0.2 kg)
0.2 kg - 0.5kg
0.5kg - 1kg
Household food waste in Australia
17
1kg - 2kg
More than 2kg
Not sure
Q13. Please estimate the original cost of this meat or fish.
Less than $1
$1-$5
$5-$10
$10-$20
$20-$50
More than $50
Not sure
Q14. Please estimate the weight any fruit or vegetables that were thrown away in the past week. Please include both raw and cooked food.
Only a small amount (less than 0.2 kg)
0.2 kg - 0.5kg
0.5kg - 1kg
1kg - 2kg
More than 2kg
Not sure
Q15. Please estimate the original cost of these fruit or vegetables.
Less than $1
$1-$5
$5-$10
$10-$20
$20-$50
More than $50
Not sure
Q16. Please estimate the original cost of any dairy products that were thrown away in the past week.
Less than $1
$1-$5
$5-$10
$10-$20
18
$20-$50
More than $50
Not sure
Q17. Please estimate the original cost of rice, pasta or bread that was thrown away in the past week.
Less than $1
$1-$5
$5-$10
$10-$20
$20-$50
More than $50
Not sure
Q18. Please estimate the original cost of any restaurant or takeaway food that was bought in the past week and not eaten, and then discarded.
Less than $1
$1-$5
$5-$10
$10-$20
$20-$50
More than $50
Not sure
Q19. Please estimate the original cost of any unfinished drinks (alcoholic or non-alcoholic) that were thrown away in the past week. Please include any half-finished bottles.
Less than $1
$1-$5
$5-$10
$10-$20
$20-$50
More than $50
Not sure
Q20. Please estimate the original cost of any food from your freezer that was thrown away in the past 3 months.
Less than $1
Household food waste in Australia
19
$1-$5
$5-$10
$10-$20
$20-$50
More than $50
Not sure
Q21. Please estimate the original cost of any food from your pantry or cupboards that was thrown away in the past 3 months.
Less than $1
$1-$5
$5-$10
$10-$20
$20-$50
More than $50
Not sure
Q22. Please estimate the original cost of any unused or partially used jars or bottles of food from your fridge that were thrown away in the past 3 months.
Less than $1
$1-$5
$5-$10
$10-$20
$20-$50
More than $50
Not sure
Q23. Please estimate the original cost of any other kind of food that was thrown away in the past 3 months.
Less than $1
$1-$5
$5-$10
$10-$20
$20-$50
More than $50
Not sure
20
Q 1. Q24. Please indicate how much you agree with the following statements. [don’t agree, agree slightly, agree strongly, not sure]
Q24a. I usually plan meals based on what I want to eat, rather than what is in the fridge or the cupboards
Q24b. When I go grocery shopping I usually take a list
Q24c. When I go grocery shopping I always plan ahead and buy only what I came for
Q24d. I tend to buy a lot of groceries in one go, so I don’t have to go to the shops all the time
Q24e. When I buy food that doesn’t get eaten I feel guilty
Q24f. When planning meals, I always think about ways to use leftovers
Q24g. At Christmas time in my household, a lot of food gets thrown away
Q24h. When I go grocery shopping I often buy things on the spur of the moment
Q25. How many people in your household are vegetarian?
None
1
2
3
4
5
6 or more
Not sure
Q32. When you cook too much food, which of these do you do most often?
Throw it out straight away
Keep it for a while and then throw it out
Keep it and eat it later
None of these/not sure
Q33. Which of these best describes the kind of outdoor area available to you at home?
None – skip to Q39
Balcony/deck only – skip to Q39
Garden/yard
Acreage/farm
Other
Q34. Do you grow your own fruit or vegetables (including herbs)?
Household food waste in Australia
21
Yes – grow some
Yes – grow a lot
No
Q35. Does your household have a compost bin/pile for organic waste?
Yes – have a compost bin/pile, and use it
Yes – have a compost bin/pile, but don’t use it
No – don’t have a compost bin/pile
The next few questions are about how your household uses water.
Q39. Is your washing machine…?
Top loading
Front loading
Not sure
Q40. What water temperature do you use when washing clothes?
Cold only
Cold sometimes, warm/hot other times
Warm/hot only
Other
Not sure
Q41. In the past week, how many loads of washing were done in your household?
None
1
2
3
4
5
6
7
More than 7
Not sure
Q42. How many of these loads of washing were less than half full?
None
22
1
2
3
4
5
6
7
More than 7
Not sure/not applicable
Q43. Do you have a dishwasher in the household?
Yes
No – skip to Q45
Q44. In the past week, how many times have you put the dishwasher on when it was less than full?
Not at all
Once
Twice
Three times
More than three times
Not sure
Q45. In the past week, how many trips to the supermarket did you and the members of your household make by car?
None
1
2
3
4
5
6
7
More than 7
Not sure
Household food waste in Australia
23
Q46. How many of these supermarket trips were because you forgot something on a previous trip or needed something for that night’s dinner?
None
1
2
3
4
5
6
7
More than 7
Not sure/Not applicable
Q47. How far is it to your main supermarket - that is, the one that you spend the most money at?
Less than 1 kilometre
1-5 kilometres
5-10 kilometres
10-20 kilometres
More than 20 kilometres
Don’t shop at a supermarket
Not sure
Q48. Are there any supermarkets closer to your home than this one?
Yes
No - skip to Q50
Not sure - skip to Q50
Q49. Why don’t you shop mainly at the closest supermarket to home? (Please select all that apply)
Difficult to park
Size/range is too small
It doesn’t have the brands I like
Too expensive
I’ve always shopped elsewhere
Another supermarket is more convenient
Just don’t like it
24
I prefer another brand/chain of supermarket
No particular reason
Other
Q50. In your view, what is the best way to reduce food waste? Please select the one option you most prefer.
Buy only food that will be eaten
Plan meals around the food you already have in the house
Put leftover food in the compost
Not sure
Q51. If you were to try to reduce your household’s food waste, why would you do so? Please select all that apply. [randomise]
Environmental reasons
Personal/financial savings to be made
Concerns about poverty and hunger
Other reason
Not sure
Q52. How concerned are you about the amount of food that is wasted in this country?
Very concerned
Somewhat concerned
Not very concerned
Not at all concerned
Not sure
Q53. How concerned are you about the amount of food that is wasted in your household?
Very concerned
Somewhat concerned
Not very concerned
Not at all concerned
Not sure
Q54. Having thought about the food that you buy and doesn’t get eaten, do you think your household throws away too much food?
Yes – too much
No – not too much
Don’t throw out any food