Embed Size (px)
Citation preview

Household Waste Behaviour in London 2005
March 2006


CONTENTS Executive Summary
1 INTRODUCTION AND CONTEXT ........................................ 1 1.1 Background to the 2005 survey.................................................... 1 1.2 Key findings from Household Waste Behaviour Phases 1 & 2............. 1 1.3 2005 survey design and sample ................................................... 2 1.4 Report structure......................................................................... 4
2 CLAIMED RECYCLING HABITS .......................................... 5 2.1 Access to recycling services ......................................................... 5 2.2 Claimed participation – 2005 versus 2001...................................... 8 2.3 Profile of High, Medium, Low and Non recyclers .............................10 2.4 Materials – change between 2001 and 2005..................................14 2.5 Materials habits of different households ........................................17 2.6 Are recycling services being used effectively? ................................21
3 ATTITUDES, BARRIERS AND INCENTIVES ...................... 26 3.1 Reasons for recycling more.........................................................26 3.2 Change in underlying beliefs, attitudes and motivations ..................27 3.3 Further changes to services to help households recycle more...........33 3.4 Attitudes to compulsion and financial incentives.............................35
4 INFORMATION AND COMMUNICATIONS......................... 37 4.1 How well informed are households about recycling? .......................37 4.2 Perceptions about sources and channels of information...................38 4.3 Where are the information gaps?.................................................41
5 CONCLUSIONS AND RECOMMENDATIONS ...................... 43 5.1 Progress since 2001...................................................................43 5.2 Remaining challenges ................................................................44 5.3 Priorities for increasing household recycling ..................................45 5.4 Policy considerations..................................................................47
6 APPENDIX...................................................................... 49

Acknowledgements Brook Lyndhurst are grateful to the GLA for commissioning this up-date research. We would also like to thank London Waste Action, which has managed and administered the London Recycling Fund (2002-2006), for its financial support to this research. We are also grateful for financial support from the Government Office for London provided from Defra's WIP Local Authority Support Unit through the London Regional Strategic Advisory Forum. We would also like to thank the Resource Recovery Forum for endorsing the commission of this new study, for allowing us to use the RRF 2001 survey data for comparison purposes, and to Kit Strange of the RRF for acting as a peer reviewer of the new work. Thanks are also due to Cigdem Penn and John Leaman at Ipsos MORI who organised and managed the fieldwork and data tabulation. The survey was designed and analysed by Brook Lyndhurst and the report was written by Jayne Cox with help from Alex Ledsom. The analysis and conclusions are entirely the responsibility of Brook Lyndhurst. © GLA 2006 This report has been produced by Brook Lyndhurst Ltd under/as part of a contract placed by the Greater London Authority (GLA). Any views expressed in it are not necessarily those of the GLA. Brook Lyndhurst warrants that all reasonable skill and care has been used in preparing this report. Notwithstanding this warranty, Brook Lyndhurst shall not be under any liability for loss of profit, business, revenues or any special indirect or consequential damage of any nature whatsoever or loss of anticipated saving or for any increased costs sustained by the client or his or her servants or agents arising in any way whether directly or indirectly as a result of reliance on this report or of any error or defect in this report.

Household Waste Behaviour in London 2005
EXECUTIVE SUMMARY I BACKGROUND • In November 2005, the GLA, London Waste Action and the Government Office
for London commissioned Brook Lyndhurst to up-date their earlier work for the Resource Recovery Forum (RRF) on Household Waste Behaviour in London.
• This report presents the findings of a new survey of 1,005 households in London about their attitudes and behaviour relating to waste and recycling. It complements campaign monitoring surveys conducted by NOP for the Recycle for London campaign.
• The purpose of the survey was to measure how much has changed since the original RRF survey in 2001, against a background in which more than £100 million has been invested in infrastructure and services: by Government (DEFRA and WRAP) via the London Recycling Fund; and by boroughs and other London waste authorities, on their own part, through leverage required as a condition of LRF funding, or through partnerships with the private sector.
• The survey was designed and analysed by Brook Lyndhurst with fieldwork undertaken by Ipsos MORI. Fieldwork was conducted in November-December 2005.
II CLAIMED RECYCLING HABITS Access to recycling services • The earlier research highlighted actual and perceived inconvenience as a key
barrier to recycling participation, and kerbside collection as the “path of least resistance” to engaging households.
• This was not only because collection makes recycling easier but also because it increases visibility and awareness, and helps to convince households that their own efforts are being fairly matched by their local council.
• One of the most obvious and significant changes since 2001 has been the increase in the number of households served by kerbside/doorstep recycling collections – from 48% in the 2001 survey to 74% in 2005.
• Widespread roll-out of collections has helped to narrow some of the inequalities in provision observed in 2001 though significant gaps still remain – poorer households living in flats remain the most disadvantaged in terms of access to doorstep collections.
• Increasing provision of communal facilities for flats has opened up opportunities for these households to recycle, but significant proportions (up to half) of non-kerbside households are still unaware where to recycle locally.
Claimed recycling participation – High, Medium, Low and Non recyclers • It is clear that the recent wave of investment in services and communications
has produced a marked rise in average levels of participation.
• The ratio of High/Medium to Low/Non recyclers rose from 50:50 in the 2001 survey to 70:30 in 2005. Only 8% are now Non-recyclers, down from 22% in 2001.
i

Household Waste Behaviour in London 2005 • Over-claiming is still an issue at all levels, however. Combined analysis across
different questions suggests that around 1 in 5 households are effectively still doing very little or no recycling – many more than the number prepared to declare openly that they are Non-recyclers.
• Claimed participation has increased across all social groups and the ‘catch-up’ has been particularly marked amongst middle income, younger and minority ethnic households. It remains the case, though, that older, wealthier and White households continue to have the highest average participation rates.
• It is now more difficult to target remaining Low and Non recyclers than in 2001 on the basis of socio-demographic characteristics; they are spread right across the social class and age spectrum and are a minority in every group.
• Some socio-demographic groups, though, continue to have significantly higher shares of Low/Non recyclers, including: households in flats, recent home movers, single adults, and minority ethnic, younger and low income households.
• The biggest identifiable concentration of Low/Non recyclers remains amongst non-kerbside households (3 in 5 of this group).
• Kerbside access is not the only reason for low participation, however, with Low recyclers now having the same level of kerbside coverage as Medium recyclers in 2001, and disinterest from remaining Non recyclers signalled by the 60% who are unaware of any recycling facilities in their local area.
Claimed participation - materials
• Londoners’ ‘mental map’ of recycling has been transformed since 2001. While newspapers and glass bottles remain the most consistently recycled items in 2005, a wide range of other materials are now (claimed to be) recycled regularly by 40-50% of households.
• Increases in claimed recycling have been most spectacular for card, cans and plastic bottles - fewer than 30% now say they never recycle these items, down from 70-80% in 2001.
• Performance of the previously defined ‘model’ materials of paper and glass improved on average between 2001 and 2005 but showed little change at the highest level of recycling, or amongst kerbside households. This may provide early warning of a ceiling being reached for these materials, and is an issue that should be monitored.
• Green garden and kitchen waste is currently a lost opportunity. Only 1 in 4 households claim they recycle or compost these materials all/most of the time, and the proportion barely changed between 2001 and 2005.
• Kerbside collection makes a significant difference to levels of recycling. Those with collections are 2 to 2½ times more likely to recycle most ‘everyday’ household items than are non-kerbside households.
Are recycling services being used effectively?
• Now that a majority of households have kerbside recycling collections, potential to raise London’s recycling rate lies as much in raising kerbside effectiveness as in recruiting the last remaining non-participants.
• The first barrier is lack of awareness that kerbside collections exist – which was estimated at around 7% of survey respondents.
ii

Household Waste Behaviour in London 2005 • The second barrier is households who opt out – 14% of households with
kerbside collections admit they do not use them. The real level of under-use is probably higher, with 20% of kerbside households being classified as Non/Low recyclers.
• Usage varies slightly across household types and is markedly lower amongst households living in flats – both low rise and high rise – and amongst recent movers.
• The third – and potentially biggest – barrier is increasing the effectiveness of participating kerbside households. There is still significant potential to capture more material from this source, with 25% of kerbside households not recycling newspapers consistently, 35% glass, and 40-50% all other everyday items.
• The latest survey confirms the general passivity of kerbside households shown in the earlier focus group research, with a majority relying entirely on their collections to recycle, and a sizeable minority saying they are too busy to use bring banks.
• There is also scope to increase the usage of bring facilities by non-kerbside households (supermarkets, on-street, on-estate and HWRCs). At present, only half of non-kerbside households use such facilities regularly.
III ATTITUDES, BARRIERS AND INCENTIVES Reasons for recycling more
• Half of respondents claim to be recycling more than they did 2-3 years ago.
• Of all the reasons for recycling more, introduction of kerbside collections is by some margin the most significant. Increasing the range of materials collected and introducing green waste collections are also significant reasons, together with “increased interest in environmental issues”.
• Overall, service improvement reasons were mentioned more than twice as often as advertising/promotion reasons.
Change in underlying beliefs, attitudes, and motivations
• As in 2001, respondents were asked about the extent to which they agree or disagree with a battery of attitude statements – covering how easy it is to recycle; feelings about services; and individuals’ beliefs about personal responsibility, trust in local councils, and the power of individual action.
• The most notable shift in attitudes since 2001 relates to how easy respondents think it is to recycle; 60% now agree “recycling fits easily into my everyday routine” up from only 38% in 2001.
• Households also feel much less restricted by what their council collects and are less worried about having to find time to make trips to bring banks. All of these shifts reflect the impact of more widespread kerbside collections on overcoming households’ effort-inconvenience barrier.
• More convenient recycling also appears to have triggered an increase in households’ confidence that they can reduce the amount of rubbish they make and that it is fair to be told to recycle.
• Less encouragingly, confidence in knowing what and what not to recycle has not changed since 2001, despite the fact that many more households are now recycling a much wider range of materials.
• Views on knowing what to do have become more polarised since 2001. High recyclers are largely confident about what to do but large proportions of Medium and Low recyclers continue to be unsure.
iii

Household Waste Behaviour in London 2005 • A key remaining barrier for High and Medium recyclers is the range of
materials accepted in their kerbside collections, and their passivity in using other services, which is reflected in significant proportions still saying that the Council doesn’t collect everything they want to recycle.
• The remaining rump of Non recyclers is clearly now much more disinterested in recycling than were Non recyclers in 2001, as measured across a range of attitudes. Disinterest combines with living circumstances which make recycling difficult – a majority of Non recyclers live in flats and only 1 in 4 have kerbside collections.
• Across most attitudes and beliefs, Low recyclers have moved closer to Medium recyclers since 2001, though they remain generally more uncertain and less convinced that recycling is convenient, easy, low hassle and straightforward.
Further service changes to help households recycle more
• Whereas introduction of kerbside collection was the leading reason for households to increase their recycling between 2001 and 2005, extending the range of materials collected is now the most desired option, especially by existing High and Medium recyclers.
• Overall, the top four rated factors that households think would help them to do more all relate to making kerbside collection better and easier. Not surprisingly, introduction of collections is the help most favoured by non-kerbside households.
Attitudes to compulsion and financial incentives
• A slim majority of households (53%) agree that recycling should be made compulsory, though 1 in 3 actively disagree with the idea. Support for compulsion is highest amongst those who are already recycling consistently.
• Of the attitudes to various financial measures tested in 2001, there has generally been little change with incentives remaining more popular than charging.
• On balance, households support incentives, are neutral about whether people would recycle more if they were charged, and are opposed to the idea that charging is fair or better than the present system.
• Charging is opposed most by those who have less opportunity to recycle (those in flats and less well off households) and by older people. Younger people (under 35s) appear more open to the idea of financial motivation.
IV INFORMATION AND COMMUNICATIONS • Households seem generally well informed about recycling although around 1 in
3 say they have never received recycling information or cannot remember when they saw any.
• The least well informed are also generally those who recycle least, and Non recyclers are unaware of receiving any information by several orders of magnitude over other groups.
• While it would be tempting to say there is therefore a direct relationship between information and participation, the previous research showed that the relationship is not so straightforward and that “lack of information” is sometimes used as an excuse by the less interested.
• Local councils – mainly via leaflets – are the primary source of information recalled by all types of household, followed by “environmental organisations” and supermarkets.
iv

Household Waste Behaviour in London 2005 • Council communications continue to top households’ future wish list for how
they wish to be informed about recycling, though a sizeable minority would like to see TV advertising.
• Generally, households seem much more interested in “how to” instructions than information relating to the purpose behind recycling, though sizeable minorities do want to know where their recycling ends up or what it is made into – more so regular recyclers than others.
V CONCLUSIONS AND RECOMMENDATIONS
• Evidence that there has been significant progress in London’s household recycling is provided by a number of headline indicators from the 2005 survey:
o The number of declared Non-recyclers fell from 22% to 8% between 2001 and 2005.
o Those saying they can’t be persuaded to recycle more fell from 1 in 6 to 1 in 20 households.
o The number of consistent recyclers (Highs and Mediums) increased from 50% to 70%.
o The proportion claiming to recycle a wide range of materials beyond paper and glass doubled, to between 40% and 50% of households in 2005.
o Those agreeing that recycling is easy to fit into everyday life are now a majority of 60%, up from just under 40% in 2001.
o The number saying that Councils do not collect enough materials has fallen from 60% to 40%.
• Two features in particular have underpinned the improving trend and reflect the significant investments made in infrastructure and communications in the last few years:
o Opportunities to recycle are now vastly better and more equal between social groups than they were in 2001;
o Perceptions and awareness have shifted significantly, such that Londoners’ ‘mental map’ of recycling has been transformed to include many more materials, and far fewer households now perceive recycling as difficult.
• Widespread introduction of kerbside collection, together with the roll-out of more multi-material collections, has been a significant driver of the increase in claimed recycling between 2001 and 2005. Introduction of kerbside collections has been particularly important in recruiting new Medium recyclers, who might otherwise be too passive to make the effort.
• While progress has been impressive, a number of significant challenges clearly remain, including:
o Continuing non or ineffective participation
o More resistance among non participants o Low awareness of recycling facilities among less committed and non-
kerbside households o Continuing lack of confidence about what to recycle (though reduced from
2001)
o Effectiveness of kerbside recyclers
o Residential mobility
o Continuing unequal opportunity for some groups in some places
o Households in flats
v

Household Waste Behaviour in London 2005 • The easy wins that existed in 2001 have largely been tackled by extending
kerbside collections and there is no longer a single easy, or quick, solution to boosting household recycling. The survey findings point instead to the need for action on a broad range of fronts, including:
o Engaging participation from remaining Non and Low recyclers – but accepting that up to 1 in 5 may continue to resist voluntary recycling
o Increasing usage of existing services – by focusing on kerbside non-participation
o Tackling the complacency of existing kerbside recyclers – to recycle a wider range of materials than are collected
o Heading off a ceiling for paper & glass – through continuing communications pressure
o Focusing on green waste – as key area of lost opportunity
o Starting to raise awareness of WEEE - to prevent a recycling time bomb
o An intensive focus on flats – especially areas with young people, high residential mobility, and including low-rise private rentals as well as social housing estates.
• The priorities identified by the 2005 analysis have implications in three policy areas: services; communications; and the rules of engagement with the public on recycling.
• In relation to services, the three key priorities are: to consider what further help is required to deal with the multiple engagement issues relating to households in flats, in inner London especially; to tackle green waste issues; to increase materials capture from existing kerbside households.
• On communications, the analysis points to a need for continuing promotion at local and strategic levels to reinforce the new mental map of recycling and ensure that good intentions are truly embedded in consistent recycling behaviour. Medium and Low recyclers (broadly ‘average’ Londoners) continue to be the key target for these messages.
• While it is still too early for a widespread change in the rules of engagement with the public on recycling - largely because social inequalities in access to services remain – the analysis provides some support for trialling forms of compulsion in areas with mature kerbside collection and settled residential populations.
vi

Household Waste Behaviour in London 2005
1 INTRODUCTION AND CONTEXT In November 2005, the GLA, London Waste Action and the Government Office for London commissioned Brook Lyndhurst to up-date their earlier work for the Resource Recovery Forum (RRF) on Household Waste Behaviour in London. This report presents the findings of a new survey of the waste attitudes and recycling behaviour of 1,005 households in London. The new work was commissioned to explore how much attitudes and behaviour have changed since 2001 following very significant investment in recycling. Over the last fours years investment in recycling services and infrastructure in London totalled over £100 million1: by Government (DEFRA and WRAP) through the work of the London Recycling Fund; and by boroughs and other London waste authorities, both on their own part, through leverage required as a condition of LRF funding, or through partnerships with the private sector.
1.1 Background to the 2005 survey The 2005 survey follows up two previous pieces of published research carried out by Brook Lyndhurst for the RRF2. Phase 1, in 2001, comprised a quantitative face-to-face survey of 1,009 households spread across London, together with six focus groups with different socio-economic groups. The research explored households’ attitudes to waste and the environment, how dealing with waste fitted within their household routines, and what they claimed to recycle. Phase 2, in 2003/4, explored the attitudes and behaviours of High, Medium, Low and Non recyclers in greater depth, to pinpoint which kinds of help needed to be targeted at which kinds of households to encourage Londoners to recycle more. This Phase comprised eighteen focus groups, together with additional analysis of the Phase 1 survey data. The research in both phases was designed and analysed by Brook Lyndhurst, and fieldwork was conducted by MORI (now Ipsos MORI).
1.2 Key findings from Household Waste Behaviour Phases 1 & 2 In 2001/02, landfill accounted for 73 per cent of municipal waste, with a vast majority of this going to sites outside Greater London. 19 per cent of municipal waste was incinerated, at the two waste incineration plants within London, at Edmonton and Lewisham. Only eight per cent of London’s municipal waste was recycled or composted. In 2001, more than half of London’s households were doing little or no recycling; only 1 in 5 was regularly recycling anything other than paper and glass; and 1 in 6 believed nothing could be done to encourage them to recycle more. For all but a few households, the previous research showed very clearly that choosing to recycle is not driven primarily by environmental concern.
1 Source: London Waste Action 2 With funding provided by Cory Environmental via Landfill Tax Credits, and London
Remade.
1

Household Waste Behaviour in London 2005 While interest in ‘doing my bit’ for the environment helps to make households receptive in the first place, and to sustain participation once they start recycling, for many the amount of effort required is the decisive factor. Those with a strong interest in the environment may recycle whatever the difficulty, but others may only mobilise their latent environmental concern when they are provided with convenient and easy-to-use services – typically kerbside collections. Those who have neither an interest in the environment nor convenient services are unlikely to give recycling any thought at all. The 2001 survey highlighted sizeable disparities in access to convenient services. Generally, kerbside recycling collections were then more widely available to older and wealthier households, who typically had stronger environmental concern, more trust in service providers, and a belief in personal responsibility and the power to make a difference for the environment. Less well off, and less motivated, households generally had the least convenient services, often simply because they lived in flats. Many of these households also had less space for storage and lower levels of car ownership (for transporting recyclables). Many Low and Non recyclers in 2001, in fact, experienced multiple barriers to recycling, which combined low latent interest, difficult living conditions and inconvenient services. The previous research concluded that different household types needed different kinds of help to do more but that, overall, achieving a mass increase in participation would require a twin attack involving wider access to services backed up by extensive communications. In particular, views that the “worthy” image of recycling needed to be overhauled were expressed widely in the Phase 2 focus groups. Respondents thought that a younger, livelier call to action would be more engaging, but they also wanted this backed up by more straightforward “how to” instructions delivered at local level. In particular, many existing – but not especially effective – recyclers claimed to be deterred by confusion over what can and can’t be recycled. The survey showed that only a minority were, in reality, recycling a wide range of materials beyond newspaper and glass. The 2004 report concluded that there was a large middle ground of “Medium” and “Low” recyclers who could be pushed much further up the recycling ladder; willing Low recyclers to be persuaded to recycle more often; complacent Medium (and some High) recyclers to take on a wider range of materials, including cans, card and paper other than newspaper. The report also flagged the need to tackle equity issues surrounding access to services - in the short term to help redress the balance between affluent and poorer households; and in the longer term as a necessary precursor to any consideration of compulsion or charging.
1.3 2005 survey design and sample The 2005 survey was again designed and analysed by Brook Lyndhurst, with fieldwork conducted by Ipsos MORI. The questionnaire was discussed and agreed with the GLA, and the RRF provided peer review of the questionnaire and report. Many questions from the 2001 survey were retained so as to provide a direct base for comparison. Some questions – for example on shopping and waste minimisation – were dropped to make room for additional questions on services, reasons for recycling and information. The current survey also asked about a more extensive list of materials than in 2001.
2

Household Waste Behaviour in London 2005 Some of the 2005 questions are similar to questions asked in the NOP Recycle for London campaign evaluation surveys, as well as questions used/recommended by WRAP for evaluation. This is because a number of the questions currently in use elsewhere were originally developed for the RRF 2001 survey and have been refined by others since. Wherever possible, the original question wording is retained in the 2005 survey to allow as close a comparison as possible to 2001, though revised wording is used in a few places; new questions draw on the NOP Recycle for London questionnaires and other Brook Lyndhurst recycling surveys. Fieldwork was conducted during November and December 2005 by Ipsos MORI, who interviewed 1,005 adults (16+) face-to-face at home. Respondents were all solely or jointly responsible for dealing with waste in their household. Sample quotas were set for age, sex, working status, social class, dwelling type and ethnicity and final results were weighted to ensure that the sample matches the socio-demographic profile of London. At the time of the 2001 survey, quotas were based on pre-2001 data whereas the 2005 sample is based on 2001 Census data. In addition, quotas were not set for dwelling type in 2001 which resulted in an over-representation of respondents in houses; this has been corrected in the 2005 survey. Table 1.1. below compares the main socio-demographic features of the 2001 and 2005 samples. Table 1.1
Key demographics Total respondents: 1009 in 2001; 1005 in 2005
Characteristics for which quotas set
Age Ethnicity2001 2005 2001 2005
Under 35 40% 38% White 79% 72%35-54 29% 35% Black 9% 15%55+ 31% 27% Asian 9% 8%
Social Class2001 2005
AB 20% 22%C1 34% 36%C2 16% 17%DE 30% 25%
Other household characteristics2001 2005
Anyone working 67% 75%2+ working 40% 38%Any children 30% 40%Single adult household 24% 29%Have a car 63% 63%Live in a flat 25% 42%Have private garden 76% 64%
The main differences between the two samples are: • The 2005 sample has a higher proportion of Black and Asian Minority Ethnic
households (BAME);
3
Household Waste Behaviour in London 2005 • The proportion of social class DE households is lower
• The proportion of households in flats is higher The possible impact of this sample shift on the overall results has been examined by looking closely at the 2001-2005 changes both within and between different socio-demographic groups and we do not consider that it is a material consideration. In interpreting the findings, and in particular comparisons between sub-groups shown in the graphs in this report, it is important to be aware of the degree of difference required for the results to be considered statistically significant. The required difference varies with the size of the sub-samples, as well as the distribution of answers (e.g. whether 50% give a particular answer or 75%). Broadly speaking, for the sub-samples in our survey, differences between five and ten percent will generally be statistically significant, depending on the exact size of the sample (the bigger the sample, the smaller the required difference). This is particularly important for interpreting differences by ethnicity, for which Black (152) and Asian (81) are amongst the smallest sub-samples in the analysis, as well as for Non recyclers (75). Sub-samples are given the Appendix. Statistically significant differences are indicated on tables and graphs in the report by means of a cross (+).
1.4 Report structure The structure of this report is as follows: Section 2: Claimed recycling habits – participation and materials Section 3: Attitudes, barriers and incentives Section 4: Information and communication Section 5: Conclusions and recommendations Appendix: Details about the sample, together with topline survey results A Summary precedes the Introduction.
4

Household Waste Behaviour in London 2005
2 CLAIMED RECYCLING HABITS As in 2001, the new survey asked respondents how much they feel they recycle overall, then explored this further by asking how often they recycle a wide range of materials. By using the same question frames as in 2001 (but including more materials this time) the survey shows the extent to which claimed recycling in London has moved since. The new survey, in addition, asked more detailed questions about access to, and usage of, services so that this could be compared to patterns of recycling behaviour.
2.1 Access to recycling services Kerbside collections One of the most obvious and significant changes since 2001 has been the increase in the number of households served by kerbside/doorstep recycling collections. In the 2001 survey 48% claimed to have collections; coverage rose to 74% in 2005.3 The 2005 survey estimate is slightly below the actual level of kerbside coverage, estimated by the GLA at around 80%. A possible explanation is provided by the previous focus groups, in which some households in areas where collections were available were unaware of the service. In the 2003/4 groups, this applied most obviously to young, working, frequently mobile households. By matching 2005 survey postcodes against known provision of recycling collections (as given on the Recycle for London web site), it has been possible to estimate the extent of this ‘provision-awareness gap’. On this basis, around 7% of surveyed households appear to be unaware that kerbside/doorstep recycling collections are available to them.4 When added to the 74% of respondents who know they have kerbside collection this would take the total to 81%, which is equivalent to the GLA’s own estimate of kerbside coverage. The widespread roll-out of kerbside collections in recent years has helped to even out some of the inequalities in provision observed in 2001, though some notable differences between household types remain (Figure 2.1). In particular, differences across the age spectrum are now far less marked and the gap between white and minority ethnic households appears to have narrowed.
3 This 74% comprises the group described as “kerbside households” throughout the report. 4 This should be treated as an indicative ‘best estimate’, given the constraints of the data used to derive it. We identified the postcodes of the 26% who did not mention kerbside when prompted with a list of possible recycling facilities, then looked up these postcodes on the Recycle for London web site to identify whether kerbside collection is provided in these areas. If any of these households live in an area where kerbside is provided and they live in a house then they are included in the 7% estimate. If they live in a flat, they are assumed not to have kerbside; case by case examination would be required to refine this further, which was beyond the scope of the present research.
5

Household Waste Behaviour in London 2005 There remains, though, a very wide gap in kerbside provision on two key social dimensions: between the higher professional middle classes and poorer households ((87% coverage for ABs; 61% for DEs); and between those living in houses (88%) and flats (51% for high-rise and 57% for low-rise). When combined, these two factors mean that: • The poorest (DE) households living in flats have the lowest kerbside collection
coverage (44%);
• AB households in houses have the highest coverage (92%) and are also relatively well provided for in flats (76% with kerbside)5;
• C1 and C2 households6 in flats are slightly better provided (53%), than equivalent DE households;
• While C1s and C2s living in houses have similar levels of kerbside provision to AB households.
While much has improved since 2001, it therefore remains the case that poorer and middle income households living in flats are the most disadvantaged in terms of access to convenient recycling services, with just under half in flats still without recycling collections. Figure 2.1
Households served by kerbside collections (2001-2005)
0
10
20
30
40
50
60
70
80
90
100
All HH
Under
35
35-5
455
+
Whi
te
Black
Asian AB C1 C2 DE
Car o
wne
r/us
er
Hou
seFl
at
+ all changes 2001-2005 statistically significant
%
2001 2005
Other recycling facilities
The survey also asked about the availability of bring facilities locally - at on street banks, at supermarkets, communal facilities in flats, and at Household Waste Recycling Centres (HWRCs). These sites provide the main opportunity for households without kerbside collections to recycle, and a top-up option for kerbside households to recycle materials not collected.
5 Based on a small sub-sample of 71 AB households in flats 6 C1 are junior professional/clerical households and C2 are skilled manual households
6

Household Waste Behaviour in London 2005 A sizeable, and potentially worrying, minority of non-kerbside households appear either not to know whether local facilities are available, or claim they do not exist. Altogether this amounts to 1 in 3 of non-kerbside households (but only 8% of the sample overall because non-kerbside households are now a small share of the total) (Table 2.1).
Table 2.1
Access to recycling services
Base
Kerbside households
% (745)
Non-kerbside
households %
(260) Kerbside collection 74 0 Charity shops 40 28 Local bring banks 26 24 Supermarket sites 28 17 HWRC 25 13 Communal facilities in flats 14 35 Newspaper banks outside Tube 16 13 Free/subsidised compost bins 12 5 None 0 18 Don't know 0 14 + significant differences shown in bold
Reflecting the socio-demographic pattern of kerbside provision, the proportions claiming they have no facilities, or no awareness of facilities, are highest amongst households in flats, and DE households. Perversely, for all except communal facilities in flats, claimed availability of bring facilities is equal or higher amongst households with kerbside than those without (Table 2.1). While it is not possible to match claims against actual provision in the same way as for kerbside, there must be some suspicion that low awareness of services signals lack of interest in recycling as much as lack of opportunity. The percentages who say there are no facilities available locally, in fact, match the numbers who agree strongly in later questions that they have never thought about recycling, or do not think it is their responsibility to recycle. Apart from this possibly disinterested minority, most non-kerbside households are aware of local recycling sites, with communal recycling facilities in flats cited most often of all the bring options, by 35% of non-kerbside households (Table 2.1). As a focus for investment in recent years, these communal facilities have clearly extended the opportunity to recycle for households who were previously disadvantaged. This is particularly true in high-rise flats, where 40% of households say such facilities are available. Only 1 in 8 high-rise households now say there are no local recycling facilities (including kerbside), or they don’t know of any. Households in low-rise flats appear slightly worse off, with 1 in 6 unaware of any recycling service; these households have significantly lower access to communal facilities or to on-street bring banks than those in high-rise flats (Figure 2.2).
7

Household Waste Behaviour in London 2005
Figure 2.2
Access to recycling facilities for different housing types
0
10
20
30
40
50
60
70
80
90
100
House High-rise flat Low-rise flat
+ significant difference from "house"
% c
laim
ing
faci
lity
availab
le in
lo
cal are
a
Kerbside Local bring banks Supermarket sites HWRC Communal facilities in flats
+
+
+
+
+
+ ++
+
Of the other bring facilities – supermarkets & HWRCs – claimed access is significantly higher amongst households who also have kerbside collections (Table 2.1). Reflecting the types of household that have collections, access to these bring facilities splits along class and housing situation lines, with significantly higher claimed provision amongst middle class (ABC1) households and those living in houses (Figure 2.2). These households are also more likely to be car owners, which would make these particular facilities easier to use.
2.2 Claimed participation – 2005 versus 2001 As in 2001, two different questions were asked in 2005 to establish levels of claimed recycling: • How much people feel they recycle on a scale of “as much as I possibly can”,
“a lot but not everything”, “I do not recycle much” or “I do not recycle anything”;
• How often each of a list of 22 household items are recycled on a five-point scale from “always” to “never”.
The 2001 survey (and research elsewhere) showed that the second “items” question provides a useful check on the headline claims people make about how much they recycle, when they may be tempted to say what is expected rather than what they actually do. It also provides a more discriminating basis for defining High, Medium, Low and Non recyclers than the simple direct question. Again as in 2001, the possibility of over-claiming was also checked through later questions on attitudes (e.g. “I have never really thought about doing any recycling”).
8

Household Waste Behaviour in London 2005 At a headline level (on the basis of the first question), it is clear that the recent wave of investment in recycling has produced a marked rise in average levels of participation. In particular, the number of households saying they recycle “not much” or “nothing” has halved. Table 2.2
Headline recycling claims 2001 & 2005
2001
% 2005
%
I recycle as much as I possibly can 33 46
I recycle a lot, but not everything that can be recycled
22 31
I do not recycle much 26 14
I do not recycle anything 19 9
+ all changes statistically significant
When the percentages claiming to recycle at different levels are converted into an ‘average score’ for participation7, the survey suggests that average levels of recycling have risen by a quarter (+27%) since 2001. The profile of who does and who doesn’t recycle has changed too, with more of the types of households who were previously non-recyclers now claiming to participate – in particular less well-off, BAME, and younger households (Figure 2.3). Figure 2.3
Claimed propensity to recycle
0
0.5
1
1.5
2
2.5
All AB C1 C2 DE White Black Asian 16-24 25-34 35-44 45-54 55-64 65+
+ all changes 2001-2005 statistically significant
avera
ge s
core
3=
as
mu
ch a
s p
oss
ible
; 0
=n
oth
ing
2001 2005
7 Where 4= as much as possible and 0=nothing
9

Household Waste Behaviour in London 2005 Despite this apparent ‘catch-up’ effect, it remains the case, though, that older, wealthier and White households continue to have the highest overall scores for recycling. Moreover, while there has undoubtedly been a major improvement since 2001, it is important not to be complacent, given that 1 in 4 households are still recycling little or nothing.
2.3 Profile of High, Medium, Low and Non recyclers Responses to how often particular household items are recycled provide further insight into levels of recycling commitment, and the patterns of High, Medium, Low and Non recycling across socio-demographic groups. The following analysis uses the same definition of High, Medium, Low and Non recyclers as in the 2004 report8, which was based on the claimed frequency of recycling newspapers, magazines and glass bottles as follows:
High Always recycle all three materials
Medium Typically recycle materials most or some of the time or always recycle one material and others infrequently
Low Sometimes/hardly ever recycle three materials or recycle one material some/most of time and others never or sporadically
Non Never recycle all three materials
Change in recycling commitment since 2001 The analysis confirms the headline picture, showing a major shift upwards in levels of recycling, with only 8% now classified as Non recyclers as compared to 22% in 2001 (Figure 2.4). All other groups have expanded, most notably Medium recyclers, who now comprise 42% of households as compared to 27% in 2001. Like 2001, however, it is also clear that households’ own definitions of “as much as I possibly can” are not especially stringent. Whereas nearly half claim this when asked directly, only 29% are in reality recycling newspapers, magazines and glass all of the time (High Recyclers on our definition). More of the households claiming they recycle “as much as possible” can more accurately be described as Medium recyclers, who are generally recycling these three materials most or some of the time, but not always. In addition, half of Low recyclers believe they are recycling a lot or as much as they can but are, in fact, recycling few materials and not very often. This amounts to 1 in 10 of households in total whose recycling may be constrained by their own beliefs and aspirations rather than by normal definitions of what constitutes “a lot”. The detailed picture for different materials is reported in section 2.4 below.
8 The 2001 data were re-analysed in the 2004 report to provide a stricter definition of recycling commitment than had been used in the 2001 analysis.
10

Household Waste Behaviour in London 2005 Figure 2.4
Level of recycling (2001-2005)
27 27
22
42
2123
8
29
0
5
10
15
20
25
30
35
40
45
High Medium Low Non
+ all changes 2001-2005 statistically significant
% in
each
recy
clin
g g
rou
p
HWB 2001 HWB 2005
Socio-demographic profile of High, Medium and Low recyclers While High, Medium, Low and Non recyclers are spread right across the age and social class spectrum, different groups tend be concentrated in certain parts of it. The previous reports described the different groups according to their archetypical characteristics in 2001: • High recyclers – more likely to be older and middle class in higher grade
occupations, typically living in suburban houses and a majority with kerbside collections;
• Medium recyclers – described as ‘average’ Londoners, family aged households (25-44), in junior professional and clerical jobs, and living in terraced or semi-detached housing typically with kerbside collections, but also with a sizeable minority of over-65s;
• Low recyclers – most characteristically young Londoners in middle-ranking jobs (manual and non-manual), more likely to live in flats and terraced houses, and only a minority with kerbside collections;
• Non-recyclers – also most typically young Londoners but less middle class than Low recyclers on average, most living in houses but with well above average numbers in flats and with the lowest coverage of kerbside collections.
The broad socio-demographic pattern remains similar in 2005 as in 2001, with High and Medium recyclers tending to be older and more middle class than Low and Non recyclers, less likely to live in a flat, more likely to be White than in a minority ethnic household, and much more likely to have kerbside recycling collections (Table 2.3). (A table showing the full range of statistical differences between groups is provided in the Appendix).
11

Household Waste Behaviour in London 2005 Table 2.3 Socio-demographics of High, Medium, Low and Non Recyclers 2005
HIGH MEDIUM LOW NON TOTAL% % % % %
Percent of respondents 29 42 21 8 100
Have kerbside recycling 91 82 62 24 74
GenderMale 46 47 48 63 48
Female 54 53 52 37 52Age
16-24 11 13 15 18 1325-34 21 25 25 41 2535-44 21 21 26 8 2145-54 14 14 15 15 1455-64 18 14 10 8 14
65+ 15 14 10 11 13Under 35 32 37 39 59 38Over 35 68 63 61 41 62
EthnicityWhite 85 71 62 55 72Black 6 17 19 29 15Asian 6 8 10 12 8Other
ClassAB 29 24 20 7 22C1 37 40 26 35 36C2 16 16 18 19 17D 7 8 15 13 9E 11 13 21 25 16
HousingDetached/semi 32 28 21 10 26
Terraced house 39 32 28 19 32Flat 29 40 51 71 42
Owner occupied 67 49 32 23 47Private rented 13 21 36 37 24Social rented 18 25 30 37 25
Have private garden 73 67 56 41 64
Length of residence in areaLess than 5 yrs 32 45 46 63 43
Over 5 yrs 67 54 52 37 56
Have car 70 67 55 44 63Single adult HH 26 26 35 39 29None working in HH 21 23 24 26 242+ working in HH 40 39 36 33 37No children at home 65 59 57 66 60
12

Household Waste Behaviour in London 2005 There have, though, been a number of notable shifts within the general picture. While the social class profile of High, Medium, Low and Non recyclers has remained broadly similar to 2001 (apart from a slightly higher concentration of DEs among Low and Non recyclers), the age profile across groups has shifted. • While Highs are still predominantly older, more of this group are now under 35
(1 in 3 as compared to 1 in 5 in 2001).
• At the same time, Mediums are now slightly older on average, with a more even spread across the age spectrum as well as a slightly higher concentration in the middle aged band of 35-54 than in 2001.
• The same is true of the Low recycler group, more of whom are now over 35, while the profile of Non recyclers is now even more biased towards younger households (59% are under 35).
• Non recyclers are also much more likely than other groups to be recent in-movers – 63% have located in their current area in the last five years as compared to an average of 43% across all households.
There are two further features which separate the groups, and which are closely linked to the ability to recycle – kerbside collections and living in flats. Even allowing for the fact that the 2005 sample includes more households in flats, the proportion of Low and Non recyclers living in flats has risen significantly. This is now a majority in these groups - half of Lows and 71% of Non recyclers. It is probable that many households living in flats have effectively been ‘left behind’ as kerbside has been rolled out to a majority of houses, enabling previous Low and Non recyclers in these situations to increase their participation. Figure 2.5
Claimed access to recycling services by recycling commitment
0
10
20
30
40
50
60
70
80
90
100
Kerbs
ide
colle
ctio
n
Charit
y sh
ops
Loca
l brin
g ba
nks
Supe
rmar
ket s
ites
HWRC
Com
mun
al fa
cilit
ies in
flat
s
Newsp
aper
ban
ks o
utside
Tub
e
Free
/sub
sidi
sed
com
post
bin
s
None
Don't
know
% o
f each
recy
clin
g g
rou
p (
H/
M/
L/
N)
High Medium Low Non
Equally, though, the fact that kerbside coverage of Low recyclers is now as extensive as it was for Medium recyclers in 2005, and access to local bring banks is near equal to High and Medium recyclers, suggests that this is not the only factor accounting for differences in commitment.
13

Household Waste Behaviour in London 2005 Moreover, the fact that more than 60% of Non recyclers claim there are no services in their area, or they know of none, tends to suggest that indifference as much as unequal treatment underpins non-participation for at least a minority (Figure 2.5). The extent to which recycling services are being used effectively by different groups is covered further in Section 2.6. Whether for reasons of service access, or for reasons of inclination, it is clear that there are still above average concentrations of Low and Non recyclers amongst particular socio-demographic groups, which present opportunities to boost participation (Figure 2.6): • Younger (under 35) households (34% of which are Low & Non recyclers)
• Low income (DE) households (43%)
• Minority ethnic households (39% of Black and Asian households)9
• Households in flats (39%)
• Those in rented accommodation (37% in social rented and 46% in private rented)
• Single adult households (36%)
• Recent in-movers (less than five years) (34%) Figure 2.6
Recycling profile of socio-demographic groups
0%
10%
20%
30%
40%
50%
60%
70%
80%
90%
100%
All
Under
35
35-5
455
+ AB C1 C2 DE
Whi
te
Black
Asian
House
Flat
Owne
r occ
upie
d
Privat
e re
nted
Social
rent
ed
In a
rea
< 5
yrs
Sing
le a
dult%
wit
hin
each
gro
up
wh
o a
re H
, M
, L o
r N
recy
clers
High Medium Low Non
2.4 Materials – change between 2001 and 2005 In 2001 (and confirmed in the 2003 focus groups) Londoners’ ‘mental map’ of recycling was defined principally by newspapers, magazines and glass bottles. At that time, only 1 in 5 households were regularly recycling anything other than these items.
9 Data combined to provide large enough sub-sample for comparison
14

Household Waste Behaviour in London 2005 This picture has clearly changed. While newspapers and glass bottles remain the most consistently recycled items in the 2005 survey (66% and 55% respectively recycling them all/most of the time), a wide range of other materials are now (claimed to be) recycled regularly by 40-50% of households (Table 2.4 and Figure 2.7). Table 2.4
Frequency of recycling household materials 2005
All / Most of
time %
Some-times
%
Hardly ever / Never
% Newspapers 66 15 15 Magazines 63 18 17 Junk mail 56 19 23 Glass jars 54 18 27 Glass bottles 54 18 26 Food cans 49 17 32 Drink cans 49 16 32 Light card (e.g. cereal boxes) 48 18 31 Plastic drink bottles 45 17 35 Heavy card (e.g. computer packaging) 44 18 34 Plastic carrier bags 42 18 38 Plastic cleaning bottles 40 17 41 Clothing 37 25 37 Cartons (Tetrapak) 35 15 46 Other textiles 32 24 43 Aerosol cans 28 14 52 Tin foil 24 16 55 Garden waste for compost 23 15 55 Food waste for compost 22 16 60 Electrical products (e.g. fridges) 13 9 74 Furniture 13 11 72 Batteries 11 11 71
15

Household Waste Behaviour in London 2005 Figure 2.7
Recycling frequency of materials (2001-2005)
0
10
20
30
40
50
60
70
Newspapers Magazines Largecardboard
Light card Glass bottles Food cans Drink cans Plastic drinkbottles
Tin foil Clothing Gardenwaste forcompost
+ all changes 2001-2005 statistically significant; garden waste borderline significant
% c
laim
ing
all
/m
ost
of
tim
e
All / Most of time (2001) All / Most of time (2005)
Increases in claimed recycling have been most spectacular for card, cans and plastic bottles, to the extent that the number of households saying they never recycle these items has halved - fewer than 30% now say they never recycle these items, down from 70-80% in 2001. While this is a positive trend, households are almost certainly over-claiming how much of these materials they actually recycle, given that London’s measured recycling rate is only 17.5%. It is probable that a combination of the Recycle for London campaign and the inclusion of more materials in many kerbside collections has raised awareness of what should be recycled, such that households’ mental maps of recycling have been redefined significantly, but that this latent interest has still to be converted into widespread action. A second possibility is that raised awareness is contributing to contamination in some instances, so that households are setting out these materials in the mistaken belief they can now be recycled everywhere. This cannot be verified for London as a whole but is something that the Boroughs will be able to take a view upon. There also remains room for improvement in relation to other items. Performance of the previously defined ‘model’ materials of paper and glass - while improved overall - showed little change at the highest level of recycling. Those who say they “always” recycle these items showed a barely significant increase - from 42% to 46% for newspapers, from 31% to 35% for glass bottles, and 36% to 43% for magazines. It may be premature to suggest that this represents a ceiling for these particular materials, but a clear priority for the near future will be to turn the large numbers of new Medium recyclers into households that are always recycling ‘easy’ materials rather than occasionally forgetting.
16

Household Waste Behaviour in London 2005 There is also significant potential to increase the capture of green garden and kitchen waste. Again, only a modest increase in claimed recycling was recorded in the 2005 survey10, with half of households with a garden (a majority of the sample) saying that they hardly ever or never recycle garden waste for compost, and only 1 in 3 saying they do this always or most of the time. Our previous research showed that households typically see green waste as environmentally benign because it is bio-degradable, and therefore not really worth recycling. An interest in gardening is generally a stronger motivation for composting than is commitment to recycling.11 Clothing and textiles similarly appear low down the list of regularly recycled items and showed little change since 2001 in the numbers never recycling this item (1 in 3 households). Just over 1 in 3 claim they recycle clothing always/most of the time, slightly ahead of the 1 in 4 who claim they use charity shops for recycling. At the bottom of the recycling hierarchy are a number of items that were added to the 2005 survey to cover bulky, WEEE and hazardous materials. Around three-quarters of households admit they hardly ever/never recycle any of furniture, electricals, or batteries, though around 1 in 8 claim they do so always/most of the time.
2.5 Materials habits of different households Kerbside and non-kerbside households Access to kerbside collections makes a significant difference to levels of recycling by individual households. Those with kerbside collections are 2 to 2½ times more likely to recycle most ‘everyday’ households times all/most of the time than non-kerbside households, and are even more likely than non-kerbside households to recycle furniture, electrical goods and garden waste (more kerbside households have gardens in any case). The roll-out of multi-material kerbside collection over the last few years has certainly contributed to the increase in claimed recycling of cans, card and tins; there are now many more kerbside households and higher proportions of kerbside households are claiming to recycle these materials regularly (all or most of the time) (Figure 2.8). Expansion of recycling collections, however, may not be the only reason for the observed increase. A similar trend (though at lower levels) is apparent for non-kerbside households, where cans, card and plastics have shown the biggest increase of any materials since 2001. 10 Though this may have been affected slightly by seasonality, given that the 2001 survey was conducted in Summer and the 2005 in Winter. 11 Green waste was covered in detail in the 2003 focus groups and 2004 report; research by Peter Tucker at the University of Paisley shows similar findings.
17

Household Waste Behaviour in London 2005 Figure 2.8
"Always" recycle items kerbside & non-kerbside households 2001-2005
0
10
20
30
40
50
60
70
Newsp
aper
s
Mag
azin
es
Glass
bot
tles
Drink
cans
Food
can
s
Heavy
car
d
Garde
n w
aste
for c
ompo
st
Ligh
t car
d
Plas
tic d
rink
bottle
s
Tin
Foil
Newsp
aper
s
Mag
azin
es
Glass
bot
tles
Drink
cans
Food
can
s
Heavy
car
d
Garde
n w
aste
for c
ompo
st
Ligh
t car
d
Plast
ic d
rink
bottle
s
Tin
Foil
% c
laim
ing
recy
cle ite
m a
ll o
f ti
me
2001 2005
Kerbside households
Non-Kerbside households
+
++
++
+
+ + ++ + +
+ significant difference from 2001
The trend for newspapers and glass is slightly more complex. While more households overall are claiming to recycle these items all/most of the time, this has been achieved largely by the extension of collections to more households, rather than an increase in the average frequency at which kerbside households recycle these items. On the whole, it appears that new kerbside recruits are slightly less likely to recycle newspapers all of the time, and no more likely to recycle them most of the time, than kerbside households in 2001 (Figure 2.8). The same is true of glass. These trends add further weight to the idea that household recycling of these materials may be close to a ceiling, with newspapers and magazines stuck at around 75% of kerbside households recycling them all/most of the time, and glass near to 65%. A more optimistic interpretation may argue that these new recruits need more time and, perhaps, encouragement for new habits to become embedded. Similar trends are apparent amongst non-kerbside households, where the claimed propensity to recycle paper and glass regularly has stayed more or less unchanged since 2001, while claimed recycling of cans, card and plastics has increased significantly. High, Medium, Low and Non- recyclers In the previous Household Waste Behaviour research: • Only High recyclers were recycling a range of materials any more often than
occasionally and were confident about which materials they could recycle.
• Medium recyclers were recycling newspapers and magazines most of the time on average, but were recycling glass slightly less often, and claimed to be confused or indifferent about items such as card, other paper and cans.
18
Household Waste Behaviour in London 2005 • Both Medium and High recyclers wanted to recycle plastic, though few were
doing so in 2001 and 2003.
• The recycling activity of Low recyclers was confined largely to occasional recycling of newspapers and donating old clothes to charity.
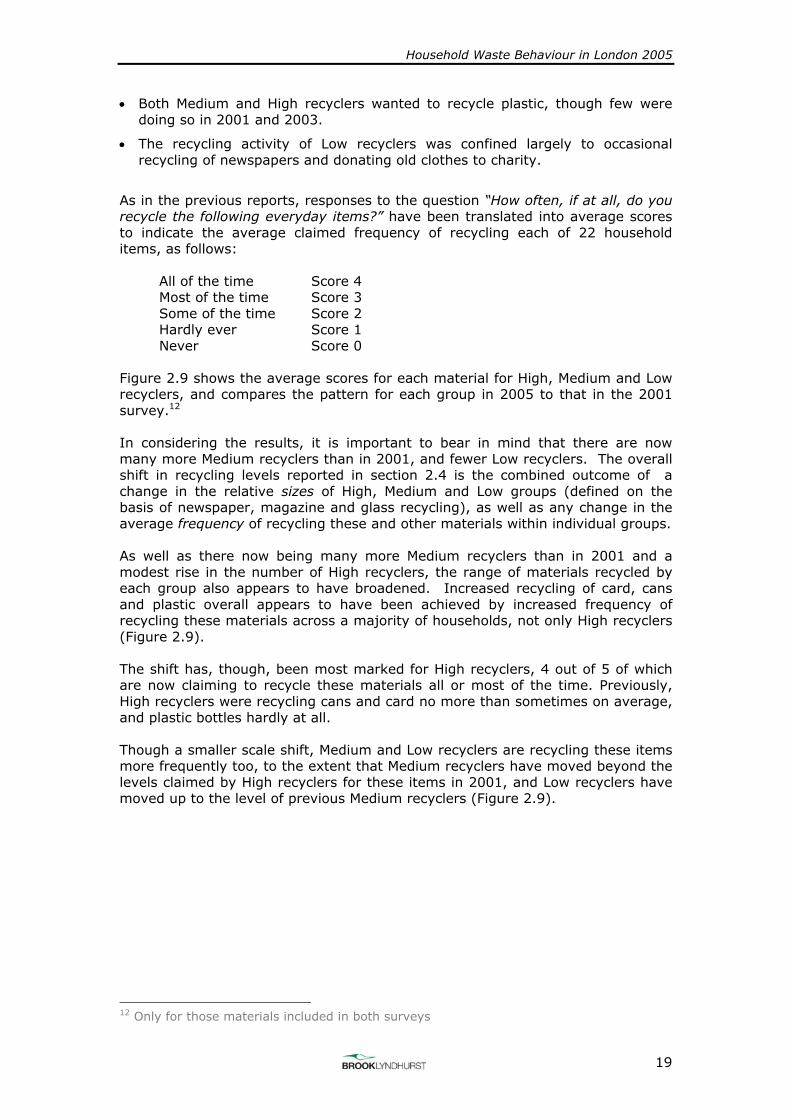
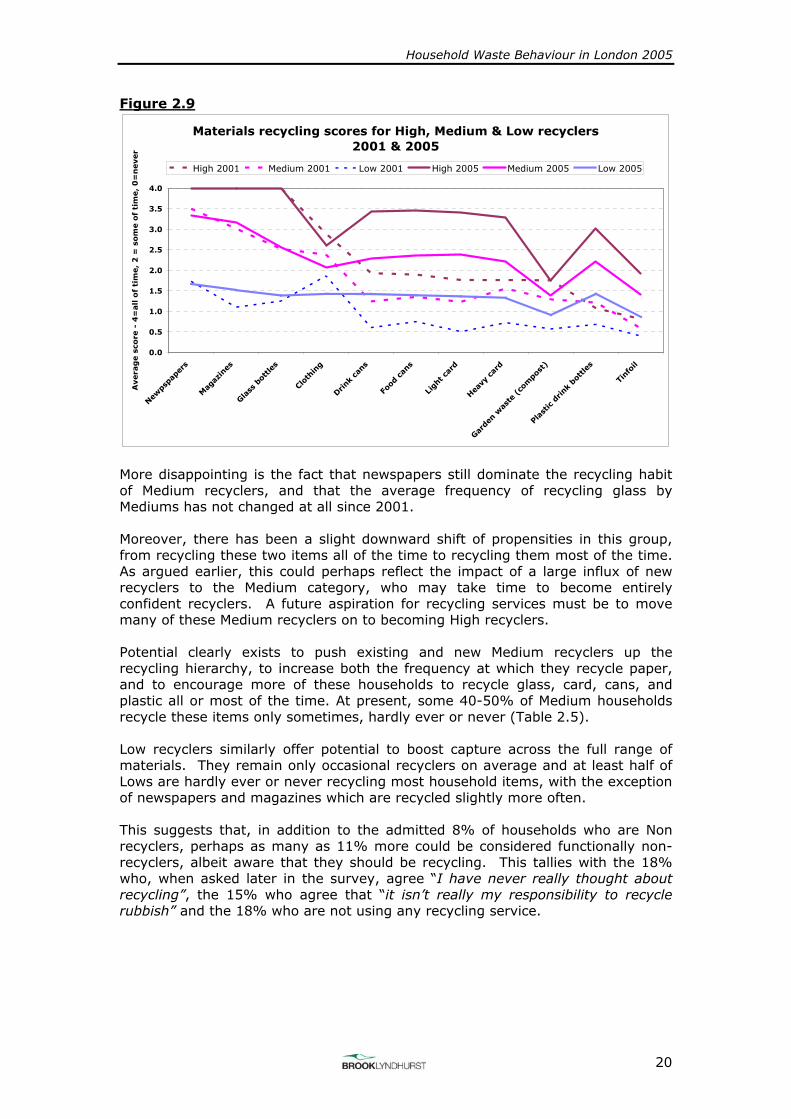
As in the previous reports, responses to the question “How often, if at all, do you recycle the following everyday items?” have been translated into average scores to indicate the average claimed frequency of recycling each of 22 household items, as follows:
All of the time Score 4 Most of the time Score 3 Some of the time Score 2 Hardly ever Score 1 Never Score 0
Figure 2.9 shows the average scores for each material for High, Medium and Low recyclers, and compares the pattern for each group in 2005 to that in the 2001 survey.12 In considering the results, it is important to bear in mind that there are now many more Medium recyclers than in 2001, and fewer Low recyclers. The overall shift in recycling levels reported in section 2.4 is the combined outcome of a change in the relative sizes of High, Medium and Low groups (defined on the basis of newspaper, magazine and glass recycling), as well as any change in the average frequency of recycling these and other materials within individual groups. As well as there now being many more Medium recyclers than in 2001 and a modest rise in the number of High recyclers, the range of materials recycled by each group also appears to have broadened. Increased recycling of card, cans and plastic overall appears to have been achieved by increased frequency of recycling these materials across a majority of households, not only High recyclers (Figure 2.9). The shift has, though, been most marked for High recyclers, 4 out of 5 of which are now claiming to recycle these materials all or most of the time. Previously, High recyclers were recycling cans and card no more than sometimes on average, and plastic bottles hardly at all. Though a smaller scale shift, Medium and Low recyclers are recycling these items more frequently too, to the extent that Medium recyclers have moved beyond the levels claimed by High recyclers for these items in 2001, and Low recyclers have moved up to the level of previous Medium recyclers (Figure 2.9).
12 Only for those materials included in both surveys
19
Household Waste Behaviour in London 2005 Figure 2.9
Materials recycling scores for High, Medium & Low recyclers 2001 & 2005
0.0
0.5
1.0
1.5
2.0
2.5
3.0
3.5
4.0
Newps
pape
rs
Mag
azin
es
Glass
bot
tles
Clot
hing
Drink
cans
Food
can
s
Ligh
t car
d
Heavy
car
d
Garde
n w
aste
(co
mpo
st)
Plas
tic d
rink
bottle
s
Tinf
oil
Avera
ge s
core
- 4
=all o
f ti
me,
2 =
som
e o
f ti
me,
0=
never
High 2001 Medium 2001 Low 2001 High 2005 Medium 2005 Low 2005
More disappointing is the fact that newspapers still dominate the recycling habit of Medium recyclers, and that the average frequency of recycling glass by Mediums has not changed at all since 2001. Moreover, there has been a slight downward shift of propensities in this group, from recycling these two items all of the time to recycling them most of the time. As argued earlier, this could perhaps reflect the impact of a large influx of new recyclers to the Medium category, who may take time to become entirely confident recyclers. A future aspiration for recycling services must be to move many of these Medium recyclers on to becoming High recyclers. Potential clearly exists to push existing and new Medium recyclers up the recycling hierarchy, to increase both the frequency at which they recycle paper, and to encourage more of these households to recycle glass, card, cans, and plastic all or most of the time. At present, some 40-50% of Medium households recycle these items only sometimes, hardly ever or never (Table 2.5). Low recyclers similarly offer potential to boost capture across the full range of materials. They remain only occasional recyclers on average and at least half of Lows are hardly ever or never recycling most household items, with the exception of newspapers and magazines which are recycled slightly more often. This suggests that, in addition to the admitted 8% of households who are Non recyclers, perhaps as many as 11% more could be considered functionally non-recyclers, albeit aware that they should be recycling. This tallies with the 18% who, when asked later in the survey, agree “I have never really thought about recycling”, the 15% who agree that “it isn’t really my responsibility to recycle rubbish” and the 18% who are not using any recycling service.
20

Household Waste Behaviour in London 2005 Table 2.5
Habits of High & Medium recyclers for selected household items
% saying item recycled all/most of the time
Medium recyclers
%
High recyclers
%
Percentage point gap
between High & Medium
Newspapers* 99 100 1
Magazines* 83 100 17
Junk mail 65 87 22
Glass bottles* 60 100 40
Glass jars 59 97 38
Drink cans 52 86 34
Food cans (e.g. baked bean tins)
52 86 34
Light card (e.g. cereal boxes)
52 85 33
Heavy card (e.g. computer packaging)
47 80 33
Plastic drink bottles (e.g. water, milk)
31 47 16
Garden waste for compost
22 39 17
• * imposed as selection criteria – High recyclers defined as households recycling newspapers, magazines and glass bottles “all of the time”
• + all differences significant, except newspapers
Finally, garden (and kitchen) waste appear to present a special case, where more effort is required by all households regardless of their habits for other materials. At present, only 2 in 5 of High recyclers and 1 in 5 of Medium recyclers claim they are ‘recycling’ garden waste for compost all/most of the time.
2.6 Are recycling services being used effectively? Now that a majority of households in London have kerbside recycling collections, maximising the effectiveness of service use should be a future priority. Potential to raise London’s recycling rate lies as much here as in recruiting the last remaining non-participants. The usage pattern of both kerbside collection and the main types of bring site revealed in the survey confirms a suspicion that there are functionally more Non-recyclers than respondents’ own claims about recycling would indicate. Altogether, nearly 1 in 5 (18%) of the 2005 sample are using neither kerbside collection nor local bring sites regularly as compared to only 8% declared non-recyclers (Figure 2.10).
21

Household Waste Behaviour in London 2005 Figure 2.10
Usage pattern of recycling services (whole sample)- kerbside & bring facilities
(communal in flats, on-street, supermarket or HWRC)
Have kerbside - don't use any service
regularly6%
No kerbside - use other13%
Have kerbside - don't use, but use other
5%
Use kerbside only42%
Use kerbside & other22%
No kerbside - don't use other regularly
12%
Kerbside take-up and usage As regards kerbside collections, we have already estimated that 7% of households overall do not appear to know that collections are provided in their area. When added to the 74% of survey respondents who are aware, this suggests that 81% of London’s households have access to kerbside. Use of collections is high amongst those households who are aware the service is provided – 86% who know they have collections also say they use them. However, if all non-users are included (those who appear unaware that the service exists as well as those who know collections are available), then the average usage rate of kerbside collection falls to 80%.13. Put simply, this means that around 1 in 5 households provided with a kerbside service are not using it. In addition, some households who have kerbside collections are using them ineffectively. Of those who are aware that kerbside is provided, 1 in 5 (20%) are classified as Low/Non recyclers. This is, however, an improvement on 2001 when nearly 1 in 3 kerbside households were classified as Low and Non recyclers. The data can be used to infer a profile of ‘recycling effectiveness’ all London’s households, shown in Table 2.6. It appears that kerbside is being used moderately effectively, but there is still considerable scope both to engage first-time participants and to increase materials capture from Low and Medium recyclers.
13 Where usage rate = households using/households provided
22

Household Waste Behaviour in London 2005 Table 2.6 Effectiveness profile of London’s Households
Effectiveness profile of London's households
% Do not have kerbside collection 19 Have kerbside collection 81 of which: Unaware have kerbside* 7 Do not use 11 Use: Low recycler 10 Use: Medium recycler 29 Use: High recycler 24 NB estimated, not direct from survey, see footnote 3
Usage across household types The following analysis is based on those households who are aware of kerbside collections, as reported directly in the survey. The usage pattern of kerbside collections varies only moderately across household types. If households have kerbside collections then typically 80%-90% claim to use them across all ages, social classes and ethnicities (albeit some are Low recyclers). In particular - and in contrast to their lower average recycling rates overall - lower social class DE households appear to use kerbside services as much as other social groups when given the opportunity. Figure 2.11
Usage of kerbside collections
0%
10%
20%
30%
40%
50%
60%
70%
80%
90%
100%
White Black Asian AB C1 C2 DE 16-24 25-34 35-44 45-54 55-64 65+ Highriseflat
Lowriseflat
House
+ significant difference
% t
hose
wit
h k
erb
sid
e w
ho u
se it
Kerbside usage of group Average usage - total sample
++
+
23

Household Waste Behaviour in London 2005 Apparent usage rates of kerbside are, though, much lower for households living in flats than in houses, especially for high rise flats which have the lowest take-up of kerbside of any group. This is mirrored by higher usage rates in owner occupied than rented property. Usage of kerbside is also slightly below average for younger and Black households, and those aged 55-64 (who are more skewed to White and DE households than the sample overall). A further key difference in usage is apparent by length of residency – an average usage rate of 89% for households living in their current area for more than 3 years falls to 78% for those who have moved in within the last 1-2 years. This finding lends some support to the theme identified in the 2003 focus groups that mobile households may miss out on essential recycling information, may not have a container and, having missed the initial introduction of the service, be too passive to make the effort to contact their local authority. Kerbside materials coverage In addition to those who are not using kerbside services at all are those who either use the service only sporadically, or restrict their recycling to what is collected. Claimed recycling of newspapers (i.e. the most commonly collected material) provides an indicator of ineffective usage. In the 2005 survey, three-quarters of kerbside households claim they recycle newspapers all/most of the time, leaving a quarter who say they are only participating occasionally or less often. This means that, on top of the 14% admitted non-users of kerbside, perhaps up to a further 11% are either using kerbside collection only occasionally or over-claiming that they use it at all. Regular recycling of magazines is at a similar level to newspapers amongst kerbside households but falls to 65% for junk mail and glass. Between 50% and 60% of kerbside households also claim to recycle cans, card and plastic all or most of the time, reflecting the fact that there are still some service gaps for materials, even though all kerbside households can now recycle at least three materials14. At present, just under 1 in 3 kerbside households are using other bring facilities as well as their kerbside collections, while more than half (56%) rely entirely on their collections. The passivity of kerbside households is further indicated in the 43% of kerbside households who agree that “the Council doesn’t collect all the things I want to recycle” and the 25% who agree that “I‘m too busy to make special trips to recycling banks”. The previous research suggested that what many kerbside households identify as ‘recyclable’ is defined by what is collected and this appears to continue to hold true for many. Other bring recycling facilities 2 in 5 (40%) households use bring facilities15, including both kerbside and non-kerbside households.
14 Source: GLA 15 Local on-street banks, communal facilities in flats, supermarket sites or HWRCs
24

Household Waste Behaviour in London 2005 Just over half (52%) of non-kerbside households use at least one mainstream type of bring facility, and this rises to 63% using any facility, including charity shops, compost bins and newspaper recycling bins at Tube stations. This leaves, though, more than 1 in 3 non-kerbside households using no facility at all (Figure 2.11). Figure 2.12
Use of recycling facilities other than kerbside collections
0 5 10 15 20 25 30 35
Charity shops
Local bring banks
Supermarket sites
HWRC
Communal facilities in flats
Newspaper banks outsideTube
Free/subsidised compost bins
None
Don't know
% of household type saying they use facility
Kerbside households Non-kerbside households
+
+
+
+
+
+ significant difference from kerbside HH
A majority of these non-kerbside, non-user households say there are no facilities locally or they are unaware of any, though there are, in addition, a small number who know about local facilities but choose not use them. Communal recycling banks in flats heads the list of facilities used by non-kerbside households, with 29% claiming to recycle via this route. This is, in fact, the only service which non-kerbside households are significantly more likely to use than other households. Communal facilities in flats also have the highest awareness-usage ratios16, with some 4 out of 5 non-kerbside households who say the facility is available claiming also to use it. This still leaves, though, 17% of non-kerbside households who are not using the communal recycling facilities which they know are available (which is a similar ratio to those who do not use kerbside collection when it is provided). Numbers using other bring facilities are lower, with each of local bring banks, supermarket sites and HWRCs being used by only 12-13% of households on average. Only minor differences are apparent between kerbside and non-kerbside households in their usage of supermarket and on-street bring sites; but usage of HWRCs is notably higher amongst kerbside households (who are also more likely to have a car).
16 Awareness-usage ratio = the number of users as a proportion of those saying thethe facililty is available locally.
25

Household Waste Behaviour in London 2005
3 ATTITUDES, BARRIERS AND INCENTIVES
3.1 Reasons for recycling more Across the sample as a whole, half say they are recycling more than they did 2-3 years ago. This is many more than the 40% who claimed the same in the 2001 survey. Around 1 in 3 (34%) say their level of recycling has not changed, while 9% say they are doing less. Households who claim they are now recycling more were asked, without prompting, to say why they started to do so. By far the most common responses relate to improvements to recycling services or facilities (57% of all reasons mentioned), with advertising/promotion and lifestyle changes far less important (24% and 19% of reasons given). Figure 3.1
Why did you start to recycle more?
0 5 10 15 20 25 30 35 40 45
Kerbside collections started
More interested in environmental issues
New materials added to existing kerbside collection
Council started collecting green/garden waste for recycling
New recycling banks on streets
Leaflets through my door
Council newsletters
Found new facilities that I wasn't aware of
TV advertising
New recycling facilities for flat or estate
Improved reliability of service
Council started collecting kitchen waste
Adverts in magazines/local newspapers
Council changed from recycling boxes to bags
Radio advertising
Got more space to restore recyclables
Door stepping by the council
Moved into a new house
Persuaded by family, friends and neighbours
Started a family
Moved into a new area with facilities
Posters on bus stops, buses and the tube
Other
% stating reason (unprompted)
Of all the reasons for recycling more, introduction of kerbside collections is by some margin the most significant, cited by 40% of households. Apart from households living in flats and non-kerbside households, this is the most often cited reason for recycling more across all socio-demographic groups. Introduction of kerbside recycling appears to have been especially significant for Medium recyclers, with more than twice as many of them mentioning this as any other reason for doing more. Extending the range of materials in collections appears slightly more important to High recyclers than Mediums, though introduction of kerbside collections nonetheless tops the list of reasons for recycling more by Highs. Across the sample as a whole, 22% cited addition of new materials to collections as a prompt to recycle more. Not far behind is the introduction of green waste collections, cited by 20% of households. This is slightly surprising given that the numbers claiming they recycle garden waste for compost have not changed since the 2001 survey.
26

Household Waste Behaviour in London 2005 The principal reasons why non-kerbside households are recycling more include an increased interest in environmental and recycling issues (27%) together with new recycling banks on street, new facilities on estates, and finding out about facilities not previously known about (all cited by 21% of non-kerbside households). For households in high rise flats, introduction of new facilities on estates is second only to increased interest in environmental issues as a reason for recycling more. Across all household types, advertising and promotion follow behind service improvements as reasons for recycling more, with leaflets ranking higher than other kinds of media. Recall of TV and poster advertising is, though, higher when respondents are prompted in a later question about information they have seen (see Section 4). TV advertising is, nonetheless, in the top 10 unprompted reasons for increasing recycling, and ranked only slightly lower than leaflets and newsletters (Figure 3.1). On the basis of these initial spontaneous responses, advertising and promotion appears to have been slightly more persuasive to C2 households and those aged 35-44, though is cited by only by 1 in 5 of these households, and well behind the introduction of kerbside collections as a reason for recycling more.
3.2 Change in underlying beliefs, attitudes and motivations As in 2001, the 2005 survey asked respondents about the extent to which they agree or disagree with a battery of attitude statements which relate to recycling motivations – covering how easy it is to recycle; feelings about services; and individuals’ beliefs about personal responsibility, trust in local councils, and the power of individual action. Here we consider, first, headline changes in attitudes overall, then look in more detail at the pattern of attitudes across different household types, including High, Medium and Low recyclers. Headline changes 2001-2005 The previous research, in particular the focus groups in 2003, showed that the motivation to recycle involves a complex bundle of personal interest in recycling, confidence, and convenience, which varies across household types and is influenced by living circumstances and availability of services. Perceived effort was identified as one of the principal barriers to engagement with recycling, and kerbside collection was described as ‘the path of least resistance’ to overcome most households’ low inconvenience thresholds. For some of the less committed, lack of kerbside provision was a further signal of unfair treatment by their local authority and a reason to resist entreaties to make an effort to recycle. The most resistant households did not believe that recycling was their responsibility, or that their council has a right to tell them to recycle. Other barriers identified in the earlier research included: • Recognition – many materials are not ‘front of mind’ for many households
because they are not collected in kerbside services or there are no obviously visible local recycling banks.
• Lack of confidence and confusion – especially in relation to what is included in kerbside collections and the ‘rules’ for participation (e.g. “wash & squash”).
27

Household Waste Behaviour in London 2005 • Hassle and yuck factors – particularly in relation to washing recyclables.
• Disinterest, low awareness and drop-out from kerbside collections, sometimes triggered if services are interrupted or individuals move house.
• Storage – both the actual amount of space required and willingness for recyclables to take up space at home whatever the amount of space available.
• Issues relating to multi-material recycling – which create more extensive storage demands and require new habits for remembering and processing everyday items.
While the new survey does not cover these issues in the depth in which they were explored in the previous focus groups, it does throw light upon the motivations and barriers identified before. Comparing the 2001 and 2005 survey results, it is notable how little most attitudes have shifted, even though levels of participation have clearly risen significantly (Figures 3.2 and 3.3). There is one area, however, where attitudes have changed substantially, and this is related to the ease of recycling. Whereas in 2001, a minority of 38% of households agreed that “recycling fits easily into my everyday routine”, this had risen to a sizeable majority of 60% in the 2005 survey. Such a shift is testament to the impact of more widespread kerbside collections on overcoming the effort-inconvenience barrier. Figure 3.2
Recycling attitudes - ease of recycling
0
10
20
30
40
50
60
70
80
I know whereto find recyclingbanks if I want
to
Recycling fitseasily into my
everydayroutine
I find it easy toremember to
recycle
It is easy toknow what canand cannot be
recycled
The Councildoesn’t collectall the things Iwant to recycle
There is notenough space in
my home toseparate myrubbish into
recyclable andnon-recyclable
things
I’m too busy tomake special
trips torecycling banks
+ statistically significant difference 2001-2005
% a
gre
e
Agree 2001 Agree 2005
+ + +
+
+ +
Similarly, and also attributable to increased coverage of kerbside collections, those agreeing that “the Council doesn’t collect all the things I want to recycle” fell from 60% in 2001 to 40% in 2005.
28

Household Waste Behaviour in London 2005 More convenient recycling also appears to have triggered an increase in households’ confidence that they can reduce the amount of rubbish they make (with under 30% now agreeing that it is not possible) and that it is fair to be told to recycle. There remain, however, 1 in 5 households who think that “the Council does not have the right to tell me to recycle”.17 Figure 3.3
Recycling attitudes - beliefs & motivations
0
10
20
30
40
50
60
70
I would makemore effort to
recycle if Icould be sure itwas making a
difference
It’s not possiblefor me or myfamily to cutdown on theamount ofrubbish we
make
I don’t believethe Council
actually doesrecycle all of
the itemscollected for
recycling
The Councildoes not havethe right to tellme to recycle
I have neverreally thought
about doing anyrecycling
There isn’tmuch that
ordinary peoplecan do to help
protect theenvironment
It isn’t reallymy
responsibility torecycle rubbish
+ statistically significant difference 2001-2005
% a
gre
e
Agree 2001 Agree 2005
+
+
++ +
The proportion now saying they are too busy to make trips to recycling banks has also fallen significantly, perhaps because many respondents no longer have to use bring banks to recycle and it has therefore dropped down their list of concerns. Less encouragingly, little change has occurred in the number of households claiming that “it is easy to know what can and cannot be recycled”. Overall, only half of all households are clearly confident that they know what to recycle, while 1 in 5 kerbside and 1 in 3 non-kerbside households actively disagree that they know what to recycle. This is, perhaps, surprising against the background of apparently increased recycling of a much wider range of materials reported above; but it may also help to explain why items such as junk mail and food packaging card are still recycled less often than newspapers by kerbside households. Similarly, the number who actively disagree that they know where to find recycling banks if they need to has not improved; and under half (46%) of the households that need them the most (i.e. non-kerbside) agree that they do know where to find recycling banks.
17 Attitudes to compulsion and incentives are also considered in Section 3.4.
29

Household Waste Behaviour in London 2005 There has been little movement too in the numbers of households who agree either: that they have never really thought about recycling; that it isn’t really their responsibility to recycle rubbish; or to disagree that there isn’t much that ordinary people can do to protect the environment. This static trend is in spite of an apparent fall in the number of Non recyclers (based on claimed participation), and adds weight to the suggestion that the real share of disinterested households is more realistically double the 8% who are happy to admit they are Non-recyclers. Attitudes and motivations across household types A number of interesting differences in attitudes and barriers are apparent across household types, which can be summarised as follows: Social class – while there is little difference between households of different social class in how easy they find it to fit recycling into daily routines, or how busy they are to use bring sites, middle class households are typically more confident on average about what to recycle and remembering to recycle than C2DE households. They also typically have higher levels of confidence and trust in local recycling services and councils. Age – younger households (typically under 35s) are more likely than average to find recycling difficult to fit into their lives – in terms of space for storage (more live in flats), being too busy or able to accommodate recycling in daily life, and being able to remember to recycle. The over 45s are generally more confident and able to fit in recycling than younger households, but generally feel more concerned about making a difference, being able to cut down on the rubbish they make, and whether the Council collects all that they would like to recycle. Issues of trust and responsibility vary little across the age spectrum. Housing situation – some of the most marked differences are between those who live and flats and those living in houses (which is also closely related to differences in kerbside provision). Households in flats appear to experience much greater barriers to recycling across a wide spectrum of issues than do households in houses. They typically have less confidence about what or where to recycle, trust in services and councils, less belief in personal responsibility and the power to make a difference, have less space for storage and find recycling less easy to fit into daily routines. The way in which these socio-demographic bundles of motivations and barriers combine is reflected in the pattern of attitudes across High, Medium, Low and Non recyclers – where High and Medium recyclers are typically over 35, middle class and living in houses, and Low and Non recyclers are generally less middle class and with a majority living in flats, and most Non recyclers aged under 35. Feelings about how easy it is to recycle A majority of High and Medium recyclers find it easy to fit recycling into their daily routine. In contrast, only a minority of Low recyclers agree and, on balance, Non recyclers disagree this is the case (Figure 3.4). The views of Non-recyclers on this topic did not change between 2001 and 2005, though Medium and Low recyclers became much more positive, to the extent that an overall negative sentiment for Low recyclers in 2001 was wiped out in 2005.
30

Household Waste Behaviour in London 2005 A majority of High and Medium recyclers similarly find it easy to remember to recycle and to know what to recycle, whereas Low recyclers are neutral on balance and Non recyclers disagree. Views on knowing what to recycle have become more polarised since 2001, with High recyclers gaining in confidence, more Non-recyclers disagreeing, and little change in the proportions of Low and Medium recyclers who agree they know what to do. Just half of Medium recyclers agree they know what to recycle and this falls to just over a third of Low recyclers (37%). This last feature points to Medium and Low recyclers continuing to be a target for promotional effort. Non recyclers continue to believe they are too busy, that recycling is too much hassle and that they do not have enough space at home to recycle. This last attitude has become more pronounced among Non-recyclers since 2001, reflecting the fact that the remaining rump of Non-recyclers are now much more likely to live in flats than the Non-recycler group in 2001. A sizeable portion of Low and Medium recyclers – around 1 in 3 – also share these views. Figure 3.4
Feelings about how easy it is to recycle
0
10
20
30
40
50
60
70
80
90
100
Recycling fitseasily into my
everydayroutine
Easy toremember to
recycle
Easy to knowwhat can and
can't berecycled
Not enoughspace in my
home
Too muchhassle to wash
up items
Too busy tomake special
trips torecycling
banks
% a
gre
ein
g w
ith
sta
tem
en
t
High Medium Low Non
Feelings about services One of the remaining barriers for High and Medium recyclers is the range of materials accepted in their kerbside collections. While the percentages agreeing this is true have fallen substantially since 2001, this factor remains a concern for nearly half of High recyclers and 44% of Medium recyclers. The earlier discussion suggested that many of these households remain passive users of services and will only recycle more if it is collected from home (Figure 3.5).
31

Household Waste Behaviour in London 2005 Figure 3.5
Feelings about services
0
10
20
30
40
50
60
70
80
90
100
I know where to findrecycling banks if I
want to
Council doesnt collectall the things I want to
recycle
Recycling facilities toofar from my home
Can't recycle because Idon't have kerbside
collection
% a
gre
ein
g w
ith
sta
tem
en
t
High Medium Low Non
Non-recyclers by contrast appear most constrained by not having an existing kerbside service, with half claiming they can’t recycle because they do not have a collection. This factor is less prevalent amongst Low recyclers but is still important for a minority of these households (1 in 6 Lows). Non – and Low – recyclers also appear relatively constrained by lack of knowledge about where to find bring banks (Figure 3.5). Beliefs and motivations The remaining few Non-recyclers in 2005 are now much more clearly disinterested in recycling than were Non-recyclers in 2001. Half now agree that they have never really thought about recycling, nearly 2 in 5 say it is not really their responsibility to recycle, and 1 in 3 do not think they should be told to recycle. These views are in-line with other characteristics of Non-recyclers revealed in the survey – for instance their apparent disinterest in the existence of services (see Section 2.3). At the other end of the spectrum, the vast majority of High recyclers feel responsible, able to make a difference, and trust councils and services. In common with Medium recyclers, knowing that they are making a difference appears to be more important to High recyclers. Across most attitudes relating to personal beliefs and values, Low recyclers have moved closer to Medium recyclers since 2001 and, in particular, are now persuaded on balance that they can cut down on the rubbish they make, whereas previously they were neutral. A majority of Low recyclers though (along with a sizeable minority of Mediums), still need to be persuaded that recycling is convenient, easy, low hassle and straightforward.
32

Household Waste Behaviour in London 2005 Figure 3.6
Beliefs and motivations
0
10
20
30
40
50
60
70
I'd make moreeffort if I couldbe sure it was
making adifference
Not possible forme to cut downon rubbish we
make
Don't believe thecouncil recycles
everything
Council doesn'thave right to tell
me to recycle
More damage iscaused by
transportingrecyclables
Not muchordinary people
can do to protectthe environment
I've never reallythought about
doing anyrecycling
Not really myresponsibility torecycle rubbish
% a
gre
ein
g w
ith
sta
tem
en
t
High Medium Low Non
3.3 Further changes to services to help households recycle more New in the 2005 survey, respondents were asked directly what more could be done to help them recycle, choosing their top three or four preferences from a list of 17 options. Encouragingly, only 5% consider that nothing can be done to persuade them to recycle more and a further 2% don’t know. These resistant households are spread right across the socio-demographic spectrum with no significant differences between household types, except for Medium and Low recyclers who are less likely than Highs or Nons to say they won’t do more. Whereas introduction of kerbside collection was the leading reason for households to increase their recycling between 2001 and 2005, the most desired option now is extending the range of materials collected, especially by High and Medium recyclers. This is followed closely by providing clearer instructions on what can/can’t be included in collections (Table 3.1). In fact, the top four rated options all relate to making kerbside collection easier and better.
33

Household Waste Behaviour in London 2005 Table 3.1
Help wanted to recycle more. Which three or four of the following, if any, would encourage you to recycle more
often or to recycle more things? High
% Med %
Low %
Non %
All %
Take more types of materials/items in my kerbside collection
48 44 36 11 40
Provide clearer instructions on what can/can’t be included in kerbside recycling collections
31 32 29 24 31
Be allowed to put all materials in same box/bag – not have to keep materials separate
27 30 27 16 26
Make doorstep/kerbside collection service more reliable
25 26 29 15 25
Introduce kerbside/doorstep collection – don’t have one at present
15 22 24 42 23
Provide recycling banks nearer to my home 21 23 24 20 23 More information 17 21 23 28 21 Provide recycling banks for more kinds of material/items
18 22 15 9 19
Regular reminders to recycle 14 9 12 16 12 Financial rewards for recycling 12 11 17 10 12 Make recycling banks cleaner 7 12 16 3 11 Empty recycling banks more often 12 14 9 1 11 Improve safety and security of recycling banks
12 10 11 6 11
Have local recycling wardens/’champions’ 5 6 5 4 6 If more people in my street recycle 4 3 4 5 4 Personal visit from somebody to explain about recycling
2 5 4 5 4
Nothing can encourage me to recycle more 7 3 4 12 5 Don’t know 2 2 2 4 2
Introduction of kerbside collections is not surprisingly, though, the help most desired by current non-kerbside households, supported by more information and instructions on what to recycle. Reflecting the present gaps in kerbside coverage, this option is also rated higher than average by households in flats (30% of these households compared to 23% on average), DE households (31%), recent in-movers (30%) and by Non-recyclers (42%). Fewer households (including those without kerbside collection) see new bring banks as the means to them recycling more, with around 1 in 5 mentioning banks nearer to home or for more materials, and 1 in 10 mentioning improvements to the quality and safety of bring banks. Improving cleanliness is of greater concern to households living in high rise flats, who are currently more reliant on these services. A sizeable minority of households still claim that they need more information to help them recycle, with specific instructions rated above “more information” in general. Direct help, such as wardens or doorstepping, is rated by very few households (5%). “More information” is rated relatively more often by skilled working class households, social renters, and Non-recyclers.
34

Household Waste Behaviour in London 2005 Though a minority concern, 1 in 10 households put financial incentives in their top 4 four most wanted options. The share of households mentioning incentives varies little across age, social class or housing situation, but Asian households are much more likely than any others to favour incentives.
3.4 Attitudes to compulsion and financial incentives Attitudes to incentives and charging were explored in more detail by asking respondents the extent to which they agree or disagree with a range of statements on the subject. The 2005 survey used the same statements as in 2001, with the addition of a question on whether recycling should be compulsory or not. Of all the suggested policy interventions, there is most support for making recycling compulsory, by a slim majority of 53%. A quarter of households, however, actively disagree with this view (Figure 3.7). Support for compulsion is strongest amongst those who are already recycling consistently – High and Medium recyclers - and respondents aged 25-54, middle class households, those with kerbside collection and long term residents in houses. Support is weakest amongst older households, Black households, those in low rise flats and social rented accommodation, and households without kerbside collection. On balance, (the ‘agrees’ minus ‘disagrees’) Non-recyclers are opposed to compulsion by a large margin, while Low recyclers are only just positive. This contrasts to the strong support from High and Medium recyclers (Figure 3.8). Figure 3.7
Attitudes to compulsion & financial incentives
0
10
20
30
40
50
60
Recycling shouldbe compulsory
People need afinancial
incentive tomake themcreate lessrubbish andrecycle more
People wouldrecycle more ifthey had to pay
per bin or bag forordinary rubbishto be collected
The Councilsaves moneyfrom people
recycling
It is fair tocharge people
according to theamount of
rubbish theyproduce
Charging per binor bag is betterthan the currentsystem of paying
for rubbishcollection in the
Council Tax
+ statistically significant difference 2001-2005
% a
gre
e
Agree 2001 Agree 2005
+
35
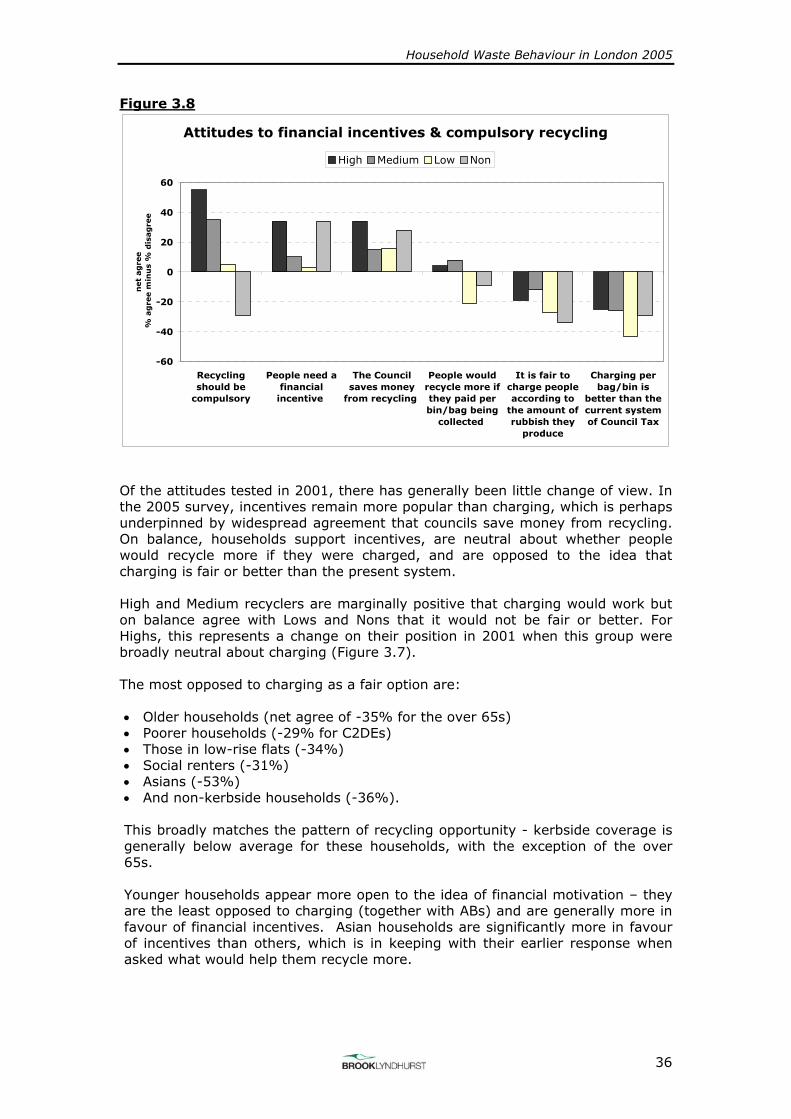
Household Waste Behaviour in London 2005 Figure 3.8
Attitudes to financial incentives & compulsory recycling
-60
-40
-20
0
20
40
60
Recyclingshould be
compulsory
People need afinancial
incentive
The Councilsaves money
from recycling
People wouldrecycle more ifthey paid perbin/bag being
collected
It is fair tocharge peopleaccording to
the amount ofrubbish they
produce
Charging perbag/bin is
better than thecurrent systemof Council Tax
net
ag
ree
% a
gre
e m
inu
s %
dis
ag
ree
High Medium Low Non
Of the attitudes tested in 2001, there has generally been little change of view. In the 2005 survey, incentives remain more popular than charging, which is perhaps underpinned by widespread agreement that councils save money from recycling. On balance, households support incentives, are neutral about whether people would recycle more if they were charged, and are opposed to the idea that charging is fair or better than the present system. High and Medium recyclers are marginally positive that charging would work but on balance agree with Lows and Nons that it would not be fair or better. For Highs, this represents a change on their position in 2001 when this group were broadly neutral about charging (Figure 3.7). The most opposed to charging as a fair option are: • Older households (net agree of -35% for the over 65s) • Poorer households (-29% for C2DEs) • Those in low-rise flats (-34%) • Social renters (-31%) • Asians (-53%) • And non-kerbside households (-36%). This broadly matches the pattern of recycling opportunity - kerbside coverage is generally below average for these households, with the exception of the over 65s. Younger households appear more open to the idea of financial motivation – they are the least opposed to charging (together with ABs) and are generally more in favour of financial incentives. Asian households are significantly more in favour of incentives than others, which is in keeping with their earlier response when asked what would help them recycle more.
36

Household Waste Behaviour in London 2005
4 INFORMATION AND COMMUNICATIONS New questions were added to the 2005 survey to explore households’ claimed exposure to information on recycling. Questions were designed to provide a general overview about information from all sources, rather than to capture data specifically relating to the Recycle for London campaign, which is covered in the NOP campaign evaluation surveys.
4.1 How well informed are households about recycling? Households seem to be well informed about recycling, with 62% claiming they have received some sort of information on recycling in the last year. Most of the remaining households claim they have never had any information (17%), or they don’t know when they last received any (14%). The pattern of those who claim they have never received any information is close to opposite the pattern of recycling participation – so that younger, less well off, minority ethnic, non-kerbside households and those in flats (especially low-rise) and rented accommodation are more likely than others to say they have never received any information. A further notable feature is the relatively high number of recent in-movers who say they have not had recycling information (Figures 4.1 and 4.2). Figure 4.1
"I have never received any information on recycling" by demographic group
0%
5%
10%
15%
20%
25%
30%
All 16-24 25-34 35-44 45-54 55-64 65+ AB C1 C2 DE White Black Asian
+ significant difference
% o
f each
gro
up
++
+
+
While it would be tempting to say that there is therefore a direct relationship between information and recycling participation, the previous focus group discussions showed that the relationship is not so straightforward. The earlier research suggested that “lack of information” is often used as an excuse by those who are generally disinterested in recycling in any case. The issue is then not only about providing information in any form, but also about finding ways to ensure that less interested households are exposed to it. Disinterest is, possibly, signalled in the 2005 survey by the fact that a very large majority of Non-recyclers – 4 in 5 – say they have never received information or
37

Household Waste Behaviour in London 2005 don’t know when they did. This is several orders of magnitude greater than for any of Low, Medium or High recyclers. This pattern mirrors claimed knowledge about local services shown in earlier questions. Figure 4.2
" I have never received any information on recycling" by household situation & recycling commitment
0
10
20
30
40
50
60
All
Flat
-hig
h ris
e
Flat
-low
rise
Any h
ouse
Privat
ely
owne
d
Rente
d-an
y
1-2
yrs in
loca
l are
a
3+ y
rs in
loca
l are
a
Kerbs
ide
Non-k
erbs
ide
High
Med
ium
Low
Non
+ significant difference
% in
each
gro
up
+
++
+
+
+
+
+
+
+
4.2 Perceptions about sources and channels of information Organisations Respondents were asked (prompted) which organisations have provided them with recycling information and through which kinds of media. This was asked of all households, not only those who said they had received information.18 Local councils are the primary source of information across all types of household - three times as many households mentioned the local council as any other source. The number naming the local council also rose slightly between 2001 and 2005 (Figure 4.3). While councils are the dominant source for everyone, the numbers claiming to have received information via this source vary significantly across household types, largely matching the pattern described above for information as a whole. Key axes of difference are: • Households in flats – especially high rise – as opposed to houses (56% of high
rise naming the local council, 61% for low rise and 73% for houses);
• Private and social renters versus owner occupiers (55% and 60% against 76%);
• White more than Black households;
• Kerbside households versus non-kerbside (75% against 46%);
18 The number saying “none of these” differs slightly lower from the number saying they have never received information – 14% and 17% respectively.
38

Household Waste Behaviour in London 2005 • Recent in-movers (in the last 1-2 years) less so than longer established
residents. Significant age and social class gradients are also apparent, with mention of the local council rising with age and towards higher social classes. Figure 4.3
Who provided recycling information in the past (2001-2005)
0 10 20 30 40 50 60 70 8
Local council
Environmental organisations
Supermarket
Family, friends or neighbours
Mayor of London
National government
My children/children's school
My work/employment
Community groups
% of total sample
0
2001 2005
NB: questions were asked slightly differently in 2001 & 2005 so statistical significance is not shown
The only other sources mentioned by more than 1 in 10 households were environmental organisations and supermarkets. While the Mayor of London is mentioned by under 10%, young people (under 35s) are much more likely to mention the Mayor than older households (55+). Lower social class DE households are significantly less aware of information from this source than middle class (ABC1) households. Media When asked how households have received recycling information in the past, council communications unsurprisingly top the list (Figure 4.4). Some 2 in 3 households say they have received a council recycling leaflet, and just under 1 in 3 say they have obtained recycling information from council newsletters. The pattern of exposure across socio-demographic groups follows that described above for local councils. TV advertising is the third principal means by which households say they have received information, mentioned by 27% of households (up from 20% in 2001). Above average shares of younger, skilled working class, and minority ethnic households say they have seen TV advertising, and awareness is also higher amongst kerbside than non-kerbside households (Figure 4.5).
39

Household Waste Behaviour in London 2005 Figure 4.4
How recyclers have/would like to obtain recycling information
0 10 20 30 40 50 60
Leaflets from council
Leaflets from other organisations
Local council newsletters
Council door steppers
TV adverts
Radio adverts
Posters on London transport
Adverts in magazines/newspapers
News bulletins on TV or radio
Website
Text/SMS
Telephone helpline
E-mails
70
Past Future
Radio, poster and magazine advertising have also had some impact with 33% altogether having seen these media (9-17% for any one source). Awareness is above average amongst younger people (under 25s), but is similar across all social classes except for DE households where awareness is lower, particularly for radio. Awareness of magazine advertising is slightly higher among 35-44 year olds, long term settled households (resident 6+ years) and kerbside recyclers. As was the case for information sources, awareness of advertising through almost all media is significantly lower amongst Non recyclers than Lows, Mediums and Highs. New ICT based media, such as texting and websites, are mentioned by only very few respondents as channels for recycling information. Elsewhere in the survey, though, respondents were asked if they use internet sites to dispose of items for recycling (eBay and Freecycle were given as examples) and 17% claimed that they do. Claimed use of these services follows the socio-demographic pattern of internet use generally, with younger middle class households most likely to use them. Households’ preferences for receiving information through different media in future follow closely the pattern of past experience. TV advertising is the notable exception, which more households (35%) would like to see. Overall, Council communications still top households’ future wish list, more so leaflets than newsletters, which appeal most to the over 65s.
40

Household Waste Behaviour in London 2005 Figure 4.5
Top 3 methods for receiving recycling information (past and future)
0
10
20
30
40
50
60
70
80
All 16-24 25-34 35-44 45-54 55-64 65+ AB C1 C2 DE White Black Asian
% o
f each
gro
up
Leaflets from council (past) Local council newsletters (past) TV adverts (past)Leaflets from council (future) Local council newsletters (future) TV adverts (future)
4.3 Where are the information gaps? Respondents were asked, from a prompted list, which three things they would like to know more about. Understandably, information on what facilities are available in the local area is the top priority for non-kerbside households; knowing where, and how to recycle, different materials are the main concerns of kerbside households. These households are also more interested in why some things can’t be recycled, and where recycling ends up, than are non-kerbside households. Overall, leading preferences relate to “how to” information about where and how to use services (Figure 4.6). The fact that information about what can and can’t be put in kerbside collections appears in the top 3 preferences matches the lack of confidence on this issue revealed by earlier attitude questions. Households appear to care less about what happens if they get it wrong, however, with this appearing in the bottom three preferences. Households are less interested in information relating to the purpose behind recycling than service information. Of these ‘purpose’ reasons, “where recycling ends up” appears slightly ahead of “what materials are made into”. Households who are already recycling are more interested in this latter feature than households who are not recycling (Figure 4.7).
41

Household Waste Behaviour in London 2005 Figure 4.6
'Which three things would you like to know more about?'
0 5 10 15 20 25 30 35
Recycling services/facilities in my area
Where to recycle specific materials
What can and can't be put in kerbside collections
Where my recycling ends up
Why some things cannot be recycled
How my recycling makes a difference
What products my recycling gets made into
What happens if the wrong things are put in the recycling
Whether recycling is environmentally friendly
What plans there are to improve recycling rates/services
Other
None
Figure 4.7
"Which 3 things would you like to know more about?"
0
5
10
15
20
25
30
35
40
45
Recyc
ling
serv
ices
/fac
ilitie
s in
my
area
Whe
re to
recy
cle
spec
ific m
ater
ials
Wha
t can
and
can
't be
put
in k
erbs
ide
colle
ct...
Whe
re m
y re
cyclin
g en
ds u
p
Why
som
e th
ings
can
not b
e re
cycled
How m
y re
cyclin
g m
akes
a d
iffer
ence
Wha
t pro
duct
s m
y re
cyclin
g ge
ts m
ade
into
Wha
t hap
pens
if th
e wro
ng th
ings
are
put
in ..
.
Whe
ther
recy
clin
g is e
nviro
nmen
tally
frie
ndly
Wha
t pla
ns th
ere
are
to im
prov
e re
cyclin
g ra
...Non
e
% o
f each
gro
up
High Medium Low Non
The pattern of preferences, in fact, varies only a little across High, Medium and Low recyclers but is markedly different for Non-recyclers - who are most interested in information about facilities in their local area but less worried about almost all other messages. There are odd instances of statistically significant variation between different socio-demographic groups, but no systematic patterns.
42

Household Waste Behaviour in London 2005 5 CONCLUSIONS AND RECOMMENDATIONS In this final section, we summarise the progress that has been made since 2001 and flag those areas where the new survey shows there are still challenges to be overcome if London is to recycle more. Priorities for boosting household recycling rates are then outlined, and policy options considered.
5.1 Progress since 2001 Significant progress in household recycling has clearly been made since 2001. The doubling of London’s recycling rate since then is reflected in a number of headline indicators from the 2005 survey: • The number of declared Non-recyclers fell from 22% to 8%.
• Those saying they can’t be persuaded to recycle more fell from 1 in 6 to 1 in 20 households.
• The number of consistent recyclers (Highs and Mediums) increased from 50% to 70%.
• The proportion claiming to recycle a wide range of materials beyond paper and glass doubled, to between 40% and 50% of households in 2005.
• Those agreeing that recycling is easy to fit into everyday life are now a majority of 60%, up from just under 40% in 2001.
• The number saying that Councils do not collect enough materials has fallen from 60% to 40%.
These marked changes clearly reflect the impact of the investments made in infrastructure and communications via the London Recycling Fund, the Recycle for London campaign and initiatives by the Boroughs. Two features in particular have underpinned the improving trend. First, opportunities to recycle are now vastly better than they were in 2001: • The number of households with kerbside collection rose from half in 2001 to
around 80% in 2005. Introduction of kerbside collection is the most commonly cited reason for recycling more by some margin.
• Indeed, across a range of indicators, the new survey confirms that kerbside collections are the easiest route to overcoming households’ effort-inconvenience barrier, which was shown in the previous research to be a decisive factor in determining participation.
• Introduction of kerbside collections has been particularly important in recruiting new Medium recyclers – who might otherwise be too passive to make the effort.
• Extending the range of materials collected has also contributed, particularly to much higher levels of claimed recycling of cans, card and plastic, as well as an increase in the number of High recyclers.
• Equally important, roll-out of recycling collections has also improved equality of access to recycling across different household types, such that a majority across all socio-demographic groups now have kerbside collections.
• Increased provision of communal recycling for flats on estates has had a similar equalising effect.
43

Household Waste Behaviour in London 2005 Second, perceptions and awareness have changed significantly since 2001. Most notably, households’ ‘mental map’ of recycling has been transformed, so that cans, card and plastic are now part of ‘normal’ recycling for many households, and are more often recognised as items that should be recycled by less committed recyclers. In addition, households’ perceptions of whether recycling is easy or not have switched round to the extent that they are now opposite to the picture in 2001, when recycling was seen as difficult by a majority. Far fewer households now perceive recycling as difficult; many of the remaining households that do tend also to be less interested in recycling in the first place, and to have weaker feelings of personal responsibility for waste.
5.2 Remaining challenges In spite of these undoubtedly positive shifts, there remains a wide range of areas where household recycling performance could be improved. Issues which are flagged by the survey include: • Continuing non or ineffective participation – in total, around 20%-30% of
households are recycling little or not very often, including up to 15% who are recycling nothing or close to nothing.
• More resistance among non participants – across a range of indicators, the remaining rump of Non-recyclers is now more disinterested than the larger group of Non-recyclers in 2001. It appears that the most willing have moved on leaving behind households who have little motivation to recycle. Similarly, Low recyclers now have as much opportunity to recycle through kerbside as previous Medium recyclers in 2001 yet are still doing little.
• Low awareness of recycling facilities among less committed and non-kerbside households – significant minorities of these households claim they do not know where local recycling facilities are, including nearly half of non-kerbside households who are not aware of bring facilities in their area. While some are open to receiving more information, introduction of kerbside collection is their most favoured option to help them recycle more.
• Continuing lack of confidence about what to recycle – significantly, this is one area where there was no improvement at all between 2001 and 2005, despite many more households now claiming to recycle a wider range of materials. Overall, only half of households agree they know what can and can’t be recycled.
• Effectiveness of recycling – if 70% of households are really recycling consistently then they must be recycling around only 30% of their waste to produce an overall recycling rate for London of close to 20%. Causes of ineffective recycling flagged by the survey include: ignorance that kerbside collection is available; choosing not to use kerbside; restricting what is recycled only to what is collected. We also conjectured that recycling rates for newspapers and glass may be reaching a participation ceiling. Low recycling rates for garden and kitchen waste are also an issue.
• Residential mobility – recent-in movers are more likely than average to be Non recyclers, to be less aware of local services and less effective in using the services available. Residential mobility is significantly higher in flats than houses, and especially in the private rented sector where 2 in 5 in the survey have relocated in the last 1-2 years.
44

Household Waste Behaviour in London 2005 • Continuing unequal opportunity – significant differences still remain in
access to kerbside collection and other facilities between well-off middle class households and more socially disadvantaged households, especially those living in flats. The latter are one of the few remaining groups where a minority are covered by doorstep collection.
• Households in flats – a special case – perhaps the biggest remaining challenge is to fully engage households living in flats, and especially those in low income and socially deprived areas. The survey shows that many of these households continue to experience multiple barriers to recycling that combine access to services, residential mobility, latent interest, confidence, trust, and feelings of ‘ownership’ of the waste problem. This issue applies as much to private renters and low rise households as to social renters and high rise residents.
Overall, the new survey demonstrates that the easy wins that existed in 2001 have largely been tackled by extending kerbside collections and that there is no longer a single easy, or quick, solution to boosting household recycling. The survey findings point instead to the need for action on a broad range of fronts.
5.3 Priorities for increasing household recycling Even more so now than in 2001, it is clear that different kinds of action will need to be targeted at different kinds of household. The survey points to areas where this action could be directed. Engage participation from remaining Non and Low recyclers – we may have to accept that there is a hard core of households in London who may always resist voluntary recycling. This numbered some 20% in 2001 and has probably fallen only slightly since on the basis of the new survey, in spite of the large drop in the number of openly declared Non-recyclers. This leaves, though 1 in 10 non-participating households, perhaps more, who are open to persuasion. These households exist right across the age and class spectrum, but are most concentrated amongst the least well-off. Engaging these households is not going to be straightforward and this no longer presents the main opportunity to increase recycling rates, in our view. Increase usage of existing services – now that a majority of London households have recycling collections, maximising the performance of this substantial investment is a clear near-term priority. This means ensuring that all households who qualify know that collections are available and that those that have them use them, and use them for all materials collected. At least 7%, and perhaps more, are not aware they have collections; 11% have collections but do not use them; and up to a quarter of kerbside households are not recycling even newspapers regularly. This points to a need for continuing engagement with kerbside recyclers, especially in areas where residential mobility is high, or underlying recycling commitment weaker (e.g. young people and those in flats). Tackle the complacency of kerbside households - this is an area where there is probably potential to make a large difference, but where success is not going to be easy. Even apparently committed middle class kerbside recyclers could be
45

Household Waste Behaviour in London 2005 doing much more, and this is especially true of current Medium recyclers, many of whom are relatively new to recycling. The challenge will be to persuade these households to recycle items not collected – notably cans, card and plastic which are now more widely recognised – in local bring sites. Rolling out more multi-material collections is a potentially more straightforward, but expensive, option. This is, in fact, the option most wanted by existing committed recyclers and lack of multi-material collection is seen as the most significant barrier by these households. Head off a ceiling for paper & glass – it may be too early to say with confidence whether a ceiling has been reached but claimed recycling of these materials amongst both kerbside and non-kerbside households changed little between the 2001 and 2005 surveys. This points to the need to continue to apply pressure on households via communication campaigns. Continuing efforts are also still required to broaden households’ understanding of ‘paper’, with claimed recycling of magazines and junk mail still lagging behind newspapers. Focus on green waste – given that it is a large share of household waste, this is another significant area of opportunity to boost recycling rates (or increase home composting) with under 1 in 4 households claiming they do this regularly, now amongst the lowest recycling of any material. The issues here almost certainly relate to perceptions that garden and kitchen waste are not really ‘recyclable’ as commonly understood. There is some encouragement, though, from the fact that “introduction of green waste collections” appeared in the top 4 reasons for recycling more in the 2005 survey. This points to increasing the availability of green waste collections, preferably on the same basis as other household recyclables so that there is no reason for individuals to differentiate these materials from other common items in their minds. A major effort may also be required via communications to change the probable perception that green waste is environmentally benign and therefore not worth recycling. Start raising awareness of WEEE - WEEE is a potential recycling time bomb, given that it is growing rapidly (at 3%-5% per year according to the EU), and that very few households recognise it as something that needs to be recycled. At present, around only 1 in 10 households say they are recycling these materials. Providing information at local level giving households clear instructions about what they are supposed to do, and where, is most likely the main priority here. Intensive focus on flats – there are two main priorities here. First, to ensure that the half of households in flats who do not have doorstep collections have other convenient services nearby, and that they are aware facilities exist. While on-estate systems have clearly made a difference, attention now may need to turn to households in private rented, and low-rise accommodation in all except the wealthiest areas. A second priority will be to maximise the effectiveness of kerbside usage among the other half of flat residents who have kerbside. Usage of available kerbside appears to be lowest of any social group among flat residents, and especially in high rise.
46

Household Waste Behaviour in London 2005 The pattern of attitudes expressed by households in flats in the survey suggests that a sizeable portion of these households will need equivalently more persuasion and engagement via communications than kerbside households elsewhere. For some of these households issues of personal responsibility and trust in authorities remain a barrier unlike wealthier and long settled residents in houses. Making provision in communications strategies for high rates of residential mobility will also be a priority in areas with large numbers of flats, especially where these are rented privately and where there are high proportions of young, mobile households.
5.4 Policy considerations The survey findings are relevant to three policy areas, both for the London boroughs and strategically across London: • Services • Communications • Rules of engagement for recycling Services The very significant investment in recycling services over the last few years is clearly reflected in much higher levels of claimed participation, in total and across a wider range of materials. On the basis of the survey evidence the principal remaining gaps in recycling services are: collections for households in flats; a service focus on green waste; and coverage of multi-material kerbside collection. Generally lower participation and effectiveness of households in flats, together with more complex engagement issues, suggest that it will be difficult for the inner London boroughs to achieve the same performance as suburban authorities on an equal footing. It may be the case that additional resources are required, for both services and communications, to achieve fully effective recycling in these areas. Authorities should also note the issues highlighted by the survey in relation to low rise flats and private rented accommodation and review whether specific action needs to be taken. Green waste is currently a lost opportunity amongst most households. While some boroughs provide excellent green waste services, more research may be required to identify what more is needed both in terms of service coverage and style, and in motivating households to participate. Work currently underway by WRAP on food waste attitudes will be helpful here. There may also need to be a more strategic focus on green waste, which could also tie in with action on the Mayor’s Food Strategy. Green waste should also be a focus of GLA work on waste minimisation. Extending multi-material collection, especially in mature kerbside areas, presents the principal – but costly – prospect of increasing the effectives of the 70% of households who are now consistently recycling. This option is desired by nearly half of existing kerbside households.
47

Household Waste Behaviour in London 2005 Communications Again, the survey provides firm evidence that the recent communications push at local and London-wide level has helped to change perceptions in favour of recycling being easy and that a wide range of materials can be recycled. There is, however, still room to turn widespread good intentions into consistent action and, in particular to raise the effectiveness of existing recyclers beyond our estimated 30% capture. Continuing effort at both local and strategic level is most likely required, to ensure that the progress of recent years is firmly embedded. At local level, households still want more “how to” instructions and there is a case for reinforcing knowledge about what can be recycled at strategic level - given that only half of Londoners appear confident and that this level has not changed overall since 2001. Medium and Low recyclers are a key target for this message. Authorities may also wish to consider whether attention needs to be given – both services and communications – to paper and glass in order to increase capture beyond already high levels. Rules of engagement for recycling Continuing unequal access to services – with a strong social class dimension - suggests that it is still premature to consider introducing compulsory recycling or charging across London as a whole. Charging is, in any case, opposed by a majority of households, regardless of their level of recycling commitment. Compulsion, on the other hand, is supported by a majority of consistent recyclers and by a slim majority overall. Since raising the effectiveness of now widespread kerbside collections will need to be a key focus for the future, it may be time for some authorities to consider introducing compulsion, either directly or via instruments such as alternate weekly collection. Suburban areas with mature kerbside and stable populations are the most obvious candidates.
48

Household Waste Behaviour in London 2005
6 APPENDIX The Appendix provides: • A description of social class definitions used in the report
• Tables showing the socio-demographic breakdown of the sample with statistical significance and sample sizes
• The topline results from the survey Table A1 Social Class Definitions
Social class
Occupation of chief income earner
A Upper middle Higher managerial, administrative or professional
B Middle Intermediate managerial, administrative or professional
C1 Lower middle Supervisor or clerical & junior managerial, admin, or professional; some students
C2 Skilled working Skilled manual workers D Working Semi & unskilled manual E Those at lowest level of
subsistence People on benefits, state pensions etc – with no other earnings
49

Household Waste Behaviour in London 2005 Table A2 Socio-demographics of High, Medium, Low and Non Recyclers 2005
HIGH MEDIUM LOW NON TOTAL% % % % %
Percent of respondents 29 42 21 8 100
Have kerbside recycling 91 82 62 24 74
GenderMale 46 47 48 63 48
Female 54 53 52 37 52Age
16-24 11 13 15 18 1325-34 21 25 25 41 2535-44 21 21 26 8 2145-54 14 14 15 15 1455-64 18 14 10 8 14
65+ 15 14 10 11 13Under 35 32 37 39 59 38Over 35 68 63 61 41 62
EthnicityWhite 85 71 62 55 72Black 6 17 19 29 15Asian 6 8 10 12 8Other
ClassAB 29 24 20 7 22C1 37 40 26 35 36C2 16 16 18 19 17D 7 8 15 13 9E 11 13 21 25 16
HousingDetached/semi 32 28 21 10 26
Terraced house 39 32 28 19 32Flat 29 40 51 71 42
Owner occupied 67 49 32 23 47Private rented 13 21 36 37 24Social rented 18 25 30 37 25
Have private garden 73 67 56 41 64
Length of residence in areaLess than 5 yrs 32 45 46 63 43
Over 5 yrs 67 54 52 37 56
Have car 70 67 55 44 63Single adult HH 26 26 35 39 29None working in HH 21 23 24 26 242+ working in HH 40 39 36 33 37No children at home 65 59 57 66 60
50

Household Waste Behaviour in London 2005 Table A3 Socio-demographics of High, Medium, Low and Non Recyclers 2005Statistically significant differences between groups and sub-sample sizesSignificant difference from other groups indicated by H=high, M=Medium, L=Low, N = NonBlank cells where no significant difference exists
HIGH MEDIUM LOW NON Sub-sample size% % % % number
Have kerbside recycling MLN HLN HMN HML 745
GenderMale 480
Female N N N HML 525Age
16-24 13025-34 N N N HML 24935-44 N N N HML 21245-54 14355-64 LN H H 142
65+ 130Under 35 N N N HML 379Over 35 N N N HML 627
EthnicityWhite MLN HLN HM HM 724Black MLN HN HN HML 152Asian 81
ClassAB LN N HN HML 225C1 366C2 166D L L HM 91E LN LN HM HM 157
HousingDetached/semi LN N HN HML 260
Terraced house LN N H HM 324Flat MLN HLN HMN HMN 422
Owner occupied MLN HLN HM HM 471Private rented MLN HLN HM HM 243Social rented MLN HN H HM 253
Have private garden LN LN HMN HML 641
Length of residence in areaLess than 5 yrs MLN HN HN HML 431
Over 5 yrs MLN HN HN HML 558
Have car LN LN MH MH 633Single adult HH LN LN MH MH 295None working in HH 2362+ working in HH 377No children at home 606
51
Household Waste Behaviour in London 2005
A4: Top Line Results 2005 The following presents top line data from the Household Waste Behaviour Survey 2005 compared to data from the survey conducted for the Resource Recovery Forum in 2001. The results are based on 1,005 face to face, in-home interviews with London residents aged 16+ conducted in December 2005, conducted by Ipsos MORI. Quotas were set for gender, age, ethnic group, class, working status and dwelling type and results are weighted by ethnicity and housing to match the socio-demographic profile of London. Where percentages do not sum to 100, this may be due to computer rounding, the exclusion of ‘don’t know’ or ‘not stated’ categories, or multiple answers. An asterisk (*) denotes any value of less than half a percent but greater than zero.
52

Household Waste Behaviour in London 2005
Section 1: Recycling Habits & Opinions Q1. Are you solely or jointly responsible for decisions about household waste disposal? SINGLE CODE Yes - solely 46 Yes - jointly 54 No *
⇒ IF NOT, INTERVIEW CLOSED.
Q2. How often, if at all, do you personally do any of the following? SINGLE CODE ONLY All of
the time
Most of the time
Some of the time
Odd occasion
Rarely Never
No opinion
Recycle paper and glass
42 25 14 4 13 2
Buy energy saving light bulbs for the home
19 21 24 12 22 3
Buy second hand/reconditioned electrical appliances instead of new ones
3 8 13 13 60 3
Turn appliances off completely rather than to ‘standby’ (e.g. TV, stereo)
38 22 19 7 12 2
Buy organic food 7 11 30 16 35 2 Have showers instead of baths
23 24 25 9 18 2
Use the car less to protect the environment
8 14 23 14 24 17
Eat meat as part of your main meal
23 36 28 6 7 1
Q3. Which, if any, of the following statements come closest to how you feel about recycling? SINGLE CODE ONLY 2001 2005 I recycle as much as I possibly can
33 46
I recycle a lot, but not everything that can be recycled
22 31
I do not recycle much 26 14 I do not recycle anything 19 9
53

Household Waste Behaviour in London 2005 Q4a. Which of the following recycling services, if any, are provided in your area? MULTICODE OK Q4b. And which of these recycling services in your area do you use regularly? MULTICODE OK Q4a. Provided
Q4b. Use
Doorstep/kerbside recycling collection of one material only
3219 21
Doorstep/kerbside recycling collection of more than one material
56 48
Any kerbside 74 63 Communal recycling facilities in flats
19 13
Supermarket recycling facilities
25 12
Newspaper recycling banks outside underground stations
15 8
Local recycling sites (e.g. on the street, at schools etc)
25 12
Charity shops 37 25 Recycling centre at household waste site (“tip”)
22 13
Other 10 6 Free/subsidised compost bins
1 1
None of these 5 9 Don’t know 4 4 Q5. Do you use online websites (e.g. eBay, Freecycle) on a regular basis to sell or give away things you no longer need? Yes - eBay 12 Yes - Freecycle 2 Yes - Other 3 No 82 Don’t know 2
19 Some respondents answered ‘Yes’ to both the questions on kerbside recycling services (i.e. for one material AND more than one material). Accounting for this ‘double-counting’ gives the figure for ‘Any kerbside’, shown in the third row.
54

Household Waste Behaviour in London 2005 Q6. How often, if at all, do you recycle the following everyday items? TICK START. MULTICODE ONLY. All of
the time
Most of the time
Some of the time
Hardly ever
Never Don’t use item
Newspapers (2001) 42 11 12 6 27 2 Newspapers 46 20 15 7 9 4 Magazines/brochures (2001)
36 11 10 6 35 2
Magazines 43 20 18 6 11 2 Junk mail 38 19 19 9 14 2 Cardboard packaging (2001)
13 7 11 10 58 1
Large cardboard boxes, e.g. computer packaging
28 16 18 15 19 4
Cereal boxes (2001) 12 5 7 11 62 3 Light card, e.g. cereal boxes
31 18 18 12 19 3
Glass beer/wine bottles (2001)
31 11 12 9 32 4
Glass bottles 35 20 18 10 16 2 Glass jars 33 20 18 11 16 2 Tin cans, e.g. baked bean tins (2001)
12 7 10 13 55 2
Pet food cans (2001) 4 2 2 5 42 44 Food cans, e.g. baked bean tins
31 18 17 12 20 2
Soft drink cans (2001)
12 8 8 9 58 6
Drink cans 30 19 16 10 23 2 Aerosol cans 15 12 14 18 34 7 Plastic bottles, e.g. water, milk etc (2001)
8 7 7 11 65 2
Plastic drink bottles, e.g. water, milk
27 18 17 9 26 3
55

Household Waste Behaviour in London 2005
All of
the time
Most of the time
Some of the time
Hardly ever
Never Don’t use item
Plastic cleaning product bottles, e.g. detergent
24 16 17 12 29 2
Plastic carrier bags 23 20 18 11 27 1 Cartons (tetrapak) 18 17 15 14 31 5 Tin foil (2001) 4 3 5 10 75 2 Tin foil 13 11 16 15 40 6 Old clothes (2001) 24 20 19 7 29 1 Clothing 19 18 25 15 22 1 Other textiles, e.g. sheets, towels, shoes
16 16 24 16 27 2
Food waste for compost
12 11 16 15 45 2
Garden rubbish (e.g. grass cuttings, soil etc) (2001)
13 6 9 7 50 14
Garden waste for compost
13 10 15 16 40 7
Batteries 6 6 11 16 54 7 Furniture, e.g. sofas 6 7 11 21 50 4 Small electrical products, e.g. fridges
6 7 9 22 52 3
Q7. Thinking about the amount of recycling you (and your household) do now, do you think that this is more, less or about the same as you did two or three years ago? SINGLE CODE ONLY. 2001 2005 Lot more 27 Slightly more
40 (more) 24
About the same 49 34 Slightly less 6 Lot less
9 (less) 3
Don’t know 2 6 ⇒ IF MORE, CONTINUE TO Q8.
56

Household Waste Behaviour in London 2005 Q8. Why did you start to recycle more? Anything else? DO NOT PROMPT. A. Facilities Kerbside collections started up 40 New recycling banks on streets 17 New recycling facilities for your flat or estate
11
New materials were added to kerbside collections
22
Improved reliability of service 11 Council started collection of green/garden waste for recycling
20
Council started collecting kitchen waste for recycling
10
Council changed from recycling boxes to bags
7
Found out facilities were available that I didn’t know about before
13
B. Changes in Lifestyle
Moved into a new house 5 Moved into a new area with facilities
3
Got more space to store recyclables 6 Started a family 3 Got more interested in environmental issues/recycling
26
Persuaded by friends, family or neighbours
5
C. Advertising/publicity
Radio advertising 7 TV advertising 12 Adverts in magazines/local newspapers
7
Council newsletters 14 Leaflets through my door 15 Door stepping by the council/ someone (from council) came round to talk to me about recycling
6
Posters on bus stops, buses and the underground
1
Other 9 Don’t know 2
57

Household Waste Behaviour in London 2005
Section 2: Barriers to Recycling
Q9. I am going to read a list of things people have said about recycling. To what extent do you agree or disagree with each of them? TICK START. SINGLE CODE ONLY. Strongly
agree Tend
to agree
Neither agree nor
disagree
Tend to disagree
Strongly disagree
No opinion
Net agree
I don’t believe the Council actually does recycle all of the items collected for recycling (2001)
10 20 22 21 10 16 -1
I don’t believe the Council actually does recycle all of the items collected for recycling
6 18 23 21 19 13 -16
Recycling fits easily into my everyday routine (2001)
12 26 20 21 16 3 1
Recycling fits easily into my everyday routine
24 36 18 12 8 3 40
I have never really thought about doing any recycling (2001)
5 13 13 29 36 4 -47
I have never really thought about doing any recycling
6 11 14 28 38 3 -49
It isn’t really my responsibility to recycle rubbish (2001)
5 13 16 27 34 4 -43
It isn’t really my responsibility to recycle rubbish
4 11 16 31 35 3 -51
It is easy to know what can and cannot be recycled (2001)
14 36 20 22 5 4 22
It is easy to know what can and cannot be recycled
17 34 21 18 7 3 26
Recycling facilities are too far away from my home
8 15 22 27 24 4 -28
I know where to find recycling banks if I want to (2001)
28 39 10 12 6 3 49
I know where to find recycling banks if I want to
27 34 17 12 8 2 41
58

Household Waste Behaviour in London 2005
Strongly
agree Tend
to agree
Neither agree nor
disagree
Tend to disagree
Strongly disagree
No opinion
Net agree
I’m too busy to make special trips to recycling banks (2001)
12 25 18 26 16 2 -5
I’m too busy to make special trips to recycling banks
7 20 22 27 21 3 -21
It’s too much hassle to wash up jars and cans for recycling
7 22 23 26 20 3 -17
There is not enough space in my home to separate my rubbish into recyclable and non-recyclable things (2001)
17 23 17 26 14 3 *
There is not enough space in my home to separate my rubbish into recyclable and non-recyclable things
11 23 21 26 17 2 -9
I find it easy to remember to recycle (2001)
18 32 18 18 10 4 22
I find it easy to remember to recycle
23 35 19 13 6 4 39
More environmental damage is caused by transporting recycled goods than is saved
3 13 27 23 21 13 -28
The Council doesn’t collect all the things I want to recycle (2001)
34 26 18 10 4 7 46
The Council doesn’t collect all the things I want to recycle
17 23 22 20 14 6 6
There isn’t much that ordinary people can do to help protect the environment (2001)
6 15 15 27 31 6 -38
There isn’t much that ordinary people can do to help protect the environment
5 12 18 31 31 4 -45
59

Household Waste Behaviour in London 2005
Strongly agree
Tend to
agree
Neither agree nor
disagree
Tend to disagree
Strongly disagree
No opinion
Net agree
It’s not possible for me or my family to cut down on the amount of rubbish we make (2001)
13 24 20 28 11 3 -3
It’s not possible for me or my family to cut down on the amount of rubbish we produce
7 21 22 27 19 3 -18
I would make more effort to recycle if I could be sure it was making a difference (2001)
29 35 19 9 4 3 50
I would make more effort to recycle if I could be sure it was making a difference
22 35 23 11 5 4 41
The Council does not have the right to tell me to recycle (2001)
10 19 21 23 23 3 -17
The Council does not have the right to tell me to recycle
6 14 28 26 21 4 -27
I can’t recycle because I don’t have a kerbside collection
7 8 16 23 42 4 -50
60

Household Waste Behaviour in London 2005
Section 3: Incentives for Recycling Q10. Which three or four of the following, if any, would encourage you to recycle more often or to recycle more things? CODE UP TO 4 ONLY. Introduce kerbside/doorstep collection –
don’t have one at present 23
Take more types of materials/items in my kerbside collection
40
Provide clearer instructions on what can/can’t be included in kerbside
recycling collections
31
Be allowed to put all materials in same box/bag – not have to keep materials
separate
26
Make doorstep/kerbside collection service more reliable
25
Provide recycling banks nearer to my home
23
Make recycling banks cleaner 11 Empty recycling banks more often 11
Provide recycling banks for more kinds of material/items
19
Improve safety and security of recycling banks
11
More information 21 Regular reminders to recycle 12
If more people in my street recycle 4 Financial rewards for recycling 12
Have local recycling wardens/’champions’ etc
6
Personal visit from somebody to explain about recycling
4
Other 5 Nothing can encourage me to recycle
more 5
Don’t know 2
61

Household Waste Behaviour in London 2005
Q11. In the future, instead of paying for rubbish collection through their Council Tax, households could recycle for free but be charged per bag or per bin of ordinary non-recyclable waste to encourage people to recycle more and generate less ordinary waste as for electricity where you pay according to how much you use. Could you tell me to what extent you agree or disagree with each of these things people have said about the idea of charging people for rubbish collection and disposal? SINGLE CODE ONLY FOR EACH Strongly
agree Tend to agree
Neither agree nor disagree
Tend to disagree
Strongly disagree
No opinion
Net agree
It is fair to charge people according to the amount of rubbish they produce (2001)
9 26 9 22 31 3 -18
It is fair to charge people according to the amount of rubbish they produce
11 21 15 19 32 3 -19
People would recycle more if they had to pay per bin or bag for ordinary rubbish to be collected (2001)
14 28 16 16 23 3 3
People would recycle more if they had to pay per bin or bag for ordinary rubbish to be collected
18 23 13 19 23 4 -1
Charging per bin or bag is better than the current system of paying for rubbish collection in the Council Tax (2001)
6 13 20 20 33 7 -34
Charging per bin or bag is better than the current system of paying for rubbish collection in the Council Tax
7 14 22 21 30 5 -30
People need a financial incentive to make them create less rubbish and recycle more (2001)
20 32 19 16 10 3 26
People need a financial incentive to make them create less rubbish and recycle more, e.g. a reward card
18 27 24 14 13 5 18
The Council saves money from people recycling (2001)
13 23 25 12 5 22 19
The Council saves money from people recycling
14 25 29 10 7 15 22
Recycling should be compulsory
27 26 19 13 12 2 28
62

Household Waste Behaviour in London 2005
Section 4: Communications Q12. When, if at all, did you last receive information on recycling? SINGLE CODE ONLY In the last 3 months 33 Between 3-6 months 17 Between 6-12 months 12 Between 1-2 years 5 Over 2 years ago 2 Never 17 Don’t know 14 Q13. Which of these have provided you with information on recycling in the past? MULTICODE OK. 2001 2005 My local council 58 67 Supermarket 19 16 Environmental campaigning organisations e.g. Greenpeace, Friends of the Earth
28 21
My children/children’s school
5 6
Family, friends or neighbours
920 9
National government 13 8 Mayor of London n/a 9 My work/employment 5 6 Community groups, e.g. church, scouts
n/a 5
None of these 11 14 Don’t know 3 5
20 This is an average of answers provided in 2001 where ‘family, friends and neighbours’ were asked as three separate categories.
63
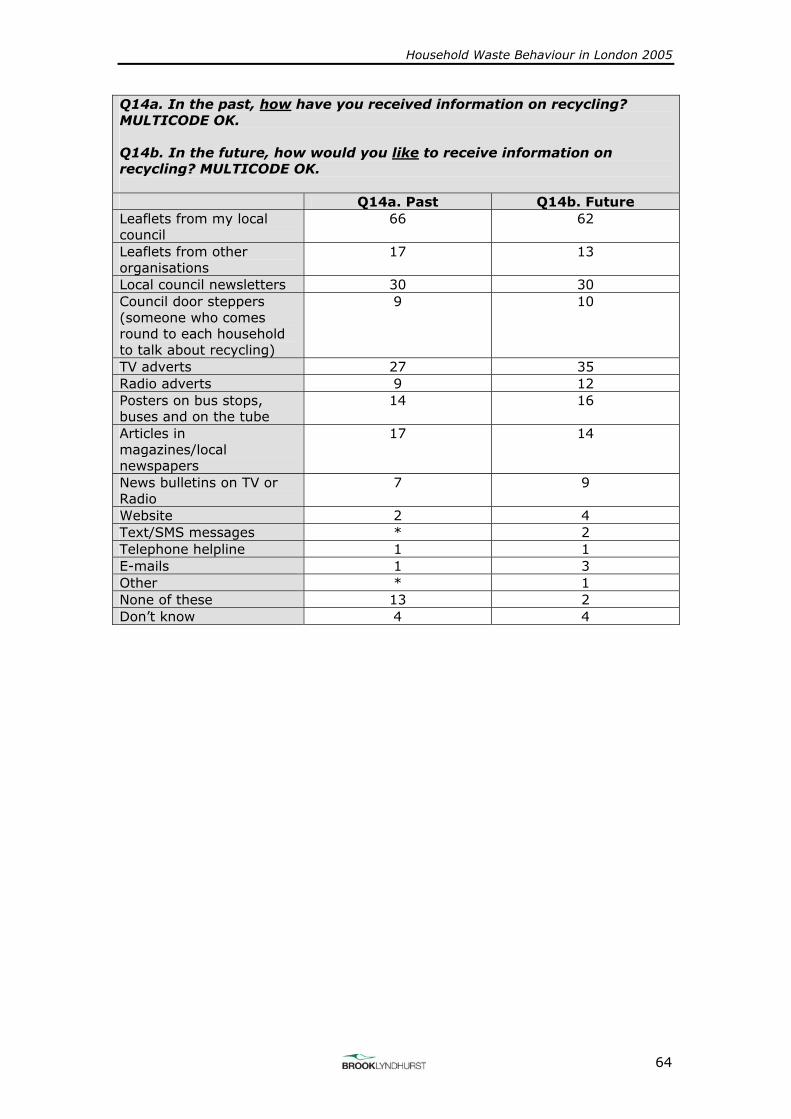
Household Waste Behaviour in London 2005 Q14a. In the past, how have you received information on recycling? MULTICODE OK. Q14b. In the future, how would you like to receive information on recycling? MULTICODE OK. Q14a. Past Q14b. Future Leaflets from my local council
66 62
Leaflets from other organisations
17 13
Local council newsletters 30 30 Council door steppers (someone who comes round to each household to talk about recycling)
9 10
TV adverts 27 35 Radio adverts 9 12 Posters on bus stops, buses and on the tube
14 16
Articles in magazines/local newspapers
17 14
News bulletins on TV or Radio
7 9
Website 2 4 Text/SMS messages * 2 Telephone helpline 1 1 E-mails 1 3 Other * 1 None of these 13 2 Don’t know 4 4
64

Household Waste Behaviour in London 2005 Q15. Which three of the following, if any, would you like to know more about? MULTICODE OK. CODE UP TO THREE ONLY. What recycling services and facilities are available in my area
32
Where to recycle specific materials/items
32
What can and can’t be put in kerbside collections, e.g. envelopes, types of glass, lids
31
Why some things can’t be recycled 25 What happens if the wrong things are put in the recycling
22
What products my recycling get made into
21
Where my recycling ends up 25 How my recycling is making a difference 24 Whether recycling is environmentally friendly
19
What plans there are to improve recycling rates/services
17
Other 2 None 9
65

Household Waste Behaviour in London 2005
Socio-demographics GENDER 2001 2005 Male 47 48 Female 53 52 AGE 2001 2005 16-24 13 25-34
40 25
35-44 17 21 45-54 12 14 55-59 8 60-64
14 6
65-74 8 75+
17 5
WORKING STATUS OF RESPONDENT Working – Full time (30+ hours) 41 Working - Part time (9-29 hours) 16 Unemployed 8 Not working - retired 19 Not working – looking after house/children
7
Not working – invalid/disabled 2 Student 7 Other 1 CLASS 2001 2005 A 2 B
20 21
C1 36 C2
50 17
D 9 E
30 16
Respondent is: Chief Income Earner 65 68 Not Chief Income Earner 31 32
66

Household Waste Behaviour in London 2005 QA. How many children under 16 live in this household? 2001 2005 None 67 60 1 13 16 2 11 16 3 5 6 4 1 1 5 * * 6 or more * * QB. How many people aged 16 or over live in this household? 2001 2005 1 24 29 2 48 48 3 15 14 4 8 5 5 2 1 6 or more 1 1 QC. How many people (including yourself) aged 16 or over in your household work either full or part time? 2001 2005 None 30 24 1 28 38 2 30 29 3 7 6 4 2 2 5 1 * 6 or more * * QD. Which best describes your home? 2001 2005 Detached house/bungalow 4 4 Semi-detached house 25 22 Terraced house 41 32 High/medium rise flat 8 20 Low rise flat/flat in converted house
17 22
Other 5 *
67

Household Waste Behaviour in London 2005 QE. Do you have a garden? 2001 2005 Yes 80 64 No 20 30 QF. Home Ownership Privately owned 47 Privately rented 24 Rent from local authority/housing association
25
Other 3 QG. Does anyone in your household own or have use of a car? 2001 2005 Yes 63 63 No 35 36 Don’t know * 1 QH. How long have you lived in this local area? 1-2 years 20 3-5 years 23 6-10 years 18 More than 10 years 38 Don’t know 2
68

Household Waste Behaviour in London 2005
69
QI. Ethnicity 2001 2005 White British 62 White Irish 1 Any other white background
79
9
Mixed white and Black Caribbean
1
Mixed White and Black African
2
Mixed White and Asian 1 Any other Mixed background
-
*
Asian or Asian British – Indian
3
Asian or Asian British – Pakistani
3
Asian or Asian British – Bangladeshi
1
Any other Asian background
9
2
Black or Black British – Caribbean
5
Black or Black British – African
9
Any other Black background
9
*
Chinese or other ethnic group
2 1
Refused * *

![Untitled-1 [images1.loopnet.com]...2010 Households 2019 Total Households 2024 Total Households 2000-2010 Annual Rate 2010-2019 Annual Rate 2019-2024 Annual Rate 2019 Average Household](https://img.pdfslide.us/doc/110x75/5f35bf22568c8b527b6d5173/untitled-1-2010-households-2019-total-households-2024-total-households-2000-2010.jpg)