Embed Size (px)
Citation preview

Electronic copy available at: http://ssrn.com/abstract=1482023
Wharton Financial Institutions Center
Personal Finance
Real World Index Annuity Returns
Jack Marrion* [email protected]
Geoffrey VanderPal** [email protected]
David F. Babbel***
Revised Version, December 27, 2010
Abstract • We offer the first empirical exploration of fixed indexed annuity returns based upon actual
contracts that were sold and actual interest that was credited. • Annuity returns have been competitive with alternative portfolios of stocks and bonds. • Their design has limited the downside returns associated with declining markets. • They have achieved respectable returns in more robust equity markets. • Studies that have criticized FIA’s are typically based on hypothesized crediting rate formu-
lae, constant participation rates and caps, and unrealistic simulations of stock market and in-terest rate behavior. When actual policy data are used, the conclusions change.
• Our study is exploratory, because although it is based on actual contracts and actual crediting rates, our policy data set is neither randomly selected nor comprehensive, based upon data provided by 19 FIA carriers.
Keywords: Indexed annuities, retirement, optimal asset allocation JEL classifications: G11, G22, G23, J26 * MBA, doctoral candidate in the area of cognitive bias in decision-making, President of Advantage Compendium. ** DBA, MBA, CFP®, CLU, CFS, RFC®, CTP, CAMS, Chief Investment Officer of Skyline Capital Management. *** Professor of Insurance and Risk Management, The Wharton School, University of Pennsylvania; Senior Advisor to Charles River Associates; Fellow of Wharton Financial Institutions Center.

Electronic copy available at: http://ssrn.com/abstract=1482023
1
Real World Index Annuity Returns
Jack Marrion, Geoffrey VanderPal, and David F. Babbel Introduction Financial advisors and financial planners have sought various programs to provide clients protec-tion from systematic risk, also known as market risk. Various asset allocation strategies have been used with limited success when extreme market movements and “black swans” occur (Taleb, 2007). It has been known for close to 50 years that equity market returns do not conform to a Gaussian, or Normal (bell-shaped) probability distribution (Mandelbrot, 1963; Fama, 1963).i Rather, probability distributions of market returns are typically skewed positively or negatively and leptokurtic (fat-tailed – i.e., higher chances of extreme positive or negative returns than sug-gested by a bell-shaped distribution). When these leptokurtic events occur on the positive side of the distribution, clients are delighted, but the opposite is true when these events occur on the negative end of the two-tailed distribution. Principal preservation products have evolved to address the needs of many risk-averse consum-ers by providing them a safety net for their investment/savings capital. The products are struc-tured in a way that reduces correlations with other asset classes. To illustrate better the extremes of market returns, we can examine the Russell 3000 index that accounts for nearly 98% of the publicly traded U.S. equity market. A study by Eric Crittenden and Cole Wilcox (2008) at Black-star Funds was conducted using Russell 3000 data from 1983 through 2006. The findings were that “about 40% of the stocks had negative returns over their lifetime, and about 20% of stocks lost nearly all of their value. A little more than 10% of stocks recorded huge wins over 500%” (Richardson, 2009). These data indicate that most of the positive market return over time comes from relatively few performers, which lends support to the use of stock index strategies as part of an overall portfolio. Furthermore it supports the notion that there is significant risk in the stock market and thus, for moderately to highly risk-averse clients, the need for principal protection programs such as fixed indexed annuities (FIA’s). Nearly 96% of FIA’s possess reset (or ratchet) features that allow for locking in positive returns each annual or biannual period. By eliminating the prejudicial effects occasioned by significant stock market declines, and locking in returns an-nually or biannually, there is less of a need to try and capture large upside market swings to re-cover from the declines. As financial professionals, we are tasked with assisting our more risk-averse clients to protect themselves from black swans and many of us have a fiduciary responsibility. One of the signifi-cant developments for principal or asset preservation vehicles has been the fixed index annuity (VanderPal, 2004). During the past few years various articles have been written regarding the value in FIA’s and some people relying upon these studies have drawn misleading inferences from them.ii

2
After reviewing the size and growth of the FIA market in recent years, we turn to dispelling two basic errors that people often make in assessing the message of FIA studies. We will illustrate these misconceptions by using actual crediting rates on various kinds of FIA policies. With these data we are able to show actual returns on FIA’s rather than make inferences from hypothetical crediting rates derived from assumed (and often constant) rate caps, assumed crediting rate for-mulae, and hypothetical participation rates, often coupled with theoretical stock market and in-terest rate moves. This should help inform the public and correct the inaccurate information por-trayed by some journalists and industry professionals.iii Furthermore, the article will delve into additional FIA features that provide advantages not found in ordinary securities and various principal preservation programs. FIA Market Growth The table below indicates the growth in sales of FIA’s since 1997. Overall sales of FIA’s in 2009 of $30.2 billion are small compared to total fixed and variable annuities sales of $235 billion in 2009 (Koco, 2010), and dwarfed by securities sales.
Equity Index Annuity Sales
Year In billions of dollars
1997 1998 1999 2000 2001 2002 2003 2004 2005 2006 2007 2008 2009
3.00 4.20 5.15 5.25 6.50
11.70 14.01 23.00 27.26 25.30 25.20 26.70 30.20
Sources: Various reports from The Advantage Group, and (Koco, 2010) Although the FIA market may be small relative to more established markets, it has nonetheless attracted several performance studies. We have noticed two basic limitations that typify most studies and articles that attempt to describe potential index annuity performance. The first of these is assuming crediting formulae that are rarely used and crediting rates that are seldom ob-served. While this type of exploratory exercise is fine in and of itself, a problem arises when readers assume the theoretical results are somehow representative of the index annuity world. The second limitation is making assumptions about stock market and interest rate behavior that are not well supported. This can lead people to make inferences about actual FIA behavior that are unjustified. Our study examines these limitations and shows how actual index annuity returns are at odds with many of the hypothetical conclusions.
3
Are Hypothetical Returns Realistic? A number of studies and popular press articles have been disseminated recently on the perform-ance of FIA’s.iv These studies have been based on hypothetical elements in one or more of: annu-ity contract designs, product parameters, economic environments, stock market behavior, and interest rate behavior. While it is common for economists and others to develop models in order to get a handle on product performance, unfortunately most of the models to date have created theoretical annuity products whose performance has little relation to FIA’s sold in the real world. As we will discuss in greater detail in the Appendix to this article, the main areas of concern with these models relate to the following dubious assumptions that underlie the model designs. First, some models posit crediting methods or combinations of contract elements such as assumed par-ticipation rates, interest caps, and pricing spreads that have never been observed in available con-tracts. Second, some models assume behavior over time of the pricing elements that is unlike the dynamic behavior characterizing FIA’s in practice. For example, the economic models typically assume constant participation rates and interest caps that remain constant throughout the life of the contract. Third, they may select a time period in the economy that is not representative of the time period within which FIA’s were offered, and therefore cannot couple the chosen time period with realistic product parameters that would have prevailed over that time period. Fourth, in some cases they construct completely hypothetical dynamic behaviors of the stock market and interest rates that have not been observed before and couple them with an imaginary FIA con-tract whose features are simply assumed, and somehow develop comparisons between the per-formance of the imaginary FIA and an assumed investment portfolio in the hypothetical econ-omy. Fifth, the models do not include any accommodation for managerial discretion in adjusting the product pricing levers to be responsive to economic conditions and competitive forces. While such exercises are instructive, they shed little light on how actual FIA’s have fared under real world conditions. In the following section, we will attempt to remedy these deficiencies – at least insofar as available data will permit. Reality Index annuities have been producing returns since the first one was purchased on February 15, 1995. Unfortunately, most of the articles and studies ignore these data and attempt to portray how index annuities should have performed while ignoring actual results. What we show below are actual results. They are not intended to be a prediction of how index annuities will perform in the future, nor are the results intended to be representative of overall industry performance. They results are what they are. Let us be very clear on this. Our data set does have serious limitations, which we describe presently so that readers may draw their own conclusions, but unlike the numbers shown in the studies previously mentioned these results are real and not hypothetical. We believe this to be the most comprehensive data ever assembled for actual FIA performance data to date. These results are based on copies of actual customer statements received with personal informa-tion blacked out, for each of the preceding five-year periods, requested on an annual basis since 2002. The return data reflect contract periods closest to 30 September with the exception of the 1997-2002 period that uses a 2 January date. The returns reflect the results of products with term
4
end point, high water mark, and annual reset designs with and without crediting rate caps, and with and without averaging. The returns do reflect any fees charged, but not surrender penalties. Annuitization was not required to receive these returns.
Annualized Five-Year Returns
Period S&P index return FIA avg. return Number of FIA’s Return Range
1997-2002 1998-2003 1999-2004 2000-2005 2001-2006 2002-2007 2003-2008 2004-2009 2005-2010
9.39% -0.42% -2.77% -3.08% 5.11%
13.37% 3.18%
-1.05% -1.47%
9.19% 5.46% 4.69% 4.33% 4.36% 6.12% 6.05% 4.19% 3.89%
5 13 8
28 13 23 19 27 36
7.80% to 12.16% 3.00% to 7.97% 3.00% to 6.63% 0.85% to 8.66% 1.91% to 6.55% 3.00% to 8.39% 3.00% to 7.80% 2.25% to 6.83% 2.33% to 7.10%
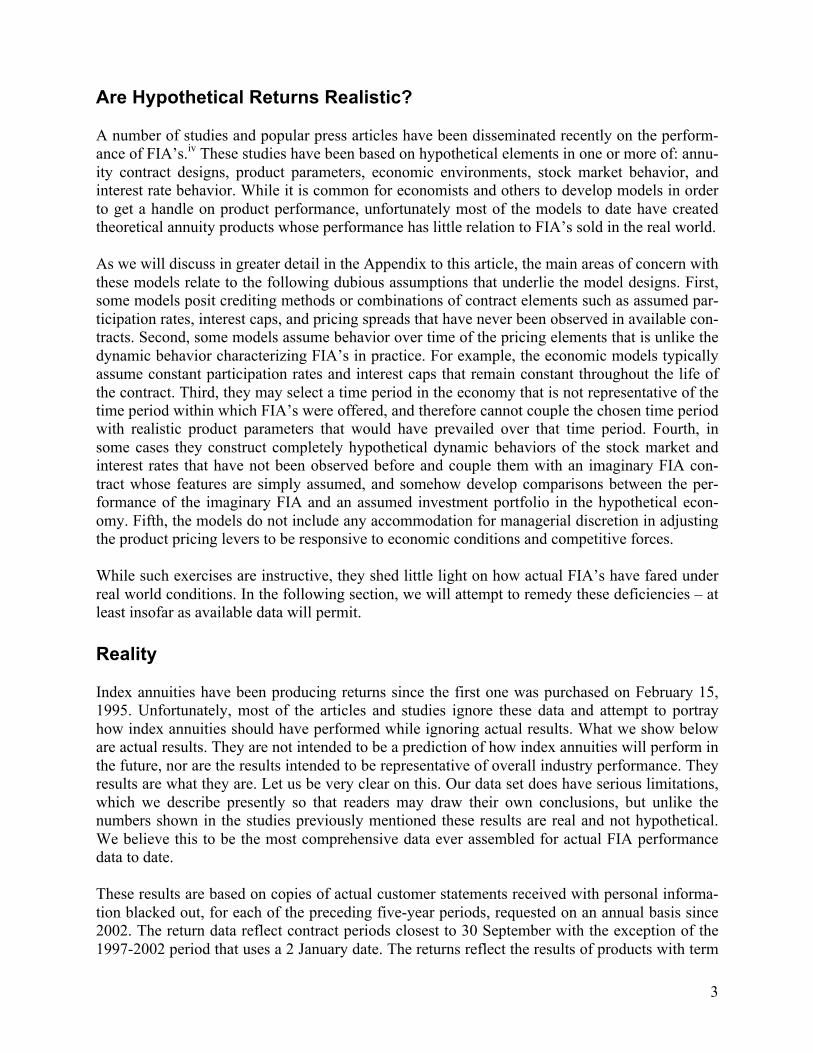
Note: All returns shown above are annualized (geometric) rates of return. The S&P index returns are not meant to proxy for index mutual fund returns, which would include dividends, expense ratios (the least costly have featured approximately 20 b.p. per year), trading costs (another 30 b.p. per year), tracking error and taxes; rather, they are to reference what happened to the most popular index to which many FIA’s are linked through some formula. Later, we consider total returns (including dividends, but not expenses and trading costs) on the S&P 500 stocks. There are several limitations with the data above. The main one is that they are derived from car-riers that chose to participate and that chose the products for which they reported returns. This could have imparted some bias in returns, and may differ from what a larger, more random sam-ple would have produced for the periods. Although some of the annuities had contract years end-ing on the 30th, the contract anniversaries encompassed a three-week range around that end date. The data collected are very few for some periods. And the data reflect results across a very small spectrum of time, only looking at 1997-2010 and then only at one day out of each year. Nonethe-less, the 172 contracts for which we have data are real contracts and reflect actual crediting rates that were provided to annuity owners over time under twelve different crediting rate structures used in FIA designs. This next data set reflects the actual real-world total five-year returns credited to annuityowners for an annual point-to-point with cap structured index annuity. Assuming an annuity is purchased on the 21st of every month beginning April 1996 with a final purchase on September 2004. This annuity was selected because it has been steadily offered every month for 14 years and its per-formance is publicly available. It is not intended to be representative of anything except itself. The chart below compares the FIA returns with the total returns of the S&P 500 over the same period, and a blended return composed of 50% of the S&P 500 total return and 50% of the com-pounded return for a series of one-year, U.S. constant maturity T-bills. To render our study more comparable to other studies (cited previously), we have not rebalanced our portfolios each pe-riod. Moreover, we have not deducted from these alternative portfolios any of the annual ex-penses that typify mutual funds, thereby biasing the comparison to favor mutual funds. (Note that the vertical axis on the next two charts shows accumulated returns over five years, which are not expressed in annualized terms.)
5
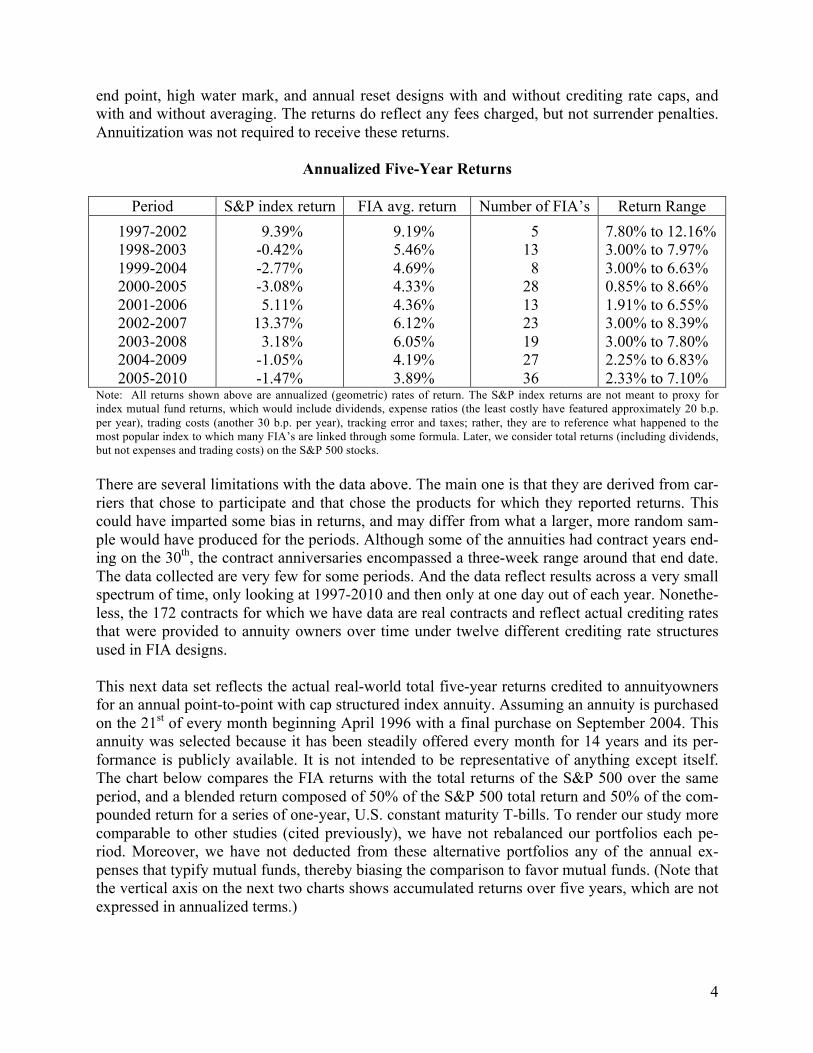
This next data set reflects the actual real-world total five-year returns credited to annuityowners for two other index annuities using annual point-to-point with cap structures. (These data are shown separately from the prior chart because the data for these annuities were available only quarterly, whereas the prior chart is based on monthly data.) It shows the actual returns of the annuities if purchased quarterly since inception of the product in April 1995 on the one annuity and since inception of the other in April 1998 with a final purchase in October 2004. These annuities were also selected because they have been steadily available for fifteen years in the first example and twelve years in the second and their performance is readily available. The chart on the following page compares the FIA returns with the total returns of the S&P 500 over the same period, and a blended return composed of 50% of the S&P 500 total return and 50% of the compounded return for a series of one-year, U.S. constant maturity T-bills. We have not de-ducted from these alternative portfolios any of the annual expenses that typify mutual funds, thereby biasing the comparison to favor mutual funds. Collins, Lam and Stampfli (2009) attempted to predict the future by using the past and creating “a rich set of probable future results [that] is available for inspection.” Based on these “probable” futures they found the index annuity minimum guarantee to be beneficial at times, but that the index annuity payoff “always lags the investment portfolio’s payoff for returns.” McCann (2008) created his own hypothetical annuity structure and in the future he created, he stated that “99.8% of the time the investor would be better off with the Treasury securities and stocks than with the equity-indexed annuity.” However, if your future included all of the 141 actual 5-year periods from April 1995 through 2009, and you had purchased any of these real-world-still-being-
6
marketed index annuities month after month, the not-pretend index annuity results bested the S&P 500 alone over 67% and a 50/50 mix of one-year Treasury Bills and the S&P 500 79% of the time.v
These returns should not be viewed as representative. The annualized range of returns in the graph are from annuity carriers that chose to submit their return data, and although overall a ma-jority of index carriers did provide actual return data (reaching 83% of all carriers selling FIA’s at one point), self-reporting bias may have resulted that skewed the returns higher than would be seen with a more comprehensive data set. The two charts showing total returns are much more comprehensive. The first chart shows the actual returns of one annuity purchased month after month since April 1996. The second chart shows the actual returns of two annuities purchased at the same time each quarter beginning in April 1995. All in all, actual results for 172 five-year periods are shown. However, it should be noted these three annuities all use an annual point-to-point with cap interest crediting method. We fully realize the limitations of the data. We wish that we could show actual index annuity returns for a multitude of products and crediting methods going back a half century, but the data are not there. Again, due to these limitations the return data should not be considered representa-tive of how index annuities perform, but nether should it be dismissed. Exercises conducted by McCann, Reichenstein, or Collins, Lam and Stampfli (discussed later in the Appendix) created hypothetical worlds that either use crediting methods that are, at best, ex-tremely rare (to the best of our knowledge, as we have never encountered them), or dubious as-
7
sumptions that do not reflect the actual pricing environment, and yet these studies have been used by some to condemn index annuities as a failed financial concept. In the interest of fairness, the actual results from 344 five-year returns representing close to two hundred different index annuities should be seen for what they are and that is showing that at least some index annuities have been competitive. Liquidity and Risk According to Collins, Lam and Stampfli (2009), FIA’s are not liquid investments and have “for-midable” surrender charges. Although the authors did not define what they mean by “liquidity,” in a financial sense it usually refers to (1) the ability to buy or sell an asset with minimum distur-bance of its market price; (2) the ability to buy or sell with relative ease; or (3) the ability to eas-ily convert into cash. With regard to definition (1), we note that unlike some assets that are traded in the open market, FIA’s are private contracts, similar in that respect to nonnegotiable bank CD’s. They are not traded in the marketplace, and hence have no market price. Hence, the first definition of liquidity does not fit. (Of course, many stocks and bonds have very thin markets and may require quite a lengthy time to find a buyer, and then only if a steep price discount is offered, but those assets that are quickly tradable rarely have guaranteed price schedules over time and may be sellable at only a small fraction of their original purchase price. Nonetheless, under this definition of liquid-ity, the original purchase price is not a factor.) Under definitions (2) and (3) we note that unlike some stocks and bonds but similar to bank CD’s, FIA’s may be easily “cashed in” with the issuer at any time and at prices that are formula-ically pre-specified in the contracts. There is always a willing buyer. Both CD’s and FIA’s have surrender penalties for premature withdrawal or early surrender, but both are easily convertible into cash. In the case of some CD’s, the early withdrawal penalty may depend on how early they are liquidated, yet with other CD’s the penalty may be fixed regardless of how early they are cashed.vi In the case of FIA’s, the early surrender penalty is almost always a function of how early the surrender occurs. Moreover, the authors failed to take into account the various free withdrawal provisions in all FIA’s. Generally a 10% withdrawal is allowed annually without surrender penalty and some con-tracts allow 15% annually. A 10% withdrawal is about triple what you can withdraw from a Treasury bond portfolio in today’s interest rate climate without subjecting yourself to losses of principal occasioned by bond price fluctuations, and even more so when the alternative portfolio includes common stock. Most articles analyzing appropriate withdrawal rates for retirees range in the 4-6% range annually, depending upon various methods of thought. This being said, a 10% withdrawal privilege should not be an issue for most retirees and individuals. If more liquidity than that is desired, it should be sought through additional types of portfolio assets. Nearly all FIA’s provide a full surrender value (i.e., all surrender charges are waived) upon death of the owner or annuitant. Many FIA issuers offer full surrender without penalties for nursing home stays, extended hospital visits and terminal illness (VanderPal, 2008). Several carriers of-fer full surrender without penalties for unemployment if under 65 years of age. The surrender charges when applied outside of the free withdrawal provisions typically depend on the mini-

8
mum term of the annuity and whether any bonuses are paid, and usually decline each following year. Another difference is that in the case of a non-qualified annuity purchase, the accumulation value grows tax deferred, whereas with a non-qualified portfolio of stocks and bonds, taxes are in-curred along the way. Babbel and Reddy (2009) have shown that the difference between these two tax treatments can ultimately produce after-tax income potential from the annuity that would require alternative taxable mixes of stocks and bonds to produce annual returns that must be sub-stantially higher, in some cases 200 basis points or more higher, than the annuity returns in order to provide for an equivalent after-tax income.vii This missing element in our comparison biases the result in favor of the alternative portfolio. In short, tax-deferred annuities including FIA’s provide a tax advantage and potential return advantage that standard stock and bond investments would not provide unless held in a retirement account. Moreover, FIA’s in almost all states are protected from creditors and against seizure in situations of litigation, which is not typically true of stock and bond mutual funds unless held in a protected vehicle. FIA opponents commonly cite surrender fees as an issue. However, surrender fees are generally required by state insurance regulators in order for policies to qualify for sale. Inadequate surren-der fees have attracted hot money in the past and often led to insurer insolvency (Babbel and Merrill, 2005). FIA’s provide a guaranteed minimum return along with principal preservation at each point in time and other options, which mutual funds and other similar investments do not provide. These guaranties can be costly to secure. The existence of surrender fees also helps an insurer recapture up-font costs on products that were designed to be held for several years, and protects persisting policies from the imposition of extra costs by those who choose to surrender early. Fees and Expenses “Although FIA’s do not provide complete participation in an index, based on various crediting methods and market anomalies, returns may actually be better over time than in mutual funds or variable annuities. Consider that variable annuities with mortality and administration expenses (M&E), sub-account management fees and other various charges can account for up to 4.00% of annual expenses that erode market returns on variable annuities” (VanderPal, 2008). According to Morningstar the average mortality and expense and management fees are 2.08%. For example, a variable annuity sub-account that earned 10% in the market would net less than 8% to the cli-ent’s account after internal fees are deducted from earnings. Unlike mutual funds, an FIA does not deduct sales charges, management fees or 12b-1 marketing fees. Instead, the insurance company uses a small amount from the underlying portfolio which lowers participation in the market index to cover administrative costs and commissions to bro-kers (VanderPal, 2008). Because the FIA provides policy crediting rate formulae and periodic annuityowner reports net of any fees and management expenses, it does not separately disclose them. All distribution and management costs are already “baked in” the products’ terms and pa-rameters. No study has been published to date that shows whether these costs exceed those of retail mutual funds (taking into consideration that some of these FIA costs are not comparable, as they are incurred to provide protection against downside returns).

9
Consumer Risk Aversion Finally, most of the aforementioned fixed indexed annuity studies have failed to take into ac-count the level of risk aversion of an individual consumer.viii An exception to this pattern is the study of Babbel, Herce and Dutta (2008) that explicitly takes into account the level of consumer risk aversion. Using the criteria of multiperiod utility analysis, they find that for moderate and strongly risk-averse individuals, the fixed indexed annuity is judged superior in performance to various combinations of stocks and bonds. This is not surprising because a risk-averse consumer will penalize an investment alternative that does not avoid downside risk in a quest to achieve superior returns. Because FIA’s are designed in a way to avoid downside risk, they tend to pro-duce preferred return patterns for such consumers when compared to alternative investment strategies that expose consumers to significant levels of that risk. Conclusion Much of the analysis published on index annuities is based on hypothetical annuities and com-pletely fabricated returns, often calculated over periods that were decades before they were even introduced, or over simulated future periods whose characteristics do not conform well to eco-nomic conditions that we have ever encountered. Some studies are generated by using selected time periods and crediting criteria to produce the preordained conclusion desired. If the analysis is produced for the annuity industry the conclusion is positive, if it is directed towards the securi-ties industry it is negative. The present study, in contrast, has examined some annuities that have actually been sold, and has tracked them over their lives, including all of their periodic changes in contract “levers” such as evolving interest caps and participation rates, and their actual credited interest. While we were relegated to using a relatively short time period, at least we used the actual time period over which FIA’s have existed. We cannot say whether our data are representative of all FIA’s, al-though we assembled the largest database of actual returns that has yet been used in a published study. Our rather modest conclusion is that at least some index annuities have produced returns which have been truly competitive with certificates of deposit, fixed rate annuities, taxable bond funds, and even equities at times (Marrion, 2008). This is in contrast with assertions in other studies (discussed further in the Appendix), based on no actual return data, that the structure of FIA’s necessarily relegates them to being inferior or unsuitable products. How will index annuities perform in the future? We do not know. We do remind the reader, however, that FIA’s were not designed to be direct competitors of index investing nor have FIA’s been promoted to provide returns to compete with equity mutual funds or ETFs. The FIA is designed for safety of principal with returns linked to upside market performance.
10
Appendix on Hypothetical Returns Studies As stated earlier, the studies and articles that have been most critical of FIA’s are based entirely on hypothetical returns. Such treatments provide interesting illustrations of how an FIA could operate. However, problems arise when people begin to extrapolate from these hypothetical FIA return studies and assume that they are somehow representative of FIA contracts that are typi-cally sold. They are not. This is because the hypothetical returns are based upon hypothetical contract structures, hypothetical product parameters, and hypothetical economic environments that are built upon dubious assumptions. Below we identify five of these dubious assumptions. There are many others that we do not discuss here, but they have been discussed at length else-where in sources that we identify. Dubious Assumption #1: Real world contract designs are similar to hypothetical designs Collins, Lam and Stampfli (2009) created a term end point structure (they call it a multi-year, point-to-point) that applied a 75% participation rate to any gain over a seven-year period. They then calculated the annual return, deducted a 1% spread, and finally compounded the lower of 8% or the calculated annual yield to produce the total gain for the period. This is a rather cum-bersome structure, and one we cannot find was ever used on any index annuity. In reviewing specifications on the over 400 index annuities marketed since the first index annuity sale in February 1995 (Marrion, 2003), we failed to find any term end point product that used a crediting method which had a participation rate of less than 100% combined with both a cap and a yield spread greater than zero. Indeed, in reviewing all of the product information we have as-sembled since 1995, the only annuity we found which had a participation rate of less than 100% that could change each year and deducted a yield spread or asset fee and had a cap was the Americo FlexPlus annuity marketed around the turn of the century. However, it did not use a term end point design; instead this product used an annual reset or ratchet design, the perform-ance of which differs radically from a term end point structure (Marrion, 1996, 1997, 1998, 1999, 2000, 2001, 2002, 2003, 2004, 2005, 2006, 2007). Often a financial columnist or an occasional other writer will dismiss the index annuity concept by proposing that a consumer purchase a long-term zero-coupon bond together with an index fund instead of an index annuity (Clements, 2005; Pressman, 2007; Warner, 2005; McCann and Luo, 2006). These columnists and other writers often posit the term end point crediting method as the representative interest crediting structure. However, all term end point designs account for less than 4.5% of sales over the last four years and term end point design using two crediting components represents even less (Marrion, 2006, 2007; Moore, 2008, 2009). Indeed, Collins, Lam and Stampfli (2009) base their conclusions on a term end point that uses a cap, but less than 1% of the products have ever placed a cap on a term end point crediting method (Marrion, 2009). Such a product is certainly not representative of index annuity crediting methods in practice. The assumed index participation rates may also not be representative. For example, for their chart of seven-year periods starting in December 1988 and with the final seven-year period be-ginning in December 2000, Collins, Lam and Stampfli (2009) assume a term end point participa-tion rate of 70% to 75%, depending upon whether the seventh-year index values are averaged, and place an 8% cap on any yearly gain. Since index annuities were not around until the mid-

11
1990s we cannot decisively state what rates would have been for the early years used. However, one can gather the actual participation rate data from when products did appear. We can state that based on actual FIA’s offered, if you had purchased every available index annuity using a term-end point annuity with a seven-year term on the first business day of each month from January 1997 through December 2000 your average participation rate would have been 72% without a cap (Marrion, 1997, 1998, 1999, 2000).ix Looking at “representative” annual reset methods, Collins, Lam and Sampfli (2009) assume 55% index participation with a 7% annual cap or 60% averaged index participation with a 7.5% cap. McCann (2008) compares returns from 1990 through 2007 of the S&P 500 with a hypothetical annual reset point-to-point design that assumes a constant 6.5% cap. However, in reviewing ac-tual new money rates for annual reset designs from 1996 to the present, one would have encoun-tered effective participation this low at only a few points in 2003 and 2004 and in 2007 and 2008. Indeed, many averaging products were offering 100% first-year participation without a cap in the late ‘90s, and many annual point-to-point products have offered 100% participation allow-ing for possible double-digit gains (Marrion, 1996, 1997, 1998, 1999, 2000, 2001, 2002, 2003, 2004, 2005, 2006, 2007). There is nothing wrong with showing how a term end point method might have performed under these assumptions. However, we must keep in mind that the results of the Collins, Lam and Stampfli (2009) study are not representative of FIA’s performance, as they depend upon a credit-ing rate method not used in over 95% of sales, and combinations of other contract features not observed in practice. Dubious Assumption #2: Participation Rates and Caps Never Change Collins, Lam and Stampfli (2009) assumed an averaging method had a 60% participation rate with a 7.5% cap and applied it to the past. McCann (2008) assumed a constant 6.5% cap for all of his index annuity performance calculations, which appears to have been a cap on the date his story was completed, when interest rates were heading toward historic lows. On the day he com-pleted his story the constant maturity rate of a 10-year U.S. Treasury Note was 3.64%; by con-trast, during the 1990 until 2000 period (within the time frames of both studies) the 10-year Treasury rate was nearly twice as high, averaging 6.66% (Federal Reserve Board, 2009). Lewis (2005) assumed either a 5% or 9% cap on an annual reset design and ignored the interest rate en-vironment that might change these caps, but allowed for the returns to positively affect the T-bill comparison he made. Higher bond yields generate more interest income thus allowing carriers to buy or synthesize more options to increase index participation, which is why some annual point-to-point products were able to offer 100% participation and 14% caps in the previous decade (Marrion, 1996). Lewis (2005), McCann (2008), and Collins, Lam and Stampfli (2009) assume constant index an-nuity participation rates, while holding caps and spreads steady over long periods of time. Reichenstein (2009) attempts to remedy this by considering a matrix of renewal cap rates (al-ways constant or descending over time) while ignoring the actual evolution of cap levels on real contracts. He assumes that a particular annuity whose terms were observed in the late 1990s would have had similar parameters beginning in 1957 and continuing for almost 40 years before the first FIA arrived on the scene. (Indeed, there were not even any index funds available to indi-vidual investors until 1977, yet his study assumes that individual investors would have secured

12
better returns over that period by investing in them. His study also assumes that these funds were held together with five-year Treasury bonds that were held for only one month and then liqui-dated, replacing them with new five-year bonds every month for 52 successive years.) The flaw in these studies is that they do not take into account the real world effect of changes in interest rate environments and market volatility’s effect on the cost of providing the index par-ticipation. One cannot assume today’s product parameter levels would have existed in the past because the financial conditions of the past were often quite different. One cannot simply posit a participation rate or cap on crediting rates, hold it constant or have it worsen formulaically over time, and then attempt to make conclusive comparisons with actual stock index returns. Clearly the reach of the conclusions is limited by the unrealistic assumptions underlying the annuity modeled. Not every study adopts these simplifying assumptions. Gaillardetz and Lin (2006) note that when interest rates increase participation rates also go up, unless offset by increased volatility. One carrier suggested that the uncapped guaranteed participation rates on their seven-year averaging annual reset product from 1980 through 1995 would have ranged from 135% to 260% based on bond yields and call option prices in effect (Physicians Life, 1996). They understand that index participation is driven by bond yields and option costs and these change over time. Dubious Assumption #3: Annual Stock Market Returns of 17.6% Are Normal Collins, Lam and Sampfli (2009) mention that many attempts to show index annuity compari-sons are exercises in data mining and we quite agree. One way to data mine is to make long-term predictions based on using low participation rates that do not represent the reality of long-term rates. Another is to intentionally select periods that favor one choice over another. McCann (2008) makes a performance comparison over a 30-year period that happens to start in a year with the lowest end-of-year S&P 500 value over the previous 45 years. Using the correct December 2004 index values, the annualized growth rate of the S&P 500 for McCann’s selected comparison period is 10.05%. By contrast, the S&P 500 growth rate from December 1954 to De-cember 1984, another 30-year period, was 5.25%, and the average annual growth from Decem-ber 1964 to December 1994 was 5.79%. In the 30-year period that McCann selected for constructing his comparisons, the S&P 500 ended at 1211.92. If you used a monthly averaged annual reset method to compute where a monthly averaged S&P 500 would have ended at you get an ending value of 591, which is 49% of the ac-tual S&P 500 level. By contrast, if your 30-year period ends December 1984 the S&P 500 level is 167.24; however, the monthly averaged S&P 500 computed value is 161.37, almost equal to the actual S&P 500 level. Many performance comparisons pit index annuities against stock mar-ket investments over the ‘80s and ‘90s when stock market returns averaged 17.6% and ignore the preceding eight decades with their average return of 8.5% (Bogle, 2003). Dubious Assumption #4: Stock Market Returns Conform to a Normal Distribution, Inter-est Rates and Volatility Are Constant A more egregious problem in some of the studies that simply simulate hypothetical stock market return scenarios in order to generate hypothetical policy crediting rates is that the simulations are

13
often based on an assumed distribution of stock returns that cannot be supported. For example, McCann and Luo (2006) have conducted studies of hypothetical crediting rate behavior assum-ing that equity market rates of return conform to a Normal distribution. When Babbel, Herce and Dutta (2008) re-examined that study but used an empirical distribution that matched the histori-cal record, while keeping in tact all of the other assumptions of McCann and Luo, they found that annual crediting rates in the range of 5-15% were about twice as common as what were be-ing credited under the Normal distribution assumption. This implies that FIA’s were far more valuable than was being represented under the hypothetical distribution of stock market returns. In a similar vein, several studies assume that interest rates and volatility are constant throughout an annuity’s life, in order to construct their performance comparisons. Of course the simplifying assumption has never occurred in the marketplace, and the alternative investments to which FIA’s are compared have their returns affected by interest rate movements as well as volatility changes. Dubious Assumption #5: Managerial Discretion Is Not Involved Over 95% of index annuity sales are in products that may change at least one element of their interest crediting methodology after each reset period. Two primary factors affecting subsequent index participation are bond yields and the price of call options (Gaillardetz and Lin, 2006). However, the ultimate determining factor in setting index participation in future years is not the interest rate environment or the cost of options, it is what carrier management decides to do. This human element introduces a random variable that cannot be quantified, thereby making any at-tempt to project any returns ultimately subjective. On the other hand, although the insurer does have discretion periodically to change certain con-tract parameters, such as the cap levels or participation rates, it does not have unfettered discre-tion to alter them, because the contracts themselves have minimum guaranteed levels for both, as well as state minimum nonforfeiture value schedules. Moreover, and more importantly, the in-surer faces the discipline of the market. If it tries to credit less than a competitive and fair rate, it will face the dissatisfaction of its consumers, the rancor of its agents, the cost of lapsation and policy surrender, and the hesitancy of agents to ever put future clients in such products. This would essentially be the death knell of its future business. Therefore, consumers have at least three layers of protection – contractual minimums, state minimum nonforfeiture values, and competition enforced by both consumers and, more importantly, agents (because they are more aware of what other companies are offering and have a financial incentive to replace underper-forming policies) – which should assuage the risk aversion of many.

14
References Babbel, David F., Migel A. Herce, and Kabir Dutta. 2008. “Un-Supermodels and the FIA.” Presentation given at the Morningstar- Ibbotson Associates / IFID Centre Retirement Income Products Executive Symposium, University of Chicago, November 11; the slides presentation is available at: http://corporate.morningstar.com/ib/documents/UserGuides/UnSupermodelsFIA.pdf and the video pres-entation at: http://corporate.morningstar.com/ib/tools/David_Babbel/tape2b.html
Babbel, David F. and Craig Merrill. 2005. “Real and Illusory Value Creation by Insurance Companies.” Journal of Risk and Insurance 72:1 (March).
Babbel, David F. and Ravi Reddy. 2009. “Measuring the Tax Benefit of a Tax-Deferred Annuity.” Jour-nal of Financial Planning 22:10 (October).
Bogle, John C. 2005. “The Relentless Rules of Humble Arithmetic.” Financial Analysts Journal 61:6 (November/December).
Bogle, John C. 2003. “The policy portfolio in an era of subdued returns.” Speech before the Investment Analysts Society of Chicago and The EnnisKnupp Client Conference. Chicago, IL. (June 5). Bogle Fi-nancial Markets Research Center. http://www.vanguard.com/bogle_site/sp20030605.html
Collins, Patrick J., Huy Lam, and Josh Stampfli. 2009. “Equity Indexed Annuities: Downside Protection, But at What Cost?” Journal of Financial Planning 22:5 (May).
Clements, Jonathan. 2005. “A do-it-yourself kit for investors: Build your own equity-indexed annuity.” Wall Street Journal. (January 26):D.1.
Crittenden, Eric and Col Wilcox. 2008. “The Capitalism Distribution – The Realities of Common Stock Returns.” BlackStar Funds. http://[email protected]/files/TheCapitalismDistribution.pdf
Fama, Eugene. 1965. “The Behavior of Stock-Market Prices.” Journal of Business 38:1 (January).
Federal Reserve Board of Governors. “10-Year Treasury Constant Maturity Rate. H.15. 2009-06-02 9:06 AM CDT Release.”
Gaillardetz, Patrice, and X Sheldon Lin. 2006. “Valuation of equity-linked insurance and annuity prod-ucts with binomial models.” North American Actuarial Journal 10:4 (October).
Koco, Linda. (2010) “Year end annuity results flow in.” National Underwriter 115:4 (February).
Lewis, W. Cris. 2005. A return-risk evaluation of an indexed annuity investment. The Journal of Wealth Management 7:4 (Spring).
Mandelbrot, Benoît. 1963. “The variation of certain speculative prices.” Journal of Business 36:4 (Octo-ber).
Marrion, Jack. 2009. “Product Trends.” Index Compendium. Advantage Compendium, Ltd. 13:7.
Marrion, Jack. 2008. “Fixed annuities are competitive with taxable bond mutual funds.” Index Compen-dium 12:2.
Marrion, Jack. 2003. Index Annuities: Power & Protection. Advantage Group. St. Louis.
Marrion, Jack. 2002. “Interest crediting concepts.” Advantage Compendium, Ltd. 6:3.
Marrion, Jack. 1996-2000. Index Annuities Report. Advantage Compendium, Ltd.
Marrion, Jack. 1996-2007. Advantage Index Product Sales & Market Report. Advantage Compendium, Ltd. Volumes 1-39.
McCann, Craig J. 2008. “An Economic Analysis of Equity-Indexed Annuities.” Securities Litigation & Consulting Group, Inc. (September 10).
McCann, Craig J. and Dengpan Luo. 2006. “An Overview of Equity-Indexed Annuities.” Securities Liti-gation & Consulting Group, Inc. (June).

15
Moore, Sheryl. 2007-2009. Advantage Index Product Sales & Market Report. AnnuitySpecs.com. Vol-umes 40-46.
Physicians Life Insurance Company. 1996. Vista 500 Market Index Annuity Producers Guide, p.15.
Pressman, Aaron. 2007. “Retirement made complicated; why equity-indexed annuities have a bad name and what investors need to know.” Business Week. Sep 24, Issue 4051; pg. 98.
Reichenstein, William. 2009. “Financial Analysis of Equity-Indexed Annuities.” Financial Services Re-view 18:3 (December).
Richardson, M. T. 2009. The Ivy Portfolio. Hoboken: John Wiley & Sons, Inc.
Taleb, N. N. 2007. The Black Swan:The Impact of the Highly Improbable. London: Penguin Books.
VanderPal, Geoffrey. (2008) “Equity Index Annuities.” Journal of Personal Finance 7:2.
VanderPal, Geoffrey. (2004) “The Advantages and Disadvantages of Equity Index Annuities.” Journal of Financial Planning 17:1 (January).
Warner, Joan. 2005. “EIAs: Behind the hype: Equity-indexed annuities are flying off the shelves, but they carry risks that regulators fear are not fully disclosed.” Financial Planning (October). Endnotes i A recent confirmation of this finding is in Babbel, Herce and Dutta (2008). In their study, the authors found that there was less than one chance in a million that monthly stock market returns from 1926-2008, and various sub-periods during that time interval, conform to a Normal distribution, whether measured by a Jarque-Bera, an Anderson-Darling, or a Kolmogorov-Smirnov goodness of fit test.
ii See, for example, Collins, Lam and Stampfli (2009), Lewis (2005), McCann and Luo (2006), McCann (2008), Reichenstein (2009) and Warner (2005). These will be discussed in depth in the Appendix.
iii Refer again to all of the articles indicated in endnote ii as well as Clements (2005) and Pressman (2007).
iv Again, we refer the reader to the articles cited in endnote ii.
v A more direct comparison with McCann’s 14-year hypothetical periods is provided by Babbel, Dutta and Herce (2009).
vi For example, in 2010 the flat premature withdrawal interest penalty on its five-year CD’s ranged from 60 days to two years of interest, regardless of how early or late one makes the premature withdrawal.
vii Their study showed that an alternative portfolio would have to generate an additional pre-tax return that in some cases reached over 200 basis points per year. The ultimate size of the tax benefit from tax deferral depends on the length of time the annuity is held during the accumulation and decumulation phases of ownership, whether a deferred annuity is annuitized at the end of the surrender period, or taken as a lump sum distribution, the level of yields net of expenses, the marginal tax rates on ordinary income of the investor, and the differential between tax rates on ordinary income and tax-preferred treatment of dividends and capital gains. McCann and Luo (2006) claimed that the benefits of tax deferral were “de minimis.”
viii Some unpublished studies have been performed in a litigation context where long-term zero-coupon bonds are used, together with index funds, to craft an alternative portfolio and compare its returns to hy-pothetical FIA’s. We used Treasury bills in this study to make it conform to most of the published studies.
ix To be precise, the average term end point participation rates for seven-year periods were: 1997-87%, 1998-71%, 1999-61%, 2000-70%.