Embed Size (px)
Citation preview

1
Q2, 2014 Management Roadshow WHA Corporation Public Company Limited
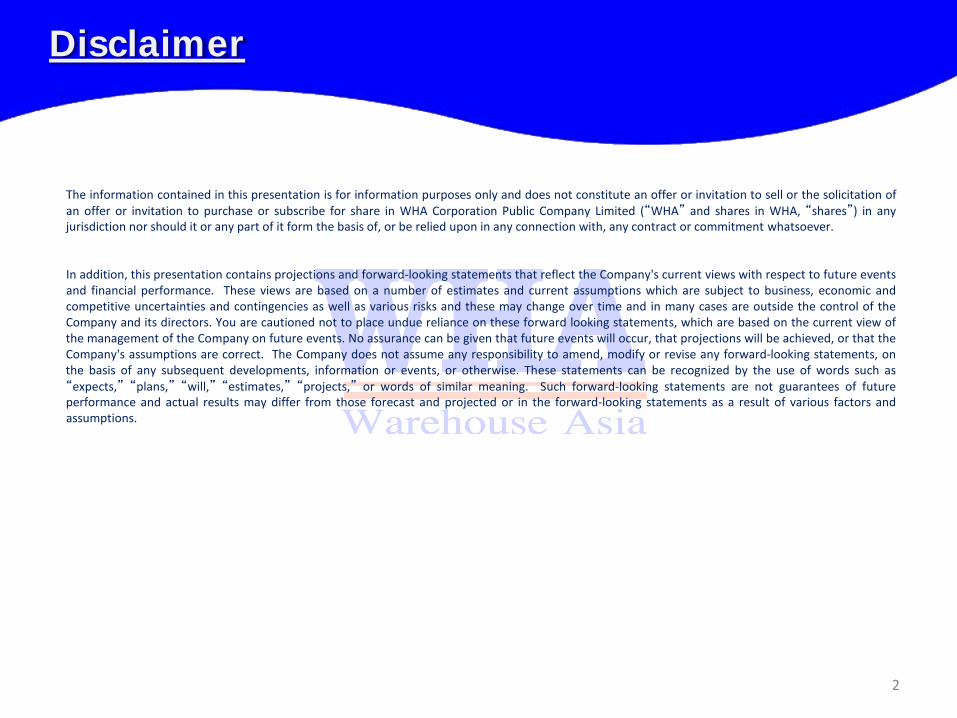
The information contained in this presentation is for information purposes only and does not constitute an offer or invitation to sell or the solicitation of an offer or invitation to purchase or subscribe for share in WHA Corporation Public Company Limited (“WHA” and shares in WHA, “shares”) in any jurisdiction nor should it or any part of it form the basis of, or be relied upon in any connection with, any contract or commitment whatsoever. In addition, this presentation contains projections and forward-looking statements that reflect the Company's current views with respect to future events and financial performance. These views are based on a number of estimates and current assumptions which are subject to business, economic and competitive uncertainties and contingencies as well as various risks and these may change over time and in many cases are outside the control of the Company and its directors. You are cautioned not to place undue reliance on these forward looking statements, which are based on the current view of the management of the Company on future events. No assurance can be given that future events will occur, that projections will be achieved, or that the Company's assumptions are correct. The Company does not assume any responsibility to amend, modify or revise any forward-looking statements, on the basis of any subsequent developments, information or events, or otherwise. These statements can be recognized by the use of words such as “expects,” “plans,” “will,” “estimates,” “projects,” or words of similar meaning. Such forward-looking statements are not guarantees of future performance and actual results may differ from those forecast and projected or in the forward-looking statements as a result of various factors and assumptions.
Disclaimer
2
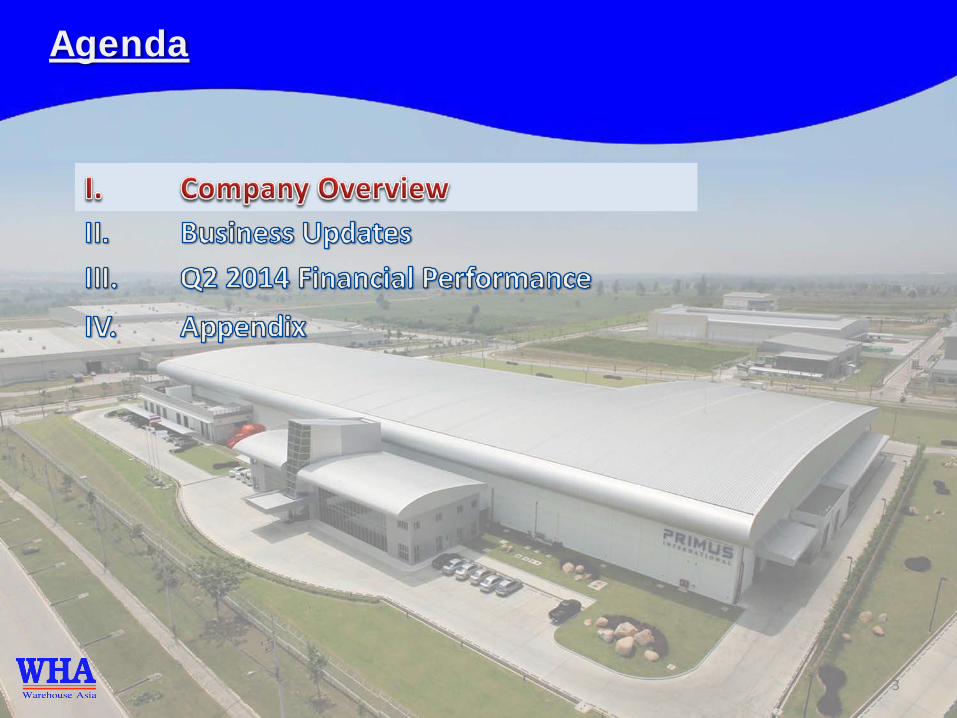
Agenda
3
4
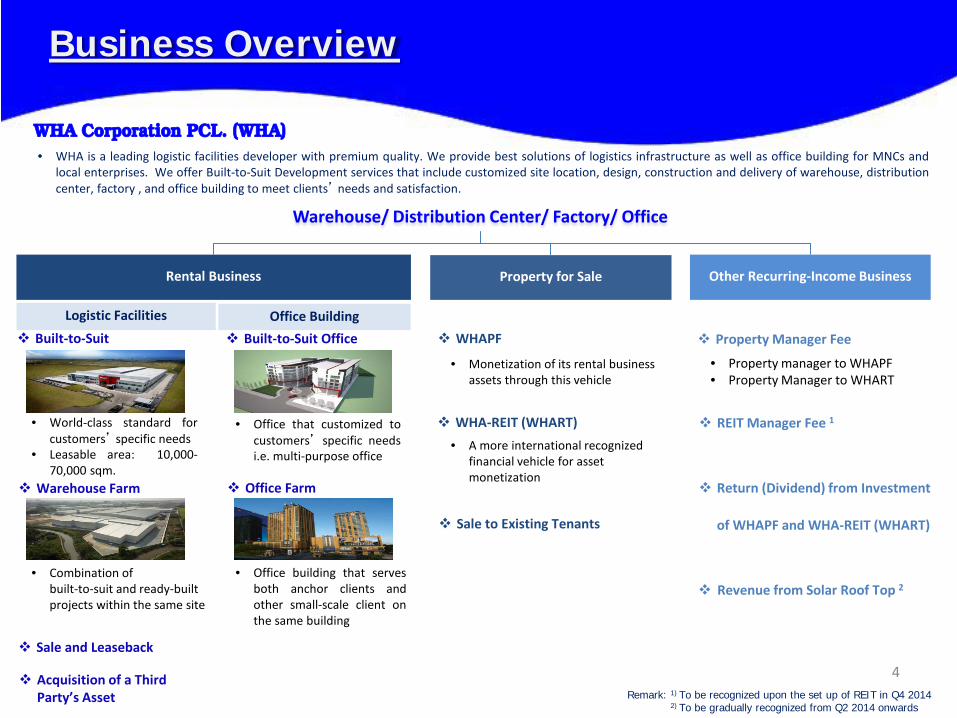
WHA Corporation PCL. (WHA)
Warehouse/ Distribution Center/ Factory/ Office
Warehouse Farm
Built-to-Suit
• World-class standard for customers’ specific needs
• Leasable area: 10,000-70,000 sqm.
• Combination of built-to-suit and ready-built projects within the same site
• Monetization of its rental business assets through this vehicle
Sale to Existing Tenants
WHAPF
Return (Dividend) from Investment
of WHAPF and WHA-REIT (WHART)
Property Manager Fee
• Property manager to WHAPF • Property Manager to WHART
Sale and Leaseback
Business Overview
Revenue from Solar Roof Top 2
Remark: 1) To be recognized upon the set up of REIT in Q4 2014 2) To be gradually recognized from Q2 2014 onwards
REIT Manager Fee 1
Office Farm
Built-to-Suit Office
• Office that customized to customers’ specific needs i.e. multi-purpose office
• Office building that serves both anchor clients and other small-scale client on the same building
Office Building Logistic Facilities
Acquisition of a Third Party’s Asset
Rental Business Property for Sale Other Recurring-Income Business
• WHA is a leading logistic facilities developer with premium quality. We provide best solutions of logistics infrastructure as well as office building for MNCs and local enterprises. We offer Built-to-Suit Development services that include customized site location, design, construction and delivery of warehouse, distribution center, factory , and office building to meet clients’ needs and satisfaction.
WHA-REIT (WHART) • A more international recognized
financial vehicle for asset monetization
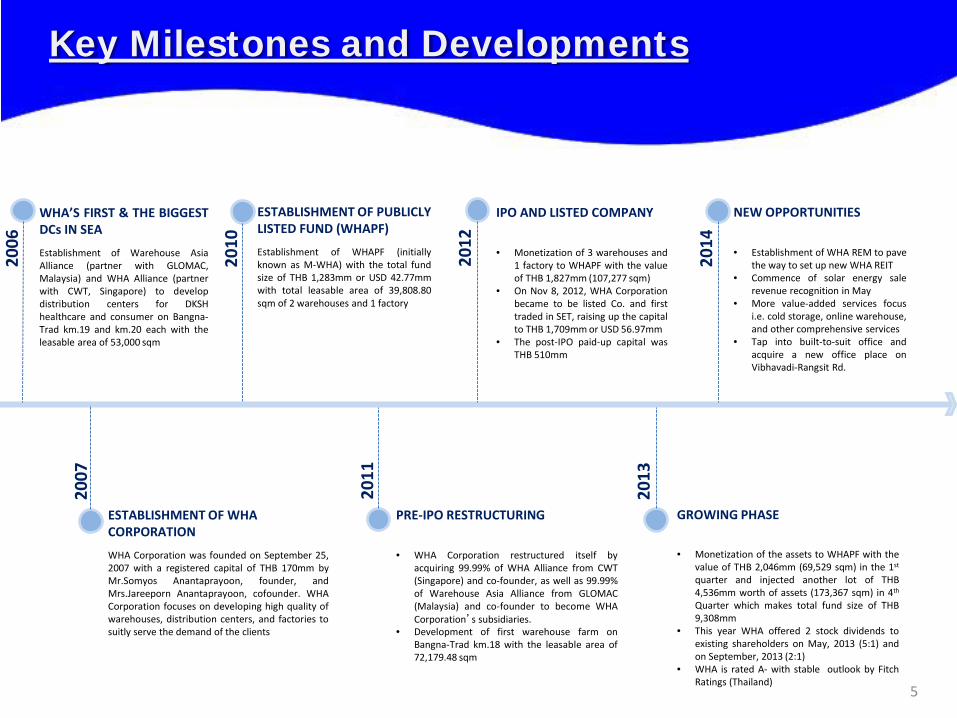
GROWING PHASE • Monetization of the assets to WHAPF with the
value of THB 2,046mm (69,529 sqm) in the 1st quarter and injected another lot of THB 4,536mm worth of assets (173,367 sqm) in 4th Quarter which makes total fund size of THB 9,308mm
• This year WHA offered 2 stock dividends to existing shareholders on May, 2013 (5:1) and on September, 2013 (2:1)
• WHA is rated A- with stable outlook by Fitch Ratings (Thailand)
ESTABLISHMENT OF PUBLICLY LISTED FUND (WHAPF)
Establishment of WHAPF (initially known as M-WHA) with the total fund size of THB 1,283mm or USD 42.77mm with total leasable area of 39,808.80 sqm of 2 warehouses and 1 factory
ESTABLISHMENT OF WHA CORPORATION
WHA Corporation was founded on September 25, 2007 with a registered capital of THB 170mm by Mr.Somyos Anantaprayoon, founder, and Mrs.Jareeporn Anantaprayoon, cofounder. WHA Corporation focuses on developing high quality of warehouses, distribution centers, and factories to suitly serve the demand of the clients
WHA’S FIRST & THE BIGGEST DCs IN SEA
Establishment of Warehouse Asia Alliance (partner with GLOMAC, Malaysia) and WHA Alliance (partner with CWT, Singapore) to develop distribution centers for DKSH healthcare and consumer on Bangna-Trad km.19 and km.20 each with the leasable area of 53,000 sqm
Key Milestones and Developments
5
PRE-IPO RESTRUCTURING • WHA Corporation restructured itself by
acquiring 99.99% of WHA Alliance from CWT (Singapore) and co-founder, as well as 99.99% of Warehouse Asia Alliance from GLOMAC (Malaysia) and co-founder to become WHA Corporation’s subsidiaries.
• Development of first warehouse farm on Bangna-Trad km.18 with the leasable area of 72,179.48 sqm
2007
2006
2010
2011
IPO AND LISTED COMPANY • Monetization of 3 warehouses and
1 factory to WHAPF with the value of THB 1,827mm (107,277 sqm)
• On Nov 8, 2012, WHA Corporation became to be listed Co. and first traded in SET, raising up the capital to THB 1,709mm or USD 56.97mm
• The post-IPO paid-up capital was THB 510mm
2013
2012
NEW OPPORTUNITIES • Establishment of WHA REM to pave
the way to set up new WHA REIT • Commence of solar energy sale
revenue recognition in May • More value-added services focus
i.e. cold storage, online warehouse, and other comprehensive services
• Tap into built-to-suit office and acquire a new office place on Vibhavadi-Rangsit Rd.
2014
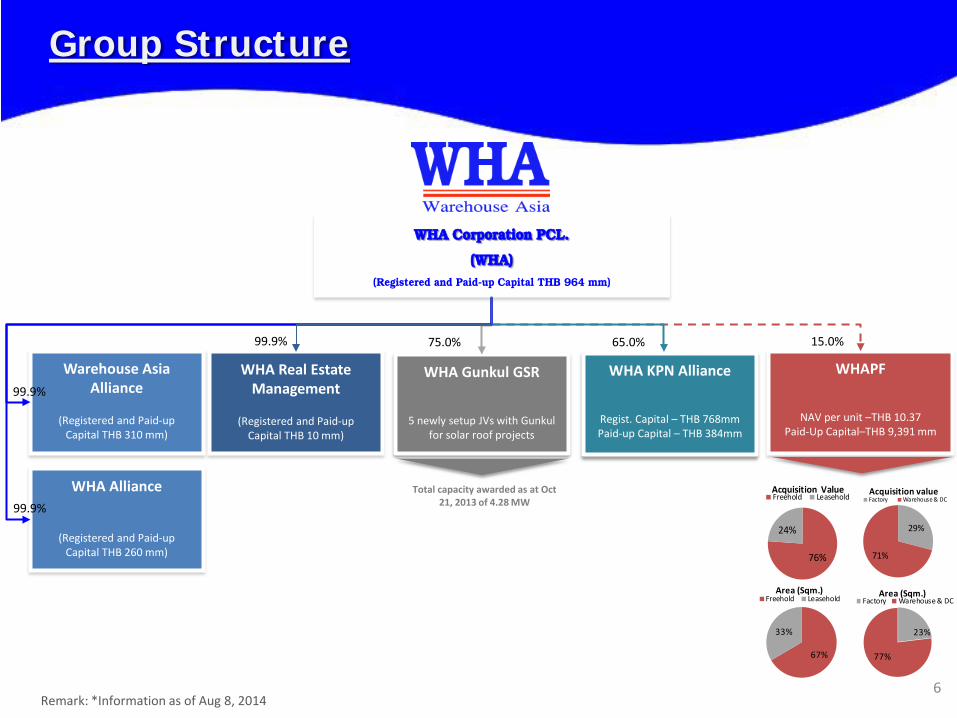
Warehouse Asia Alliance
(Registered and Paid-up
Capital THB 310 mm)
WHA Alliance
(Registered and Paid-up Capital THB 260 mm)
WHAPF
NAV per unit –THB 10.37 Paid-Up Capital–THB 9,391 mm
WHA Gunkul GSR
5 newly setup JVs with Gunkul for solar roof projects
Total capacity awarded as at Oct 21, 2013 of 4.28 MW
99.9%
15.0% 75.0%
WHA Corporation PCL.
(WHA) (Registered and Paid-up Capital THB 964 mm)
Group Structure
WHA KPN Alliance
Regist. Capital – THB 768mm Paid-up Capital – THB 384mm
76%
24%
Acquisition ValueFreehold Leasehold
29%
71%
Acquisition valueFactory Warehouse & DC
67%
33%
Area (Sqm.)Freehold Leasehold
23%
77%
Area (Sqm.)Factory Warehouse & DC
65.0%
6
99.9%
WHA Real Estate Management
(Registered and Paid-up
Capital THB 10 mm)
99.9%
Remark: *Information as of Aug 8, 2014
7
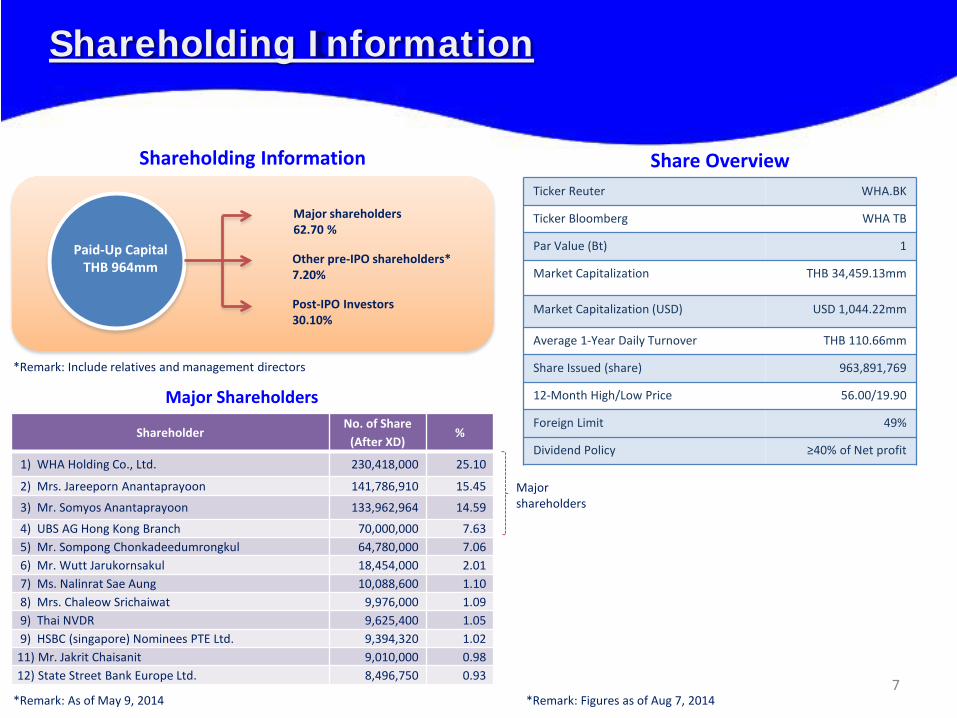
Shareholding Information
Major Shareholders
Shareholder No. of Share
(After XD) %
1) WHA Holding Co., Ltd. 230,418,000 25.10
2) Mrs. Jareeporn Anantaprayoon 141,786,910 15.45
3) Mr. Somyos Anantaprayoon 133,962,964 14.59
4) UBS AG Hong Kong Branch 70,000,000 7.63 5) Mr. Sompong Chonkadeedumrongkul 64,780,000 7.06 6) Mr. Wutt Jarukornsakul 18,454,000 2.01 7) Ms. Nalinrat Sae Aung 10,088,600 1.10 8) Mrs. Chaleow Srichaiwat 9,976,000 1.09 9) Thai NVDR 9,625,400 1.05 9) HSBC (singapore) Nominees PTE Ltd. 9,394,320 1.02 11) Mr. Jakrit Chaisanit 9,010,000 0.98 12) State Street Bank Europe Ltd. 8,496,750 0.93
Paid-Up Capital THB 964mm
Major shareholders 62.70 %
Other pre-IPO shareholders* 7.20%
Post-IPO Investors 30.10%
Share Overview
*Remark: As of May 9, 2014
*Remark: Include relatives and management directors
*Remark: Figures as of Aug 7, 2014
Shareholding Information
Ticker Reuter WHA.BK
Ticker Bloomberg WHA TB
Par Value (Bt) 1
Market Capitalization THB 34,459.13mm
Market Capitalization (USD) USD 1,044.22mm
Average 1-Year Daily Turnover THB 110.66mm
Share Issued (share) 963,891,769
12-Month High/Low Price 56.00/19.90
Foreign Limit 49%
Dividend Policy ≥40% of Net profit
Major shareholders
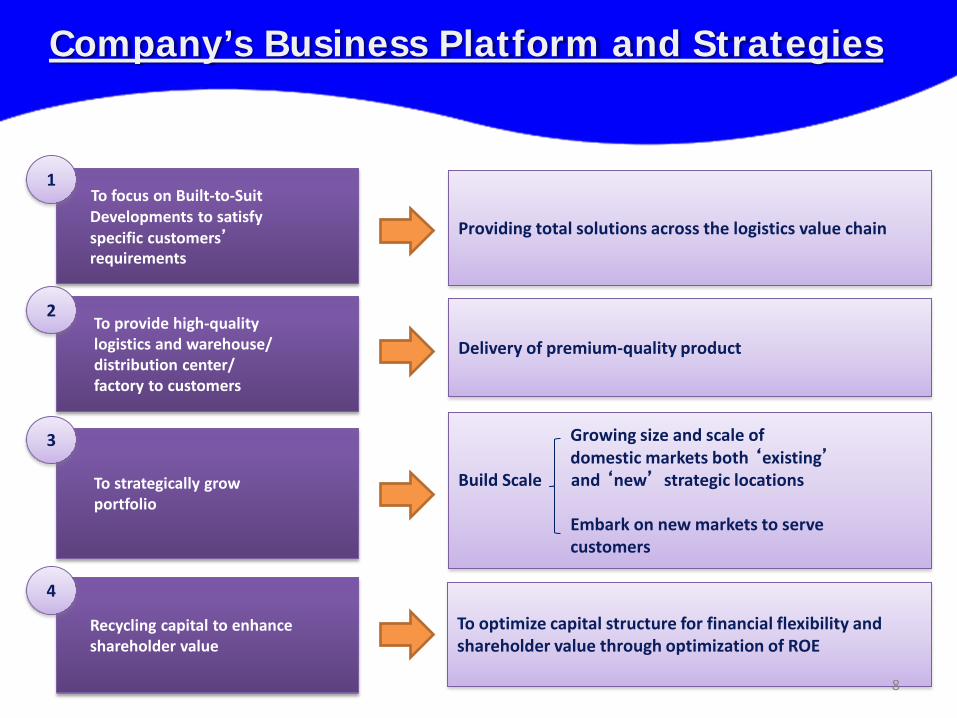
To optimize capital structure for financial flexibility and shareholder value through optimization of ROE
Growing size and scale of domestic markets both ‘existing’ Build Scale and ‘new’ strategic locations Embark on new markets to serve customers
Delivery of premium-quality product
Providing total solutions across the logistics value chain
8
To focus on Built-to-Suit Developments to satisfy specific customers’ requirements
To provide high-quality logistics and warehouse/ distribution center/ factory to customers
To strategically grow portfolio
Recycling capital to enhance shareholder value
1
2
3
4
Company’s Business Platform and Strategies
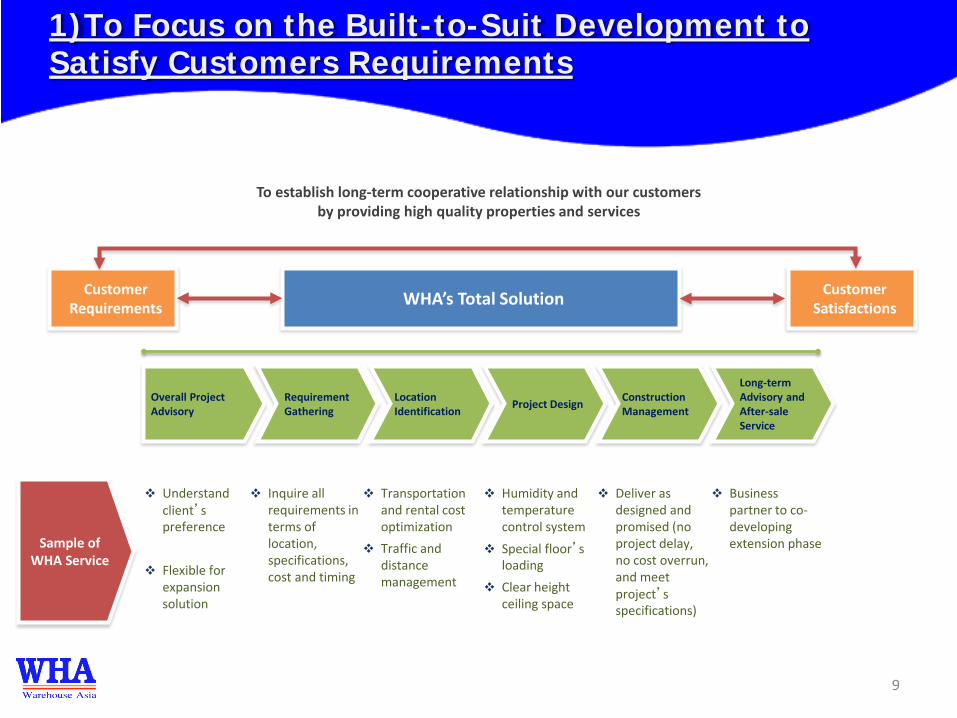
Inquire all requirements in terms of location, specifications, cost and timing
Transportation and rental cost optimization
Traffic and distance management
Humidity and temperature control system
Special floor’s loading
Clear height ceiling space
Deliver as designed and promised (no project delay, no cost overrun, and meet project’s specifications)
Business partner to co-developing extension phase
Understand client’s preference
Flexible for expansion solution
Overall Project Advisory
Requirement Gathering
Location Identification Project Design Construction
Management
Long-term Advisory and After-sale Service
Customer Requirements
Customer Satisfactions WHA’s Total Solution
To establish long-term cooperative relationship with our customers by providing high quality properties and services
Sample of WHA Service
9
1)To Focus on the Built-to-Suit Development to Satisfy Customers Requirements
10
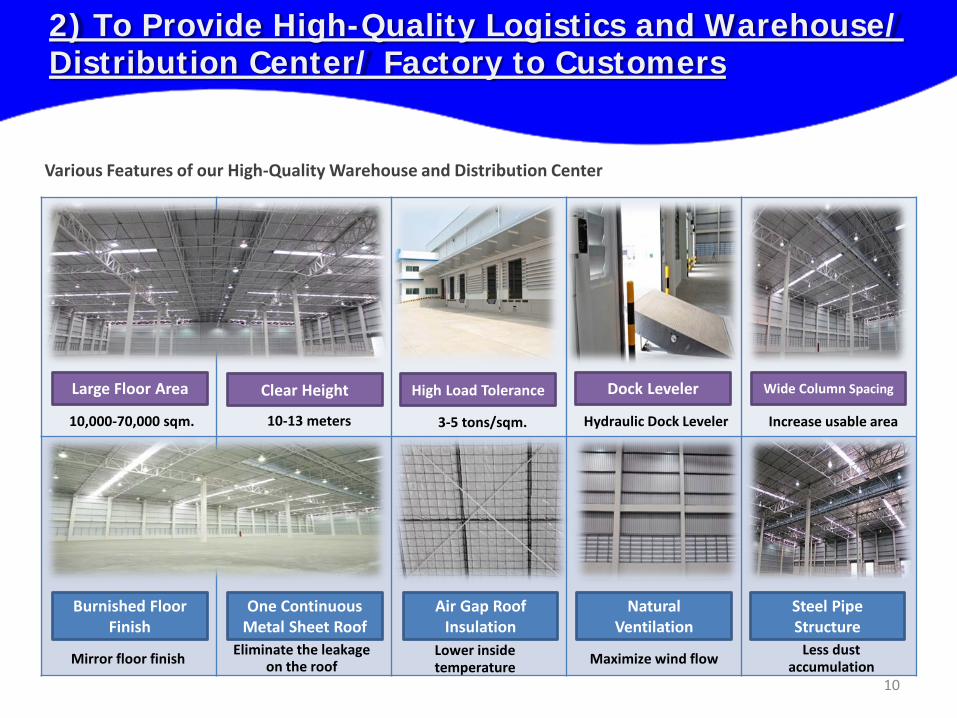
Various Features of our High-Quality Warehouse and Distribution Center
Large Floor Area Clear Height High Load Tolerance Dock Leveler Wide Column Spacing
Burnished Floor Finish
One Continuous Metal Sheet Roof
Air Gap Roof Insulation
Natural Ventilation
Steel Pipe Structure
10,000-70,000 sqm. 10-13 meters 3-5 tons/sqm.
Mirror floor finish Eliminate the leakage
on the roof Lower inside temperature
Maximize wind flow Less dust
accumulation
Increase usable area Hydraulic Dock Leveler
2) To Provide High-Quality Logistics and Warehouse/ Distribution Center/ Factory to Customers
U-Tapao Airport
Bangkok Port
Laem Chabang Port
Map Ta phut Port
Bangna-Trad K.M.19
Bangna-Trad Km.18
Bangna-Trad Km.19
Lardkrabang
Chonburi
Bangna-Trad Km.20
Saraburi
Amata City
Bang pa-in Wang-Noi K.M.61
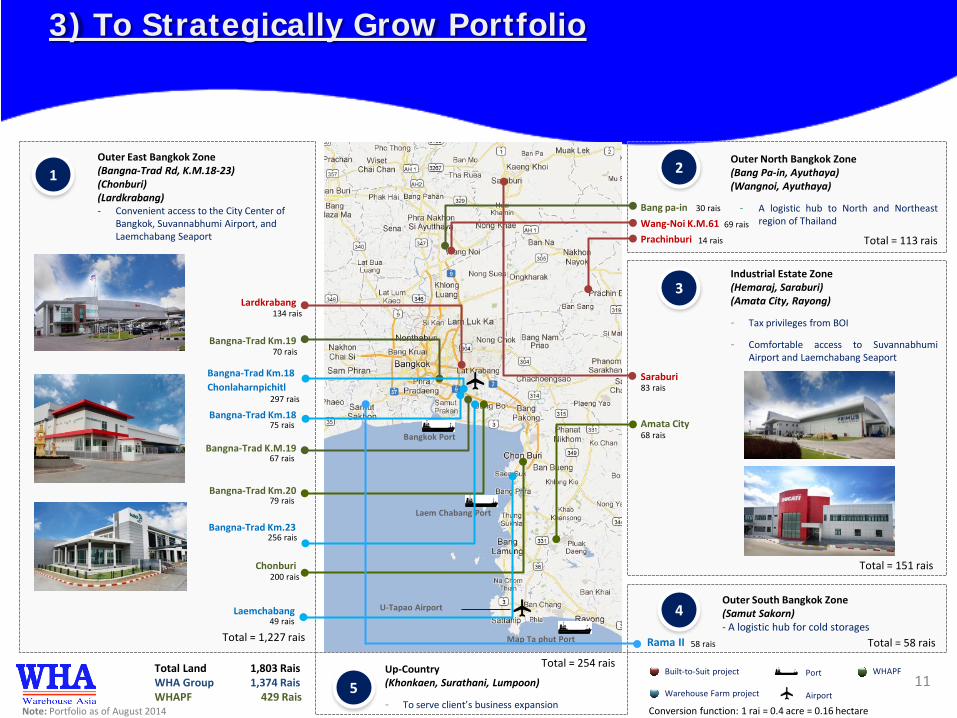
Outer East Bangkok Zone (Bangna-Trad Rd, K.M.18-23) (Chonburi) (Lardkrabang) - Convenient access to the City Center of
Bangkok, Suvannabhumi Airport, and Laemchabang Seaport
Industrial Estate Zone (Hemaraj, Saraburi) (Amata City, Rayong)
- Tax privileges from BOI
- Comfortable access to Suvannabhumi Airport and Laemchabang Seaport
2 Outer North Bangkok Zone (Bang Pa-in, Ayuthaya) (Wangnoi, Ayuthaya)
- A logistic hub to North and Northeast region of Thailand
Note: Portfolio as of August 2014
Built-to-Suit project
Warehouse Farm project
WHAPF Port
Airport
Bangna-Trad Km.23
3
1
11
Prachinburi
Bangna-Trad Km.18 Chonlaharnpichitl
Laemchabang 4
Rama II 58 rais
134 rais
70 rais
297 rais
75 rais
67 rais
79 rais
256 rais
200 rais
49 rais
30 rais
14 rais
83 rais
68 rais
69 rais
Total = 1,227 rais
Total = 113 rais
Total = 151 rais
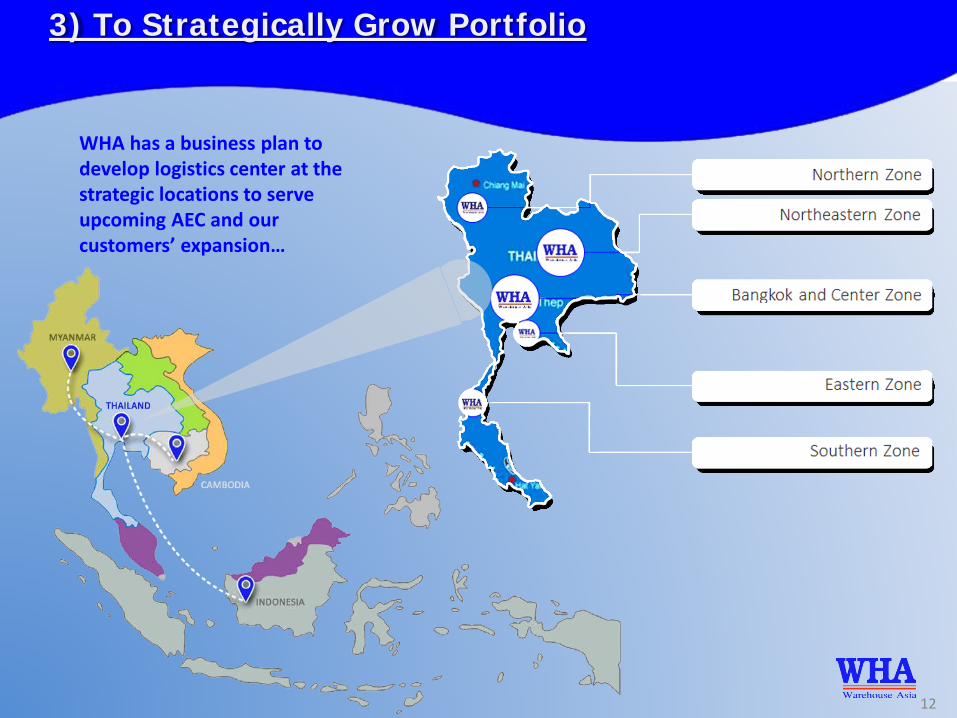
Outer South Bangkok Zone (Samut Sakorn) - A logistic hub for cold storages
Total Land 1,803 Rais WHA Group 1,374 Rais WHAPF 429 Rais
135 rais
Up-Country (Khonkaen, Surathani, Lumpoon)
- To serve client’s business expansion 5
3) To Strategically Grow Portfolio
Total = 254 rais
Total = 58 rais
Conversion function: 1 rai = 0.4 acre = 0.16 hectare
12
3) To Strategically Grow Portfolio
WHA has a business plan to develop logistics center at the strategic locations to serve upcoming AEC and our customers’ expansion…
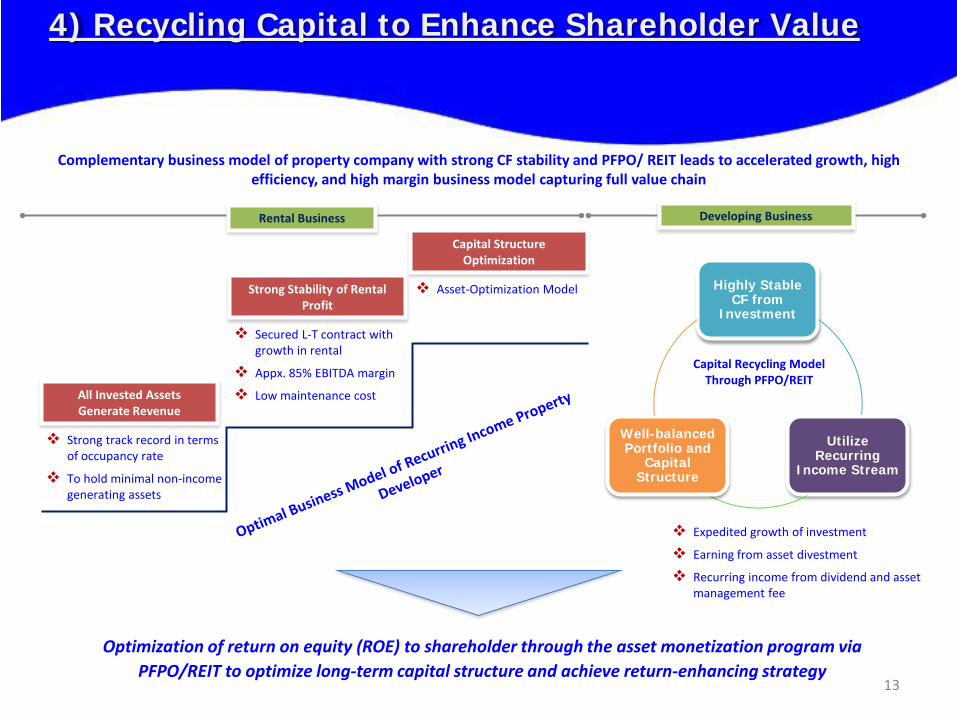
Highly Stable CF from
Investment
Utilize Recurring
Income Stream
Well-balanced Portfolio and
Capital Structure
All Invested Assets Generate Revenue
Strong track record in terms of occupancy rate
To hold minimal non-income generating assets
Strong Stability of Rental Profit
Secured L-T contract with growth in rental
Appx. 85% EBITDA margin
Low maintenance cost
Capital Structure Optimization
Asset-Optimization Model
Optimization of return on equity (ROE) to shareholder through the asset monetization program via PFPO/REIT to optimize long-term capital structure and achieve return-enhancing strategy
Rental Business Developing Business
Expedited growth of investment
Earning from asset divestment
Recurring income from dividend and asset management fee
Complementary business model of property company with strong CF stability and PFPO/ REIT leads to accelerated growth, high efficiency, and high margin business model capturing full value chain
Capital Recycling Model Through PFPO/REIT
13
4) Recycling Capital to Enhance Shareholder Value
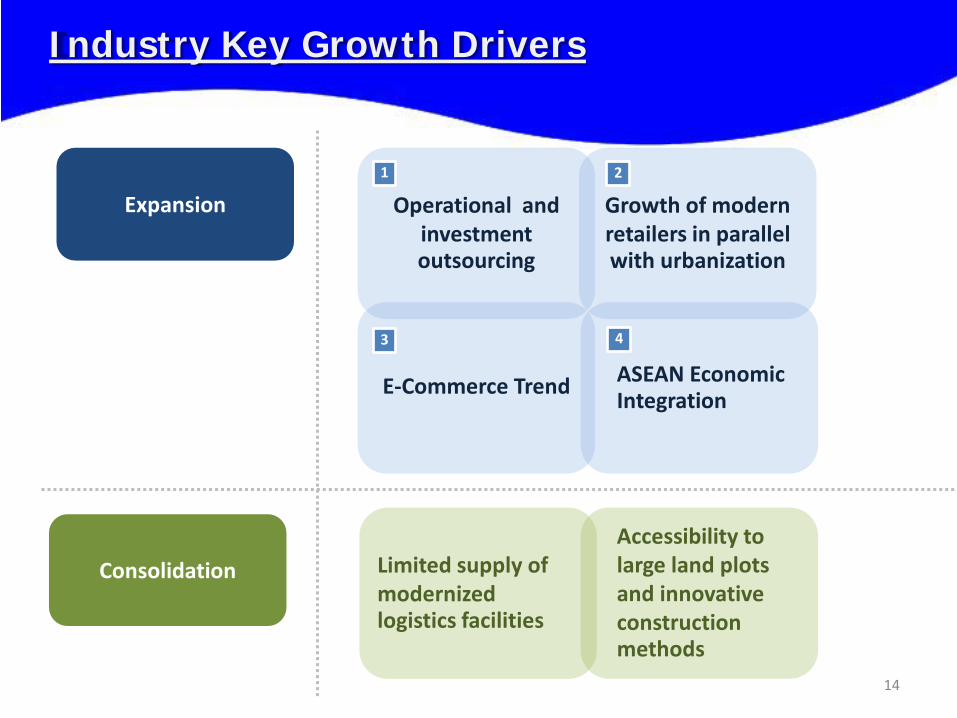
Expansion
Consolidation
Operational and investment outsourcing
Growth of modern retailers in parallel with urbanization
E-Commerce Trend ASEAN Economic Integration
Limited supply of modernized logistics facilities
Accessibility to large land plots and innovative construction methods
Industry Key Growth Drivers
14
1 2
4 3
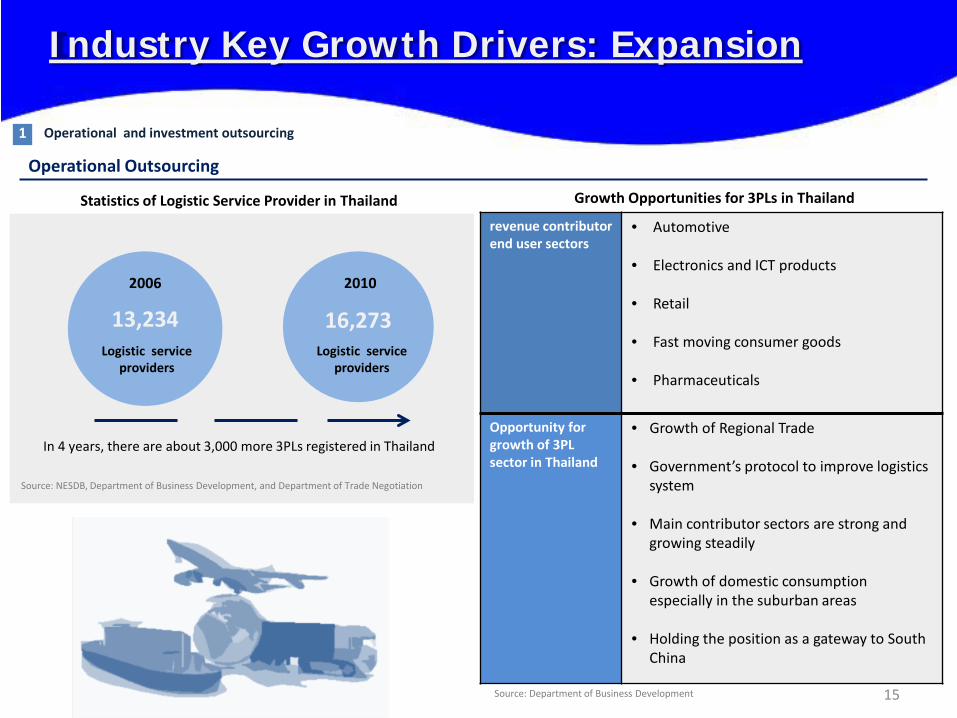
Statistics of Logistic Service Provider in Thailand
13,234
2006
Logistic service providers
16,273
2010
Logistic service providers
In 4 years, there are about 3,000 more 3PLs registered in Thailand
Source: NESDB, Department of Business Development, and Department of Trade Negotiation
revenue contributor end user sectors
• Automotive
• Electronics and ICT products
• Retail
• Fast moving consumer goods
• Pharmaceuticals
Opportunity for growth of 3PL sector in Thailand
• Growth of Regional Trade
• Government’s protocol to improve logistics system
• Main contributor sectors are strong and growing steadily
• Growth of domestic consumption especially in the suburban areas
• Holding the position as a gateway to South China
Growth Opportunities for 3PLs in Thailand
Source: Department of Business Development
Industry Key Growth Drivers: Expansion
15
1 Operational and investment outsourcing
Operational Outsourcing
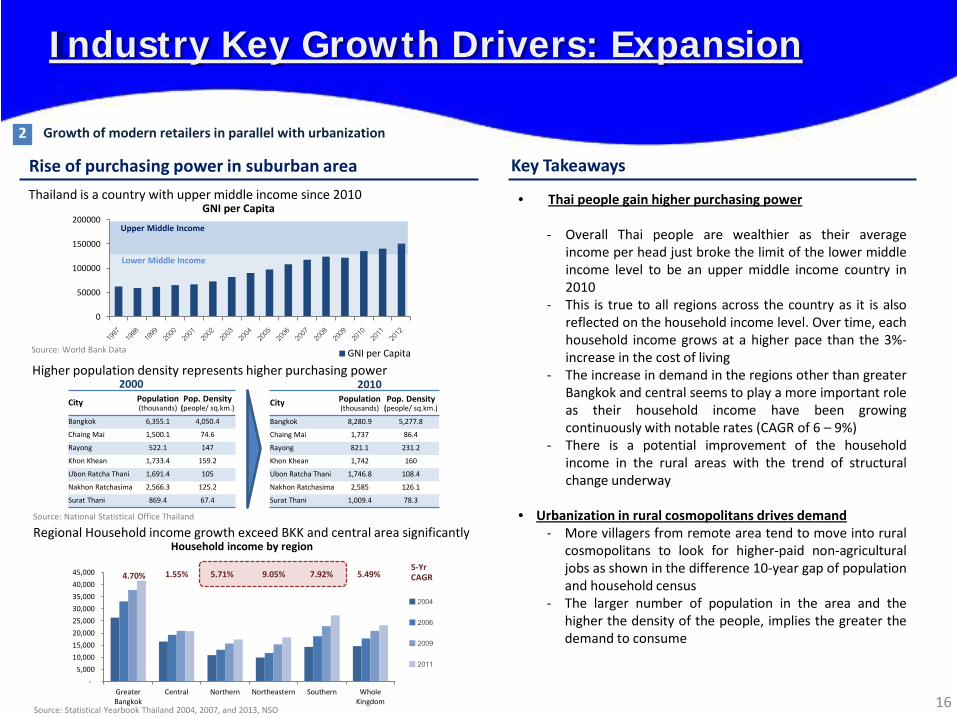
Thailand is a country with upper middle income since 2010
0
50000
100000
150000
200000GNI per Capita
GNI per Capita
Upper Middle Income
Lower Middle Income
Source: World Bank Data
Source: Statistical Yearbook Thailand 2004, 2007, and 2013, NSO
Regional Household income growth exceed BKK and central area significantly
16 -
5,000 10,000 15,000 20,000 25,000 30,000 35,000 40,000 45,000
GreaterBangkok
Central Northern Northeastern Southern WholeKingdom
Household income by region
2004
2006
2009
2011
4.70% 1.55% 5.49% 5-Yr CAGR 5.71% 9.05% 7.92%
Higher population density represents higher purchasing power
Source: National Statistical Office Thailand
City Population (thousands)
Pop. Density (people/ sq.km.)
Bangkok 6,355.1 4,050.4
Chaing Mai 1,500.1 74.6
Rayong 522.1 147
Khon Khean 1,733.4 159.2
Ubon Ratcha Thani 1,691.4 105
Nakhon Ratchasima 2,566.3 125.2
Surat Thani 869.4 67.4
City Population (thousands)
Pop. Density (people/ sq.km.)
Bangkok 8,280.9 5,277.8
Chaing Mai 1,737 86.4
Rayong 821.1 231.2
Khon Khean 1,742 160
Ubon Ratcha Thani 1,746.8 108.4
Nakhon Ratchasima 2,585 126.1
Surat Thani 1,009.4 78.3
2000 2010
Key Takeaways Rise of purchasing power in suburban area
• Thai people gain higher purchasing power - Overall Thai people are wealthier as their average
income per head just broke the limit of the lower middle income level to be an upper middle income country in 2010
- This is true to all regions across the country as it is also reflected on the household income level. Over time, each household income grows at a higher pace than the 3%-increase in the cost of living
- The increase in demand in the regions other than greater Bangkok and central seems to play a more important role as their household income have been growing continuously with notable rates (CAGR of 6 – 9%)
- There is a potential improvement of the household income in the rural areas with the trend of structural change underway
• Urbanization in rural cosmopolitans drives demand - More villagers from remote area tend to move into rural
cosmopolitans to look for higher-paid non-agricultural jobs as shown in the difference 10-year gap of population and household census
- The larger number of population in the area and the higher the density of the people, implies the greater the demand to consume
Industry Key Growth Drivers: Expansion
2 Growth of modern retailers in parallel with urbanization
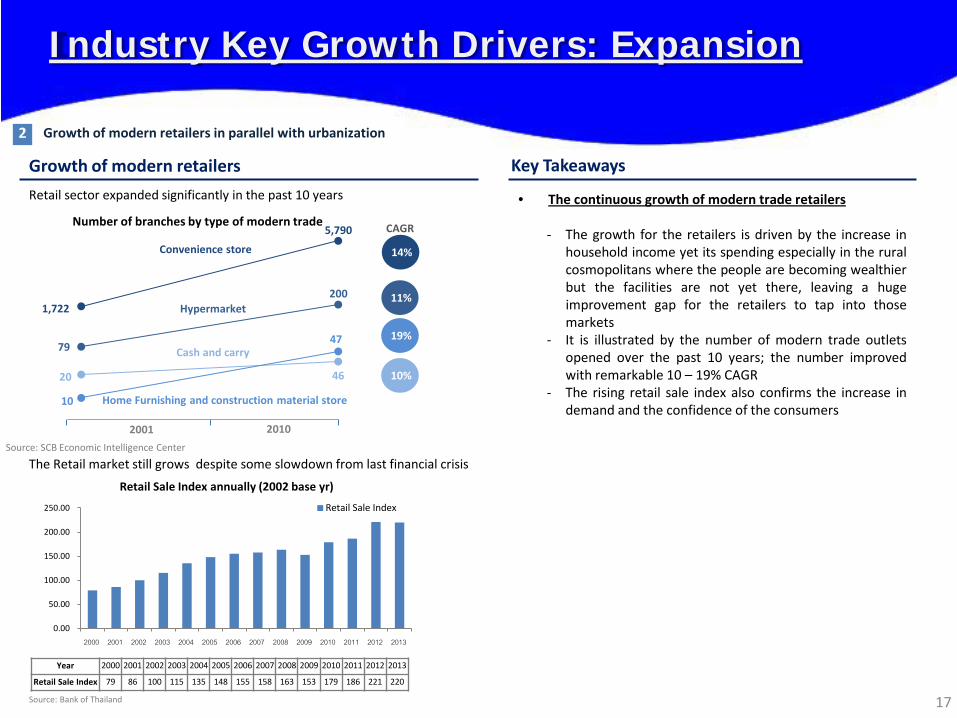
Growth of modern retailers
Retail sector expanded significantly in the past 10 years
1,722
5,790
79
200
20
10
47
46
Convenience store
Hypermarket
Cash and carry
Home Furnishing and construction material store
2001 2010
14%
11%
19%
10%
CAGR Number of branches by type of modern trade
Source: SCB Economic Intelligence Center
17
0.00
50.00
100.00
150.00
200.00
250.00
2000 2001 2002 2003 2004 2005 2006 2007 2008 2009 2010 2011 2012 2013
Retail Sale Index annually (2002 base yr)
Retail Sale Index
Source: Bank of Thailand
The Retail market still grows despite some slowdown from last financial crisis
Year 2000 2001 2002 2003 2004 2005 2006 2007 2008 2009 2010 2011 2012 2013
Retail Sale Index 79 86 100 115 135 148 155 158 163 153 179 186 221 220
Key Takeaways
• The continuous growth of modern trade retailers - The growth for the retailers is driven by the increase in
household income yet its spending especially in the rural cosmopolitans where the people are becoming wealthier but the facilities are not yet there, leaving a huge improvement gap for the retailers to tap into those markets
- It is illustrated by the number of modern trade outlets opened over the past 10 years; the number improved with remarkable 10 – 19% CAGR
- The rising retail sale index also confirms the increase in demand and the confidence of the consumers
Industry Key Growth Drivers: Expansion
2 Growth of modern retailers in parallel with urbanization
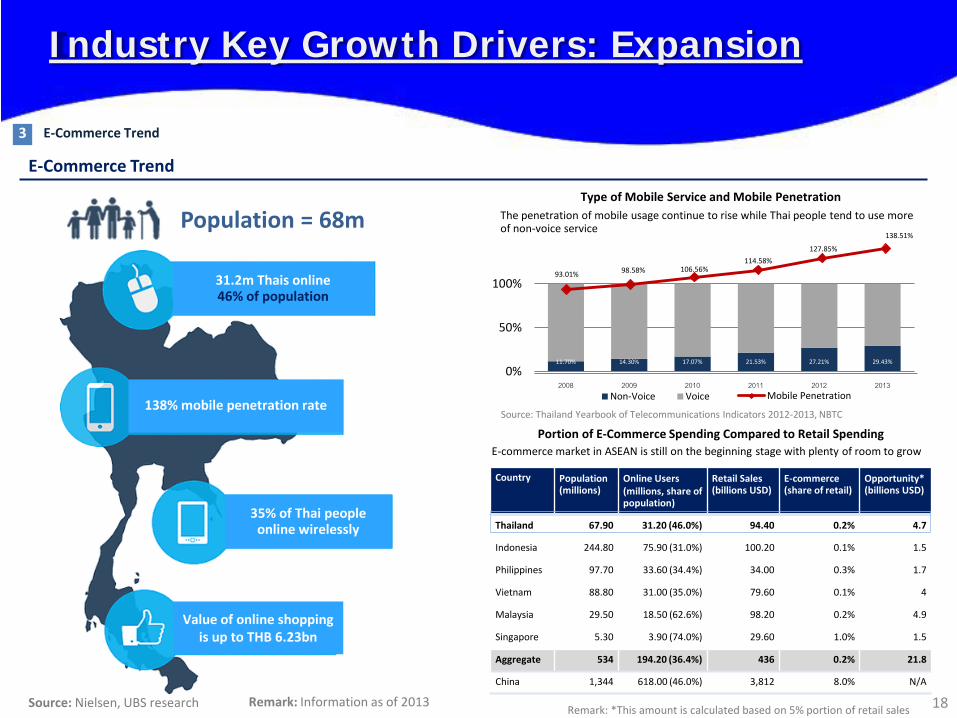
Source: Nielsen, UBS research
31.2m Thais online 46% of population
Value of online shopping is up to THB 6.23bn
18
Source: Thailand Yearbook of Telecommunications Indicators 2012-2013, NBTC
11.70% 14.30% 17.07% 21.53% 27.21% 29.43%
0%
50%
100%
2008 2009 2010 2011 2012 2013 Non-Voice Voice
93.01% 98.58% 106.56% 114.58%
127.85%
138.51%
Mobile Penetration138% mobile penetration rate
35% of Thai people online wirelessly
Remark: Information as of 2013
Population = 68m
Country Population (millions)
Online Users (millions, share of population)
Retail Sales (billions USD)
E-commerce (share of retail)
Opportunity* (billions USD)
Thailand 67.90 31.20 (46.0%) 94.40 0.2% 4.7
Indonesia 244.80 75.90 (31.0%) 100.20 0.1% 1.5
Philippines 97.70 33.60 (34.4%) 34.00 0.3% 1.7
Vietnam 88.80 31.00 (35.0%) 79.60 0.1% 4
Malaysia 29.50 18.50 (62.6%) 98.20 0.2% 4.9
Singapore 5.30 3.90 (74.0%) 29.60 1.0% 1.5
Aggregate 534 194.20 (36.4%) 436 0.2% 21.8
China 1,344 618.00 (46.0%) 3,812 8.0% N/A
Remark: *This amount is calculated based on 5% portion of retail sales
E-Commerce Trend
Type of Mobile Service and Mobile Penetration
Portion of E-Commerce Spending Compared to Retail Spending
The penetration of mobile usage continue to rise while Thai people tend to use more of non-voice service
E-commerce market in ASEAN is still on the beginning stage with plenty of room to grow
Industry Key Growth Drivers: Expansion
3 E-Commerce Trend
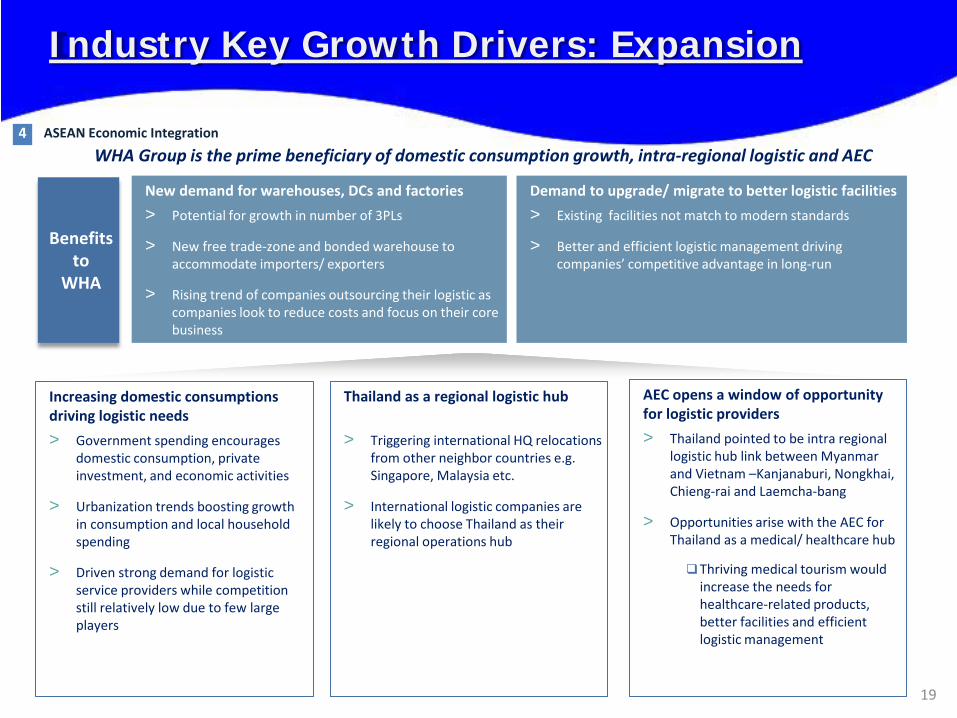
Increasing domestic consumptions driving logistic needs > Government spending encourages
domestic consumption, private investment, and economic activities
> Urbanization trends boosting growth in consumption and local household spending
> Driven strong demand for logistic service providers while competition still relatively low due to few large players
New demand for warehouses, DCs and factories > Potential for growth in number of 3PLs
> New free trade-zone and bonded warehouse to accommodate importers/ exporters
> Rising trend of companies outsourcing their logistic as companies look to reduce costs and focus on their core business
Demand to upgrade/ migrate to better logistic facilities > Existing facilities not match to modern standards
> Better and efficient logistic management driving companies’ competitive advantage in long-run
AEC opens a window of opportunity for logistic providers > Thailand pointed to be intra regional
logistic hub link between Myanmar and Vietnam –Kanjanaburi, Nongkhai, Chieng-rai and Laemcha-bang
> Opportunities arise with the AEC for Thailand as a medical/ healthcare hub
Thriving medical tourism would increase the needs for healthcare-related products, better facilities and efficient logistic management
Thailand as a regional logistic hub > Triggering international HQ relocations
from other neighbor countries e.g. Singapore, Malaysia etc.
> International logistic companies are likely to choose Thailand as their regional operations hub
Benefits to
WHA
WHA Group is the prime beneficiary of domestic consumption growth, intra-regional logistic and AEC
19
Industry Key Growth Drivers: Expansion
4 ASEAN Economic Integration
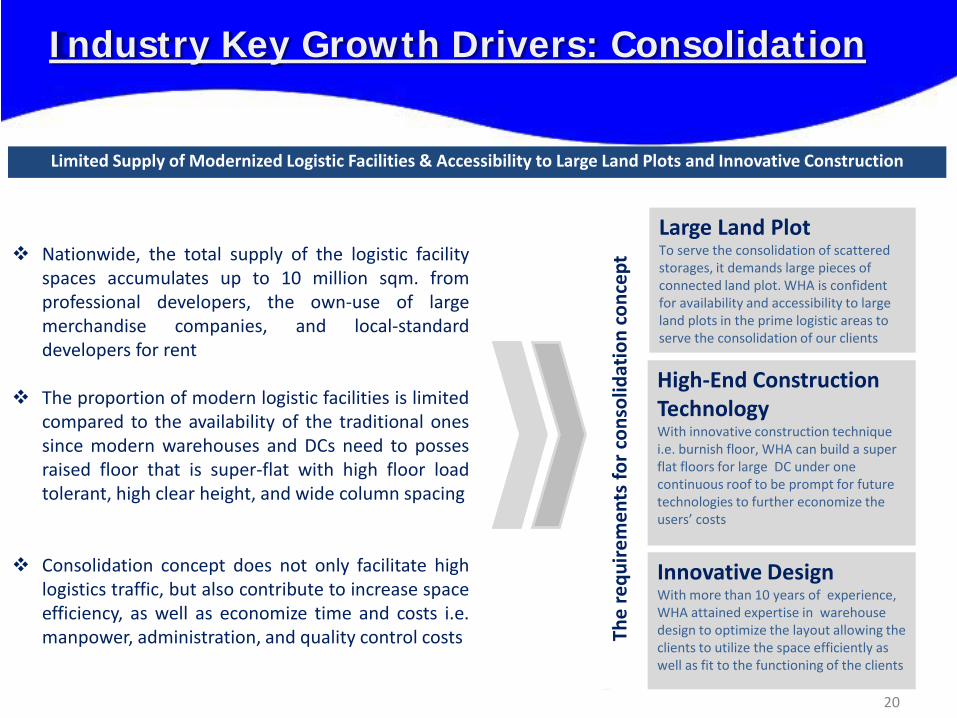
High-End Construction Technology With innovative construction technique i.e. burnish floor, WHA can build a super flat floors for large DC under one continuous roof to be prompt for future technologies to further economize the users’ costs
Innovative Design With more than 10 years of experience, WHA attained expertise in warehouse design to optimize the layout allowing the clients to utilize the space efficiently as well as fit to the functioning of the clients
Large Land Plot To serve the consolidation of scattered storages, it demands large pieces of connected land plot. WHA is confident for availability and accessibility to large land plots in the prime logistic areas to serve the consolidation of our clients
Limited Supply of Modernized Logistic Facilities & Accessibility to Large Land Plots and Innovative Construction
Nationwide, the total supply of the logistic facility spaces accumulates up to 10 million sqm. from professional developers, the own-use of large merchandise companies, and local-standard developers for rent
The proportion of modern logistic facilities is limited compared to the availability of the traditional ones since modern warehouses and DCs need to posses raised floor that is super-flat with high floor load tolerant, high clear height, and wide column spacing
Consolidation concept does not only facilitate high logistics traffic, but also contribute to increase space efficiency, as well as economize time and costs i.e. manpower, administration, and quality control costs
The
requ
irem
ents
for c
onso
lidat
ion
conc
ept
Industry Key Growth Drivers: Consolidation
20

21
Proven and Strong Track Record and Credentials in Thailand and SEA Region.
Pioneered Built-to-Suit Concept to Thai Logistics Market
Superior and Best-in-Class Warehouse, Distribution Center in Prime Locations
Like-Minded Logistic Consultant and Hands-on Management Team
Most Sophisticated Financial Engineering Tools to Serve the Capital-Intensive Business and Satisfy the Attractive Return on Capital to Shareholders
1
2
3
4
5
• WHA has become global contact for MNCs to expand and consolidate their hubs for AEC
• Tailor-made product to cater with each tenant’s specific requirements in order to optimize their long-term logistics costs
• With continuous research and development to improve the quality of our products e.g. floor (high-strength, super flat concrete), large continuous roof, natural ventilation, and ability to construct in each module concurrently to shorten the construction period
• Logistics mentality, dedicated top management to listen to clients’ requirements with in house design and construction management team to communicate with the clients directly
• Property Fund (WHAPF) • REIT (WHA REIT) • Upcoming Infrastructure Fund
Our Key Competitive Advantages
22
Agenda
23
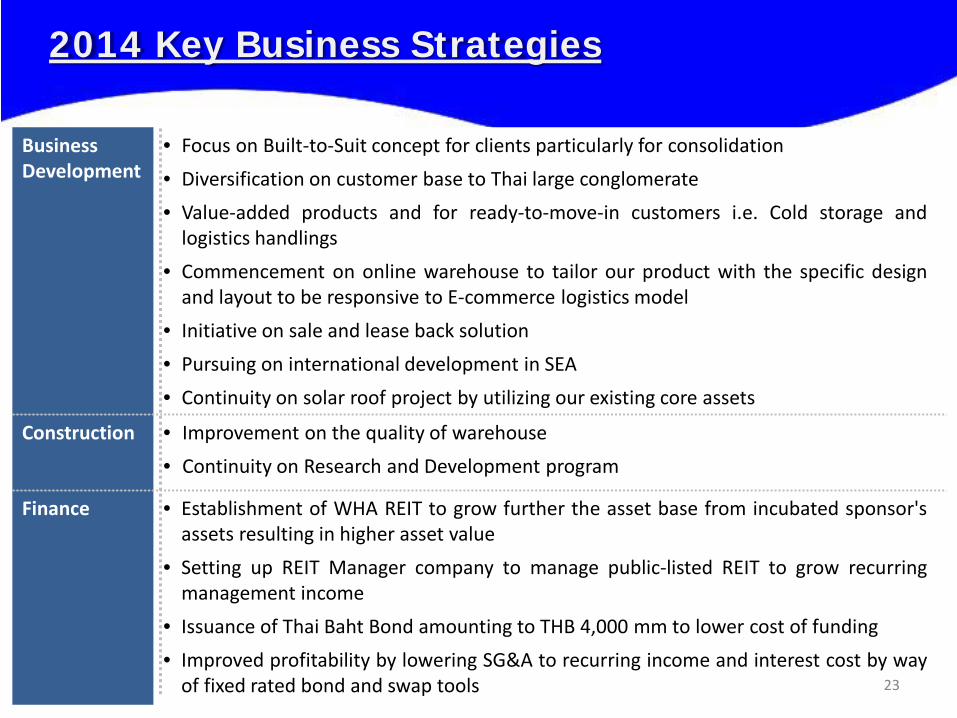
2014 Key Business Strategies
Business Development
• Focus on Built-to-Suit concept for clients particularly for consolidation • Diversification on customer base to Thai large conglomerate • Value-added products and for ready-to-move-in customers i.e. Cold storage and
logistics handlings • Commencement on online warehouse to tailor our product with the specific design
and layout to be responsive to E-commerce logistics model • Initiative on sale and lease back solution • Pursuing on international development in SEA • Continuity on solar roof project by utilizing our existing core assets
Construction • Improvement on the quality of warehouse • Continuity on Research and Development program
Finance • Establishment of WHA REIT to grow further the asset base from incubated sponsor's assets resulting in higher asset value
• Setting up REIT Manager company to manage public-listed REIT to grow recurring management income
• Issuance of Thai Baht Bond amounting to THB 4,000 mm to lower cost of funding • Improved profitability by lowering SG&A to recurring income and interest cost by way
of fixed rated bond and swap tools 23
24
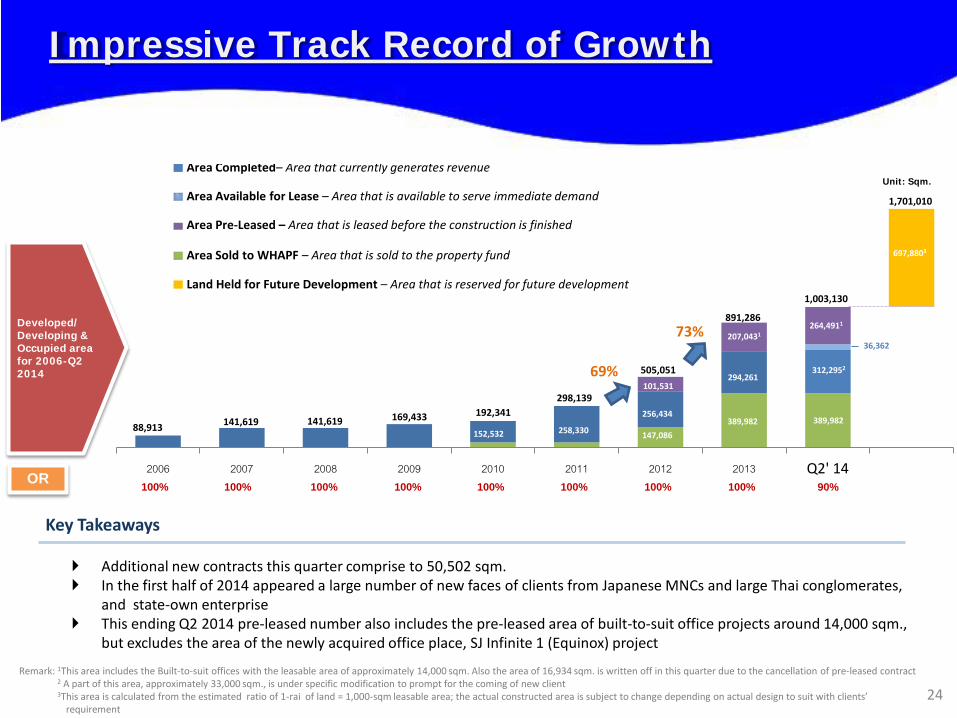
Developed/ Developing & Occupied area for 2006-Q2 2014
OR 100% 100% 100% 100% 100% 100% 100% 100% 90%
Unit: Sqm.
2006 2007 2008 2009 2010 2011 2012 2013 Q2' 14
207,0431
294,261
389,982
147,086
256,434
258,330 152,532
1,701,010
697,8803
312,2952
389,982
264,4911
101,531
88,913 141,619 141,619 169,433 192,341
298,139
505,051 69%
73%
1,003,130
891,286
Area Completed– Area that currently generates revenue Area Available for Lease – Area that is available to serve immediate demand Area Pre-Leased – Area that is leased before the construction is finished Area Sold to WHAPF – Area that is sold to the property fund Land Held for Future Development – Area that is reserved for future development
36,362
Remark: 1This area includes the Built-to-suit offices with the leasable area of approximately 14,000 sqm. Also the area of 16,934 sqm. is written off in this quarter due to the cancellation of pre-leased contract 2 A part of this area, approximately 33,000 sqm., is under specific modification to prompt for the coming of new client
3This area is calculated from the estimated ratio of 1-rai of land = 1,000-sqm leasable area; the actual constructed area is subject to change depending on actual design to suit with clients’ requirement
Key Takeaways
Additional new contracts this quarter comprise to 50,502 sqm. In the first half of 2014 appeared a large number of new faces of clients from Japanese MNCs and large Thai conglomerates,
and state-own enterprise This ending Q2 2014 pre-leased number also includes the pre-leased area of built-to-suit office projects around 14,000 sqm.,
but excludes the area of the newly acquired office place, SJ Infinite 1 (Equinox) project
Impressive Track Record of Growth
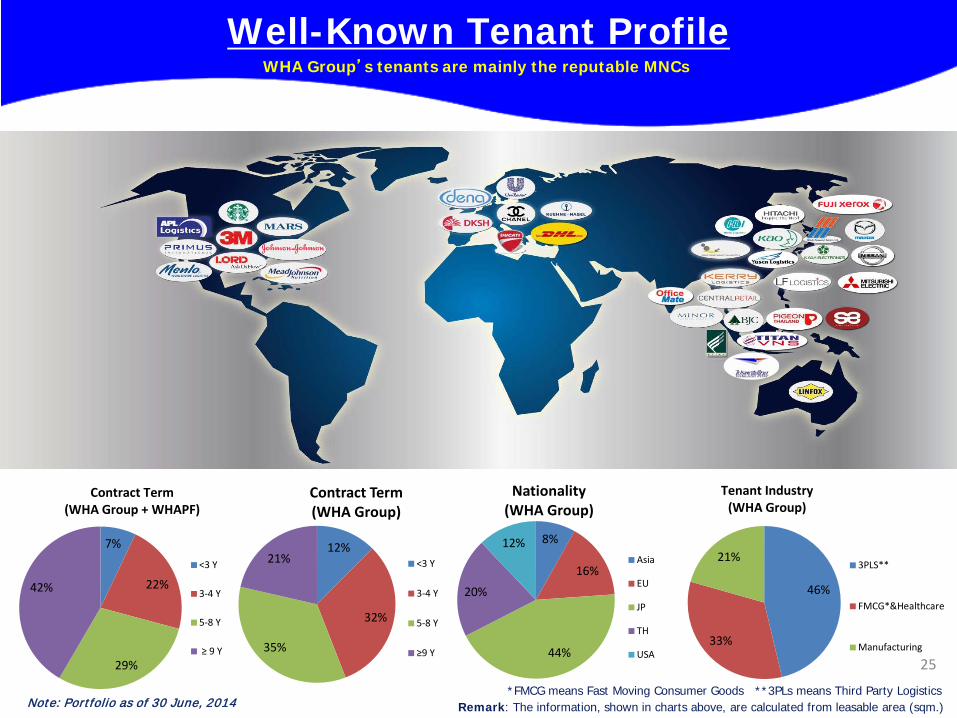
WHA Group’s tenants are mainly the reputable MNCs
Remark: The information, shown in charts above, are calculated from leasable area (sqm.)
Well-Known Tenant Profile
Note: Portfolio as of 30 June, 2014 *FMCG means Fast Moving Consumer Goods **3PLs means Third Party Logistics
25
8%
16%
44%
20%
12%
Nationality (WHA Group)
Asia
EU
JP
TH
USA
46%
33%
21%
Tenant Industry (WHA Group)
3PLS**
FMCG*&Healthcare
Manufacturing
12%
32%
35%
21%
Contract Term (WHA Group)
<3 Y
3-4 Y
5-8 Y
≥9 Y
7%
22%
29%
42%
Contract Term (WHA Group + WHAPF)
<3 Y
3-4 Y
5-8 Y
≥ 9 Y

Top 10 Tenants
26
Top 10 Tenants by Rental Income (WHA Group)
Top 10 Tenants by Rental Income (WHA Group and WHAPF)
Reve
nue
(THB
mm
)
Tenants
Reve
nue
(THB
mm
)
Tenants
18% 17%
16%
8%
6% 6% 6% 5%
4% 3%
28%
8% 7% 7% 6% 6% 5% 5%
3% 3%
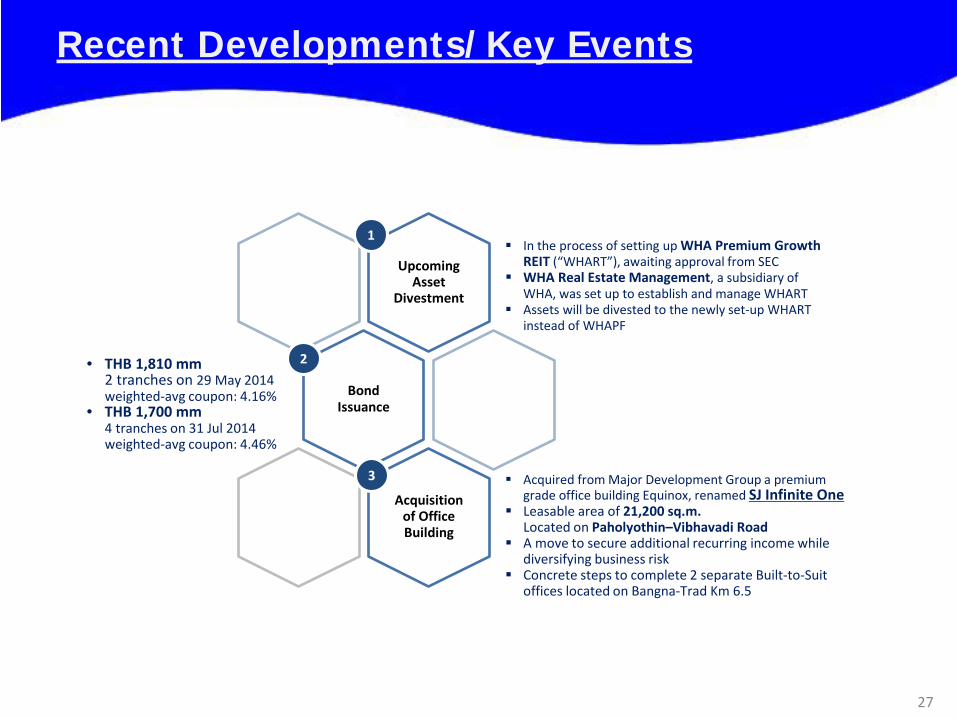
Recent Developments/Key Events
27
Upcoming Asset
Divestment
Bond Issuance
Acquisition of Office Building
1
2
3
In the process of setting up WHA Premium Growth REIT (“WHART”), awaiting approval from SEC
WHA Real Estate Management, a subsidiary of WHA, was set up to establish and manage WHART
Assets will be divested to the newly set-up WHART instead of WHAPF
• THB 1,810 mm 2 tranches on 29 May 2014 weighted-avg coupon: 4.16%
• THB 1,700 mm 4 tranches on 31 Jul 2014 weighted-avg coupon: 4.46%
Acquired from Major Development Group a premium
grade office building Equinox, renamed SJ Infinite One Leasable area of 21,200 sq.m.
Located on Paholyothin–Vibhavadi Road A move to secure additional recurring income while
diversifying business risk Concrete steps to complete 2 separate Built-to-Suit
offices located on Bangna-Trad Km 6.5
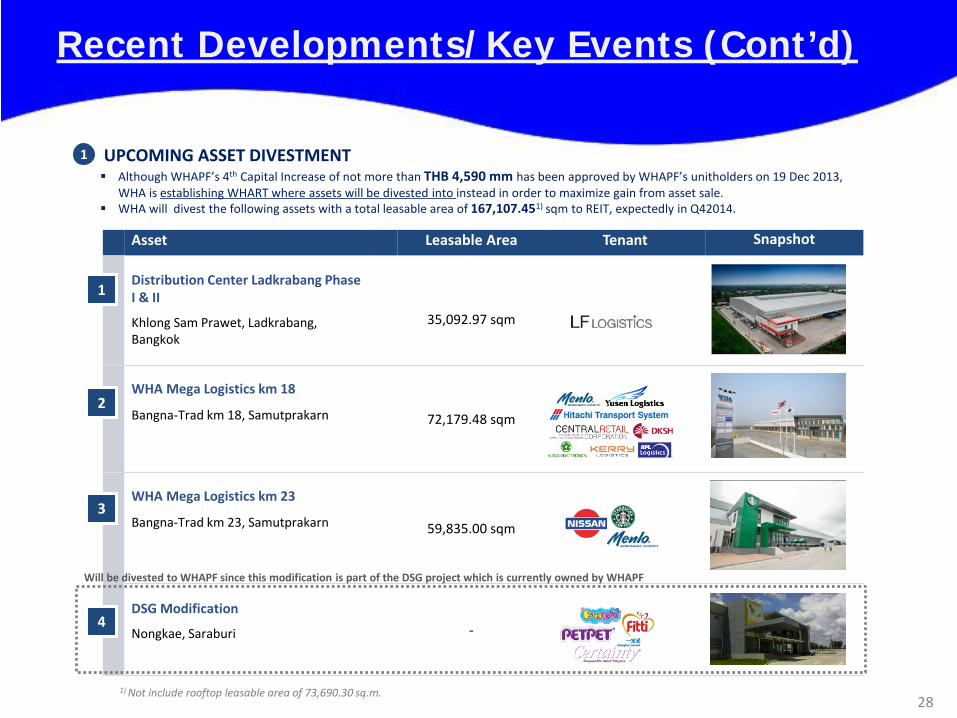
Recent Developments/Key Events (Cont’d)
28
Asset Leasable Area Tenant Snapshot
Distribution Center Ladkrabang Phase I & II
Khlong Sam Prawet, Ladkrabang, Bangkok
35,092.97 sqm
WHA Mega Logistics km 18
Bangna-Trad km 18, Samutprakarn
72,179.48 sqm
WHA Mega Logistics km 23
Bangna-Trad km 23, Samutprakarn 59,835.00 sqm
DSG Modification
Nongkae, Saraburi
-
2
3
1
4
Although WHAPF’s 4th Capital Increase of not more than THB 4,590 mm has been approved by WHAPF’s unitholders on 19 Dec 2013, WHA is establishing WHART where assets will be divested into instead in order to maximize gain from asset sale.
WHA will divest the following assets with a total leasable area of 167,107.451) sqm to REIT, expectedly in Q42014.
1) Not include rooftop leasable area of 73,690.30 sq.m.
UPCOMING ASSET DIVESTMENT 1
Will be divested to WHAPF since this modification is part of the DSG project which is currently owned by WHAPF
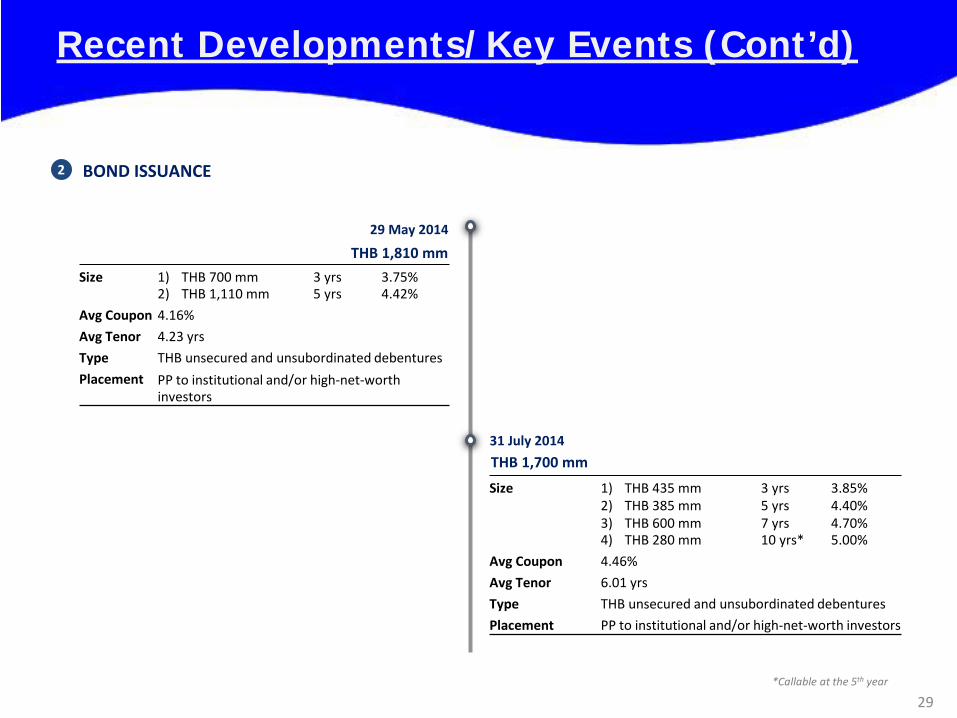
Recent Developments/Key Events (Cont’d)
29
BOND ISSUANCE 2
29 May 2014
Size
1) THB 700 mm 2) THB 1,110 mm
3 yrs 5 yrs
3.75% 4.42%
Avg Coupon 4.16%
Avg Tenor 4.23 yrs
Type THB unsecured and unsubordinated debentures
Placement PP to institutional and/or high-net-worth investors
THB 1,810 mm
31 July 2014
Size
1) THB 435 mm 2) THB 385 mm 3) THB 600 mm 4) THB 280 mm
3 yrs 5 yrs 7 yrs 10 yrs*
3.85% 4.40% 4.70% 5.00%
Avg Coupon 4.46%
Avg Tenor 6.01 yrs
Type THB unsecured and unsubordinated debentures
Placement PP to institutional and/or high-net-worth investors
THB 1,700 mm
*Callable at the 5th year
Recent Developments/Key Events (Cont’d)
30
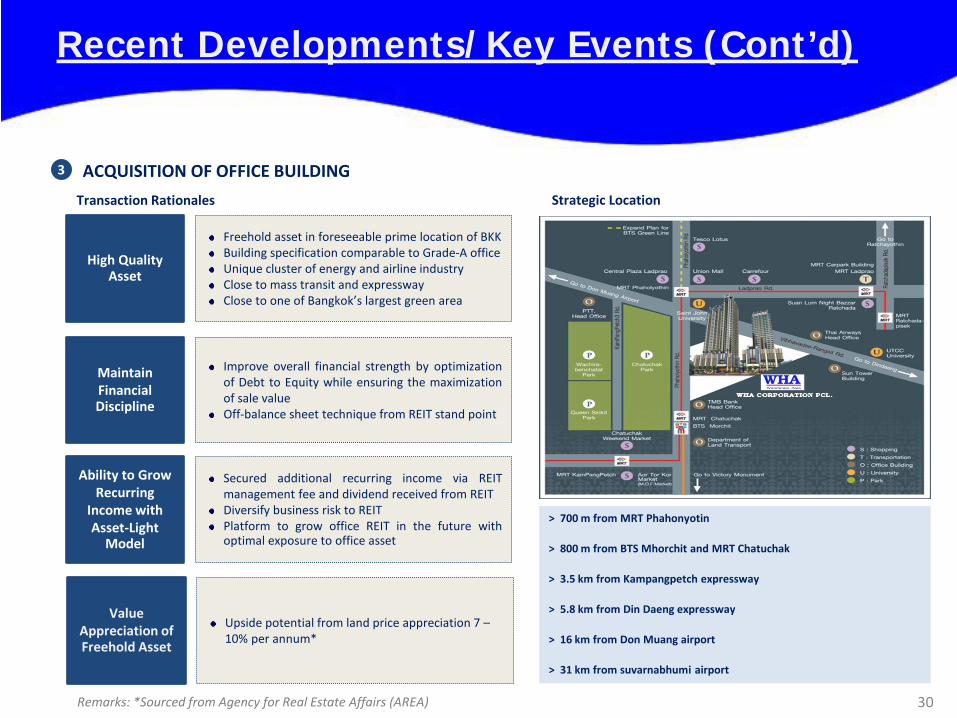
Transaction Rationales
High Quality Asset
Freehold asset in foreseeable prime location of BKK Building specification comparable to Grade-A office Unique cluster of energy and airline industry Close to mass transit and expressway Close to one of Bangkok’s largest green area
Maintain Financial Discipline
Improve overall financial strength by optimization of Debt to Equity while ensuring the maximization of sale value Off-balance sheet technique from REIT stand point
Ability to Grow Recurring
Income with Asset-Light
Model
Secured additional recurring income via REIT management fee and dividend received from REIT Diversify business risk to REIT Platform to grow office REIT in the future with optimal exposure to office asset
Value Appreciation of Freehold Asset
Upside potential from land price appreciation 7 – 10% per annum*
Remarks: *Sourced from Agency for Real Estate Affairs (AREA)
ACQUISITION OF OFFICE BUILDING 3
> 700 m from MRT Phahonyotin
> 800 m from BTS Mhorchit and MRT Chatuchak
> 3.5 km from Kampangpetch expressway
> 5.8 km from Din Daeng expressway
> 16 km from Don Muang airport
> 31 km from suvarnabhumi airport
Strategic Location
Recent Developments/Key Events (Cont’d)
31
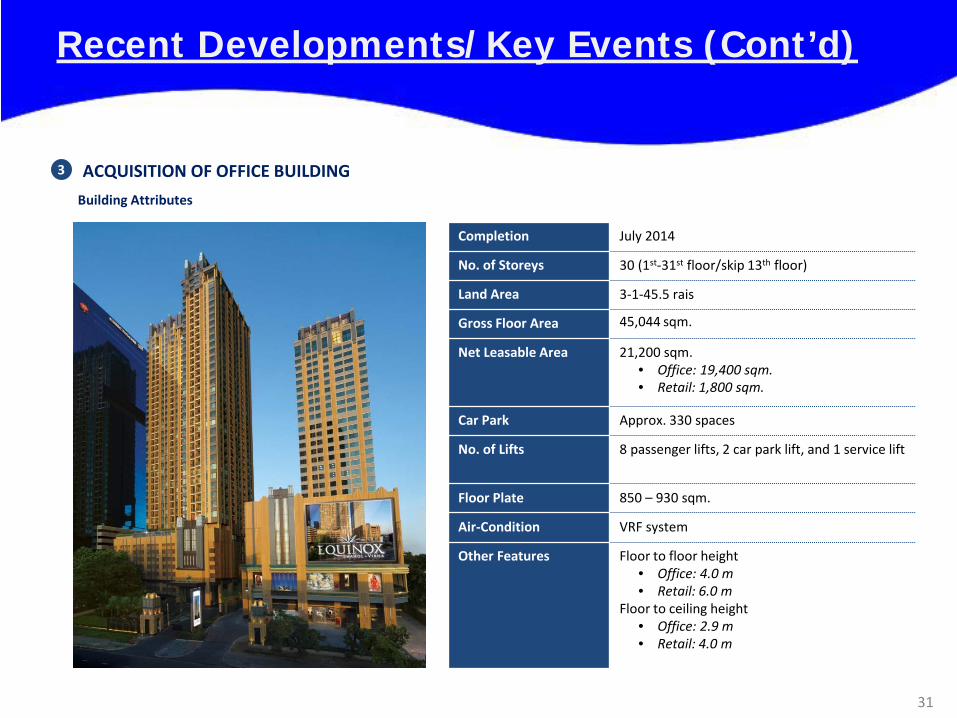
Completion July 2014
No. of Storeys 30 (1st-31st floor/skip 13th floor)
Land Area 3-1-45.5 rais
Gross Floor Area 45,044 sqm.
Net Leasable Area 21,200 sqm. • Office: 19,400 sqm.
• Retail: 1,800 sqm.
Car Park Approx. 330 spaces
No. of Lifts 8 passenger lifts, 2 car park lift, and 1 service lift
Floor Plate 850 – 930 sqm.
Air-Condition VRF system
Other Features Floor to floor height • Office: 4.0 m • Retail: 6.0 m
Floor to ceiling height • Office: 2.9 m • Retail: 4.0 m
ACQUISITION OF OFFICE BUILDING 3
Building Attributes

Recent Developments/Key Events (Cont’d)
32
Building Attributes
Construction Start 21 October 2013
Completion 30 September 2014
No. of Storeys 7 floors
Land Area 1-2-65 rais (building A only)
Gross Floor Area 10,133 sqm.
Net Leasable Area 8,893 sqm.
Car Park Separated car park building
No. of Lifts 2 passenger lifts plus 1 service lift
Floor Plate 1,355 – 1,390 sqm.
Air-Condition Split-type air-conditioning system
Other Features Floor to floor height
• Office: 3.2 m Floor to ceiling height
• Office: 2.5 – 2.6 m
DEVELOPMENT OF BUILT-TO-SUIT OFFICE 3
33
Agenda
106.52 121.39
-
-18.90
31.08 125.42
152.47
21.6%
2Q2013 2 Q2 0 14
Revenue Structure
34
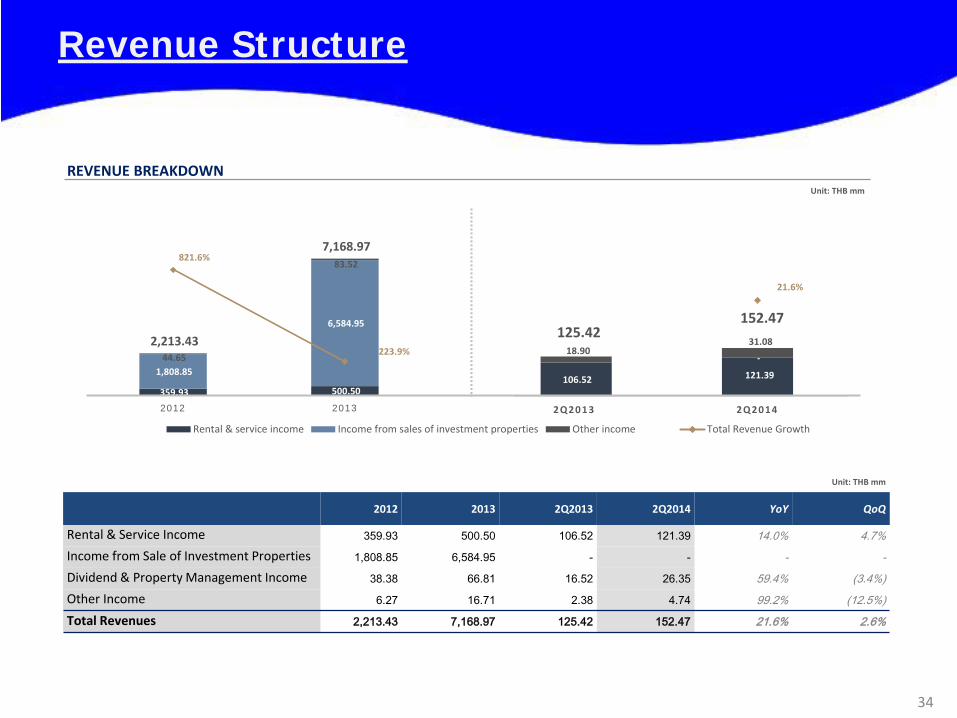
REVENUE BREAKDOWN
2012 2013 2Q2013 2Q2014 YoY QoQ
Rental & Service Income 359.93 500.50 106.52 121.39 14.0% 4.7% Income from Sale of Investment Properties 1,808.85 6,584.95 - - - - Dividend & Property Management Income 38.38 66.81 16.52 26.35 59.4% (3.4%) Other Income 6.27 16.71 2.38 4.74 99.2% (12.5%) Total Revenues 2,213.43 7,168.97 125.42 152.47 21.6% 2.6%
Unit: THB mm
Unit: THB mm
359.93 500.50
1,808.85
6,584.95
44.65
83.52
2,213.43
7,168.97 821.6%
223.9%
0%
200%
400%
600%
800%
1000%
-
1,000
2,000
3,000
4,000
5,000
6,000
7,000
8,000
2012 2013
Rental & service income Income from sales of investment properties Other income Total Revenue Growth

32.28
56.72
14.34 22.75
204.6%
75.7%58.7%
2012 2013 2 Q 2 0 1 3 2 Q 2 0 1 4
Dividend income Growth
6.10
10.09
2.19 3.60
176.3%
65.3% 64.6%
2012 2013 2 Q 2 0 1 3 2 Q 2 0 1 4
Property management income Growth
Revenue Structure (Cont’d)
35
RENTAL AND SERVICE INCOME
Gross Profit and Margin
WHA’s Leasable Area
SALE OF INVESTMENT PROPERTIES
PROPERTY MANAGEMENT AND DIVIDEND INCOME
Gross Profit and Margin WHAPF’s Leasable Area
Property Management Income Dividend Income
Unit: THB mm
1 2
3
126.00 178.99
233.93
321.51
359.93
500.50
65.0%64.2%
6
8
2012 2013
Cost of rental & service Gross profit GPM
Occupied area Available for lease area
Occupied area growth
39,809 39,809 39,809 39,809
107,277 107,277
69,530
173,366
39,809 39,809
147,086
389,982
2010 2011 2012 2013
IPO 1st PO 2nd PO 3rd PO
Remark: Occupied area of 312,295 sq.m. includes leasable area of approx. 33,000 sq.m. that is currently under some modification for the new clients
34.28 36.69
72.24 84.70
106.52 121.39
67.8%69.8%
2 Q 2 0 1 3 2 Q 2 0 1 4
256,434 294,261 270,170 312,295
36,362 256,434
294,261 270,170
348,657 30.7%
14.8%
15.6%
2012 2013 2 Q 2 0 1 3 2 Q 2 0 1 4
1,617.10
4,961.78
- -
191.76
1,623.18
- -
1,808.85
6,584.95
--
10.6%
24.6%
2 0 1 2 2 0 1 3 2 Q 2 0 1 3 2 Q 2 0 1 4
Cost of investment properties Gross profit GPM
No Asset Sale
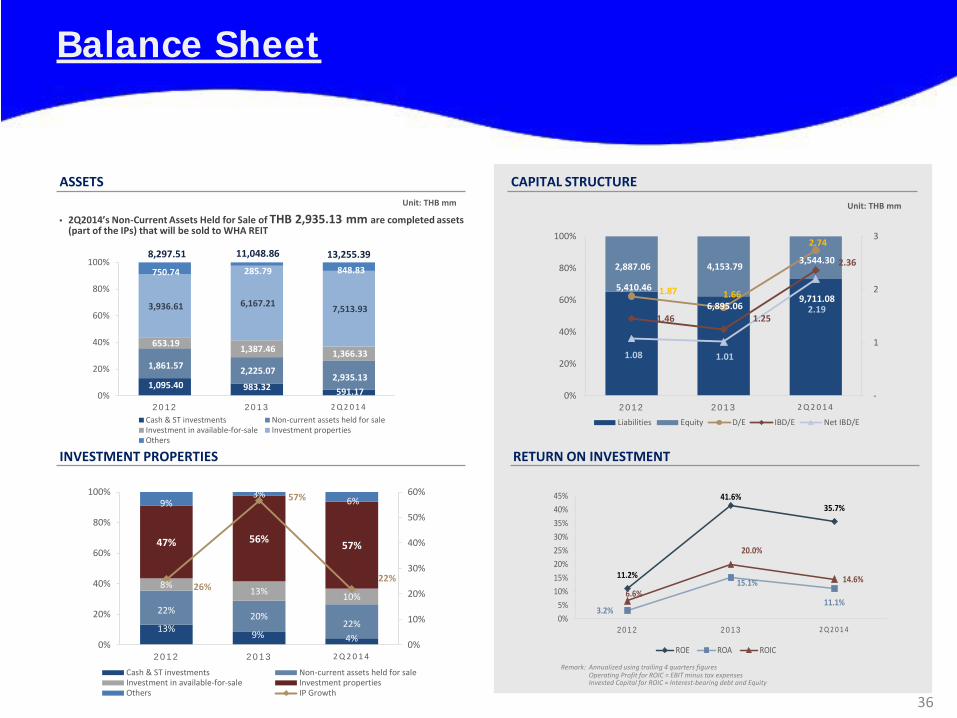
13% 9% 4%
22% 20%22%
8%13% 10%
47% 56% 57%
9%3%
6%
26%
57%
22%
0%
10%
20%
30%
40%
50%
60%
0%
20%
40%
60%
80%
100%
2012 2013 2 Q 2 0 1 4
Cash & ST investments Non-current assets held for saleInvestment in available-for-sale Investment propertiesOthers IP Growth
1,095.40 983.32 591.17
1,861.57 2,225.07 2,935.13
653.19 1,387.46 1,366.33
3,936.61 6,167.21 7,513.93
750.74 285.79 848.83
0%
20%
40%
60%
80%
100%
2012 2013 2 Q 2 0 1 4Cash & ST investments Non-current assets held for saleInvestment in available-for-sale Investment propertiesOthers
Balance Sheet
36
Unit: THB mm
CAPITAL STRUCTURE ASSETS Unit: THB mm
INVESTMENT PROPERTIES
• 2Q2014’s Non-Current Assets Held for Sale of THB 2,935.13 mm are completed assets (part of the IPs) that will be sold to WHA REIT
8,297.51 11,048.86
RETURN ON INVESTMENT
Remark: Annualized using trailing 4 quarters figures Operating Profit for ROIC = EBIT minus tax expenses
Invested Capital for ROIC = Interest-bearing debt and Equity
13,255.39
11.2%
41.6%35.7%
3.2%
15.1%
11.1%6.6%
20.0%
14.6%
0%5%
10%15%20%25%30%35%40%45%
2012 2013 2 Q 2 0 1 4
ROE ROA ROIC
5,410.46
6,895.06 9,711.08
2,887.06 4,153.79 3,544.30
1.87 1.66
2.74
1.46 1.25
2.36
1.08 1.01
2.19
-
1
2
3
0%
20%
40%
60%
80%
100%
2012 2013 2 Q 2 0 1 4
Liabilities Equity D/E IBD/E Net IBD/E
3.04%B/E
800.00
4.89%Term Loan
2,573.63
4.29%Bond
5,010.00
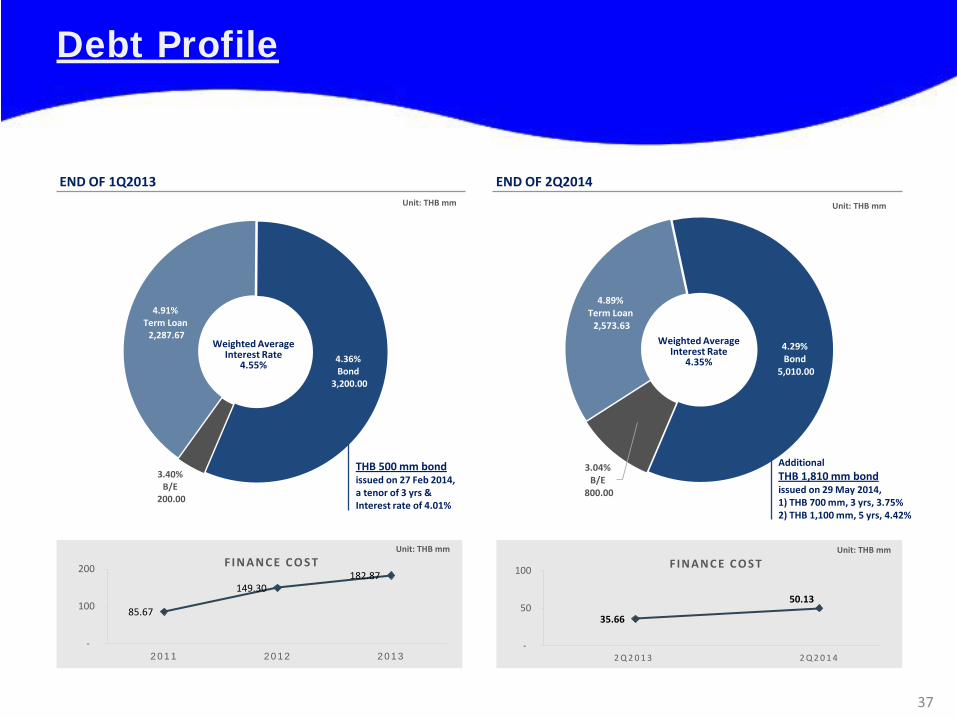
Debt Profile
37
Unit: THB mm
END OF 2Q2014 END OF 1Q2013
Weighted Average Interest Rate
4.35%
Additional THB 1,810 mm bond issued on 29 May 2014, 1) THB 700 mm, 3 yrs, 3.75% 2) THB 1,100 mm, 5 yrs, 4.42%
Unit: THB mm
85.67
149.30 182.87
-
100
200
2011 2012 2013
F IN AN C E C O S TUnit: THB mm Unit: THB mm
3.40%B/E
200.00
4.91%Term Loan
2,287.67
4.36%Bond
3,200.00
Weighted Average Interest Rate
4.55%
THB 500 mm bond issued on 27 Feb 2014, a tenor of 3 yrs & Interest rate of 4.01%
35.66
50.13
-
50
100
2 Q 2 0 1 3 2 Q 2 0 1 4
F IN AN C E C O S T
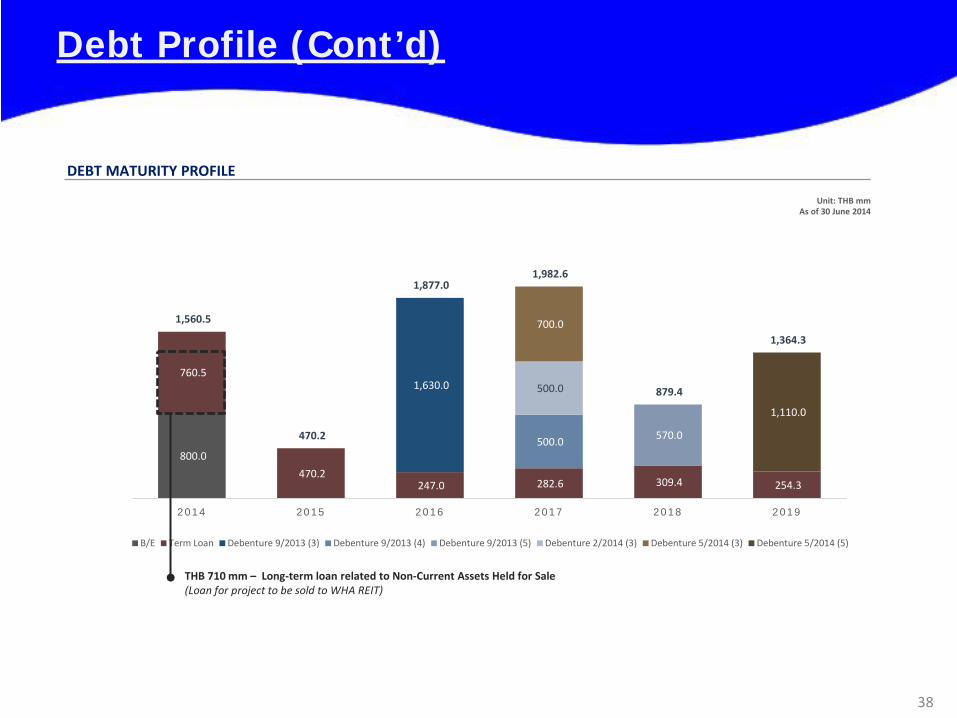
800.0
760.5
470.2 247.0 282.6 309.4 254.3
1,630.0
500.0 570.0
500.0
700.0
1,110.0
1,560.5
470.2
1,877.0 1,982.6
879.4
1,364.3
2014 2015 2016 2017 2018 2019
B/E Term Loan Debenture 9/2013 (3) Debenture 9/2013 (4) Debenture 9/2013 (5) Debenture 2/2014 (3) Debenture 5/2014 (3) Debenture 5/2014 (5)
Debt Profile (Cont’d)
38
Unit: THB mm As of 30 June 2014
DEBT MATURITY PROFILE
THB 710 mm – Long-term loan related to Non-Current Assets Held for Sale (Loan for project to be sold to WHA REIT)
39
Agenda
39
40
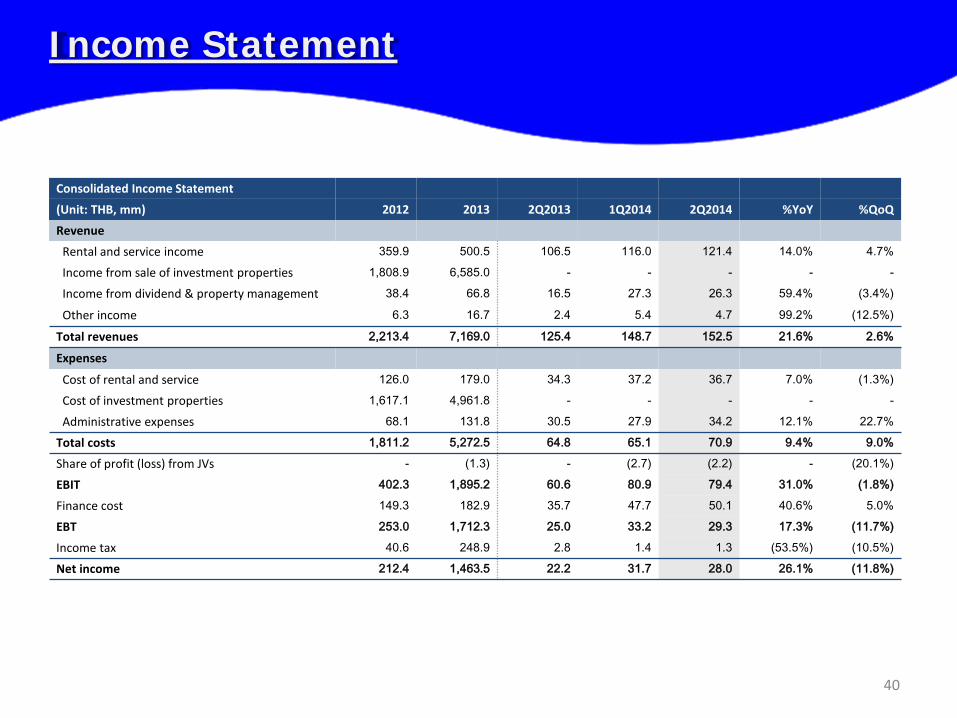
Income Statement
Consolidated Income Statement
(Unit: THB, mm) 2012 2013 2Q2013 1Q2014 2Q2014 %YoY %QoQ
Revenue
Rental and service income 359.9 500.5 106.5 116.0 121.4 14.0% 4.7%
Income from sale of investment properties 1,808.9 6,585.0 - - - - -
Income from dividend & property management 38.4 66.8 16.5 27.3 26.3 59.4% (3.4%)
Other income 6.3 16.7 2.4 5.4 4.7 99.2% (12.5%)
Total revenues 2,213.4 7,169.0 125.4 148.7 152.5 21.6% 2.6%
Expenses
Cost of rental and service 126.0 179.0 34.3 37.2 36.7 7.0% (1.3%)
Cost of investment properties 1,617.1 4,961.8 - - - - -
Administrative expenses 68.1 131.8 30.5 27.9 34.2 12.1% 22.7%
Total costs 1,811.2 5,272.5 64.8 65.1 70.9 9.4% 9.0%
Share of profit (loss) from JVs - (1.3) - (2.7) (2.2) - (20.1%)
EBIT 402.3 1,895.2 60.6 80.9 79.4 31.0% (1.8%)
Finance cost 149.3 182.9 35.7 47.7 50.1 40.6% 5.0%
EBT 253.0 1,712.3 25.0 33.2 29.3 17.3% (11.7%)
Income tax 40.6 248.9 2.8 1.4 1.3 (53.5%) (10.5%)
Net income 212.4 1,463.5 22.2 31.7 28.0 26.1% (11.8%)

41
Balance Sheet
Consolidated Balance Sheet (Unit: THB, mm) 2012 2013 1Q2014 2Q2014 Increase (Decrease) Current assets Cash and cash equivalents 978.7 319.8 77.2 483.5 406.3 526.3% ST investment 116.7 663.5 98.6 107.6 9.1 9.2% Non-current assets held-for-sale 1,861.6 2,225.1 2,921.5 2,935.1 13.6 0.5% Other current assets 473.6 123.4 183.2 137.2 (46.0) (25.1%) Total current assets 3,430.5 3,331.8 3,280.5 3,663.5 383.0 11.7% Non-current assets Investment properties (net) 3,936.6 6,167.2 6,487.7 7,513.9 1,026.2 15.8% Leasehold rights (net) 165.0 64.0 63.4 62.9 (0.5) (0.9%) Building improvement and equipment (net) 26.2 43.4 48.6 47.8 (0.8) (1.6%) Other non-current assets 739.2 1,442.4 1,699.9 1,967.3 267.3 15.7% Total non-current assets 4,867.0 7,717.0 8,299.6 9,591.9 1,292.3 15.6% Total assets 8,297.5 11,048.9 11,580.1 13,255.4 1,675.3 14.5% Liabilities Bank overdrafts and ST borrowings 4.3 198.7 198.7 792.6 593.9 298.9% Trade and other payables 645.4 1,123.1 1,210.9 1,015.7 (195.2) (16.1%) Current portion of LT borrowings – FN institutions
981.1 87.0 173.0 123.0 (50.0) (28.9%)
Other current liabilities 755.0 1,120.9 1,135.8 905.2 (230.6) (20.3%) LT borrowings – FN institutions (net) 2,603.6 1,501.9 1,404.7 1,740.6 336.0 23.9% Debentures (net) - 2,695.3 3,195.0 5,002.7 1,807.6 56.6% Other non-current liabilities 421.0 168.1 88.4 131.3 43.0 48.6% Total liabilities 5,410.5 6,895.1 7,406.5 9,711.1 2,304.6 31.1% Shareholders’ equity 2,887.1 4,153.8 4,173.7 3,544.3 (629.3) (15.1%) Total liabilities and Shareholders’ equity 8,297.5 11,048.9 11,580.1 13,255.4 1,675.3 14.5%
42
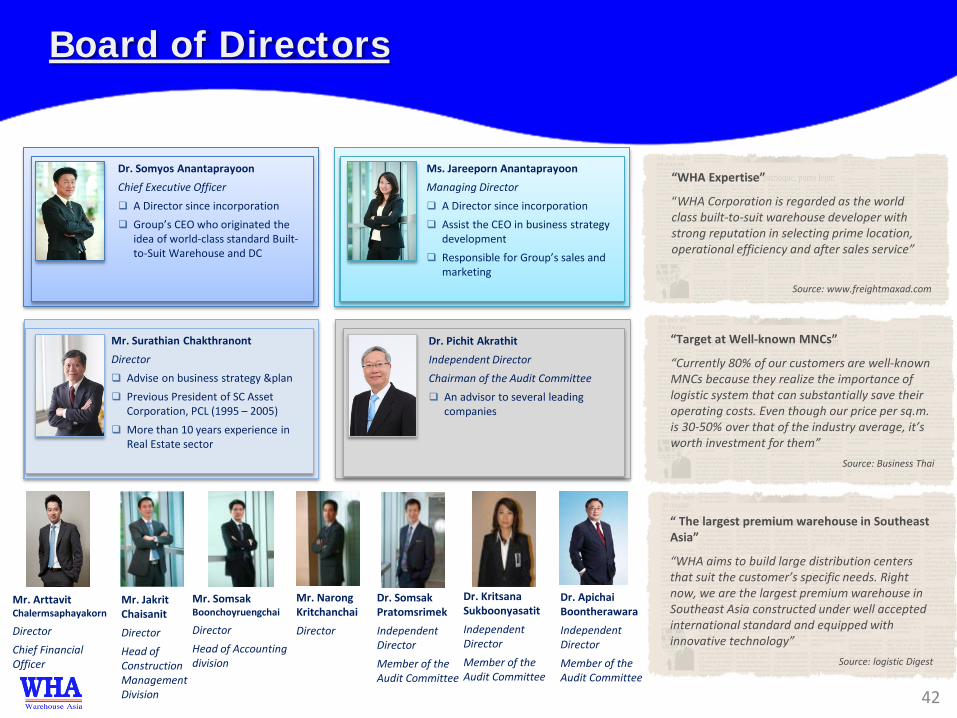
“Target at Well-known MNCs”
“Currently 80% of our customers are well-known MNCs because they realize the importance of logistic system that can substantially save their operating costs. Even though our price per sq.m. is 30-50% over that of the industry average, it’s worth investment for them”
Source: Business Thai
“ The largest premium warehouse in Southeast Asia”
“WHA aims to build large distribution centers that suit the customer’s specific needs. Right now, we are the largest premium warehouse in Southeast Asia constructed under well accepted international standard and equipped with innovative technology”
Source: logistic Digest
Dr. Somyos Anantaprayoon Chief Executive Officer A Director since incorporation Group’s CEO who originated the
idea of world-class standard Built-to-Suit Warehouse and DC
Ms. Jareeporn Anantaprayoon Managing Director A Director since incorporation Assist the CEO in business strategy
development Responsible for Group’s sales and
marketing
Mr. Surathian Chakthranont Director Advise on business strategy &plan Previous President of SC Asset
Corporation, PCL (1995 – 2005) More than 10 years experience in
Real Estate sector
Dr. Pichit Akrathit Independent Director Chairman of the Audit Committee An advisor to several leading
companies
Mr. Jakrit Chaisanit Director Head of Construction Management Division
Mr. Narong Kritchanchai Director
Mr. Somsak Boonchoyruengchai
Director Head of Accounting division
Dr. Somsak Pratomsrimek Independent Director Member of the Audit Committee
Dr. Kritsana Sukboonyasatit Independent Director Member of the Audit Committee
Mr. Arttavit Chalermsaphayakorn
Director Chief Financial Officer
“WHA Expertise”
“WHA Corporation is regarded as the world class built-to-suit warehouse developer with strong reputation in selecting prime location, operational efficiency and after sales service”
Source: www.freightmaxad.com
Board of Directors
Dr. Apichai Boontherawara Independent Director Member of the Audit Committee
43
1121 Moo.3 Theparak Rd., Theparak, A. Muang, Samutprakarn 10270 Thailand
Tel. +66 (0) 2 753 3750
Fax. +66 (0) 2 753 2750
e-mail: [email protected] Website: www.wha.co.th
WHA Corporation PCL.