Embed Size (px)
Citation preview
w w w . b a i r d . c o m
Baird
o c e a n s
e n g i n e e r i n g
l a k e s
d e s i g n
r i v e r s
s c i e n c e
w a t e r s h e d s
c o n s t r u c t i o n
I n n o v a t i o n , E x c e l l e n c e & S e r v i c e
Lake Shore Boulevard Design Review Marquette, MI
September 2, 2014
12035.200
Financial assistance for this project was provided, in part, by the MichiganCoastal Management Program, Department of Environmental Quality (DEQ), through a grant from the National Oceanic and Atmospheric Administration (NOAA), U.S. Department of Commerce. The statements, findings, conclusions, and recommendations in this report are those of the Superior Watershed Partnership (Grantee) and do not necessarily reflect the views of the DEQ and the NOAA.
w w w . b a i r d . c o m
I n n o v a t i o n , E x c e l l e n c e & S e r v i c e
Lake Shore Boulevard Design Review
Prepared for
City of Marquette
Prepared by
W.F. Baird & Associates Ltd.
For further information please contact
Dave Anglin at (608) 273‐0592
Project Number: 12035.200
Revision Date Status Comments Reviewed by Approved by 0 30 July 2014 Draft Client review GCF/CDA CDA 1 2 Sept 2014 Final GCF CDA
This report was prepared by W.F. Baird & Associates Ltd. for the City of Marquette. The
material in it reflects the judgment of Baird & Associates in light of the information available to
them at the time of preparation. Any use that a Third Party makes of this report, or any
reliance on decisions to be made based on it, are the responsibility of such Third Parties. Baird
& Associates accepts no responsibility for damages, if any, suffered by any Third Party as a
result of decisions made or actions based on this report.
Financial assistance for this project was provided, in part, by the MichiganCoastal Management Program, Department of Environmental Quality (DEQ),through a grant from the National Oceanic and Atmospheric Administration(NOAA), U.S. Department of Commerce. The statements, findings, conclusions,and recommendations in this report are those of the Superior WatershedPartnership (Grantee) and do not necessarily reflect the views of the DEQ andthe NOAA.
B a i r d & A s s o c i a t e s
R u b b l e m o u n d R e v e t m e n t D e s i g n R e v i e w T a b l e o f C o n t e n t sL a k e S h o r e B o u l e v a r d , M a r q u e t t e , M I 1 2 0 3 5 . 2 0 1
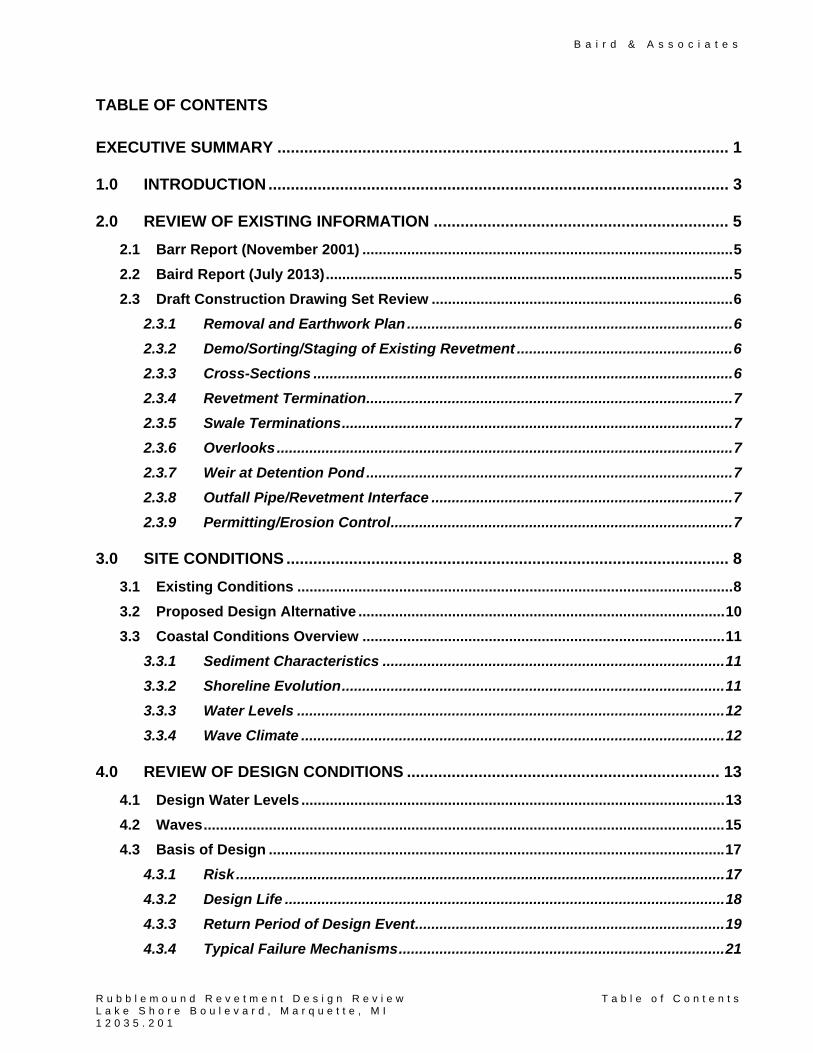
TABLE OF CONTENTS
EXECUTIVE SUMMARY ..................................................................................................... 1
1.0 INTRODUCTION ....................................................................................................... 3
2.0 REVIEW OF EXISTING INFORMATION .................................................................. 5
2.1 Barr Report (November 2001) ........................................................................................... 5
2.2 Baird Report (July 2013) .................................................................................................... 5
2.3 Draft Construction Drawing Set Review .......................................................................... 6
2.3.1 Removal and Earthwork Plan ................................................................................ 6
2.3.2 Demo/Sorting/Staging of Existing Revetment ..................................................... 6
2.3.3 Cross-Sections ....................................................................................................... 6
2.3.4 Revetment Termination .......................................................................................... 7
2.3.5 Swale Terminations ................................................................................................ 7
2.3.6 Overlooks ................................................................................................................ 7
2.3.7 Weir at Detention Pond .......................................................................................... 7
2.3.8 Outfall Pipe/Revetment Interface .......................................................................... 7
2.3.9 Permitting/Erosion Control .................................................................................... 7
3.0 SITE CONDITIONS ................................................................................................... 8
3.1 Existing Conditions ........................................................................................................... 8
3.2 Proposed Design Alternative .......................................................................................... 10
3.3 Coastal Conditions Overview ......................................................................................... 11
3.3.1 Sediment Characteristics .................................................................................... 11
3.3.2 Shoreline Evolution .............................................................................................. 11
3.3.3 Water Levels ......................................................................................................... 12
3.3.4 Wave Climate ........................................................................................................ 12
4.0 REVIEW OF DESIGN CONDITIONS ...................................................................... 13
4.1 Design Water Levels ........................................................................................................ 13
4.2 Waves ................................................................................................................................ 15
4.3 Basis of Design ................................................................................................................ 17
4.3.1 Risk ........................................................................................................................ 17
4.3.2 Design Life ............................................................................................................ 18
4.3.3 Return Period of Design Event ............................................................................ 19
4.3.4 Typical Failure Mechanisms ................................................................................ 21
B a i r d & A s s o c i a t e s
R u b b l e m o u n d R e v e t m e n t D e s i g n R e v i e w T a b l e o f C o n t e n t sL a k e S h o r e B o u l e v a r d , M a r q u e t t e , M I 1 2 0 3 5 . 2 0 1
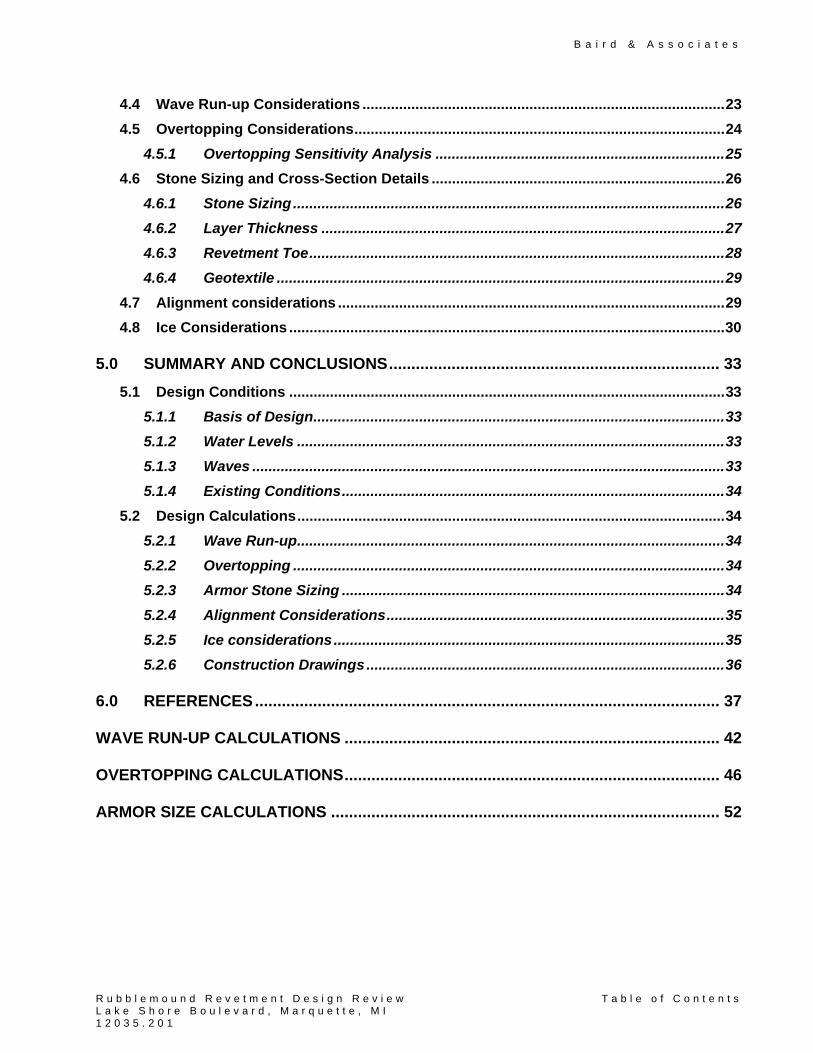
4.4 Wave Run-up Considerations ......................................................................................... 23
4.5 Overtopping Considerations ........................................................................................... 24
4.5.1 Overtopping Sensitivity Analysis ....................................................................... 25
4.6 Stone Sizing and Cross-Section Details ........................................................................ 26
4.6.1 Stone Sizing .......................................................................................................... 26
4.6.2 Layer Thickness ................................................................................................... 27
4.6.3 Revetment Toe ...................................................................................................... 28
4.6.4 Geotextile .............................................................................................................. 29
4.7 Alignment considerations ............................................................................................... 29
4.8 Ice Considerations ........................................................................................................... 30
5.0 SUMMARY AND CONCLUSIONS .......................................................................... 33
5.1 Design Conditions ........................................................................................................... 33
5.1.1 Basis of Design ..................................................................................................... 33
5.1.2 Water Levels ......................................................................................................... 33
5.1.3 Waves .................................................................................................................... 33
5.1.4 Existing Conditions .............................................................................................. 34
5.2 Design Calculations ......................................................................................................... 34
5.2.1 Wave Run-up ......................................................................................................... 34
5.2.2 Overtopping .......................................................................................................... 34
5.2.3 Armor Stone Sizing .............................................................................................. 34
5.2.4 Alignment Considerations ................................................................................... 35
5.2.5 Ice considerations ................................................................................................ 35
5.2.6 Construction Drawings ........................................................................................ 36
6.0 REFERENCES ........................................................................................................ 37
WAVE RUN-UP CALCULATIONS .................................................................................... 42
OVERTOPPING CALCULATIONS .................................................................................... 46
ARMOR SIZE CALCULATIONS ....................................................................................... 52
B a i r d & A s s o c i a t e s
R u b b l e m o u n d R e v e t m e n t D e s i g n R e v i e w P a g e 1L a k e S h o r e B o u l e v a r d , M a r q u e t t e , M I 1 2 0 3 5 . 2 0 1
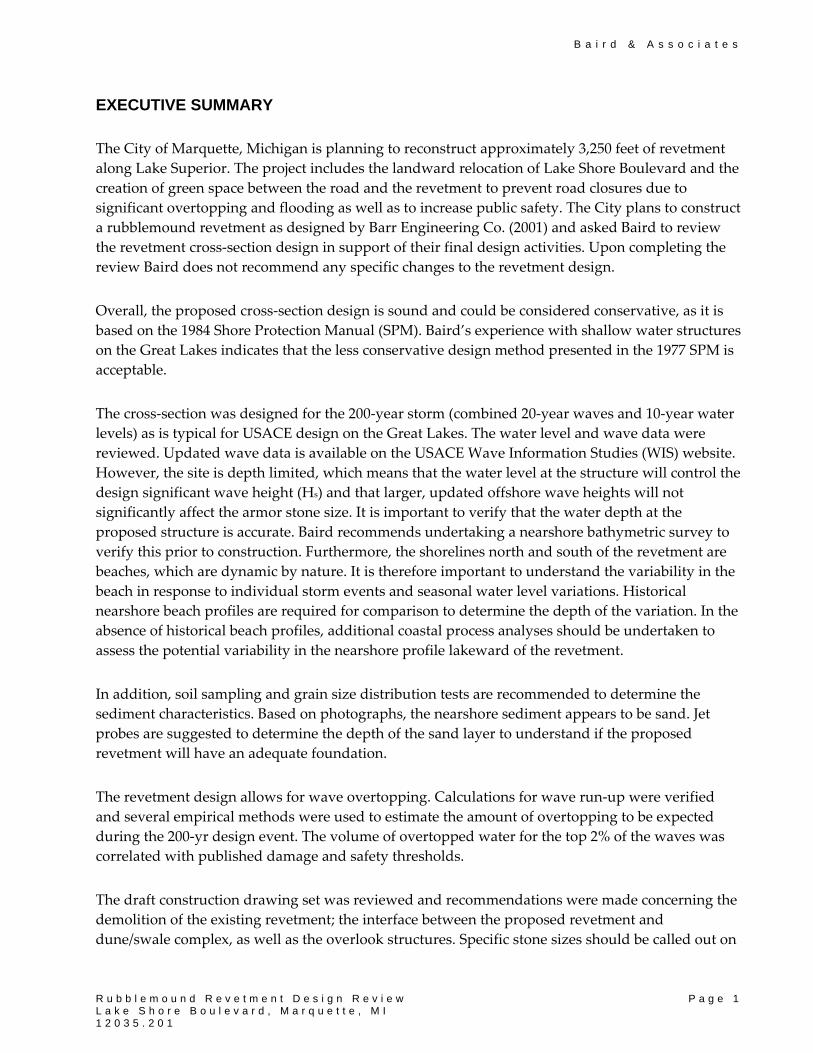
EXECUTIVE SUMMARY
The City of Marquette, Michigan is planning to reconstruct approximately 3,250 feet of revetment
along Lake Superior. The project includes the landward relocation of Lake Shore Boulevard and the
creation of green space between the road and the revetment to prevent road closures due to
significant overtopping and flooding as well as to increase public safety. The City plans to construct
a rubblemound revetment as designed by Barr Engineering Co. (2001) and asked Baird to review
the revetment cross‐section design in support of their final design activities. Upon completing the
review Baird does not recommend any specific changes to the revetment design.
Overall, the proposed cross‐section design is sound and could be considered conservative, as it is
based on the 1984 Shore Protection Manual (SPM). Baird’s experience with shallow water structures
on the Great Lakes indicates that the less conservative design method presented in the 1977 SPM is
acceptable.
The cross‐section was designed for the 200‐year storm (combined 20‐year waves and 10‐year water
levels) as is typical for USACE design on the Great Lakes. The water level and wave data were
reviewed. Updated wave data is available on the USACE Wave Information Studies (WIS) website.
However, the site is depth limited, which means that the water level at the structure will control the
design significant wave height (Hs) and that larger, updated offshore wave heights will not
significantly affect the armor stone size. It is important to verify that the water depth at the
proposed structure is accurate. Baird recommends undertaking a nearshore bathymetric survey to
verify this prior to construction. Furthermore, the shorelines north and south of the revetment are
beaches, which are dynamic by nature. It is therefore important to understand the variability in the
beach in response to individual storm events and seasonal water level variations. Historical
nearshore beach profiles are required for comparison to determine the depth of the variation. In the
absence of historical beach profiles, additional coastal process analyses should be undertaken to
assess the potential variability in the nearshore profile lakeward of the revetment.
In addition, soil sampling and grain size distribution tests are recommended to determine the
sediment characteristics. Based on photographs, the nearshore sediment appears to be sand. Jet
probes are suggested to determine the depth of the sand layer to understand if the proposed
revetment will have an adequate foundation.
The revetment design allows for wave overtopping. Calculations for wave run‐up were verified
and several empirical methods were used to estimate the amount of overtopping to be expected
during the 200‐yr design event. The volume of overtopped water for the top 2% of the waves was
correlated with published damage and safety thresholds.
The draft construction drawing set was reviewed and recommendations were made concerning the
demolition of the existing revetment; the interface between the proposed revetment and
dune/swale complex, as well as the overlook structures. Specific stone sizes should be called out on

B a i r d & A s s o c i a t e s
R u b b l e m o u n d R e v e t m e n t D e s i g n R e v i e w P a g e 2L a k e S h o r e B o u l e v a r d , M a r q u e t t e , M I 1 2 0 3 5 . 2 0 1
revetment cross‐sections. Additional details are suggested for the north and south terminations of
the revetment; the dunes and swales terminations; the weir at the detention pond; the interface of
the outfall pipe and the revetment; and for turbidity and erosion control during construction. It is
also noted that geotextile specifications require updating to reflect changes resulting from updated
manufacturing processes and implementation experience.

B a i r d & A s s o c i a t e s
R u b b l e m o u n d R e v e t m e n t D e s i g n R e v i e w P a g e 3L a k e S h o r e B o u l e v a r d , M a r q u e t t e , M I 1 2 0 3 5 . 2 0 1
1.0 INTRODUCTION
The City of Marquette is planning to reconfigure and rebuild approximately 4,200 feet of Lakeshore
Boulevard along Lake Superior. The project includes the relocation of Lake Shore Boulevard, the
reconstruction of approximately 3,250 feet of revetment, and the creation of a public waterfront
park including a bike path, parking areas, overlooks, and stormwater management features
including a detention pond and a dune/swale complex (see Figure 1.1). The project’s main area of
focus is the stretch of Lakeshore Boulevard that runs parallel to the Lake Superior shoreline from
Hawley Street to a point midway between Wright Street and Pine Street. This stretch of roadway is
in close proximity to the shoreline, adjacent to an existing stone revetment.
The project need has been identified by the
City based on the deteriorating condition of
the existing revetment, as well as flooding and
drainage problems along Lakeshore
Boulevard. At present, there are several issues
with the existing stone revetment and
roadway alignment that are driving this
redevelopment. This site can experience
significant wave overtopping during storm
events, especially at high water levels. This, in
turn, causes roadway closures and is a general
safety concern for the public. Flooding
becomes an issue due to overtopping waves
because various sections of existing land along
Lakeshore Boulevard have limited flood
storage capacity. During the winter months,
ice build‐up along the revetment causes
structural undermining and damage as well as
interruptions to roadway usage.
The City plans to address these issues by
utilizing a rubblemound revetment design
developed by Barr (2001). It is proposed to
use the Barr (2001) design to reconstruct the
existing stone revetment.
The City of Marquette has retained Baird to
undergo a design review of the cross‐section
presented by Barr (2001) for purposes of final
design for the Lakeshore Boulevard Coastal
Restoration project. This review will support final design activities and production of construction
Figure 1.1 Selected Project Preferred Plan

B a i r d & A s s o c i a t e s
R u b b l e m o u n d R e v e t m e n t D e s i g n R e v i e w P a g e 4 L a k e S h o r e B o u l e v a r d , M a r q u e t t e , M I 1 2 0 3 5 . 2 0 1
documents by the City of Marquette. The City plans to finalize these documents during the
summer of 2014.
Baird has completed a review of the cross‐sections, as well as other characteristics of the project
layout. The information contained in this report includes a renewed assessment of existing design
reports, site conditions, and design conditions and constraints to provide a complete review of the
Barr (2001) cross‐section.
B a i r d & A s s o c i a t e s
R u b b l e m o u n d R e v e t m e n t D e s i g n R e v i e w P a g e 5 L a k e S h o r e B o u l e v a r d , M a r q u e t t e , M I 1 2 0 3 5 . 2 0 1
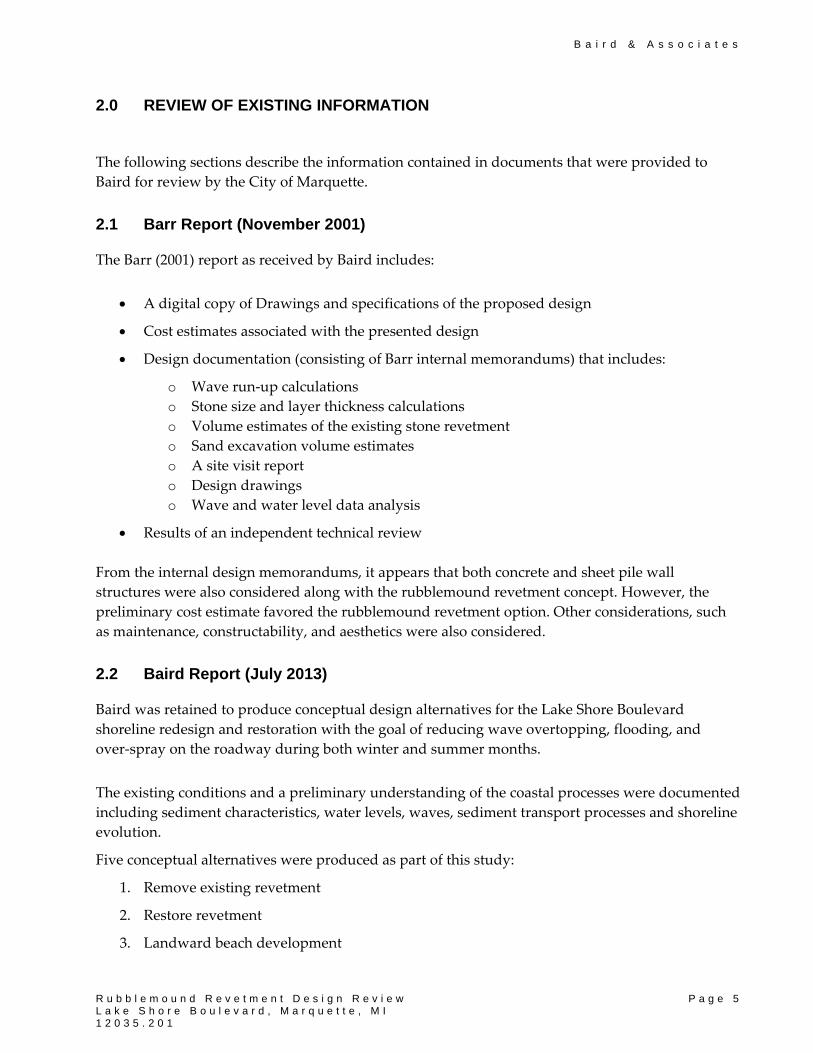
2.0 REVIEW OF EXISTING INFORMATION
The following sections describe the information contained in documents that were provided to
Baird for review by the City of Marquette.
2.1 Barr Report (November 2001)
The Barr (2001) report as received by Baird includes:
A digital copy of Drawings and specifications of the proposed design
Cost estimates associated with the presented design
Design documentation (consisting of Barr internal memorandums) that includes:
o Wave run‐up calculations
o Stone size and layer thickness calculations
o Volume estimates of the existing stone revetment
o Sand excavation volume estimates
o A site visit report
o Design drawings
o Wave and water level data analysis
Results of an independent technical review
From the internal design memorandums, it appears that both concrete and sheet pile wall
structures were also considered along with the rubblemound revetment concept. However, the
preliminary cost estimate favored the rubblemound revetment option. Other considerations, such
as maintenance, constructability, and aesthetics were also considered.
2.2 Baird Report (July 2013)
Baird was retained to produce conceptual design alternatives for the Lake Shore Boulevard
shoreline redesign and restoration with the goal of reducing wave overtopping, flooding, and
over‐spray on the roadway during both winter and summer months.
The existing conditions and a preliminary understanding of the coastal processes were documented
including sediment characteristics, water levels, waves, sediment transport processes and shoreline
evolution.
Five conceptual alternatives were produced as part of this study:
1. Remove existing revetment
2. Restore revetment
3. Landward beach development
B a i r d & A s s o c i a t e s
R u b b l e m o u n d R e v e t m e n t D e s i g n R e v i e w P a g e 6 L a k e S h o r e B o u l e v a r d , M a r q u e t t e , M I 1 2 0 3 5 . 2 0 1
4. Nearshore breakwaters and beach development
5. Stone groyne beach development
With the exception of option 2 above, all of the above options require that Lake Shore Boulevard be
realigned. Preliminary construction cost estimates supporting these options and recommendations
for further studies were also provided in this report.
The City of Marquette has since chosen to restore the revetment as well as realigning Lake Shore
Boulevard so that there is ample setback between the revetment and the road.
2.3 Draft Construction Drawing Set Review
The City of Marquette requested that Baird perform a preliminary review of the draft drawing set
for the Lakeshore Boulevard Coastal Restoration project. Draft drawings (PDF) were provided to
Baird on July 9, 2014. Baird’s cursory review of the drawings focused on overall designed
constructability. It is assumed that the City of Marquette will complete an independent Quality
Assurance/Quality Control and technical review of the final documents before bidding or
construction. The following items have been identified as areas that may warrant further review
and/or drawing revision.
2.3.1 Removal and Earthwork Plan
“Sheet 2” could be revised to better show limits of construction, salvage, clearing and grubbing,
tree protection, etc. It is unclear if the existing revetment between the proposed revetment
termination and Hawley Street is meant to be removed. While this area appears to include an
existing beach, additional analysis may be beneficial to understand potential overtopping of the
roadway in this area given its proximity to the shoreline.
2.3.2 Demo/Sorting/Staging of Existing Revetment
The demolition of the existing revetment may require a substantial land area for sorting existing
armor stone, staging replacement armor stone, and reconstruction of the revetment. Access for
construction machinery may be challenging or require additional temporary access.
2.3.3 Cross-Sections
The interface between the rebuilt revetment and the proposed dune/swale complex could
experience erosion due to overtopping of the revetment during severe storms. Armoring of the
slope from the +608.5’ terrace at the landside of the revetment or additional support of revetment
“Under Layer” in this area may be beneficial.
B a i r d & A s s o c i a t e s
R u b b l e m o u n d R e v e t m e n t D e s i g n R e v i e w P a g e 7 L a k e S h o r e B o u l e v a r d , M a r q u e t t e , M I 1 2 0 3 5 . 2 0 1
The Barr (2001) drawings indicate an armor layer thickness but do not specify the number of layers
or units associated with this measurement. It would be useful to have either or both of the stone
weight range and number of layers of armor stone intended for the course shown on the drawings.
2.3.4 Revetment Termination
Additional detail of the north and south termination of the revetment into existing ground may be
necessary to ensure accurate construction and stability of the revetment.
2.3.5 Swale Terminations
Additional detail or grading plans of the proposed dune and swale terminations may be necessary
to ensure accurate construction. It is assumed that additional planting plans and specifications will
be provided.
2.3.6 Overlooks
It is noted that the proposed overlook structures will be located over the landward side of the
proposed revetment. Additional detail and specification may be required on properly sizing the
earth retention plate, support piles, and construction.
2.3.7 Weir at Detention Pond
Additional detail, weirs, collars, or headwalls may be required at the interface between the concrete
pipe and the proposed detention pond.
2.3.8 Outfall Pipe/Revetment Interface
Additional detail may be required at the interface of the outfall pipe and the revetment for proper
placement of armor stone and protection of the pipe.
2.3.9 Permitting/Erosion Control
It is assumed that the City of Marquette has received all necessary permits for construction in and
adjacent to Lake Superior. Additional detail may be required for turbidity, and erosion control
measures if required by these permits.
B a i r d & A s s o c i a t e s
R u b b l e m o u n d R e v e t m e n t D e s i g n R e v i e w P a g e 8 L a k e S h o r e B o u l e v a r d , M a r q u e t t e , M I 1 2 0 3 5 . 2 0 1
3.0 SITE CONDITIONS
3.1 Existing Conditions
Baird has performed a preliminary review of several sources of available information to achieve a
general understanding of the existing conditions at the Lakeshore Boulevard location.
The northern section of the stone revetment was constructed before 1939, while the southern section
was constructed between 1939 and 1972. Based on a review of aerial photographs and images
supplied by the Lake Superior Watershed Partnership (LSWP), it appears that the revetment shows
signs of aging, was not well engineered, and the material was dumped in place by trucks. The
material ranges in size from cobble to armor stone (Figure 3.1).
Figure 3.1 Lakeshore Boulevard Stone Revetment
Physical changes to the shoreline south of the upper harbor have been recorded since the
completion of the multi‐phase harbor of refuge in 1939, which included the construction of a 2,600
foot Federal breakwater. The shoreline erosion processes south of the harbor determined the need
to provide a stone revetment along Lakeshore Boulevard, as shown in Figure 3.2.
B a i r d & A s s o c i a t e s
R u b b l e m o u n d R e v e t m e n t D e s i g n R e v i e w P a g e 9 L a k e S h o r e B o u l e v a r d , M a r q u e t t e , M I 1 2 0 3 5 . 2 0 1
Figure 3.2 Project Location Map
The National Oceanic and Atmospheric Administration (NOAA) have published LiDAR (Light
Detection and Ranging) surveys of the Great Lakes from several sources including the U.S. Army
Corps of Engineers (USACE) through the Joint Airborne LiDAR Bathymetry Technical Center of
Expertise. Data compiled by NOAA in 2011 was utilized in the basemap created for the Baird
(2013) study as shown in Figure 3.3.
Presque Isle
Lower Harbor
Lake Shore Blvd.
Upper Harbor
B a i r d & A s s o c i a t e s
R u b b l e m o u n d R e v e t m e n t D e s i g n R e v i e w P a g e 1 0 L a k e S h o r e B o u l e v a r d , M a r q u e t t e , M I 1 2 0 3 5 . 2 0 1
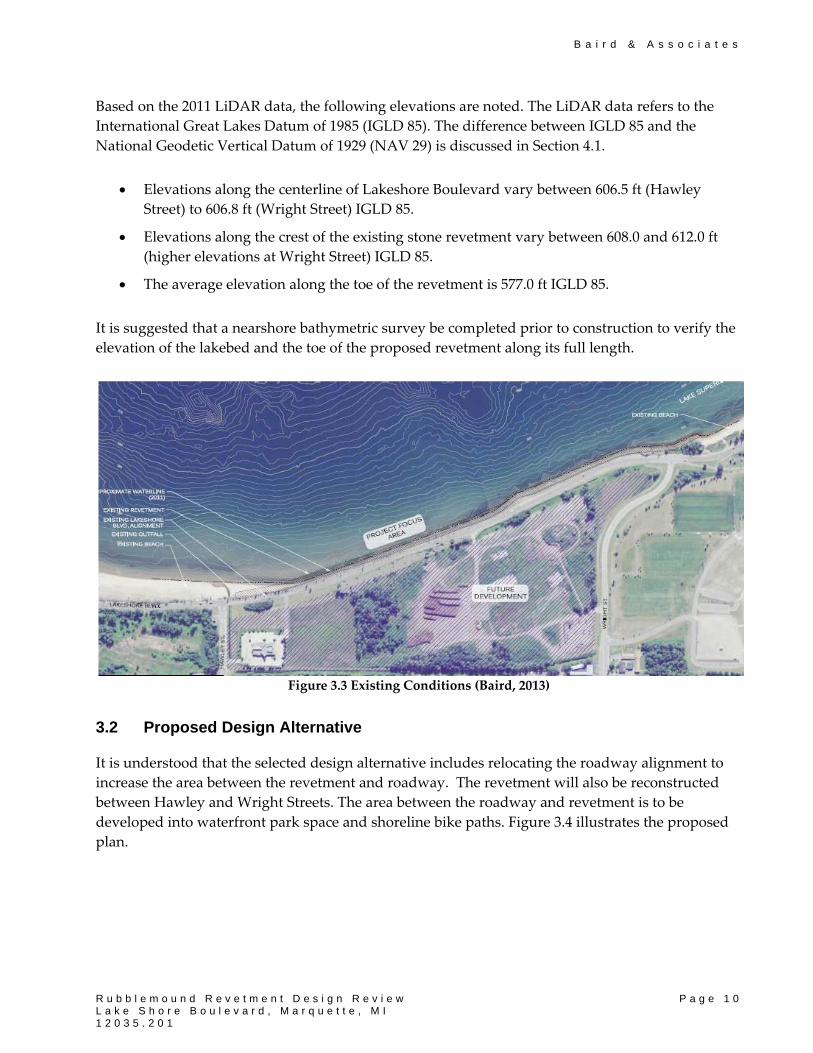
Based on the 2011 LiDAR data, the following elevations are noted. The LiDAR data refers to the
International Great Lakes Datum of 1985 (IGLD 85). The difference between IGLD 85 and the
National Geodetic Vertical Datum of 1929 (NAV 29) is discussed in Section 4.1.
Elevations along the centerline of Lakeshore Boulevard vary between 606.5 ft (Hawley
Street) to 606.8 ft (Wright Street) IGLD 85.
Elevations along the crest of the existing stone revetment vary between 608.0 and 612.0 ft
(higher elevations at Wright Street) IGLD 85.
The average elevation along the toe of the revetment is 577.0 ft IGLD 85.
It is suggested that a nearshore bathymetric survey be completed prior to construction to verify the
elevation of the lakebed and the toe of the proposed revetment along its full length.
Figure 3.3 Existing Conditions (Baird, 2013)
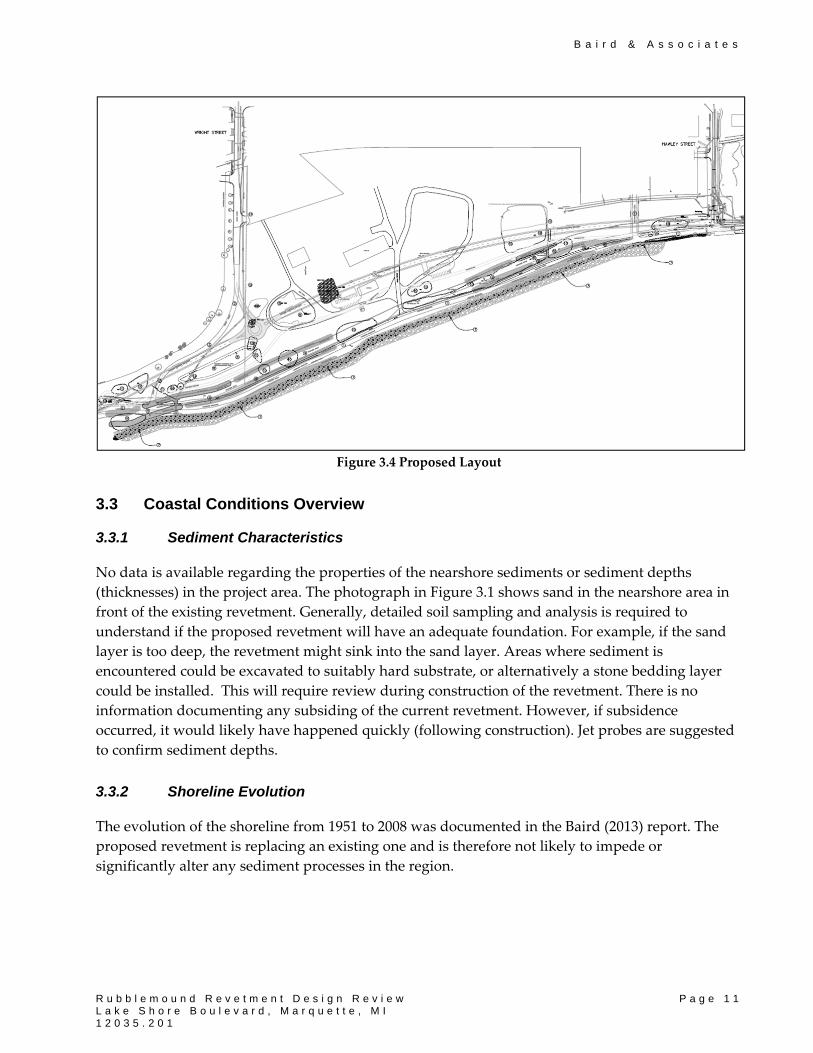
3.2 Proposed Design Alternative
It is understood that the selected design alternative includes relocating the roadway alignment to
increase the area between the revetment and roadway. The revetment will also be reconstructed
between Hawley and Wright Streets. The area between the roadway and revetment is to be
developed into waterfront park space and shoreline bike paths. Figure 3.4 illustrates the proposed
plan.
B a i r d & A s s o c i a t e s
R u b b l e m o u n d R e v e t m e n t D e s i g n R e v i e w P a g e 1 1 L a k e S h o r e B o u l e v a r d , M a r q u e t t e , M I 1 2 0 3 5 . 2 0 1
Figure 3.4 Proposed Layout
3.3 Coastal Conditions Overview
3.3.1 Sediment Characteristics
No data is available regarding the properties of the nearshore sediments or sediment depths
(thicknesses) in the project area. The photograph in Figure 3.1 shows sand in the nearshore area in
front of the existing revetment. Generally, detailed soil sampling and analysis is required to
understand if the proposed revetment will have an adequate foundation. For example, if the sand
layer is too deep, the revetment might sink into the sand layer. Areas where sediment is
encountered could be excavated to suitably hard substrate, or alternatively a stone bedding layer
could be installed. This will require review during construction of the revetment. There is no
information documenting any subsiding of the current revetment. However, if subsidence
occurred, it would likely have happened quickly (following construction). Jet probes are suggested
to confirm sediment depths.
3.3.2 Shoreline Evolution
The evolution of the shoreline from 1951 to 2008 was documented in the Baird (2013) report. The
proposed revetment is replacing an existing one and is therefore not likely to impede or
significantly alter any sediment processes in the region.
B a i r d & A s s o c i a t e s
R u b b l e m o u n d R e v e t m e n t D e s i g n R e v i e w P a g e 1 2 L a k e S h o r e B o u l e v a r d , M a r q u e t t e , M I 1 2 0 3 5 . 2 0 1
3.3.3 Water Levels
Water levels may have a significant influence on the performance of coastal structures in shallow
water where the wave conditions at the structure may be depth‐limited. In this case, the wave
heights will increase at higher water levels, leading to a requirement for larger armor stone to
provide a stable armor layer. In addition, the freeboard of the structure (i.e. height of crest above
water level) is reduced at higher water levels, resulting in more overtopping and an increased risk
of damage. As such, the effectiveness of any proposed shoreline protection structure will be
reduced at higher water elevations. Low water levels may be a consideration in the design of an
appropriate toe detail for the structure.
Water levels on Lake Superior vary on several different time scales in response to climatic
fluctuations. Changes in precipitation and evaporation patterns over the Great Lakes drainage
basin result in long‐term (i.e. over a period of years) lake level fluctuations in the order of several
feet on Lake Superior. In addition, there are seasonal changes in water level due to annual
precipitation patterns and spring runoff. Lake Superior levels tend to be highest during July and
lowest during March, with the typical annual variation in lake levels being approximately 1 foot. In
addition, local water levels may vary significantly on a short‐term basis (i.e. over a period of hours
to days) due to storm surge resulting from meteorological forcing (i.e. wind stress and barometric
pressure). Storm surges on Lake Superior may reach several feet (positive/setup or
negative/setdown), depending on site location, and occur independent of the long‐term and
seasonal lake level fluctuations. However, there is a tendency for the most severe surges to occur
during the stormy winter period when lake levels tend to be lower.
The Baird (2013) report provides water level data as analyzed by the USACE in a 1993 publication
(Design Water Level Determination on The Great Lakes) in which design water levels are estimated
for various return periods. The design water level is defined as the lake level and storm surge
combined. These values are further discussed in Section 4.1.
3.3.4 Wave Climate
Wave data from the Baird (2013) and the Barr (2001) reports are discussed in Section 4.2.
B a i r d & A s s o c i a t e s
R u b b l e m o u n d R e v e t m e n t D e s i g n R e v i e w P a g e 1 3 L a k e S h o r e B o u l e v a r d , M a r q u e t t e , M I 1 2 0 3 5 . 2 0 1
4.0 REVIEW OF DESIGN CONDITIONS
4.1 Design Water Levels
The design water level including the effects of long term and seasonal lake level fluctuations, as
well as storm surge for various recurrence intervals is shown in Table 4.1. These values were
determined by the USACE (1993) and are reported in the Baird (2013) report as well as the Barr
(2001) design report. The elevations are based on a gage analysis of 130 years of data at Marquette,
MI.
Table 4.1 Summary of Design Water Levels Near Presque Isle, MI (USACE, 1993)
Recurrence interval
Design water levels (IGLD 85)
10 year 604.2 ft 20 year 604.3 ft 30 year 604.5 ft 50 year 604.7 ft
100 year 604.9 ft
It should be noted that there is a conversion factor between the NAV 29 (or NGVD 29) and IGLD 85
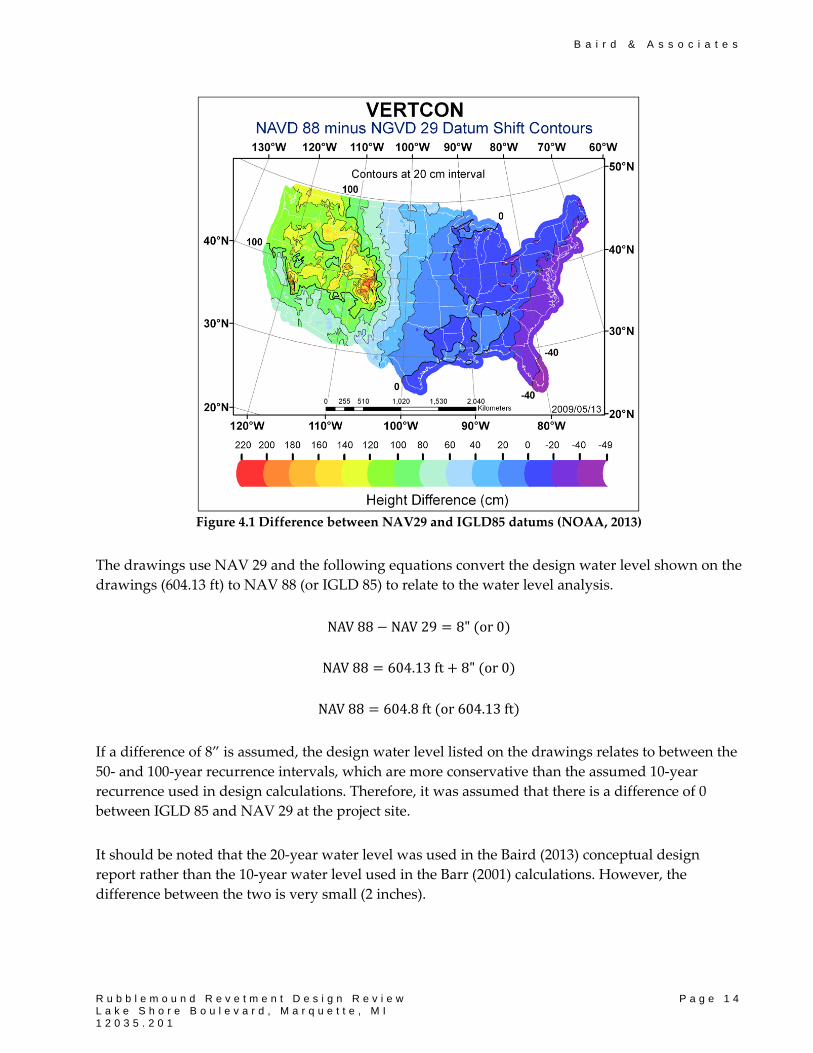
datums which is location dependent. There is no difference between IGLD 85 and NAVD 88. Figure
4.1 shows that the difference between NAV 88 (or IGLD 85) and NAV 29 is between 0 and 8 inches
(20 cm). The exact difference needs to be interpolated from sites where the conversion was
calculated.
B a i r d & A s s o c i a t e s
R u b b l e m o u n d R e v e t m e n t D e s i g n R e v i e w P a g e 1 4 L a k e S h o r e B o u l e v a r d , M a r q u e t t e , M I 1 2 0 3 5 . 2 0 1
Figure 4.1 Difference between NAV29 and IGLD85 datums (NOAA, 2013)
The drawings use NAV 29 and the following equations convert the design water level shown on the
drawings (604.13 ft) to NAV 88 (or IGLD 85) to relate to the water level analysis.
NAV88 NAV29 8" or0
NAV88 604.13ft 8" or0
NAV88 604.8ft or604.13ft
If a difference of 8” is assumed, the design water level listed on the drawings relates to between the
50‐ and 100‐year recurrence intervals, which are more conservative than the assumed 10‐year
recurrence used in design calculations. Therefore, it was assumed that there is a difference of 0
between IGLD 85 and NAV 29 at the project site.
It should be noted that the 20‐year water level was used in the Baird (2013) conceptual design
report rather than the 10‐year water level used in the Barr (2001) calculations. However, the
difference between the two is very small (2 inches).
B a i r d & A s s o c i a t e s
R u b b l e m o u n d R e v e t m e n t D e s i g n R e v i e w P a g e 1 5 L a k e S h o r e B o u l e v a r d , M a r q u e t t e , M I 1 2 0 3 5 . 2 0 1
4.2 Waves
Barr (2001) reports using a 1978 USACE hindcast, which yielded 20‐year deep water significant
wave heights (Hs) of 12.5, 18.4 and 14.8 ft from angle classes 1, 2 and 3 respectively. Because the site
is largely sheltered from angle class 3, waves from this angle are not used for design. The design
waves from the Barr (2001) report are summarized in Table 4.2.
Table 4.2 Summary of Waves
Incident Wave Height Significant Deep Water Wave at Hawley St at Fair Ave
Angle class 2 with diffraction 2.8 ft 14.7 ft Angle class 1 with no diffraction 12.5 ft 12.5 ft
The toe of the proposed revetment is in relatively shallow water. Therefore, the waves listed in
Table 4.1 will break offshore and the design wave height for the revetment should be determined
by a breaking wave analysis under depth limited conditions. Barr (2001) estimated the breaking
wave at the structure (Hb, or H10) to be 7.0 ft, while the significant wave height (Hs) is 5.5 ft.
According to the Barr (2001) wave analysis, this corresponds to the 20‐year deep water significant
wave.
Baird used Goda’s method (1970) to estimate shoaling and breaking effects as the deepwater waves
propagate into shore. Lakebed slopes were determined from three representative cross‐sections
extracted from the available LiDAR data. One of the Barr internal memos states that a T = 7 s wave
was assumed, which is considered typical for storm events in the area. Table 4.3 provides the inputs
and results from the Goda wave transformations.
Table 4.3 Deepwater Wave Transformation to Structure (Goda, 1970)
Deepwater wave Slope depth at the
structure Hs
Angle class 1 with no diffraction at Hawley St 12.5 ft
1:40
7.1 ft
5.3 ft
1:30
5.8 ft *Angle class 2 with diffraction at Wright street end of proposed revetment
9.4 ft 5.3 ft
*This wave height was interpolated as the study area does not extend all the way to Fair Ave.
The resulting Hs values in Table 4.3 compare well to the design significant wave height (Hb) used
by Barr (2001). More detailed calculations can be found in Appendix A.
The revetment is situated in depth limited conditions. Therefore, the significant wave height (Hs) at
the structure is governed by the revetment toe depth and the design water level. Because the
adjacent shorelines to the north and south of the breakwater are beaches which are dynamic by
nature, it is important to understand the variability in the beach in response to individual storm
B a i r d & A s s o c i a t e s
R u b b l e m o u n d R e v e t m e n t D e s i g n R e v i e w P a g e 1 6 L a k e S h o r e B o u l e v a r d , M a r q u e t t e , M I 1 2 0 3 5 . 2 0 1
events and seasonal water level variations. Historical nearshore beach profiles are required for
comparison to determine the depth of the variation. The toe of the revetment should reside below
the level of variability in the lakebed.
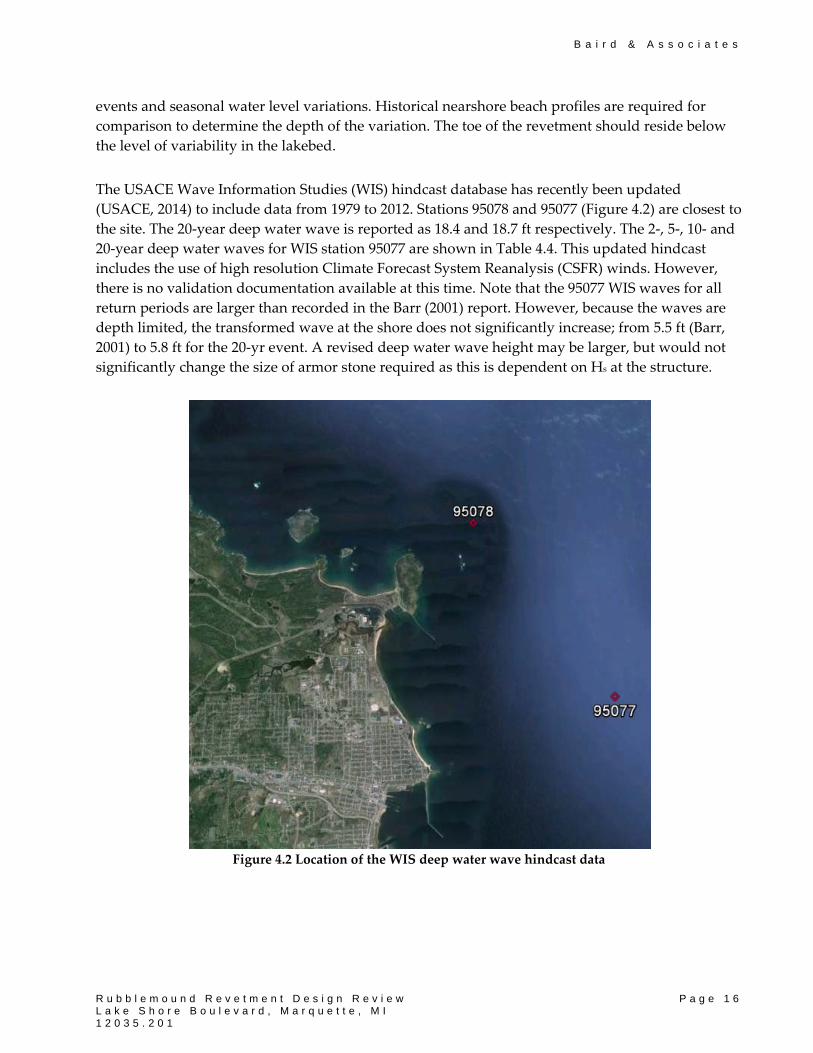
The USACE Wave Information Studies (WIS) hindcast database has recently been updated
(USACE, 2014) to include data from 1979 to 2012. Stations 95078 and 95077 (Figure 4.2) are closest to
the site. The 20‐year deep water wave is reported as 18.4 and 18.7 ft respectively. The 2‐, 5‐, 10‐ and
20‐year deep water waves for WIS station 95077 are shown in Table 4.4. This updated hindcast
includes the use of high resolution Climate Forecast System Reanalysis (CSFR) winds. However,
there is no validation documentation available at this time. Note that the 95077 WIS waves for all
return periods are larger than recorded in the Barr (2001) report. However, because the waves are
depth limited, the transformed wave at the shore does not significantly increase; from 5.5 ft (Barr,
2001) to 5.8 ft for the 20‐yr event. A revised deep water wave height may be larger, but would not
significantly change the size of armor stone required as this is dependent on Hs at the structure.
Figure 4.2 Location of the WIS deep water wave hindcast data
B a i r d & A s s o c i a t e s
R u b b l e m o u n d R e v e t m e n t D e s i g n R e v i e w P a g e 1 7 L a k e S h o r e B o u l e v a r d , M a r q u e t t e , M I 1 2 0 3 5 . 2 0 1
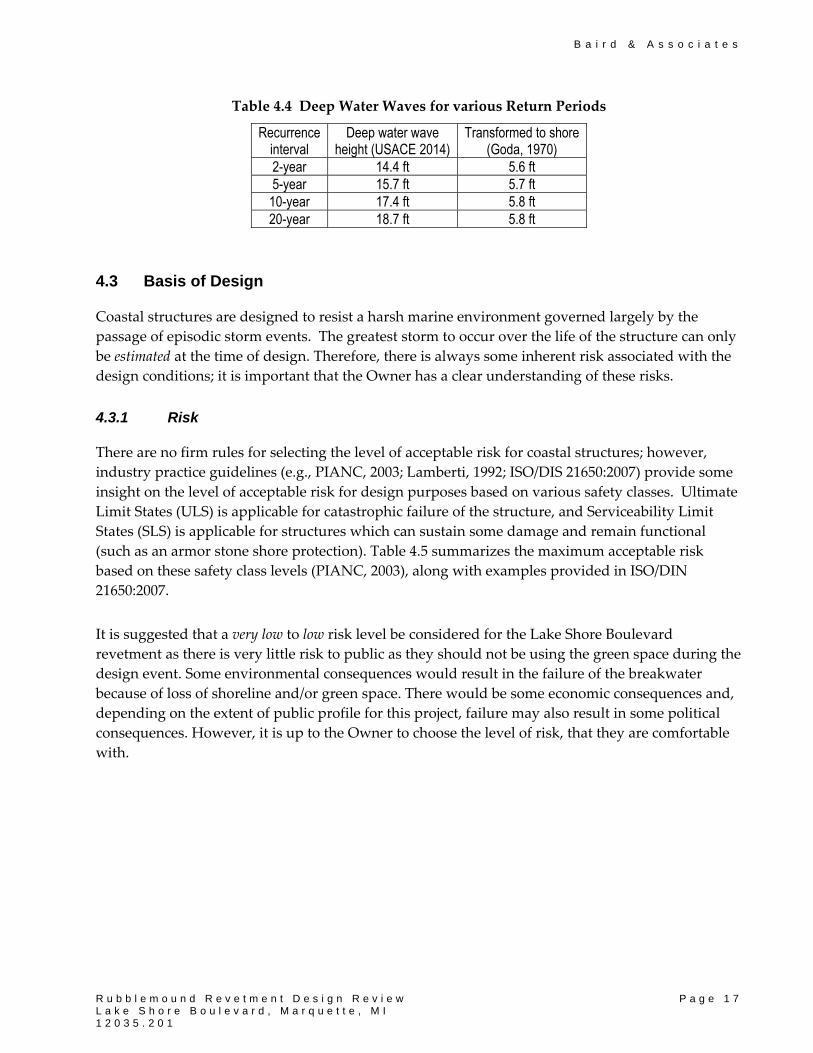
Table 4.4 Deep Water Waves for various Return Periods
Recurrence interval
Deep water wave height (USACE 2014)
Transformed to shore (Goda, 1970)
2-year 14.4 ft 5.6 ft 5-year 15.7 ft 5.7 ft
10-year 17.4 ft 5.8 ft 20-year 18.7 ft 5.8 ft
4.3 Basis of Design
Coastal structures are designed to resist a harsh marine environment governed largely by the
passage of episodic storm events. The greatest storm to occur over the life of the structure can only
be estimated at the time of design. Therefore, there is always some inherent risk associated with the
design conditions; it is important that the Owner has a clear understanding of these risks.
4.3.1 Risk
There are no firm rules for selecting the level of acceptable risk for coastal structures; however,
industry practice guidelines (e.g., PIANC, 2003; Lamberti, 1992; ISO/DIS 21650:2007) provide some
insight on the level of acceptable risk for design purposes based on various safety classes. Ultimate
Limit States (ULS) is applicable for catastrophic failure of the structure, and Serviceability Limit
States (SLS) is applicable for structures which can sustain some damage and remain functional
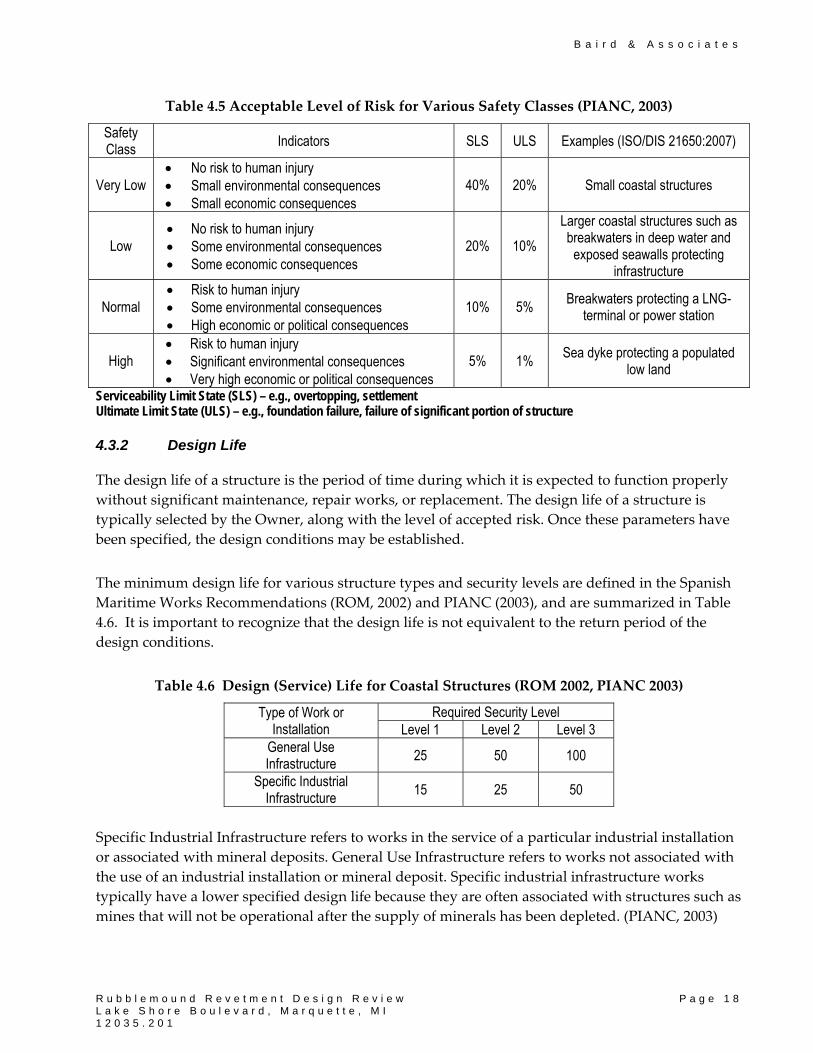
(such as an armor stone shore protection). Table 4.5 summarizes the maximum acceptable risk
based on these safety class levels (PIANC, 2003), along with examples provided in ISO/DIN
21650:2007.
It is suggested that a very low to low risk level be considered for the Lake Shore Boulevard
revetment as there is very little risk to public as they should not be using the green space during the
design event. Some environmental consequences would result in the failure of the breakwater
because of loss of shoreline and/or green space. There would be some economic consequences and,
depending on the extent of public profile for this project, failure may also result in some political
consequences. However, it is up to the Owner to choose the level of risk, that they are comfortable
with.
B a i r d & A s s o c i a t e s
R u b b l e m o u n d R e v e t m e n t D e s i g n R e v i e w P a g e 1 8 L a k e S h o r e B o u l e v a r d , M a r q u e t t e , M I 1 2 0 3 5 . 2 0 1
Table 4.5 Acceptable Level of Risk for Various Safety Classes (PIANC, 2003)
Safety Class
Indicators SLS ULS Examples (ISO/DIS 21650:2007)
Very Low No risk to human injury Small environmental consequences Small economic consequences
40% 20% Small coastal structures
Low No risk to human injury Some environmental consequences Some economic consequences
20% 10%
Larger coastal structures such as breakwaters in deep water and
exposed seawalls protecting infrastructure
Normal Risk to human injury Some environmental consequences High economic or political consequences
10% 5% Breakwaters protecting a LNG-
terminal or power station
High Risk to human injury Significant environmental consequences Very high economic or political consequences
5% 1% Sea dyke protecting a populated
low land
Serviceability Limit State (SLS) – e.g., overtopping, settlement Ultimate Limit State (ULS) – e.g., foundation failure, failure of significant portion of structure
4.3.2 Design Life
The design life of a structure is the period of time during which it is expected to function properly
without significant maintenance, repair works, or replacement. The design life of a structure is
typically selected by the Owner, along with the level of accepted risk. Once these parameters have
been specified, the design conditions may be established.
The minimum design life for various structure types and security levels are defined in the Spanish
Maritime Works Recommendations (ROM, 2002) and PIANC (2003), and are summarized in Table
4.6. It is important to recognize that the design life is not equivalent to the return period of the
design conditions.
Table 4.6 Design (Service) Life for Coastal Structures (ROM 2002, PIANC 2003)
Type of Work or Installation
Required Security Level Level 1 Level 2 Level 3
General Use Infrastructure
25 50 100
Specific Industrial Infrastructure
15 25 50
Specific Industrial Infrastructure refers to works in the service of a particular industrial installation
or associated with mineral deposits. General Use Infrastructure refers to works not associated with
the use of an industrial installation or mineral deposit. Specific industrial infrastructure works
typically have a lower specified design life because they are often associated with structures such as
mines that will not be operational after the supply of minerals has been depleted. (PIANC, 2003)
B a i r d & A s s o c i a t e s
R u b b l e m o u n d R e v e t m e n t D e s i g n R e v i e w P a g e 1 9 L a k e S h o r e B o u l e v a r d , M a r q u e t t e , M I 1 2 0 3 5 . 2 0 1
Security Level 1 refers to works and installations of local auxiliary interest with a small risk of loss
of human life or environmental damage in the event of failure. Typical structures included in
Security Level 1 are defense and coastal regeneration works, works in minor ports or marinas, local
outfalls, pavements, commercial installations, buildings, etc. (PIANC, 2003).
Security level 2 refers to works and installations of general interest with a moderate risk of loss of
human life or environmental damage in the event of failure. Typical structures included in security
level 2 are large ports, outfalls of large cities, etc. (PIANC, 2003).
Security level 3 refers to works and installations for protection against inundations or international
interest with an elevated risk of loss of human life or environmental damage in the event of failure.
Typical structures included in security level 3 are utility‐scale power plants and measures
preventing significant damage to urban or industrial centers (PIANC, 2003).
The proposed revetment is General Use Infrastructure and could be categorized as Security Level 1
or 2 which dictates a 25 to 50 year design life.
4.3.3 Return Period of Design Event
Risk is defined as the probability that a given design event (for this project, a specified combination
of monthly mean water level, storm surge, and wave height) will be reached or exceeded at least
once during the project life. If the design event is reached or exceeded, there will be certain
consequences that must be taken into consideration. For example, if the design conditions are
exceeded, there may be damage to the coastal structure and a subsequent possibility of direct or
indirect economic costs.
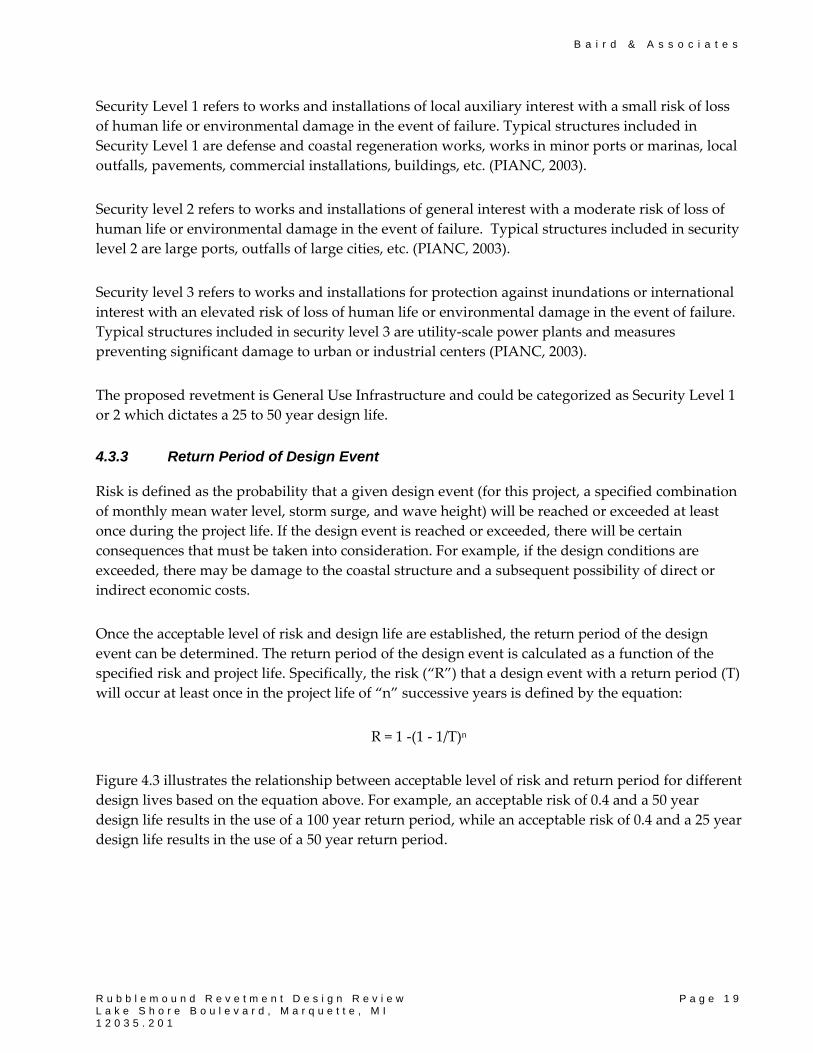
Once the acceptable level of risk and design life are established, the return period of the design
event can be determined. The return period of the design event is calculated as a function of the
specified risk and project life. Specifically, the risk (“R”) that a design event with a return period (T)
will occur at least once in the project life of “n” successive years is defined by the equation:
R = 1 ‐(1 ‐ 1/T)n
Figure 4.3 illustrates the relationship between acceptable level of risk and return period for different
design lives based on the equation above. For example, an acceptable risk of 0.4 and a 50 year
design life results in the use of a 100 year return period, while an acceptable risk of 0.4 and a 25 year
design life results in the use of a 50 year return period.
B a i r d & A s s o c i a t e s
R u b b l e m o u n d R e v e t m e n t D e s i g n R e v i e w P a g e 2 0 L a k e S h o r e B o u l e v a r d , M a r q u e t t e , M I 1 2 0 3 5 . 2 0 1
Figure 4.3 Risk of Event Occurring within the Design Life of a Structure
The selection of the acceptable level of risk and the design life is ultimately a decision that must be
made by the Owner. Based on the aforementioned published literature and standard engineering
practices, the return periods for the design of the proposed revetment are shown in Table 4.7.
Table 4.7 Design Return Period Summary
Safety Class SLS Design Life (years)
Event Return Period (years)
Very Low 40% 25-50 50-100 Low 20% 25-50 100-200
A low risk level results in a design return period of 100‐200 years. The USACE standard for coastal
design on the Great Lakes is nominally a 200 year return period, considering the combined effects
of waves and water levels. Generally, different combinations of the waves and water levels would
be tested to determine the worst case scenario; i.e. the 20‐year wave x 10‐year water level; 10‐year
wave x 20‐year water level; or the 2‐year wave × 100‐year water level. Given that the waves are
depth limited and the water levels do not significantly increase with increasing return period, a
200‐year return period considering the combined effects of waves and water levels is considered
acceptable.
In general, Rubblemound revetments are designed to accommodate some minor damage. Of note,
the “no damage” criteria in standard Coastal Engineering practice typically allows for 0 to 5%
B a i r d & A s s o c i a t e s
R u b b l e m o u n d R e v e t m e n t D e s i g n R e v i e w P a g e 2 1 L a k e S h o r e B o u l e v a r d , M a r q u e t t e , M I 1 2 0 3 5 . 2 0 1
damage. In addition, some maintenance in response to long term deterioration or “wear and tear”
should be expected.
In addition to the replacement costs due to deterioration of the stone, there should be an allowance
for repairs to the structure which may be required as a result of storms exceeding the design event.
Rubblemound structures generally fail progressively, with a failed structure generally retaining a
significant amount of residual shore protection capability.
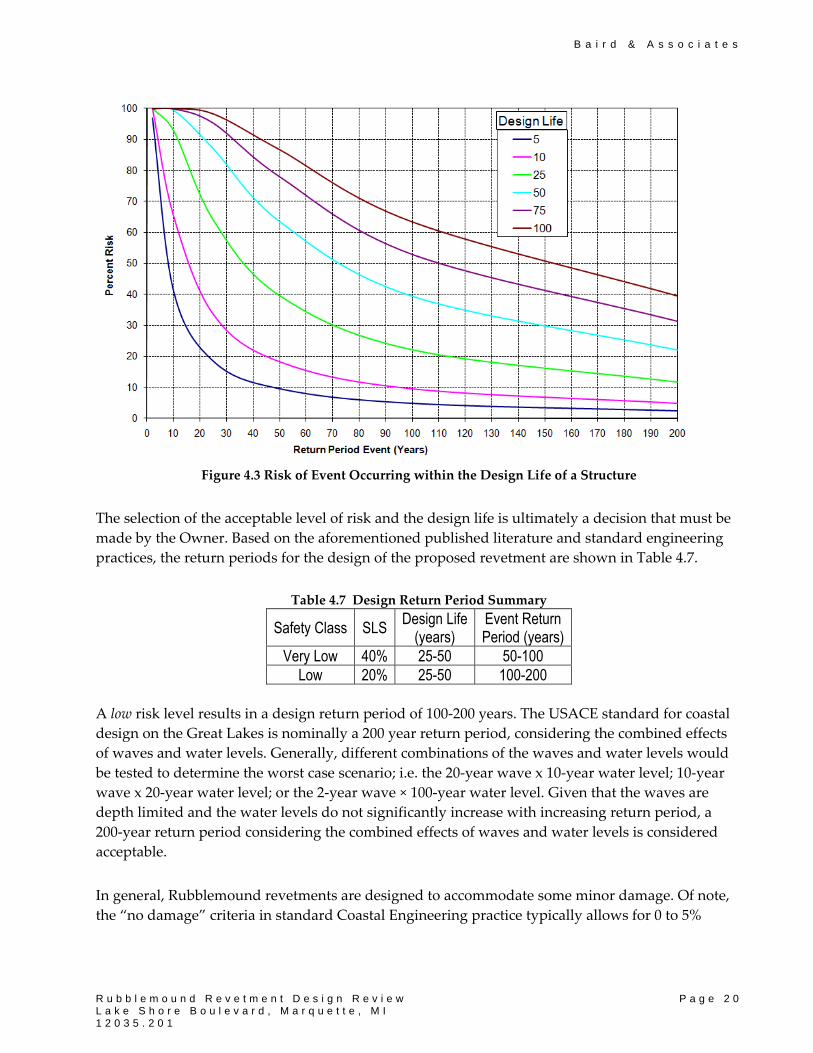
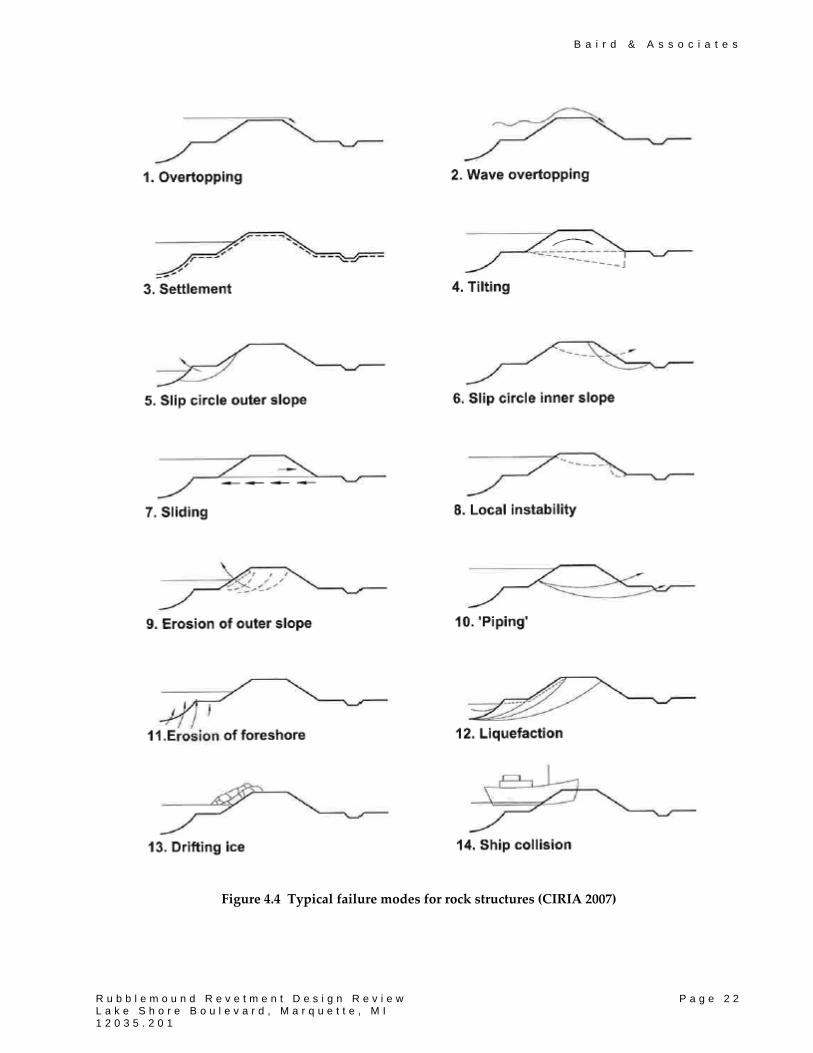
4.3.4 Typical Failure Mechanisms
CIRIA (2007) presents an overview of principal failure mechanisms for rock structures (Figure 4.4)
and defines failure as a response to a defined loading which exceeds a value of performance related
to the structure’s functional requirements. Some failure modes can be allowed to occur repeatedly
up to a certain limit during normal service life, such as overtopping or displacement of stones on a
dynamically stable slope.
The degree to which the failure modes presented in Figure 4.4 are relevant varies for different
structures. Some wave overtopping is permitted as discussed in Section 4.5. It is not possible to
predict the mechanisms of failure, should it occur. No geotechnical information is available and the
likelihood of a ship collision is unknown.
B a i r d & A s s o c i a t e s
R u b b l e m o u n d R e v e t m e n t D e s i g n R e v i e w P a g e 2 2 L a k e S h o r e B o u l e v a r d , M a r q u e t t e , M I 1 2 0 3 5 . 2 0 1
Figure 4.4 Typical failure modes for rock structures (CIRIA 2007)
B a i r d & A s s o c i a t e s
R u b b l e m o u n d R e v e t m e n t D e s i g n R e v i e w P a g e 2 3 L a k e S h o r e B o u l e v a r d , M a r q u e t t e , M I 1 2 0 3 5 . 2 0 1
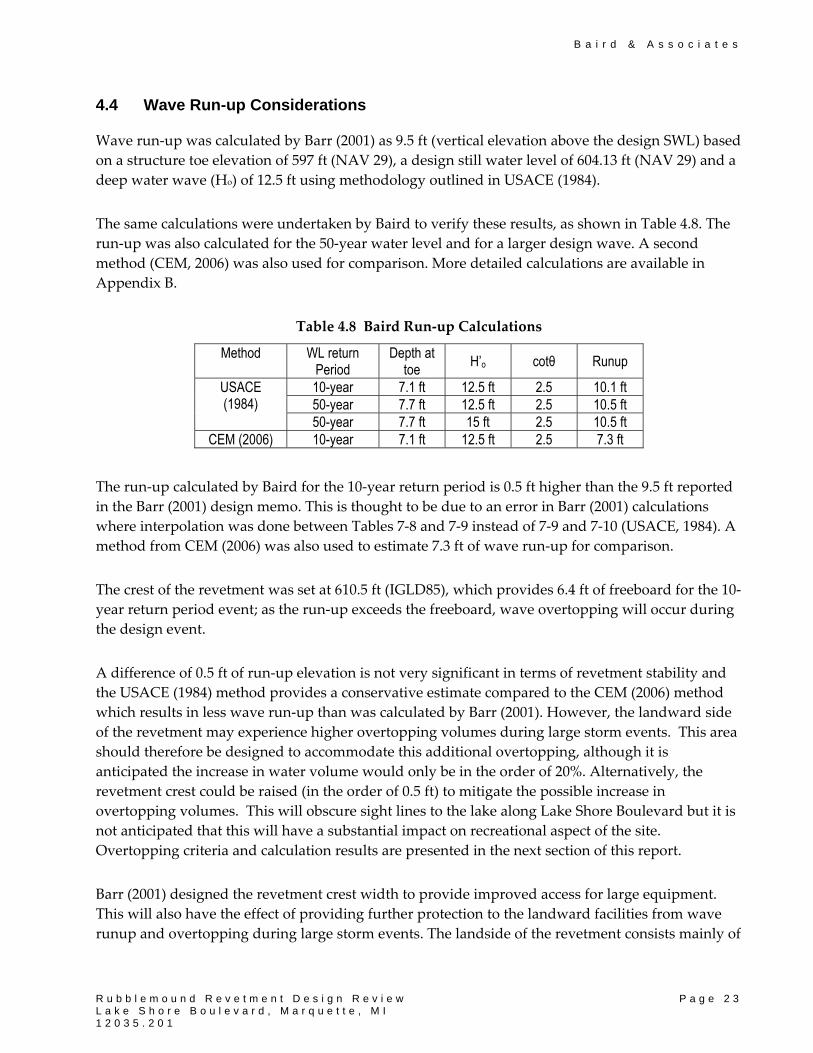
4.4 Wave Run-up Considerations
Wave run‐up was calculated by Barr (2001) as 9.5 ft (vertical elevation above the design SWL) based
on a structure toe elevation of 597 ft (NAV 29), a design still water level of 604.13 ft (NAV 29) and a
deep water wave (Ho) of 12.5 ft using methodology outlined in USACE (1984).
The same calculations were undertaken by Baird to verify these results, as shown in Table 4.8. The
run‐up was also calculated for the 50‐year water level and for a larger design wave. A second
method (CEM, 2006) was also used for comparison. More detailed calculations are available in
Appendix B.
Table 4.8 Baird Run‐up Calculations
Method WL return Period
Depth at toe
H’o cotθ Runup
USACE (1984)
10-year 7.1 ft 12.5 ft 2.5 10.1 ft 50-year 7.7 ft 12.5 ft 2.5 10.5 ft 50-year 7.7 ft 15 ft 2.5 10.5 ft
CEM (2006) 10-year 7.1 ft 12.5 ft 2.5 7.3 ft
The run‐up calculated by Baird for the 10‐year return period is 0.5 ft higher than the 9.5 ft reported
in the Barr (2001) design memo. This is thought to be due to an error in Barr (2001) calculations
where interpolation was done between Tables 7‐8 and 7‐9 instead of 7‐9 and 7‐10 (USACE, 1984). A
method from CEM (2006) was also used to estimate 7.3 ft of wave run‐up for comparison.
The crest of the revetment was set at 610.5 ft (IGLD85), which provides 6.4 ft of freeboard for the 10‐
year return period event; as the run‐up exceeds the freeboard, wave overtopping will occur during
the design event.
A difference of 0.5 ft of run‐up elevation is not very significant in terms of revetment stability and
the USACE (1984) method provides a conservative estimate compared to the CEM (2006) method
which results in less wave run‐up than was calculated by Barr (2001). However, the landward side
of the revetment may experience higher overtopping volumes during large storm events. This area
should therefore be designed to accommodate this additional overtopping, although it is
anticipated the increase in water volume would only be in the order of 20%. Alternatively, the
revetment crest could be raised (in the order of 0.5 ft) to mitigate the possible increase in
overtopping volumes. This will obscure sight lines to the lake along Lake Shore Boulevard but it is
not anticipated that this will have a substantial impact on recreational aspect of the site.
Overtopping criteria and calculation results are presented in the next section of this report.
Barr (2001) designed the revetment crest width to provide improved access for large equipment.
This will also have the effect of providing further protection to the landward facilities from wave
runup and overtopping during large storm events. The landside of the revetment consists mainly of
B a i r d & A s s o c i a t e s
R u b b l e m o u n d R e v e t m e n t D e s i g n R e v i e w P a g e 2 4 L a k e S h o r e B o u l e v a r d , M a r q u e t t e , M I 1 2 0 3 5 . 2 0 1
green space, with no future plans for development. Therefore, some wave run‐up and overtopping
can be tolerated. However, the area should be properly signed so that the public is aware that it is
unsafe to be in the area during extreme weather events. Some maintenance may also be required in
this area following large storm events. The USACE (1984) Shore Protection Manual (SPM)
recommends a minimum revetment crest width of three armor units. Assuming a nominal armor
unit size of 3 ft, the Barr (2001) design would yield four units on the crest for a total of 12 ft which is
greater than recommended in USACE (1984).
4.5 Overtopping Considerations
Overtopping rates for the proposed revetment design were estimated using empirical equations
found in CEM (2006); CIRIA (2007); and Goda (2010). The numerical model PC‐Overtopping was
also used as a point of reference to estimate overtopping rates. The key input variables for all
methods are the incident wave conditions (taking into account the nearshore bathymetry) and the
structure geometry (slope, freeboard, etc.).
The above‐listed methods estimated overtopping rates between 0.05 and 0.75 ft3/s/ft for the 20/10
wave/water level design event (200‐year return period storm) as reported in Barr (2001). Differences
in the estimated rates are attributed to differences in the experimentally derived equations and
constants. Equations and calculations can be found in Appendix C.
Several guidelines (Eurotop, 2007; CEM 2006; Goda, 2010; CIRIA, 2007) were consulted to assess the
potential implications of the overtopping that can be expected with the combined 20‐year design
wave and the 10‐year design water level used by Barr (2001). During the design event the following
conditions may be expected in the vicinity of the revetment:
It will likely be very dangerous for pedestrians. The public should not be in the area during
these events. It is also unsafe for trained staff that are well shod and protected. Any person
in the area should expect to get very wet. Signage should be erected warning the public of
the overtopping danger during severe storm events.
Limits for safe vehicular access will likely be exceeded. It will be unsafe for driving at
moderate or high speeds because of “impulsive” wave overtopping in the form of falling or
high velocity jets. However, with the realignment of Lake Shore Boulevard to a location
further inland, this should not be a concern, as the effect of the overtopping should be
restricted to the greenspace immediately adjacent to the revetment.
Damage to a promenade may result if it is not paved. If walkways are planned adjacent to
the revetment, they should be paved to avoid damage. Otherwise some maintenance of the
pathways may be required. It should also be noted that soft landscaping or grassy slopes
may be damaged by overtopping during the design event.
At the higher end of the overtopping range (above 0.5 f3/s/ft), damage to the revetment
armor layer may occur.
B a i r d & A s s o c i a t e s
R u b b l e m o u n d R e v e t m e n t D e s i g n R e v i e w P a g e 2 5 L a k e S h o r e B o u l e v a r d , M a r q u e t t e , M I 1 2 0 3 5 . 2 0 1
The above overtopping criteria are applicable adjacent to the shoreline and some distance inland
and provides an estimation of the effects of the design conditions which have a combined return
period of 200 years.
The effect of wave run‐up and overtopping on any proposed viewing platforms (or other structures
in the vicinity) should be properly quantified prior to design of these structures. In addition,
specific studies should be conducted to determine appropriate wave impact loads.
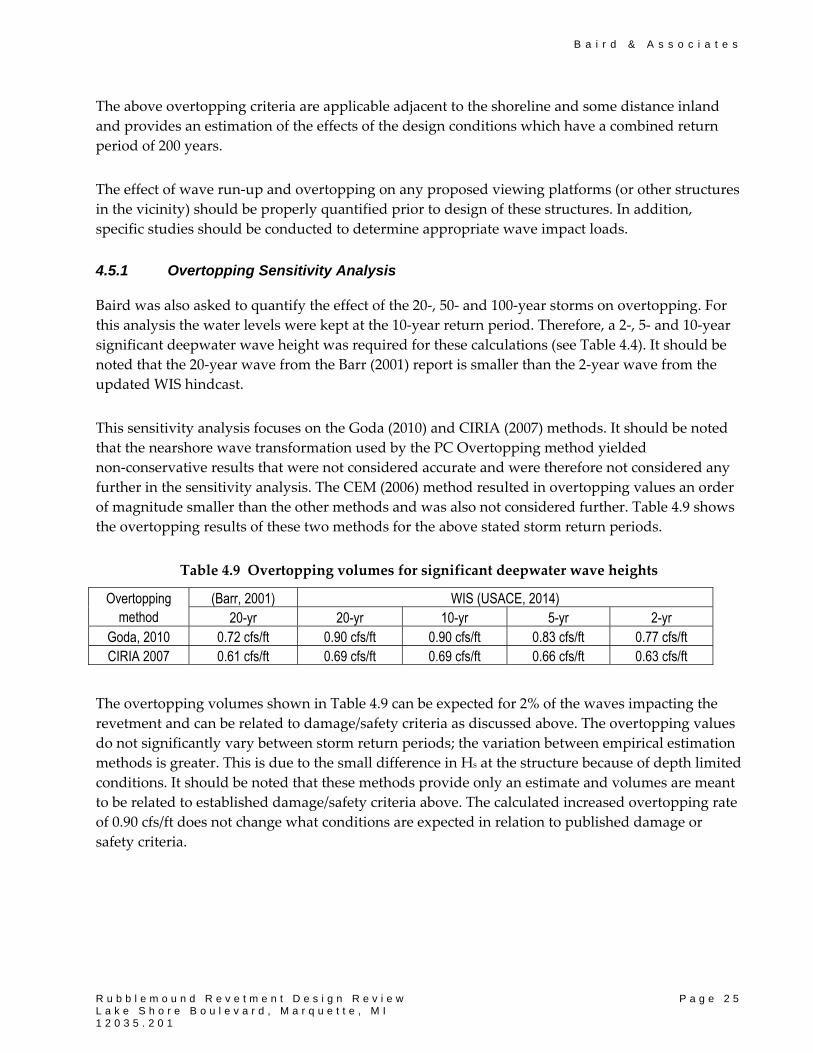
4.5.1 Overtopping Sensitivity Analysis
Baird was also asked to quantify the effect of the 20‐, 50‐ and 100‐year storms on overtopping. For
this analysis the water levels were kept at the 10‐year return period. Therefore, a 2‐, 5‐ and 10‐year
significant deepwater wave height was required for these calculations (see Table 4.4). It should be
noted that the 20‐year wave from the Barr (2001) report is smaller than the 2‐year wave from the
updated WIS hindcast.
This sensitivity analysis focuses on the Goda (2010) and CIRIA (2007) methods. It should be noted
that the nearshore wave transformation used by the PC Overtopping method yielded
non‐conservative results that were not considered accurate and were therefore not considered any
further in the sensitivity analysis. The CEM (2006) method resulted in overtopping values an order
of magnitude smaller than the other methods and was also not considered further. Table 4.9 shows
the overtopping results of these two methods for the above stated storm return periods.
Table 4.9 Overtopping volumes for significant deepwater wave heights
Overtopping method
(Barr, 2001) WIS (USACE, 2014) 20-yr 20-yr 10-yr 5-yr 2-yr
Goda, 2010 0.72 cfs/ft 0.90 cfs/ft 0.90 cfs/ft 0.83 cfs/ft 0.77 cfs/ft CIRIA 2007 0.61 cfs/ft 0.69 cfs/ft 0.69 cfs/ft 0.66 cfs/ft 0.63 cfs/ft
The overtopping volumes shown in Table 4.9 can be expected for 2% of the waves impacting the
revetment and can be related to damage/safety criteria as discussed above. The overtopping values
do not significantly vary between storm return periods; the variation between empirical estimation
methods is greater. This is due to the small difference in Hs at the structure because of depth limited
conditions. It should be noted that these methods provide only an estimate and volumes are meant
to be related to established damage/safety criteria above. The calculated increased overtopping rate
of 0.90 cfs/ft does not change what conditions are expected in relation to published damage or
safety criteria.
B a i r d & A s s o c i a t e s
R u b b l e m o u n d R e v e t m e n t D e s i g n R e v i e w P a g e 2 6 L a k e S h o r e B o u l e v a r d , M a r q u e t t e , M I 1 2 0 3 5 . 2 0 1
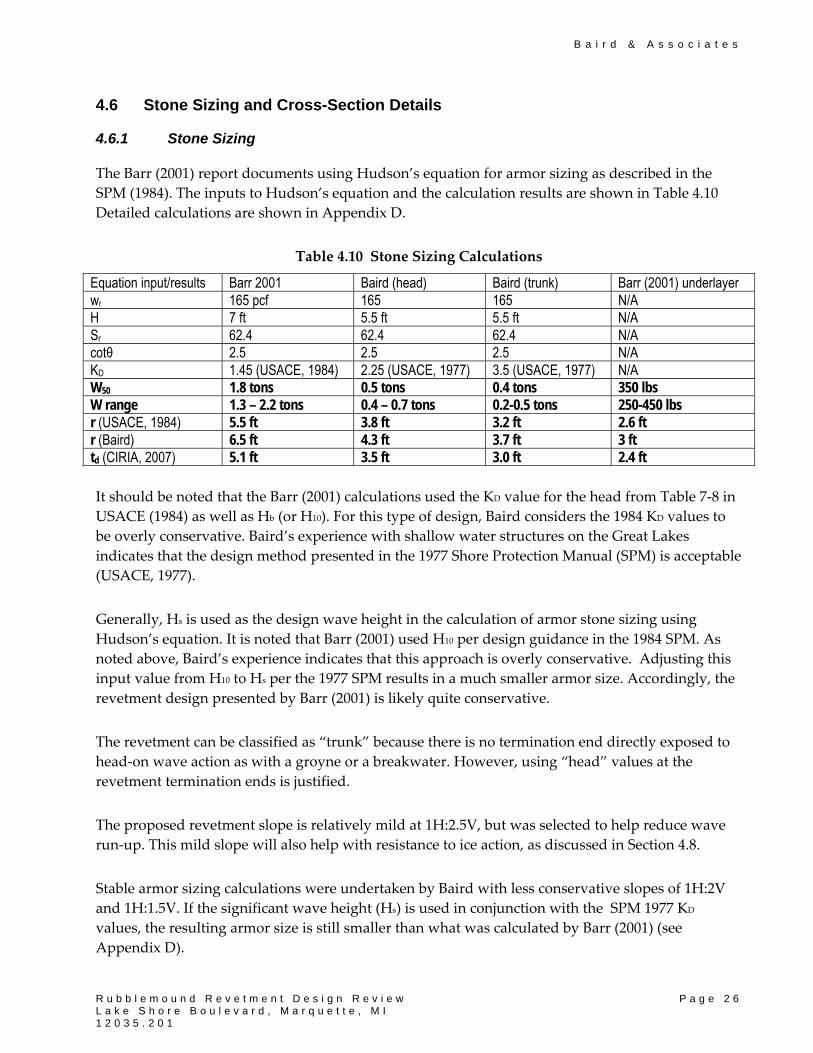
4.6 Stone Sizing and Cross-Section Details
4.6.1 Stone Sizing
The Barr (2001) report documents using Hudson’s equation for armor sizing as described in the
SPM (1984). The inputs to Hudson’s equation and the calculation results are shown in Table 4.10
Detailed calculations are shown in Appendix D.
Table 4.10 Stone Sizing Calculations
Equation input/results Barr 2001 Baird (head) Baird (trunk) Barr (2001) underlayer wr 165 pcf 165 165 N/A H 7 ft 5.5 ft 5.5 ft N/A Sr 62.4 62.4 62.4 N/A cotθ 2.5 2.5 2.5 N/A KD 1.45 (USACE, 1984) 2.25 (USACE, 1977) 3.5 (USACE, 1977) N/A W50 1.8 tons 0.5 tons 0.4 tons 350 lbs W range 1.3 – 2.2 tons 0.4 – 0.7 tons 0.2-0.5 tons 250-450 lbs r (USACE, 1984) 5.5 ft 3.8 ft 3.2 ft 2.6 ft r (Baird) 6.5 ft 4.3 ft 3.7 ft 3 ft td (CIRIA, 2007) 5.1 ft 3.5 ft 3.0 ft 2.4 ft
It should be noted that the Barr (2001) calculations used the KD value for the head from Table 7‐8 in
USACE (1984) as well as Hb (or H10). For this type of design, Baird considers the 1984 KD values to
be overly conservative. Baird’s experience with shallow water structures on the Great Lakes
indicates that the design method presented in the 1977 Shore Protection Manual (SPM) is acceptable
(USACE, 1977).
Generally, Hs is used as the design wave height in the calculation of armor stone sizing using
Hudson’s equation. It is noted that Barr (2001) used H10 per design guidance in the 1984 SPM. As
noted above, Baird’s experience indicates that this approach is overly conservative. Adjusting this
input value from H10 to Hs per the 1977 SPM results in a much smaller armor size. Accordingly, the
revetment design presented by Barr (2001) is likely quite conservative.
The revetment can be classified as “trunk” because there is no termination end directly exposed to
head‐on wave action as with a groyne or a breakwater. However, using “head” values at the
revetment termination ends is justified.
The proposed revetment slope is relatively mild at 1H:2.5V, but was selected to help reduce wave
run‐up. This mild slope will also help with resistance to ice action, as discussed in Section 4.8.
Stable armor sizing calculations were undertaken by Baird with less conservative slopes of 1H:2V
and 1H:1.5V. If the significant wave height (Hs) is used in conjunction with the SPM 1977 KD
values, the resulting armor size is still smaller than what was calculated by Barr (2001) (see
Appendix D).
B a i r d & A s s o c i a t e s
R u b b l e m o u n d R e v e t m e n t D e s i g n R e v i e w P a g e 2 7 L a k e S h o r e B o u l e v a r d , M a r q u e t t e , M I 1 2 0 3 5 . 2 0 1
The Barr (2001) report identified the north to central part of the revetment as being more exposed
based on bathymetric data. Therefore, there may be construction cost savings in differential armor
stone design by reducing or matching armor stone gradations. However, this would require further
engineering, and the construction cost savings may not significantly outweigh engineering costs.
The size of stone for the filter layer is appropriate in relation to the armor layer based on guidance
found in CIRIA (2007) and USACE (1977, 1984).
4.6.2 Layer Thickness
Two layers of armor stone is typically specified for a conventional revetment shore protection
structure. Barr (2001) calculated the armor layer thickness (r) by means of Table 7‐12 (USACE,
1984), whereas the SPM 1977 r values are calculated with equation 7‐120. Baird generally uses
2xD50, which is similar to the r calculated from the SPM 1977. The layer thickness (td) was also
calculated based on CIRIA (2007), as presented in Table 4.7 (equations can be found in Appendix
D).
There is a difference of between 0.5‐1 ft between the value of ‘r’ calculated from SPM (1977) and
SPM (1984). However, the Barr (2001) calculated layer thickness is conservative compared to the
CIRIA (2007) criteria, which is considered state of the art in the use of rock in hydraulic
engineering. Ultimately, the in‐place armor layer thickness will depend on many factors, including
properties of the sourced armor stone (density, gradation and shape), placement technique and
construction tolerances.
The implications of the Barr (2001) design having a thicker theoretical armor layer thickness may be
reflected in the material quantification, construction bidding, and construction review. However,
this will not affect the structural integrity of the revetment cross‐section. Depending on the
Contractor’s methodology and materials source, larger (i.e. heavier) armor stone is often more
difficult to produce, transport, and place properly.
The calculated layer thickness for the underlayer appears to be acceptable. However, the stone size
could be noted on the drawings in order to provide clarity.
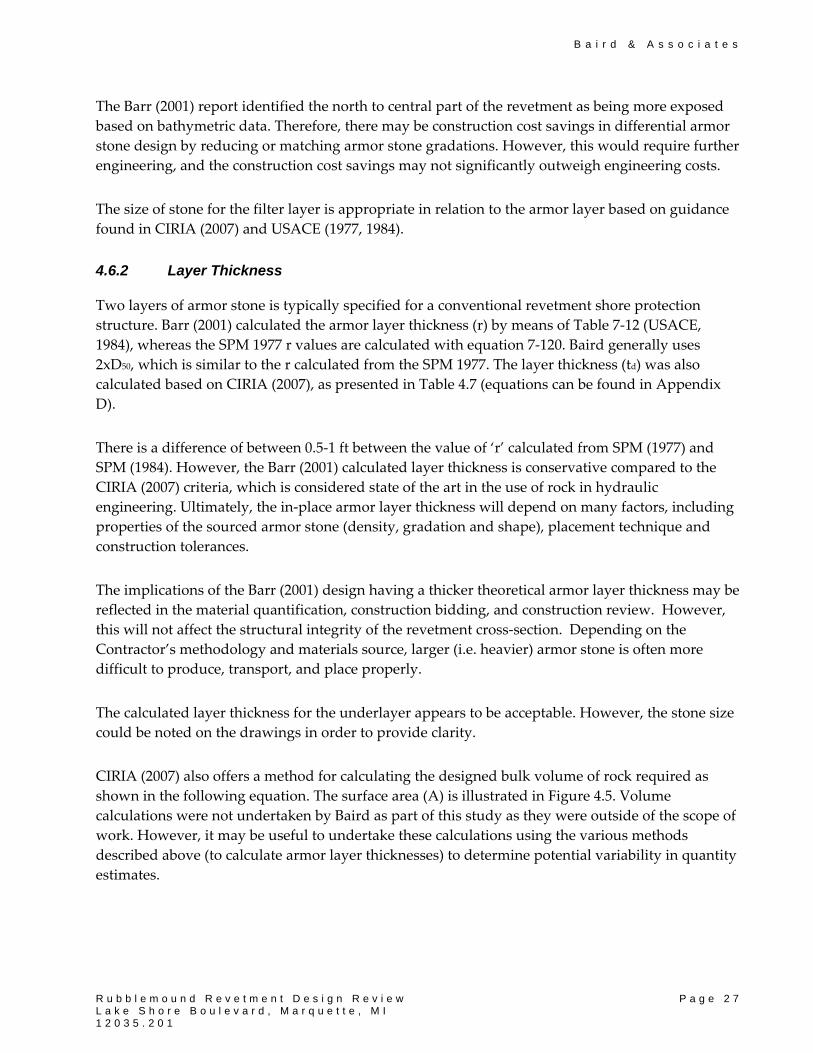
CIRIA (2007) also offers a method for calculating the designed bulk volume of rock required as
shown in the following equation. The surface area (A) is illustrated in Figure 4.5. Volume
calculations were not undertaken by Baird as part of this study as they were outside of the scope of
work. However, it may be useful to undertake these calculations using the various methods
described above (to calculate armor layer thicknesses) to determine potential variability in quantity
estimates.
B a i r d & A s s o c i a t e s
R u b b l e m o u n d R e v e t m e n t D e s i g n R e v i e w P a g e 2 8 L a k e S h o r e B o u l e v a r d , M a r q u e t t e , M I 1 2 0 3 5 . 2 0 1
,
Figure 4.5 Armor layer geometry (Figure 3.25, CIRIA 2007)
Quality Assurance/Quality Control of armor stone production and placement is extremely
important to the success of any rubblemound coastal structure project. QA/QC procedures should
be well defined in construction specifications, and it is highly recommended that experienced
professionals be involved in onsite administration and review throughout the construction process.
4.6.3 Revetment Toe
The width of a toe apron depends on the level of scour expected at a coastal structure. This is
generally dependent on the magnitude of wave and current forcing, structure alignment and
exposure, and bearing surface characteristics (erodibility).
The Barr (2001) toe design consists of an excavated trench in which the toe stone (as well as stone
underlayer and geotextile bedding) are placed below existing grade. This type of toe arrangement
corresponds to a configuration intended to resist “severe scour potential,” per CIRIA (2007). This
type of toe protection is both ‘flexible’ and able to resist migration of finer material through the toe
due to the presence of the geotextile.
No information is available with regards to the subsurface conditions at the revetment toe. The
existing revetment should be surveyed for any signs of scour. This could increase the size of the toe
protection required.
B a i r d & A s s o c i a t e s
R u b b l e m o u n d R e v e t m e n t D e s i g n R e v i e w P a g e 2 9 L a k e S h o r e B o u l e v a r d , M a r q u e t t e , M I 1 2 0 3 5 . 2 0 1
The toe apron appears to be approximately five armor stones wide (14 ft) placed on top of filter and
then backfilled with sand. The total depth of the toe scour apron is not shown on the typical
cross‐section. However, the depth is a minimum of 7.6 ft below grade, which is in excess of the
design wave height (H10=7 ft used in Barr, 2001) which corresponds to a “rule of thumb” for
maximum scour depth at the toe of a structure. The toe width (5 x D50) is also in excess of the
recommended minimum of 3 x D50 found in most published criteria.
Considering the geometric configuration and size of stone, the Barr (2001) toe apron design appears
to be conservative, despite the unknown lakebed characteristics at the toe of the structure.
4.6.4 Geotextile
Although a review of the construction specifications is beyond the scope of work, Baird
cross‐referenced the proposed geotextile specifications with past project experience and found them
to be insufficient. The specification standards for geotextiles used in marine applications have
changed in recent years to reflect knowledge gained from updated manufacturing processes and
materials implementation experience. The following points should be considered when specifying
the geotextile:
The fiber should be polypropylene, not polyester (the latter can lose strength in water).
UV resistance is typically 70%, not 50%.
Seams may be sewn but 1‐2 ft minimum overlap is more typical and seams should not be
tied.
Cushioning material is not generally required
Regarding installation of the geotextile, it is important that geotextile specifications state the
following:
The geotextile shall not extend to the outer edge of the apron and should stop
approximately 3 feet from the edge to prevent undermining of the toe.
The geotextile should be shown to terminate by hooking into the armor stone layer.
A tie‐in detail for the shore edge should also be included.
4.7 Alignment considerations
The alignment of the proposed revetment reconstruction generally matches that of the existing
revetment. The revetment extends from a beach south of Wright Street to Hawley Street. The
proposed revetment alignment consists of a series of straight segments to reconstruct the existing
revetment rather than one single, smooth curve. While the segmented approach may be favorable
from a construction standpoint, each transition between reaches will require special attention to
stone placement.
B a i r d & A s s o c i a t e s
R u b b l e m o u n d R e v e t m e n t D e s i g n R e v i e w P a g e 3 0 L a k e S h o r e B o u l e v a r d , M a r q u e t t e , M I 1 2 0 3 5 . 2 0 1
The existing stone revetment appears to be reduced in elevation and width north of the “Drive to
Bio‐Resources.” Baird notes that the north termination point of the revetment is located quite close
the proposed roadway alignment. The proximity of the roadway, combined with the lack of
existing shore protection and the potential of wave focusing at this location may offer little, if any,
improvement over the existing conditions during storm events. Extending the revetment north may
improve conditions, though would require additional engineering and design detail at the mouth of
the existing stormwater outfall adjacent to Hawley Avenue. It is also noted that the bike path is
located approximately 40 feet west of the revetment in this reach, and could be subject to flooding
from overtopping of the revetment during large storm events (depending on drainage details).
4.8 Ice Considerations
Ice can damage a revetment in a number of ways, including:
Thermal expansion of an ice sheet, potentially causing heave and displacement of armor
stones placed on an exposed slope.
Large moving ice sheets make contact with exposed structure slopes and ‘pushing’ (a few
stones), or ‘bulldozing’ (large scale damage) armor stones, causing either localized or
regional damage.
Ice can adhere to and ‘pluck’ individual units from an armor slope. This can happen during
periods of rapid water level increase or decrease.
Ice may accumulate and ‘ride up’ a structure face, causing displacement not only to the
structure slope, but also the crest.
There is limited design guidance for shoreline protection design in the presence of ice. To mitigate
damage caused by ice, recommendations from CIRIA (2007), Ministry of Natural Resources (1996),
and Sodhi and Donnelly (1999) were consulted. The relevant recommendations are provided
below:
For ice about 2.5 ft thick, a standard heavy grading for rock of 0.3‐1.1 ton or greater should
be used (CIRIA, 2007).
Generally when there are significant water level changes and concerns over plucking out of
individual stones, the median nominal stone diameter should exceed the maximum ice
thickness (CIRIA, 2007).
The surface of the armor stone needs to be relatively smooth and the armor stone layer
should be well keyed.
In the St. Lawrence River, it was inferred that 0.7 ton stone on a 1:3 slope exposed to 2 ft ice
or 5 ft waves was too small and that 1.1 ton stone on a slope of 1:2 above the water line and
1:4 or flatter below the waterline was preferred (MNR, 1996).
B a i r d & A s s o c i a t e s
R u b b l e m o u n d R e v e t m e n t D e s i g n R e v i e w P a g e 3 1 L a k e S h o r e B o u l e v a r d , M a r q u e t t e , M I 1 2 0 3 5 . 2 0 1
Rip rap failure takes place when ice thickness is equal to or thicker than the median stone
size. Accepting some (15%) probability of rip rap failure, median stone size needs to be 2‐3
times the ice thickness to protect a bank from ice (Sodhi and Donnelly, 1999).
There is evidence that ice has plucked stones from the current revetment. However, no site‐specific
information is available on the seasonal thickness of the ice or incidental ice damage events. Some
ice thickness measurements are available from the NOAA Great Lakes Environmental Research
Laboratory (GLERL, 2014) between December 1967 and March 1969 in the Lower Harbor (Figure
4.6). It should be noted that the ice thickness is located in a less exposed area and is not specific to
the site of the proposed revetment. Other data constraints include the relatively short period of
record and that the data set may not reflect the full winter severity range. The data is presented to
provide an approximate ice thickness at the site. However, ice thickness varies spatially and
seasonally. Over the measurement period, measured ice thickness reached a maximum of 14 inches.
Figure 4.6 Ice thickness measurements
Based on the above recommendations, the Barr (2001) armor layer as designed should provide
resistance to ice thicknesses of approximately 2 ft as W is 1.5 ton and is larger than what was found
to be stable by MNR (1996) since the design wave conditions are relatively similar. The slope of the
Lake Shore Boulevard revetment is steeper below the waterline but flatter above the waterline.
B a i r d & A s s o c i a t e s
R u b b l e m o u n d R e v e t m e n t D e s i g n R e v i e w P a g e 3 2 L a k e S h o r e B o u l e v a r d , M a r q u e t t e , M I 1 2 0 3 5 . 2 0 1
Placement of the armor stone to provide the least amount of roughness will improve the stability of
the armor stone against ice forces. Special attention to armor stone placement during construction
should be undertaken as well placed armor units have better contact with adjacent stones, reduced
void spacing, and a higher level of interlock.
B a i r d & A s s o c i a t e s
R u b b l e m o u n d R e v e t m e n t D e s i g n R e v i e w P a g e 3 3 L a k e S h o r e B o u l e v a r d , M a r q u e t t e , M I 1 2 0 3 5 . 2 0 1
5.0 SUMMARY AND CONCLUSIONS
5.1 Design Conditions
5.1.1 Basis of Design
The basis of design is not explicitly described in the Barr (2001) report. However, the combined 20‐
year wave and 10‐year water levels (which produces a nominal 200‐year return period event) were
used for design calculations. It should be noted that although the 20‐10 (or 10‐20) combined waves
and water levels are the USACE standard design practice for coastal structures on the Great Lakes,
other combinations of wave and water level resulting in the same return period were not discussed
by Barr (2001).
Background information on the determination of the design conditions is provided. Because the site
is depth limited, the significant wave height at the structure will not significantly change. The
variance in water levels does not increase significantly with increasing return period.
5.1.2 Water Levels
The 10‐year water level was selected for design (Barr, 2001). Water levels for various return periods
are shown in the Baird (2013) and Barr (2001) reports and both originate from the same source.
However, the Baird 10‐year water level is reported to be 0.1 ft higher than in the Barr report. The
difference is not significant and could either be attributed to rounding error or an updated version
of the source data.
Two datums were used in the Barr (2001) report. The NAV 29 datum is listed on the drawings
while the IGLD 85 datum is used in the water level analysis. The conversion needs to be
interpolated from nearby sites where it has already been calculated. However, taking the most
conservative conversion gives a difference of zero.
A full bathymetric survey prior to construction to confirm the elevation of the lakebed at the toe of
the proposed revetment is important because the design wave height is depth limited. Therefore,
the water depth at the toe of the revetment controls the height of the design wave.
5.1.3 Waves
The waves at the structure are depth limited. Therefore, there will be no significant change in the
size of the significant design wave height at the structure if the wave return period is increased. The
20‐year wave was used for design and originated from the WIS database. However, the WIS
database has since been updated along with extreme event return periods. The 20‐year wave is now
18.7 ft. However, when transformed into shore, Hs is not significant due to the depth limited
conditions.
B a i r d & A s s o c i a t e s
R u b b l e m o u n d R e v e t m e n t D e s i g n R e v i e w P a g e 3 4 L a k e S h o r e B o u l e v a r d , M a r q u e t t e , M I 1 2 0 3 5 . 2 0 1
5.1.4 Existing Conditions
No information regarding the properties of the nearshore sediment or the thickness of the sediment
layer. Jet probes are recommended to determine the type and thickness of the sediment layer.
5.2 Design Calculations
5.2.1 Wave Run-up
Wave run‐up calculations were reviewed. An interpolation error was noted and the revised run‐up
level at the most exposed location on the revetment may increase by approximately 0.5 ft. However,
the revetment is designed to accommodate some overtopping and this increase is not anticipated to
be significant.
The Barr (2001) design specifies a 12 ft wide crest width which is equivalent to 4 armor stones
rather than the 3 recommended in USACE (1984). This should add conservatism to the design by
helping to reduce overtopping of the revetment.
5.2.2 Overtopping
No overtopping calculations are presented in the Barr (2001) report. Baird used several empirical
methods to estimate the amount of overtopping to be expected during a design event and to
correlate with published damage and safety thresholds. The results show that the design event
could result in overtopping rates in the range of 0.05 and 0.75 ft3/s/ft. The upper end of the
overtopping rate is close to published criteria for the initiation of damage for the type of stone
revetment being reviewed. Monitoring of the revetment front slope, crest and areas immediately
landside of the revetment should be performed following large storm events. Some maintenance
may be required after severe events. All nearby (exposed) promenades and pathways should be
paved. Signage should be erected notifying the public that the area is unsafe during severe events.
In addition, any planned viewing platforms near or overlooking the revetment may be subject to
wave loading. Further investigations would be required to determine the uplift and horizontal
wave loading on these features for design purposes.
5.2.3 Armor Stone Sizing
The armor stone size was calculated (Barr, 2001) using Hudson’s equation and coefficient values
from USACE (1984) as well as a breaking wave height (Hb) equivalent to H10. Baird reviewed the
calculations and provided the following observations:
The revised KD values defined in USACE (1984) are considered by Baird to be overly
conservative. Baird recommends using the KD values found in USACE (1977).
B a i r d & A s s o c i a t e s
R u b b l e m o u n d R e v e t m e n t D e s i g n R e v i e w P a g e 3 5 L a k e S h o r e B o u l e v a r d , M a r q u e t t e , M I 1 2 0 3 5 . 2 0 1
The Barr (2001) calculations used Hb = H10 = 7.0 ft (USACE 1984), while USACE (1977) calls
the use of Hs = 5.5 ft. The H and KD values used in the Barr (2001) design are both
conservative and may result in an overly conservative cross‐section design.
The magnitude of the design wave varies over the length of the revetment. Therefore, there
may be opportunities for construction cost savings through the application of smaller or
more economically available stone over the length of the structure. This would require
further engineering and the construction savings may not significantly outweigh
engineering costs.
The armor layer thickness was verified with USACE (1977, 1984) as well as with CIRIA
(2007) criteria and was found to be conservative. This could possibly lead to over‐estimation
in quantity calculations, possibly leading to higher bids during the tender process. CIRIA
(2007) provides a state of the art method for calculating the designed bulk volume of rock
for the armor layer.
The range of armor stone weight and the corresponding filter stone weight proposed by
Barr (2001) were found to be appropriate.
The dimensions of the revetment toe were found to be adequate based on published criteria and
Baird’s past experience. Some concerns over the specification of geotextile properties were raised
and should be addressed prior to project tendering.
5.2.4 Alignment Considerations
The proposed revetment alignment consists of a series of straight segments to reconstruct the
existing revetment rather than one single, smooth curve. Straight segments may be beneficial for
construction and the transition between segments should not be of concern with regards to stone
placement if they are not abrupt.
The north end of the revetment is located quite close to the road. The lack of adjacent shore
protection may offer little if any improvement over the existing conditions during storm events at
this location.
It should also be noted that the bike path is located approximately 40 feet west of the revetment in
the reach, and could be subject to flooding from overtopping of the revetment during large storm
events. Proper design of drainage systems will be required over the length of the project.
5.2.5 Ice considerations
There is no site‐specific ice data available. However, a small amount of historical measurements are
presented for the lower harbor. Published criteria applicable to the design of stone revetments were
examined in the context of the Barr (2001) revetment design. Due to the structure’s mild slope and
conservative armor size, the design appears to be adequate to resist ice loading. The armor stone
B a i r d & A s s o c i a t e s
R u b b l e m o u n d R e v e t m e n t D e s i g n R e v i e w P a g e 3 6 L a k e S h o r e B o u l e v a r d , M a r q u e t t e , M I 1 2 0 3 5 . 2 0 1
should be placed in such a way to produce a relatively smooth slope surface in order to maximize
unit interlock and minimize armor unit plucking from ice.
5.2.6 Construction Drawings
Several areas for additional detail were noted on the current drawings, including:
Revetment and swale termination details;
Revetment landside detail including dune/swale interface and overlooks;
Specifying the stone size for both the under layers and primary armor layers;
Details of the pipe, detention basin, and outfall; and
Demolition details or specifications along with the staging for construction.
In addition, stone production and placement specifications should be developed including suitable
QA/QC measures.
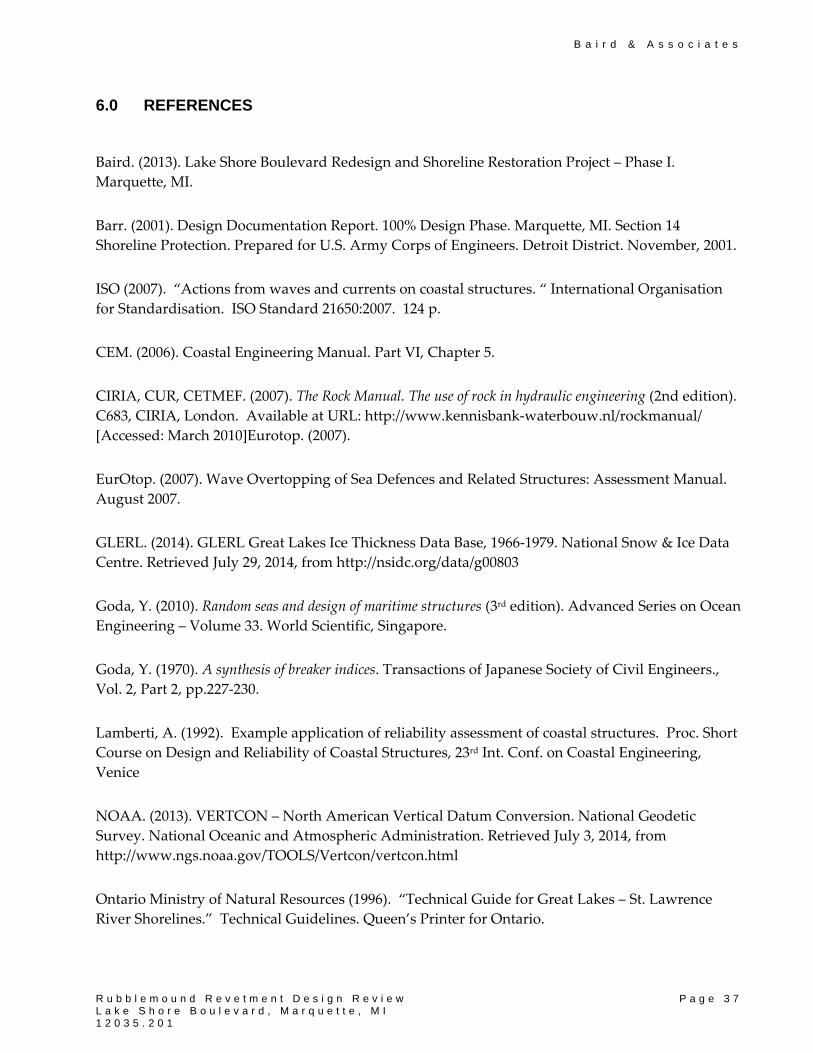
B a i r d & A s s o c i a t e s
R u b b l e m o u n d R e v e t m e n t D e s i g n R e v i e w P a g e 3 7 L a k e S h o r e B o u l e v a r d , M a r q u e t t e , M I 1 2 0 3 5 . 2 0 1
6.0 REFERENCES
Baird. (2013). Lake Shore Boulevard Redesign and Shoreline Restoration Project – Phase I.
Marquette, MI.
Barr. (2001). Design Documentation Report. 100% Design Phase. Marquette, MI. Section 14
Shoreline Protection. Prepared for U.S. Army Corps of Engineers. Detroit District. November, 2001.
ISO (2007). “Actions from waves and currents on coastal structures. “ International Organisation
for Standardisation. ISO Standard 21650:2007. 124 p.
CEM. (2006). Coastal Engineering Manual. Part VI, Chapter 5.
CIRIA, CUR, CETMEF. (2007). The Rock Manual. The use of rock in hydraulic engineering (2nd edition).
C683, CIRIA, London. Available at URL: http://www.kennisbank‐waterbouw.nl/rockmanual/
[Accessed: March 2010]Eurotop. (2007).
EurOtop. (2007). Wave Overtopping of Sea Defences and Related Structures: Assessment Manual.
August 2007.
GLERL. (2014). GLERL Great Lakes Ice Thickness Data Base, 1966‐1979. National Snow & Ice Data
Centre. Retrieved July 29, 2014, from http://nsidc.org/data/g00803
Goda, Y. (2010). Random seas and design of maritime structures (3rd edition). Advanced Series on Ocean
Engineering – Volume 33. World Scientific, Singapore.
Goda, Y. (1970). A synthesis of breaker indices. Transactions of Japanese Society of Civil Engineers.,
Vol. 2, Part 2, pp.227‐230.
Lamberti, A. (1992). Example application of reliability assessment of coastal structures. Proc. Short
Course on Design and Reliability of Coastal Structures, 23rd Int. Conf. on Coastal Engineering,
Venice
NOAA. (2013). VERTCON – North American Vertical Datum Conversion. National Geodetic
Survey. National Oceanic and Atmospheric Administration. Retrieved July 3, 2014, from
http://www.ngs.noaa.gov/TOOLS/Vertcon/vertcon.html
Ontario Ministry of Natural Resources (1996). “Technical Guide for Great Lakes – St. Lawrence
River Shorelines.” Technical Guidelines. Queen’s Printer for Ontario.
B a i r d & A s s o c i a t e s
R u b b l e m o u n d R e v e t m e n t D e s i g n R e v i e w P a g e 3 8 L a k e S h o r e B o u l e v a r d , M a r q u e t t e , M I 1 2 0 3 5 . 2 0 1
PIANC. (2003). Breakwaters with Vertical and Inclined Concrete Walls. Report of Working Group 28 of
the Maritime Navigation Commission.
ROM, (2002). ROM 0.2‐90 General procedure and requirements in the design of harbor and maritime
structures. Spanish Ministry of Public Works and Urban Development.
Sodhi, D. S., & Donnelly, C. J. (1999). Ice effects on riprap: Model tests. In PROC INT CONF COLD
REG ENG, (pp. 824‐837).
USACE. (1977). “Shore Protection Manual.” Volume II. Department of the Army Corps of
Engineers.
USACE. (1984). “Shore Protection Manual.” Volume II. Department of the Army Corps of
Engineers.
USACE. (2014). Wave Information Studies. Retrieved July 14, 2014, from:
http://wis.usace.army.mil/hindcasts.shtml?dmn=lakesWIS
B a i r d & A s s o c i a t e s
R u b b l e m o u n d R e v e t m e n t D e s i g n R e v i e w A p p e n d i x A L a k e S h o r e B o u l e v a r d , M a r q u e t t e , M I 1 2 0 3 5 . 2 0 1
APPENDIX A
Wave Shoaling Calculations
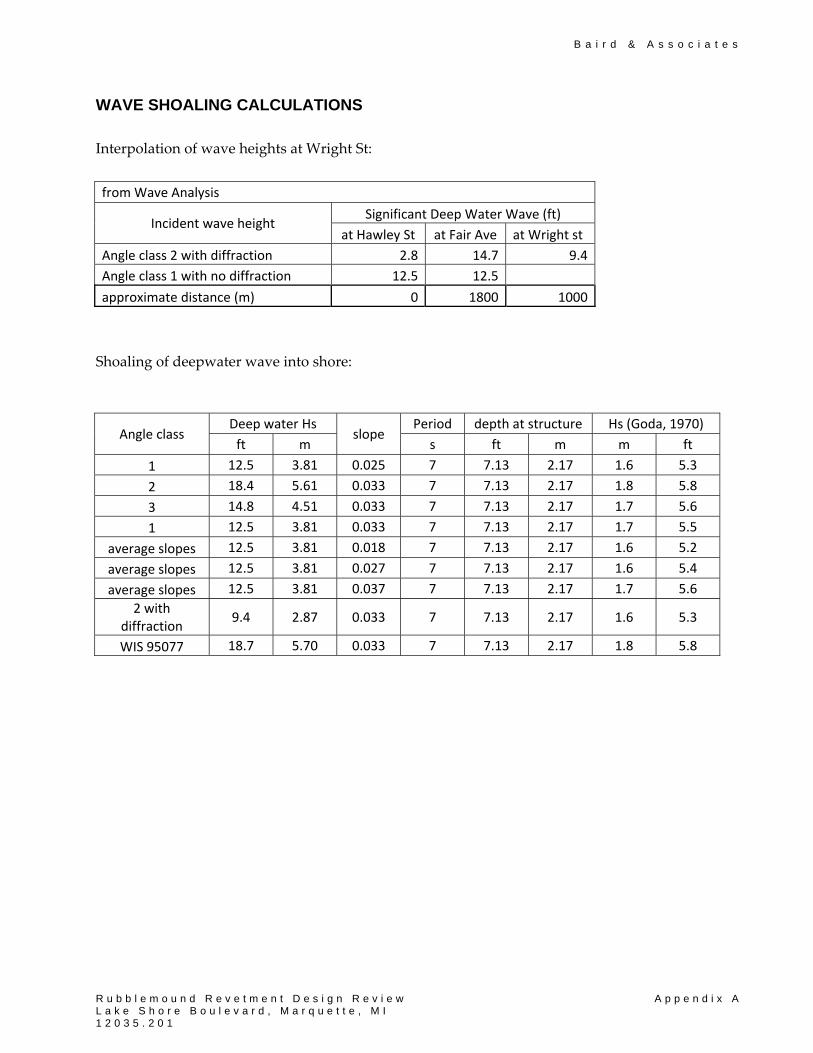
B a i r d & A s s o c i a t e s
R u b b l e m o u n d R e v e t m e n t D e s i g n R e v i e w A p p e n d i x A L a k e S h o r e B o u l e v a r d , M a r q u e t t e , M I 1 2 0 3 5 . 2 0 1
WAVE SHOALING CALCULATIONS
Interpolation of wave heights at Wright St:
from Wave Analysis
Incident wave height Significant Deep Water Wave (ft)
at Hawley St at Fair Ave at Wright st
Angle class 2 with diffraction 2.8 14.7 9.4
Angle class 1 with no diffraction 12.5 12.5
approximate distance (m) 0 1800 1000
Shoaling of deepwater wave into shore:
Angle class Deep water Hs
slope Period depth at structure Hs (Goda, 1970)
ft m s ft m m ft
1 12.5 3.81 0.025 7 7.13 2.17 1.6 5.3
2 18.4 5.61 0.033 7 7.13 2.17 1.8 5.8
3 14.8 4.51 0.033 7 7.13 2.17 1.7 5.6
1 12.5 3.81 0.033 7 7.13 2.17 1.7 5.5
average slopes 12.5 3.81 0.018 7 7.13 2.17 1.6 5.2
average slopes 12.5 3.81 0.027 7 7.13 2.17 1.6 5.4
average slopes 12.5 3.81 0.037 7 7.13 2.17 1.7 5.6
2 with diffraction
9.4 2.87 0.033 7 7.13 2.17 1.6 5.3
WIS 95077 18.7 5.70 0.033 7 7.13 2.17 1.8 5.8

B a i r d & A s s o c i a t e s
R u b b l e m o u n d R e v e t m e n t D e s i g n R e v i e w A p p e n d i x B L a k e S h o r e B o u l e v a r d , M a r q u e t t e , M I 1 2 0 3 5 . 2 0 1
APPENDIX B
Wave Run-up Calculations
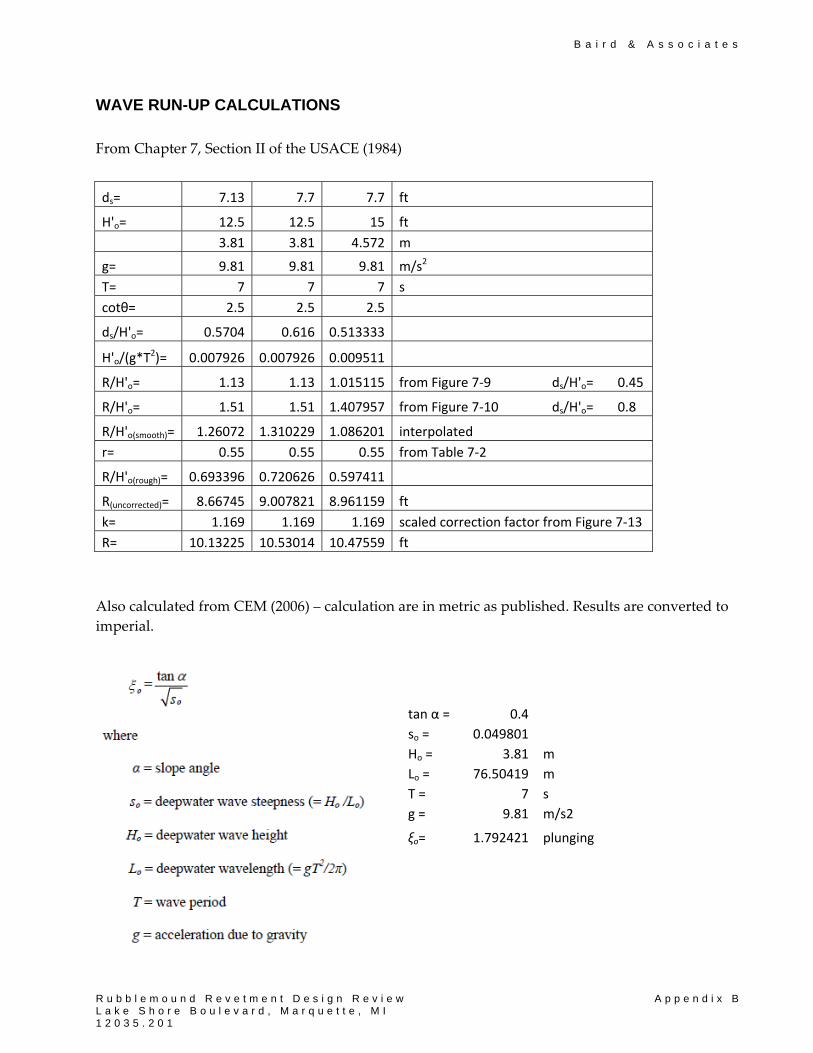
B a i r d & A s s o c i a t e s
R u b b l e m o u n d R e v e t m e n t D e s i g n R e v i e w A p p e n d i x B L a k e S h o r e B o u l e v a r d , M a r q u e t t e , M I 1 2 0 3 5 . 2 0 1
WAVE RUN-UP CALCULATIONS
From Chapter 7, Section II of the USACE (1984)
ds= 7.13 7.7 7.7 ft
H'o= 12.5 12.5 15 ft
3.81 3.81 4.572 m
g= 9.81 9.81 9.81 m/s2
T= 7 7 7 s
cotθ= 2.5 2.5 2.5
ds/H'o= 0.5704 0.616 0.513333
H'o/(g*T2)= 0.007926 0.007926 0.009511
R/H'o= 1.13 1.13 1.015115 from Figure 7‐9 ds/H'o= 0.45
R/H'o= 1.51 1.51 1.407957 from Figure 7‐10 ds/H'o= 0.8
R/H'o(smooth)= 1.26072 1.310229 1.086201 interpolated
r= 0.55 0.55 0.55 from Table 7‐2
R/H'o(rough)= 0.693396 0.720626 0.597411
R(uncorrected)= 8.66745 9.007821 8.961159 ft
k= 1.169 1.169 1.169 scaled correction factor from Figure 7‐13
R= 10.13225 10.53014 10.47559 ft
Also calculated from CEM (2006) – calculation are in metric as published. Results are converted to
imperial.
tan α = 0.4
so = 0.049801
Ho = 3.81 m
Lo = 76.50419 m
T = 7 s
g = 9.81 m/s2
ξo= 1.792421 plunging
B a i r d & A s s o c i a t e s
R u b b l e m o u n d R e v e t m e n t D e s i g n R e v i e w A p p e n d i x B L a k e S h o r e B o u l e v a r d , M a r q u e t t e , M I 1 2 0 3 5 . 2 0 1
Ahrens (1981) for slopes between 1:1 and 1:4 for ξop > 1.2
Ru2%
A = 1.6
C = 0
σRu/Ru = 0.15
B a i r d & A s s o c i a t e s
R u b b l e m o u n d R e v e t m e n t D e s i g n R e v i e w A p p e n d i x B L a k e S h o r e B o u l e v a r d , M a r q u e t t e , M I 1 2 0 3 5 . 2 0 1
Rus
A = 1.35
C = 0
σRu/Ru = 0.1
Hs/D= 1.98
ϒr= 0.55
Ru2%= 2.6 m
Ru2%= 8.7 ft with σRu= 10.0 ft
Rus= 2.2 m
Rus= 7.3 ft
B a i r d & A s s o c i a t e s
R u b b l e m o u n d R e v e t m e n t D e s i g n R e v i e w A p p e n d i x C L a k e S h o r e B o u l e v a r d , M a r q u e t t e , M I 1 2 0 3 5 . 2 0 1
APPENDIX C
Overtopping Calculations
B a i r d & A s s o c i a t e s
R u b b l e m o u n d R e v e t m e n t D e s i g n R e v i e w A p p e n d i x C L a k e S h o r e B o u l e v a r d , M a r q u e t t e , M I 1 2 0 3 5 . 2 0 1
OVERTOPPING CALCULATIONS
Several methods were used.
Goda (2010)
∗ exp
tanh 0.956 4.44 ⁄ 1.242 2.032 .
tanh 0.822 2.22 ⁄ 0.578 2.22
3.4 0.734 cot 0.239 cot 0.0162 cot 2.3 0.5 cot 0.15 cot 0.011 cot
Barr (2001) WIS station 95077 (USACE, 2014)
20yr 20yr 20yr 10yr 5yr 2yr
g= 9.81 9.81 9.81 9.81 9.81 9.81 m/s2
H1/3= 5.5 5.5 5.8 5.8 5.7 5.6 ft
1.68 1.68 1.77 1.77 1.74 1.71 m
h= 7.13 7.13 7.13 7.13 7.13 7.13 ft
2.17 2.17 2.17 2.17 2.17 2.17 m
cot αs= 2.5 2.5 2.5 2.5 2.5 2.5
s= 0.05 0.02 0.05 0.05 0.05 0.05
hc= 6.37 6.37 6.37 6.37 6.37 6.37 ft
1.94 1.94 1.94 1.94 1.94 1.94 m
A0= 2.81 2.81 2.81 2.81 2.81 2.81
B0= 1.82 1.82 1.82 1.82 1.82 1.82
A= 2.67 2.67 2.65 2.65 2.66 2.67
B= 1.69 1.67 1.67 1.67 1.67 1.68
q*= 0.0098 0.0100 0.0113 0.0113 0.0108 0.0103
q= 0.0667 0.0680 0.0832 0.0832 0.0774 0.0719 m3/s/m
67 68 83 83 77 72 L/s/m
0.72 0.73 0.90 0.90 0.83 0.77 cfs/ft
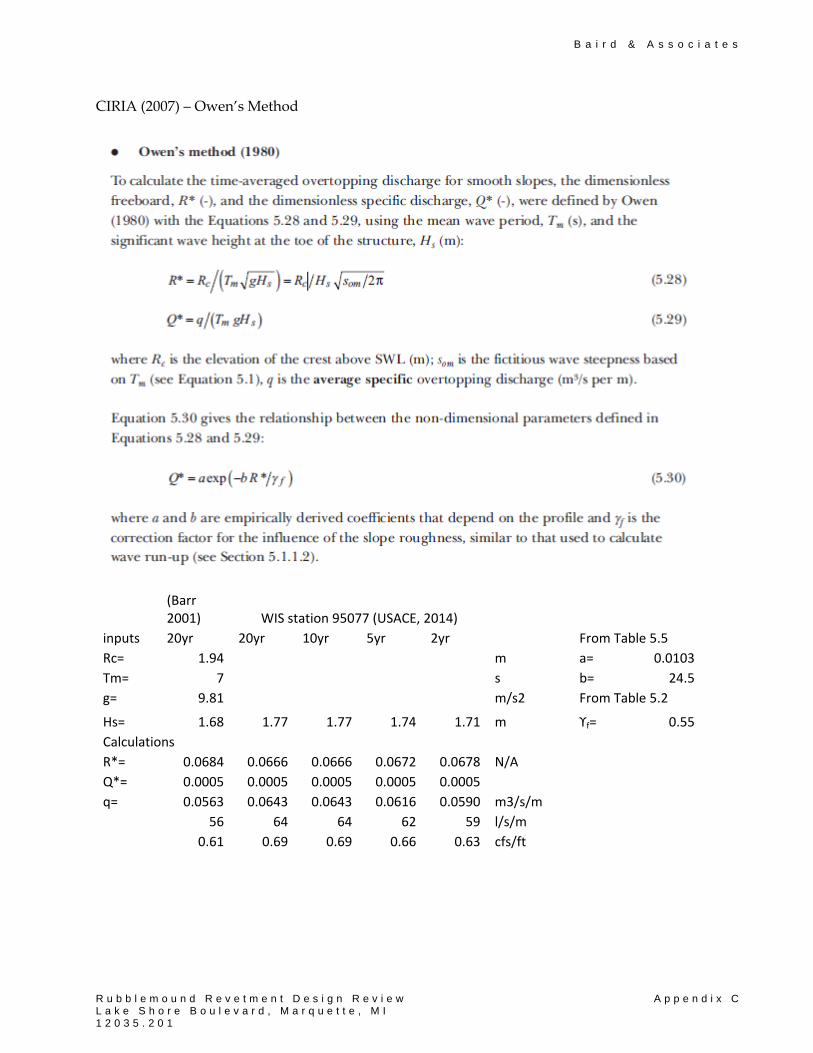
B a i r d & A s s o c i a t e s
R u b b l e m o u n d R e v e t m e n t D e s i g n R e v i e w A p p e n d i x C L a k e S h o r e B o u l e v a r d , M a r q u e t t e , M I 1 2 0 3 5 . 2 0 1
CIRIA (2007) – Owen’s Method
(Barr 2001) WIS station 95077 (USACE, 2014)
inputs 20yr 20yr 10yr 5yr 2yr From Table 5.5
Rc= 1.94 m a= 0.0103
Tm= 7 s b= 24.5
g= 9.81 m/s2 From Table 5.2
Hs= 1.68 1.77 1.77 1.74 1.71 m ϒf= 0.55
Calculations
R*= 0.0684 0.0666 0.0666 0.0672 0.0678 N/A
Q*= 0.0005 0.0005 0.0005 0.0005 0.0005
q= 0.0563 0.0643 0.0643 0.0616 0.0590 m3/s/m
56 64 64 62 59 l/s/m
0.61 0.69 0.69 0.66 0.63 cfs/ft
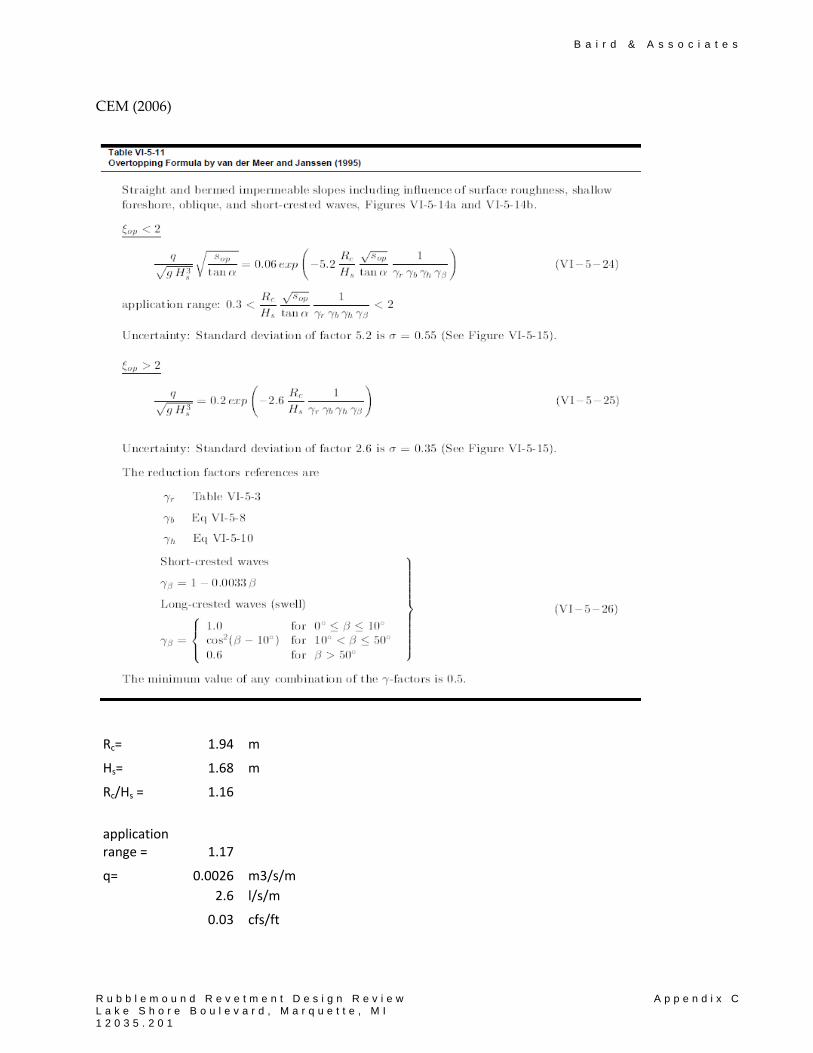
B a i r d & A s s o c i a t e s
R u b b l e m o u n d R e v e t m e n t D e s i g n R e v i e w A p p e n d i x C L a k e S h o r e B o u l e v a r d , M a r q u e t t e , M I 1 2 0 3 5 . 2 0 1
CEM (2006)
Rc= 1.94 m
Hs= 1.68 m
Rc/Hs = 1.16
application range = 1.17
q= 0.0026 m3/s/m
2.6 l/s/m
0.03 cfs/ft
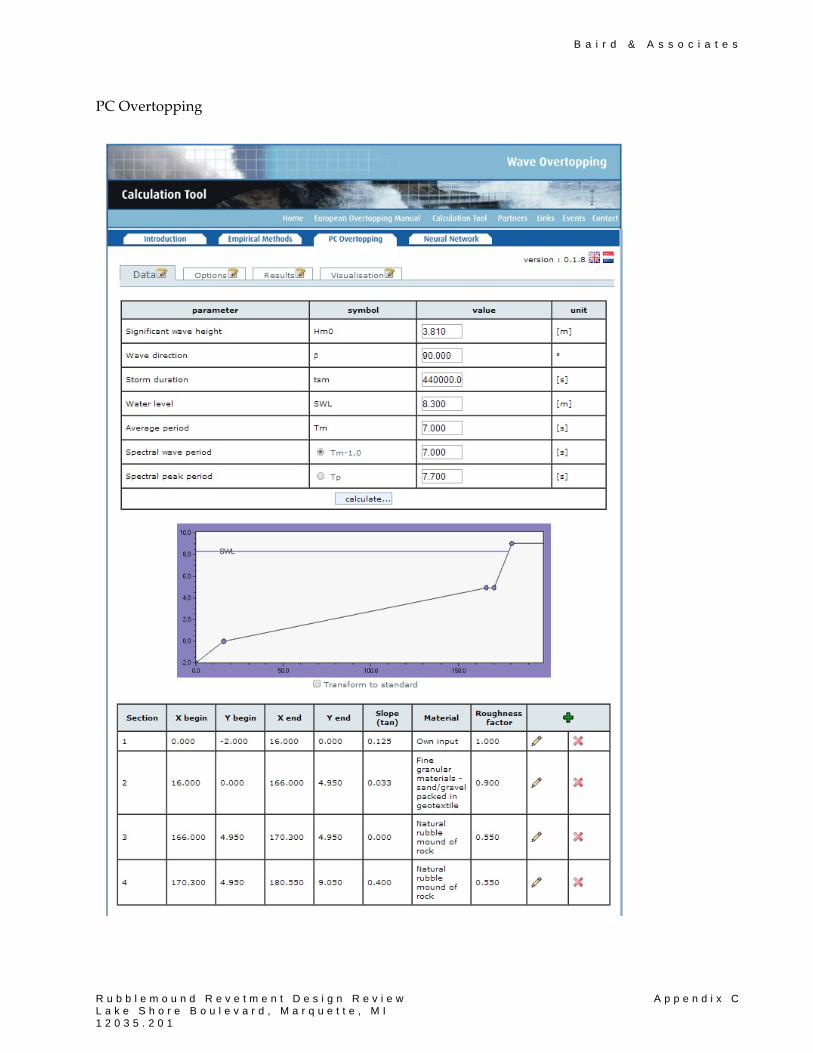
B a i r d & A s s o c i a t e s
R u b b l e m o u n d R e v e t m e n t D e s i g n R e v i e w A p p e n d i x C L a k e S h o r e B o u l e v a r d , M a r q u e t t e , M I 1 2 0 3 5 . 2 0 1
PC Overtopping
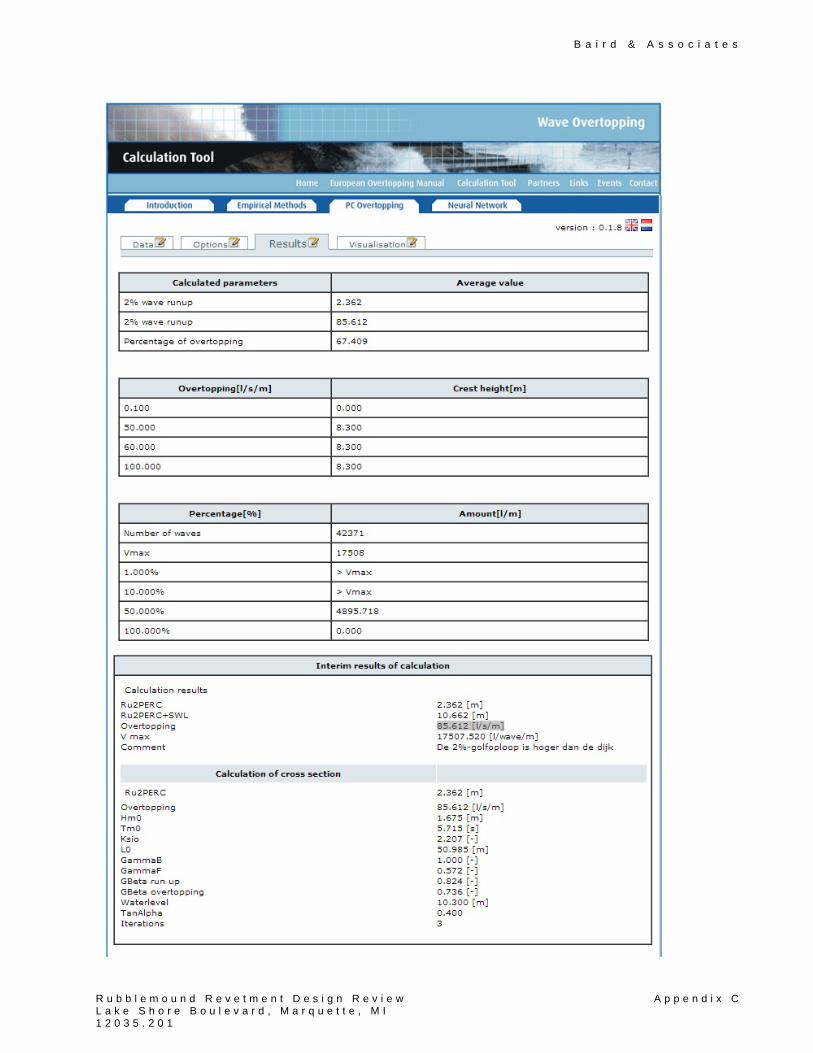
B a i r d & A s s o c i a t e s
R u b b l e m o u n d R e v e t m e n t D e s i g n R e v i e w A p p e n d i x C L a k e S h o r e B o u l e v a r d , M a r q u e t t e , M I 1 2 0 3 5 . 2 0 1
B a i r d & A s s o c i a t e s
R u b b l e m o u n d R e v e t m e n t D e s i g n R e v i e w A p p e n d i x D L a k e S h o r e B o u l e v a r d , M a r q u e t t e , M I 1 2 0 3 5 . 2 0 1
APPENDIX D
Armor Size Calculations
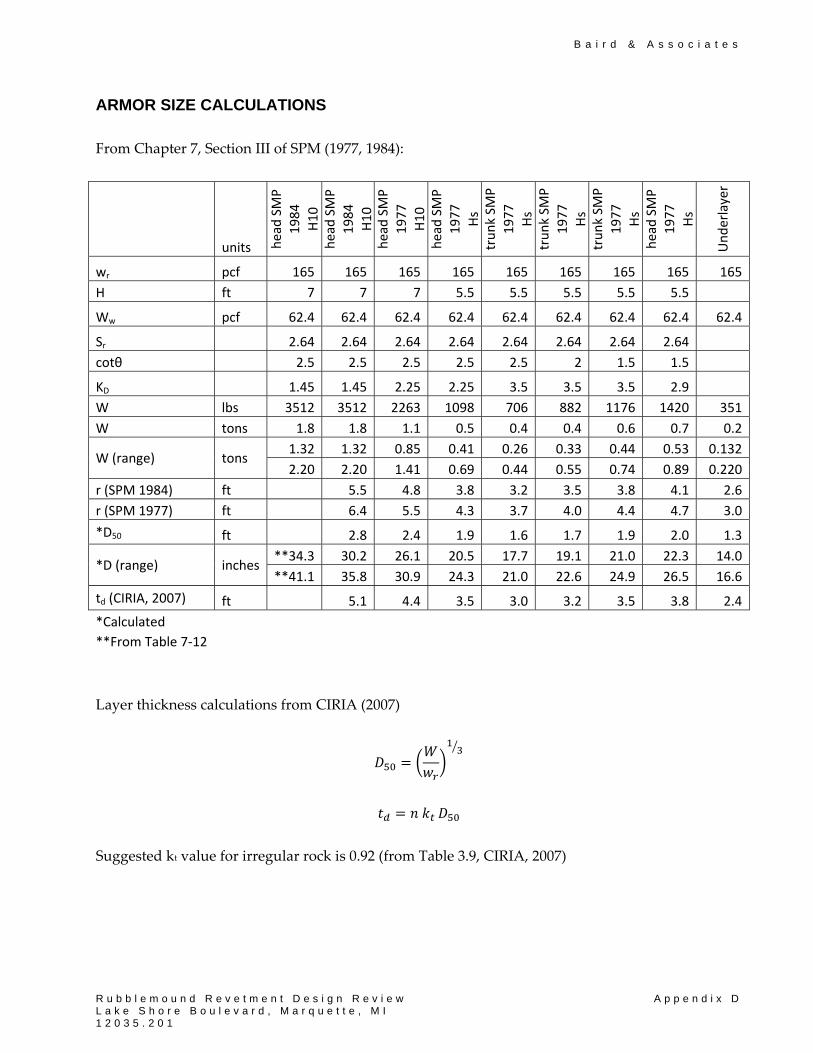
B a i r d & A s s o c i a t e s
R u b b l e m o u n d R e v e t m e n t D e s i g n R e v i e w A p p e n d i x D L a k e S h o r e B o u l e v a r d , M a r q u e t t e , M I 1 2 0 3 5 . 2 0 1
ARMOR SIZE CALCULATIONS
From Chapter 7, Section III of SPM (1977, 1984):
units head SMP
1984
H10
head SMP
1984
H10
head SMP
1977
H10
head SMP
1977
Hs
trunk SM
P
1977
Hs
trunk SM
P
1977
Hs
trunk SM
P
1977
Hs
head SMP
1977
Hs
Underlayer
wr pcf 165 165 165 165 165 165 165 165 165
H ft 7 7 7 5.5 5.5 5.5 5.5 5.5
Ww pcf 62.4 62.4 62.4 62.4 62.4 62.4 62.4 62.4 62.4
Sr 2.64 2.64 2.64 2.64 2.64 2.64 2.64 2.64
cotθ 2.5 2.5 2.5 2.5 2.5 2 1.5 1.5
KD 1.45 1.45 2.25 2.25 3.5 3.5 3.5 2.9
W lbs 3512 3512 2263 1098 706 882 1176 1420 351
W tons 1.8 1.8 1.1 0.5 0.4 0.4 0.6 0.7 0.2
W (range) tons 1.32 1.32 0.85 0.41 0.26 0.33 0.44 0.53 0.132
2.20 2.20 1.41 0.69 0.44 0.55 0.74 0.89 0.220
r (SPM 1984) ft 5.5 4.8 3.8 3.2 3.5 3.8 4.1 2.6
r (SPM 1977) ft 6.4 5.5 4.3 3.7 4.0 4.4 4.7 3.0
*D50 ft 2.8 2.4 1.9 1.6 1.7 1.9 2.0 1.3
*D (range) inches **34.3 30.2 26.1 20.5 17.7 19.1 21.0 22.3 14.0
**41.1 35.8 30.9 24.3 21.0 22.6 24.9 26.5 16.6
td (CIRIA, 2007) ft 5.1 4.4 3.5 3.0 3.2 3.5 3.8 2.4
*Calculated
**From Table 7‐12
Layer thickness calculations from CIRIA (2007)
Suggested kt value for irregular rock is 0.92 (from Table 3.9, CIRIA, 2007)