Embed Size (px)
Citation preview
WestminsterResearchhttp://www.westminster.ac.uk/westminsterresearch
Functional studies on receptor-type protein tyrosine
phosphatases of the R3 subgroup
Conn, O.
This is an electronic version of a PhD thesis awarded by the University of Westminster.
© Ms Olga Conn, 2017.
The WestminsterResearch online digital archive at the University of Westminster aims to make the
research output of the University available to a wider audience. Copyright and Moral Rights remain
with the authors and/or copyright owners.
Whilst further distribution of specific materials from within this archive is forbidden, you may freely
distribute the URL of WestminsterResearch: ((http://westminsterresearch.wmin.ac.uk/).
In case of abuse or copyright appearing without permission e-mail [email protected]
i
Functional studies on receptor-type protein tyrosine phosphatases of the R3 subgroup
Olga Conn
A thesis submitted in partial fulfilment of the requirements of the
University of Westminster for the degree of Doctor of Philosophy
Department of Science and Technology
University of Westminster
August 2017

ii
Acknowledgements
Firstly, I would like to extend my sincere gratitude to my supervisor Dr.
Alastair Barr for giving me an exciting and valuable opportunity to study this
Ph.D project. I am very grateful for his continuous support throughout my
studies, for his immense knowledge, guidance and motivation. These four
years have been really challenging and without his constant encouragement
and sympathetic attitude this thesis would not be possible.
I am very grateful to Dr. Caroline Smith, who encouraged me to apply for this
project. Thank you for always showing a great interest in the progress of my
work and for giving me much appreciated valuable advice.
I would like to thank my second supervisor Dr. Miriam Dwek for her
interesting suggestions, valuable comments and kind words. My sincere
thanks also go to Dr. Anatoliy Markiv and Dr. Mark Odell for sharing their
valuable experience and skills.
I would like to thank the University of Westminster for providing a scholarship
and the British Pharmacological Society for various funds that allowed me to
attend conferences and training courses.
And of course I would not be able to complete this project without the
enormous support of my husband. It has been a long and rough journey.
Thank you so much for being patient!
Last but not least I would like to thank my mother for always believing in me
and Jeremy Alexander for endless reading and commenting on my written
reports, abstracts, letters and thesis.
iii
Table of Contents
Page Number
Acknowledgements ii
Table of Contents iii
List of Figures vii
List of Tables xii
Abbreviations xiii
Abstract xv
1.0 Chapter 1: Introduction 1
1.1 Protein tyrosine phosphatases 2
1.1.1 Dephosphorylation mechanism 4
1.1.2 Classification of protein tyrosine phosphatases 6
1.2 Protein tyrosine phosphatases of R3 subgroup 9
1.2.1 Signal transduction pathways of R3 RPTPs 11
1.2.2 VE-PTP (PTPRB) 15
1.2.3 GLEPP1 (PTPRO) 16
1.2.4 SAP-1 (PTPRH) 17
1.2.5 DEP-1 (PTPRJ) 18
1.3 Function of R3 RPTP extracellular domain 19
1.4 Fibronectin and FN type III-like domain 20
1.5 Regulation of R3 RPTPs 23
1.5.1 Regulation by reversible oxidation 23
1.5.2 Regulation by ligand-binding 24
1.5.3 Regulation by dimerisation 25
1.6 Membrane protein interaction technologies 27
1.7 Aims of the thesis 30
2.0 Chapter 2: Materials and Methods 31
2.1 Bacterial strains 32
2.2 Preparation of competent E.coli 32
2.3 Media, buffers and solutions 34
2.4 Standard molecular biology methods 35
2.4.1 Primer design 35
iv
2.4.2 Miniprep of DNA 35
2.4.3 PCR of constructs and reaction conditions 36
2.4.4 Agarose gel electrophoresis 39
2.4.5 Purification of DNA from agarose gel 40
2.4.6 Purification of DNA from PCR 40
2.4.7 Restriction enzyme digest 41
2.4.8 Ligation 43
2.4.9 Transformation of competent cells 44
2.4.10 Colony PCR 44
2.4.11 Purification of high yields of plasmid DNA for
transfection
45
2.5 Molecular cloning for generation of BiFC constructs 47
2.5.1 Plasmids and primers 47
2.5.2 Generation of BiFC constructs 55
2.5.3 Generation of VE-PTPΔ17FN mutant using a
polymerase chain reaction based approach
57
2.5.4 Generation of membrane anchored N- and C-
terminal Venus-YFP fragments using the annealed
Oligo cloning technique
62
2.5.5 Cell culture 64
2.5.6 Transfection and confocal visualisation 65
2.5.7 Immunoblotting 65
2.5.8 Membrane localisation study by
immunoprecipitation
67
2.5.9 Generation of quantitative data and statistical
analysis
68
3.0 Chapter 3: Optimisation of the Bimolecular Fluorescence
Complementation (BiFC) assay and validation of the quantitation
procedure
70
3.1 Introduction 71
3.2 Results 79
3.2.1 Western blot analysis to confirm the expression of
bJun-VN, bFos-VC and bFosΔZIP-VC fusion proteins in
79
v
HEK293T cells
3.2.2 Comparison of HEK293 and HEK293T cell lines 81
3.2.3 Optimising quantity of DNA for HEK293T cell
transfection
83
3.2.4 Determining the optimal time-scale for expression
of bFos-VC/bJun-VN and bFosΔZIP-VC/bJun-VN
fusion pairs in HEK293T cells
86
3.2.5 Quantitative analysis and sub-cellular localisation
of BiFC signal
88
3.2.6 Quantitative and statistical analysis 92
3.3 Discussion 97
4.0 Chapter 4: Validation and characterisation of the interaction
between VE-PTP and VE-cadherin in live cells
103
4.1 Introduction 104
4.1.1 Controls to determine the complementation
specificity
107
4.1.2 Investigating association of a VE-PTPΔ17FN
mutant with VE-cadherin
110
4.2 Results 112
4.2.1 Cloning VE-PTP-VN and VE-cadherin-VC fusion proteins
112
4.2.2 Generation of negative control SPN fusion
construct
116
4.2.3 Cloning membrane anchored N- and C-terminal
Venus-YFP fusion proteins
120
4.2.4 Cloning a deletion mutant VE-PTPΔ17FN 122
4.3 Western blot analysis of BiFC fusion proteins in HEK293T
cells
124
4.4 Validation of VE-PTP and VE-cadherin interaction in live
cells using the BiFC technique
127
4.5 Comparison of the BiFC signal from the VE-PTP and VE-
cadherin pairing with VE-PTP and control constructs
131
4.6 Quantitative analysis of BiFC data 136
vi
4.7 Analysis of the VE-PTP/VE-cadherin interface 142
4.8 Discussion 149
4.9 Conclusion 157
5.0 Chapter 5: Investigation of a potential interaction between DEP-
1, SAP-1 and GLEPP1 and VE-cadherin in live cells
158
5.1 Introduction 159
5.2 Results 163
5.2.1 Cloning fusion proteins 163
5.3 Western blot analysis of BiFC fusion proteins in HEK293T
cells
170
5.4 Investigation of DEP-1, SAP-1 and GLEPP1 interactions
with VE-cadherin in live cells using BiFC technique
173
5.5 Quantitative analysis of BiFC data 184
5.6 Discussion 193
5.7 Conclusion 200
6.0 Chapter 6: Investigation of potential homodimerisation of R3
RPTPs in live cells
201
6.1 Introduction 202
6.2 Results 205
6.2.1 Fusion proteins 205
6.3 Western blot analysis of BiFC fusion proteins in HEK293T
cells
205
6.4 Investigation of homodimerisation of R3 RPTPs in live
cells using BiFC technique
206
6.5 Quantitative analysis of R3 RPTP homodimerisation BiFC
data
216
6.6 Evaluating the fraction of BiFC constructs in the plasma
membrane
225
6.7 Discussion 227
6.8 Conclusion 234
7.0 Chapter 7: Summary and Future Directions 236
References 241
vii
List of Figures
Figure 1 Phosphorylation/Dephosphorylation reactions 4
Figure 2 Two-step dephosphorylation mechanism 5
Figure 3 Schematic representation of Classical PTPs 8
Figure 4 Schematic representation of the R3 RPTPs 10
Figure 5 Regulation of signal transduction required for endothelial cell survival and proliferation by DEP-1
14
Figure 6 A structural representation of fibronectin glycoprotein 22
Figure 7 Schematic representation of the principle of the BiFC assay 29
Figure 8 Schematic diagram of BiFC constructs generation 55
Figure 9 Schematic diagram of VE-PTPΔ17FN-VN mutant generation
58
Figure 10 Schematic representation of eight different combinations of fusion proteins to be tested for BiFC
75
Figure 11 Schematic representation of the formation of the bFos-VC/bJun-VN bimolecular fluorescent complex
78
Figure 12 Western blot analysis of bJun-VN, bFos-VC and bFos∆ZIP-VC fusion proteins
80
Figure 13 Confocal analysis of expression efficiency in HEK293 and HEK293T cells
82
Figure 14 BiFC and bright field images of HEK293T cells transfected with either bFos-VC/bJun-VN or bFos∆ZIP-VC/bJun-VN fusion pairs at various concentrations
85
Figure 15 Visualisation of fluorescent signal after 24 and 48 hours post-transfection
87
Figure 16 Visualisation of bFos-VC/bJun-VN protein interactions in living cells using BiFC analysis
89
Figure 17 Confocal analysis of single transfected HEK293T cells 90
Figure 18 Visualisation of bFos∆ZIP-VC and bJun-VN interactions in 91
viii
living cells using BiFC analysis
Figure 19 The distribution of BiFC/DeepRed plasma stain ratios 94
Figure 20 Validation of BiFC specificity 96
Figure 21 Schematic representation of the VE-PTP and VE-cadherin constructs used for BiFC
106
Figure 22 Schematic representation of BiFC negative controls 109
Figure 23 Schematic representation of VE-PTP mutant fusion construct
111
Figure 24 The generation of transmembrane and extracellular domains of VE-PTP and VE-cadherin by PCR
114
Figure 25 Colony PCR to screen for successful ligation 115
Figure 26 Colony PCR analysis 117
Figure 27 Generation of extracellular and transmembrane domains of SPN by PCR
118
Figure 28 Colony PCR analysis 119
Figure 29 Colony PCR analysis for membrane anchored N- and C-terminal Venus YFP fusion proteins
121
Figure 30 Deletion of the 17th FNIII-like domain in VE-PTP-VN using a PCR based approach
123
Figure 31 Protein expression analysis by Western blot 126
Figure 32 Confocal analysis of single construct transfected HEK293T cells
128
Figure 33 BiFC analysis of interaction between VE-PTP-VN and VE-cadherin-VC
129
Figure 34
Figure 35
Co-localisation analysis of fluorescence signals from the BiFC and the red plasma membrane stain channels from HEK293T cells co-transfected with VE-PTP-VN/VE-cadherin-VC fusion pair
BiFC analysis of VE-PTP-VN with control construct SPN-VC
130
132
ix
Figure 36
Figure 37
Figure 38
BiFC analysis of VE-PTP-VN with control construct Myr-VC
BiFC analysis of control constructs SPN-VN and Myr-VC
Co-localisation analysis of fluorescence signals from the BiFC and the red plasma membrane stain channels
133
134
135
Figure 39 Validation of VE-PTP-VN/VE-cadherin-VC interaction specificity
139
Figure 40 S/N ratio of BiFC assay in HEK293T cells 140
Figure 41 Quantitation of BiFC fluorescence intensities in transiently transfected HEK293T cells
141
Figure 42 BiFC analysis of the deletion mutant VE-PTP∆17FN-VN and VE-cadherin-VC
144
Figure 43 Figure 44 Figure 45
BiFC analysis of the deletion mutant VE-PTP∆17FN-VN and control mutants SPN-VC and Myr-VC Co-localisation analysis of fluorescence signals from the BiFC and the red plasma membrane stain channels across a single cell BiFC analysis of the VE-PTP/VE-cadherin interface
145
146
147
Figure 46 Validation of VE-PTP-VN/VE-cadherin-VC interaction specificity
148
Figure 47 Schematic representation of BiFC fusion proteins 162
Figure 48 Colony PCR analysis 164
Figure 49 The generation of transmembrane and extracellular domains of DEP-1, SAP-1 and GLEPP1 by PCR
165
Figure 50 Colony PCR to screen for successful ligation of ECD+TM domains of DEP-1, SAP-1 and GLEPP1 into pBiFC-VN155 expression vectors
166
Figure 51 Colony PCR analysis to screen for successful ligation of signal peptide and HA tag of DEP-1, SAP-1 and GLEPP1 into pBiFC-VC155 expression vectors
168
Figure 52 Colony PCR to screen for successful ligation of ECD+TM domains of DEP-1, SAP-1 and GLEPP1 into pBiFC-VC155
169
x
expression vectors
Figure 53 Protein expression analysis by Western blot 172
Figure 54
Figure 55
Figure 56
BiFC analysis of interaction between DEP-1-VN and VE-cadherin-VC
BiFC analysis of DEP-1-VN with control constructs SPN-VC and Myr-VC
Co-localisation analysis of fluorescence signals across a single cell from the BiFC and the red plasma membrane stain channels
175
176 177
Figure 57 Figure 58
BiFC analysis of interaction between SAP-1-VN and VE-cadherin-VC BiFC analysis of SAP-1-VN with control constructs SPN-VC and Myr-VC
178
179
Figure 59
Figure 60
Co-localisation analysis of fluorescence signals across a single cell from the BiFC and the red plasma membrane stain channels
BiFC analysis of interaction between GLEPP1-VN and VE-cadherin-VC
180
181
Figure 61
Figure 62
Figure 63
BiFC analysis of GLEPP1-VNwith control constructs SPN-VC and Myr-VC
Co-localisation analysis of fluorescence signal across a single cell from the BiFC and the red plasma membrane stain channels
Validation of DEP-1-VN/VE-cadherin-VC interaction specificity
182
183
187
Figure 64 Validation of SAP-1-VN/VE-cadherin-VC interaction specificity
188
Figure 65 Validation of GLEPP1-VN/VE-cadherin-VC interaction specificity
189
Figure 66 S/N ratio of BiFC assay in HEK293T cells 190
Figure 67 Quantitation of BiFC fluorescence intensities in transiently transfected HEK293T cells
192
xi
Figure 68 VE-cadherin adhesive complex 197
Figure 69 BiFC analysis of VE-PTP dimerisation 208
Figure 70
Figure 71
BiFC analysis of VE-PTP-VN with control constructs SPN-VC and Myr-VC
BiFC analysis of DEP-1 dimerisation
209
210
Figure 72
Figure 73
BiFC analysis of DEP-1-VN with control consructs SPN-vc and Myr-VC
BiFC analysis of SAP-1 dimerisation
211
212
Figure 74
Figure 75
BiFC analysis of SAP-1-VN with control constructs SPN-VC and Myr-VC
BiFC analysis of GLEPP1 dimerisation
213
214
Figure 76
Figure 77
BiFC analysis of GLEPP1-VN with control constructs SPN-VC and Myr-VC
Validation of VE-PTP dimerisation
215
217
Figure 78 Validation of DEP-1 dimerisation 218
Figure 79 Validation of SAP-1 dimerisation 219
Figure 80 Validation of GLEPP1 dimerisation 220
Figure 81 S/N ratio of BiFC assay in HEK293T cells in R3 RPTP dimerisation study
223
Figure 82 Quantitation of BiFC fluorescence intensities in transiently transfected HEK293T cells
224
Figure 83 Evaluating the fraction of the DEP-1 BiFC construct in the plasma membrane
226
xii
List of Tables
Table 1 E. coli strains for cloning and associated genotypes 32
Table 2 Antibiotics for bacterial cell cultures 32
Table 3 Media and buffers 34
Table 4 PCR conditions for ECD+TM amplification with Pfx platinum
38
Table 5 Restriction digest 42
Table 6 The PCR parameters for colony PCR 45
Table 7 Addgene plasmids 47
Table 8 Details and sources of clones used 48
Table 9 Synthetic DNA sequences and oligonucleotides used to generate signal peptides and epitope tags in expression constructs
49
Table 10 Cloning primers for extracellular and transmembrane domains of the BiFC constructs
51
Table 11 Colony PCR primers 52
Table 12 Sequencing primers 53
Table 13 Primers for the generation of the VE-PTP mutant 59
Table 14 PCR parameters used for generation of VE-PTP∆17FN mutant
61
Table 15 Generation of membrane anchored N- and C-terminal Venus-YFP fragments
63
Table 16 List of primary antibodies used in Western blotting 66
xiii
Abbreviations
Ab - antibody
ADP – adenosine diphosphate
Ang1 – angiopoietin-1
ATP – adenosine triphosphate
BiFC – bimolecular fluorescence complementation
BRET - bioluminescence resonance energy transfer
CTFG – connective tissue growth factor
DEP-1 - density-enhanced phosphatase-1
DSPs - dual specificity phosphatases
ECD – extracellular domain
ECM – extracellular matrix
EGF – epidermal growth factor
EGFR1 – epidermal growth factor receptor 1
EphB2 - Ephrin type-B receptor 2
FGF – fibroblast growth factor
FN - fibronectin
FRET - fluorescence resonance energy transfer
GF – growth factor
GLEPP1 - glomerular epithelial protein 1
Grb2 - Growth factor receptor-bound protein 2
HCC – hepatocellular carcinoma
HGF – hepatocyte growth factor
IGF – insulin-like growth factor
IL – interleukin
IR – insulin receptor
LAR – leukocyte common antigen related
MaMTH - mammalian-membrane two-hybrid
MAPK – mitogen-activated protein kinase
NGF – nerve growth factor
NK cells – natural killer cells
NT-3 – neurotrophin-3
NTPTPs – non-transmembrane protein tyrosine phosphatases
xiv
PDGF – platelet-derived growth factor
PI – phosphatidylinositol
PI3K – phosphatidylinositol 3 kinase
PTK – protein tyrosine kinase
PTMs – post-transfectional modifications
PTP – protein tyrosine phosphatase
RAP – receptor affinity phosphatase
ROS – reactive oxygen species
RPTK – receptor protein tyrosine kinase
RPTP – receptor protein tyrosine phosphatase
PTPRQ - protein tyrosine phosphatase receptor type Q
SAP-1 – stomach cancer-associated protein tyrosine phosphatase-1
Sdc - syndecan
SFKs - Src family kinases
SH2 – Src homology 2
SOS – Son of sevenless
SPN – sialophorin
TCR – T cell receptor
TF – transcription factor
TSP1 – thrombospondin-1
Tyr; Y – tyrosine
UV - ultraviolet
VEGF – vascular endothelial growth factor
VEGFR2 – vascular endothelial growth factor receptor 2
VE-PTP – vascular endothelial protein tyrosine phosphatase
YFP – yellow fluorescent protein
xv
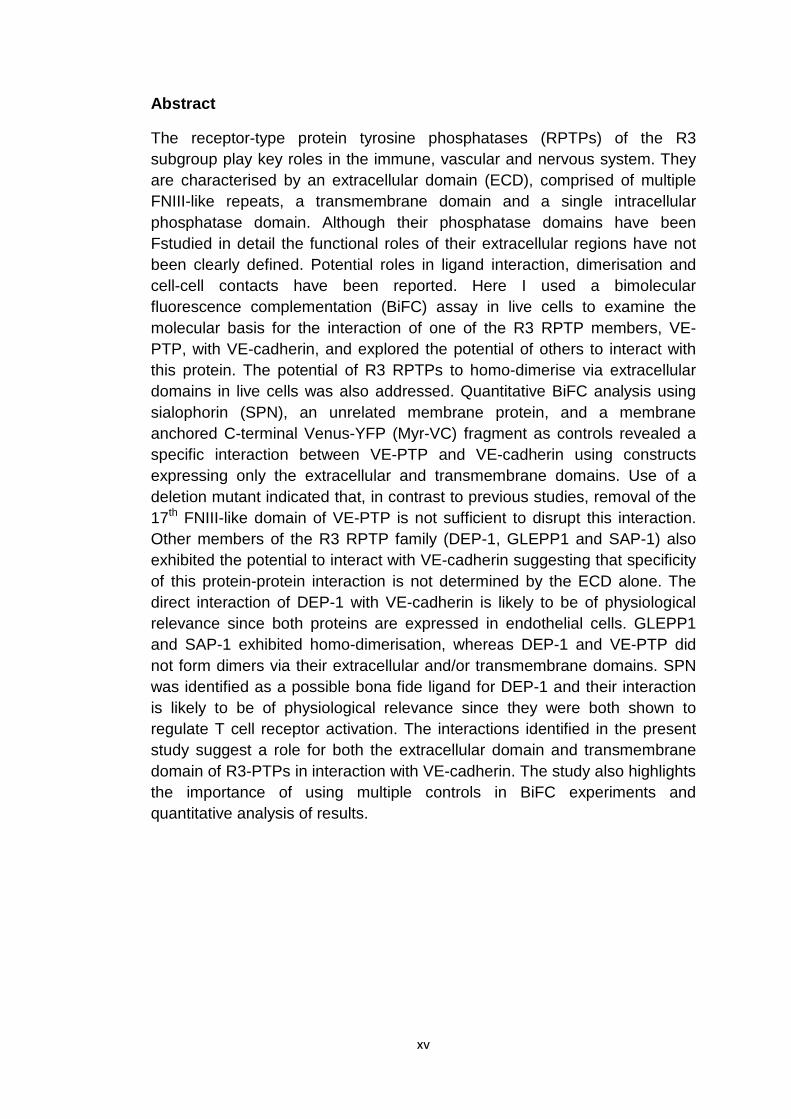
Abstract
The receptor-type protein tyrosine phosphatases (RPTPs) of the R3 subgroup play key roles in the immune, vascular and nervous system. They are characterised by an extracellular domain (ECD), comprised of multiple FNIII-like repeats, a transmembrane domain and a single intracellular phosphatase domain. Although their phosphatase domains have been Fstudied in detail the functional roles of their extracellular regions have not been clearly defined. Potential roles in ligand interaction, dimerisation and cell-cell contacts have been reported. Here I used a bimolecular fluorescence complementation (BiFC) assay in live cells to examine the molecular basis for the interaction of one of the R3 RPTP members, VE-PTP, with VE-cadherin, and explored the potential of others to interact with this protein. The potential of R3 RPTPs to homo-dimerise via extracellular domains in live cells was also addressed. Quantitative BiFC analysis using sialophorin (SPN), an unrelated membrane protein, and a membrane anchored C-terminal Venus-YFP (Myr-VC) fragment as controls revealed a specific interaction between VE-PTP and VE-cadherin using constructs expressing only the extracellular and transmembrane domains. Use of a deletion mutant indicated that, in contrast to previous studies, removal of the 17th FNIII-like domain of VE-PTP is not sufficient to disrupt this interaction. Other members of the R3 RPTP family (DEP-1, GLEPP1 and SAP-1) also exhibited the potential to interact with VE-cadherin suggesting that specificity of this protein-protein interaction is not determined by the ECD alone. The direct interaction of DEP-1 with VE-cadherin is likely to be of physiological relevance since both proteins are expressed in endothelial cells. GLEPP1 and SAP-1 exhibited homo-dimerisation, whereas DEP-1 and VE-PTP did not form dimers via their extracellular and/or transmembrane domains. SPN was identified as a possible bona fide ligand for DEP-1 and their interaction is likely to be of physiological relevance since they were both shown to regulate T cell receptor activation. The interactions identified in the present study suggest a role for both the extracellular domain and transmembrane domain of R3-PTPs in interaction with VE-cadherin. The study also highlights the importance of using multiple controls in BiFC experiments and quantitative analysis of results.

1
Chapter 1
Introduction
2
1.1 Protein tyrosine phosphatases
Over the past few decades there has been a great improvement in the
techniques for studying protein structures and functions. As a result there
has been a great focus on processes by which newly synthesised proteins
become post-translationally associated with specific organelles or are
modified by folding or addition of different associated constituents, such as
metals and carbohydrates (Waters, 2016). Almost all proteins undergo post-
translational modifications (PTMs) that take place in different cellular
compartments (e.g. nucleus, cytoplasm, endoplasmic reticulum and Golgi
apparatus) and modulate functions of modified proteins. It has been
proposed that overall structure and function of a mature protein in a cell
could be influenced by PTMs (Blom et al, 2004). PTMs can be irreversible,
such as proteolytic cleavage, or reversible, such as phosphorylation and
glycosylation (Blom et al, 2004; Jensen, 2004). Protein modification by
phosphorylation is considered a key event in many signal transduction
pathways of biological systems and it mainly occurs on serine, threonine and
tyrosine residues (Blom et al, 2004). For example, in cell signalling kinase
cascades are turned on and off by the addition and removal of phosphate
groups (Jensen, 2002; Jensen, 2004).
Many fundamental cellular processes in human cells, such as
communication between and within the cells, proliferation, differentiation,
metabolic homeostasis, migration and regulation of gene transcription, are
coordinated by tyrosine and to a lesser extent by threonine and serine
phosphorylation. Although phosphorylation of tyrosine residues represents
less than 1%, tyrosine phosphorylation plays an essential role in signal
transductions that regulate these cellular processes among neighbouring
cells in embryogenesis, organ development, tissue homeostasis and the
immune system (Alonso et al, 2004; Conrads and Veenstra, 2005). It is a
reversible and dynamic process governed by the opposing, yet coordinated,
activities of protein tyrosine kinases (PTKs) and protein tyrosine
phosphatases (PTPs) (Ostman et al, 1994; Mustelin et al, 2002; Chiarugi,
2005). PTKs catalyse phosphorylation of protein, i.e. addition of a phosphate
group, whereas PTPs are responsible for the removal of a phosphate group
3
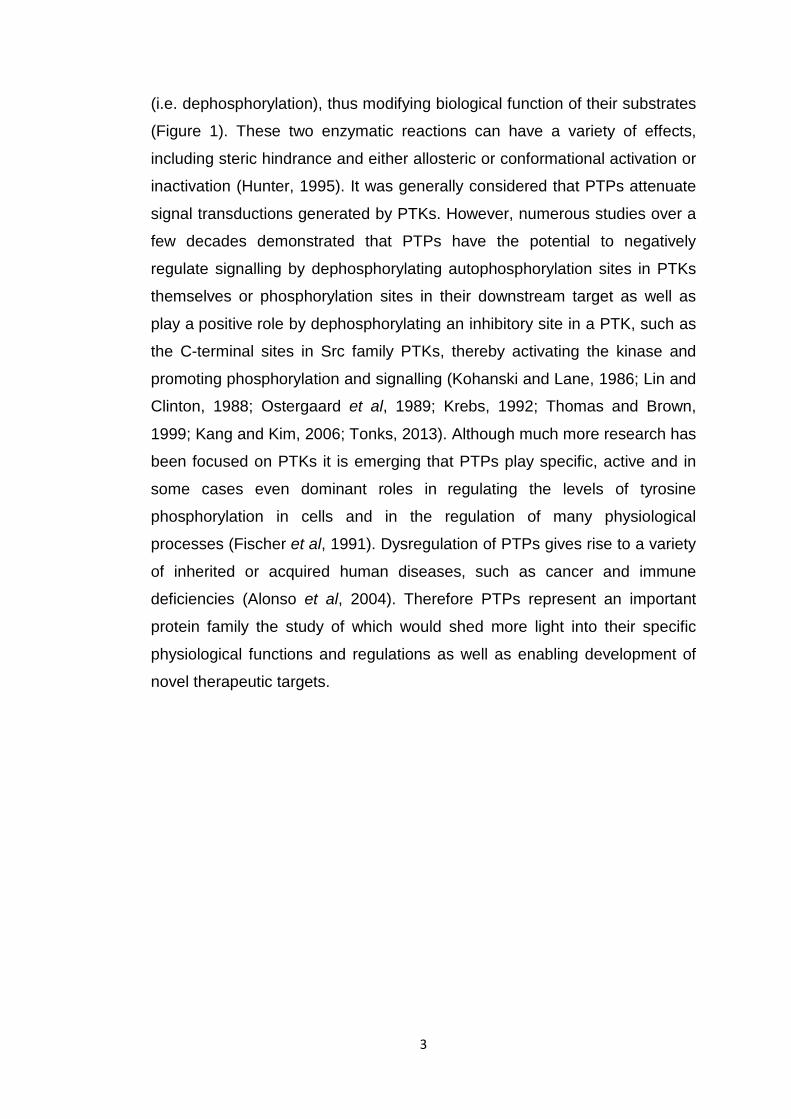
(i.e. dephosphorylation), thus modifying biological function of their substrates
(Figure 1). These two enzymatic reactions can have a variety of effects,
including steric hindrance and either allosteric or conformational activation or
inactivation (Hunter, 1995). It was generally considered that PTPs attenuate
signal transductions generated by PTKs. However, numerous studies over a
few decades demonstrated that PTPs have the potential to negatively
regulate signalling by dephosphorylating autophosphorylation sites in PTKs
themselves or phosphorylation sites in their downstream target as well as
play a positive role by dephosphorylating an inhibitory site in a PTK, such as
the C-terminal sites in Src family PTKs, thereby activating the kinase and
promoting phosphorylation and signalling (Kohanski and Lane, 1986; Lin and
Clinton, 1988; Ostergaard et al, 1989; Krebs, 1992; Thomas and Brown,
1999; Kang and Kim, 2006; Tonks, 2013). Although much more research has
been focused on PTKs it is emerging that PTPs play specific, active and in
some cases even dominant roles in regulating the levels of tyrosine
phosphorylation in cells and in the regulation of many physiological
processes (Fischer et al, 1991). Dysregulation of PTPs gives rise to a variety
of inherited or acquired human diseases, such as cancer and immune
deficiencies (Alonso et al, 2004). Therefore PTPs represent an important
protein family the study of which would shed more light into their specific
physiological functions and regulations as well as enabling development of
novel therapeutic targets.
4
Figure 1. Phosphorylation/Dephosphorylation reactions. Protein tyrosine kinases catalyse the addition of phosphate groups (phosphorylation) by transferring the phosphate group from ATP to the hydroxyl group of a serine, threonine or tyrosine in the protein. Dephosphorylation is a reversal of phosphorylation catalysed by protein tyrosine phosphatases, which involves the removal of a phosphate group from a phosphorylated protein.
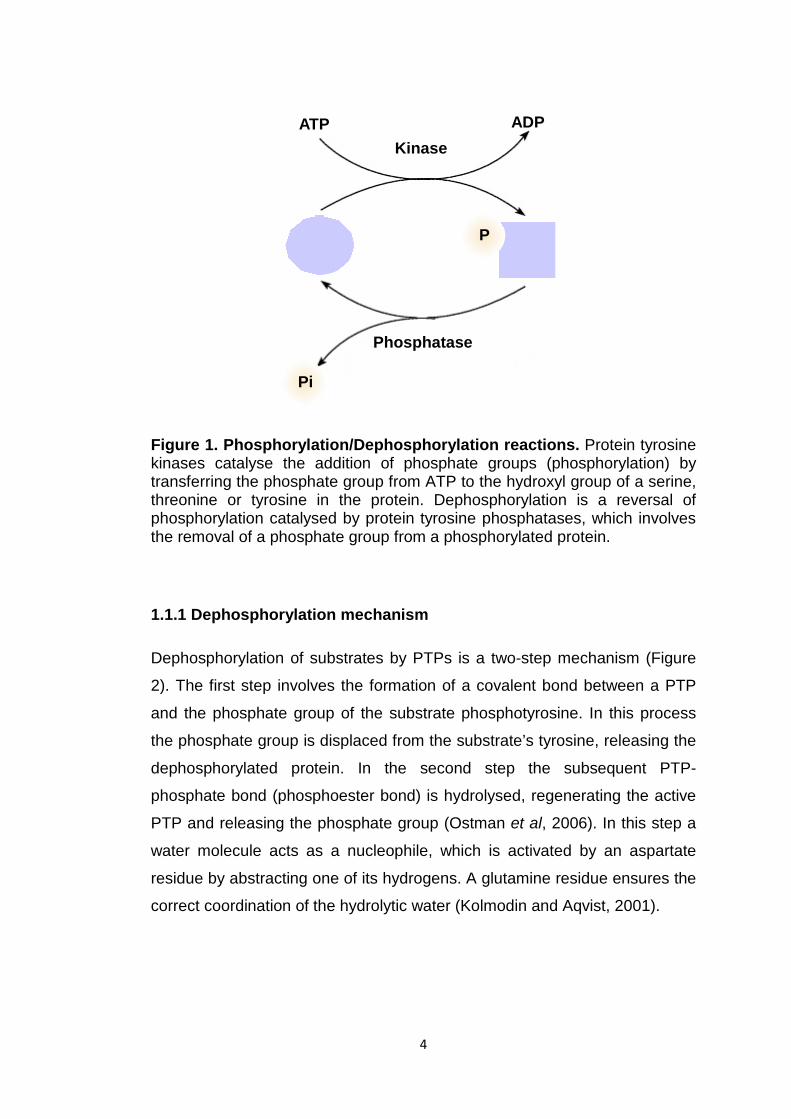
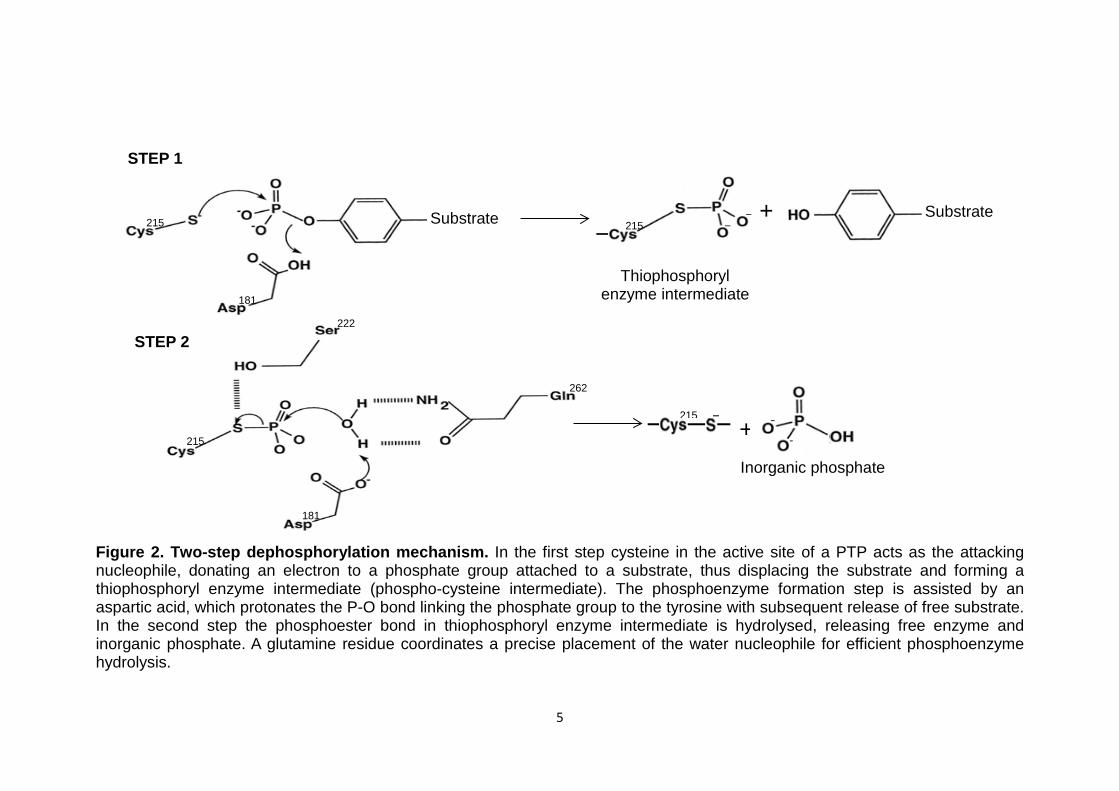
1.1.1 Dephosphorylation mechanism
Dephosphorylation of substrates by PTPs is a two-step mechanism (Figure
2). The first step involves the formation of a covalent bond between a PTP
and the phosphate group of the substrate phosphotyrosine. In this process
the phosphate group is displaced from the substrate’s tyrosine, releasing the
dephosphorylated protein. In the second step the subsequent PTP-
phosphate bond (phosphoester bond) is hydrolysed, regenerating the active
PTP and releasing the phosphate group (Ostman et al, 2006). In this step a
water molecule acts as a nucleophile, which is activated by an aspartate
residue by abstracting one of its hydrogens. A glutamine residue ensures the
correct coordination of the hydrolytic water (Kolmodin and Aqvist, 2001).
ADP ATP Kinase
Phosphatase
Pi
P
5
Figure 2. Two-step dephosphorylation mechanism. In the first step cysteine in the active site of a PTP acts as the attacking nucleophile, donating an electron to a phosphate group attached to a substrate, thus displacing the substrate and forming a thiophosphoryl enzyme intermediate (phospho-cysteine intermediate). The phosphoenzyme formation step is assisted by an aspartic acid, which protonates the P-O bond linking the phosphate group to the tyrosine with subsequent release of free substrate. In the second step the phosphoester bond in thiophosphoryl enzyme intermediate is hydrolysed, releasing free enzyme and inorganic phosphate. A glutamine residue coordinates a precise placement of the water nucleophile for efficient phosphoenzyme hydrolysis.
Substrate Substrate 215
STEP 1
STEP 2
181
+ 215
262
181
215
+
Inorganic phosphate
215
222
Thiophosphoryl enzyme intermediate
6
1.1.2 Classification of protein tyrosine phosphatases
Protein tyrosine phosphatases (PTPs) represent a large and diverse
superfamily of related enzymes encoded by 107 PTP genes in the human
genome (Alonso et al, 2004). The PTPs can be grouped into four families,
namely Class I, II and III cysteine-based PTPs and aspartic acid-based
PTPs. Based on their structure and substrate specificity Class I cysteine-
based PTPs can be further divided into two major categories: the tyrosine-
specific or “classical” PTPs, which are specific for phosphotyrosine (pTyr)-
containing substrates and the dual specificity phosphatases (DSPs), which
dephosphorylate pTyr and pSer/pThr and other substrates, such as lipids
and mRNA. As demonstrated in Figure 3 classical PTPs, in turn, can be
subdivided into intracellular non-transmembrane NT1-NT9 phosphatases
and transmembrane receptor-like enzymes designated receptor types R1-R8
based on sequence similarity (Andersen et al, 2001; Alonso et al, 2004; Barr,
2010). This is a simplistic classification of phosphatases, which in reality is
much more complex and diverse due to the use of alternative promoters,
alternative mRNA splicing and post-translational modifications. Classical
PTPs have one or two intracellular domains but only one membrane-
proximal domain (D1) is believed to be catalytic, comprising about 280
residues. Nevertheless the structural integrity of the second PTP domain
(D2) was shown to be important for the activity, specificity and stability of the
RPTP as a whole and may provide docking sites for substrates and
regulatory proteins (Tonks, 2006). The catalytic domain is defined by several
conserved short sequence motifs, such as the signature sequence that
functions as a phosphate-binding loop at the active site (Tonks, 2006). The
specificity of the classical PTPs for the phosphotyrosyl residues could be
partially explained by the depth of the active side cleft on the protein
molecular surface. The depth of this cleft is determined by an invariant
tyrosine residue from the pTyr loop. At the base of the cleft a cysteine (cys)
residue is positioned within the PTP (i.e. catalytic) loop for nucleophilic attack
on the phosphate moiety of the substrate (Salmeen et al, 2000). Non-
transmembrane PTPs (NTPTPs) are rich in protein-protein interaction
domains, such as the SH2 domain (Alonso et al, 2004). In addition the
7
NTPTPs contain a wide variety of structural motifs flanking the catalytic
domain that are important for regulating their PTP activity, either directly by
interaction with the active site or by controlling substrate specificity (Garton
et al, 1997). The transmembrane receptor-like phosphatases (PTPs) are
characterised by an extracellular domain and a membrane-spanning α-helix
transmembrane. Many RPTPs display features of cell-adhesion molecules
have been implicated in processes that involve cell–cell and cell–matrix
contact (Tonks, 2006).
8
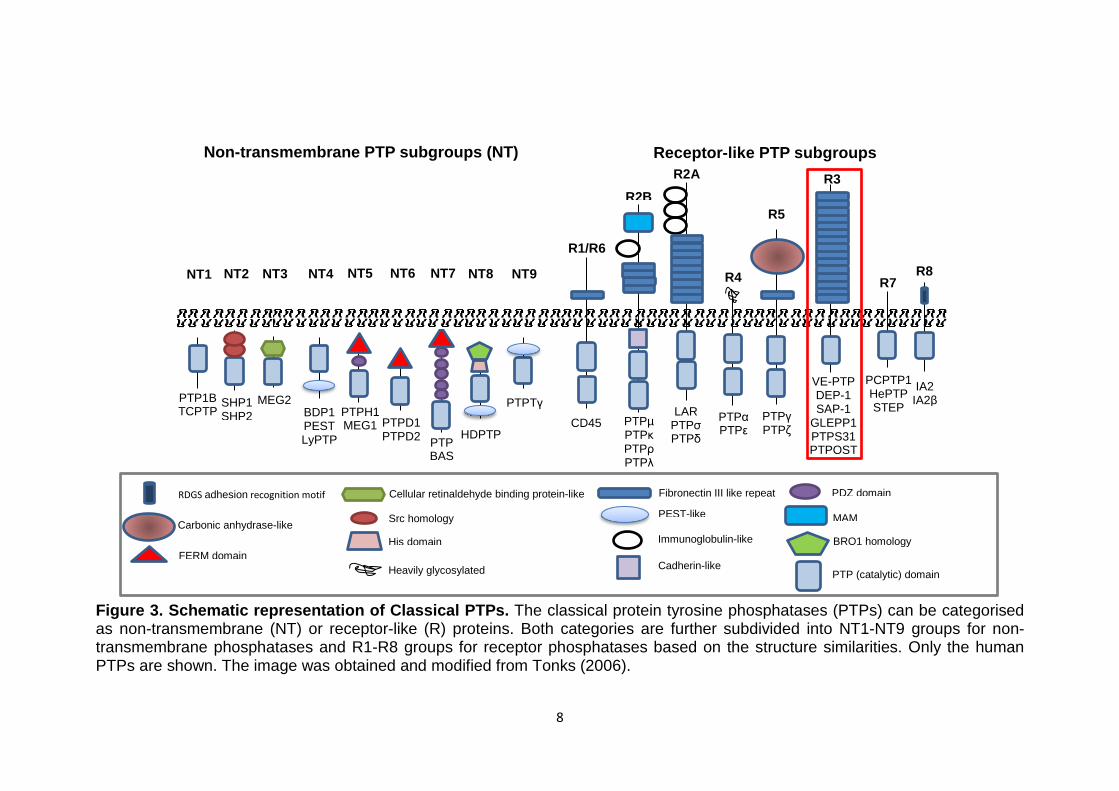
Figure 3. Schematic representation of Classical PTPs. The classical protein tyrosine phosphatases (PTPs) can be categorised as non-transmembrane (NT) or receptor-like (R) proteins. Both categories are further subdivided into NT1-NT9 groups for non-transmembrane phosphatases and R1-R8 groups for receptor phosphatases based on the structure similarities. Only the human PTPs are shown. The image was obtained and modified from Tonks (2006).
Non-transmembrane PTP subgroups (NT)
Receptor-like PTP subgroups
NT1 NT2 NT3 NT4 NT5 NT6 NT7 NT8 NT9
SHP1 SHP2
PTP1B TCPTP
MEG2
BDP1 PEST LyPTP
PTPH1 MEG1
PTPD1 PTPD2
PTP BAS
HDPTP
PTPTγ
CD45
R1/R6
PTPµ PTPκ PTPρ PTPλ
R2B
LAR PTPσ PTPδ
R2A
PTPα PTPε
R4
PTPγ PTPζ
R5
VE-PTP DEP-1 SAP-1
GLEPP1 PTPS31 PTPOST
R3
PCPTP1 HePTP STEP
R7
IA2 IA2β
R8
PTP (catalytic) domain
Src homology
Cellular retinaldehyde binding protein-like
PEST-like
PDZ domain
FERM domain His domain BRO1 homology
Fibronectin III like repeat
Immunoglobulin-like
MAM
Cadherin-like Heavily glycosylated
Carbonic anhydrase-like
RDGS adhesion recognition motif
9
1.2 Protein tyrosine phosphatases of R3 subgroup
The focus of this thesis is on the receptor-type PTPs of R3 subgroup (R3
RPTPs) (boxed in red in Figure 3). There are five RPTP members in this
subgroup in humans and mice: density-enhanced phosphatase-1 (DEP-1),
vascular endothelial protein tyrosine phosphatase (VE-PTP), glomerular
epithelial protein 1 (GLEPP1), stomach cancer-associated protein tyrosine
phosphatase-1 (SAP- 1) and protein tyrosine phosphatase receptor type Q
(PTPRQ). Only the first four members are tyrosine phosphatases. The
PTPRQ protein, although it shares primary structure with the other R3
RPTPs, is a phosphatidylinositol (PI) phosphatase and has little activity
towards protein substrates (Yu et al, 2013; Jeon, 2015). Therefore, only VE-
PTP, DEP-1, SAP-1 and GLEPP1 transmembrane enzymes were
investigated in this project. The schematic representation of these proteins is
shown in Figure 4.
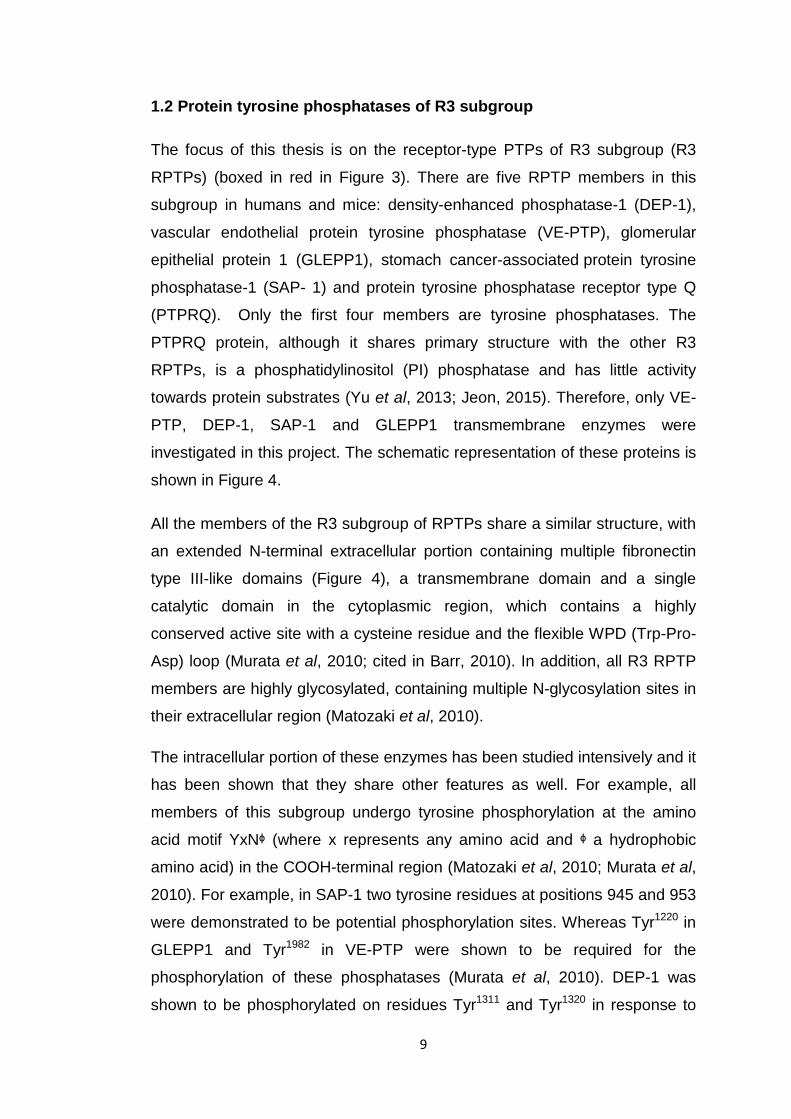
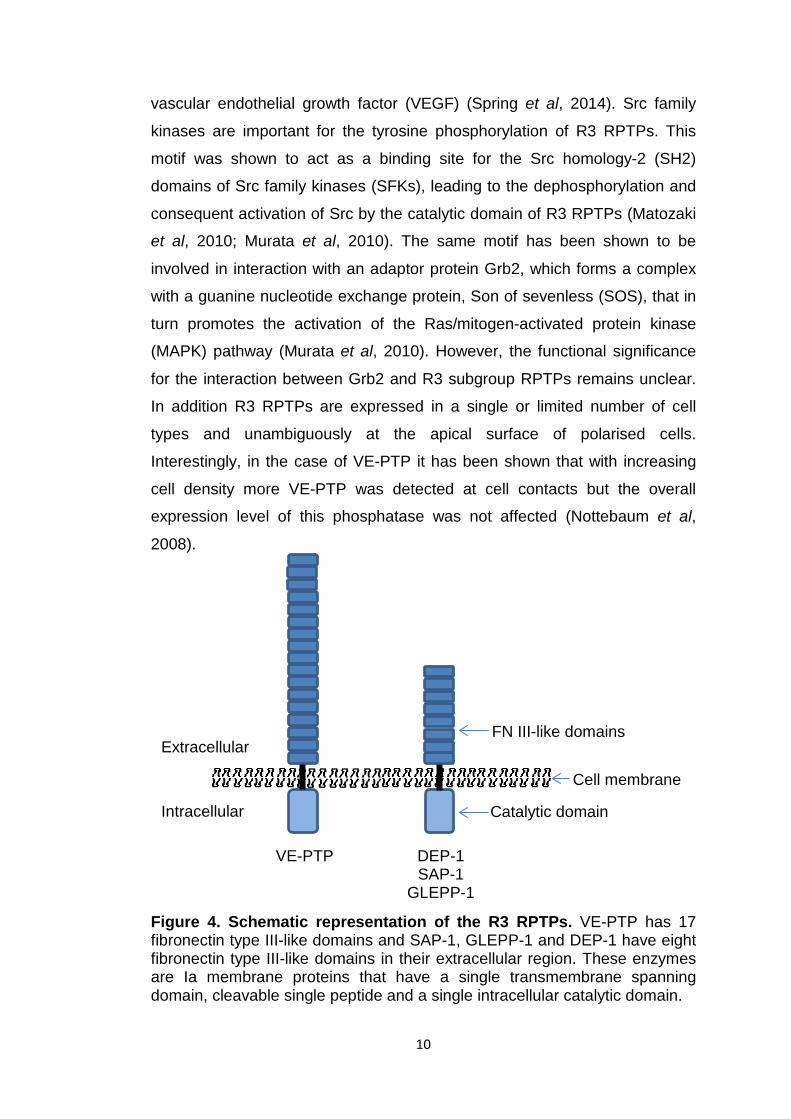
All the members of the R3 subgroup of RPTPs share a similar structure, with
an extended N-terminal extracellular portion containing multiple fibronectin
type III-like domains (Figure 4), a transmembrane domain and a single
catalytic domain in the cytoplasmic region, which contains a highly
conserved active site with a cysteine residue and the flexible WPD (Trp-Pro-
Asp) loop (Murata et al, 2010; cited in Barr, 2010). In addition, all R3 RPTP
members are highly glycosylated, containing multiple N-glycosylation sites in
their extracellular region (Matozaki et al, 2010).
The intracellular portion of these enzymes has been studied intensively and it
has been shown that they share other features as well. For example, all
members of this subgroup undergo tyrosine phosphorylation at the amino
acid motif YxNᶲ (where x represents any amino acid and ᶲ a hydrophobic
amino acid) in the COOH-terminal region (Matozaki et al, 2010; Murata et al,
2010). For example, in SAP-1 two tyrosine residues at positions 945 and 953
were demonstrated to be potential phosphorylation sites. Whereas Tyr1220 in
GLEPP1 and Tyr1982 in VE-PTP were shown to be required for the
phosphorylation of these phosphatases (Murata et al, 2010). DEP-1 was
shown to be phosphorylated on residues Tyr1311 and Tyr1320 in response to
10
vascular endothelial growth factor (VEGF) (Spring et al, 2014). Src family
kinases are important for the tyrosine phosphorylation of R3 RPTPs. This
motif was shown to act as a binding site for the Src homology-2 (SH2)
domains of Src family kinases (SFKs), leading to the dephosphorylation and
consequent activation of Src by the catalytic domain of R3 RPTPs (Matozaki
et al, 2010; Murata et al, 2010). The same motif has been shown to be
involved in interaction with an adaptor protein Grb2, which forms a complex
with a guanine nucleotide exchange protein, Son of sevenless (SOS), that in
turn promotes the activation of the Ras/mitogen-activated protein kinase
(MAPK) pathway (Murata et al, 2010). However, the functional significance
for the interaction between Grb2 and R3 subgroup RPTPs remains unclear.
In addition R3 RPTPs are expressed in a single or limited number of cell
types and unambiguously at the apical surface of polarised cells.
Interestingly, in the case of VE-PTP it has been shown that with increasing
cell density more VE-PTP was detected at cell contacts but the overall
expression level of this phosphatase was not affected (Nottebaum et al,
2008).
Figure 4. Schematic representation of the R3 RPTPs. VE-PTP has 17 fibronectin type III-like domains and SAP-1, GLEPP-1 and DEP-1 have eight fibronectin type III-like domains in their extracellular region. These enzymes are Ia membrane proteins that have a single transmembrane spanning domain, cleavable single peptide and a single intracellular catalytic domain.
Extracellular
Intracellular
FN III-like domains
Catalytic domain
VE-PTP DEP-1 SAP-1
GLEPP-1
Cell membrane
11
1.2.1 Signal transduction pathways of R3 RPTPs
Some RPTPs have been reported to regulate the activity of RPTKs through
dephosphorylation. Ligand-binding to the extracellular domains of RPTKs
was shown to induce their dimerisation, resulting in the subsequent
autophosphorylation of their cytoplasmic domains and activation of the
tyrosine kinase activity. Phosphorylated tyrosine sites in the RPTKs
cytoplasmic domains serve as binding sites for specific downstream
signalling molecules, which, upon complex formation, initiate a specific signal
transduction (Sakuraba et al, 2013). A study by Sakuraba et al (2013) using
a two-hybrid system with substrate-trapping R3 RPTP mutants demonstrated
that the members of the R3 subgroup share some similarities in specificity
towards some RPTKs but differences towards others. All four members
appeared to interact with and dephosphorylate TYRO3 and EphB2 tyrosine
kinases whereas protein tyrosine kinase RET was recognised only by DEP-
1, and EGFR1 and VEGFR2 kinases by SAP-1. However, the signal
transduction pathways are not fully defined for all R3 RPTPs. It is interesting
to note that VEGFR2 was identified as a substrate for SAP-1 in a study by
Sakuraba et al (2013) whereas in a study by Chabot et al (2009) VEGFR2
was identified as a bona fide substrate for DEP-1. DEP-1 was shown to
specifically dephosphorylate tyrosine residues in the activation loop of
VEGFR2 and, thus, play a regulatory role in the VEGFR2-mediated
angiogenic signalling response. The proposed DEP-1 regulation of VEGFR2-
mediated signalling pathway is shown in Figure 5. It appears that DEP-1
exerts both negative and positive regulation of VEGFR2 activity perhaps by
dephosphorylating different tyrosine residues. Upon VEGF stimulation
VEGFR2 undergoes dimerisation that allows trans/autophosphorylation of
several intracellular tyrosine residues. Activated VEGFR2 then associates
with numerous signal transducers, resulting in endothelial cell survival,
proliferation and migration (Laramee et al, 2007). Activated VEGFR2 was
shown to associate with VE-cadherin-β-catenin complex, where it is
dephosphorylated by DEP-1 (Lampugnani et al, 2003). This results in
impaired activation of the proliferative ERK1/2 pathway and, thus, in
decreased endothelial cell proliferation (Chabot et al, 2009). A study by
12
Laramee et al (2007) demonstrated that upon VEGF stimulation VEGFR2
also associates with and phosphorylates an adaptor protein Gab1. It has
been suggested that the activated Gab1 links the DEP-1-activated Src
(through dephosphorylation of the Src-inhibitory tyrosine residue Y529) to
phosphatidylinositol3 kinase (PI3K) and subsequently activates Akt signalling
pathway that promotes cell survival (Laramee et al, 2007; Chabot et al, 2009;
Lampugnani et al, 2003). VE-PTP was also shown to interact with and
dephosphorylate VEGFR2. However, unlike with DEP-1, this association is
not direct but mediated by the Angiopoietin-1 (Ang1) receptor Tie-2 and it is
accompanied by decreased VE-cadherin phosphorylation and the
subsequent enhancement of lumenised vessel formation (Hayashi et al,
2013). VE-PTP, Tie-2 and VEGFR2 appear to form a trimeric complex that,
upon stimulation by VEGF and Ang1, translocates to junctions where Tie2
and VEGFR2 are dephosphorylated and thus inactivated by VE-PTP.
Downregulation of VE-PTP results in increased activation of VEGFR2 and
Tie-2 and leads to VE-cadherin phosphorylation and formation of
pathological vasculature (Hayashi et al, 2013). However, the exact signalling
pathway that brings all these proteins together in regulation of VE-cadherin-
mediated angiogenesis is not yet defined.
However, it is important to note that the above studies obtained their results
using different methods. A study by Sakuraba et al (2013) used mammalian
two-hybrid assay, which provides sensitivity and specificity in protein-protein
interaction studies and allows the assayed proteins to undergo appropriate
post-translational modifications in their native cellular context. However,
caution must be taken when interpreting the results as an exogenous
expression of hybrid “prey” and “bait” proteins could lead to either false
positive or false negative results. For example, overexpression of proteins is
common and can create the risk that the proteins interact merely due to their
high concentration in the cell. Generation of hybrid proteins can also result in
steric hindrance, preventing the association of the assayed proteins and thus
giving rise to false negative interactions. On the other hand, fusion proteins
can adopt altered conformations, which could result in exposure of an
interaction domain that is normally hidden in the protein structure, facilitating
13
non-native interactions and resulting in false-positive signal (Lievens et al,
2009). In contrast, a study by Chabot et al (2009) used substrate-trapping
experiments which, although versatile and any type of cells, tissues or organ
can be used, are prone to artifactual results since isolated PTPs can be
promiscuous. In addition, both studies investigated the ability of a sigle PTP
to dephosphorylate VEGFR2 (i.e. SAP-1 in the Sakuraba et al (2013) study
and DEP-1 in the Chabot et al (2009) study). However, since these PTPs
belong to the same R3 subgroup they could both have a potential to
recognise the same substrate.
A study by Shintani et al (2015) showed that R3 RPTPs could also be
involved in insulin receptor (IR) signalling. Upon insulin stimulation the IR
undergoes autophosphorylation. Activated IR subsequently phosphorylates
and activates downstream signals, including PI3K and Akt (Saltiel and Kahn,
2001). All four members of R3 subgroup have been shown to suppress
activation of the IR by specifically interacting with and dephosphorylating
Y960 in the juxtamembrane region and Y1146 in the activation loop of the IR
(Shintani et al, 2015). Although all four phosphatases showed similar
dephosphorylating activities towards IR, only DEP-1 was found to be
expressed and co-localised with IR in insulin target tissues (i.e. skeletal
muscle, liver and adipose tissue) and, thus, was the most likely member to
regulate insulin signalling in vivo (Shintani et al, 2015). This is an interesting
observation that raises some questions about substrate specificity. If all four
members have a potential to bind directly to the same substrate (as in the
case with insulin receptor) in vitro, then it remains unclear how the substrate
specificity is determined in vivo.
Despite many cellular targets involved in essential cellular activities, such as
cell survival, proliferation and migration, the exact signalling events are not
fully understood. This highlights the complexity of signal transductions and
shows that one protein can trigger different signalling pathways. Even though
the members of R3 RPTP subgroup show the specificity towards the same
substrate, the biological downstream activities could be diverse. In addition, it
is still not entirely understood how their involvement in certain signalling
pathways is regulated.
14
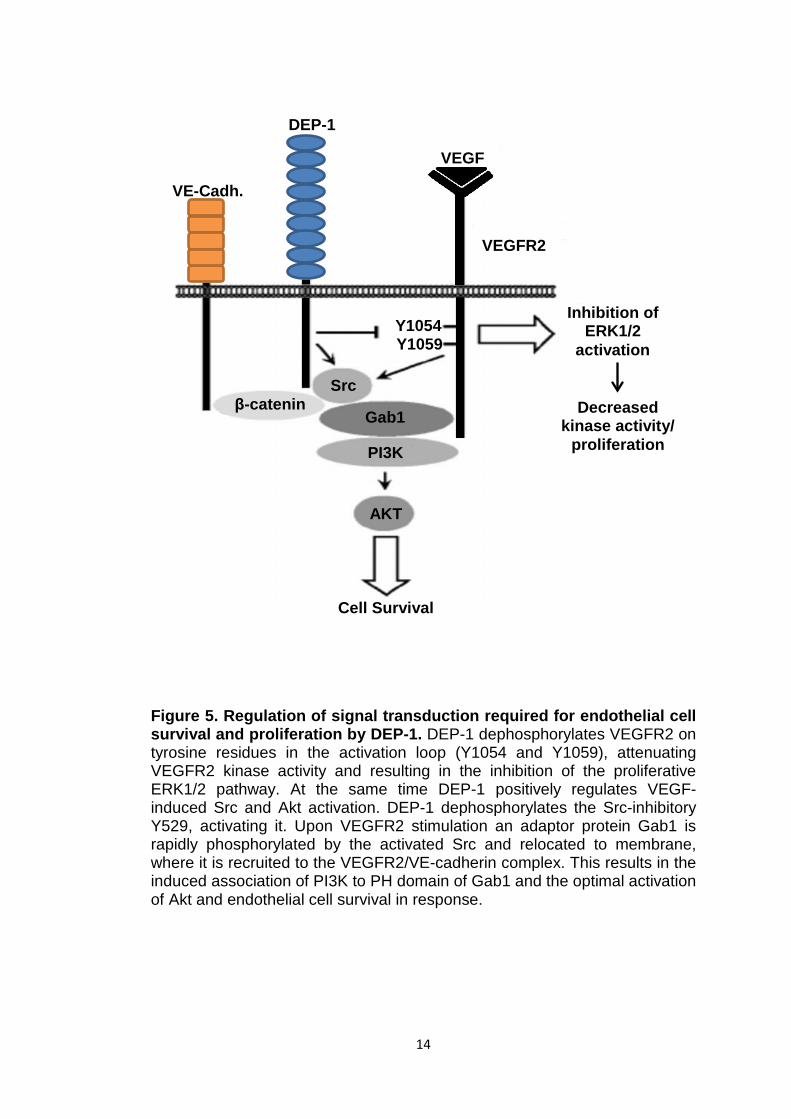
Figure 5. Regulation of signal transduction required for endothelial cell survival and proliferation by DEP-1. DEP-1 dephosphorylates VEGFR2 on tyrosine residues in the activation loop (Y1054 and Y1059), attenuating VEGFR2 kinase activity and resulting in the inhibition of the proliferative ERK1/2 pathway. At the same time DEP-1 positively regulates VEGF-induced Src and Akt activation. DEP-1 dephosphorylates the Src-inhibitory Y529, activating it. Upon VEGFR2 stimulation an adaptor protein Gab1 is rapidly phosphorylated by the activated Src and relocated to membrane, where it is recruited to the VEGFR2/VE-cadherin complex. This results in the induced association of PI3K to PH domain of Gab1 and the optimal activation of Akt and endothelial cell survival in response.
VE-Cadh.
DEP-1
VEGF
VEGFR2
β-catenin Src
Gab1
PI3K
AKT
Cell Survival
Y1059 Y1054
Decreased kinase activity/
proliferation
Inhibition of ERK1/2
activation
15
1.2.2 VE-PTP (PTPRB)
VE-PTP is expressed in vascular endothelial cells, especially in brain, lung
and heart and more strongly in arterial endothelium (Fachinger et al, 1999).
VE-PTP was shown to interact with the tyrosine kinase Tie-2 receptor (a
receptor for angiopoietin that plays an important role in angiogenesis) via the
intracellular parts of the proteins, causing dephosphorylation of Tie-2, which
in turn results in inhibition of the proliferation of endothelial cells (cited in
Matozaki et al, 2010; Baumer et al, 2006; Fachinger et al, 1999).
Furthermore, co-precipitation experiments using COS-7 cells showed that
VE-PTP also associates with the adhesion molecule of endothelial adherens
junctions VE-cadherin and enhances cell-cell adhesion mediated by this
molecule. But the interesting point is that this association takes place
independently of their cytoplasmic tails and occurs via extracellular domains
(Nawroth et al, 2002). Experiments using a series of truncation mutants led
to the conclusion that the 5th cadherin domain of VE-cadherin interacts with
the 17th FNIII repeat of VE-PTP. This finding raises a question as to the role
of the other 16 FNIII domains in VE-PTP and other 4 domains in VE-
cadherin. Taking into account that VE-PTP interacts with Tie-2 and VE-
cadherin, it might play an important role in the regulation of functions of
vascular adhesion molecules required for efficient angiogenesis (Matozaki et
al, 2010). Some results showed the up-regulation of VE-PTP expression in
new tumour vessels, suggesting the involvement of VE-PTP in tumour
angiogenesis (Dominguez et al, 2007).
16
1.2.3 GLEPP-1 (PTPRO) Alternative splicing of GLEPP1 mRNA generates either a cytoplasmic or
transmembrane form of the enzyme (Pixley et al, 1995). Five spliced
isoforms are known: two transmembrane-type isoforms are highly expressed
in the developing nervous system, where they are involved in the regulation
of axon guidance. Three truncated isoforms of GLEPP1 lacking the
extracellular domain are expressed in macrophages, B cells and osteoclasts
(cited in Matozaki et al, 2010). GLEPP1 is also expressed in the renal
visceral glomerular epithelial cell (podocytes), where it may play an important
role in signalling pathways required for the regulation of structure and
function of the slit diaphragm of podocytes, necessary for the size-selective
filtration barrier of the kidney (Thomas et al, 1994; Matozaki et al, 2010;
Beltran et al, 2003). This regulation is achieved through
phosphorylation/dephosphorylation of serine, threonine or tyrosine residues
of the adhesion proteins nephrin and neph1, creating binding sites for SH2
domain-containing molecules and forming multiprotein complexes (Benzing,
2004). The GLEPP1 (PTPRO gene)-deficient mice showed reduced
glomerular filtration and a tendency to hypertension (Wharram et al, 2000).
Some evidence showed that the likely relevant substrate for GLEPP1 is the
high-affinity receptor for neurotrophin-3 (NT-3) tropomyosin-related kinase C
(TrkC) (Hower et al, 2009). GLEPP1 is co-expressed with TrkC in neurons in
several locations, including sensory ganglia, cranial ganglia, spinal cord and
cortex (cited in Hower et al, 2009). Studies on PTPRO-/- mice demonstrated
that lack of GLEPP1 resulted in a disturbed axon guidance in TrkC-
expressing sensory neurons, suggesting that GLEPP1 may play a role in
regulation of axon outgrowth and guidance (Gonzalez-Brito and Bixby,
2009).
17
1.2.4 SAP-1 (PTPRH)
SAP-1 is expressed in the gastrointestinal tract, particularly in the small
intestine and colon as well as stomach, and specifically localised at the
microvilli of the brush border in gastrointestinal epithelial cells (Sadakata et
al, 2009). It has been suggested that SAP-1 regulates intestinal
tumorigenesis, though the exact mechanism of this regulation remains
unclear (Sadakata et al, 2009). Using a substrate-trapping strategy it was
possible to identify likely physiological substrates that are dephosphorylated
by SAP-1 – prominent focal adhesion-associated proteins p130Cas and, to a
lesser extent, paxillin. Since p130Cas plays an important role in the
maintenance of actin stress fibres and focal adhesions through the
association with the SH2 domain-containing adapter protein Crk as well as
contributing to cell spreading on the extracellular matrix (ECM), SAP-1 is
probably involved in regulation of the rearrangement of the actin-based
cytoskeleton and cell spreading on fibronectin (Noguchi et al, 2001). The
cytoplasmic region of SAP-1 was shown to bind to protein kinase Lck,
resulting in the inhibition of the Lck kinase activity and consequent inhibition
of T cell receptor-mediated T cell function (Sadakata et al, 2009). However,
the exact mechanism of SAP-1 regulation of Lck-mediated T cell function
remains unclear. SAP-1 has been shown to regulate negatively the
progression of human hepatocellular carcinoma (HCC) by suppressing
mitogenic and survival signalling and the expression of this protein seems to
be down-regulated at the later stages of human HCC (Nagano et al, 2003).
Similar results were obtained by studying colorectal cancer tissues, showing
a decrease in SAP-1 expression with the progression of this cancer (Seo et
al, 1997).
18
1.2.5 DEP-1 (PTPRJ)
DEP-1 (also known as PTPRJ and CD148) is expressed by all resting
leukocytes, with the highest level of expression on monocytes, intermediate
level on NK cells, B cells and CD8+ T cells and the lowest level on CD4+ T
cells. The expression of DEP-1 on peripheral T cells is up-regulated in the
presence of IL-2 and IL-15, suggesting that DEP-1 is involved in the
functional regulation of activated T cells, particularly CD8+ T cells. The fact
that DEP-1 is also expressed on monocytes, B cells and NK cells suggests
that CD148 may have a role in the biological responses of different
populations of mononuclear cells and that its primary function is not
restricted to T cells (Tangye et al, 1998). In addition, a study by Borges et al
(1996) showed that the high expression levels of DEP-1 are also present in
distal tubule epithelia and endothelial cells at sites of cell-cell interactions as
well as megakaryocytes (Borges et al, 1996). The expression of this PTP
displayed a direct relation to cell density, suggesting that it may play a role in
regulation of cell contact-mediated growth inhibition (Borges et al, 1996;
Matozaki et al, 2010). DEP-1 has been found to function as a tumour
suppressor and deletion or mutation of a gene PTPRJ that encodes for this
protein can be observed in colon cancer (Ostman et al, 2006; Barr, 2010). A
study by Whiteford et al (2011) showed that heparin sulphate proteoglycan
Syndecan-2 acts as a ligand for the DEP-1 and through the interaction of the
extracellular domains of these two proteins (which requires PI3K activity
downstream of Src kinase) the extracellular core protein of Syndecan-2
promotes β1 integrin-mediated fibroblast attachment and spreading. Another
ligand for DEP-1 is Thrombospondin-1 (TSP1) – a glycoprotein that mediates
cell-cell and cell-matrix interactions. TSP1 increases DEP-1 activity,
influencing the dephosphorylation of its substrates (Takahashi et al, 2012).
19
1.3 Function of R3 RPTP extracellular domain
Even though these PTPs show functional importance in the regulation, both
positive and negative, of signal transduction, the exact functions and
mechanisms remain uncharacterised and require further investigation.
Although the function of the intracellular catalytic domain of RPTPs has been
extensively studied the function of the extracellular domain for RPTPs is less
clearly defined but probably plays an important role in regulating activity. For
example, the extracellular domain (ECD) of a type IIB receptor protein
tyrosine phosphatase RPTPµ was shown to play a key regulatory role in
modulating the stability of adherens junctions. The extracellular region of this
protein is highly N-glycosylated and consists of one MAM (meprin/A5/µ)
domain, one immunoglobulin (Ig)-like domain and four fibronectin (FN) type
III repeats, forming rigid rod-like architecture. RPTPµ is a cell adhesion
molecule that forms high affinity trans-dimers, the dimensions of which match
cadherin-mediated cell junctions and, thus, has a potential to act as a spacer
clamp, locking the phosphatase activity at the adherens junction (Aricescu et
al, 2007).
Recent findings demonstrate that the extracellular domains of DEP-1 (also
named PTPRJ and CD148) and CD45 are involved in regulation of T-cell
receptor (TCR) triggering through mediating their passive (i.e. signalling
independent) segregation from areas of close cell-cell contact (Cordoba et al,
2013). It was suggested that the segregation from the engaged TCR is
enhanced by the large extracellular domains of CD148 and CD45. The
results also showed that it is the large size of the CD148 extracellular domain
that prevents it from inhibiting TCR signalling, whereas truncated CD148 has
a strong inhibitory effect (Cordoba et al, 2013). Another member of R3 RPTP
subgroup VE-PTP was suggested to exert its role in the regulation of the
endothelial barrier via its extracellular domain. The association of VE-PTP
and VE-cadherin appears to stabilise VE-cadherin-plakoglobin complex and
to enhance the adhesive function of VE-cadherin. The inhibition of VE-PTP
expression resulted in increased permeability of endothelial cells and
leukocyte extravasation, suggesting that VE-PTP could play an important
20
role in regulation of immune responses and that its extracellular domain
plays an active part (Nottebaum et al, 2008). However, the molecular basis
of the association between VE-PTP and VE-cadherin in live cells has not yet
been defined.
1.4 Fibronectin and FN type III-like domain To date the role of the extracellular domain of the R3 PTPs remains unclear.
However, perhaps some light can be shed from a study on a key adhesion
protein fibronectin (FN) found in the blood, interstitial extracellular matrix
(ECM) and pericellular matrix. Fibronectin is a high molecular weight tandem
modular glycoprotein consisting of individually folded functional domains
termed type I, II and III repeats (Figure 6). Fibronectin provides a substrate
for cell anchorage and serves as a regulatory protein in processes such as
cell adhesion, motility, differentiation and proliferation (Gao et al, 2003). The
modular fibronectin (FN) domains function by binding to other molecules and
by acting as spacers separating and orienting other domains of the protein
(Carr et al, 1997). Two intramolecular disulfide bonds form within each type I
and type II module to stabilise the folded structure (Singh et al, 2010).
Individual FNIII modules have been proposed to unfold on mechanical
stretching of fibronectin protein, providing for the elasticity of FN fibrils, which
is believed to expose buried binding sites (also known as cryptic sites) that,
for example, serve as nucleation sites for the assembly of FN into its fibrillar
form (Gao et al, 2003). Fibronectin III motifs comprise 90-100 amino acids
characterised by highly conserved hydrophobic residues (Brady-Kalnay and
Tonks, 1995). These domains are composed of seven antiparallel β strands
denoted A, B, C, C′, E, F, G, arranged into two sheets (Figure 6) (Carr et al,
1997). As a study by Martino et al (2010) showed, FN bind a wide range of
growth factors (GFs) from different families, e.g. platelet-derived growth
factor (PDGF) family, fibroblast growth factor (FGF) family and insulin-like
growth factor (IGF) family. Some of these molecules bind to a heparin-
binding domain II of the FN consisting of the 12th to 14th type III repeats
(FNIII12-14) and others bind to the full-length FN with the exact binding
21
location yet to be identified. In addition there was some evidence that the
neurotrophins NT-3 and BDNF, hepatocyte growth factor (HGF) and
connective tissue growth factor (CTGF) also bind to FNIII12-14 with a high
affinity (Martino et al, 2010). The physiological role of these interactions still
needs to be investigated in the context of each GF and potentially they could
play a role during development and tissue repair (Martino et al, 2010). In
addition it was shown that the tenth FN-III domain of fibronectin contains the
cell-adhesive triplet Arg-Gly-Asp (RGD loop) sequence, which is known to
interact with integrins, and the residues outside this loop provide specificity
and high affinity for each integrin-ligand pair (Carr et al, 1997; Takagi, 2003).
A member of the integrin family α5β1 interacts with FNIII through RGD motif,
mediating FN fibril formation and governing extracellular matrix assembly
(Figure 6). This interaction was shown to be essential for vertebrate
development (Takagi, 2004). However, none of the FN type III-like domains
of R3 RPTP members has an RGD sequence but instead an XGD (where X
represents any amino acid; G – glycine and D – aspartic acid) sequence was
found on the expected loop in five FN type III-like domains of DEP-1, through
which DEP-1 could play an important role in cell-cell interactions (Ostman et
al, 1994).
22
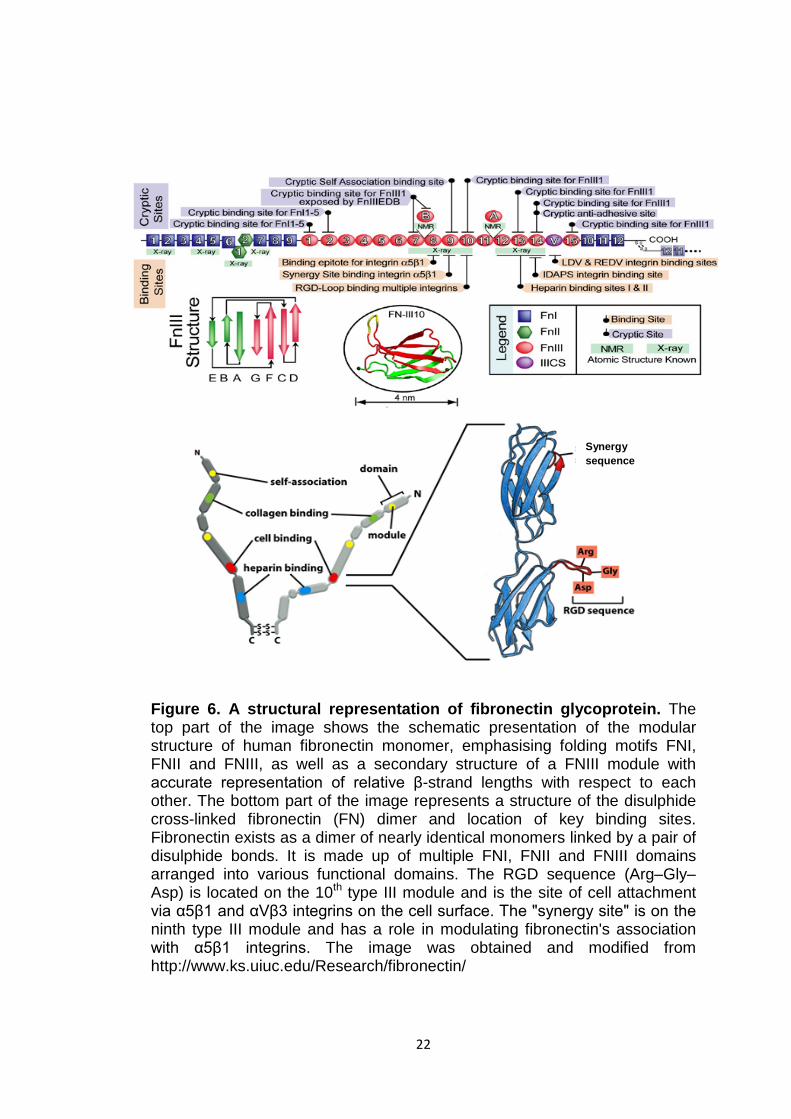
Figure 6. A structural representation of fibronectin glycoprotein. The top part of the image shows the schematic presentation of the modular structure of human fibronectin monomer, emphasising folding motifs FNI, FNII and FNIII, as well as a secondary structure of a FNIII module with accurate representation of relative β-strand lengths with respect to each other. The bottom part of the image represents a structure of the disulphide cross-linked fibronectin (FN) dimer and location of key binding sites. Fibronectin exists as a dimer of nearly identical monomers linked by a pair of disulphide bonds. It is made up of multiple FNI, FNII and FNIII domains arranged into various functional domains. The RGD sequence (Arg–Gly–Asp) is located on the 10th type III module and is the site of cell attachment via α5β1 and αVβ3 integrins on the cell surface. The "synergy site" is on the ninth type III module and has a role in modulating fibronectin's association with α5β1 integrins. The image was obtained and modified from http://www.ks.uiuc.edu/Research/fibronectin/
Synergy sequence
23
1.5 Regulation of R3 RPTPs
A family of enzymes that play a crucial role in the regulation of cell signalling
and the fundamental cellular processes, such as cell migration, proliferation
and differentiation, must be tightly controlled in vivo by some regulatory
mechanisms. It is essential that tyrosine phosphorylation mediated by PTKs
and dephosphorylation mediated by PTPs are fine-tuned since these two
families of enzymes have important roles in diseases like cancer and
diabetes.
1.5.1 Regulation by reversible oxidation
Recently it became apparent that reversible oxidation is one of the important
regulators of RPTPs. Most RPTPs contain two conserved cytoplasmic PTP
domains: D1, which contains most, if not all, catalytic activity, and D2, which
has a regulatory role. Due to their microenvironment, the catalytic cysteines
have a low pKa. Under normal conditions the active site cysteines are in the
thiolate anion form and thus are highly susceptible to oxidation. Some
studies show that reactive oxygen species (ROS), the production of which is
induced by stimuli such as ultraviolet (UV) light and cytokines, oxidise the
essential active site nucleophilic cysteine residue, located in the HC(X)5
signature motif, in PTPs, inactivating them (Tonks, 2006). For example,
hydrogen peroxide (H2O2) produced in response to epidermal growth factor
(EGF) has been shown to oxidise PTP1B’s catalytic site cysteine to sulfenic
acid, causing reversible inactivation (Lee et al, 1998; Mahadev et al, 2001).
This process shifts the equilibrium between the actions of protein tyrosine
kinases and protein tyrosine phosphatases towards phosphorylation,
activating signal transduction pathways (Lee et al, 1998). A study by Krejsa
et al (1997) showed that CD45 RPTP is also inactivated by intracellular
oxidation induced by vanadium PTP inhibitors and this inactivation led to the
activation of kinase signalling cascades. However, it was also shown that not
all the PTPs are equally sensitive to oxidation. Based on studies of RPTPα,
the D2 domain displays greater sensitivity to oxidation than the D1 domain,
24
suggesting that PTPs containing only the D1 domain might be less sensitive
to oxidation (den Hertog et al, 2008).
1.5.2 Regulation by ligand-binding
RPTPs could be regulated by various mechanisms and perhaps there is
more than one way to regulate the same RPTP. The extracellular domains of
PTPs are typically large, highly glycosylated, structurally diverse and
evolutionarily conserved, suggesting their roles in the regulation of PTP
function. Recent studies have defined some RPTPs through which signal
transduction may be regulated by ligand-controlled dephosphorylation of
tyrosyl residues in proteins. One such RPTP is a cell-adhesion-molecule-like
RPTP leukocyte common antigen related (LAR). The activity of this protein
was shown to be controlled by ligand binding. A high-affinity interaction
between LAR and its ligand transmembrane protein syndecan (Sdc) results
in promotion of LAR’s function, whereas the binding of the
glycosylphosphatidylinositol-anchored protein Dallylike (Dlp) to LAR
suppresses its activity (Tonks, 2006). The activity of RPTPζ was also shown
to be regulated by ligand-binding. It has been demonstrated that a secreted
growth factor pleiotrophin (PTN) directly binds to and inactivates the catalytic
activity of RPTPζ, resulting in inability to dephosphorylate β-catenin and,
thus, an increased phosphorylation of β-catenin and the subsequent loss of
contact inhibition, cell adhesion and the destruction of cytoskeletal
architecture (Meng et al, 2000). Despite different regulatory mechanisms
being identified, the mechanisms regulating R3 RPTPs activity remain
undefined. Although the extracellular ligand interactions were proposed to
be one of the regulatory mechanisms the strong evidence for such regulation
for R3 RPTPs has not yet been provided. Potential ligand proteins have been
identified for only a limited number of RPTPs.
25
1.5.3 Regulation by dimerisation
The catalytic activity of some PTPs has been shown to be affected by
dimerisation. Unlike with PTKs PTPs are believed to be inactivated by
dimerisation. The artificial induction of dimerisation for CD45, RPTPα and
DEP-1 clearly affected their enzymatic activity (Noordman et al, 2008). Some
evidence suggests that the ligand-induced oligomerisation of CD148 (DEP-1;
PTPRJ) could be a potential mechanism to regulate this protein and that the
extracellular domain plays a crucial role. The observations by Takahashi et al
(2006) showed that the role of CD148 in endothelial vessel formation and in
cell-growth control was inhibited in the presence of a bivalent monoclonal
antibody (Ab1), generated against the extracellular domain sequence of
CD148. It was demonstrated that bivalent but not monovalent Ab1 inhibits
endothelial cell-growth and angiogenesis. Therefore these findings
demonstrate that the activity of CD148 can be potentially regulated by
extracellular domain oligomerisation (Takahashi et al, 2006). This is an
important discovery implying that CD148 could serve as a molecular target
for antiangiogenesis therapy, which could be forced to oligomerise and, thus,
be activated by a synthetically generated agonist.
However, whether dimerisation is a general regulatory mechanism of RPTPs
is still a subject to debate. The dimerisation of R3 RPTPS is poorly
understood and whether this dimerisation is related to the binding of
extracellular ligands remains unclear. It has been shown that the activity of
RPTPs is inhibited by ligand-induced dimerisation (Tonks, 2006). Although a
study by Barr et al (2009) demonstrated that the members of R3 PTPs exist
as monomers in solution, the dimerisation may still occur in vivo as a result
of ligand binding to the extracellular domain. A contradictory study by Walchli
et al (2005) showed that SAP-1 enzymes form homodimers and this
dimerisation is mediated by the extracellular domains. It was also
demonstrated that the monomeric form of SAP-1 is significantly more active
than the dimeric one (Walchli et al, 2005). On the other hand, the same study
by Walchli et al (2005) showed no dimerisation of VE-PTP and DEP1 when
tested in parallel with SAP-1. The mechanism of ligand-induced dimerisation
was obtained only for RPTPα and CD48, where N-terminal helix-turn-helix
26
wedge motif occludes the active site of the partner domain (Barr et al, 2009;
Tonks, 2006). However, such a model of dimerisation-induced RPTP
inhibition prompted by these findings cannot be extrapolated to other
members of the RPTP family because the residues that occlude the active
site of RPTPα and CD48 are poorly conserved among other RPTPs
(Takahashi et al, 2006; Barr et al, 2009). It has been now shown that
GLEPP1 could exist as a dimer in living cells and this dimerisation is partly
regulated by disulphide linkages (Hower et al, 2009). Interestingly the
presence of nerve growth factor (NGF) increases dimerisation of GLEPP1 by
nearly twofold. In addition the catalytic domain of this enzyme is not involved
in dimerisation whereas the extracellular domain and probably the
transmembrane domain may play a role in the dimerisation. The dimerisation
of GLEPP1 appeared to result in a strong decrease in its intrinsic activity
(Hower et al, 2009).
Deregulation of R3 RPTPs’ activity that results in either loss or gain of
function contributes to the pathogenesis of human disease. For example, as
already mentioned above, VE-PTP was shown to be an important
component of the VE-cadherin-plakoglobin complex, required for the
maintenance of the endothelial barrier function. VE-PTP seems to enhance
plakoglobin/VE-cadherin association, suggesting that plakoglobin could be a
substrate for the VE-PTP. Knocking down VE-PTP expression by RNA
interference resulted in increased diepedesis of leukocytes, which
demonstrates that the deregulation of VE-PTP leads to an increased
inflammatory response. During inflammatory stimuli, leukocytes cause a
disruption of VE-PTP/VE-cadherin association, destabilising endothelial
contacts (Nottebaum et al, 2008). Therefore VE-PTP represents a novel
therapeutic target for the treatment of inflammatory diseases. Because the
selective suppression of the activity of R3 RPTPs can be essential in cells, it
is important to understand how the inhibition of activity of these enzymes is
regulated by dimerisation and whether this dimerisation is induced by
ligands. This knowledge will shed more light on mechanisms of function and
regulation of these enzymes and will help to develop novel molecular targets
27
for the development of medicinal reagents that possess distinct modes of
action.
1.6 Membrane protein interaction technologies
Different methods have been developed to investigate membrane protein-
protein interactions, such as bioluminescence resonance energy transfer
(BRET) and fluorescence resonance energy transfer (FRET), which
represent valuable tools but are technically challenging. BRET and FRET
rely on the ability to capture fluorescent signals from the interactions of
labelled molecules and have been widely used to determine the
compartmentalisation and functional organisation of living cells as well as
protein-protein interactions and their movement inside cells (Sekar and
Periasamy, 2003). The mammalian-membrane two-hybrid (MaMTH) assay is
based on split-ubiquitin technique that can be used to detect dynamic and
stimulus-dependent protein-protein interactions in mammalian cells. One
protein of interest is fused to the C-terminal half of ubiquitin and a chimeric
transcription factor (TF) and the other is fused to the N-terminal half of
ubiquitin. If the two proteins of interest interact together the split halves
reconstitute functional ubiquitin protein, which is recognised by cytosolic
deubiquitinating enzymes, resulting in cleavage of the TF and expression of
a reporter gene, such as luciferase (Petschnigg et al, 2014). MaMTH assay
has been successfully applied to investigate stimulus-dependent interactions
of the wild-type as well as oncogenic variant of epidermal growth factor
receptor (Petschnigg et al, 2014). However, this assay has some limitations.
The activation of a reporter gene could be caused by an interaction of
proteins that are not being investigated, leading to false positive results.
Over-expression of proteins is common in transient transfections and it can
lead to non-relevant forced protein-protein interactions and self-activation of
the reporter gene by the bait protein, resulting in false positive results (Suter
et al, 2008). Receptor alkaline phosphatase (RAP) assay is another method
that can be used to identify potential extracellular binding ligands. This assay
can be carried out on endogenously expressed proteins without the risk of
over-expressing the proteins that could lead to false-positive results. This
28
method provides a direct indicator of extracellular domain binding and it is
heat stable and thus can be differentiated from the heat labile alkaline
phosphatases of most tissues. It is also useful when a reliable monoclonal
antibody is not available for the protein of interest (Stoker, 2005).
In this study the bimolecular fluorescence complementation (BiFC) assay
was chosen for the simple and direct visualisation of protein-protein
interactions in live cells with minimal perturbation of their normal
environment. The schematic representation of the BiFC assay is shown in
Figure 7. BiFC assay can provide information about the localisation of
protein-protein interactions and it has been used previously to investigate
membrane protein interactions. De Virgilio et al (2004) used this assay to
define successfully the interaction between integrin αIIbβ3 and protein
tyrosine kinases C-Src and Syk in live cells. Some techniques are used for
an initial screen for novel binding partners. The initial experiments on VE-
PTP and VE-cadherin interaction, as well as on R3 RPTP dimerisation
studies, have been carried out using affinity chromatography and co-
immunoprecipitation assays (Nawroth et al, 2002; Hower et al, 2009;
Takahashi et al, 2006). Co-immunoprecipitation provides an excellent
method to purify and identify multiprotein complexes. However, during cell
lysis the expressed tagged proteins could be present in a mixture of both
physiological and non-physiological targets and the latter could be
incorporated in the complex without any biological significance, especially if
they interact with high affinity and/or slow kinetics of dissociation and thus
more easily replacing the physiological targets (Berggård et al, 2007). In
contrast to co-immunoprecipitation assays BiFC can be used to detect
transient and modification-dependent protein-protein interactions.
29
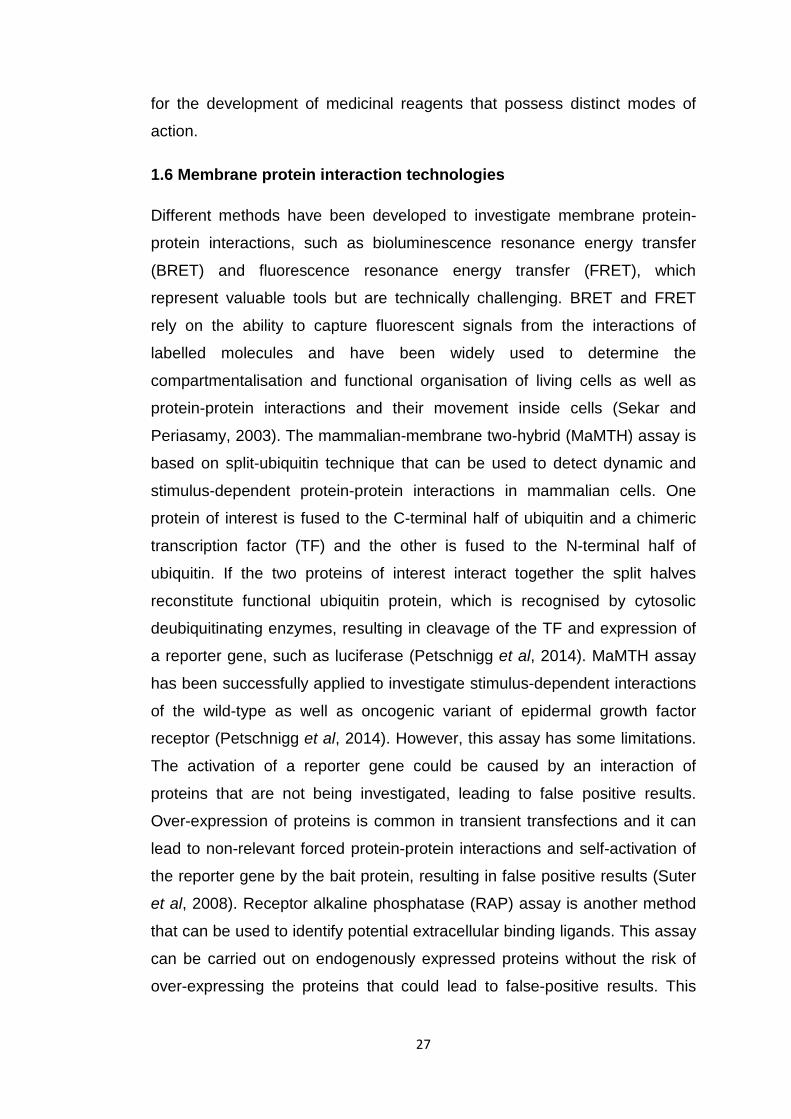
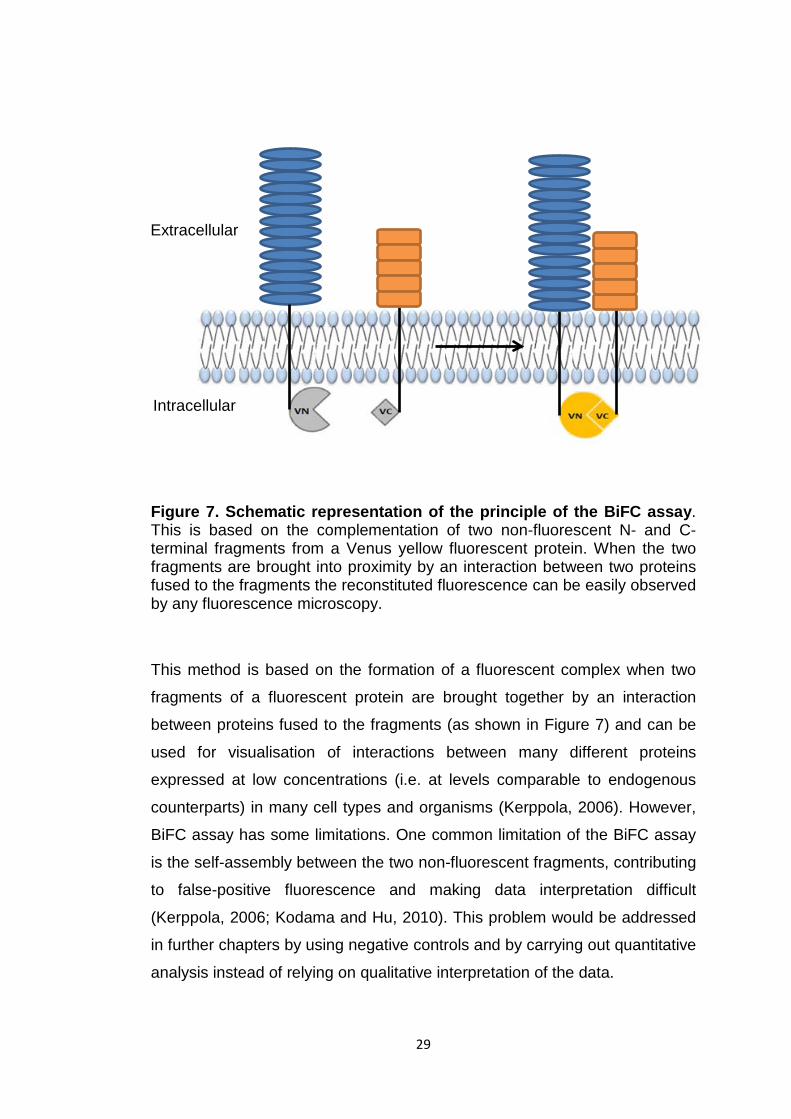
Figure 7. Schematic representation of the principle of the BiFC assay. This is based on the complementation of two non-fluorescent N- and C-terminal fragments from a Venus yellow fluorescent protein. When the two fragments are brought into proximity by an interaction between two proteins fused to the fragments the reconstituted fluorescence can be easily observed by any fluorescence microscopy.
This method is based on the formation of a fluorescent complex when two
fragments of a fluorescent protein are brought together by an interaction
between proteins fused to the fragments (as shown in Figure 7) and can be
used for visualisation of interactions between many different proteins
expressed at low concentrations (i.e. at levels comparable to endogenous
counterparts) in many cell types and organisms (Kerppola, 2006). However,
BiFC assay has some limitations. One common limitation of the BiFC assay
is the self-assembly between the two non-fluorescent fragments, contributing
to false-positive fluorescence and making data interpretation difficult
(Kerppola, 2006; Kodama and Hu, 2010). This problem would be addressed
in further chapters by using negative controls and by carrying out quantitative
analysis instead of relying on qualitative interpretation of the data.
Extracellular
Intracellular
30
1.7 Aims of the thesis
The identification of ligands for R3 PTPs and the mapping of their binding
sites on the extracellular domains of these enzymes will provide additional
information on their functions, mechanisms of function and, perhaps, may
provide tools to fine-tune the signalling pathways, mediated by these PTPs.
For that reason investigation of the functional role of the extracellular
domains of these proteins and identification of cognate ligands will be the
main focus of this research.
The initial aim of this project was to confirm the interaction between VE-PTP
and VE-cadherin via their extracellular domains in live cells as well as to
investigate the molecular basis of their interaction. The second aim was to
gain a better understanding of the role of R3 RPTP extracellular domains in
ligand-binding specificity. This was addressed by examining whether all the
members of R3 RPTP have the potential to interact with VE-cadherin via
their extracellular domains in live cells. Additionally the potential dimerisation
of the R3 RPTPs via their extracellular domains was investigated in live cells.
To address the aims of this thesis the bimolecular fluorescence
complementation (BiFC) assay was used, which was first developed and
validated with fusion proteins bJun and bFos that are known to interact. The
quantitative analyses were adapted and validated from previous studies to
obtain more robust data.

31
Chapter 2
Materials and Methods
32
Materials
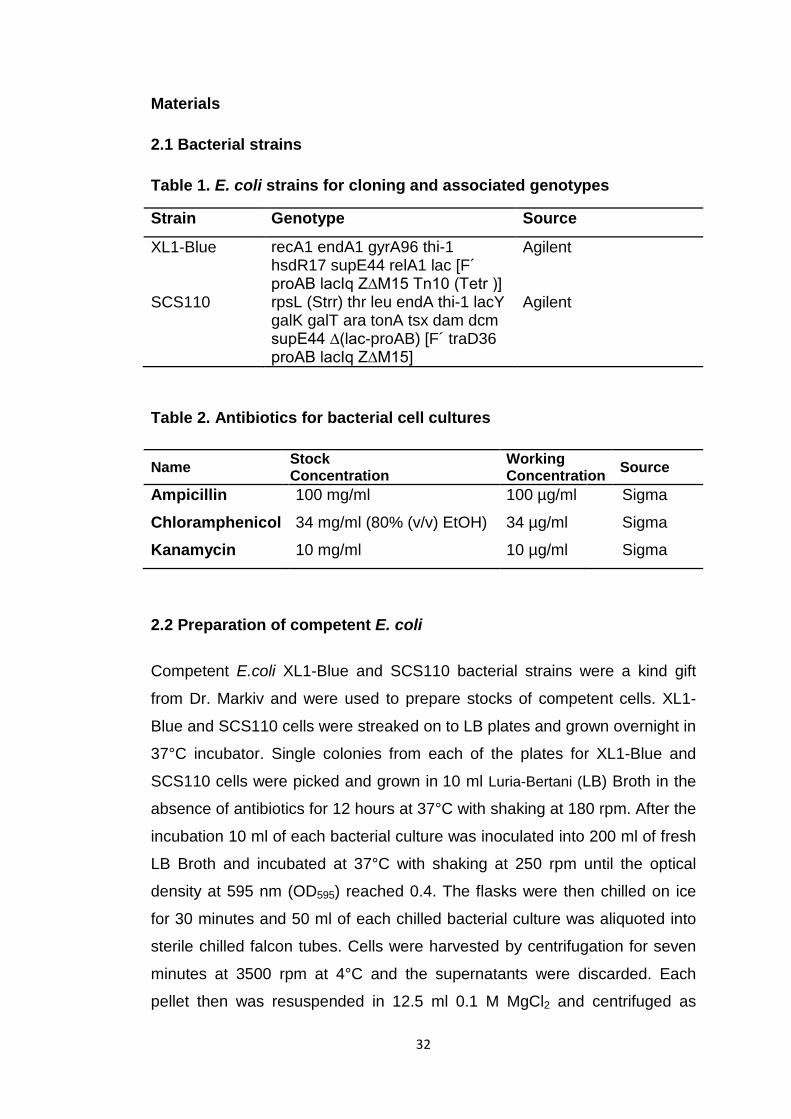
2.1 Bacterial strains
Table 1. E. coli strains for cloning and associated genotypes
Strain Genotype Source
XL1-Blue recA1 endA1 gyrA96 thi-1 hsdR17 supE44 relA1 lac [F´ proAB lacIq Z∆M15 Tn10 (Tetr )]
Agilent
SCS110 rpsL (Strr) thr leu endA thi-1 lacY galK galT ara tonA tsx dam dcm supE44 ∆(lac-proAB) [F´ traD36 proAB lacIq Z∆M15]
Agilent
Table 2. Antibiotics for bacterial cell cultures
Name Stock Concentration
Working Concentration Source
Ampicillin 100 mg/ml 100 µg/ml Sigma
Chloramphenicol Kanamycin
34 mg/ml (80% (v/v) EtOH)
10 mg/ml
34 µg/ml
10 µg/ml
Sigma
Sigma
2.2 Preparation of competent E. coli
Competent E.coli XL1-Blue and SCS110 bacterial strains were a kind gift
from Dr. Markiv and were used to prepare stocks of competent cells. XL1-
Blue and SCS110 cells were streaked on to LB plates and grown overnight in
37°C incubator. Single colonies from each of the plates for XL1-Blue and
SCS110 cells were picked and grown in 10 ml Luria-Bertani (LB) Broth in the
absence of antibiotics for 12 hours at 37°C with shaking at 180 rpm. After the
incubation 10 ml of each bacterial culture was inoculated into 200 ml of fresh
LB Broth and incubated at 37°C with shaking at 250 rpm until the optical
density at 595 nm (OD595) reached 0.4. The flasks were then chilled on ice
for 30 minutes and 50 ml of each chilled bacterial culture was aliquoted into
sterile chilled falcon tubes. Cells were harvested by centrifugation for seven
minutes at 3500 rpm at 4°C and the supernatants were discarded. Each
pellet then was resuspended in 12.5 ml 0.1 M MgCl2 and centrifuged as
33
previously. Supernatants were discarded and each pellet was resuspended
in 25 ml 0.1 M CaCl2. Resuspended cells were incubated on ice for 30
minutes, centrifuged as previously and the supernatants were discarded.
Each pellet was resuspended in 700 µl 0.1 M CaCl2 and 300 µl 50% (v/v)
glycerol and the 50 µl aliquots were stored at -80°C.
SCS110 competent cells were used when the DNA had to be digested with
methylation-sensitive restriction enzymes (e.g. ApaI and EcoRI) since these
cells lack DNA adenine methylation (dam) and DNA cytosine methylation
(dcm) genes.
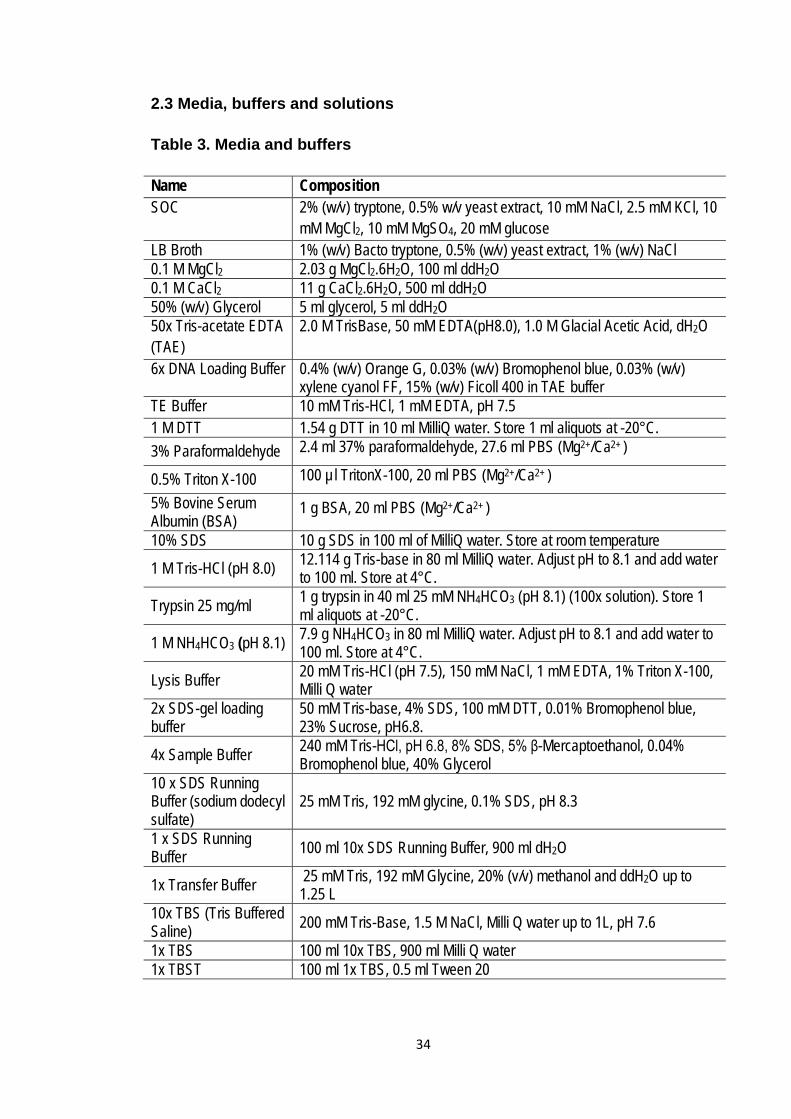
34
2.3 Media, buffers and solutions
Table 3. Media and buffers
Name Composition SOC 2% (w/v) tryptone, 0.5% w/v yeast extract, 10 mM NaCl, 2.5 mM KCl, 10
mM MgCl2, 10 mM MgSO4, 20 mM glucose LB Broth 1% (w/v) Bacto tryptone, 0.5% (w/v) yeast extract, 1% (w/v) NaCl 0.1 M MgCl2 2.03 g MgCl2.6H2O, 100 ml ddH2O 0.1 M CaCl2 11 g CaCl2.6H2O, 500 ml ddH2O 50% (w/v) Glycerol 5 ml glycerol, 5 ml ddH2O 50x Tris-acetate EDTA (TAE)
2.0 M TrisBase, 50 mM EDTA(pH8.0), 1.0 M Glacial Acetic Acid, dH2O
6x DNA Loading Buffer 0.4% (w/v) Orange G, 0.03% (w/v) Bromophenol blue, 0.03% (w/v) xylene cyanol FF, 15% (w/v) Ficoll 400 in TAE buffer
TE Buffer 10 mM Tris-HCl, 1 mM EDTA, pH 7.5 1 M DTT 1.54 g DTT in 10 ml MilliQ water. Store 1 ml aliquots at -20°C. 3% Paraformaldehyde 2.4 ml 37% paraformaldehyde, 27.6 ml PBS (Mg2+/Ca2+ )
0.5% Triton X-100 100 µl TritonX-100, 20 ml PBS (Mg2+/Ca2+ )
5% Bovine Serum Albumin (BSA)
1 g BSA, 20 ml PBS (Mg2+/Ca2+ )
10% SDS 10 g SDS in 100 ml of MilliQ water. Store at room temperature
1 M Tris-HCl (pH 8.0) 12.114 g Tris-base in 80 ml MilliQ water. Adjust pH to 8.1 and add water to 100 ml. Store at 4°C.
Trypsin 25 mg/ml 1 g trypsin in 40 ml 25 mM NH4HCO3 (pH 8.1) (100x solution). Store 1 ml aliquots at -20°C.
1 M NH4HCO3 (pH 8.1) 7.9 g NH4HCO3 in 80 ml MilliQ water. Adjust pH to 8.1 and add water to 100 ml. Store at 4°C.
Lysis Buffer 20 mM Tris-HCl (pH 7.5), 150 mM NaCl, 1 mM EDTA, 1% Triton X-100, Milli Q water
2x SDS-gel loading buffer
50 mM Tris-base, 4% SDS, 100 mM DTT, 0.01% Bromophenol blue, 23% Sucrose, pH6.8.
4x Sample Buffer 240 mM Tris-HCl, pH 6.8, 8% SDS, 5% β-Mercaptoethanol, 0.04% Bromophenol blue, 40% Glycerol
10 x SDS Running Buffer (sodium dodecyl sulfate)
25 mM Tris, 192 mM glycine, 0.1% SDS, pH 8.3
1 x SDS Running Buffer 100 ml 10x SDS Running Buffer, 900 ml dH2O
1x Transfer Buffer 25 mM Tris, 192 mM Glycine, 20% (v/v) methanol and ddH2O up to 1.25 L
10x TBS (Tris Buffered Saline) 200 mM Tris-Base, 1.5 M NaCl, Milli Q water up to 1L, pH 7.6
1x TBS 100 ml 10x TBS, 900 ml Milli Q water 1x TBST 100 ml 1x TBS, 0.5 ml Tween 20
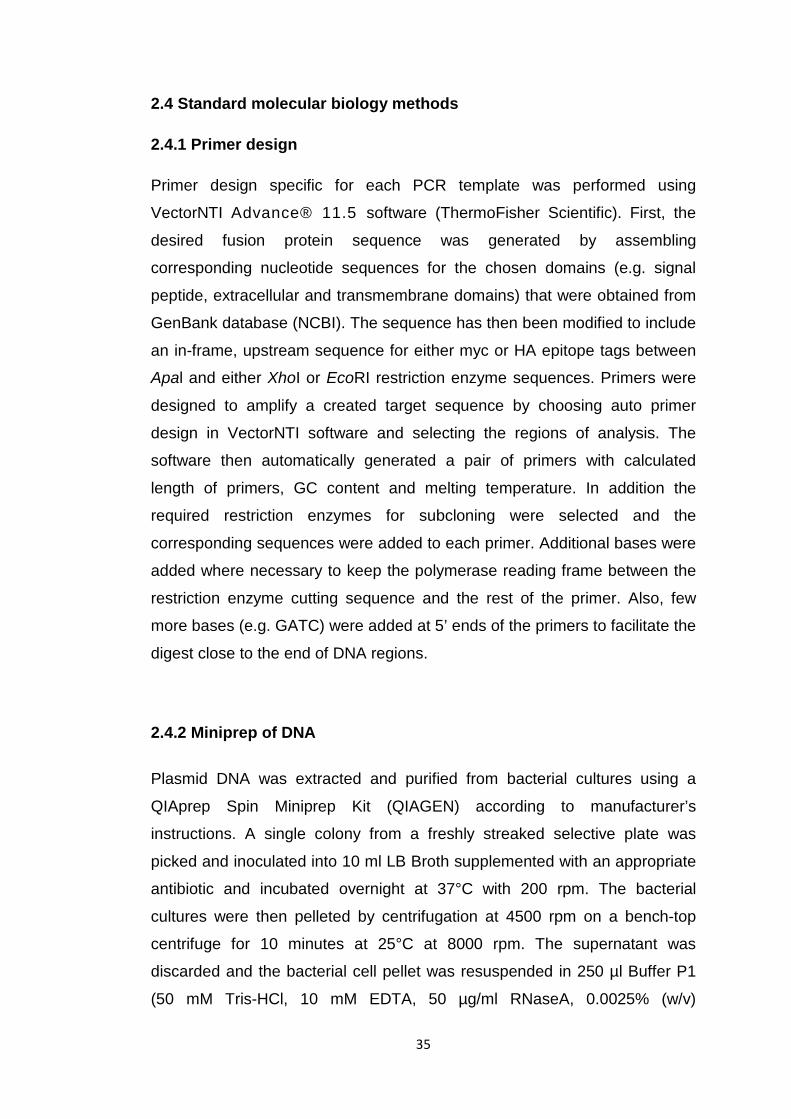
35
2.4 Standard molecular biology methods
2.4.1 Primer design
Primer design specific for each PCR template was performed using
VectorNTI Advance® 11.5 software (ThermoFisher Scientific). First, the
desired fusion protein sequence was generated by assembling
corresponding nucleotide sequences for the chosen domains (e.g. signal
peptide, extracellular and transmembrane domains) that were obtained from
GenBank database (NCBI). The sequence has then been modified to include
an in-frame, upstream sequence for either myc or HA epitope tags between
Apal and either XhoI or EcoRI restriction enzyme sequences. Primers were
designed to amplify a created target sequence by choosing auto primer
design in VectorNTI software and selecting the regions of analysis. The
software then automatically generated a pair of primers with calculated
length of primers, GC content and melting temperature. In addition the
required restriction enzymes for subcloning were selected and the
corresponding sequences were added to each primer. Additional bases were
added where necessary to keep the polymerase reading frame between the
restriction enzyme cutting sequence and the rest of the primer. Also, few
more bases (e.g. GATC) were added at 5’ ends of the primers to facilitate the
digest close to the end of DNA regions.
2.4.2 Miniprep of DNA
Plasmid DNA was extracted and purified from bacterial cultures using a
QIAprep Spin Miniprep Kit (QIAGEN) according to manufacturer’s
instructions. A single colony from a freshly streaked selective plate was
picked and inoculated into 10 ml LB Broth supplemented with an appropriate
antibiotic and incubated overnight at 37°C with 200 rpm. The bacterial
cultures were then pelleted by centrifugation at 4500 rpm on a bench-top
centrifuge for 10 minutes at 25°C at 8000 rpm. The supernatant was
discarded and the bacterial cell pellet was resuspended in 250 µl Buffer P1
(50 mM Tris-HCl, 10 mM EDTA, 50 µg/ml RNaseA, 0.0025% (w/v)
36
thymolphtalein, pH 8.0) and transferred to a sterile 1.5 ml microcentrifuge
tube. To lyse the cells 250 µl Buffer P2 (0.2 M NaOH, 1% (w/v) SDS) was
added, mixed thoroughly by inverting the tube 4-6 times until the solution
became clear (or blue if using thymolphtalein) and incubated at room
temperature for up to 5 minutes. To neutralise the lysis buffer 350 µl Buffer
N3 was added and mixed immediately and thoroughly by inverting the tube
4-6 times. The solution of lysed cells was then centrifuged for 10 minutes at
13000 rpm in a table-top microcentrifuge to precipitate the cell membrane,
proteins and genomic DNA. The supernatant containing soluble plasmid
DNA was applied to the QIAprep spin column by pipetting and centrifuged for
1 minute at 13000 rpm, discarding the flow-through. The QIAprep spin
column was then washed by adding 0.5 ml Buffer PB (5 M guanidine
hydrochloride, 20 mM Tris-HCl, 38% (v/v) ethanol, pH 6.6) and centrifuged
for 1 minute at 13000 rpm, discarding the flow-through. The QIAprep spin
column was washed again by adding 0.75 ml Buffer PE (20 mM NaCl, 2 mM
Tris-HCl, 80% (v/v) ethanol, pH 7.5) and centrifuged for 1 minute at 13000
rpm, discarding the flow-through. To remove residual wash buffer the
QIAprep spin column was centrifuged for additional 2 minutes at 13000 rpm.
To elute DNA the QIAprep column was placed in a clean 1.5 ml
microcentrifuge tube, 50 µl Buffer EB (10 mM Tris-Cl, pH 8.5) was added to
the centre of the QIAprep spin column and allowed to stand for 1-2 minutes
before centrifuging for 1 minute at 13000 rpm. The concentration and purity
of the extracted DNA were assessed using a Nanodrop 1000 (Thermo
Scientific) at 260 nm and 280 nm.
2.4.3 PCR of constructs and reaction conditions
The polymerase chain reaction (PCR) was used to amplify the coding
sequences for extracellular and transmembrane domains (ECD+TM) for the
R3 RPTPs, VE-cadherin and sialophorin (SPN). The details of constructs,
their amplified regions and the PCR conditions are provided in Table 4. The
primers used to amplify the desired regions are listed in Table 6. PCR
amplification was performed using Platinum Pfx DNA Polymerase
(Invitrogen) according to manufacturer’s instructions. Reactions were carried
37
out using BioRad MJ Mini thermal cycler. The thermocycler programs were
customised for each target sequence based on gene length and primer
optimal melting temperature (refer to Table 10). The dNTP mixture (10 µl of
each NTP) was obtained by mixing 1 M stock solutions for each nucleotide
(New England Biolabs) in the appropriate dilution. Master mix for each PCR
reaction was prepared, using 5 µM of each primer, 10 mM dNTP mixture and
2.5 ng/µl DNA template in a final volume of 20 µl in a thin-walled PCR tubes
(ThermoFisher Scientific). PCR products were resolved on an agarose gel
the DNA fragments were detected using a UV Transilluminator (Ultra-Violet
Ltd.) as described in section 2.4.4.
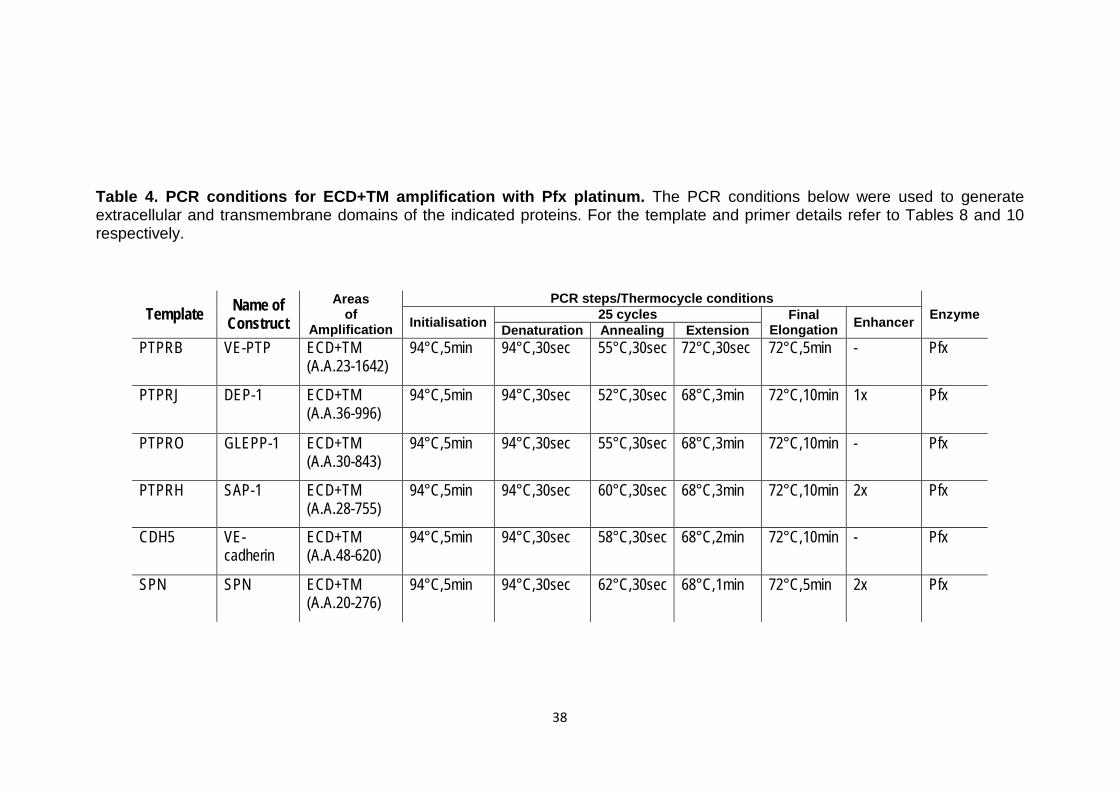
38
Table 4. PCR conditions for ECD+TM amplification with Pfx platinum. The PCR conditions below were used to generate extracellular and transmembrane domains of the indicated proteins. For the template and primer details refer to Tables 8 and 10 respectively.
Template Name of Construct
Areas of
Amplification
PCR steps/Thermocycle conditions Enzyme Initialisation 25 cycles Final
Elongation Enhancer Denaturation Annealing Extension PTPRB VE-PTP ECD+TM
(A.A.23-1642) 94°C,5min 94°C,30sec 55°C,30sec 72°C,30sec 72°C,5min - Pfx
PTPRJ DEP-1 ECD+TM (A.A.36-996)
94°C,5min 94°C,30sec 52°C,30sec 68°C,3min 72°C,10min 1x Pfx
PTPRO GLEPP-1 ECD+TM (A.A.30-843)
94°C,5min 94°C,30sec 55°C,30sec 68°C,3min 72°C,10min - Pfx
PTPRH SAP-1 ECD+TM (A.A.28-755)
94°C,5min 94°C,30sec 60°C,30sec 68°C,3min 72°C,10min 2x Pfx
CDH5 VE-cadherin
ECD+TM (A.A.48-620)
94°C,5min 94°C,30sec 58°C,30sec 68°C,2min 72°C,10min - Pfx
SPN SPN ECD+TM (A.A.20-276)
94°C,5min 94°C,30sec 62°C,30sec 68°C,1min 72°C,5min 2x Pfx
39
2.4.4 Agarose Gel Electrophoresis
Agarose gel electrophoresis was used for visualisation and purification of
DNA. Agarose gels were commonly used in concentrations of 0.7% to 1.0%
w/v depending on the size of bands needed to be separated. The appropriate
amount of agarose powder was measured out and placed into a
microwavable flask with 100 ml of 1x TAE (Tris-acetate-EDTA) Buffer. The
resulting solution was then microwaved for 1-2 minutes or until the agarose
was completely dissolved. The dissolved agarose was allowed to cool down
for 5 minutes at room temperature until it was comfortable to handle the flask
and 1 µl SYBR® Safe DNA gel stain (Thermo Fisher Scientific) was then
added that binds to DNA and allows visualisation under UV light. The
agarose was poured into a gel tray with the well comb in place and was left
to set at room temperature for 15-20 minutes until it had completely
solidified. The well comb was removed and solidified agarose was placed
into the electrophoresis unit, which was then filled with 1x TAE Buffer.
A molecular weight 1 Kb Plus DNA ladder (Thermo Fisher Scientific) and
DNA samples were mixed with 6x Gel Loading Dye Purple (New England
Biolabs) at a volume ratio of 5:1 and carefully loaded into the wells of the gel.
Electrophoresis was set to run at 110 V constant for 30-45 minutes until the
dye line was approximately 75-80% of the way down the gel.
The DNA fragments were detected using a UV Transilluminator (Ultra-Violet
Ltd.) with short wavelength UV light of 200-280 nm. Long wavelength UV
light of 315-400 nm was used to analyse the gel of the DNA that was used
for cloning or sequencing.
40
2.4.5 Purification of DNA from agarose gels
To purify the DNA from the agarose gel the QIAquick gel extraction kit
(Qiagen Ltd.) was used according to the manufacturer’s recommendations.
The DNA bands of the desired size were excised with a clean scalpel,
weighed and solubilised at 50°C for 10 minutes with three volumes of Buffer
QG (5.5 M Guanidine thiocyanate, 20 mM Tris-HCl, 0.0025% (w/v) Cresol
Red, pH 6.6) to one volume of excised gel. One gel volume of isopropanol
was added to the sample and mixed thoroughly to increase the yield of DNA
fragments. To bind the DNA the sample was applied to the QIAquick column
and centrifuged for one minute at 14000 rpm. To remove all traces of
agarose, the flow-through was discarded and the QIAquick column was put
back in the same collection tube, adding 0.5 ml of Buffer QG and centrifuging
for one minute at 14000 rpm. To wash the column 0.75 ml of Buffer PE was
added to QIAquick column and centrifuged for one minute at same speed,
discarding the flow-through and centrifuging for further one minute at 10,000
rpm to remove all the traces of ethanol. To elute the DNA the QIAquick
column was placed into a clean 1.5 ml microcentrifuge tube, adding 30 µl of
Buffer EB (10 mM Tris·HCl, pH 8.5) and incubating for 2 minutes at room
temperature, following by centrifugation for one minute at 14000 rpm. The
concentration and purity of the extracted DNA were assessed using a
Nanodrop 1000 (Thermo Scientific) at 260 nm and 280 nm. The purified DNA
was stored at -20°C until further use.
2.4.6 Purification of DNA from PCR
DNA from the PCR reaction mixture was purified using the QIAquick DNA
purification kit (Qiagen Ltd.) according to the manufacturer’s
recommendations. In short, five volumes of Buffer PB were added to one
volume of the PCR reaction, mixed thoroughly and the pH was adjusted by
adding 10 μl 3 M sodium acetate (or until the colour of the mixture turned
yellow). To bind the DNA the resulting mixture was applied to the QIAquick
column inserted into a collection tube that was spun for one minute at 14000
41
rpm. The flow-through was discarded and the QIAquick column was placed
back in the same collection tube. To wash the column, 0.75 ml of Buffer PE
was added to the QIAquick column and spun for one minute at 14000 rpm.
The flow-through was discarded and the column was spun again for one
minute to remove residual wash buffer. The QIAquick column with bound
DNA was then placed in a sterile 1.5 ml microcentrifuge tube. To elute DNA,
30 µl Buffer EB (10 mM Tris·HCl, pH 8.5) was added to the centre of the
QIAquick column and was allowed to stand for two minutes at room
temperature in order to increase DNA concentration and then spun for one
minute at 14,000 rpm. The concentration and A260/A280 purity ratio were
assessed using a NanoDrop Lite (Thermo Scientific). The purified DNA was
stored at -20°C until further use.
2.4.7 Restriction enzyme digest
Restriction enzyme digestion was used as part of the molecular cloning
procedure to generate BiFC constructs. All restriction enzymes used in this
project were purchased from New England Biolab (NEB) and used according
to manufacturer’s instructions. Information of restriction enzymes and
experimental conditions used for the generation of each BiFC construct is
provided in Table 5. The DNA samples and vectors were digested with 1.0 µl
of the appropriate restriction enzyme in a final volume of 50 µl to create
complementary sticky-ends for ligation. Double digest was done sequentially
if the buffer and/or incubation temperature for restriction enzymes were not
compatible (as indicated in Table 5).
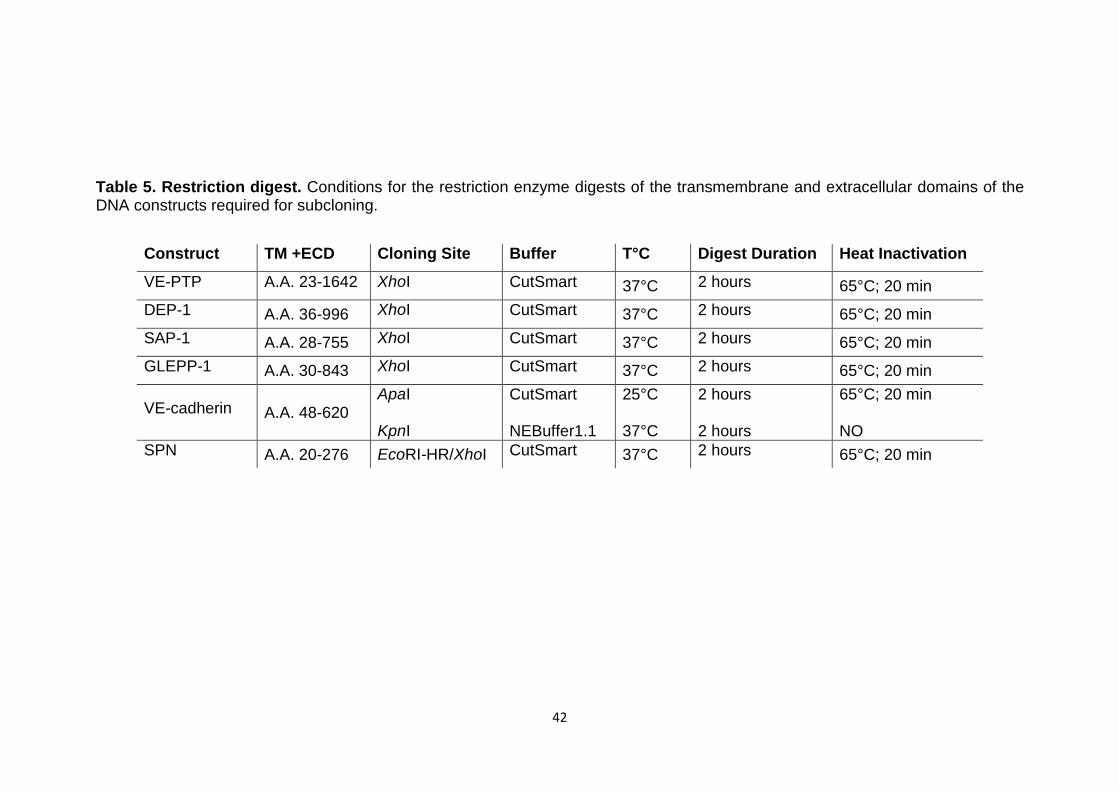
42
Table 5. Restriction digest. Conditions for the restriction enzyme digests of the transmembrane and extracellular domains of the DNA constructs required for subcloning.
Construct TM +ECD Cloning Site Buffer T°C Digest Duration Heat Inactivation
VE-PTP A.A. 23-1642 XhoI CutSmart 37°C 2 hours 65°C; 20 min DEP-1 A.A. 36-996 XhoI CutSmart 37°C 2 hours 65°C; 20 min SAP-1 A.A. 28-755 XhoI CutSmart 37°C 2 hours 65°C; 20 min GLEPP-1 A.A. 30-843 XhoI CutSmart 37°C 2 hours 65°C; 20 min
VE-cadherin A.A. 48-620 ApaI KpnI
CutSmart NEBuffer1.1
25°C 37°C
2 hours 2 hours
65°C; 20 min NO
SPN A.A. 20-276 EcoRI-HR/XhoI CutSmart 37°C 2 hours 65°C; 20 min
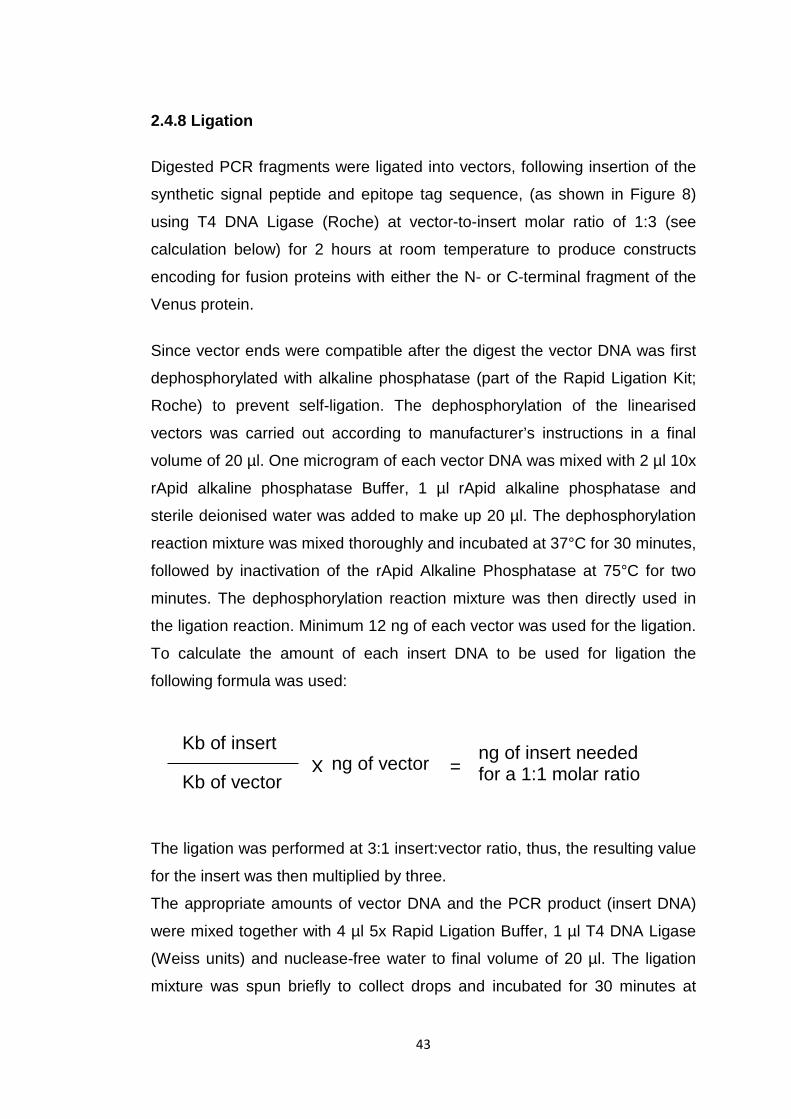
43
2.4.8 Ligation
Digested PCR fragments were ligated into vectors, following insertion of the
synthetic signal peptide and epitope tag sequence, (as shown in Figure 8)
using T4 DNA Ligase (Roche) at vector-to-insert molar ratio of 1:3 (see
calculation below) for 2 hours at room temperature to produce constructs
encoding for fusion proteins with either the N- or C-terminal fragment of the
Venus protein.
Since vector ends were compatible after the digest the vector DNA was first
dephosphorylated with alkaline phosphatase (part of the Rapid Ligation Kit;
Roche) to prevent self-ligation. The dephosphorylation of the linearised
vectors was carried out according to manufacturer’s instructions in a final
volume of 20 µl. One microgram of each vector DNA was mixed with 2 µl 10x
rApid alkaline phosphatase Buffer, 1 µl rApid alkaline phosphatase and
sterile deionised water was added to make up 20 µl. The dephosphorylation
reaction mixture was mixed thoroughly and incubated at 37°C for 30 minutes,
followed by inactivation of the rApid Alkaline Phosphatase at 75°C for two
minutes. The dephosphorylation reaction mixture was then directly used in
the ligation reaction. Minimum 12 ng of each vector was used for the ligation.
To calculate the amount of each insert DNA to be used for ligation the
following formula was used:
The ligation was performed at 3:1 insert:vector ratio, thus, the resulting value
for the insert was then multiplied by three.
The appropriate amounts of vector DNA and the PCR product (insert DNA)
were mixed together with 4 µl 5x Rapid Ligation Buffer, 1 µl T4 DNA Ligase
(Weiss units) and nuclease-free water to final volume of 20 µl. The ligation
mixture was spun briefly to collect drops and incubated for 30 minutes at
Kb of insert
Kb of vector X ng of vector =
ng of insert needed for a 1:1 molar ratio
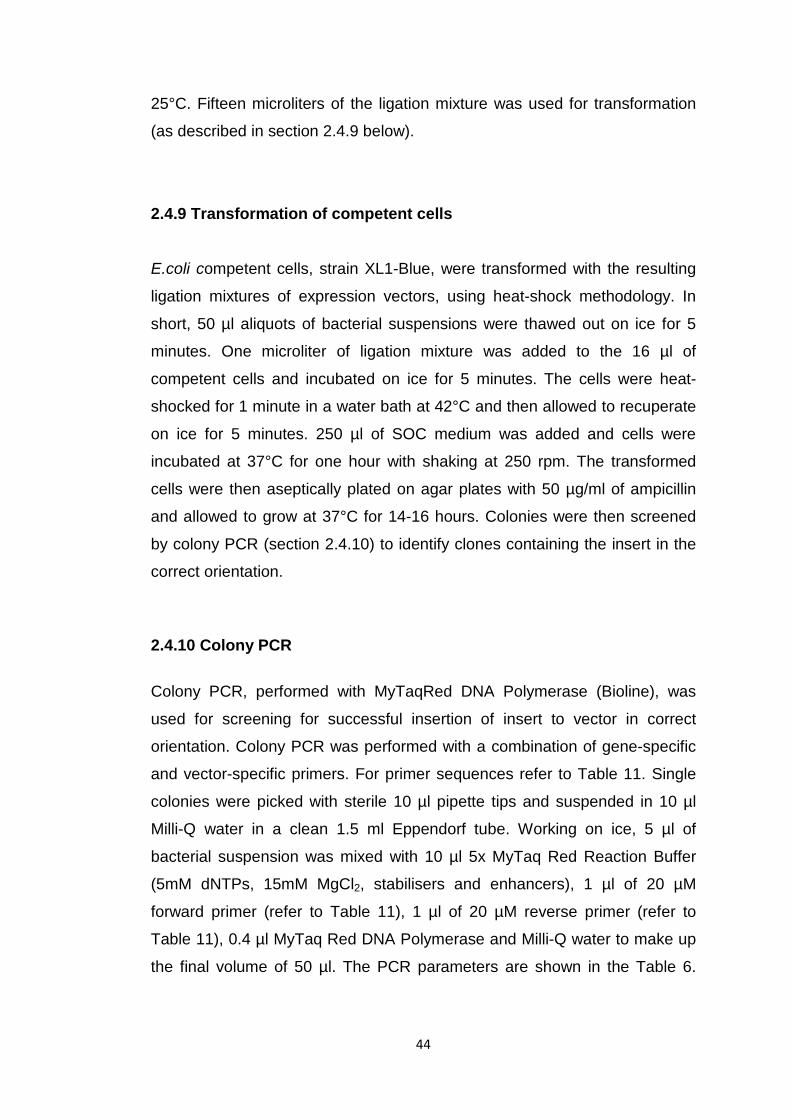
44
25°C. Fifteen microliters of the ligation mixture was used for transformation
(as described in section 2.4.9 below).
2.4.9 Transformation of competent cells E.coli competent cells, strain XL1-Blue, were transformed with the resulting
ligation mixtures of expression vectors, using heat-shock methodology. In
short, 50 µl aliquots of bacterial suspensions were thawed out on ice for 5
minutes. One microliter of ligation mixture was added to the 16 µl of
competent cells and incubated on ice for 5 minutes. The cells were heat-
shocked for 1 minute in a water bath at 42°C and then allowed to recuperate
on ice for 5 minutes. 250 µl of SOC medium was added and cells were
incubated at 37°C for one hour with shaking at 250 rpm. The transformed
cells were then aseptically plated on agar plates with 50 µg/ml of ampicillin
and allowed to grow at 37°C for 14-16 hours. Colonies were then screened
by colony PCR (section 2.4.10) to identify clones containing the insert in the
correct orientation.
2.4.10 Colony PCR
Colony PCR, performed with MyTaqRed DNA Polymerase (Bioline), was
used for screening for successful insertion of insert to vector in correct
orientation. Colony PCR was performed with a combination of gene-specific
and vector-specific primers. For primer sequences refer to Table 11. Single
colonies were picked with sterile 10 µl pipette tips and suspended in 10 µl
Milli-Q water in a clean 1.5 ml Eppendorf tube. Working on ice, 5 µl of
bacterial suspension was mixed with 10 µl 5x MyTaq Red Reaction Buffer
(5mM dNTPs, 15mM MgCl2, stabilisers and enhancers), 1 µl of 20 µM
forward primer (refer to Table 11), 1 µl of 20 µM reverse primer (refer to
Table 11), 0.4 µl MyTaq Red DNA Polymerase and Milli-Q water to make up
the final volume of 50 µl. The PCR parameters are shown in the Table 6.
45
Table 6. The PCR parameters for colony PCR. The PCR parameters used for colony PCR to screen for successful transformations.
Colonies that produced positive results were then used to inoculate 10 ml LB
Broth supplemented with 100 µg/ml of ampicillin and incubated overnight at
37°C with shaking at 200 rpm. Putative positive colonies were then pelleted
by centrifugation at 4500 rpm in a bench-top centrifuge for 10 minutes at
25°C. Plasmid DNA was subsequently purified from the harvested pellet as
described above in section 2.4.2 and then sequenced by GATC Biotech. The
sequenced DNA was aligned with the template sequence in VectorNTI
software by ContigExpress assembly.
2.4.11 Purification of high yields of plasmid DNA for transfection
The correct sequenced constructs were used to generate a high yield of
plasmid DNA with high purity suitable for mammalian cell transfections. The
required miniprepped plasmid DNA was used to transform competent XL1-
Blue bacterial cells, using the same experimental procedure as described in
section 2.4.9. After the incubation a single colony was picked and suspended
Step Temperature Time Cycles
Initial denaturation 95°C 1 min 1
Denaturation 95°C 15 s
25 Annealing 55°C 15 s
Extension 72°C 30 s
Final extension 72°C 5 min 1
46
in 10 ml sterile LB Broth supplemented with 100 µg/ml ampicillin and
incubated for 8 hours at 37°C at 200 rpm. After the incubation period 1 ml of
the bacterial culture was added to 100 ml sterile LB Broth supplemented with
100 µg/ml ampicillin and incubated for 12 hours at 37°C at 200 rpm. Plasmid
DNA was extracted and purified using QIAprep Spin Midiprep Kit (QIAGEN)
as described in section 2.5.1. The overnight bacterial culture was harvested
by centrifuging at 6000 g for 15 minutes at 4°C. The bacterial pellet was
resuspended in 4 ml Buffer P1. To lyse the bacterial cells 4 ml Buffer P2 was
added, mixed thoroughly by inverting vigorously 4-6 times and incubated for
5 minutes at room temperature. To neutralise the lysis buffer 4 ml prechilled
Buffer P3 was added, mixed thoroughly by inverting vigorously 4-6 times and
incubated on ice for 15 minutes. A QIAGEN-tip 100 was equilibrated by
applying 4 ml Buffer QBT and allowing column to empty by gravity flow. The
bacterial lysate was centrifuged for 30 minutes at 20000 g at 4°C. The
supernatant was then applied to the equilibrated QIAGEN-tip and allowed to
enter the resin by gravity flow. The QIAGEN-tip was washed with 2 x 10 ml
Buffer QC, each time allowing the column to empty by gravity flow. The DNA
was eluted into a clean 15 ml vessel by adding 5 ml Buffer QF. To precipitate
DNA 3.5 ml room-temperature isopropanol was added, mixed well and
centrifuged at 15000 g for 30 minutes at 4°C, carefully removing supernatant.
Marking the outside of the vessel helps to see what side the DNA
precipitates on. The DNA pellet was washed with 2 ml room-temperature
70% (v/v) ethanol and centrifuged for 10 minutes at 15000 g, carefully
removing supernatant as in the previous step. The DNA pellet was allowed to
air-dry at room temperature for 10 minutes and then resuspended in 500 µl
Buffer TE. The concentration and purity of the eluted DNA was assessed and
the DNA samples were stored at -20°C.
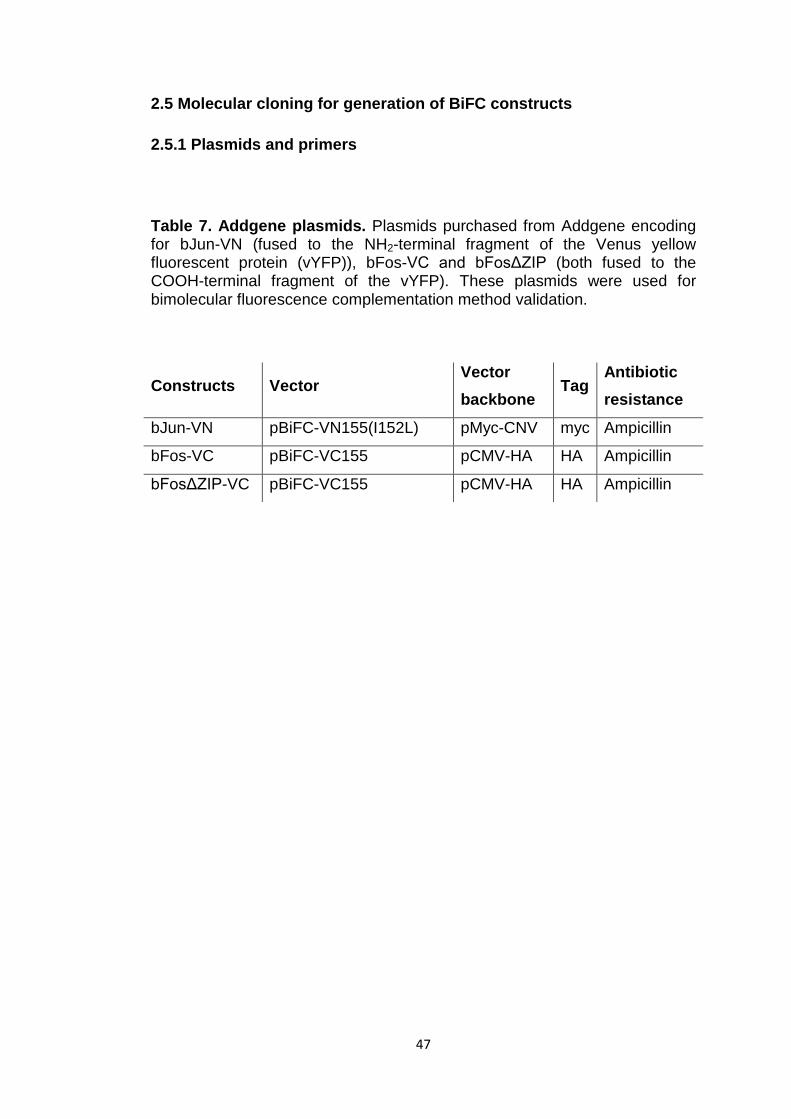
47
2.5 Molecular cloning for generation of BiFC constructs
2.5.1 Plasmids and primers
Table 7. Addgene plasmids. Plasmids purchased from Addgene encoding for bJun-VN (fused to the NH2-terminal fragment of the Venus yellow fluorescent protein (vYFP)), bFos-VC and bFosΔZIP (both fused to the COOH-terminal fragment of the vYFP). These plasmids were used for bimolecular fluorescence complementation method validation.
Constructs Vector Vector backbone
Tag Antibiotic resistance
bJun-VN pBiFC-VN155(I152L) pMyc-CNV myc Ampicillin
bFos-VC pBiFC-VC155 pCMV-HA HA Ampicillin
bFosΔZIP-VC pBiFC-VC155 pCMV-HA HA Ampicillin
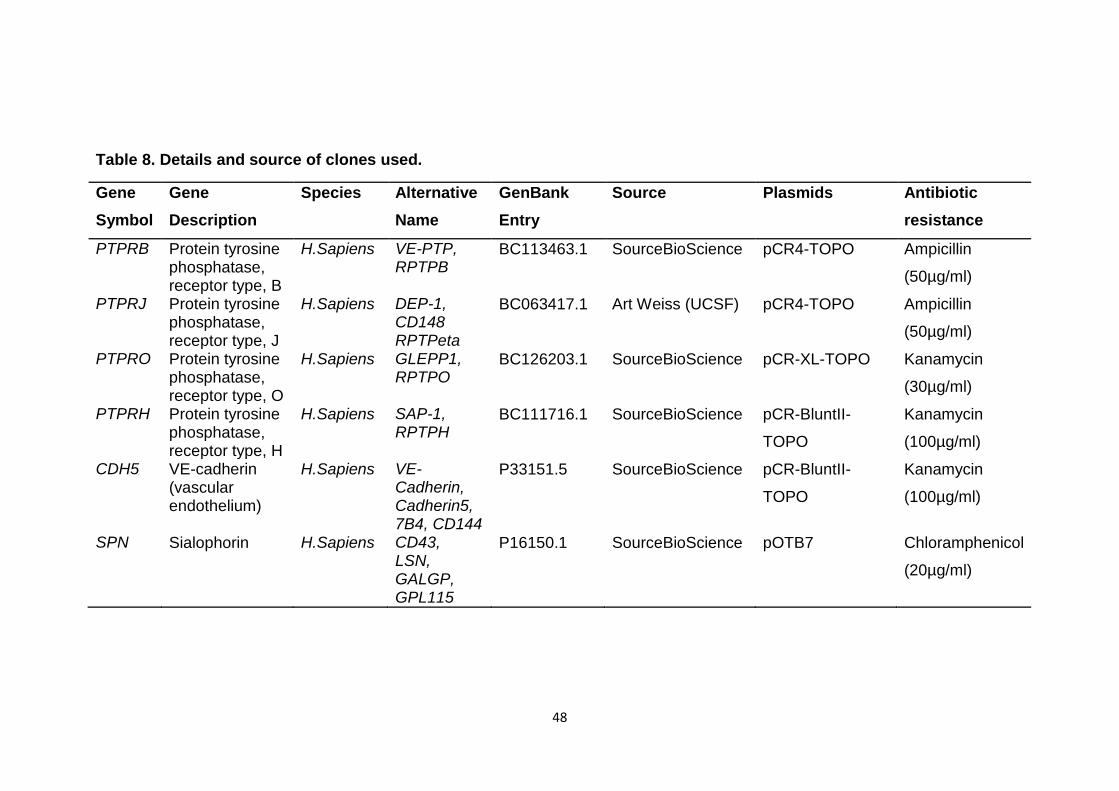
48
Table 8. Details and source of clones used.
Gene Symbol
Gene Description
Species Alternative Name
GenBank Entry
Source Plasmids Antibiotic resistance
PTPRB Protein tyrosine phosphatase, receptor type, B
H.Sapiens VE-PTP, RPTPB
BC113463.1 SourceBioScience pCR4-TOPO Ampicillin
(50µg/ml)
PTPRJ Protein tyrosine phosphatase, receptor type, J
H.Sapiens DEP-1, CD148 RPTPeta
BC063417.1 Art Weiss (UCSF) pCR4-TOPO Ampicillin
(50µg/ml)
PTPRO Protein tyrosine phosphatase, receptor type, O
H.Sapiens GLEPP1, RPTPO
BC126203.1 SourceBioScience pCR-XL-TOPO Kanamycin
(30µg/ml)
PTPRH Protein tyrosine phosphatase, receptor type, H
H.Sapiens SAP-1, RPTPH
BC111716.1 SourceBioScience pCR-BluntII-
TOPO
Kanamycin
(100µg/ml)
CDH5 VE-cadherin (vascular endothelium)
H.Sapiens VE-Cadherin, Cadherin5, 7B4, CD144
P33151.5 SourceBioScience pCR-BluntII-
TOPO
Kanamycin
(100µg/ml)
SPN Sialophorin H.Sapiens CD43, LSN, GALGP, GPL115
P16150.1 SourceBioScience pOTB7 Chloramphenicol
(20µg/ml)
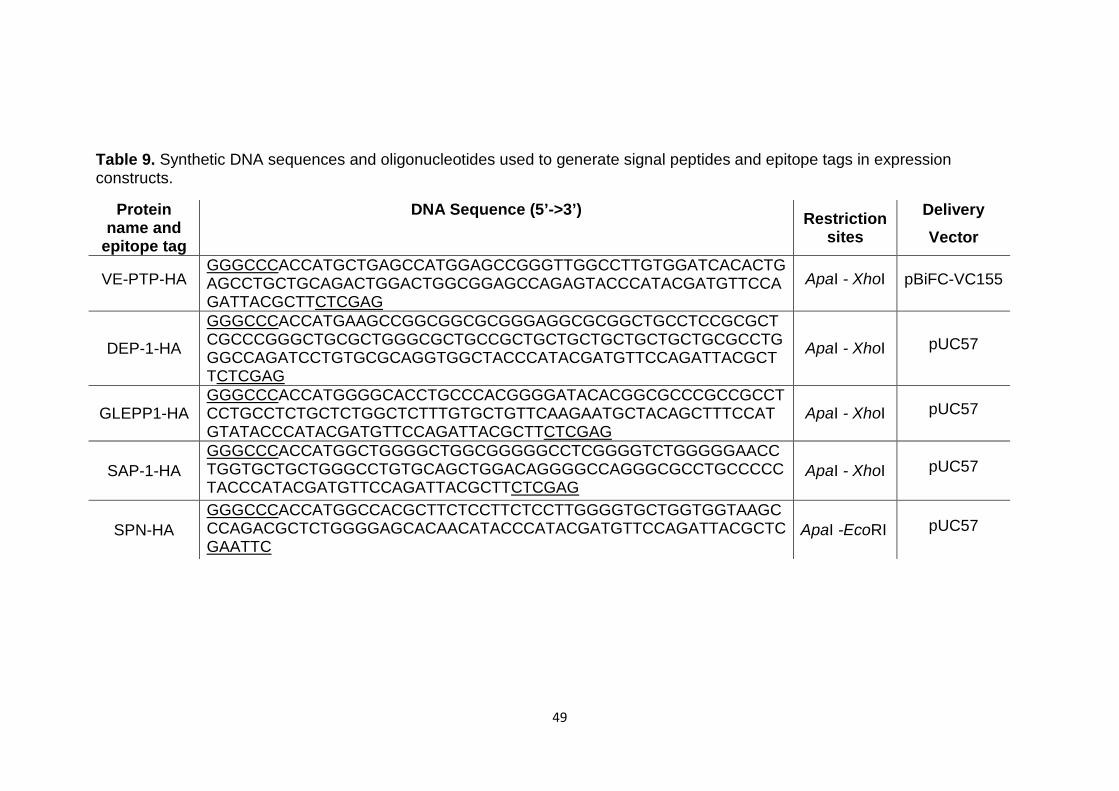
49
Table 9. Synthetic DNA sequences and oligonucleotides used to generate signal peptides and epitope tags in expression constructs.
Protein name and
epitope tag
DNA Sequence (5’->3’) Restriction sites
Delivery Vector
VE-PTP-HA GGGCCCACCATGCTGAGCCATGGAGCCGGGTTGGCCTTGTGGATCACACTGAGCCTGCTGCAGACTGGACTGGCGGAGCCAGAGTACCCATACGATGTTCCAGATTACGCTTCTCGAG
ApaI - XhoI pBiFC-VC155
DEP-1-HA
GGGCCCACCATGAAGCCGGCGGCGCGGGAGGCGCGGCTGCCTCCGCGCTCGCCCGGGCTGCGCTGGGCGCTGCCGCTGCTGCTGCTGCTGCTGCGCCTGGGCCAGATCCTGTGCGCAGGTGGCTACCCATACGATGTTCCAGATTACGCTTCTCGAG
ApaI - XhoI pUC57
GLEPP1-HA GGGCCCACCATGGGGCACCTGCCCACGGGGATACACGGCGCCCGCCGCCTCCTGCCTCTGCTCTGGCTCTTTGTGCTGTTCAAGAATGCTACAGCTTTCCATGTATACCCATACGATGTTCCAGATTACGCTTCTCGAG
ApaI - XhoI pUC57
SAP-1-HA GGGCCCACCATGGCTGGGGCTGGCGGGGGCCTCGGGGTCTGGGGGAACCTGGTGCTGCTGGGCCTGTGCAGCTGGACAGGGGCCAGGGCGCCTGCCCCCTACCCATACGATGTTCCAGATTACGCTTCTCGAG
ApaI - XhoI pUC57
SPN-HA GGGCCCACCATGGCCACGCTTCTCCTTCTCCTTGGGGTGCTGGTGGTAAGCCCAGACGCTCTGGGGAGCACAACATACCCATACGATGTTCCAGATTACGCTCGAATTC
ApaI -EcoRI pUC57
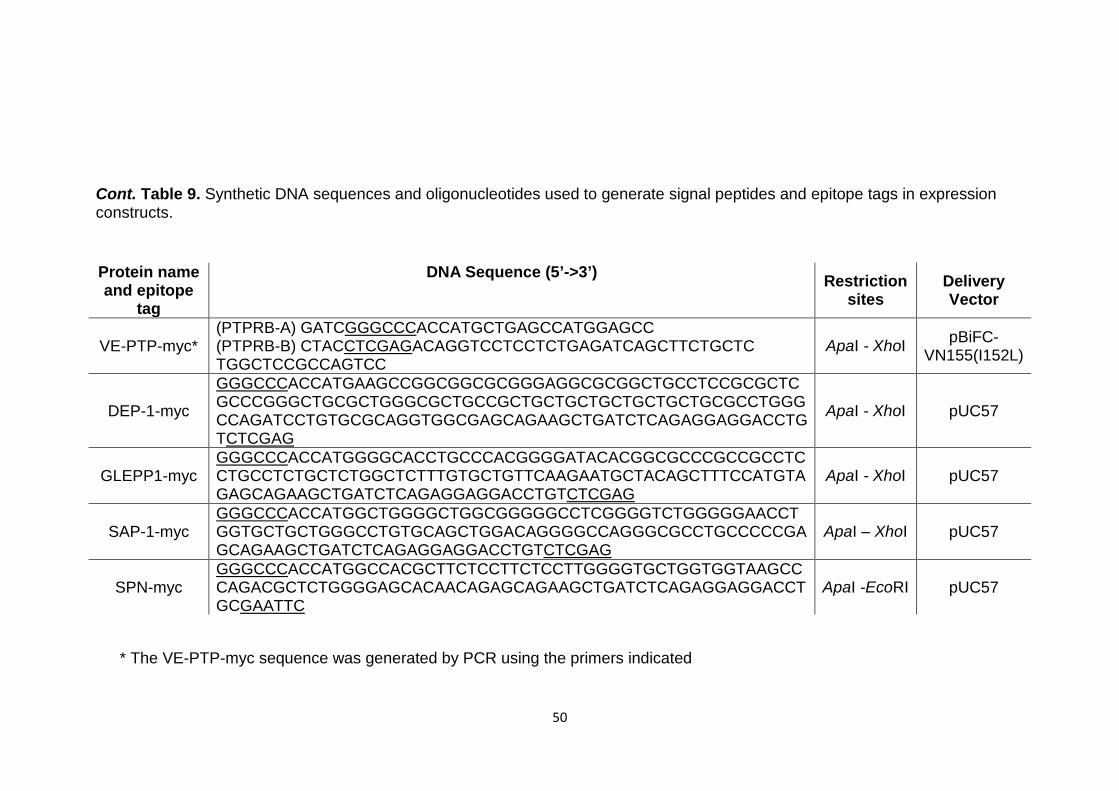
50
Cont. Table 9. Synthetic DNA sequences and oligonucleotides used to generate signal peptides and epitope tags in expression constructs.
* The VE-PTP-myc sequence was generated by PCR using the primers indicated
Protein name and epitope
tag
DNA Sequence (5’->3’) Restriction sites
Delivery Vector
VE-PTP-myc* (PTPRB-A) GATCGGGCCCACCATGCTGAGCCATGGAGCC (PTPRB-B) CTACCTCGAGACAGGTCCTCCTCTGAGATCAGCTTCTGCTC TGGCTCCGCCAGTCC
ApaI - XhoI pBiFC-VN155(I152L)
DEP-1-myc
GGGCCCACCATGAAGCCGGCGGCGCGGGAGGCGCGGCTGCCTCCGCGCTC GCCCGGGCTGCGCTGGGCGCTGCCGCTGCTGCTGCTGCTGCTGCGCCTGGG CCAGATCCTGTGCGCAGGTGGCGAGCAGAAGCTGATCTCAGAGGAGGACCTG TCTCGAG
ApaI - XhoI pUC57
GLEPP1-myc GGGCCCACCATGGGGCACCTGCCCACGGGGATACACGGCGCCCGCCGCCTC CTGCCTCTGCTCTGGCTCTTTGTGCTGTTCAAGAATGCTACAGCTTTCCATGTA GAGCAGAAGCTGATCTCAGAGGAGGACCTGTCTCGAG
ApaI - XhoI pUC57
SAP-1-myc GGGCCCACCATGGCTGGGGCTGGCGGGGGCCTCGGGGTCTGGGGGAACCTGGTGCTGCTGGGCCTGTGCAGCTGGACAGGGGCCAGGGCGCCTGCCCCCGAGCAGAAGCTGATCTCAGAGGAGGACCTGTCTCGAG
ApaI – XhoI pUC57
SPN-myc GGGCCCACCATGGCCACGCTTCTCCTTCTCCTTGGGGTGCTGGTGGTAAGCCCAGACGCTCTGGGGAGCACAACAGAGCAGAAGCTGATCTCAGAGGAGGACCTGCGAATTC
ApaI -EcoRI pUC57
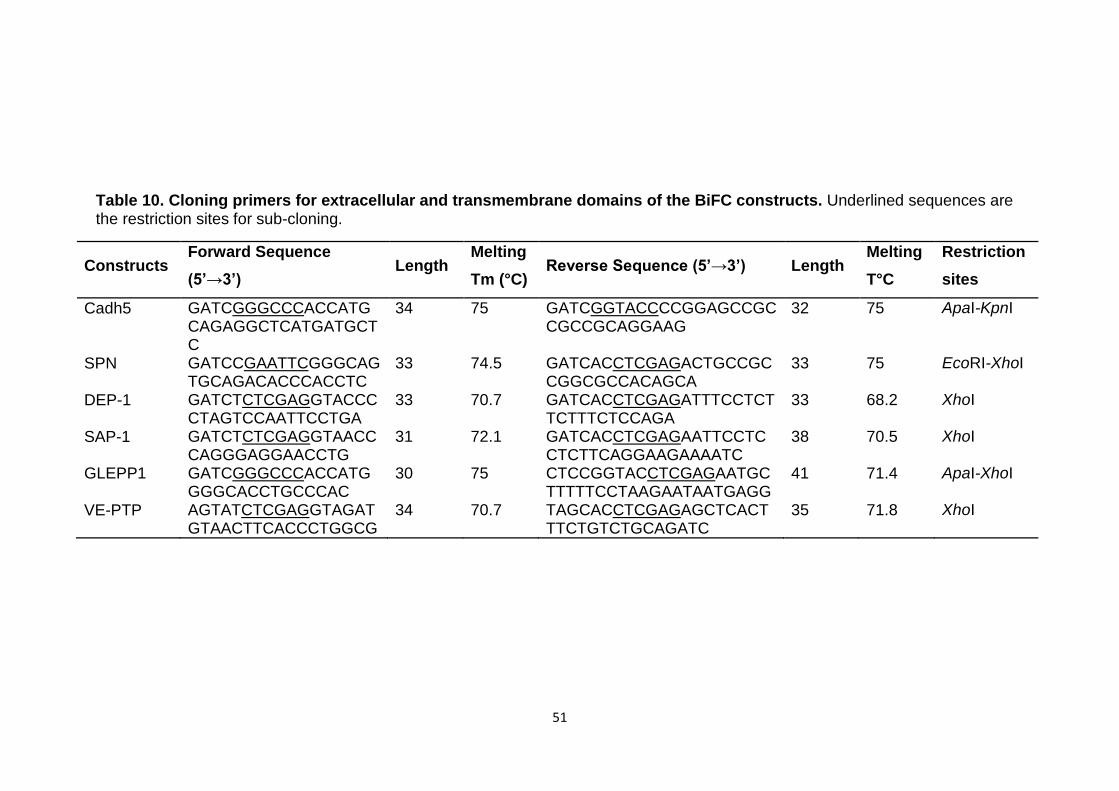
51
Table 10. Cloning primers for extracellular and transmembrane domains of the BiFC constructs. Underlined sequences are the restriction sites for sub-cloning.
Constructs Forward Sequence (5’→3’)
Length Melting Tm (°C)
Reverse Sequence (5’→3’) Length Melting T°C
Restriction sites
Cadh5 GATCGGGCCCACCATGCAGAGGCTCATGATGCTC
34 75 GATCGGTACCCCGGAGCCGCCGCCGCAGGAAG
32 75 ApaI-KpnI
SPN GATCCGAATTCGGGCAGTGCAGACACCCACCTC
33 74.5 GATCACCTCGAGACTGCCGCCGGCGCCACAGCA
33 75 EcoRI-XhoI
DEP-1 GATCTCTCGAGGTACCCCTAGTCCAATTCCTGA
33 70.7 GATCACCTCGAGATTTCCTCTTCTTTCTCCAGA
33 68.2 XhoI
SAP-1 GATCTCTCGAGGTAACCCAGGGAGGAACCTG
31 72.1 GATCACCTCGAGAATTCCTCCTCTTCAGGAAGAAAATC
38 70.5 XhoI
GLEPP1 GATCGGGCCCACCATGGGGCACCTGCCCAC
30 75 CTCCGGTACCTCGAGAATGCTTTTTCCTAAGAATAATGAGG
41 71.4 ApaI-XhoI
VE-PTP AGTATCTCGAGGTAGATGTAACTTCACCCTGGCG
34 70.7 TAGCACCTCGAGAGCTCACTTTCTGTCTGCAGATC
35 71.8 XhoI
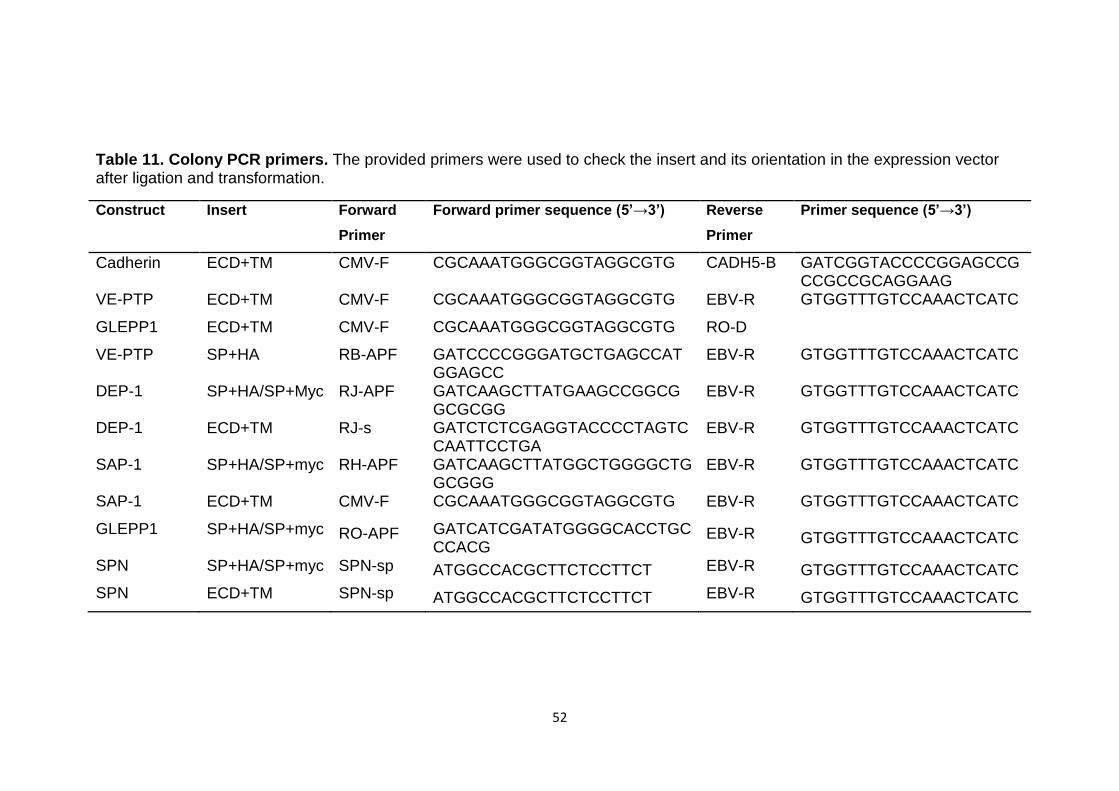
52
Table 11. Colony PCR primers. The provided primers were used to check the insert and its orientation in the expression vector after ligation and transformation.
Construct Insert Forward Primer
Forward primer sequence (5’→3’) Reverse Primer
Primer sequence (5’→3’)
Cadherin ECD+TM CMV-F CGCAAATGGGCGGTAGGCGTG CADH5-B GATCGGTACCCCGGAGCCGCCGCCGCAGGAAG
VE-PTP ECD+TM CMV-F CGCAAATGGGCGGTAGGCGTG EBV-R GTGGTTTGTCCAAACTCATC GLEPP1 ECD+TM CMV-F CGCAAATGGGCGGTAGGCGTG RO-D
VE-PTP SP+HA RB-APF GATCCCCGGGATGCTGAGCCATGGAGCC
EBV-R GTGGTTTGTCCAAACTCATC
DEP-1 SP+HA/SP+Myc RJ-APF GATCAAGCTTATGAAGCCGGCGGCGCGG
EBV-R GTGGTTTGTCCAAACTCATC
DEP-1 ECD+TM RJ-s GATCTCTCGAGGTACCCCTAGTCCAATTCCTGA
EBV-R GTGGTTTGTCCAAACTCATC
SAP-1 SP+HA/SP+myc RH-APF GATCAAGCTTATGGCTGGGGCTGGCGGG
EBV-R GTGGTTTGTCCAAACTCATC
SAP-1 ECD+TM CMV-F CGCAAATGGGCGGTAGGCGTG EBV-R GTGGTTTGTCCAAACTCATC GLEPP1 SP+HA/SP+myc RO-APF GATCATCGATATGGGGCACCTGC
CCACG EBV-R GTGGTTTGTCCAAACTCATC
SPN SP+HA/SP+myc SPN-sp ATGGCCACGCTTCTCCTTCT EBV-R GTGGTTTGTCCAAACTCATC SPN ECD+TM SPN-sp ATGGCCACGCTTCTCCTTCT EBV-R GTGGTTTGTCCAAACTCATC
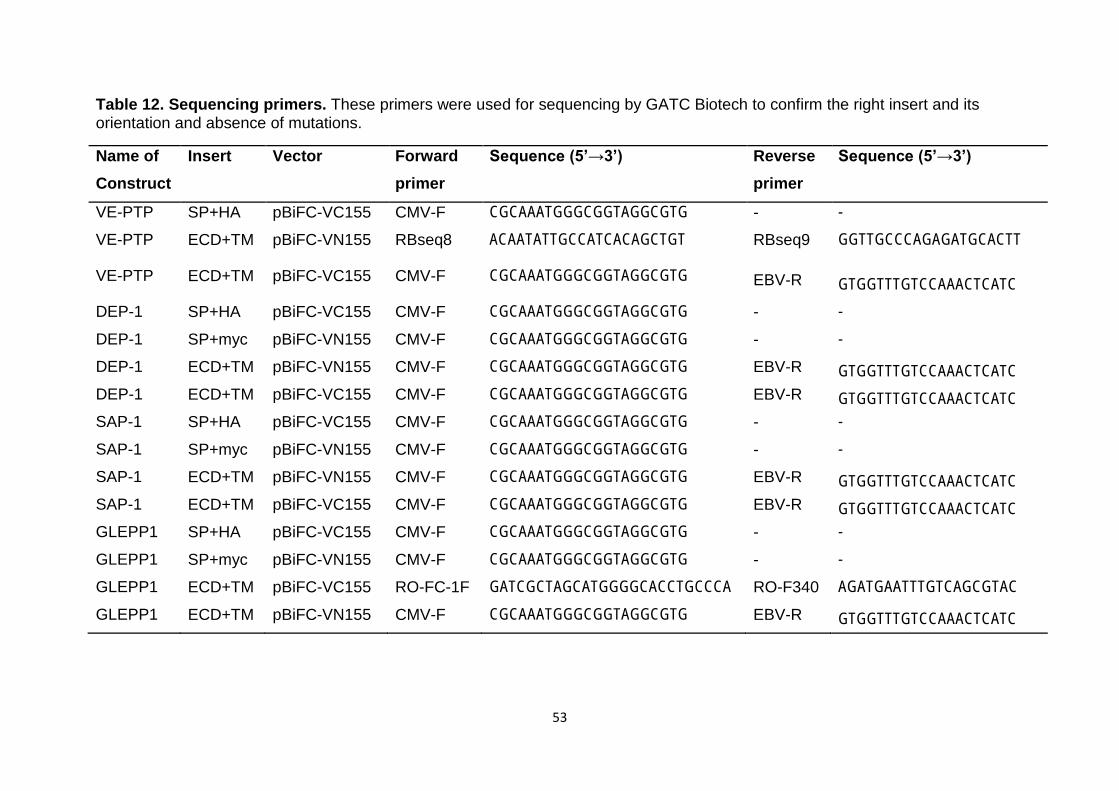
53
Table 12. Sequencing primers. These primers were used for sequencing by GATC Biotech to confirm the right insert and its orientation and absence of mutations.
Name of Construct
Insert Vector Forward primer
Sequence (5’→3’) Reverse primer
Sequence (5’→3’)
VE-PTP SP+HA pBiFC-VC155 CMV-F CGCAAATGGGCGGTAGGCGTG - - VE-PTP ECD+TM pBiFC-VN155 RBseq8 ACAATATTGCCATCACAGCTGT RBseq9 GGTTGCCCAGAGATGCACTT
VE-PTP ECD+TM pBiFC-VC155 CMV-F CGCAAATGGGCGGTAGGCGTG EBV-R GTGGTTTGTCCAAACTCATC DEP-1 SP+HA pBiFC-VC155 CMV-F CGCAAATGGGCGGTAGGCGTG - - DEP-1 SP+myc pBiFC-VN155 CMV-F CGCAAATGGGCGGTAGGCGTG - - DEP-1 ECD+TM pBiFC-VN155 CMV-F CGCAAATGGGCGGTAGGCGTG EBV-R GTGGTTTGTCCAAACTCATC DEP-1 ECD+TM pBiFC-VC155 CMV-F CGCAAATGGGCGGTAGGCGTG EBV-R GTGGTTTGTCCAAACTCATC SAP-1 SP+HA pBiFC-VC155 CMV-F CGCAAATGGGCGGTAGGCGTG - - SAP-1 SP+myc pBiFC-VN155 CMV-F CGCAAATGGGCGGTAGGCGTG - - SAP-1 ECD+TM pBiFC-VN155 CMV-F CGCAAATGGGCGGTAGGCGTG EBV-R GTGGTTTGTCCAAACTCATC SAP-1 ECD+TM pBiFC-VC155 CMV-F CGCAAATGGGCGGTAGGCGTG EBV-R GTGGTTTGTCCAAACTCATC GLEPP1 SP+HA pBiFC-VC155 CMV-F CGCAAATGGGCGGTAGGCGTG - - GLEPP1 SP+myc pBiFC-VN155 CMV-F CGCAAATGGGCGGTAGGCGTG - - GLEPP1 ECD+TM pBiFC-VC155 RO-FC-1F GATCGCTAGCATGGGGCACCTGCCCA RO-F340 AGATGAATTTGTCAGCGTAC GLEPP1 ECD+TM pBiFC-VN155 CMV-F CGCAAATGGGCGGTAGGCGTG EBV-R GTGGTTTGTCCAAACTCATC
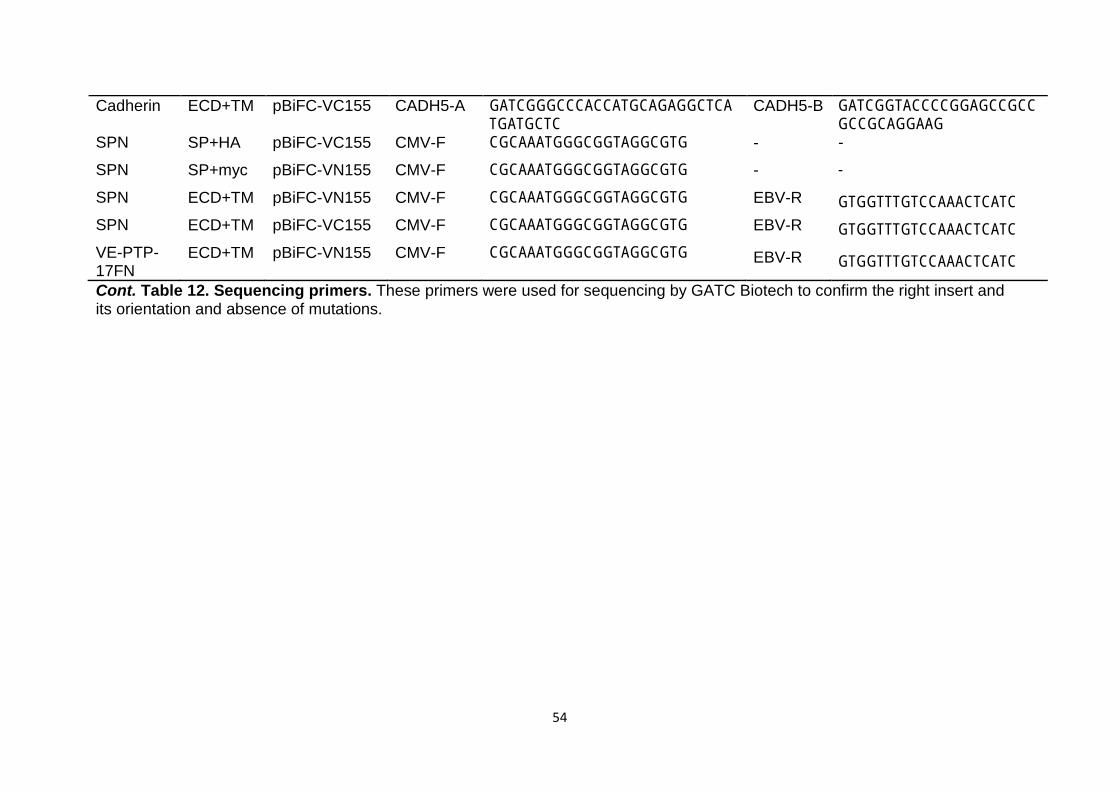
54
Cadherin ECD+TM pBiFC-VC155 CADH5-A GATCGGGCCCACCATGCAGAGGCTCATGATGCTC
CADH5-B GATCGGTACCCCGGAGCCGCCGCCGCAGGAAG
SPN SP+HA pBiFC-VC155 CMV-F CGCAAATGGGCGGTAGGCGTG - -
SPN SP+myc pBiFC-VN155 CMV-F CGCAAATGGGCGGTAGGCGTG - - SPN ECD+TM pBiFC-VN155 CMV-F CGCAAATGGGCGGTAGGCGTG EBV-R GTGGTTTGTCCAAACTCATC SPN ECD+TM pBiFC-VC155 CMV-F CGCAAATGGGCGGTAGGCGTG EBV-R GTGGTTTGTCCAAACTCATC VE-PTP-17FN
ECD+TM pBiFC-VN155 CMV-F CGCAAATGGGCGGTAGGCGTG EBV-R GTGGTTTGTCCAAACTCATC
Cont. Table 12. Sequencing primers. These primers were used for sequencing by GATC Biotech to confirm the right insert and its orientation and absence of mutations.
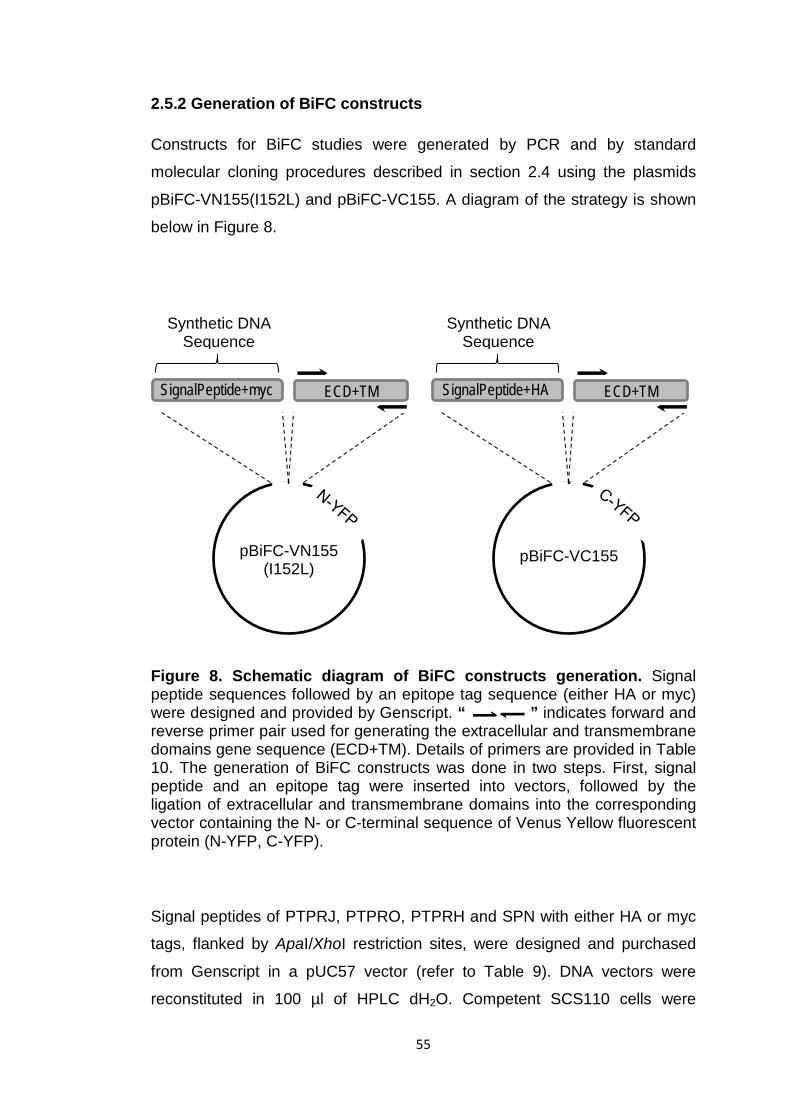
55
2.5.2 Generation of BiFC constructs
Constructs for BiFC studies were generated by PCR and by standard
molecular cloning procedures described in section 2.4 using the plasmids
pBiFC-VN155(I152L) and pBiFC-VC155. A diagram of the strategy is shown
below in Figure 8.
Figure 8. Schematic diagram of BiFC constructs generation. Signal peptide sequences followed by an epitope tag sequence (either HA or myc) were designed and provided by Genscript. “ ” indicates forward and reverse primer pair used for generating the extracellular and transmembrane domains gene sequence (ECD+TM). Details of primers are provided in Table 10. The generation of BiFC constructs was done in two steps. First, signal peptide and an epitope tag were inserted into vectors, followed by the ligation of extracellular and transmembrane domains into the corresponding vector containing the N- or C-terminal sequence of Venus Yellow fluorescent protein (N-YFP, C-YFP).
Signal peptides of PTPRJ, PTPRO, PTPRH and SPN with either HA or myc
tags, flanked by ApaI/XhoI restriction sites, were designed and purchased
from Genscript in a pUC57 vector (refer to Table 9). DNA vectors were
reconstituted in 100 µl of HPLC dH2O. Competent SCS110 cells were
SignalPeptide+myc ECD+TM
Synthetic DNA Sequence
pBiFC-VN155 (I152L)
SignalPeptide+HA ECD+TM
Synthetic DNA Sequence
pBiFC-VC155
56
transformed with each of the pUC57 vector as described in section 2.4.9.
DNA plasmids were then extracted and purified from bacterial culture as
described in section 2.4.2. The synthetically generated signal peptide and
myc/HA tag sequences were digested with appropriate restriction enzymes
(refer to Table 9) and cloned into the BiFC expression vectors (Figure 8) as
described in sections 2.4.8 and 2.4.9. Successful ligation was checked by
Colony PCR as described in section 2.4.10 using vector and gene specific
primers (refer to Table 11), followed by gel electrophoresis (section 2.4.4).
DNA plasmids containing the correct signal peptide and an epitope tag insert
were purified as described in section 2.4.2 and sequenced by GATC Biotech.
Polymerase chain reaction was used to amplify the coding sequences for
extracellular and transmembrane domains for all R3 RPTPs, VE-cadherin
and SPN as described in section 2.4.3. Details and sources of clones used
are listed in Table 8. Cloning primers are provided in Table 10. The
thermocycler programs were customised for each target sequence based on
gene length and primers’ melting temperature (refer to Table 4). PCR
products were analysed on agarose gel and purified as described in sections
2.4.4 and 2.4.6 respectively.
Three micrograms of each of the purified PCR products and pBiFC-VN155
(27097) and pBiFC-VC155 (22011) vectors containing corresponding DNA
sequences for signal peptides were digested with one unit of the appropriate
restriction enzymes as described in section 2.4.7. Information on restriction
enzymes used for each construct and on conditions is provided in Table 5.
The digested fragments were analysed by agarose gel electrophoresis
(section 2.4.4), purified (section 2.4.5) and ligated together (section 2.4.8).
The resulting ligation mixture of expression vectors containing the final
products was used to transform XL1-Blue strain of E.coli competent cells as
described in section 2.4.9. Colony PCR was then performed to screen for
successful ligations (section 2.4.10), which was analysed by gel
electrophoresis (section 2.4.4). DNA plasmids containing the correct insert
were purified as described in section 2.4.2 and sequenced by GATC Biotech.
57
The miniprepped plasmid DNA that corresponded to the predicted sequence
was used to generate high yield of plasmid DNA with greater purity suitable
for mammalian cell transfections as described in section 2.4.11.
2.5.3 Generation of VE-PTPΔ17FN mutant using a polymerase chain reaction based approach
In order to generate the VE-PTP∆17FN construct (as illustrated in Figure 23)
in which 17th fibronectin III-like domain has been removed the pBiFC-VN155
vector containing sequences for signal peptide, myc-tag, full-length
extracellular and transmembrane domains followed by the N-terminal part of
the YFP was used as a template. First, the sequence for the above vector
was checked for all the restriction sites using VectorNTI software. The cutting
sequence for the restriction enzyme XmaI was chosen to be included with
primer sequence as there were no restriction sites for this enzyme in the
above vector. Primers were designed, corresponding to the sequence on
either side of the 17th FNIII domain, using VectorNTI software with an XmaI
sequence at the start (Figure 9). The 5’ ends of the primers were designed
so that they would complement each other, and could be ligated together,
and 3’ ends oriented so that the extension would amplify the entire plasmid
(see Figure 9).
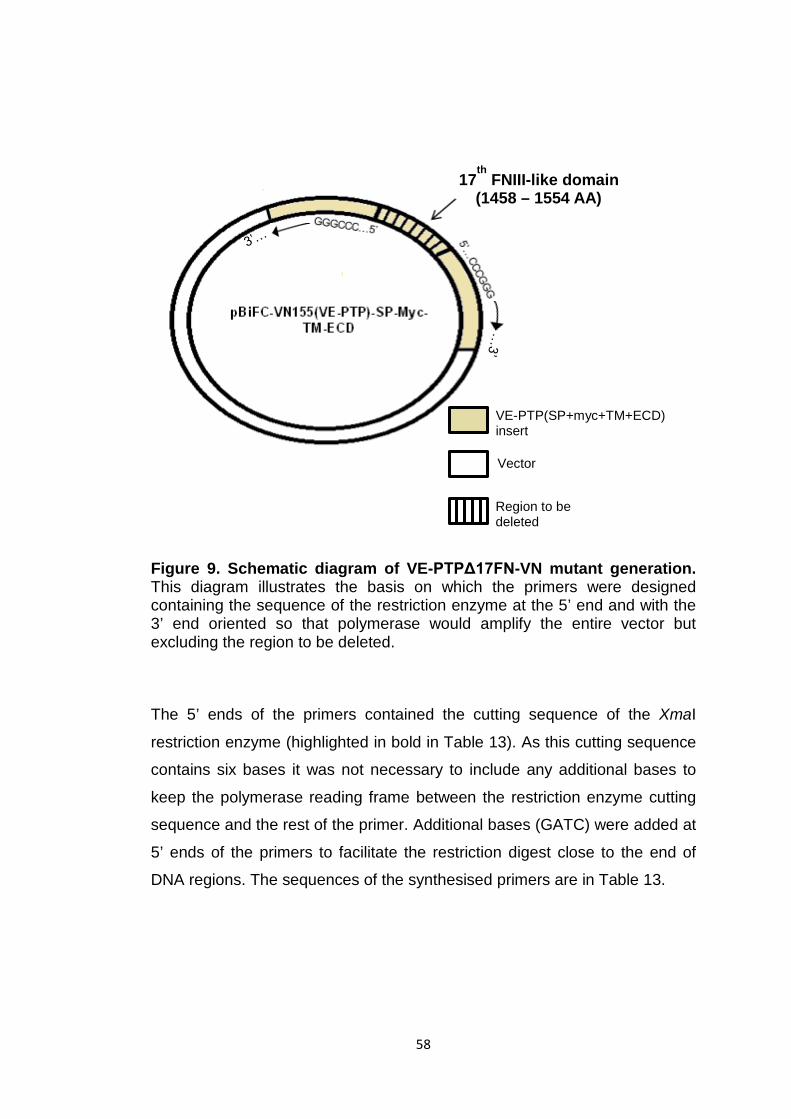
58
Figure 9. Schematic diagram of VE-PTPΔ17FN-VN mutant generation. This diagram illustrates the basis on which the primers were designed containing the sequence of the restriction enzyme at the 5’ end and with the 3’ end oriented so that polymerase would amplify the entire vector but excluding the region to be deleted.
The 5’ ends of the primers contained the cutting sequence of the XmaI
restriction enzyme (highlighted in bold in Table 13). As this cutting sequence
contains six bases it was not necessary to include any additional bases to
keep the polymerase reading frame between the restriction enzyme cutting
sequence and the rest of the primer. Additional bases (GATC) were added at
5’ ends of the primers to facilitate the restriction digest close to the end of
DNA regions. The sequences of the synthesised primers are in Table 13.
17th
FNIII-like domain (1458 – 1554 AA)
Vector
Region to be deleted
VE-PTP(SP+myc+TM+ECD) insert
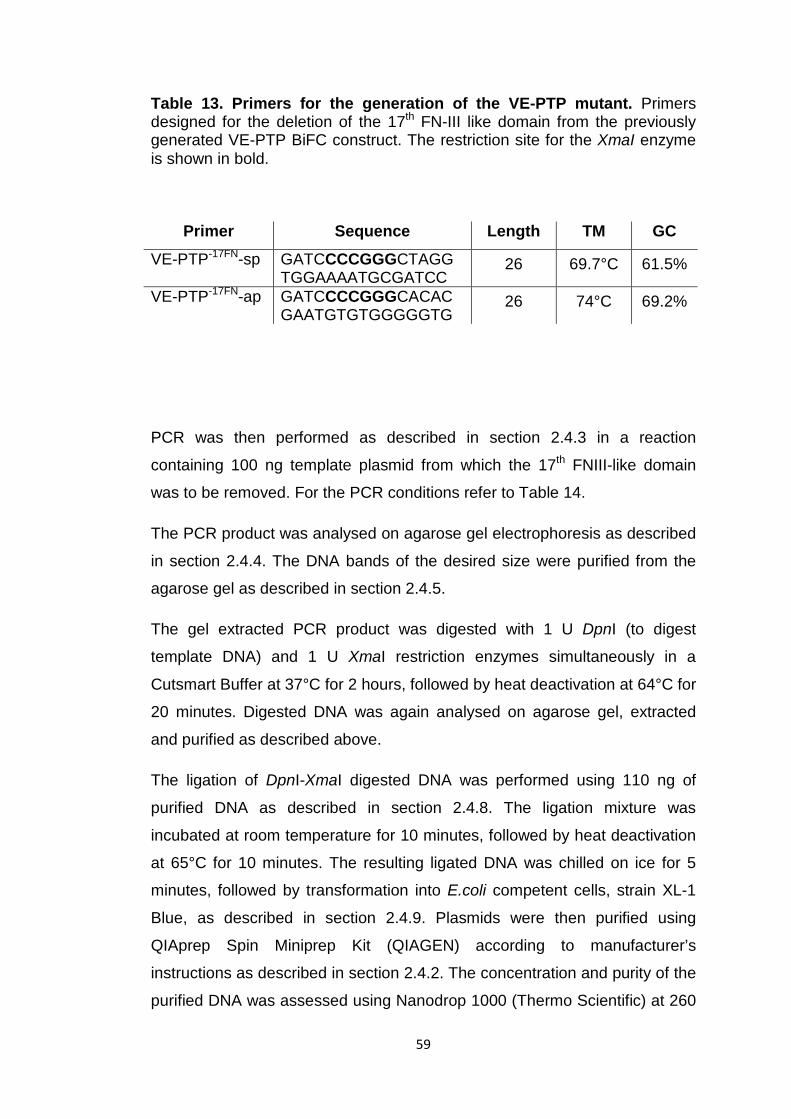
59
Table 13. Primers for the generation of the VE-PTP mutant. Primers designed for the deletion of the 17th FN-III like domain from the previously generated VE-PTP BiFC construct. The restriction site for the XmaI enzyme is shown in bold.
Primer Sequence Length TM GC
VE-PTP-17FN-sp GATCCCCGGGCTAGG TGGAAAATGCGATCC
26 69.7°C 61.5%
VE-PTP-17FN-ap GATCCCCGGGCACAC GAATGTGTGGGGGTG
26 74°C 69.2%
PCR was then performed as described in section 2.4.3 in a reaction
containing 100 ng template plasmid from which the 17th FNIII-like domain
was to be removed. For the PCR conditions refer to Table 14.
The PCR product was analysed on agarose gel electrophoresis as described
in section 2.4.4. The DNA bands of the desired size were purified from the
agarose gel as described in section 2.4.5.
The gel extracted PCR product was digested with 1 U DpnI (to digest
template DNA) and 1 U XmaI restriction enzymes simultaneously in a
Cutsmart Buffer at 37°C for 2 hours, followed by heat deactivation at 64°C for
20 minutes. Digested DNA was again analysed on agarose gel, extracted
and purified as described above.
The ligation of DpnI-XmaI digested DNA was performed using 110 ng of
purified DNA as described in section 2.4.8. The ligation mixture was
incubated at room temperature for 10 minutes, followed by heat deactivation
at 65°C for 10 minutes. The resulting ligated DNA was chilled on ice for 5
minutes, followed by transformation into E.coli competent cells, strain XL-1
Blue, as described in section 2.4.9. Plasmids were then purified using
QIAprep Spin Miniprep Kit (QIAGEN) according to manufacturer’s
instructions as described in section 2.4.2. The concentration and purity of the
purified DNA was assessed using Nanodrop 1000 (Thermo Scientific) at 260

60
nm and 280 nm and then sequenced by GATC Biotech. The miniprepped
plasmid DNA that corresponded to the predicted sequence, containing the
deletion of the 17th FNIII-like domain, was then used to generate high yield of
plasmid DNA with greater purity suitable for mammalian cell transfections as
described in section 2.4.11.
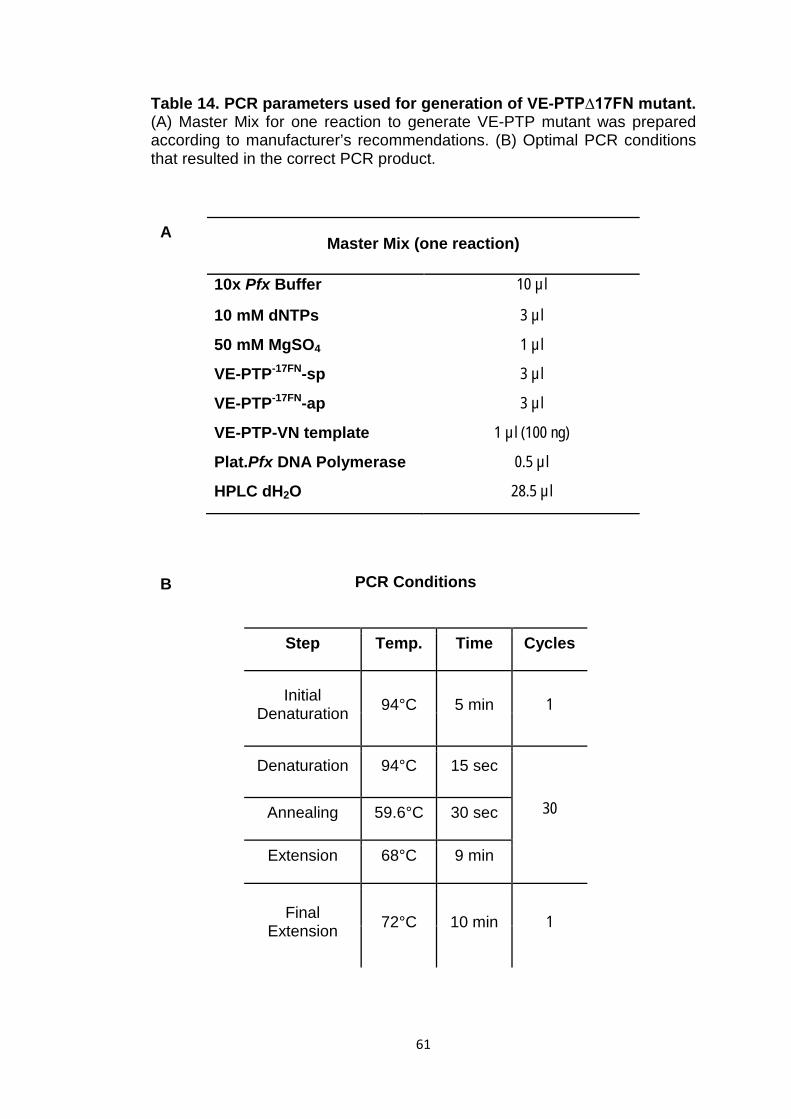
61
Table 14. PCR parameters used for generation of VE-PTP∆17FN mutant. (A) Master Mix for one reaction to generate VE-PTP mutant was prepared according to manufacturer’s recommendations. (B) Optimal PCR conditions that resulted in the correct PCR product.
Master Mix (one reaction)
10x Pfx Buffer 10 µl
10 mM dNTPs 3 µl
50 mM MgSO4 1 µl
VE-PTP-17FN-sp 3 µl
VE-PTP-17FN-ap 3 µl
VE-PTP-VN template 1 µl (100 ng)
Plat.Pfx DNA Polymerase 0.5 µl
HPLC dH2O 28.5 µl
PCR Conditions
Step Temp. Time Cycles
Initial Denaturation 94°C 5 min 1
Denaturation 94°C 15 sec
30 Annealing 59.6°C 30 sec
Extension 68°C 9 min
Final Extension 72°C 10 min 1
A
B
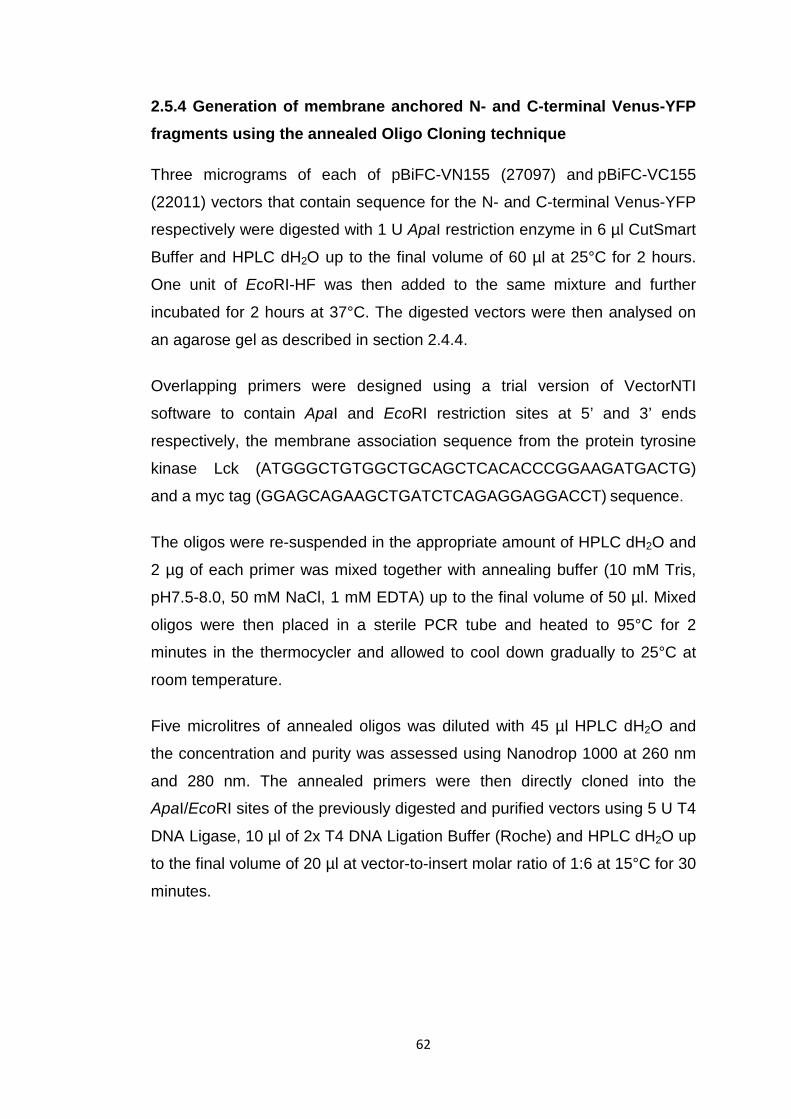
62
2.5.4 Generation of membrane anchored N- and C-terminal Venus-YFP fragments using the annealed Oligo Cloning technique
Three micrograms of each of pBiFC-VN155 (27097) and pBiFC-VC155
(22011) vectors that contain sequence for the N- and C-terminal Venus-YFP
respectively were digested with 1 U ApaI restriction enzyme in 6 µl CutSmart
Buffer and HPLC dH2O up to the final volume of 60 µl at 25°C for 2 hours.
One unit of EcoRI-HF was then added to the same mixture and further
incubated for 2 hours at 37°C. The digested vectors were then analysed on
an agarose gel as described in section 2.4.4.
Overlapping primers were designed using a trial version of VectorNTI
software to contain ApaI and EcoRI restriction sites at 5’ and 3’ ends
respectively, the membrane association sequence from the protein tyrosine
kinase Lck (ATGGGCTGTGGCTGCAGCTCACACCCGGAAGATGACTG)
and a myc tag (GGAGCAGAAGCTGATCTCAGAGGAGGACCT) sequence.
The oligos were re-suspended in the appropriate amount of HPLC dH2O and
2 µg of each primer was mixed together with annealing buffer (10 mM Tris,
pH7.5-8.0, 50 mM NaCl, 1 mM EDTA) up to the final volume of 50 µl. Mixed
oligos were then placed in a sterile PCR tube and heated to 95°C for 2
minutes in the thermocycler and allowed to cool down gradually to 25°C at
room temperature.
Five microlitres of annealed oligos was diluted with 45 µl HPLC dH2O and
the concentration and purity was assessed using Nanodrop 1000 at 260 nm
and 280 nm. The annealed primers were then directly cloned into the
ApaI/EcoRI sites of the previously digested and purified vectors using 5 U T4
DNA Ligase, 10 µl of 2x T4 DNA Ligation Buffer (Roche) and HPLC dH2O up
to the final volume of 20 µl at vector-to-insert molar ratio of 1:6 at 15°C for 30
minutes.
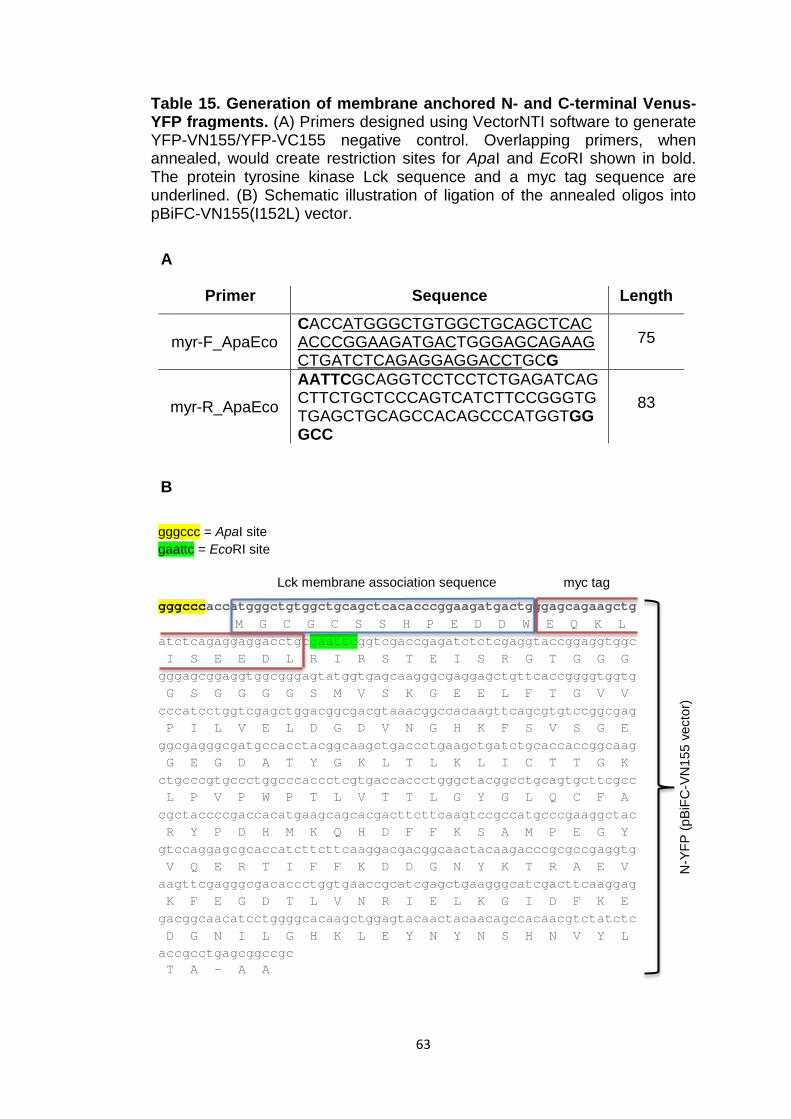
63
Table 15. Generation of membrane anchored N- and C-terminal Venus-YFP fragments. (A) Primers designed using VectorNTI software to generate YFP-VN155/YFP-VC155 negative control. Overlapping primers, when annealed, would create restriction sites for ApaI and EcoRI shown in bold. The protein tyrosine kinase Lck sequence and a myc tag sequence are underlined. (B) Schematic illustration of ligation of the annealed oligos into pBiFC-VN155(I152L) vector.
Primer Sequence Length
myr-F_ApaEco CACCATGGGCTGTGGCTGCAGCTCACACCCGGAAGATGACTGGGAGCAGAAGCTGATCTCAGAGGAGGACCTGCG
75
myr-R_ApaEco
AATTCGCAGGTCCTCCTCTGAGATCAGCTTCTGCTCCCAGTCATCTTCCGGGTGTGAGCTGCAGCCACAGCCCATGGTGGGCC
83
A
gggcccaccatgggctgtggctgcagctcacacccggaagatgactgggagcagaagctg M G C G C S S H P E D D W E Q K L atctcagaggaggacctgcgaattcggtcgaccgagatctctcgaggtaccggaggtggc I S E E D L R I R S T E I S R G T G G G gggagcggaggtggcgggagtatggtgagcaagggcgaggagctgttcaccggggtggtg G S G G G G S M V S K G E E L F T G V V cccatcctggtcgagctggacggcgacgtaaacggccacaagttcagcgtgtccggcgag P I L V E L D G D V N G H K F S V S G E ggcgagggcgatgccacctacggcaagctgaccctgaagctgatctgcaccaccggcaag G E G D A T Y G K L T L K L I C T T G K ctgcccgtgccctggcccaccctcgtgaccaccctgggctacggcctgcagtgcttcgcc L P V P W P T L V T T L G Y G L Q C F A cgctaccccgaccacatgaagcagcacgacttcttcaagtccgccatgcccgaaggctac R Y P D H M K Q H D F F K S A M P E G Y gtccaggagcgcaccatcttcttcaaggacgacggcaactacaagacccgcgccgaggtg V Q E R T I F F K D D G N Y K T R A E V aagttcgagggcgacaccctggtgaaccgcatcgagctgaagggcatcgacttcaaggag K F E G D T L V N R I E L K G I D F K E gacggcaacatcctggggcacaagctggagtacaactacaacagccacaacgtctatctc D G N I L G H K L E Y N Y N S H N V Y L accgcctgagcggccgc T A - A A
N-Y
FP (p
BiFC
-VN
155
vect
or)
Lck membrane association sequence myc tag
gggccc = ApaI site gaattc = EcoRI site
B
64
E.coli competent cells, strain XL1-Blue, were then transformed with the
resulting ligation mixtures as described in section 2.4.9. The transformed
cells were then aseptically plated on agar plates with 50 µg/ml of Ampicillin
and allowed to grow at 37°C for 14-16 hours, followed by the colony PCR as
described above in section 2.4.10. Putative positive colonies were used to
start an overnight bacterial culture (refer to section 2.4.10). Plasmid DNA
was extracted and purified from the harvested pellet using QIAprep Spin
Miniprep Kit (QIAGEN) as described in section 2.4.2. The concentration and
purity of the eluted DNA was assessed using Nanodrop 1000 (Thermo
Scientific) and then sequenced by GATC Biotech. The miniprepped plasmid
DNA that corresponded to the predicted sequence was then used to
generate high yield of plasmid DNA with high purity suitable for mammalian
cell transfections as described in section 2.4.11.
2.5.5 Cell Culture
Human Embryonic Kidney 293 (HEK293) and 293T cells (ATCC code CRL-
1573 and CRL-11268) were purchased from ATCC. Both HEK293 and
HEK293T cell lines were used initially to compare the transfection and
expression efficiency. The HEK293T cells are derived from 293 cells but
stably express the simian virus 40 (SV40) large T antigen, which can bind to
SV40 enhancer of expression vectors to increase protein production.
HEK293 and HEK293T cells were maintained in Dulbecco’s Modified Eagle’s
Medium (DMEM, with GlutaMAX, 4500 mg/L glucose; Gibco) supplemented
with 10% (v/v) foetal bovine serum at 37°C in 5% CO2 in a humidified
incubator. Cells were trypsinised at 80% confluence and seeded 24 hours
prior to transfection on 6-well (3 x 10⁵ cells) plates.
65
2.5.6 Transfection and confocal visualisation
Transient transfections were performed using Lipofectamine® LTX Plus
(Invitrogen) according to the manufacturer’s instructions. Briefly, 500 µl Opti-
MEM® Reduced Serum Medium, 0.5 µg of each DNA construct and PLUS™
Reagent (at the 1:1 ratio of DNA (μg) to PLUS™ Reagent (μl)) were mixed
together in a sterile Eppendorf tube and allowed to incubate at room
temperature for 5 minutes. Lipofectamine® LTX was mixed gently and added
to the diluted DNA (2 µl per µg of DNA) and incubated at room temperature
for 30 minutes. DNA-lipid complexes were then added directly to the cells in
a drop-wise manner and incubated at 37°C in a CO2 incubator. After 24
hours cells were stained with CellMask™ DeepRed plasma membrane stain
(ThermoFisher Scientific) for 1 hour at 37°C by directly adding 1 µl/well of the
stain to live cells. The media were then removed, cells were rinsed with
warm HBSS (Gibco) and images were acquired by sequential scanning using
a Leica TCS SP2 confocal microscope system (Leica Microsystems) with a
63× ceramic dipping objective, using a dichroic beamsplitter DD458/514. A
514 nm argon ion laser was used to excite Venus YFP (Ex/Em 514/527 nm)
with detection at 525-560 nm; and a 633 nm helium neon laser, intensity
35%, was used for the red stain (Ex/Em 649/666 nm) with detection at 660-
685 nm.
2.5.7 Immunoblotting
Transfected HEK293T cells were rinsed with 2 ml/well ice-cold PBS
containing Ca2+ and Mg2+ and lysed by adding 300 µl 4x Sample Buffer (240
mM Tris-HCl, pH 6.8, 8% SDS, 5% β-mercaptoethanol, 0.04% (v/v)
bromophenol blue, 40% (v/v) glycerol) into each well. In some experiments
some cells were lysed using 250 µl/well ice-cold lysis buffer containing
complete protease inhibitor tablet (Roche). To prepare samples for loading
30 µl of cell lysates were mixed with 10 µl 4x sample buffer. The total cell
lysate (20 µl) was loaded on to a 4–20% Mini-Protean TGX precast gel (Bio-
Rad) and subjected to electrophoresis at 110 V for 60 minutes in 1 x SDS
running buffer (for buffer composition refer to Table 3). For accurate
molecular weight estimation on SDS-polyacrylamide gel and on immunoblots
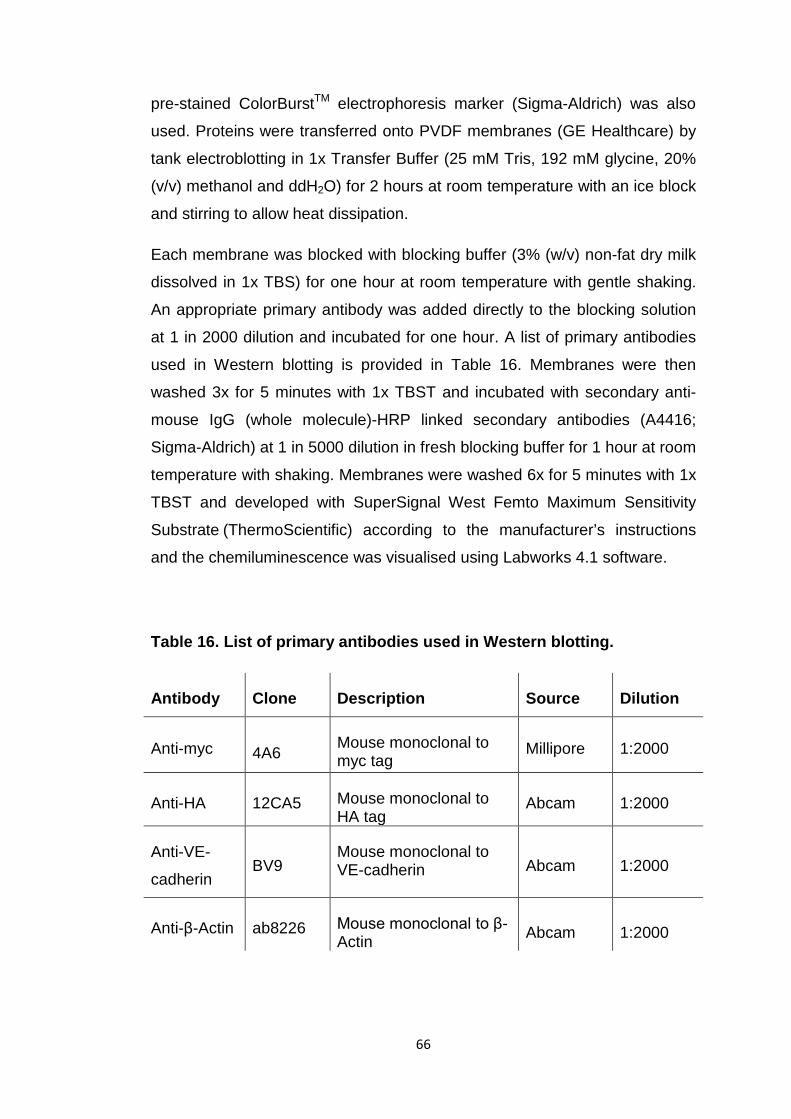
66
pre-stained ColorBurstTM electrophoresis marker (Sigma-Aldrich) was also
used. Proteins were transferred onto PVDF membranes (GE Healthcare) by
tank electroblotting in 1x Transfer Buffer (25 mM Tris, 192 mM glycine, 20%
(v/v) methanol and ddH2O) for 2 hours at room temperature with an ice block
and stirring to allow heat dissipation.
Each membrane was blocked with blocking buffer (3% (w/v) non-fat dry milk
dissolved in 1x TBS) for one hour at room temperature with gentle shaking.
An appropriate primary antibody was added directly to the blocking solution
at 1 in 2000 dilution and incubated for one hour. A list of primary antibodies
used in Western blotting is provided in Table 16. Membranes were then
washed 3x for 5 minutes with 1x TBST and incubated with secondary anti-
mouse IgG (whole molecule)-HRP linked secondary antibodies (A4416;
Sigma-Aldrich) at 1 in 5000 dilution in fresh blocking buffer for 1 hour at room
temperature with shaking. Membranes were washed 6x for 5 minutes with 1x
TBST and developed with SuperSignal West Femto Maximum Sensitivity
Substrate (ThermoScientific) according to the manufacturer’s instructions
and the chemiluminescence was visualised using Labworks 4.1 software.
Table 16. List of primary antibodies used in Western blotting.
Antibody Clone Description Source Dilution
Anti-myc 4A6 Mouse monoclonal to myc tag
Millipore 1:2000
Anti-HA 12CA5 Mouse monoclonal to HA tag
Abcam 1:2000
Anti-VE-
cadherin BV9
Mouse monoclonal to VE-cadherin Abcam 1:2000
Anti-β-Actin ab8226 Mouse monoclonal to β-Actin Abcam 1:2000
67
2.5.8 Membrane localisation study by immunoprecipitation
To test that the epitope tags do not interfere with protein localisation and that
the BiFC epitope-tagged proteins lacking a cytosolic domain still reach the
plasma membrane the proteins were immunoprecipitated with antibodies
specific to their tags, followed by detection by immunoblotting. The antibody
was added directly to the cells that express the protein of interest so that only
the proteins on the plasma membrane would be detected. The plasma
membrane expression level could then be compared with the expression of
the corresponding full-length protein as well as the expression in whole cell
lysates.
HEK293T cells were transiently transfected with 2.5 µg of each DNA
construct using Lipofectamine® LTX Plus as described in section 2.10. After
the 24 hours of incubation at 37°C in the humidified incubator anti-myc
(mouse monoclonal 4A6; Millipore) primary antibody was added to each well
at 1 in 1000 dilution and incubated at room temperature for 10 minutes with
gentle rocking. The media was then removed and cells were rinsed once with
1 ml/well ice-cold HBSS. The cells were lysed by adding 250 µl of ice-cold
lysis buffer (refer to Table 3 for the composition) containing complete
Protease Inhibitor Tablet (Roche) to each well and gently aspirating. The
lysates were transferred to clean Eppendorf tubes and centrifuged at 4°C for
15 minutes at 14000 g. The supernatant was then transferred to clean
Eppendorf tubes and 50 µl of the protein A-sepharose beads (GE Healthcare
Life Sciences) was added to each tube. The lysate-beads mixture was
agitated at 4°C for 2 hours and centrifuged for 2 minutes at 4°C, discarding
the supernatant. The beads were washed 3x with 100 µl lysis buffer,
centrifuging each time for 1 minute at 4°C and discarding the supernatant.
After the last supernatant was removed 25 µl of 4x sample buffer was added
to each tube and boiled for 5 minutes at 95°C. The tubes were centrifuged at
4°C for 2 minutes and the supernatant containing proteins was transferred to
clean Eppendorf tubes.
Samples were then subjected to SDS-PAGE, followed by Western blot and
visualisation as described above in section 2.5.7.
68
2.5.9 Generation of quantitative data and statistical analysis
ImageJ software (https://imagej.nih.gov/ij/) was used to carry out quantitative
analysis of results. HEK293T cells were transiently co-transfected with an
interacting fusion pair of interest, stained with CellMask™ DeepRed
Plasma Membrane Stain and analysed using confocal microscope. The
confocal images were then used to measure the fluorescence intensity. For
BiFC quantification multiple images were taken in random distribution.
Confocal images, one from yellow channel (YFP fluorescence signal) and
one from red channel (plasma membrane stain) were opened in ImageJ
software. Images were then merged by selecting from Menu Bar: Image →
Colour → Merge channels and then selecting the image for the red channel
(C1) and for the yellow channel (C7), thus creating a composite image and
keeping the source images too. The composite image was then used to
select the border of each cell using a polygon selection tool and adding the
selection, one at a time, in region of interest (ROI) manager
(Analyse→Tools→ROI Manager). In addition, a region containing no cell was
selected as a background in each confocal image analysed. The selected
cells were analysed, each channel at a time, by selecting from Menu Bar
option Analyse→Set Measurements→select Area, min and max grey value,
integrated density and mean grey value→redirected to (a channel to be
analysed)→OK. To get the values for the selected channel the Measure
option in ROI Manager was chosen and the results were saved as an Excel
file.
To calculate the corrected total cell fluorescence (CTCF) the following
formula was used: integrated density minus (area of selected cell x mean
fluorescence of background readings). This was done for all the selected
cells from the yellow channel as well as the red channel. The values were
then used to calculate yellow/red ratio in individual cells by dividing the
corrected fluorescent intensity derived from bimolecular fluorescence
complementation (e.g. YFP-VN+YFP-VC) by the corrected fluorescence
signal derived from the plasma membrane stain. On average about 700 cells
for each fusion protein combination were analysed from several fields in at
69
least three independent experiments. To determine the distribution of ratios
Bin Limits were first created ranging from 0.01 to 4.01 in the interval of 0.1.
Then, the frequency was determined using the Frequency function in Excel
by selecting ratio values data array and bins data array and then the formula
was entered as a multi-cell array by pressing Ctrl+Shift+Enter. The
distributions of ratios in individual cells were then plotted in histogram.
To calculate the average yellow fluorescence intensity the border of each cell
was traced in the ImageJ using a polygon selection and the average pixel
intensity of the selected region, including border, was calculated. Since the
cells were stained with the plasma membrane stain all the cells were
selected based on the red fluorescence signal outlining the membrane,
including those that did not exhibit the yellow fluorescence signal. To account
for the variability in transfection efficiency the images were acquired from
multiple fields per well and used for analysis. The background signal in an
area with no cells was subtracted from all values as described above. BiFC
fluorescence intensity values from at least three independent experiments
were averaged and used for statistical analysis.
Data were analysed with ImageJ, Microsoft Excel and IBM SPSS Statistics
22 software, using Kruskal-Wallis H test and Mann-Whitney U test. A P value
of <0.05 was considered statistically significant for any set of data.

70
Chapter 3
Optimisation of the Bimolecular Fluorescence Complementation (BiFC) assay and validation of the quantitation procedure
71
3.1 Introduction
The overall object of this thesis is to investigate receptor protein tyrosine
phosphatases of R3 subgroup using bimolecular fluorescence
complementation (BiFC) assay and in this chapter as a preliminary step the
assay has been optimised and validated using a pair of well characterised
interacting proteins. This assay enables direct visualisation of protein
interactions in living cells, mimicking their normal cellular environment
(Kerppola, 2006). The BiFC assay is based on the principle of protein
fragment complementation, in which two non-fluorescent fragments from the
Venus yellow fluorescent protein are fused to a pair of interacting partners. If
these two proteins interact with each other they bring the two non-fluorescent
fragments into close proximity, resulting in proper folding and assembly, thus
reconstituting a fluorescent protein. Therefore the reconstituted fluorescence
reflects the interaction of two proteins of interest (Kerppola, 2008). The
assembled complex produces strong intrinsic fluorescence that can be
detected by a confocal microscope without the need for staining with
exogenous fluorogenic and chromogenic agents (Kerppola, 2006).
However, this approach has some limitations. The main two limitations are
self-assembly of the two non-fluorescent fragments and irreversibility that
can contribute to the false-positive fluorescence and decreases the signal-to-
noise ratio, making data interpretation difficult (Kodama and Hu, 2010). To
address the problem with self-assembly various mutants, such as V150L,
I152L and T153M, have been introduced in fragments of a Venus yellow
fluorescent protein in order to weaken the hydrophobic interaction between
VN155 and VC155 and to reduce the background fluorescence (Kodama and
Hu, 2010; Nakagawa et al, 2011). It has been previously reported that V150L
resulted in very low fluorescence intensity in BiFC with bJunVN and bFosVC.
The point mutation of T153M showed lower fluorescence intensity in BiFC
with bJunVN and bFosVC but higher in BiFC with bJunVN and ∆bFosVC
compared with I152L. However, the point mutation of I152L in VN155 of
Venus significantly reduced self-assembly and decreased background
fluorescence without significantly altering the overall structure (Kodama and
72
Hu, 2010). This improved Venus fragment should facilitate the study of
protein interactions in living cells in this project.
Numerous protein interactions have been visualised using the BiFC assay in
many different cell types and organisms. For example, a study by Magliery et
al (2006) used the GFP-based BiFC assay to study protein-peptide
interactions in BL21 (DE3) Escherichia coli cells. In their study the
interactions of TPR1 and TPR2A (tetratricopeptide repeat) domains with
protein chaperones Hsc70 and Hsp90 were analysed. TPR1 binds to the C-
terminus of the human chaperone Hsc70 and TPR2A binds to the C-terminus
of Hsp90 (Magliery et al, 2006). The BiFC results confirmed the known
interactions and showed that protein-peptide or protein-protein interactions
are clearly required for the reassembly of the GFP and that the BiFC
approach was useful for discriminating strongly bound ligands from weakly
bound ones (Magliery et al 2006).
Another study by Walter et al (2004) adopted the BiFC approach to address
its feasibility for visualisation of the basic leucine zipper (bZIP) transcription
factor bZIP63 homodimerisation in living plant cells. It has been shown
previously that nuclear bZIP63 transcription factor forms homodimers and
heterodimers via the C-terminal leucine zipper domain (Siberil et al, 2001).
The BiFC results showed that the epidermal cells infiltrated with bZIP63-
YFPN and bZIP63-YFPC-carrying Agrobacteria resulted in a strong
fluorescence signal (Walter et al, 2004). The homodimerisation-induced YFP
fluorescence appeared exclusively inside the nucleus which corresponded to
the nuclear localisation of the bZIP63 (Walter et al, 2004). The same study
by Walter et al (2004) also showed that the BiFC approach could be used to
visualise cytoplasmic protein-protein interactions in plant cells. Previous
experiments showed that the tobacco 14-3-3 protein T14-3c (T14) forms
homodimers, which was also demonstrated by the BiFC experiments. The
co-expression of T14-YFPN and T14-YFPC resulted in strong YFP
fluorescence detected throughout the cytoplasm and the nucleus. The
localisation of homodimer formation corresponded to the subcellular
distribution of T14-3c, demonstrating that BiFC is a very efficient technology
73
for the analysis of protein–protein interactions in living plants cells (Walter et
al, 2004).
Some transmembrane protein interactions have also been studied using the
BiFC approach. For example, a group led by de Virgilio et al (2004) used
BiFC to define αIIbβ3 - tyrosine kinase interactions in living cells as well as to
obtain subcellular localisation of αIIbβ3 - tyrosine kinase complexes.
Transmembrane platelet integrin αIIbβ3 plays a critical role in platelet
aggregation by binding to soluble ligands like c-Src. BiFC analysis revealed
that the co-expression of αIIbYCβ3 (fused to the C-terminal part of YFP) with
SrcYN (fused to the N-terminal part of YFP) resulted in a fluorescent signal
within membrane ruffles, focal complexes and focal adhesions. The
localisation of BiFC corresponded with where the proteins were previously
co-localised with antibody-labelled αIIbβ3 and c-Src in fixed cells (de Virgilio
et al, 2004). The same experiments showed that αIIbβ3 can also interact with
spleen tyrosine kinase Syk. The co-expression of αIIbYCβ3 and SykYN
detected BiFC signal confined primarily to ruffles and nascent adhesion
structures close to the cell periphery. The above results were complemented
with and corresponded to the results obtained with bioluminescence
resonance energy transfer (BRET) (de Virgilio et al, 2004).
Although the BiFC method has gained popularity in protein-protein
interaction studies there is still a major downside that the non-fluorescent
fragments of YFP are prone to self-assembly independent of a protein-
protein interaction event. To establish whether fluorescence observed in the
BiFC assay reflects a specific protein interaction, it is essential to include
negative controls in each experiment. A literature survey on recent BiFC
studies carried out by Horstman et al (2014) revealed that most studies use
inappropriate controls and rely on qualitative rather than quantitative read-out
of fluorescence. The validity of results from BiFC analysis must be confirmed
by examining fluorescence complementation by fusion proteins in which the
interaction interface has been mutated (Kerppola, 2006). However, this is
possible only if there is a prior knowledge of the structural nature of the
interaction interface. It was suggested by Kerppola et al (2006) that multiple

74
combinations of fusion proteins need to be tested for BiFC. Amino- and
carboxyl-terminal fusions can be used to test eight distinct combinations
(refer to Figure 10; obtained and modified from Kerppola (2006)) in order to
find a favourable combination that would reflect the precise structures and
flexibilities of the fusion proteins (Kerppola, 2006).
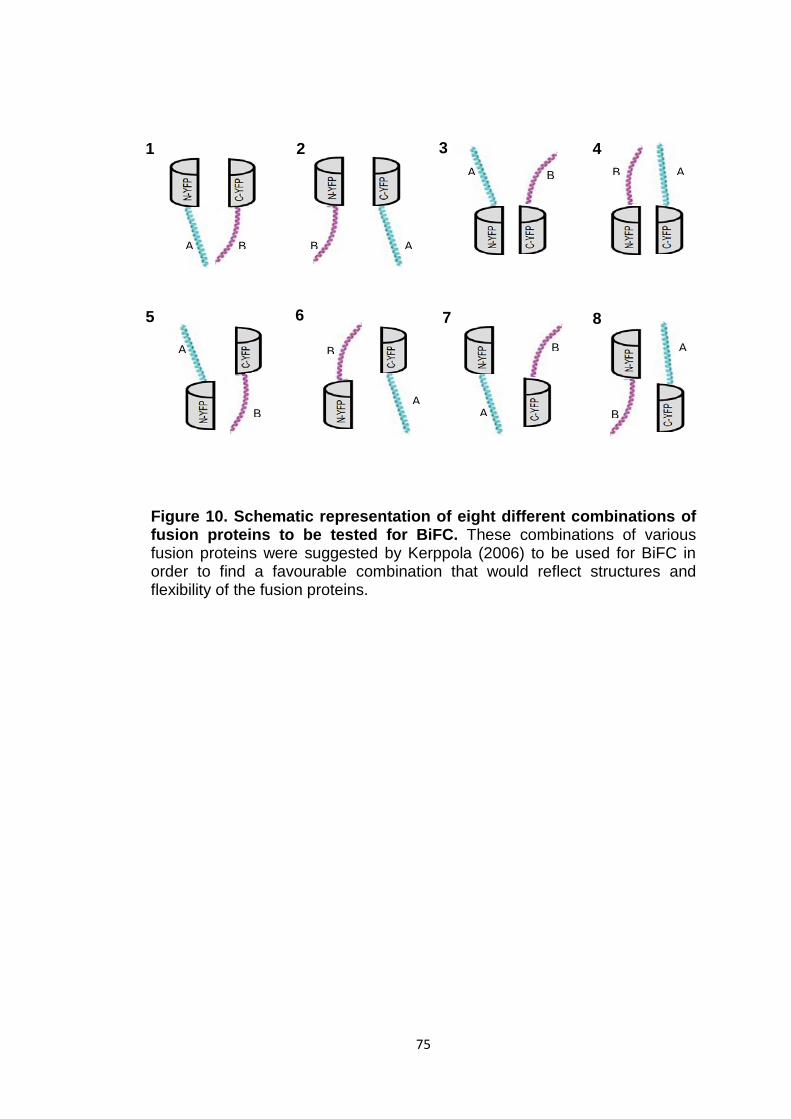
75
Figure 10. Schematic representation of eight different combinations of fusion proteins to be tested for BiFC. These combinations of various fusion proteins were suggested by Kerppola (2006) to be used for BiFC in order to find a favourable combination that would reflect structures and flexibility of the fusion proteins.
A B
1
5
2
B A
3 A B
A
B
6
4 B A
B
A
7
A
B
8
B
A
76
In addition, it is also recommended to use some of the numerous fusion
proteins whose interactions have been visualised using the BiFC assay as
positive controls.
Because of the self-assembly capacity of the two halves of the YFP the
qualitative analysis of the BiFC method has proved problematic. Thus BiFC
quantification of protein-protein interactions in living cells has been proposed
in order to distinguish between a fluorescence complementation by a true
protein-protein interaction and a signal due to self-assembly of the two YFP
fragments (Horstman et al, 2014). It is necessary to compare the quantitative
data obtained from the protein combination of interest and from a negative
control combination. One method for BiFC quantification is to determine the
average fluorescence intensity from fluorescent images. However, this
method requires measurement of cells on a one-by-one basis. In addition, in
transient assays it is difficult to maintain relatively uniform and constant
expression levels in the entire cell population and in replicate experiments.
Therefore, to determine the statistical significance between experimental and
control interaction pairs a large number of cells from random fields and
multiple experiments have to be analysed (Kerppola, 2006; Horstman et al,
2014). Additional quantification analyses performed in this thesis were
adapted from Kodama and Hu (2010) and from Kerppola (2013). In previous
studies the BiFC relative efficiency was quantified by determining the
fluorescence intensity of BiFC complex and dividing it by the intensity of the
control protein Cerulean. The distribution of ratios between the fluorescence
intensities in individual cells was plotted in histogram (Kerppola, 2013). In
this thesis the ratio of BiFC to cell membrane stain (rather than Cerulean)
represented a measure of the efficiency of bimolecular fluorescence
complementation. In addition the previous studies also looked at the signal-
to-noise (S/N) ratio as a measure of BiFC specificity. The higher the S/N ratio
value the more specific the interaction. The S/N ratio was calculated by
dividing a median of the BiFC efficiency with the positive interaction by a
median of the BiFC efficiency with the negative interaction (Kerppola, 2013;
Kodama and Hu, 2010).
77
In this chapter the objectives were to validate a novel quantification
procedure using bJun, bFos and bFosΔZIP YFP fusion proteins and to
optimise the assay to enhance the BiFC signal and to minimise background
noise due to self-assembly of the YFP halves. It has been previously shown
that two proteins bJun and bFos interact together. bFos directly modulates
bJun function by formation of a heterodimer of bFos and bJun proteins
(Ransone et al, 1990). In previous work Hu and colleagues (2002) used the
basic region-leucine zipper (bZIP) family of transcription regulatory proteins
bJun and bFos to establish BiFC assay. bFos-YC (fused to the C-terminal
part of the yellow fluorescent protein) and bJun-YN (fused to the N-terminal
part of the yellow fluorescent protein) fusion pair exhibited high fluorescence
intensity when co-expressed together in COS-1 cells. Fluorophore formation
by bFos-YC/bJun-YN fusion pair showed sigmoidal kinetics, consistent with
bimolecular association of the two subunits followed by fluorophore formation
at the rate comparable to that observed for intact YFP. The excitation and
emission spectra of the bFos-YC/bJun-YN heterodimer were also identical to
those of intact YFP (Hu et al, 2002). The introduction of a mutation into the
interaction interface of bFos (bFosΔZIP-YC) has been shown to decrease
significantly the fluorescence signal under the same experimental conditions,
reflecting the specific interaction between bFos-YC/bJun-YN (Hu et al, 2002).
Based on previous studies by Hu et al (2002) bFos-VC/bJun-VN (fused to C-
and N-terminal parts of the Venus yellow fluorescent protein respectively)
and bFosΔZIP-VC/bJun-VN fusion pairs were used as positive and negative
control respectively.
Figure 11 (A) shows the schematic representation of bFos-VC/bJun-VN
bimolecular complex formation. Upon the interaction of these two proteins
the non-fluorescent YFP fragments are brought into close proximity,
reconstituting full-length functional yellow fluorescent protein. The resultant
fluorescence is then detected by any confocal microscope. The mutated form
of bFos-VC that lacks the interaction region (bFos∆ZIP-VC), in theory, would
not be able to interact with bJun-VC. As a result there is no interaction and
thus no bimolecular complex formation (Figure 11, B) and in theory there
should be no detectable fluorescence signal.
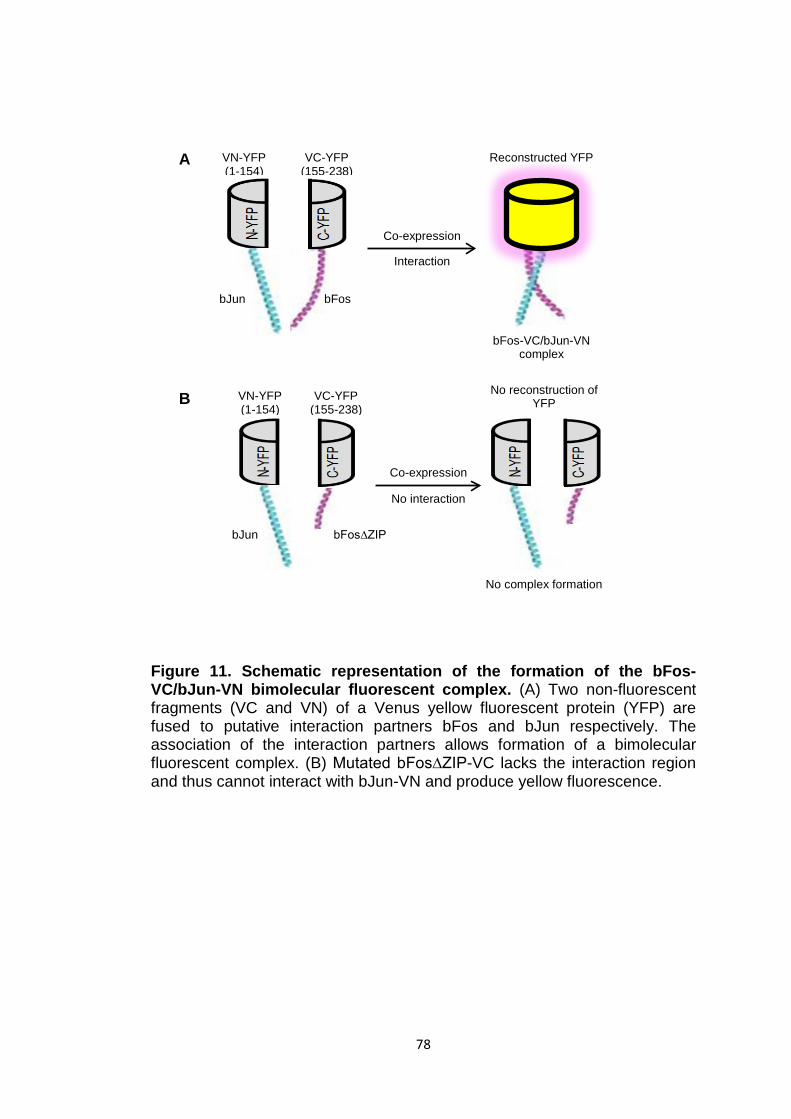
78
Figure 11. Schematic representation of the formation of the bFos-VC/bJun-VN bimolecular fluorescent complex. (A) Two non-fluorescent fragments (VC and VN) of a Venus yellow fluorescent protein (YFP) are fused to putative interaction partners bFos and bJun respectively. The association of the interaction partners allows formation of a bimolecular fluorescent complex. (B) Mutated bFos∆ZIP-VC lacks the interaction region and thus cannot interact with bJun-VN and produce yellow fluorescence.
bJun bFos
Reconstructed YFP
bFos-VC/bJun-VN complex
Co-expression
Interaction
VN-YFP (1-154)
VC-YFP (155-238)
bJun bFos∆ZIP
No reconstruction of YFP
No complex formation
Co-expression
No interaction
VN-YFP (1-154)
VC-YFP (155-238)
A
B
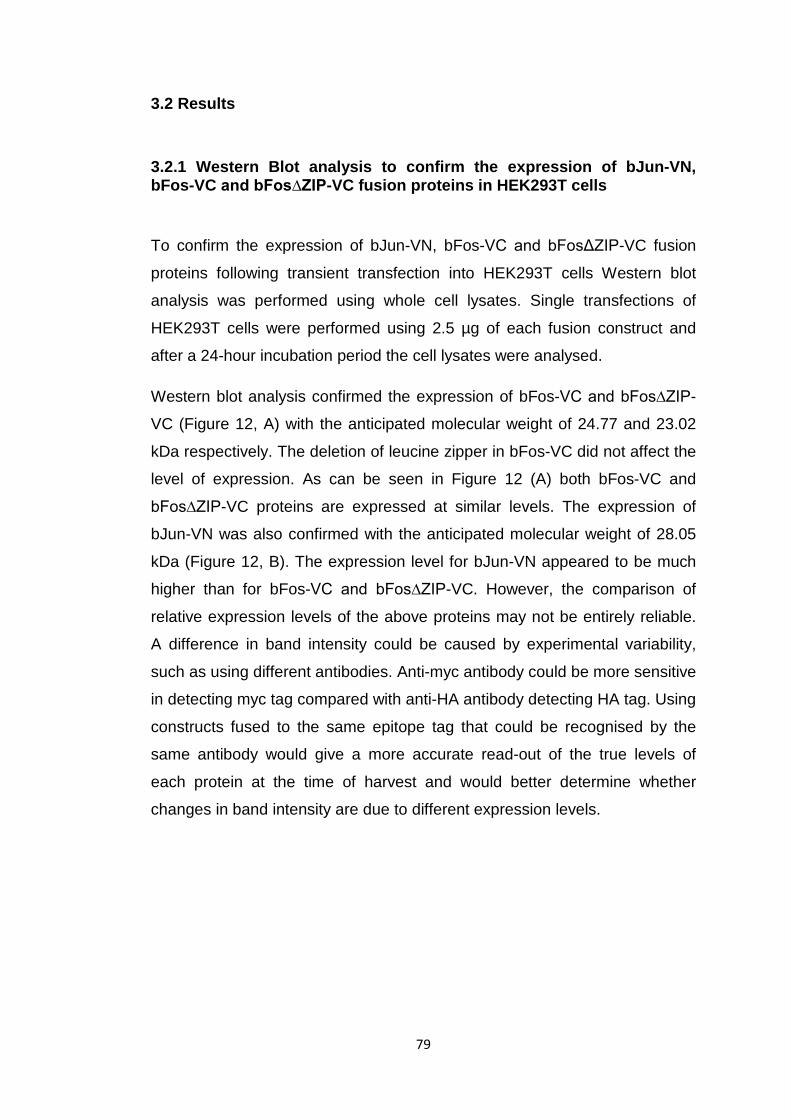
79
3.2 Results
3.2.1 Western Blot analysis to confirm the expression of bJun-VN, bFos-VC and bFos∆ZIP-VC fusion proteins in HEK293T cells
To confirm the expression of bJun-VN, bFos-VC and bFosΔZIP-VC fusion
proteins following transient transfection into HEK293T cells Western blot
analysis was performed using whole cell lysates. Single transfections of
HEK293T cells were performed using 2.5 µg of each fusion construct and
after a 24-hour incubation period the cell lysates were analysed.
Western blot analysis confirmed the expression of bFos-VC and bFos∆ZIP-
VC (Figure 12, A) with the anticipated molecular weight of 24.77 and 23.02
kDa respectively. The deletion of leucine zipper in bFos-VC did not affect the
level of expression. As can be seen in Figure 12 (A) both bFos-VC and
bFos∆ZIP-VC proteins are expressed at similar levels. The expression of
bJun-VN was also confirmed with the anticipated molecular weight of 28.05
kDa (Figure 12, B). The expression level for bJun-VN appeared to be much
higher than for bFos-VC and bFos∆ZIP-VC. However, the comparison of
relative expression levels of the above proteins may not be entirely reliable.
A difference in band intensity could be caused by experimental variability,
such as using different antibodies. Anti-myc antibody could be more sensitive
in detecting myc tag compared with anti-HA antibody detecting HA tag. Using
constructs fused to the same epitope tag that could be recognised by the
same antibody would give a more accurate read-out of the true levels of
each protein at the time of harvest and would better determine whether
changes in band intensity are due to different expression levels.
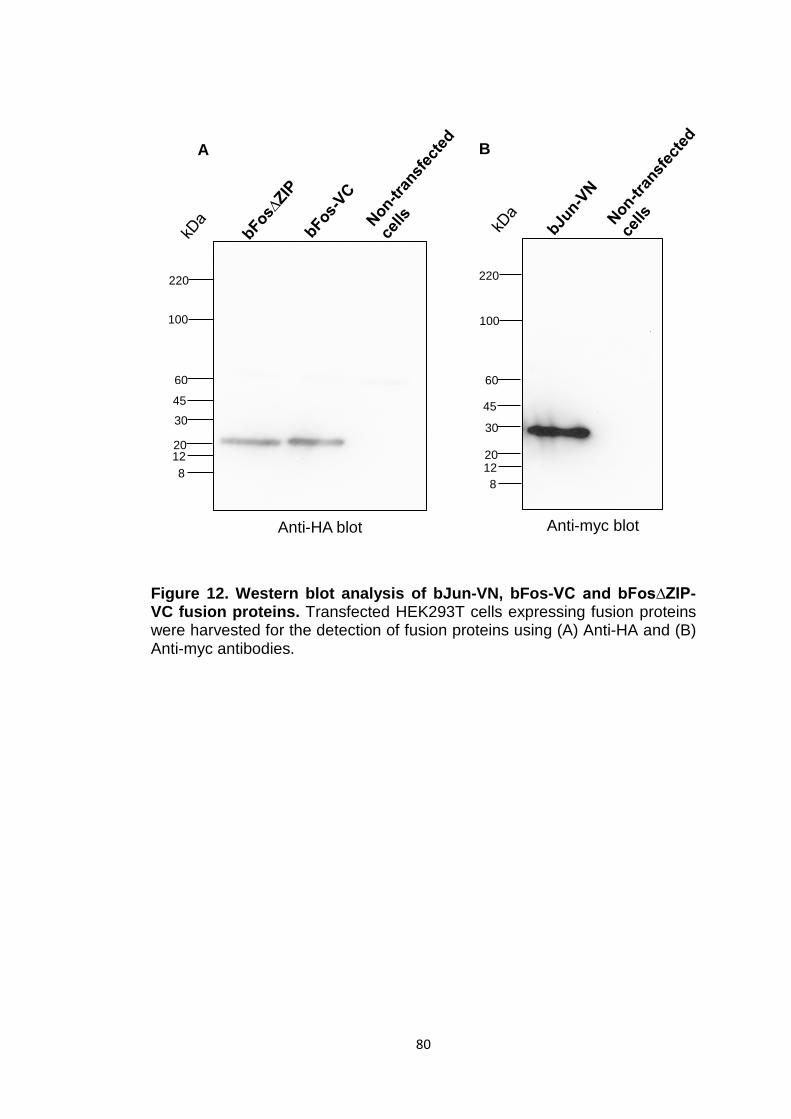
80
Figure 12. Western blot analysis of bJun-VN, bFos-VC and bFos∆ZIP-VC fusion proteins. Transfected HEK293T cells expressing fusion proteins were harvested for the detection of fusion proteins using (A) Anti-HA and (B) Anti-myc antibodies.
8 12 20
30
45
60
100
220
Anti-HA blot
A
8 12 20
30
45
60
100
220
Anti-myc blot
B
81
3.2.2 Comparison of HEK293 and HEK293T cell lines
The human embryonic kidney 293 (HEK293) cell line is widely used in many
transfection experiments due to the cells’ high transfection efficiency and
rapid growth. HEK293T cells are derived from HEK293 cells but have been
transduced with the SV40 large T antigen (Simian Vacuolating Virus 40 Tag)
that can bind to SV40 enhancer of expression vectors, promoting plasmid
replication, and thus considerably increase the expression levels obtained
with transient transfection.
In order to establish the cell line that results in higher BiFC signal both
HEK293 and HEK293T cell lines were transiently co-transfected with bFos-
VC/bJun-VN and bFosΔZIP-VC/bJun-VN fusion pairs, using 0.25 µg of each
DNA fusion construct using Lipofectamine® LTX Plus. After a 24-hour
incubation live cells were examined under a confocal microscope to compare
fluorescence signal.
Both cell lines exhibited yellow fluorescence (Figure 13) after being co-
transfected with the bFos-VC/bJun-VN fusion pair. However, qualitative
assessment of at least three randomly acquired images from two
independent experiments showed that the co-expression of bFos-VC/bJun-
VN in HEK293T cells produced a stronger yellow fluorescence signal
compared with the signal in HEK293 cells. HEK293T cells exhibited not only
higher intensity of the fluorescent signal but also a higher number of cells
producing the signal. Co-expression of bFos∆ZIP-VC/bJun-VN in either
HEK293 or HEK293T cells did not produce any fluorescence emission
(Figure 13).
Based on qualitative results of this experiment it was considered that
HEK293T cells exhibit higher protein expression efficiency since the
transfection and confocal analysis were carried out under the same
conditions and using the same parameters. In addition the experiment was
repeated twice and resulted in the same outcome. Therefore the HEK293T
cell line was chosen for further experiments.
82
Figure 13. Confocal analysis of expression efficiency in HEK293 and HEK293T cells. Cells were co-transfected with either bFos-VC/bJun-VN or bFos∆ZIP-VC/bJun-VN fusion pairs using 0.25 µg of each DNA fusion construct and images were acquired 24 hours after transfection. The scale bar is 47.62 µm.
bFos-VC/bJun-VN
HEK
293
BiFC Bright Field BiFC Bright Field
bFos∆ZIP-VC/bJun-VN
HEK
293T
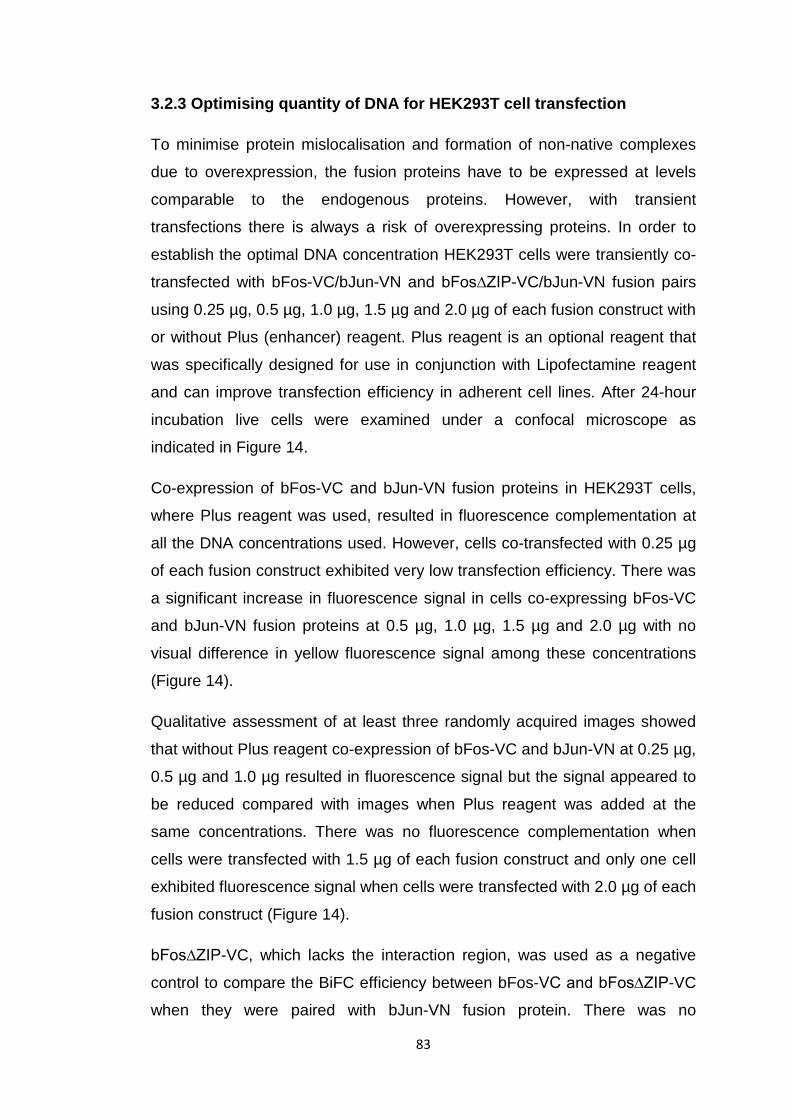
83
3.2.3 Optimising quantity of DNA for HEK293T cell transfection
To minimise protein mislocalisation and formation of non-native complexes
due to overexpression, the fusion proteins have to be expressed at levels
comparable to the endogenous proteins. However, with transient
transfections there is always a risk of overexpressing proteins. In order to
establish the optimal DNA concentration HEK293T cells were transiently co-
transfected with bFos-VC/bJun-VN and bFos∆ZIP-VC/bJun-VN fusion pairs
using 0.25 µg, 0.5 µg, 1.0 µg, 1.5 µg and 2.0 µg of each fusion construct with
or without Plus (enhancer) reagent. Plus reagent is an optional reagent that
was specifically designed for use in conjunction with Lipofectamine reagent
and can improve transfection efficiency in adherent cell lines. After 24-hour
incubation live cells were examined under a confocal microscope as
indicated in Figure 14.
Co-expression of bFos-VC and bJun-VN fusion proteins in HEK293T cells,
where Plus reagent was used, resulted in fluorescence complementation at
all the DNA concentrations used. However, cells co-transfected with 0.25 µg
of each fusion construct exhibited very low transfection efficiency. There was
a significant increase in fluorescence signal in cells co-expressing bFos-VC
and bJun-VN fusion proteins at 0.5 µg, 1.0 µg, 1.5 µg and 2.0 µg with no
visual difference in yellow fluorescence signal among these concentrations
(Figure 14).
Qualitative assessment of at least three randomly acquired images showed
that without Plus reagent co-expression of bFos-VC and bJun-VN at 0.25 µg,
0.5 µg and 1.0 µg resulted in fluorescence signal but the signal appeared to
be reduced compared with images when Plus reagent was added at the
same concentrations. There was no fluorescence complementation when
cells were transfected with 1.5 µg of each fusion construct and only one cell
exhibited fluorescence signal when cells were transfected with 2.0 µg of each
fusion construct (Figure 14).
bFos∆ZIP-VC, which lacks the interaction region, was used as a negative
control to compare the BiFC efficiency between bFos-VC and bFos∆ZIP-VC
when they were paired with bJun-VN fusion protein. There was no
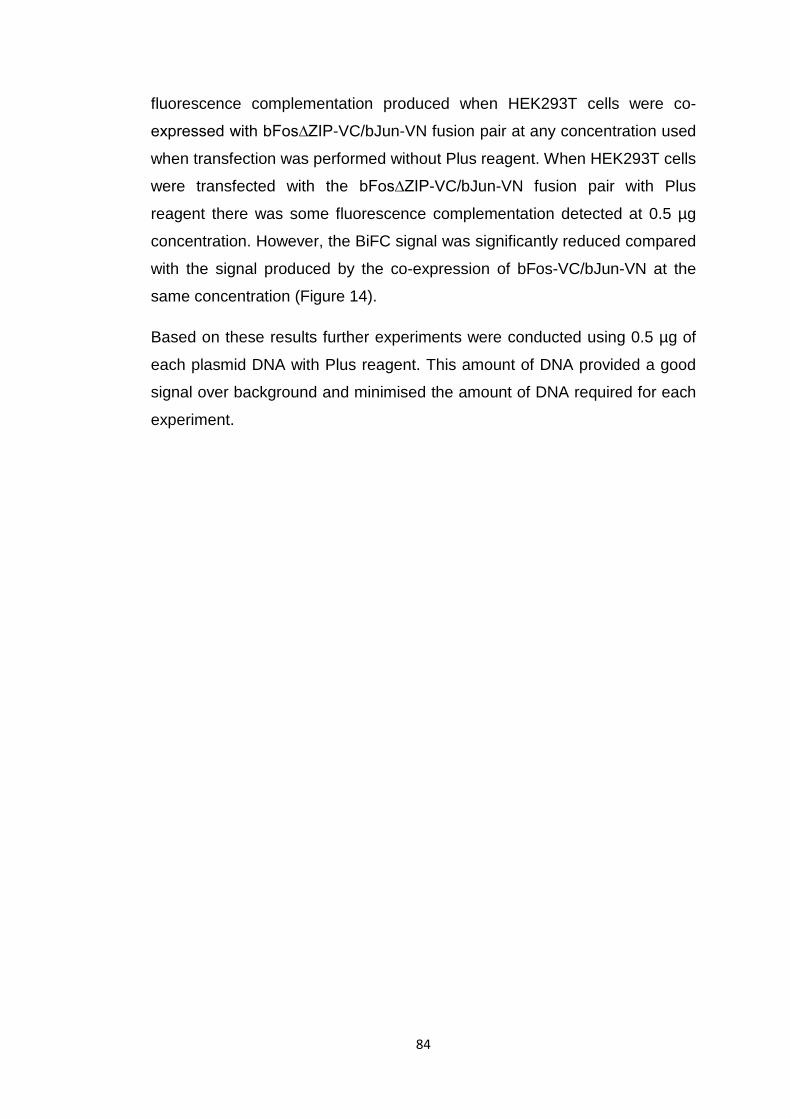
84
fluorescence complementation produced when HEK293T cells were co-
expressed with bFos∆ZIP-VC/bJun-VN fusion pair at any concentration used
when transfection was performed without Plus reagent. When HEK293T cells
were transfected with the bFos∆ZIP-VC/bJun-VN fusion pair with Plus
reagent there was some fluorescence complementation detected at 0.5 µg
concentration. However, the BiFC signal was significantly reduced compared
with the signal produced by the co-expression of bFos-VC/bJun-VN at the
same concentration (Figure 14).
Based on these results further experiments were conducted using 0.5 µg of
each plasmid DNA with Plus reagent. This amount of DNA provided a good
signal over background and minimised the amount of DNA required for each
experiment.
85
Figure 14. BiFC and bright field images of HEK293T cells transfected with either bFos-VC/bJun-VN or bFos∆ZIP-VC/bJun-VN fusion pairs at various concentrations. HEK293T cells were transfected with fusion pairs at different concentration with and without Plus reagent to determine the optimum concentration for further experiments. Confocal analysis was performed 24 hours post-transfection.
Jun/Fos + Plus reagent
Jun/Fos - Plus reagent
Jun/∆Fos + Plus reagent
Jun/∆Fos - Plus reagent
2.0 µg
1.5 µg
1.0 µg
0.25 µg
0.5 µg
DNA Amount
86
3.2.4 Determining the optimal time-scale for expression of bFos-VC/bJun-VN and bFosΔZIP-VC/bJun-VN fusion pairs in HEK293T cells
In BiFC transient expression experiments fluorescence from specific
interactions can generally be detected between 12 and 30 hours after
transfection (Kerppola, 2006). A BiFC assay is not a “real-time” kinetic
measurement of protein-protein association and the fluorescence signal
increases with incubation time (Rose et al, 2010). However, caution must be
taken as the fluorescence signal accumulates in time due to the irreversible
nature of YFP complementation and the saturation of fluorescence signal
influences the signal-to-noise ratio (Horstman et al, 2014). Therefore, it is
essential to determine the optimal time-scale for expression of the BiFC
fusion proteins.
The initial BiFC assay validation experiments were analysed 24 hours post
transfection. It was therefore decided to compare BiFC confocal analyses at
24 and 48 hours. Longer time points (e.g. 72 hours) resulted in over-
confluent detached cells. All the other image acquisition parameters, such as
laser power, pinhole and detection gain, were held constant within an
experiment. The BiFC signal in cells transfected with bFos-VC/bJun-VN
fusion pair was higher at 24 hours post-transfection when compared with 48
hours (Figure 15, A). After 48 hours post-transfection there were fewer cells
exhibiting the fluorescence signal and the signal was more saturated (Figure
15, B). A 48-hour incubation period also resulted in some weak background
fluorescence signal in the YFP channel due to nonspecific interactions in
cells transfected with bFos∆ZIP-VC/bJun-VN fusion pair (Figure 15, B). This
could be explained by the irreversible complex formation between two non-
fluorescent YFP fragments and the prolonged post-transfection incubation
may result in the accumulation of the fluorescence signal, leading to false-
positive results and making the data interpretation difficult.
Based on these results further BiFC experiments with bJun, bFos and
bFosΔZIP fusion proteins as well as with all the membrane proteins of
interest were analysed at 24 hours after transfection.
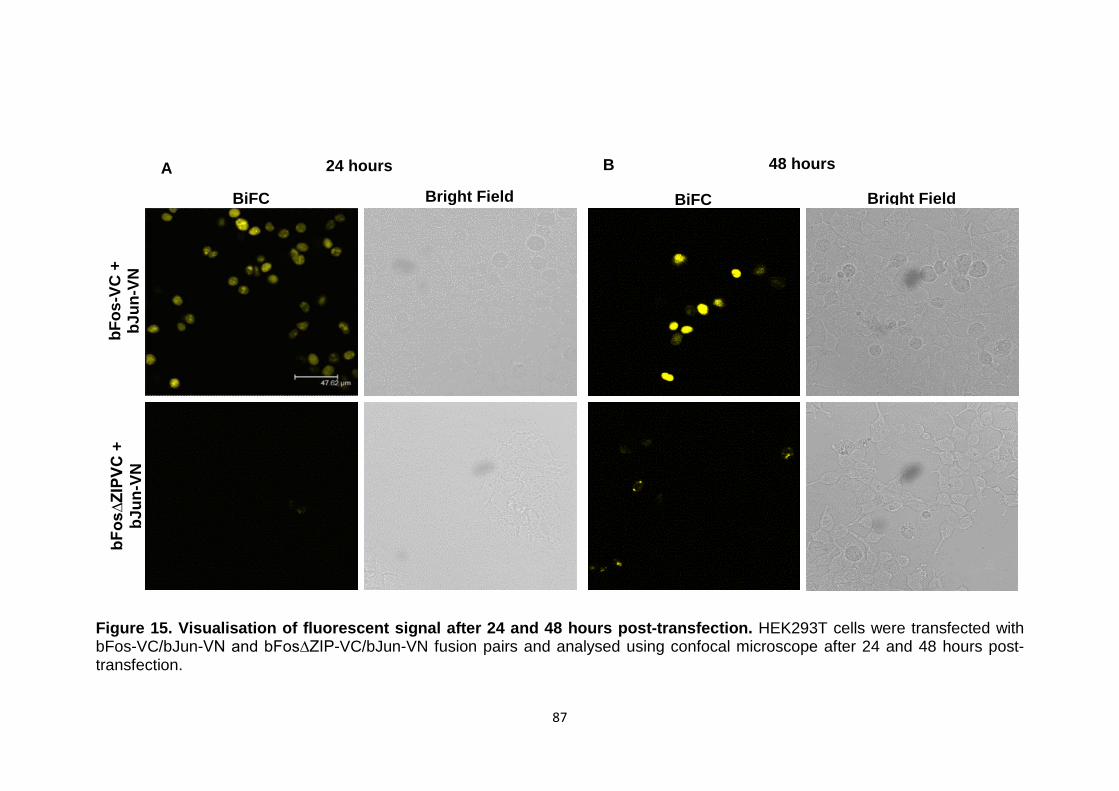
87
Figure 15. Visualisation of fluorescent signal after 24 and 48 hours post-transfection. HEK293T cells were transfected with bFos-VC/bJun-VN and bFos∆ZIP-VC/bJun-VN fusion pairs and analysed using confocal microscope after 24 and 48 hours post-transfection.
BiFC Bright Field
bFos
∆ZIP
VC +
bJ
un-V
N
24 hours
BiFC Bright Field
bFos
-VC
+
bJun
-VN
48 hours A B
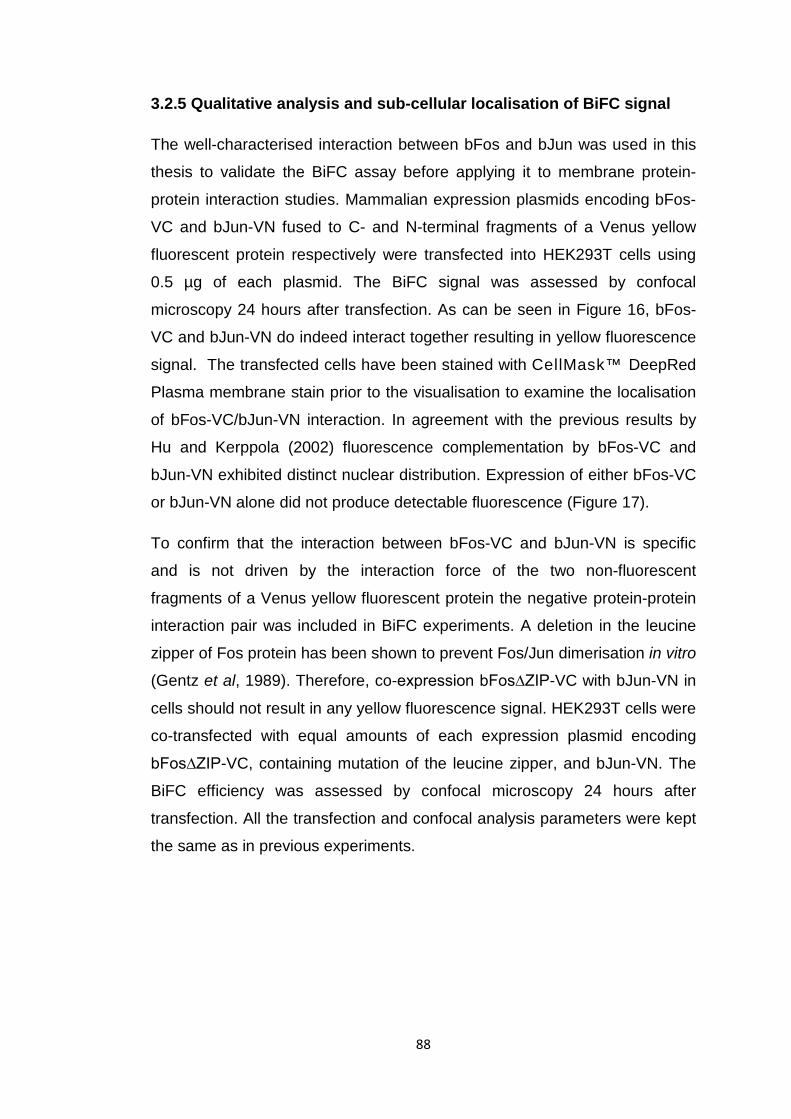
88
3.2.5 Qualitative analysis and sub-cellular localisation of BiFC signal
The well-characterised interaction between bFos and bJun was used in this
thesis to validate the BiFC assay before applying it to membrane protein-
protein interaction studies. Mammalian expression plasmids encoding bFos-
VC and bJun-VN fused to C- and N-terminal fragments of a Venus yellow
fluorescent protein respectively were transfected into HEK293T cells using
0.5 µg of each plasmid. The BiFC signal was assessed by confocal
microscopy 24 hours after transfection. As can be seen in Figure 16, bFos-
VC and bJun-VN do indeed interact together resulting in yellow fluorescence
signal. The transfected cells have been stained with CellMask™ DeepRed
Plasma membrane stain prior to the visualisation to examine the localisation
of bFos-VC/bJun-VN interaction. In agreement with the previous results by
Hu and Kerppola (2002) fluorescence complementation by bFos-VC and
bJun-VN exhibited distinct nuclear distribution. Expression of either bFos-VC
or bJun-VN alone did not produce detectable fluorescence (Figure 17).
To confirm that the interaction between bFos-VC and bJun-VN is specific
and is not driven by the interaction force of the two non-fluorescent
fragments of a Venus yellow fluorescent protein the negative protein-protein
interaction pair was included in BiFC experiments. A deletion in the leucine
zipper of Fos protein has been shown to prevent Fos/Jun dimerisation in vitro
(Gentz et al, 1989). Therefore, co-expression bFos∆ZIP-VC with bJun-VN in
cells should not result in any yellow fluorescence signal. HEK293T cells were
co-transfected with equal amounts of each expression plasmid encoding
bFos∆ZIP-VC, containing mutation of the leucine zipper, and bJun-VN. The
BiFC efficiency was assessed by confocal microscopy 24 hours after
transfection. All the transfection and confocal analysis parameters were kept
the same as in previous experiments.
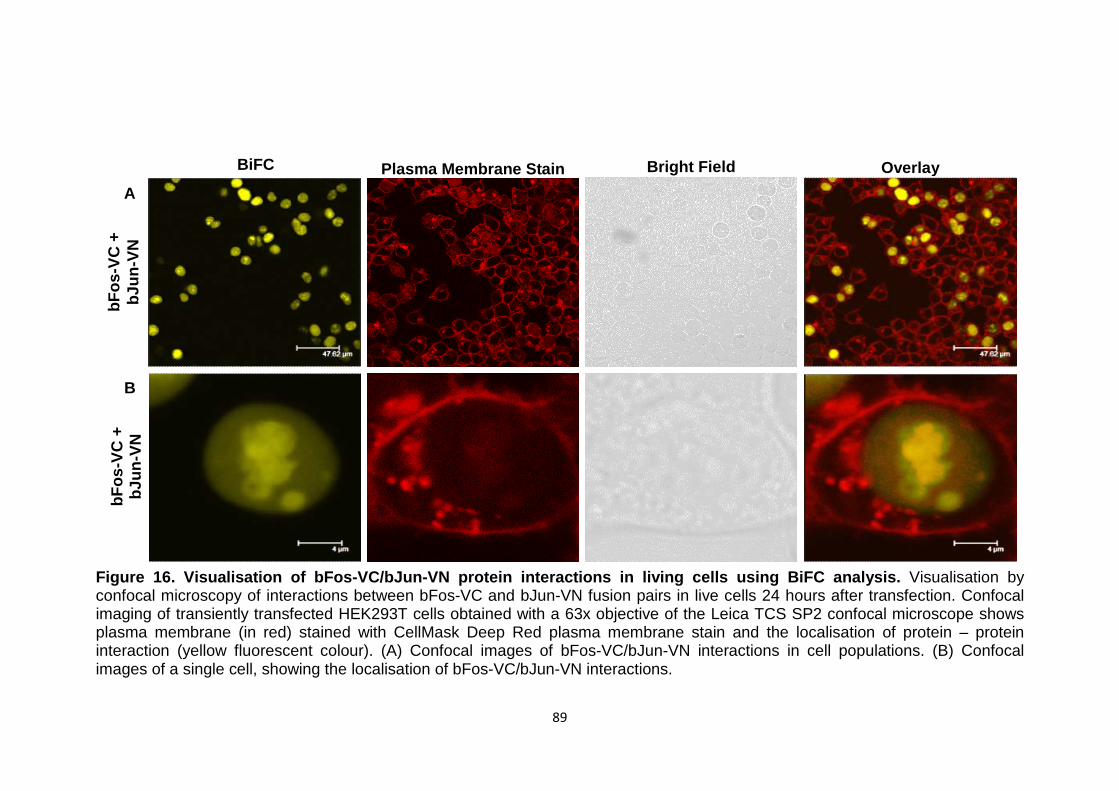
89
Figure 16. Visualisation of bFos-VC/bJun-VN protein interactions in living cells using BiFC analysis. Visualisation by confocal microscopy of interactions between bFos-VC and bJun-VN fusion pairs in live cells 24 hours after transfection. Confocal imaging of transiently transfected HEK293T cells obtained with a 63x objective of the Leica TCS SP2 confocal microscope shows plasma membrane (in red) stained with CellMask Deep Red plasma membrane stain and the localisation of protein – protein interaction (yellow fluorescent colour). (A) Confocal images of bFos-VC/bJun-VN interactions in cell populations. (B) Confocal images of a single cell, showing the localisation of bFos-VC/bJun-VN interactions.
A
BiFC Plasma Membrane Stain Bright Field Overlay
bFos
-VC
+
bJun
-VN
B
bFos
-VC
+
bJun
-VN
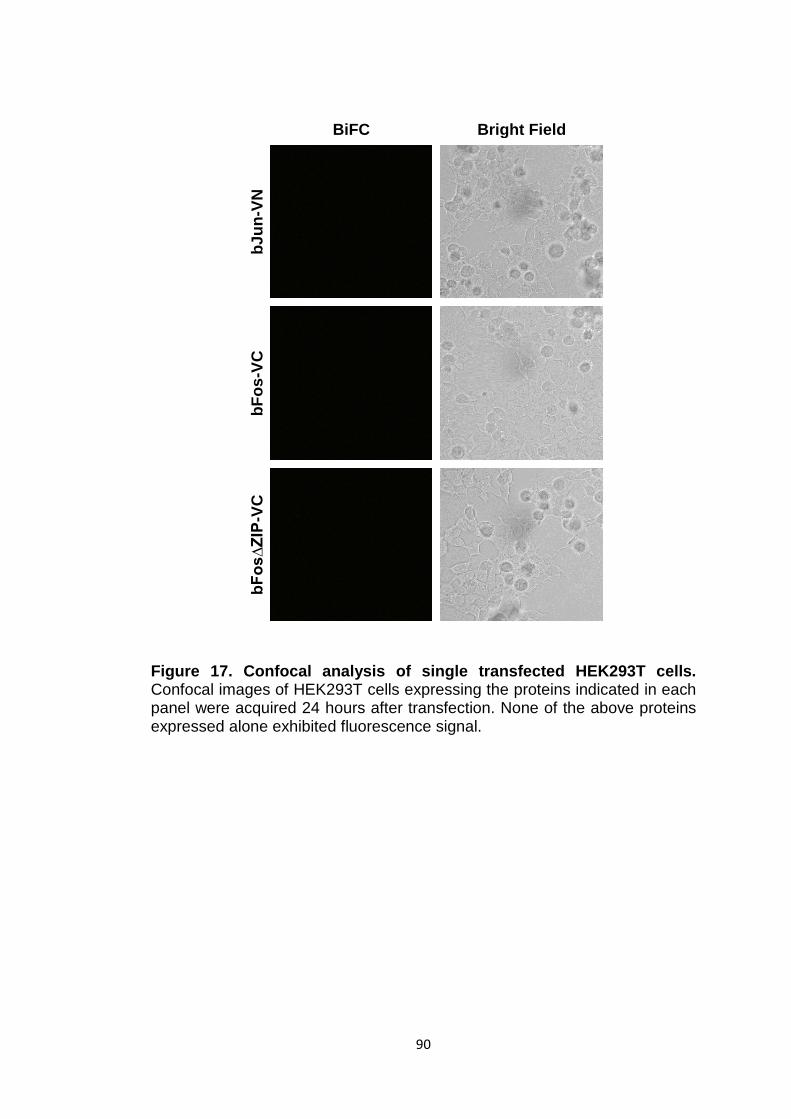
90
Figure 17. Confocal analysis of single transfected HEK293T cells. Confocal images of HEK293T cells expressing the proteins indicated in each panel were acquired 24 hours after transfection. None of the above proteins expressed alone exhibited fluorescence signal.
bJun
-VN
bF
os-V
C
BiFC Bright Field
bFos
∆ZIP
-VC
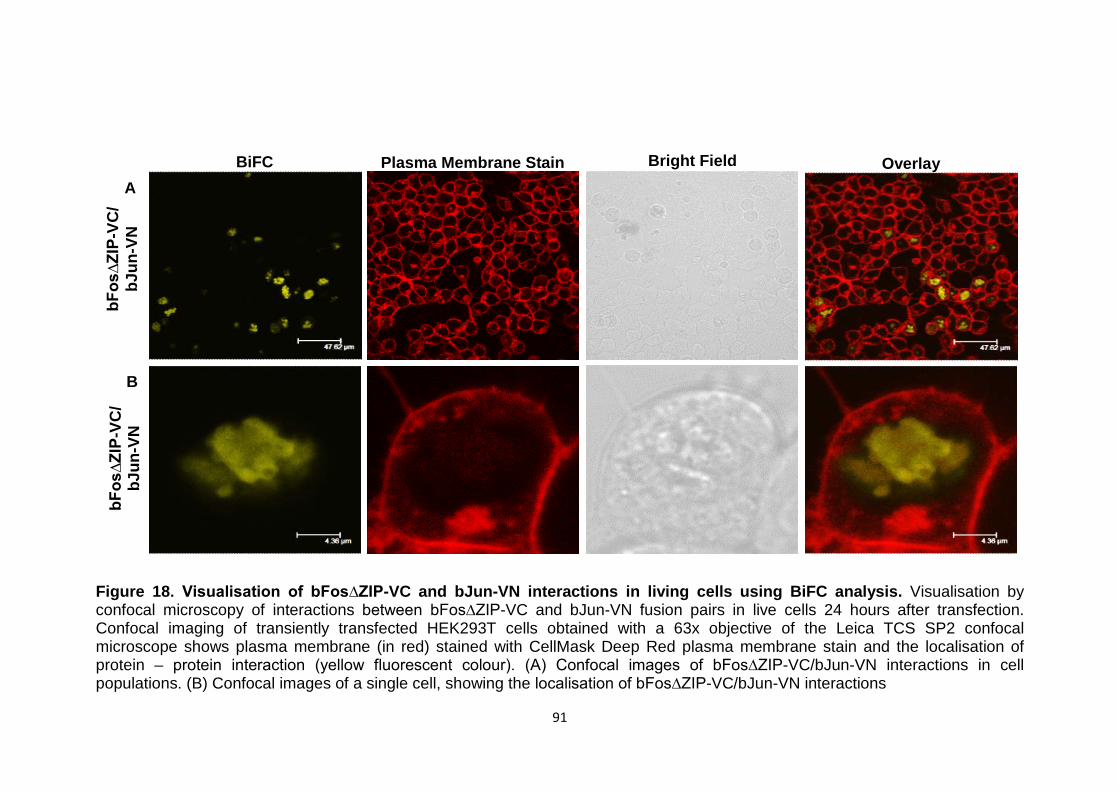
91
Figure 18. Visualisation of bFos∆ZIP-VC and bJun-VN interactions in living cells using BiFC analysis. Visualisation by confocal microscopy of interactions between bFos∆ZIP-VC and bJun-VN fusion pairs in live cells 24 hours after transfection. Confocal imaging of transiently transfected HEK293T cells obtained with a 63x objective of the Leica TCS SP2 confocal microscope shows plasma membrane (in red) stained with CellMask Deep Red plasma membrane stain and the localisation of protein – protein interaction (yellow fluorescent colour). (A) Confocal images of bFos∆ZIP-VC/bJun-VN interactions in cell populations. (B) Confocal images of a single cell, showing the localisation of bFos∆ZIP-VC/bJun-VN interactions
A BiFC Plasma Membrane Stain Bright Field Overlay
bFos
∆ZIP
-VC
/ bJ
un-V
N
bFos
∆ZIP
-VC
/ bJ
un-V
N
B
92
The mutation in the interacting region of bFos caused a significant reduction
in the efficiency of fluorescence complementation. However, the negative
bFos∆ZIP-VC and bJun-VN interaction pair did not eliminate entirely the
yellow fluorescence signal, which was also enriched in the nucleus (Figure
18). It has been shown previously that fluorescence complementation
between bFos-VC and bJun-VN in cells required an intact leucine zipper
dimerisation interface and that without this region the fluorescence signal
was entirely eliminated (Hu et al, 2002). The results in Figure 18 contradict
the previous finding, leading to the conclusion that perhaps the fluorescence
complementation is formed as a result of YFP interactions, producing false-
positive results. The fluorescence signal could also be caused by high
expression levels of proteins that lead to an increase in fluorophore
concentrations. However, images in Figure 18 are only representatives of all
the BiFC experiments that have been repeated at least three times and not
all images show fluorescence complementation for bFos∆ZIP-VC and bJun-
VN interactions. Therefore, qualitative judgment is not sufficient to draw any
concrete conclusions and quantitative analyses were performed (refer to
section 3.2.6).
3.2.6 Quantitative and statistical analysis
In order to confirm that the results of BiFC experiments using bFos-VC,
bJun-VN and bFosΔZIP-VC fusion proteins represent specific protein-protein
interactions and are not driven by the self-assembly of the two non-
fluorescent YFP fragments the ImageJ software was used to analyse and
quantitate the BiFC signal.
After being transfected and stained with plasma membrane stain HEK293T
cells were used for confocal analysis. For BiFC quantification multiple
images were taken in a random distribution from each well. The confocal
images were then used for quantitative analysis using ImageJ. In each image
field the staining of the plasma membrane allowed the outlining of all
individual cells and the border of each cell was selected on a cell-by-cell
basis. The fluorescent intensity derived from bimolecular fluorescence
93
complementation (e.g. YFP-VN+YFP-VC) and the red fluorescence signal
derived from the plasma membrane stain were measured in individual cells
and expressed as yellow/red ratio. On average about 700 cells from at least
three independent experiments for each fusion protein combination were
analysed. The distributions of ratios in individual cells were then plotted in
histogram (Figure 19). In addition the average yellow fluorescence intensity
in each cell was determined by measuring the average pixel intensity of the
selected region, including border. The background signal in an area with no
cells was subtracted from all values. BiFC fluorescence intensity values from
at least three independent experiments were averaged and used for
statistical analysis (Figure 20).
The efficiency of fluorescence complementation is determined from the
fluorescence intensity. Two non-fluorescent YFP fragments are able to form
fluorescent complexes at higher efficiency and at higher rate when fused to
two interacting proteins. Spontaneous complementation, however, is
possible but significantly reduced when the fragments are fused to proteins
that do not interact with each other. Figure 19 shows the distribution of YFP
fluorescence to red fluorescence signal from the plasma stain ratios,
representing a measure of the efficiency of bimolecular fluorescence
complementation. The interaction between bFos-VC and bJun-VN produced
an increase in the efficiency of association between the fluorescent YFP
fragments. HEK293T cells co-expressing bFos-VC and bJun-VN exhibit
higher cell numbers that fall into a greater ratio value range compared with
the cells co-expressing bFos∆ZIP-VC and bJun-VN negative interacting pair.
Therefore it can be concluded that bFos-VC/bJun-VN complementation
complex results in a stronger YFP fluorescence signal and is more prevalent
compared with negative interacting pair.
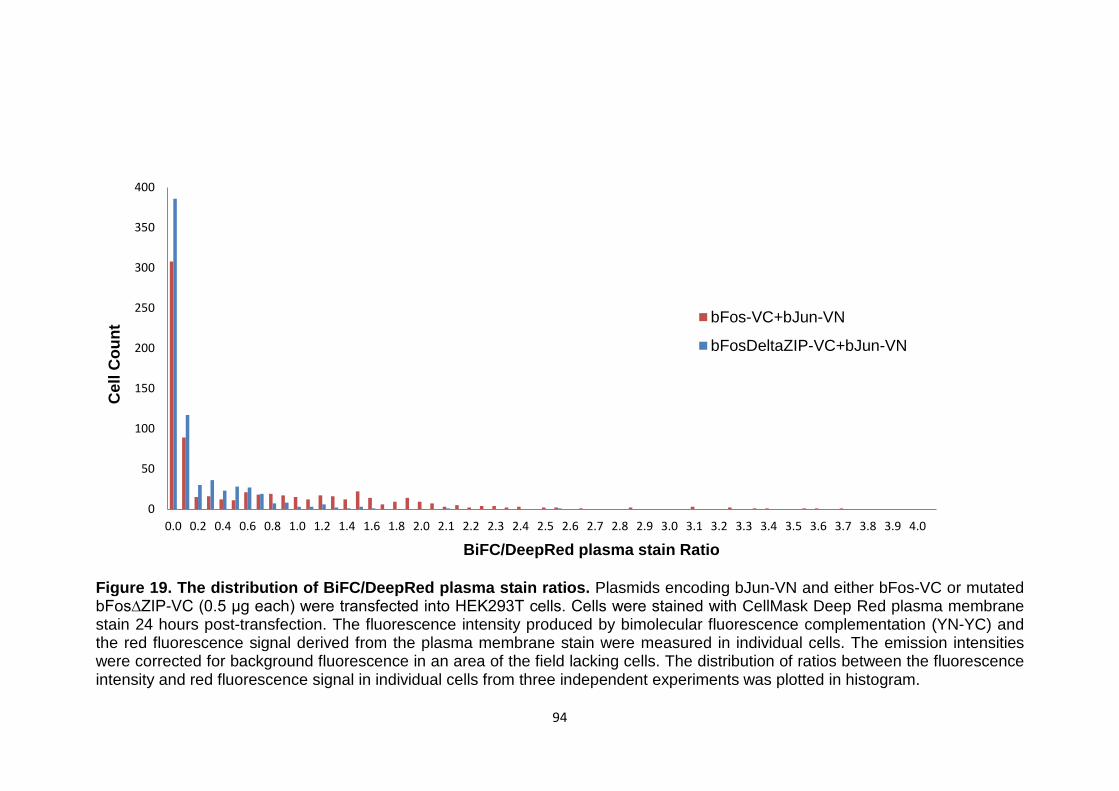
94
Figure 19. The distribution of BiFC/DeepRed plasma stain ratios. Plasmids encoding bJun-VN and either bFos-VC or mutated bFos∆ZIP-VC (0.5 μg each) were transfected into HEK293T cells. Cells were stained with CellMask Deep Red plasma membrane stain 24 hours post-transfection. The fluorescence intensity produced by bimolecular fluorescence complementation (YN-YC) and the red fluorescence signal derived from the plasma membrane stain were measured in individual cells. The emission intensities were corrected for background fluorescence in an area of the field lacking cells. The distribution of ratios between the fluorescence intensity and red fluorescence signal in individual cells from three independent experiments was plotted in histogram.
0
50
100
150
200
250
300
350
400
0.0 0.2 0.4 0.6 0.8 1.0 1.2 1.4 1.6 1.8 2.0 2.1 2.2 2.3 2.4 2.5 2.6 2.7 2.8 2.9 3.0 3.1 3.2 3.3 3.4 3.5 3.6 3.7 3.8 3.9 4.0
Cel
l Cou
nt
BiFC/DeepRed plasma stain Ratio
bFos-VC+bJun-VN
bFosDeltaZIP-VC+bJun-VN
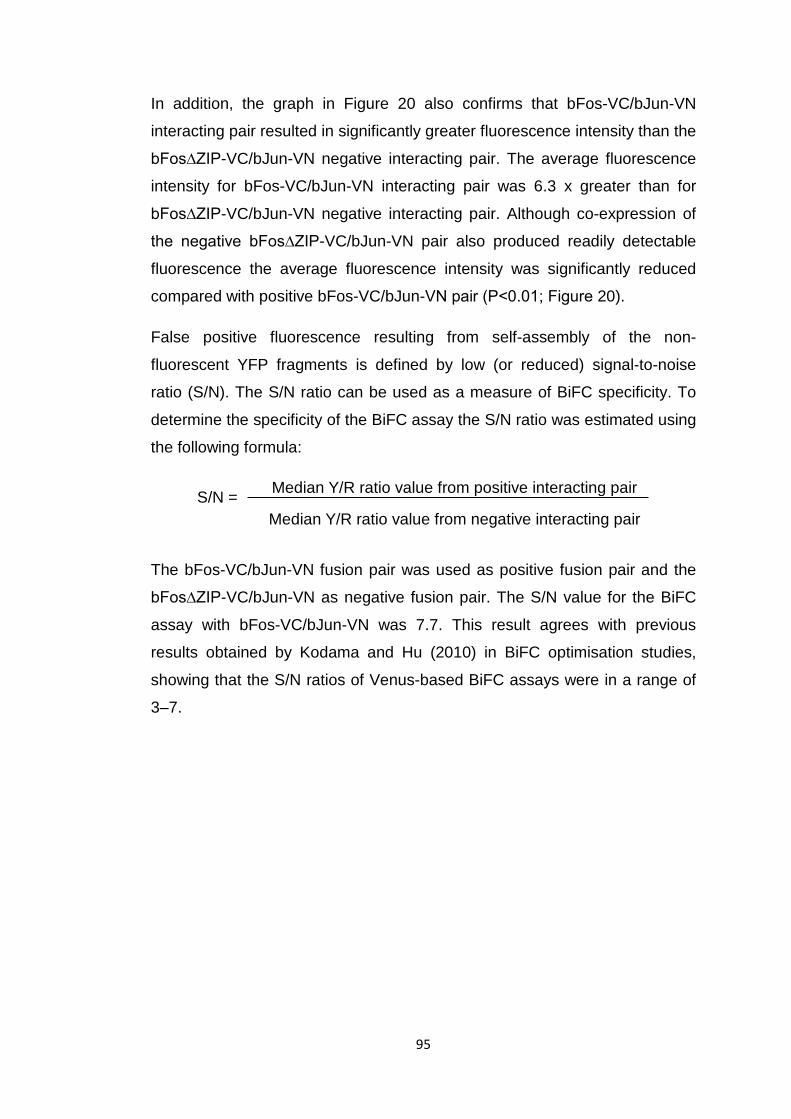
95
In addition, the graph in Figure 20 also confirms that bFos-VC/bJun-VN
interacting pair resulted in significantly greater fluorescence intensity than the
bFos∆ZIP-VC/bJun-VN negative interacting pair. The average fluorescence
intensity for bFos-VC/bJun-VN interacting pair was 6.3 x greater than for
bFos∆ZIP-VC/bJun-VN negative interacting pair. Although co-expression of
the negative bFos∆ZIP-VC/bJun-VN pair also produced readily detectable
fluorescence the average fluorescence intensity was significantly reduced
compared with positive bFos-VC/bJun-VN pair (P˂0.01; Figure 20).
False positive fluorescence resulting from self-assembly of the non-
fluorescent YFP fragments is defined by low (or reduced) signal-to-noise
ratio (S/N). The S/N ratio can be used as a measure of BiFC specificity. To
determine the specificity of the BiFC assay the S/N ratio was estimated using
the following formula:
The bFos-VC/bJun-VN fusion pair was used as positive fusion pair and the
bFos∆ZIP-VC/bJun-VN as negative fusion pair. The S/N value for the BiFC
assay with bFos-VC/bJun-VN was 7.7. This result agrees with previous
results obtained by Kodama and Hu (2010) in BiFC optimisation studies,
showing that the S/N ratios of Venus-based BiFC assays were in a range of
3–7.
S/N = Median Y/R ratio value from positive interacting pair
Median Y/R ratio value from negative interacting pair
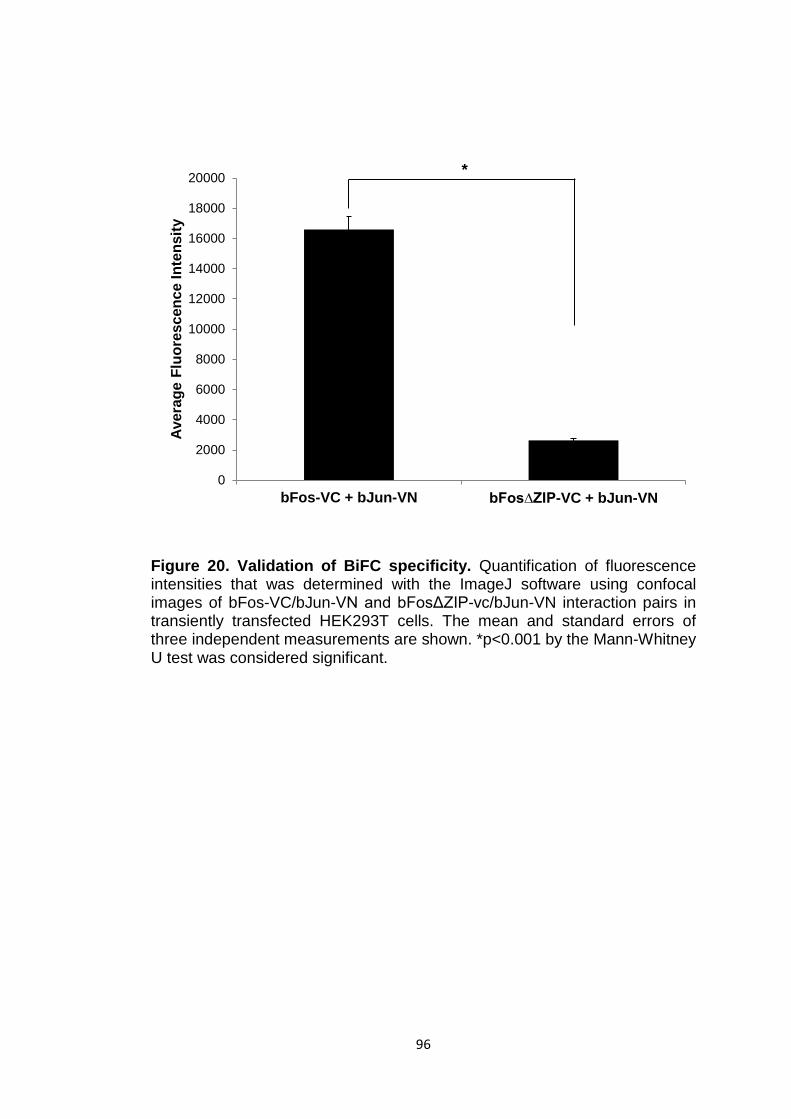
96
Figure 20. Validation of BiFC specificity. Quantification of fluorescence intensities that was determined with the ImageJ software using confocal images of bFos-VC/bJun-VN and bFosΔZIP-vc/bJun-VN interaction pairs in transiently transfected HEK293T cells. The mean and standard errors of three independent measurements are shown. *p<0.001 by the Mann-Whitney U test was considered significant.
0
2000
4000
6000
8000
10000
12000
14000
16000
18000
20000
bFos-VC + bJun-VN bFos∆ZIP-VC + bJun-VN
Aver
age
Fluo
resc
ence
Inte
nsity
*
97
3.3 Discussion
To validate and optimise the BiFC assay two interacting proteins bFos and
bJun were used as the positive interacting pair and bFosΔZIP and bJun as
the negative interacting pair. The interaction between bFos and bJun is well
documented and these proteins have been previously used in studies
developing BiFC assays (Bos et al, 1989; Neuberg et al, 1989; Kerppola,
2008; Hu et al, 2002). In this thesis fragments of a Venus YFP truncated at
residue 155 (VN155 and VC155) were used as they exhibit a relatively high
complementation efficiency when fused to interacting partners but produce
low fluorescence when fused to non-interacting proteins. bJun was fused to
the N-terminal part of YFP (bJun-VN) and bFos and bFosΔZIP were fused to
the C-terminal part of YFP (bFos-VC and bFosΔZIP-VC) and were used first
to select a cell line for BiFC experiments. In order to establish the cell line
that results in a higher expression level both HEK293 and HEK293T cell
lines were transiently co-transfected with bFos-VC/bJun-VN and bFosΔZIP-
VC/bJun-VN fusion pairs. These cell lines were chosen for the ease of
expression of mammalian proteins, cells’ high transfection efficiency and
ease of maintenance. The BiFC assay has been used for the analysis of
protein interactions in many mammalian cells including HEK293, in which co-
expression of fusion proteins exhibited similar patterns of fluorescence
compared with COS-7 and NIH 3T3 cells (Fang and Kerppola, 2004). The
results showed that HEK293T cells, when co-expressing bFos-VC/bJun-VN
fusion pair, exhibited not only higher intensity of the fluorescent signal but
also a higher number of cells producing the signal compared with HEK293
cells. This suggests that HEK293T cells exhibit higher protein expression
levels, probably due to the presence of the SV40 large T antigen that can
bind to SV40 enhancer of expression vectors and thus considerably increase
the expression levels obtained with transient transfection. Based on these
qualitative results the HEK293T cell line was chosen for further experiments
with bFos and bJun as well as with transmembrane proteins discussed in
following chapters.
98
To determine the optimal time-scale for expression of fusion proteins and
BiFC complex formation the cells were analysed 24 and 48 hours post-
transfection. A longer incubation period (i.e. 72 hours) was also considered
but resulted in the majority of cells being detached and, thus, was not
included in experimental results. In transient expression experiments
fluorescence from specific interactions can generally be detected between 12
and 30 hours after transfection (Kerppola, 2006). The confocal analysis of
the transfected HEK293T cells showed that the 24-hour incubation period
resulted in an increased fluorescence signal. Fewer cells exhibited
fluorescence signal after the 48-hour incubation period and the signal was
more saturated. In addition the 48-hour incubation resulted in weak
background fluorescence signal in cells co-expressing bFosΔZIP-VC/bJun-
VN negative interacting pair. This could be explained by the fact that the
fluorescence complex formation is irreversible and longer incubation may
result in accumulation of the signal from non-specific interactions driven by
the YFP fragments. Longer incubation could result in higher expression of
fusion proteins that could also contribute to complementation due to non-
specific interactions. Therefore, longer incubations should be avoided and,
based on the qualitative analysis obtained from these experiments, it was
decided that the 24-hour incubation is preferable for future experiments. For
the same reason it is advisable to keep the amount of DNA used for
transfection low. Although previous studies reported that BiFC generally has
very low background, very high expression of fusion proteins can result in
BiFC between proteins that do not interact in vivo (Kerppola, 2006; Kerppola,
2008). Over-expression of the fusion proteins may lead to the association of
the tethered fluorescent protein fragments because of high local
concentrations of the fusion proteins (Kodama and Hu, 2010). A paper on
design and implementation of the BiFC assay by Kerppola (2008)
recommended starting with 0.25 µg of DNA for transient transfections.
However, in various papers on protein-protein interaction studies using BiFC
a range of DNA amounts was used, ranging from 0.25 µg to 5.0 µg of each
plasmid. To optimise the amount of DNA for transfections HEK293T cells
were co-transfected with either bFos-VC/bJun-VN or bFosΔZIP-VC/bJun-VN
fusion pairs, using a range of DNA amounts from 0.25 to 2.0 µg of each
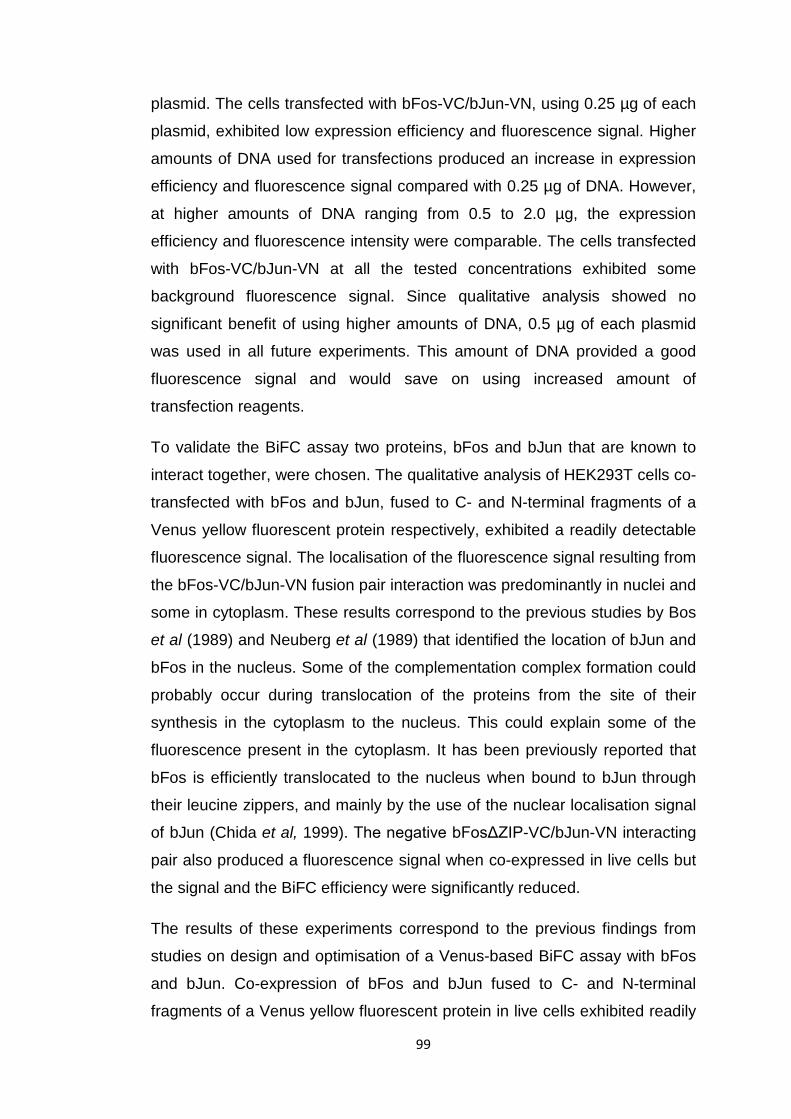
99
plasmid. The cells transfected with bFos-VC/bJun-VN, using 0.25 µg of each
plasmid, exhibited low expression efficiency and fluorescence signal. Higher
amounts of DNA used for transfections produced an increase in expression
efficiency and fluorescence signal compared with 0.25 µg of DNA. However,
at higher amounts of DNA ranging from 0.5 to 2.0 µg, the expression
efficiency and fluorescence intensity were comparable. The cells transfected
with bFos-VC/bJun-VN at all the tested concentrations exhibited some
background fluorescence signal. Since qualitative analysis showed no
significant benefit of using higher amounts of DNA, 0.5 µg of each plasmid
was used in all future experiments. This amount of DNA provided a good
fluorescence signal and would save on using increased amount of
transfection reagents.
To validate the BiFC assay two proteins, bFos and bJun that are known to
interact together, were chosen. The qualitative analysis of HEK293T cells co-
transfected with bFos and bJun, fused to C- and N-terminal fragments of a
Venus yellow fluorescent protein respectively, exhibited a readily detectable
fluorescence signal. The localisation of the fluorescence signal resulting from
the bFos-VC/bJun-VN fusion pair interaction was predominantly in nuclei and
some in cytoplasm. These results correspond to the previous studies by Bos
et al (1989) and Neuberg et al (1989) that identified the location of bJun and
bFos in the nucleus. Some of the complementation complex formation could
probably occur during translocation of the proteins from the site of their
synthesis in the cytoplasm to the nucleus. This could explain some of the
fluorescence present in the cytoplasm. It has been previously reported that
bFos is efficiently translocated to the nucleus when bound to bJun through
their leucine zippers, and mainly by the use of the nuclear localisation signal
of bJun (Chida et al, 1999). The negative bFosΔZIP-VC/bJun-VN interacting
pair also produced a fluorescence signal when co-expressed in live cells but
the signal and the BiFC efficiency were significantly reduced.
The results of these experiments correspond to the previous findings from
studies on design and optimisation of a Venus-based BiFC assay with bFos
and bJun. Co-expression of bFos and bJun fused to C- and N-terminal
fragments of a Venus yellow fluorescent protein in live cells exhibited readily
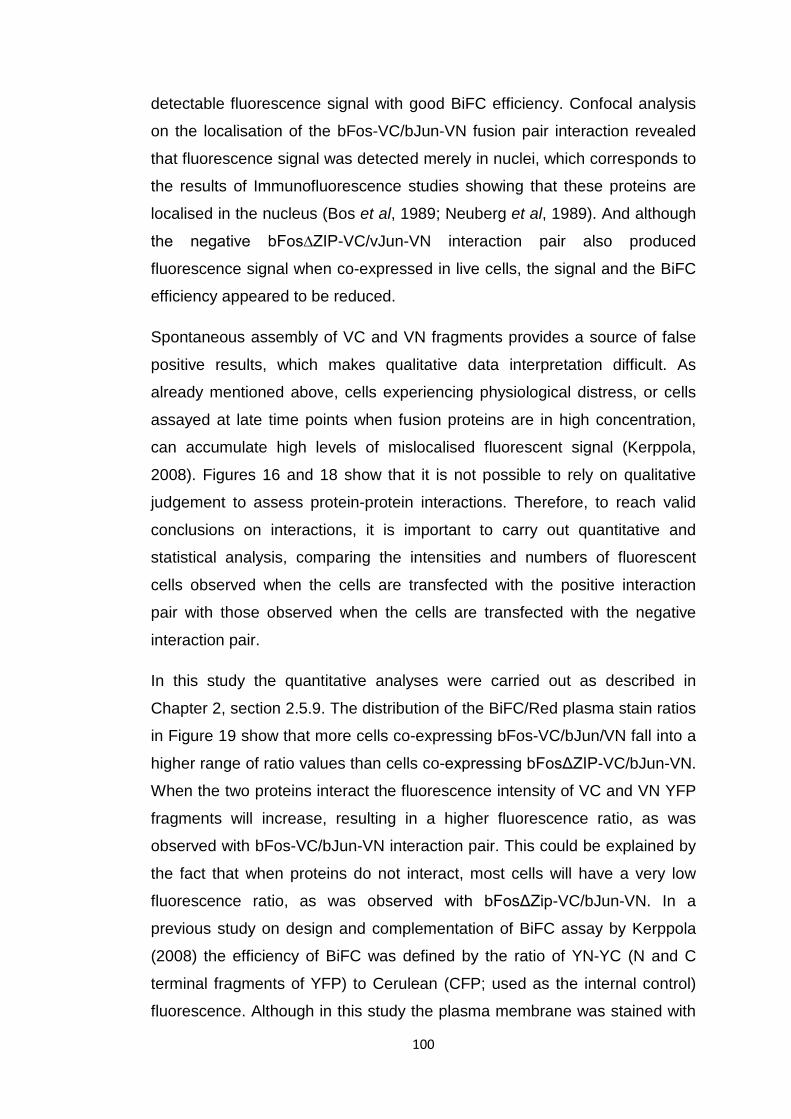
100
detectable fluorescence signal with good BiFC efficiency. Confocal analysis
on the localisation of the bFos-VC/bJun-VN fusion pair interaction revealed
that fluorescence signal was detected merely in nuclei, which corresponds to
the results of Immunofluorescence studies showing that these proteins are
localised in the nucleus (Bos et al, 1989; Neuberg et al, 1989). And although
the negative bFos∆ZIP-VC/vJun-VN interaction pair also produced
fluorescence signal when co-expressed in live cells, the signal and the BiFC
efficiency appeared to be reduced.
Spontaneous assembly of VC and VN fragments provides a source of false
positive results, which makes qualitative data interpretation difficult. As
already mentioned above, cells experiencing physiological distress, or cells
assayed at late time points when fusion proteins are in high concentration,
can accumulate high levels of mislocalised fluorescent signal (Kerppola,
2008). Figures 16 and 18 show that it is not possible to rely on qualitative
judgement to assess protein-protein interactions. Therefore, to reach valid
conclusions on interactions, it is important to carry out quantitative and
statistical analysis, comparing the intensities and numbers of fluorescent
cells observed when the cells are transfected with the positive interaction
pair with those observed when the cells are transfected with the negative
interaction pair.
In this study the quantitative analyses were carried out as described in
Chapter 2, section 2.5.9. The distribution of the BiFC/Red plasma stain ratios
in Figure 19 show that more cells co-expressing bFos-VC/bJun/VN fall into a
higher range of ratio values than cells co-expressing bFosΔZIP-VC/bJun-VN.
When the two proteins interact the fluorescence intensity of VC and VN YFP
fragments will increase, resulting in a higher fluorescence ratio, as was
observed with bFos-VC/bJun-VN interaction pair. This could be explained by
the fact that when proteins do not interact, most cells will have a very low
fluorescence ratio, as was observed with bFosΔZip-VC/bJun-VN. In a
previous study on design and complementation of BiFC assay by Kerppola
(2008) the efficiency of BiFC was defined by the ratio of YN-YC (N and C
terminal fragments of YFP) to Cerulean (CFP; used as the internal control)
fluorescence. Although in this study the plasma membrane was stained with
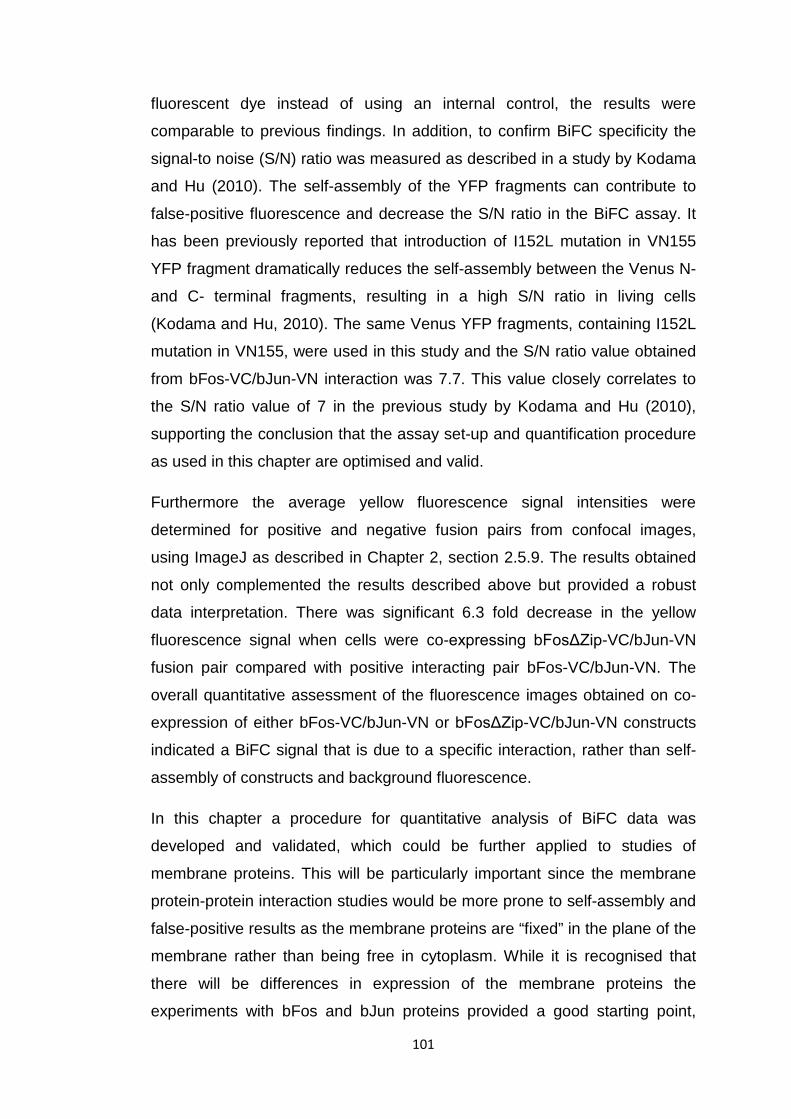
101
fluorescent dye instead of using an internal control, the results were
comparable to previous findings. In addition, to confirm BiFC specificity the
signal-to noise (S/N) ratio was measured as described in a study by Kodama
and Hu (2010). The self-assembly of the YFP fragments can contribute to
false-positive fluorescence and decrease the S/N ratio in the BiFC assay. It
has been previously reported that introduction of I152L mutation in VN155
YFP fragment dramatically reduces the self-assembly between the Venus N-
and C- terminal fragments, resulting in a high S/N ratio in living cells
(Kodama and Hu, 2010). The same Venus YFP fragments, containing I152L
mutation in VN155, were used in this study and the S/N ratio value obtained
from bFos-VC/bJun-VN interaction was 7.7. This value closely correlates to
the S/N ratio value of 7 in the previous study by Kodama and Hu (2010),
supporting the conclusion that the assay set-up and quantification procedure
as used in this chapter are optimised and valid.
Furthermore the average yellow fluorescence signal intensities were
determined for positive and negative fusion pairs from confocal images,
using ImageJ as described in Chapter 2, section 2.5.9. The results obtained
not only complemented the results described above but provided a robust
data interpretation. There was significant 6.3 fold decrease in the yellow
fluorescence signal when cells were co-expressing bFosΔZip-VC/bJun-VN
fusion pair compared with positive interacting pair bFos-VC/bJun-VN. The
overall quantitative assessment of the fluorescence images obtained on co-
expression of either bFos-VC/bJun-VN or bFosΔZip-VC/bJun-VN constructs
indicated a BiFC signal that is due to a specific interaction, rather than self-
assembly of constructs and background fluorescence.
In this chapter a procedure for quantitative analysis of BiFC data was
developed and validated, which could be further applied to studies of
membrane proteins. This will be particularly important since the membrane
protein-protein interaction studies would be more prone to self-assembly and
false-positive results as the membrane proteins are “fixed” in the plane of the
membrane rather than being free in cytoplasm. While it is recognised that
there will be differences in expression of the membrane proteins the
experiments with bFos and bJun proteins provided a good starting point,

102
showing that the BiFC assay is an efficient approach for visualisation of
protein-protein interactions with a high specificity in live cells but further
optimisation may be required with membrane proteins.

103
Chapter 4
Validation and characterisation of the interaction between VE-PTP and VE-cadherin in live cells
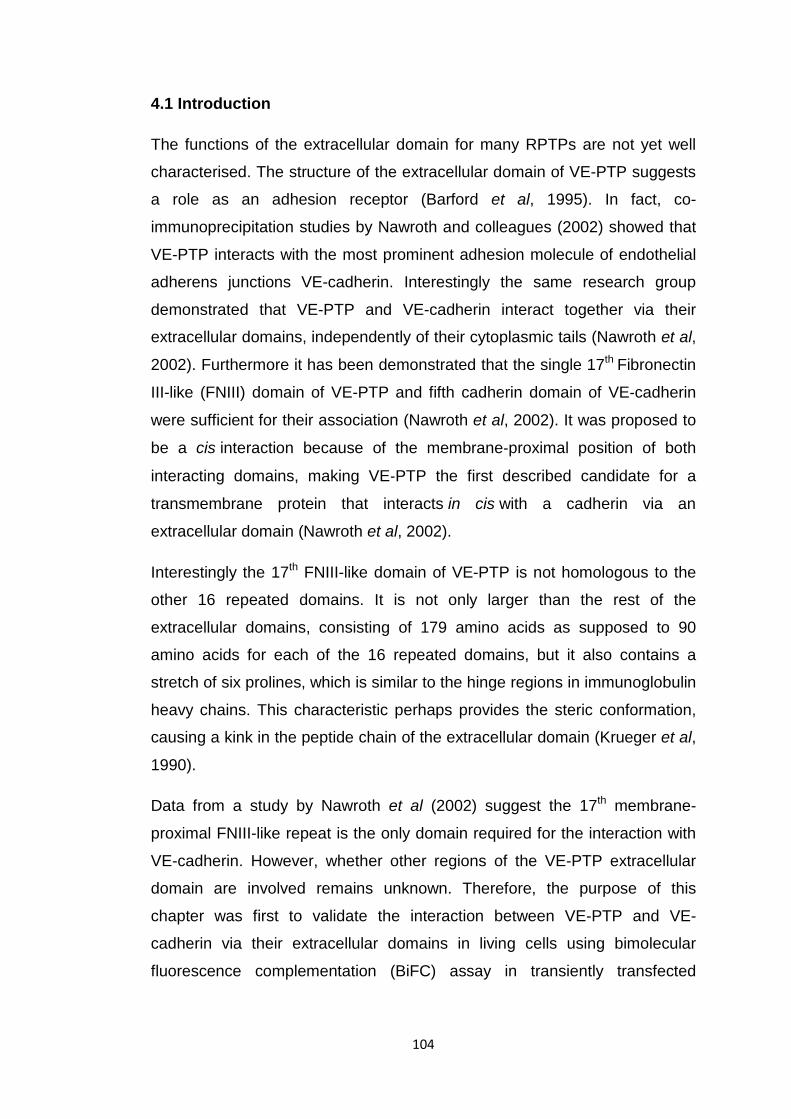
104
4.1 Introduction
The functions of the extracellular domain for many RPTPs are not yet well
characterised. The structure of the extracellular domain of VE-PTP suggests
a role as an adhesion receptor (Barford et al, 1995). In fact, co-
immunoprecipitation studies by Nawroth and colleagues (2002) showed that
VE-PTP interacts with the most prominent adhesion molecule of endothelial
adherens junctions VE-cadherin. Interestingly the same research group
demonstrated that VE-PTP and VE-cadherin interact together via their
extracellular domains, independently of their cytoplasmic tails (Nawroth et al,
2002). Furthermore it has been demonstrated that the single 17th Fibronectin
III-like (FNIII) domain of VE-PTP and fifth cadherin domain of VE‐cadherin
were sufficient for their association (Nawroth et al, 2002). It was proposed to
be a cis interaction because of the membrane‐proximal position of both
interacting domains, making VE‐PTP the first described candidate for a
transmembrane protein that interacts in cis with a cadherin via an
extracellular domain (Nawroth et al, 2002).
Interestingly the 17th FNIII-like domain of VE-PTP is not homologous to the
other 16 repeated domains. It is not only larger than the rest of the
extracellular domains, consisting of 179 amino acids as supposed to 90
amino acids for each of the 16 repeated domains, but it also contains a
stretch of six prolines, which is similar to the hinge regions in immunoglobulin
heavy chains. This characteristic perhaps provides the steric conformation,
causing a kink in the peptide chain of the extracellular domain (Krueger et al,
1990).
Data from a study by Nawroth et al (2002) suggest the 17th membrane-
proximal FNIII-like repeat is the only domain required for the interaction with
VE-cadherin. However, whether other regions of the VE-PTP extracellular
domain are involved remains unknown. Therefore, the purpose of this
chapter was first to validate the interaction between VE-PTP and VE-
cadherin via their extracellular domains in living cells using bimolecular
fluorescence complementation (BiFC) assay in transiently transfected
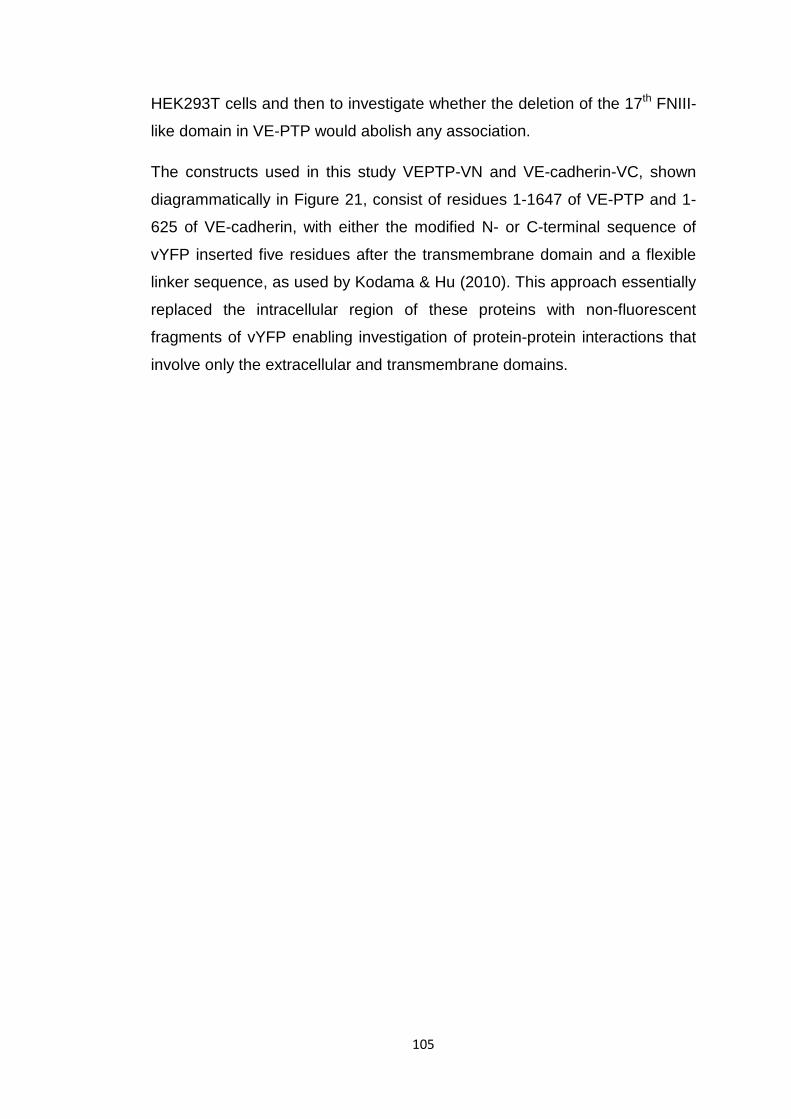
105
HEK293T cells and then to investigate whether the deletion of the 17th FNIII-
like domain in VE-PTP would abolish any association.
The constructs used in this study VEPTP-VN and VE-cadherin-VC, shown
diagrammatically in Figure 21, consist of residues 1-1647 of VE-PTP and 1-
625 of VE-cadherin, with either the modified N- or C-terminal sequence of
vYFP inserted five residues after the transmembrane domain and a flexible
linker sequence, as used by Kodama & Hu (2010). This approach essentially
replaced the intracellular region of these proteins with non-fluorescent
fragments of vYFP enabling investigation of protein-protein interactions that
involve only the extracellular and transmembrane domains.
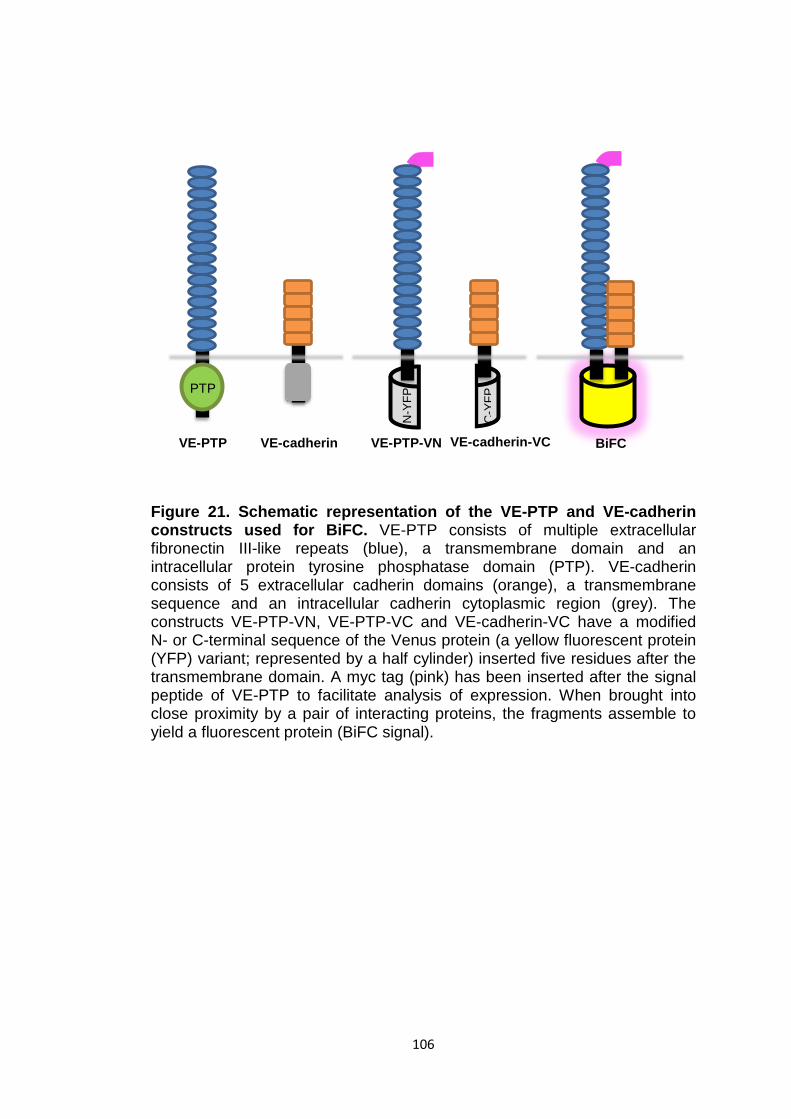
106
Figure 21. Schematic representation of the VE-PTP and VE-cadherin constructs used for BiFC. VE-PTP consists of multiple extracellular fibronectin III-like repeats (blue), a transmembrane domain and an intracellular protein tyrosine phosphatase domain (PTP). VE-cadherin consists of 5 extracellular cadherin domains (orange), a transmembrane sequence and an intracellular cadherin cytoplasmic region (grey). The constructs VE-PTP-VN, VE-PTP-VC and VE-cadherin-VC have a modified N- or C-terminal sequence of the Venus protein (a yellow fluorescent protein (YFP) variant; represented by a half cylinder) inserted five residues after the transmembrane domain. A myc tag (pink) has been inserted after the signal peptide of VE-PTP to facilitate analysis of expression. When brought into close proximity by a pair of interacting proteins, the fragments assemble to yield a fluorescent protein (BiFC signal).
PTP N
-YFP
C-Y
FP
VE-PTP VE-cadherin VE-cadherin-VC VE-PTP-VN BiFC
107
4.1.1 Controls to determine the complementation specificity
The BiFC assay is a useful technique for the direct visualisation of protein-
protein interactions in living cells. This approach allows one to study the sub-
cellular localisation of interactions with minimal perturbation of their normal
environment. However, because the non-fluorescent fragments of the
fluorescent protein are prone to self-assembly independent of a protein-
protein interaction event, leading to false positive results, it is crucial to
include appropriate negative controls. In Chapter 3 (section 3.1) appropriate
negative controls were discussed. Here two negative control fusion proteins
were generated to determine the specificity and efficiency of BiFC. The first
negative control was based on the transmembrane glycoprotein sialophorin
(SPN; also known as leukosialin, CD43) and the other was a plasma
membrane anchored fusion protein.
SPN control was fused to either the C- or N-terminal part of the YFP (SPN-
VN or SPN-VC respectively). The SPN was chosen as a negative control
since it shares no homology with any of the RPTPs of the R3 subgroup but it
has an equally large extracellular domain that is highly glycosylated
(Cordoba et al, 2013). It has been previously used as a control in studies
with another R3 RPTP member DEP-1 (density enriched protein tyrosine
phosphatase 1) to investigate the role of the DEP-1 extracellular domain in T
cell receptor signalling (Cordoba, 2013). However, in the previous study the
extracellular domain of the DEP-1 was substituted with the extracellular
domain of the SPN. Therefore, there are no known possible interactions of
SPN with any of the R3 RPTPs reported up to date. SPN fusion protein
controls consisted of extracellular and transmembrane domains, either fused
to the N-terminal part of a Venus YFP with a myc tag or the C-terminal part
of Venus YFP with a HA tag (Figure 22).
The second negative control consisted of either the C- or N-terminal
fragment of a Venus YFP anchored to the plasma membrane via the
membrane association sequence from Lck (lymphocyte-specific protein
tyrosine kinase), Myr-VC and Myr-VN respectively (i.e. myristoylated C- and
N-terminal YFP fragments). Negative controls Myr-VC and Myr-VN were
108
generated as a backup to eliminate any possible interactions between SPN
and R3 RPTPs. These negative controls had all the possible interaction
domains removed (i.e. they entirely lacked any extracellular and
transmembrane domains) and in theory there should be no complementation
complex formation when it is co-expressed with the fusion proteins of
interest. The two fusion proteins Myr-VC and Myr-VN consisted only of C-
and N-terminal YFP fragments respectively that were anchored to the
plasma membrane via membrane association sequence from Lck protein
kinase (Figure 22). An N-terminal dual acylation motif of Lck protein kinase is
necessary for correct intracellular localisation to the plasma membrane. This
sequence consists of MGCGCSSHPEDDW amino acids in which the
cysteines (C) become post-translationally S-acylated and the glycine-2 (G),
immediately after the initiator methionine, is myristoylated (Zlatkine et al,
1997). Therefore, fusing this sequence to each YFP fragment should be
sufficient to encode the correct lipid modification and to target the YFP
fragments to plasma membrane. This dual acylation motif has been used
previously to target cytosolic proteins to the plasma membrane (Zlatkine et
al, 1997). Consequently, if any fluorescence complementation is observed
after co-expressing Myr-VC or Myr-VN with any of the R3 RPTPs in
mammalian cells, it is most likely due to the self-assembly of the YFP
fragments. Therefore, the use of this control enables us to evaluate the
specificity (i.e. whether the fluorescence complementation represents
specific protein-protein interactions) and efficiency (i.e. fluorescence
intensity) of association in positive interaction pairs as explained in Chapter
3, section 3.2.6.
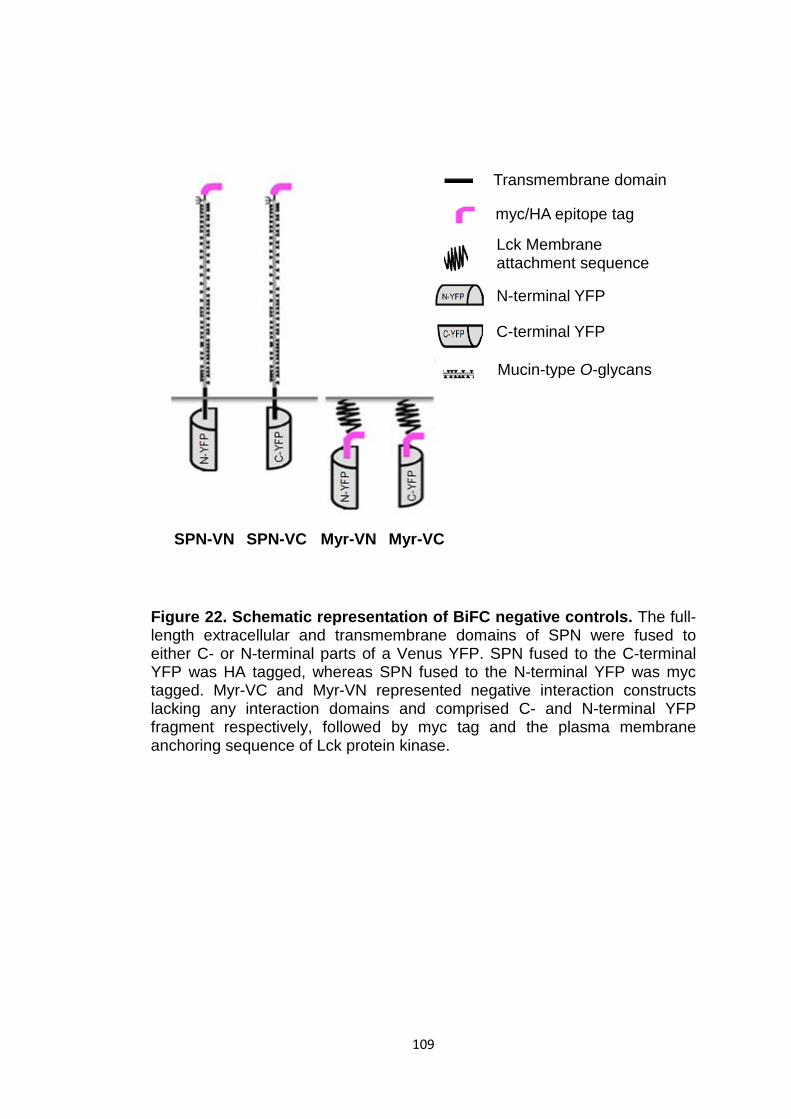
109
Figure 22. Schematic representation of BiFC negative controls. The full-length extracellular and transmembrane domains of SPN were fused to either C- or N-terminal parts of a Venus YFP. SPN fused to the C-terminal YFP was HA tagged, whereas SPN fused to the N-terminal YFP was myc tagged. Myr-VC and Myr-VN represented negative interaction constructs lacking any interaction domains and comprised C- and N-terminal YFP fragment respectively, followed by myc tag and the plasma membrane anchoring sequence of Lck protein kinase.
SPN-VN SPN-VC Myr-VN Myr-VC
Mucin-type O-glycans
C-terminal YFP
myc/HA epitope tag
Transmembrane domain
Lck Membrane attachment sequence
N-terminal YFP
110
4.1.2 Investigating association of a VE-PTP∆17FN mutant with VE-cadherin
Previous in vitro findings of Nawroth and colleagues (2002) showed that
neither the cytoplasmic nor transmembrane domains of VE-PTP are required
for the interaction with VE-cadherin and that the 17th FNIII-like domain was
sufficient for co-immunoprecipitation with VE-cadherin. In order to examine
this finding in a BiFC live cell assay a fusion construct in which the 17th FNIII-
like domain had been removed (VE-PTP∆17FN-VN) was generated (Figure
23). The objective was to investigate whether this domain is important in
association with VE-cadherin in live cells. It was hypothesised that deleting
the 17th FNIII-like domain of VE-PTP would be sufficient to abolish the VE-
PTP interaction with VE-cadherin.
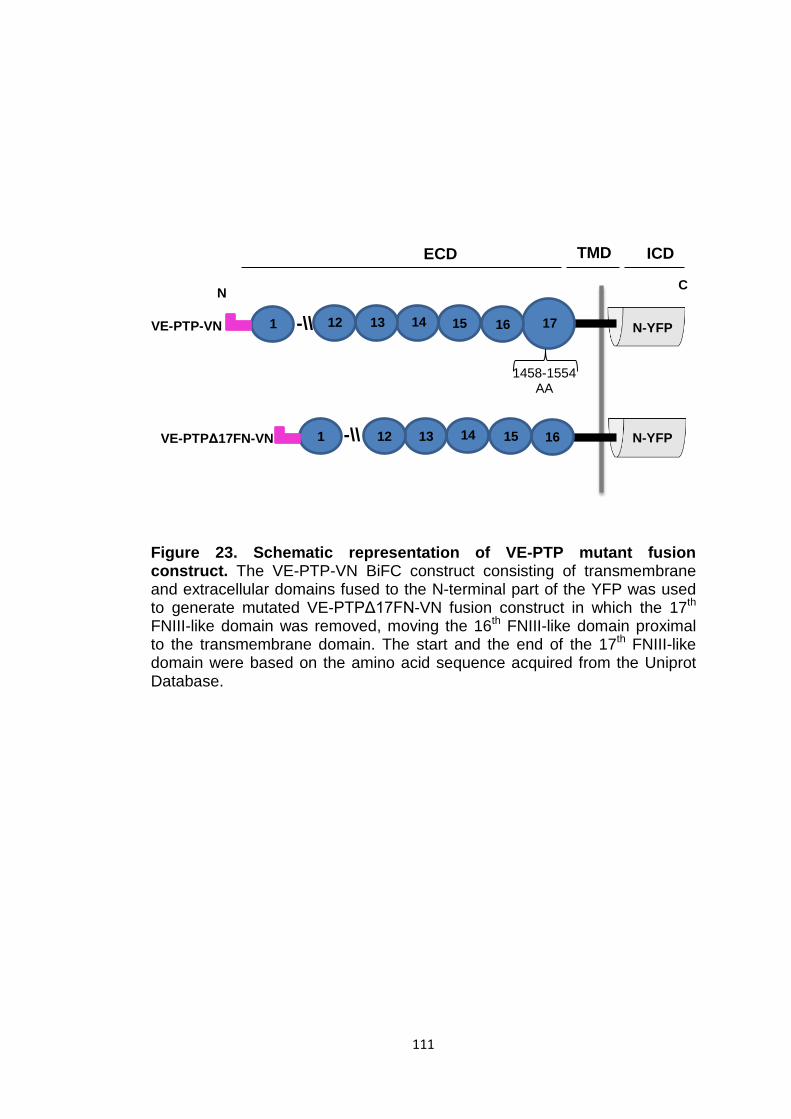
111
Figure 23. Schematic representation of VE-PTP mutant fusion construct. The VE-PTP-VN BiFC construct consisting of transmembrane and extracellular domains fused to the N-terminal part of the YFP was used to generate mutated VE-PTPΔ17FN-VN fusion construct in which the 17th FNIII-like domain was removed, moving the 16th FNIII-like domain proximal to the transmembrane domain. The start and the end of the 17th FNIII-like domain were based on the amino acid sequence acquired from the Uniprot Database.
1458-1554 AA
VE-PTP-VN
VE-PTPΔ17FN-VN
TMD
17 16 15 14 13 12
ECD
-\\ 1
N C
ICD
16 15 14 13 12 -\\ 1
N-YFP
N-YFP
112
4.2 Results
4.2.1 Cloning VE-PTP-VN and VE-cadherin-VC fusion proteins
VE-PTP-VC and VE-PTP-VN fusion constructs were generated as outlined in
the schema in Chapter 2 (Figure 8). For the VE-PTP-VN a synthetically
generated signal peptide and myc tag (EQKLISEEDL) fragment (Genscript)
was inserted into ApaI/XhoI restriction sites of pBiFC-VN155(I152L) vector.
The transmembrane and extracellular (TM+ECD) domains of VE-PTP
construct were amplified by PCR using Platinum Pfx polymerase (Figure 24,
A). The PCR product corresponded to the predicted size of 5.8 kb. The
primers used for the generation of the VE-PTP transmembrane and
extracellular domains are listed in Table 10 and the PCR conditions are
provided in Table 4 (Chapter 2). The resulting PCR product was purified,
digested and subsequently inserted into XhoI restriction site of the pBiFC-
VN155(I152L) vector, which contained signal peptide and myc tag. Colony
PCR was used to confirm the correct orientation of the insert to ensure that a
fusion protein fused to the N-terminal part of YFP has been generated
(Figure 25, A).
To generate the VE-PTP-VC fusion construct a synthetically generated
signal peptide and HA tag fragment (Genscript) was inserted into ApaI/XhoI
restriction sites of pBiFC-VC155 vector. The TM+ECD domains of VE-PTP
were cut out from the previously generated VE-PTP-VN fusion construct with
XhoI restriction enzyme, purified and ligated into the pBiFC-VC155 vector,
containing signal peptide and HA tag, to create a fusion protein fused to the
C-terminal part of YFP. Colony PCR was used to confirm the correct
orientation of the insert (Figure 25, B).
The VE-cadherin-VC fusion construct was generated by using PCR to
amplify signal peptide, transmembrane and extracellular domains of VE-
cadherin. The PCR product corresponded to the predicted size of 1.9 kb for
signal peptide, extracellular and transmembrane domains of VE-cadherin on
an agarose gel (Figure 24, B). The resulting PCR product was ligated into
ApaI/XhoI restriction sites of the corresponding pBiFC-VC155 vector and
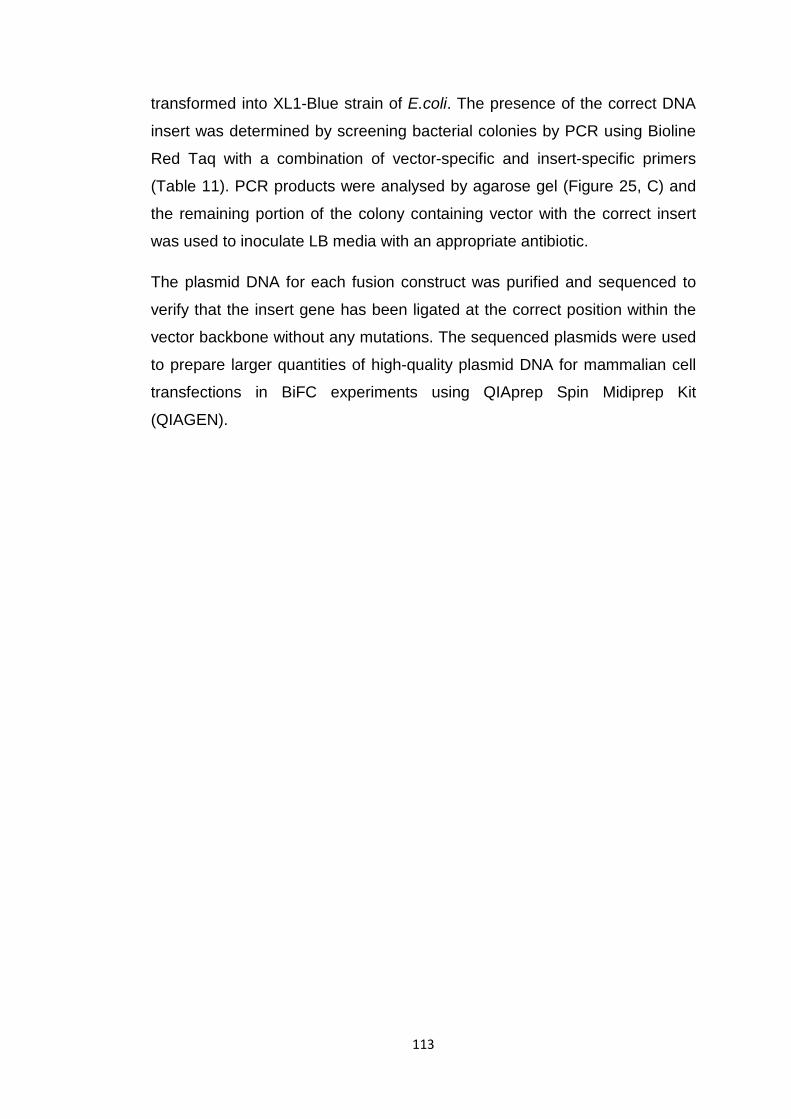
113
transformed into XL1-Blue strain of E.coli. The presence of the correct DNA
insert was determined by screening bacterial colonies by PCR using Bioline
Red Taq with a combination of vector-specific and insert-specific primers
(Table 11). PCR products were analysed by agarose gel (Figure 25, C) and
the remaining portion of the colony containing vector with the correct insert
was used to inoculate LB media with an appropriate antibiotic.
The plasmid DNA for each fusion construct was purified and sequenced to
verify that the insert gene has been ligated at the correct position within the
vector backbone without any mutations. The sequenced plasmids were used
to prepare larger quantities of high-quality plasmid DNA for mammalian cell
transfections in BiFC experiments using QIAprep Spin Midiprep Kit
(QIAGEN).
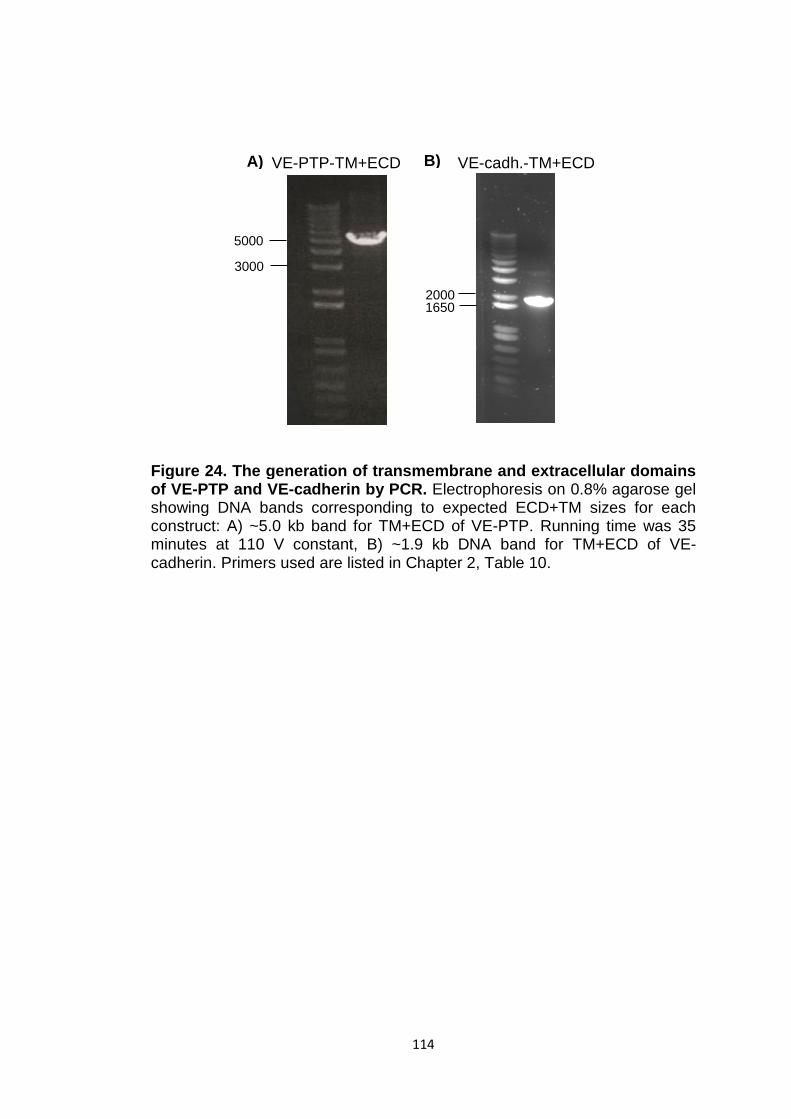
114
Figure 24. The generation of transmembrane and extracellular domains of VE-PTP and VE-cadherin by PCR. Electrophoresis on 0.8% agarose gel showing DNA bands corresponding to expected ECD+TM sizes for each construct: A) ~5.0 kb band for TM+ECD of VE-PTP. Running time was 35 minutes at 110 V constant, B) ~1.9 kb DNA band for TM+ECD of VE-cadherin. Primers used are listed in Chapter 2, Table 10.
3000 5000
VE-PTP-TM+ECD B)
2000 1650
VE-cadh.-TM+ECD A)
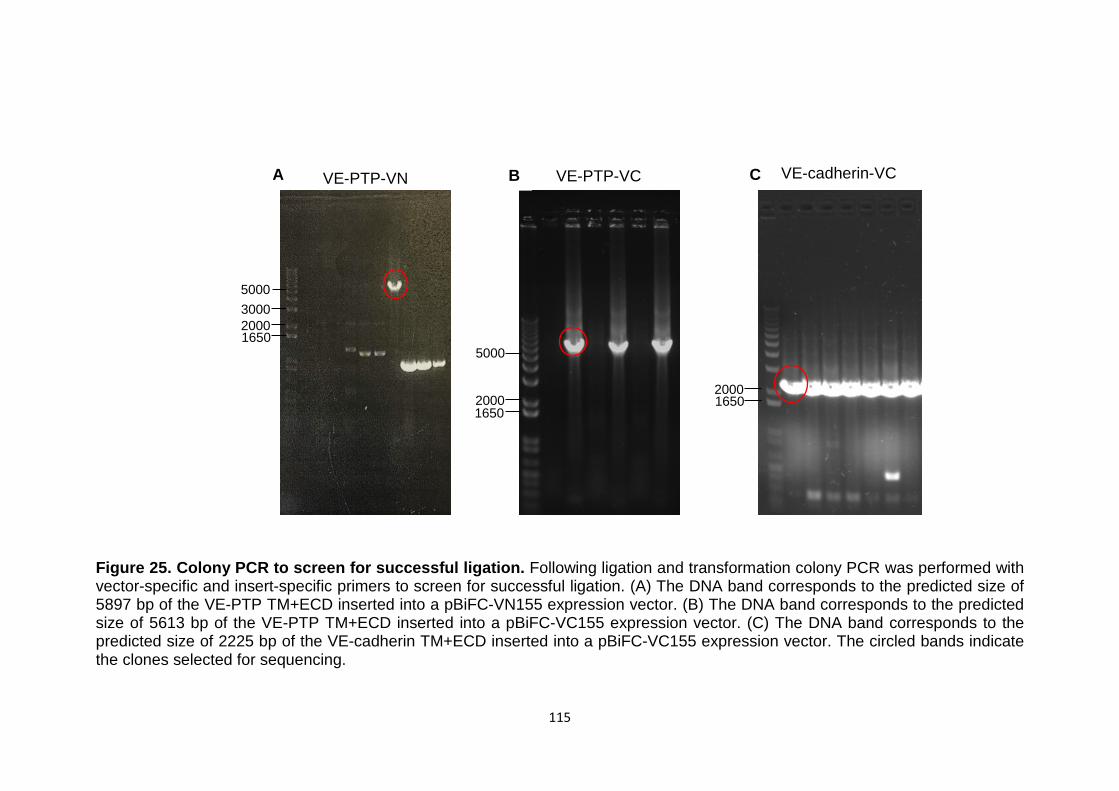
115
Figure 25. Colony PCR to screen for successful ligation. Following ligation and transformation colony PCR was performed with vector-specific and insert-specific primers to screen for successful ligation. (A) The DNA band corresponds to the predicted size of 5897 bp of the VE-PTP TM+ECD inserted into a pBiFC-VN155 expression vector. (B) The DNA band corresponds to the predicted size of 5613 bp of the VE-PTP TM+ECD inserted into a pBiFC-VC155 expression vector. (C) The DNA band corresponds to the predicted size of 2225 bp of the VE-cadherin TM+ECD inserted into a pBiFC-VC155 expression vector. The circled bands indicate the clones selected for sequencing.
2000 1650
VE-cadherin-VC C VE-PTP-VN
2000 1650
3000 5000
A
2000 1650
5000
VE-PTP-VC B
116
4.2.2 Generation of negative control SPN fusion construct
To generate the SPN-VC fusion construct a synthetically generated signal
peptide and HA tag fragment (Genscript) was inserted into ApaI/EcoRI
restriction sites of pBiFC-VC155 expression vector. For the SPN-VN fusion
construct a synthetically generated signal peptide and myc tag fragment was
inserted into ApaI/EcoRI restriction sites of pBiFC-VN155(I152L) expression
vector. Colony PCR was performed using REDTaq DNA Polymerase to
confirm the presence of the correct insert with a combination of vector-
specific and insert-specific primers. The list of primers used for colony PCR
is provided in Table 11 (Chapter 2). Figure 26 shows the DNA bands
corresponding to the correct sizes of 482 bp for signal peptide and HA tag in
pBiFC-VC155 vector and 677 bp for signal peptide and myc tag in pBiFC-
VN155(I152L) vector.
Following insertion of the appropriate signal peptide and tags into the vector
the sequence corresponding to the transmembrane and extracellular domain
of SPN was amplified by PCR using Platinum Pfx polymerase (Figure 27).
The oligonucleotide primer sequences and PCR conditions are listed in
Tables 10 and 4 respectively.
The resulting PCR product was subsequently digested, purified and inserted
into EcoRI/XhoI restriction sites of the corresponding pBiFC-VC155 and
pBiFC-VN155(I152L) vectors to create fusion protein fused to the C- and N-
terminal parts of YFP respectively.
Colony PCR was used to confirm the presence of the correct insert (Figure
28). The oligonucleotide primer sequences and PCR conditions are listed in
Tables 11 and 6 respectively.
The plasmid DNA for each fusion construct was purified and sequenced to
verify that the insert gene has been ligated at the correct position within the
vector backbone without any mutations. The sequenced plasmids were used
to prepare larger concentrations of high-quality plasmid DNA for mammalian
cell transfections in BiFC experiments using QIAprep Spin Midiprep Kit
(QIAGEN).
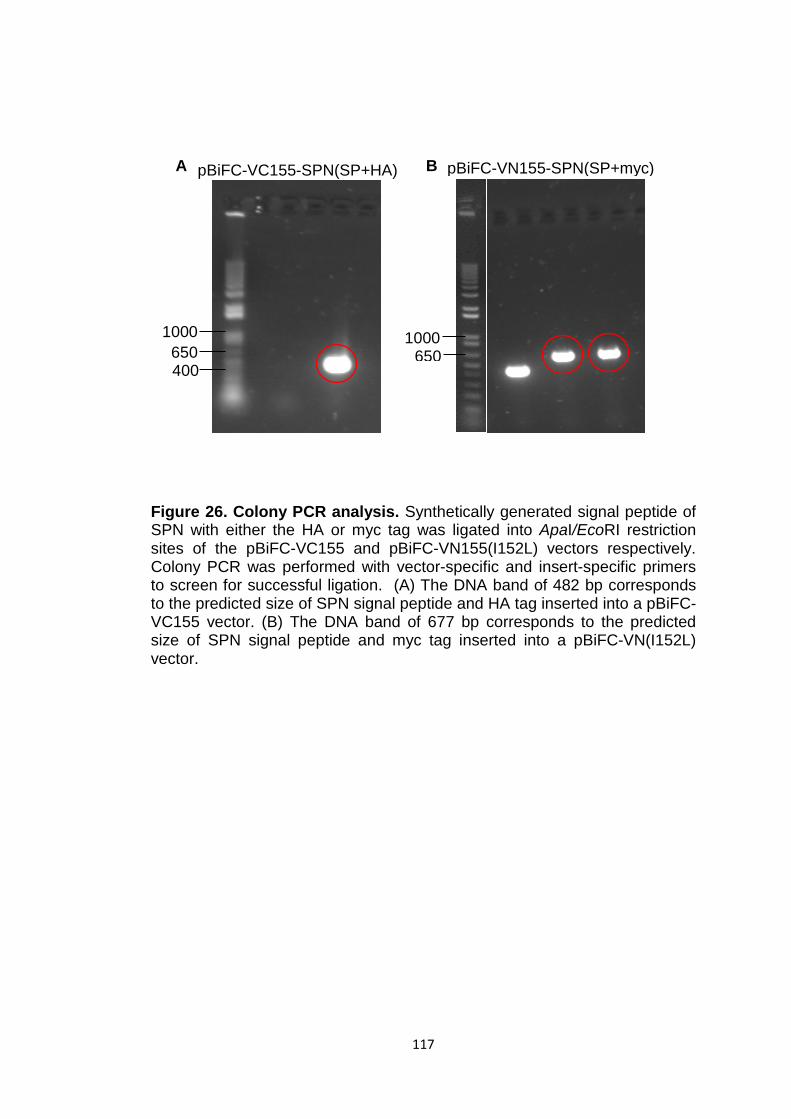
117
Figure 26. Colony PCR analysis. Synthetically generated signal peptide of SPN with either the HA or myc tag was ligated into ApaI/EcoRI restriction sites of the pBiFC-VC155 and pBiFC-VN155(I152L) vectors respectively. Colony PCR was performed with vector-specific and insert-specific primers to screen for successful ligation. (A) The DNA band of 482 bp corresponds to the predicted size of SPN signal peptide and HA tag inserted into a pBiFC-VC155 vector. (B) The DNA band of 677 bp corresponds to the predicted size of SPN signal peptide and myc tag inserted into a pBiFC-VN(I152L) vector.
1000 650
pBiFC-VC155-SPN(SP+HA)
400
A
1000 650
pBiFC-VN155-SPN(SP+myc) B
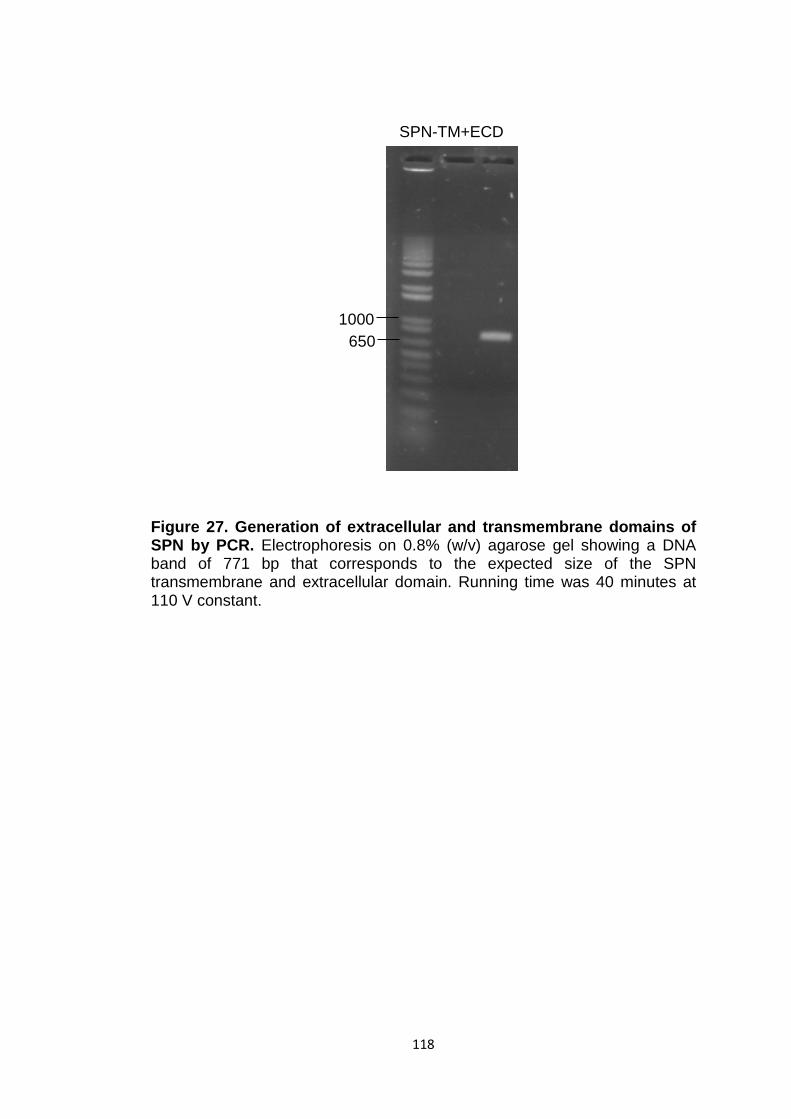
118
Figure 27. Generation of extracellular and transmembrane domains of SPN by PCR. Electrophoresis on 0.8% (w/v) agarose gel showing a DNA band of 771 bp that corresponds to the expected size of the SPN transmembrane and extracellular domain. Running time was 40 minutes at 110 V constant.
SPN-TM+ECD
1000 650
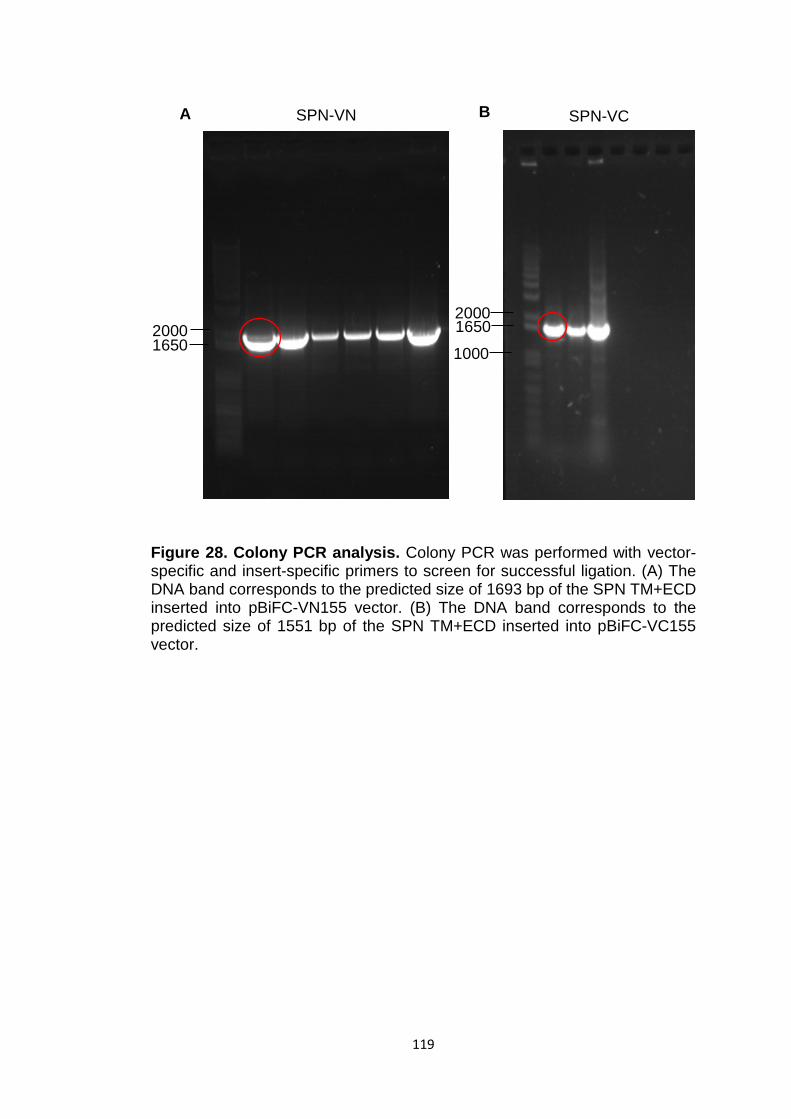
119
Figure 28. Colony PCR analysis. Colony PCR was performed with vector-specific and insert-specific primers to screen for successful ligation. (A) The DNA band corresponds to the predicted size of 1693 bp of the SPN TM+ECD inserted into pBiFC-VN155 vector. (B) The DNA band corresponds to the predicted size of 1551 bp of the SPN TM+ECD inserted into pBiFC-VC155 vector.
SPN-VC
1000
2000 1650
B A SPN-VN
2000 1650
120
4.2.3 Cloning membrane anchored N- and C-terminal Venus-YFP fusion proteins
A membrane anchored fusion protein that entirely lacked transmembrane
and extracellular domains was generated for use as a control in BiFC studies
(shown schematically in Figure 15). Overlapping primers (Table 15),
containing sequences corresponding to ApaI and EcoRI restriction sites, the
membrane association sequence (Myr) from the protein tyrosine kinase Lck
and a myc tag, were annealed together and ligated into the ApaI/EcoRI
restriction sites of pBiFC-VN155 and pBiFC-VC155 expression vectors.
Colony PCR was performed using REDTaq DNA Polymerase to confirm the
presence of the correct DNA insert with a combination of vector-specific
(CMV-F) and insert-specific (Myr-R; Table 15) primers.
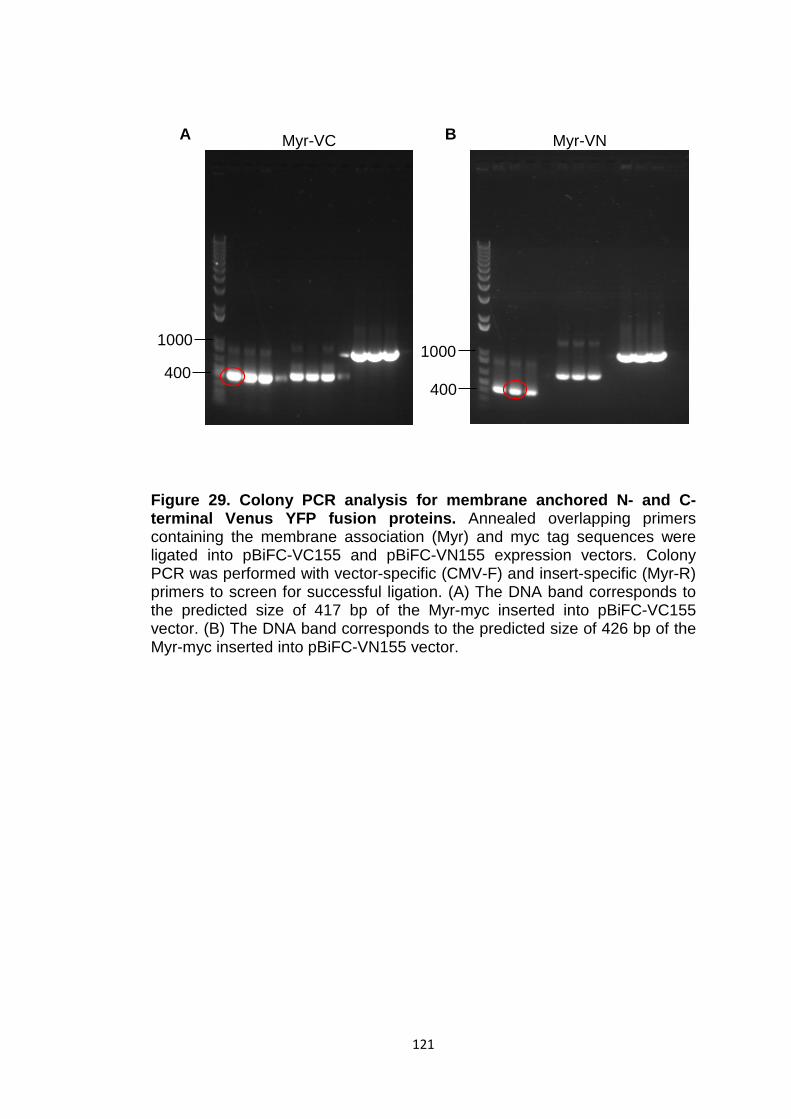
121
Figure 29. Colony PCR analysis for membrane anchored N- and C-terminal Venus YFP fusion proteins. Annealed overlapping primers containing the membrane association (Myr) and myc tag sequences were ligated into pBiFC-VC155 and pBiFC-VN155 expression vectors. Colony PCR was performed with vector-specific (CMV-F) and insert-specific (Myr-R) primers to screen for successful ligation. (A) The DNA band corresponds to the predicted size of 417 bp of the Myr-myc inserted into pBiFC-VC155 vector. (B) The DNA band corresponds to the predicted size of 426 bp of the Myr-myc inserted into pBiFC-VN155 vector.
Myr-VC
400
1000
A Myr-VN
400
1000
B
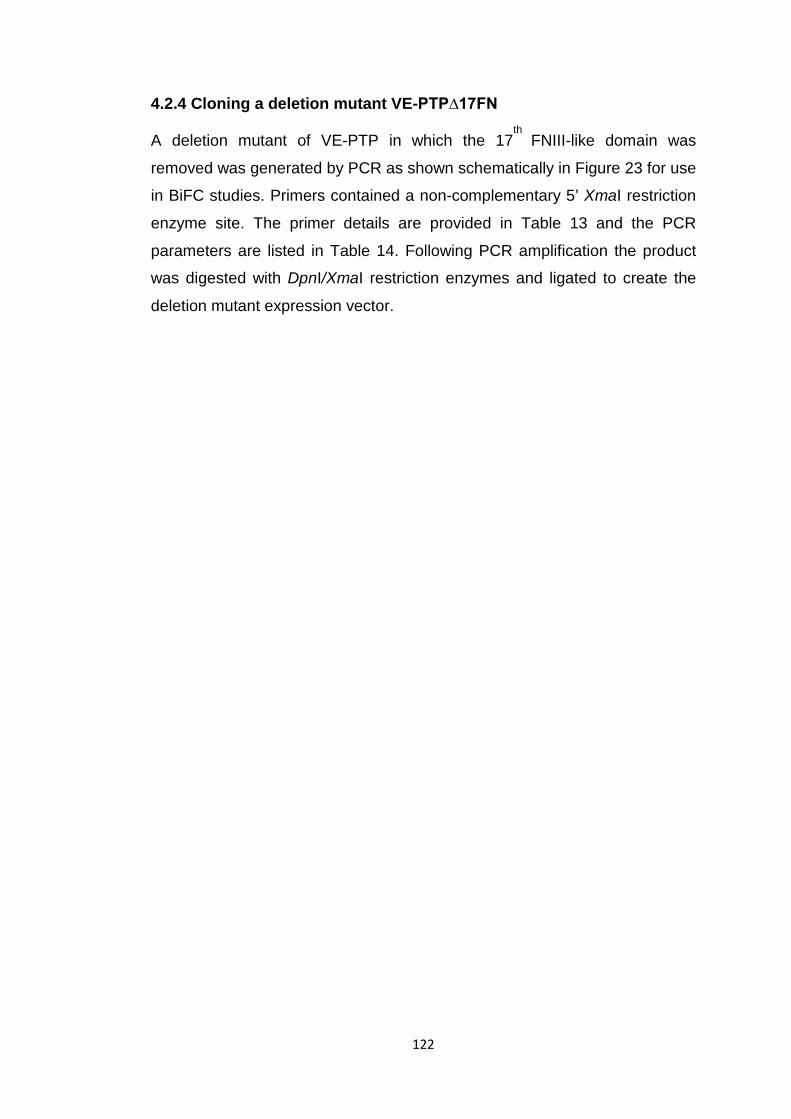
122
4.2.4 Cloning a deletion mutant VE-PTP∆17FN
A deletion mutant of VE-PTP in which the 17th
FNIII-like domain was
removed was generated by PCR as shown schematically in Figure 23 for use
in BiFC studies. Primers contained a non-complementary 5’ XmaI restriction
enzyme site. The primer details are provided in Table 13 and the PCR
parameters are listed in Table 14. Following PCR amplification the product
was digested with DpnI/XmaI restriction enzymes and ligated to create the
deletion mutant expression vector.
123
Figure 30. Deletion of the 17th FNIII-like domain in VE-PTP-VN using a PCR based approach. PCR was performed to amplify the entire sequence of the pBiFC-VN155(VE-PTP)-SP-myc-TM-ECD except for the 17th FNIII-like domain that was to be deleted. The gel extracted PCR product was digested with DpnI/XmaI restriction enzymes and the plasmid was re-ligated together using T4DNA Ligase. (A) Gel electrophoresis analysis of the PCR product shows the band of the predicted size of ~9.0 kb. (B) Gel electrophoresis analysis of the digested PCR product confirms the right product of ~9.0 kb.
5000 5000
2000
A
1Kb
Plu
s D
NA
VE-P
TP-∆
17FN
-VN
9000
1Kb
Plu
s D
NA
VE-P
TP-∆
17FN
-VN
9000
B
2000
124
4.3 Western blot analysis of BiFC fusion proteins in HEK293T cells
Western blotting of lysates from transiently transfected HEK293T cells
confirmed the expression of all the fusion proteins close to their predicted
molecular weight (Figure 31). Western blotting with anti-myc antibody for the
VE-PTP-VN and VE-PTP∆17FN-VN mutant, which have a myc-tag inserted
following the signal peptide sequence (Figure 31, A), detected proteins with a
molecular weight of approximately 220 kDa. The predicted molecular weight
for VE-PTP-VN was 203 kDa. The discrepancy in molecular weight is
probably accounted for by extensive glycosylation. It has previously been
shown that VE-PTP has 26 potential N-glycosylation sites in its extracellular
domain (Krueger et al, 1990). VE-PTP∆17FN as a fusion with the N-terminal
fragment of vYFP was expressed at lower levels than VE-PTP-VN (Figure
31, A). Western blot experiments were performed at least twice and the
results were consistent.
Western blotting with the VE-cadherin antibody (ab7047) detected a 130 kDa
band corresponding to VE-cadherin (Figure 31, B). The band is larger than
the predicted 80 kDa but this is probably due to VE-cadherin being highly
glycosylated. A study by Geyer et al (1999) showed that the VE-cadherin has
seven potential N-glycosylation sites, all localised in its five cadherin
ectodomains and it has been demonstrated that indeed VE-cadherin is
accompanied by oligosaccharide side chains of reduced branching pattern,
which are highly sialylated. This would largely increase the size of a protein
and thus affect its migration so that the actual band size observed would be
different from that predicted.
Western blotting of lysates from transiently transfected HEK293T cells
confirmed the expression of control proteins SPN and Myr-VC and Myr-VN at
their predicted molecular weight (Figure 31, C-E). The predicted molecular
weight for Myr-VC and Myr-VN was 15.3 kDa and 21.9 kDa respectively,
which closely correspond to their migration points (Figure 31, C). The
predicted molecular weight for SPN-VN was 48.4 kDa and 41 kDa for SPN-
VC. A high-molecular weight smear, reflecting extensive glycosylation, was
apparent with the SPN constructs. All control proteins were expressed at

125
substantially higher levels than the VE-cadherin-VC protein (Figure 31,
panels A, C, D and E). However, the difference in band intensities could also
be explained by the lack of sensitivity of some antibodies. Anti-VE-cadherin
antibody could be less sensitive in recognising VE-cadherin compared with
anti-HA antibody recognising HA tag fused to controls.
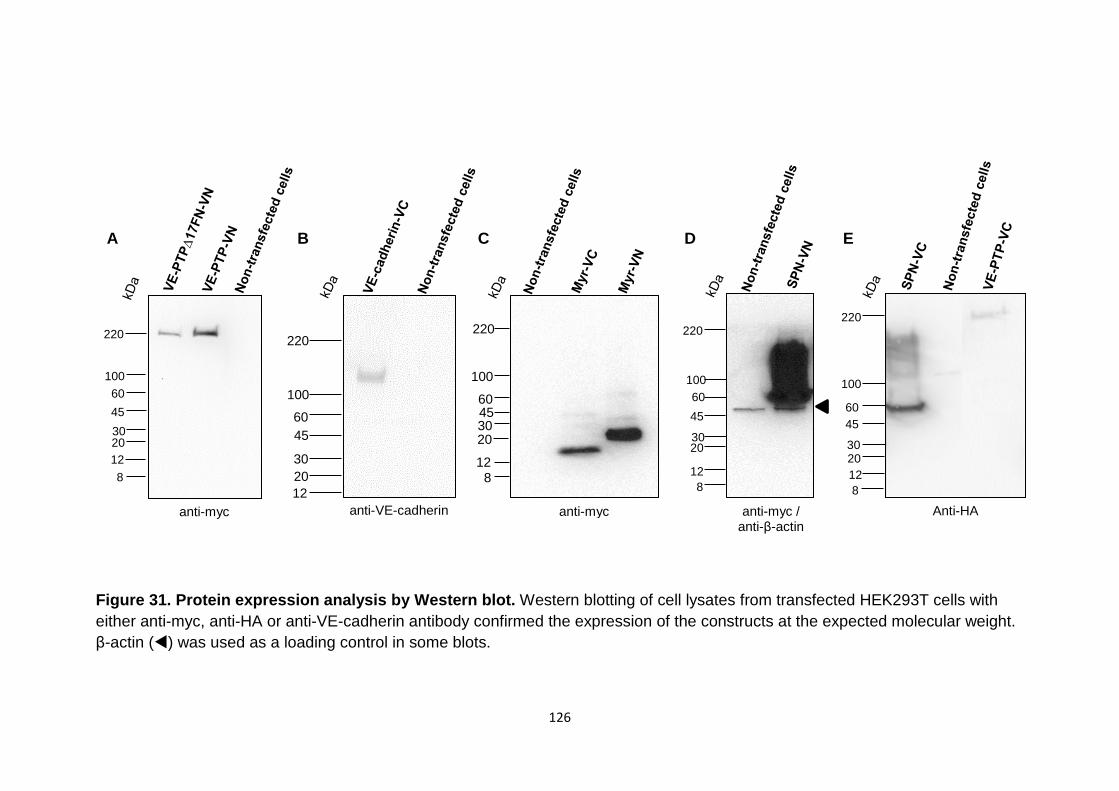
126
Figure 31. Protein expression analysis by Western blot. Western blotting of cell lysates from transfected HEK293T cells with either anti-myc, anti-HA or anti-VE-cadherin antibody confirmed the expression of the constructs at the expected molecular weight. β-actin () was used as a loading control in some blots.
8 12 20 30 45 60
100
220
anti-myc 8
12 20 30 45 60
100
220
anti-myc / anti-β-actin
8 12
30 45 60
100
220
20
Anti-HA
A B C D E
12 20 30 45 60
100
220
anti-VE-cadherin anti-myc
220
8 12 20 30 45 60
100
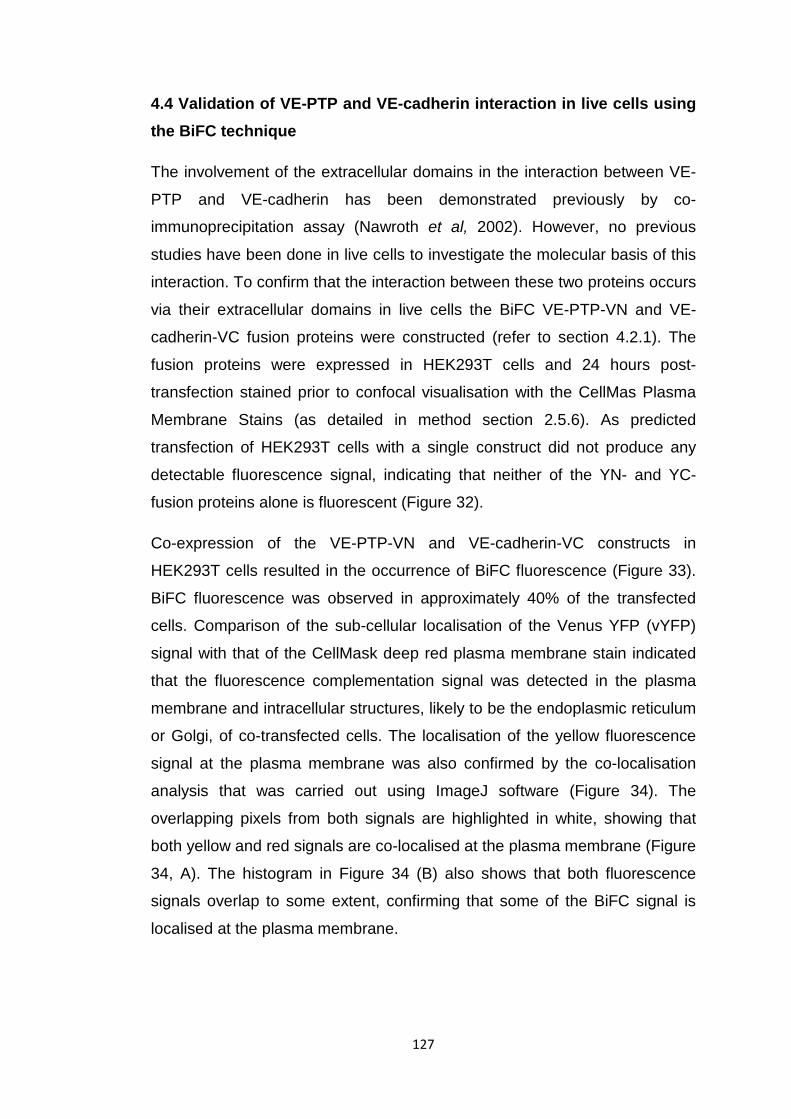
127
4.4 Validation of VE-PTP and VE-cadherin interaction in live cells using the BiFC technique
The involvement of the extracellular domains in the interaction between VE-
PTP and VE-cadherin has been demonstrated previously by co-
immunoprecipitation assay (Nawroth et al, 2002). However, no previous
studies have been done in live cells to investigate the molecular basis of this
interaction. To confirm that the interaction between these two proteins occurs
via their extracellular domains in live cells the BiFC VE-PTP-VN and VE-
cadherin-VC fusion proteins were constructed (refer to section 4.2.1). The
fusion proteins were expressed in HEK293T cells and 24 hours post-
transfection stained prior to confocal visualisation with the CellMas Plasma
Membrane Stains (as detailed in method section 2.5.6). As predicted
transfection of HEK293T cells with a single construct did not produce any
detectable fluorescence signal, indicating that neither of the YN- and YC-
fusion proteins alone is fluorescent (Figure 32).
Co-expression of the VE-PTP-VN and VE-cadherin-VC constructs in
HEK293T cells resulted in the occurrence of BiFC fluorescence (Figure 33).
BiFC fluorescence was observed in approximately 40% of the transfected
cells. Comparison of the sub-cellular localisation of the Venus YFP (vYFP)
signal with that of the CellMask deep red plasma membrane stain indicated
that the fluorescence complementation signal was detected in the plasma
membrane and intracellular structures, likely to be the endoplasmic reticulum
or Golgi, of co-transfected cells. The localisation of the yellow fluorescence
signal at the plasma membrane was also confirmed by the co-localisation
analysis that was carried out using ImageJ software (Figure 34). The
overlapping pixels from both signals are highlighted in white, showing that
both yellow and red signals are co-localised at the plasma membrane (Figure
34, A). The histogram in Figure 34 (B) also shows that both fluorescence
signals overlap to some extent, confirming that some of the BiFC signal is
localised at the plasma membrane.
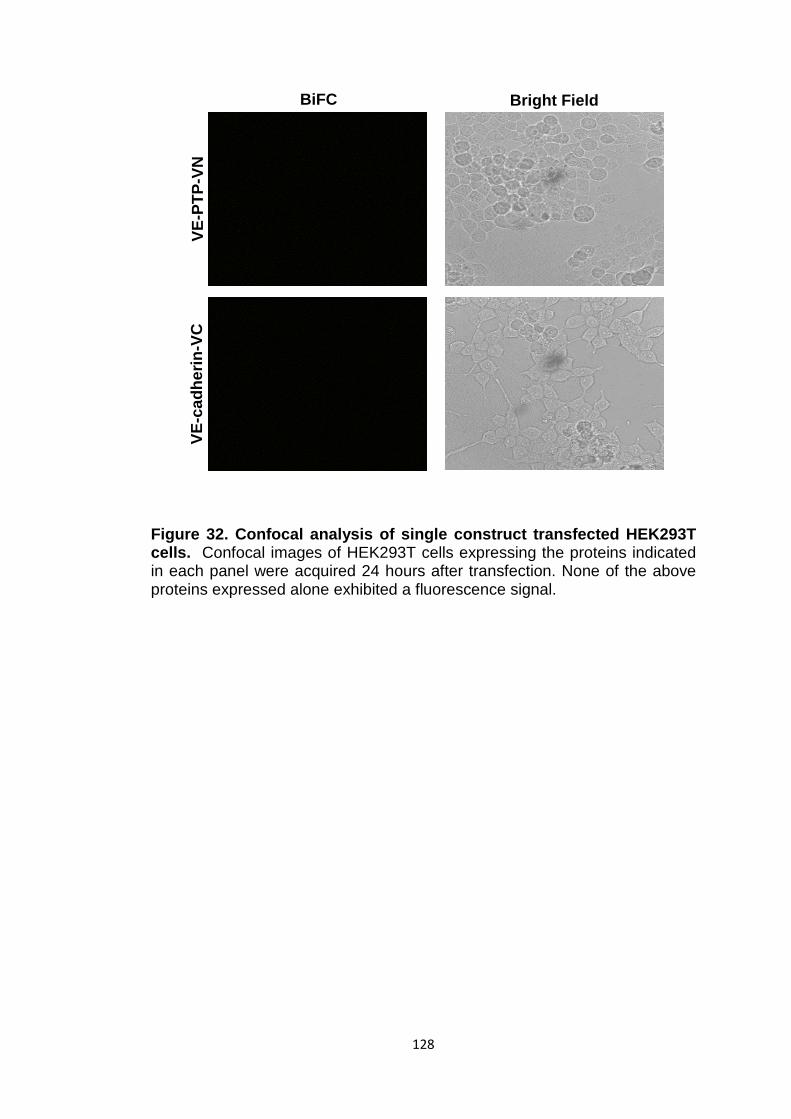
128
Figure 32. Confocal analysis of single construct transfected HEK293T cells. Confocal images of HEK293T cells expressing the proteins indicated in each panel were acquired 24 hours after transfection. None of the above proteins expressed alone exhibited a fluorescence signal.
VE-P
TP-V
N
BiFC Bright Field
VE-c
adhe
rin-V
C
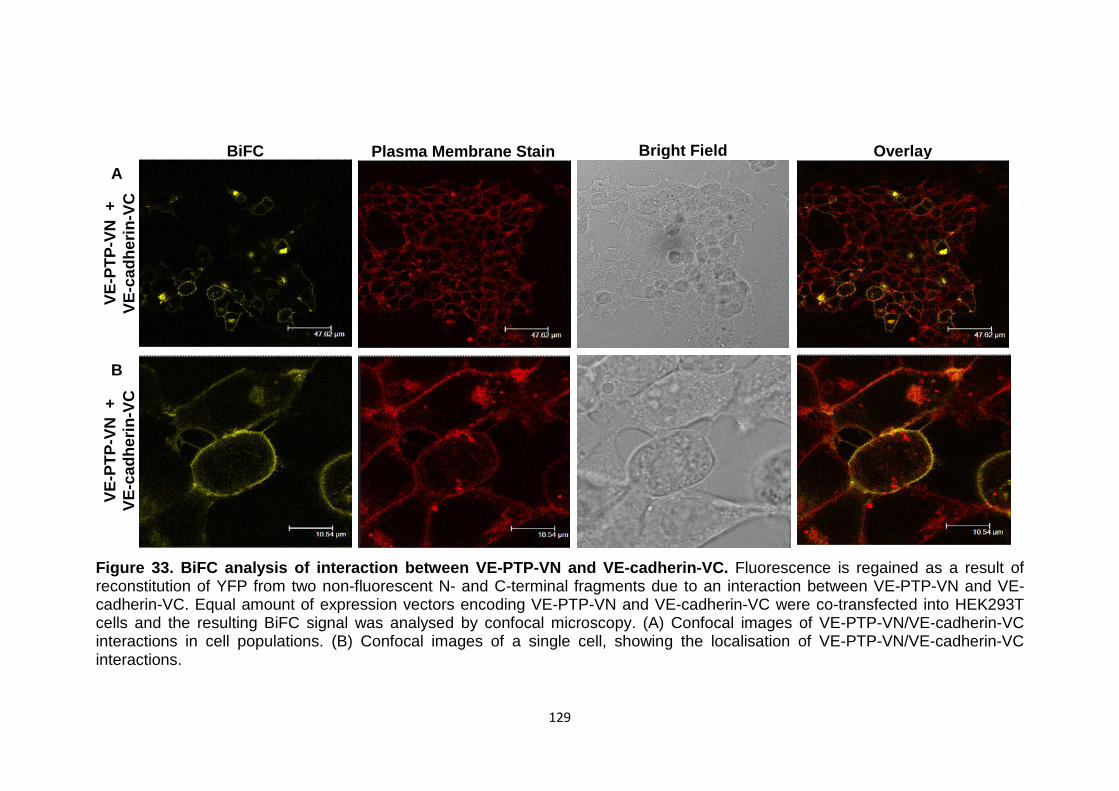
129
Figure 33. BiFC analysis of interaction between VE-PTP-VN and VE-cadherin-VC. Fluorescence is regained as a result of reconstitution of YFP from two non-fluorescent N- and C-terminal fragments due to an interaction between VE-PTP-VN and VE-cadherin-VC. Equal amount of expression vectors encoding VE-PTP-VN and VE-cadherin-VC were co-transfected into HEK293T cells and the resulting BiFC signal was analysed by confocal microscopy. (A) Confocal images of VE-PTP-VN/VE-cadherin-VC interactions in cell populations. (B) Confocal images of a single cell, showing the localisation of VE-PTP-VN/VE-cadherin-VC interactions.
BiFC Plasma Membrane Stain Bright Field Overlay
VE-P
TP-V
N +
VE
-cad
herin
-VC
VE
-PTP
-VN
+
VE-c
adhe
rin-V
C
A
B
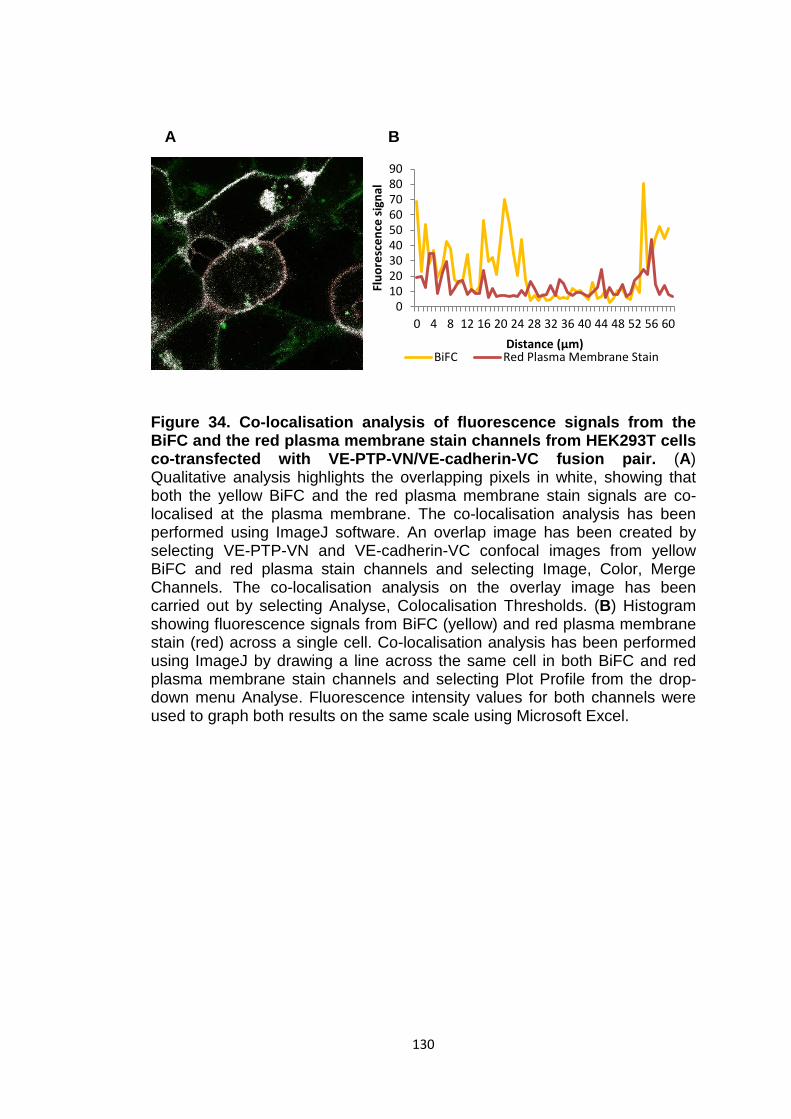
130
Figure 34. Co-localisation analysis of fluorescence signals from the BiFC and the red plasma membrane stain channels from HEK293T cells co-transfected with VE-PTP-VN/VE-cadherin-VC fusion pair. (A) Qualitative analysis highlights the overlapping pixels in white, showing that both the yellow BiFC and the red plasma membrane stain signals are co-localised at the plasma membrane. The co-localisation analysis has been performed using ImageJ software. An overlap image has been created by selecting VE-PTP-VN and VE-cadherin-VC confocal images from yellow BiFC and red plasma stain channels and selecting Image, Color, Merge Channels. The co-localisation analysis on the overlay image has been carried out by selecting Analyse, Colocalisation Thresholds. (B) Histogram showing fluorescence signals from BiFC (yellow) and red plasma membrane stain (red) across a single cell. Co-localisation analysis has been performed using ImageJ by drawing a line across the same cell in both BiFC and red plasma membrane stain channels and selecting Plot Profile from the drop-down menu Analyse. Fluorescence intensity values for both channels were used to graph both results on the same scale using Microsoft Excel.
0102030405060708090
0 4 8 12 16 20 24 28 32 36 40 44 48 52 56 60
Fluo
resc
ence
sign
al
Distance (μm) BiFC Red Plasma Membrane Stain
A B
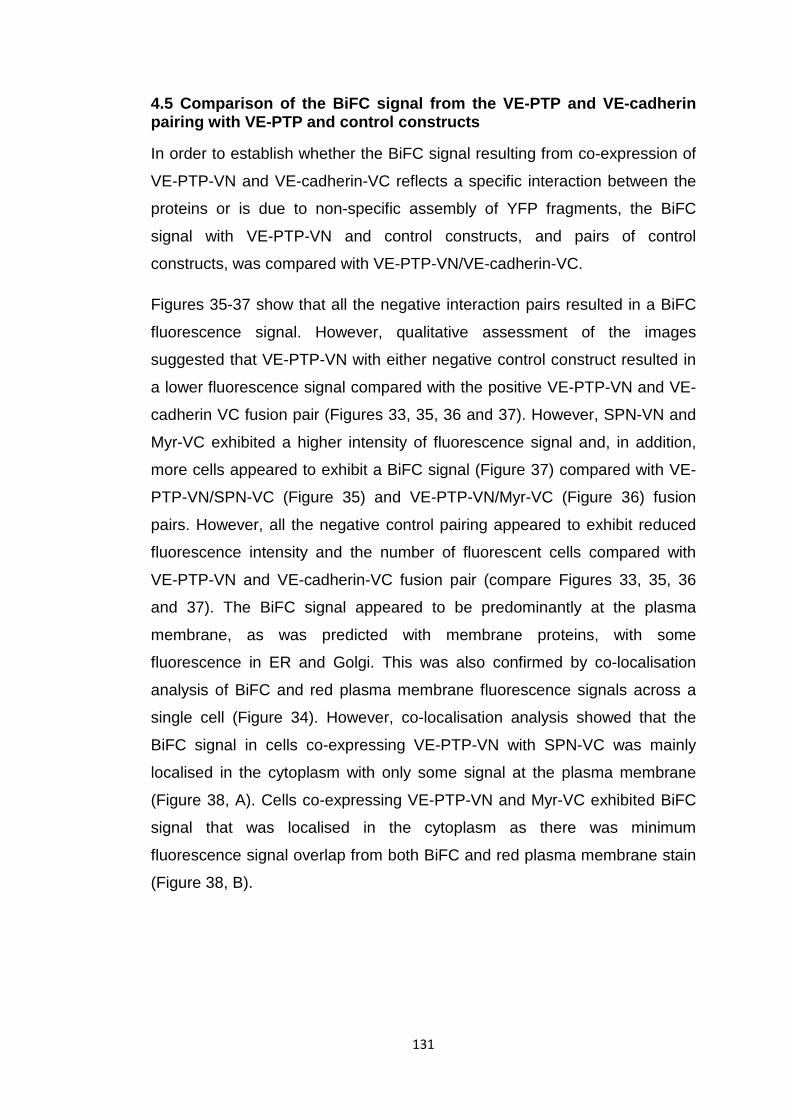
131
4.5 Comparison of the BiFC signal from the VE-PTP and VE-cadherin pairing with VE-PTP and control constructs
In order to establish whether the BiFC signal resulting from co-expression of
VE-PTP-VN and VE-cadherin-VC reflects a specific interaction between the
proteins or is due to non-specific assembly of YFP fragments, the BiFC
signal with VE-PTP-VN and control constructs, and pairs of control
constructs, was compared with VE-PTP-VN/VE-cadherin-VC.
Figures 35-37 show that all the negative interaction pairs resulted in a BiFC
fluorescence signal. However, qualitative assessment of the images
suggested that VE-PTP-VN with either negative control construct resulted in
a lower fluorescence signal compared with the positive VE-PTP-VN and VE-
cadherin VC fusion pair (Figures 33, 35, 36 and 37). However, SPN-VN and
Myr-VC exhibited a higher intensity of fluorescence signal and, in addition,
more cells appeared to exhibit a BiFC signal (Figure 37) compared with VE-
PTP-VN/SPN-VC (Figure 35) and VE-PTP-VN/Myr-VC (Figure 36) fusion
pairs. However, all the negative control pairing appeared to exhibit reduced
fluorescence intensity and the number of fluorescent cells compared with
VE-PTP-VN and VE-cadherin-VC fusion pair (compare Figures 33, 35, 36
and 37). The BiFC signal appeared to be predominantly at the plasma
membrane, as was predicted with membrane proteins, with some
fluorescence in ER and Golgi. This was also confirmed by co-localisation
analysis of BiFC and red plasma membrane fluorescence signals across a
single cell (Figure 34). However, co-localisation analysis showed that the
BiFC signal in cells co-expressing VE-PTP-VN with SPN-VC was mainly
localised in the cytoplasm with only some signal at the plasma membrane
(Figure 38, A). Cells co-expressing VE-PTP-VN and Myr-VC exhibited BiFC
signal that was localised in the cytoplasm as there was minimum
fluorescence signal overlap from both BiFC and red plasma membrane stain
(Figure 38, B).
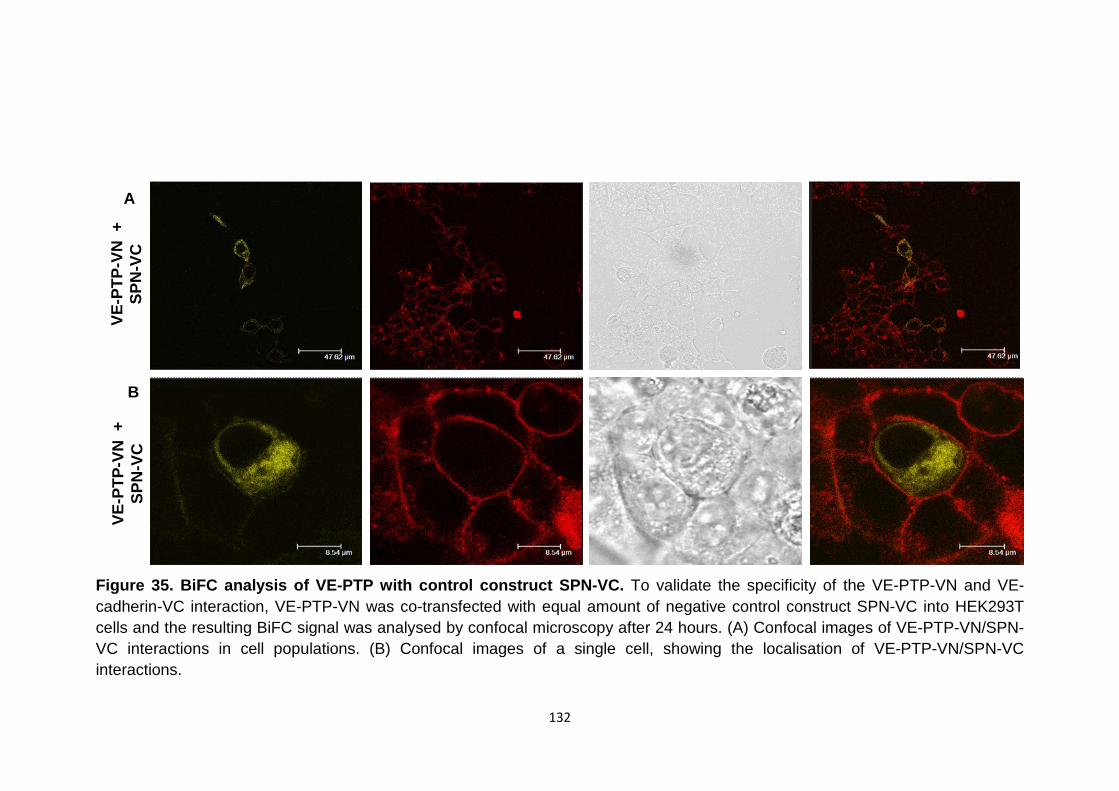
132
Figure 35. BiFC analysis of VE-PTP with control construct SPN-VC. To validate the specificity of the VE-PTP-VN and VE-cadherin-VC interaction, VE-PTP-VN was co-transfected with equal amount of negative control construct SPN-VC into HEK293T cells and the resulting BiFC signal was analysed by confocal microscopy after 24 hours. (A) Confocal images of VE-PTP-VN/SPN-VC interactions in cell populations. (B) Confocal images of a single cell, showing the localisation of VE-PTP-VN/SPN-VC interactions.
B
A
VE-P
TP-V
N +
SP
N-V
C
VE-P
TP-V
N +
SP
N-V
C
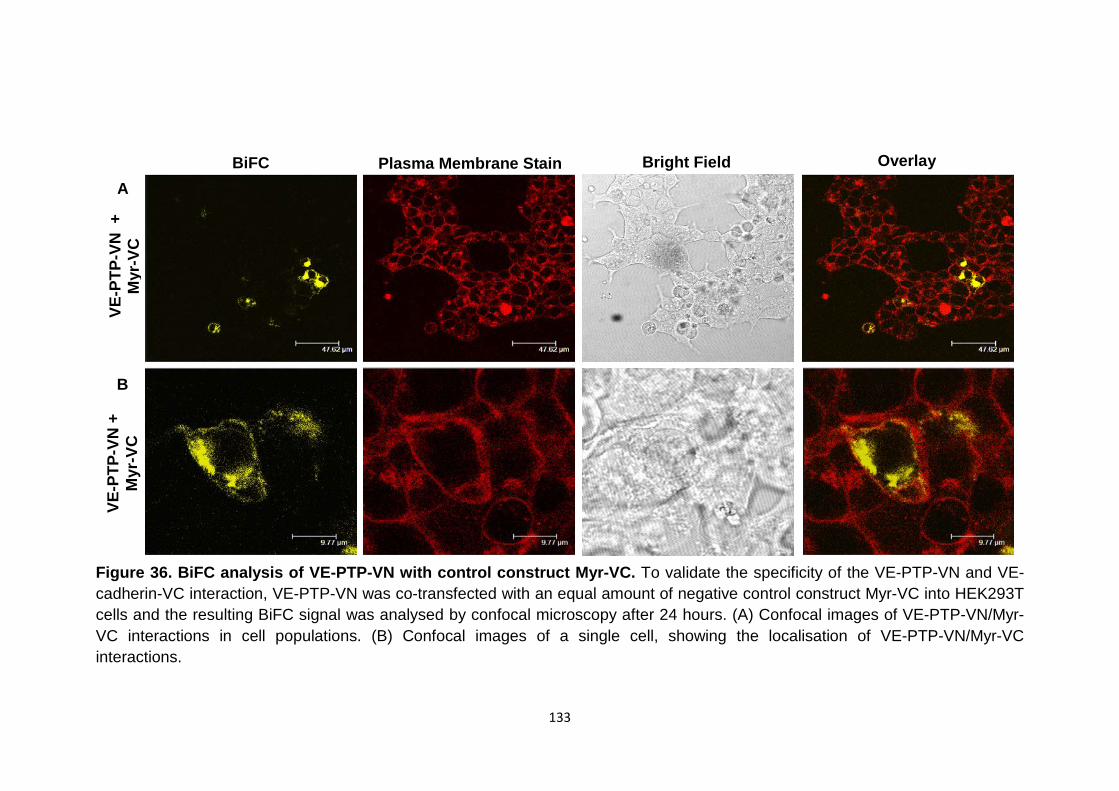
133
Figure 36. BiFC analysis of VE-PTP-VN with control construct Myr-VC. To validate the specificity of the VE-PTP-VN and VE-cadherin-VC interaction, VE-PTP-VN was co-transfected with an equal amount of negative control construct Myr-VC into HEK293T cells and the resulting BiFC signal was analysed by confocal microscopy after 24 hours. (A) Confocal images of VE-PTP-VN/Myr-VC interactions in cell populations. (B) Confocal images of a single cell, showing the localisation of VE-PTP-VN/Myr-VC interactions.
BiFC Bright Field Plasma Membrane Stain Overlay
VE-P
TP-V
N +
M
yr-V
C
VE-P
TP-V
N +
M
yr-V
C
A
B
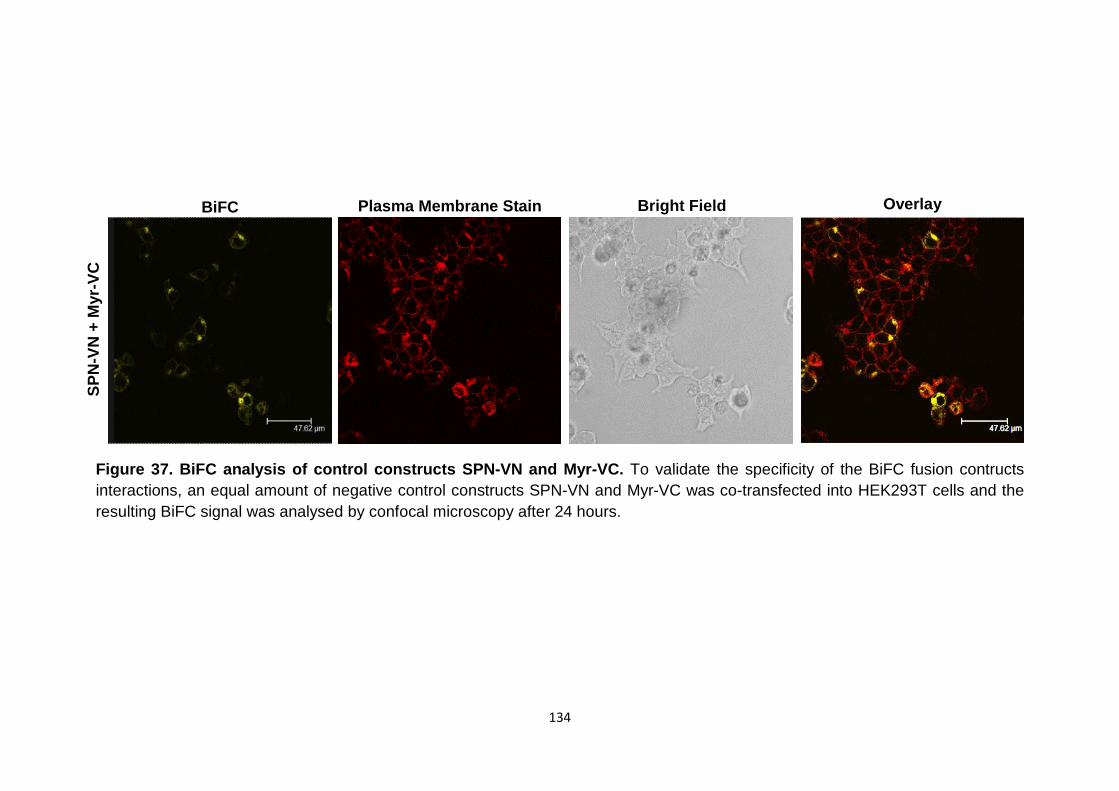
134
Figure 37. BiFC analysis of control constructs SPN-VN and Myr-VC. To validate the specificity of the BiFC fusion contructs interactions, an equal amount of negative control constructs SPN-VN and Myr-VC was co-transfected into HEK293T cells and the resulting BiFC signal was analysed by confocal microscopy after 24 hours.
BiFC Bright Field Plasma Membrane Stain Overlay
SPN
-VN
+ M
yr-V
C
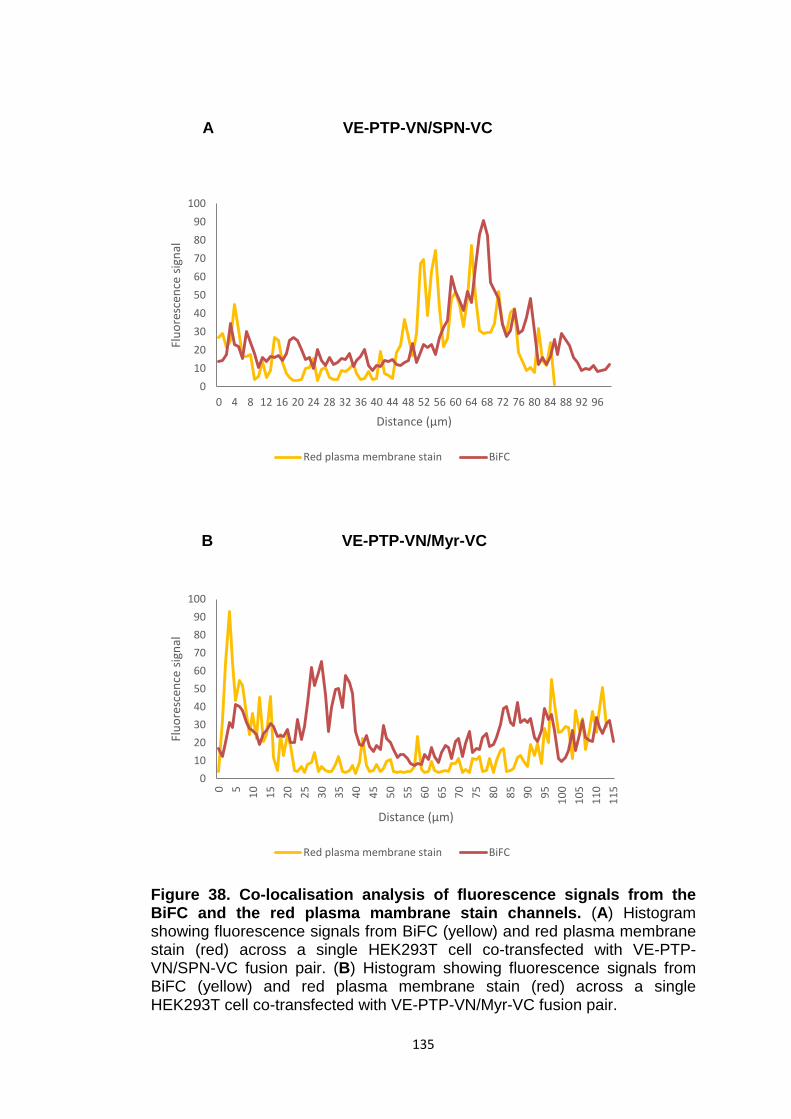
135
Figure 38. Co-localisation analysis of fluorescence signals from the BiFC and the red plasma mambrane stain channels. (A) Histogram showing fluorescence signals from BiFC (yellow) and red plasma membrane stain (red) across a single HEK293T cell co-transfected with VE-PTP-VN/SPN-VC fusion pair. (B) Histogram showing fluorescence signals from BiFC (yellow) and red plasma membrane stain (red) across a single HEK293T cell co-transfected with VE-PTP-VN/Myr-VC fusion pair.
0102030405060708090
100
0 4 8 12 16 20 24 28 32 36 40 44 48 52 56 60 64 68 72 76 80 84 88 92 96
Fluo
resc
ence
sig
nal
Distance (µm)
Red plasma membrane stain BiFC
0102030405060708090
100
0 5 10 15 20 25 30 35 40 45 50 55 60 65 70 75 80 85 90 95 100
105
110
115
Fluo
resc
ence
sig
nal
Distance (µm)
Red plasma membrane stain BiFC
A VE-PTP-VN/SPN-VC
B VE-PTP-VN/Myr-VC
136
4.6 Quantitative analysis of BiFC data
In order to obtain a more robust interpretation of the data and establish
whether the results of BiFC experiments with VE-PTP-VN/VE-cadherin-VC
represent true protein-protein interactions or are driven by the self-assembly
of the two non-fluorescent YFP fragments, images were processed with
ImageJ software to quantitate fluorescence signals. Quantitative
comparisons of the fluorescence signal obtained with the cognate pairing
and control pairings were performed. Quantitative analysis of BiFC data has
previously been performed in other studies of cytosolic proteins by
calculating the ratio of BiFC fluorescent intensity relative to an expressed
Cerulean control protein to normalise for protein expression levels (Kerppola,
2006; Kodama and Hu, 2010). In this chapter the BiFC fluorescent intensity
of individual cells was measured and the CellMask Deep Red membrane
stain was used as a reference (as described in the methods section 2.5.9).
This quantitative analysis approach was validated in Chapter 3 using the well
characterised transcription factors bJun and bFos, which are known to form a
hetero-dimer (positive control), and bJun and the deletion mutant bFos∆ZIP,
which lacks the interaction domain (negative control).
Briefly, the quantitation procedure consisted of the following steps: confocal
images from cells displaying a BiFC signal which had been stained with the
CellMask Deep Red membrane stain were acquired in a random distribution.
By tracing the outline of each cell in the ImageJ using a polygon selection the
yellow fluorescent intensity derived from bimolecular fluorescence
complementation and the red fluorescent signal derived from the plasma
membrane stain of the selected region, including border, were calculated.
The background signal in an area with no cells was subtracted from all
values. The results for each cell (i.e. ImageJ region of interest) were
expressed as a yellow/red ratio (i.e. vYFP fluorescence intensity/deep red
fluorescence intensity). On average about 700 cells from at least three
random fields from three or more independent experiments for each fusion
protein combination were analysed. The ratio in individual cells was then
plotted in a histogram (Figure 39).
137
The distribution of yellow/red ratios represents a measure of the efficiency of
bimolecular fluorescence complementation. The efficiency of BiFC is defined
by the fluorescent intensity that results upon bimolecular complex formation
when specific fusion proteins are expressed in cells. The YFP fragments,
however, have the tendency to associate with each other independently
when expressed at sufficiently high concentrations but the BiFC efficiency is
significantly reduced (Kerrpola, 2008). As can be seen from the histogram in
Figure 39 (A) co-expressing VE-PTP-VN and VE-cadherin-VC results in
higher cell numbers that have higher ratio value range compared with cells
co-expressing VE-PTP-VN and Myr-VC (Figure 39, B) or SPN-VN and Myr-
VC (Figure 39, D) negative interacting pairs. When comparing the distribution
of ratios from VE-PTP-VN/VE-cadherin-VC and VE-PTP-VN/SPN-VC there
appears to be little or no difference (Figure 39, C), suggesting that there is a
possible interaction between VE-PTP and SPN. However, just based on
these results it is difficult to conclude with confidence that VE-PTP-VN/VE-
cadherin-VC co-expression results in higher yellow/red ratio values.
In addition, to measure the BiFC specificity the signal-to-noise (S/N) ratio
was calculated as described in previous studies by Kerppola (2010). A higher
S/N ratio value reflects a more specific interaction. The S/N ratio was
calculated by dividing the median value of BiFC efficiency for the positive
interaction (i.e. VE-PTP-VN/VE-cadherin-VC) by the median value of BiFC
efficiency for the negative interaction (VE-PTP-VN/Myr-VC) (Kerppola, 2010;
Kodama and Hu, 2010). Since there are no previous documented reports
about VE-PTP and SPN interactions and since the yellow/red ratio
distributions for VE-PTP-VN/VE-cadherin-VC and VE-PTP-VN/SPN-VC
appeared to be similar, the S/N ratio was also calculated for VE-PTP-
VN/SPN-VC and compared with VE-PTP-VN/VE-cadherin-VC. As can be
seen from Figure 36, the VE-PTP-VN/VE-cadherin-VC pairing resulted in S/N
value of 6.5 that was 2-fold higher when compared with VE-PTP-VN in
combination with SPN-VC, indicating a specific interaction of VE-PTP-VN
and VE-cadherin-VC.
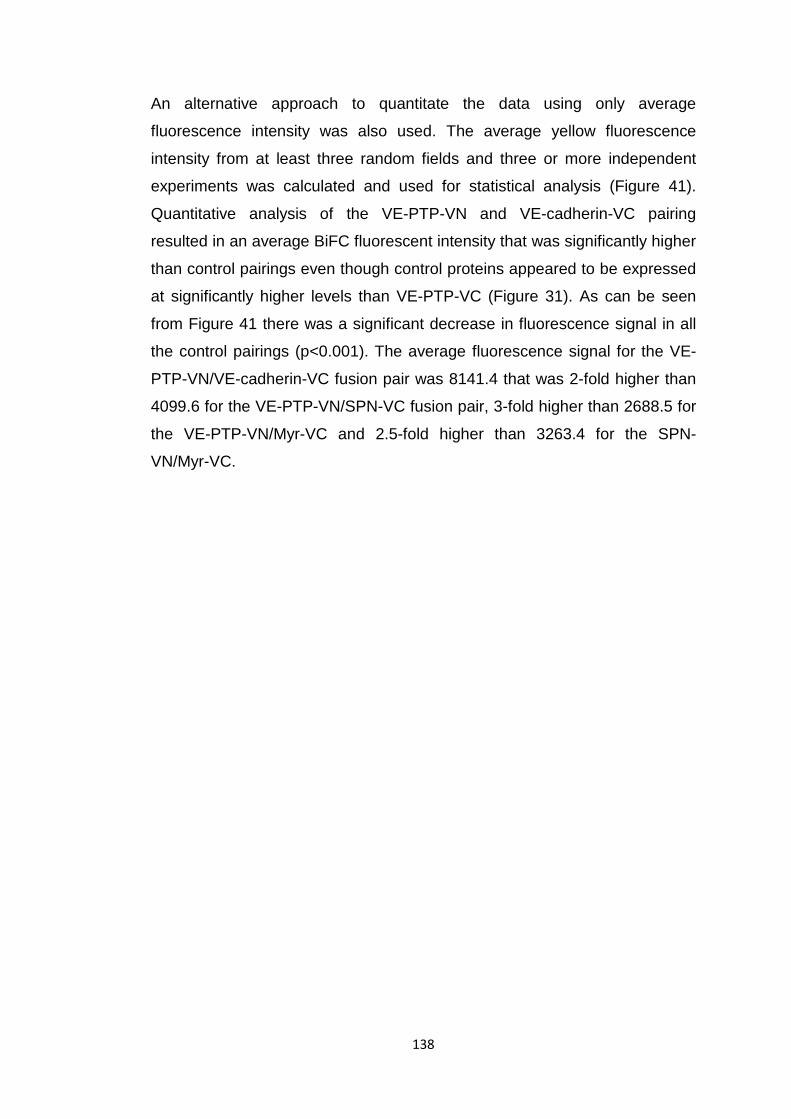
138
An alternative approach to quantitate the data using only average
fluorescence intensity was also used. The average yellow fluorescence
intensity from at least three random fields and three or more independent
experiments was calculated and used for statistical analysis (Figure 41).
Quantitative analysis of the VE-PTP-VN and VE-cadherin-VC pairing
resulted in an average BiFC fluorescent intensity that was significantly higher
than control pairings even though control proteins appeared to be expressed
at significantly higher levels than VE-PTP-VC (Figure 31). As can be seen
from Figure 41 there was a significant decrease in fluorescence signal in all
the control pairings (p<0.001). The average fluorescence signal for the VE-
PTP-VN/VE-cadherin-VC fusion pair was 8141.4 that was 2-fold higher than
4099.6 for the VE-PTP-VN/SPN-VC fusion pair, 3-fold higher than 2688.5 for
the VE-PTP-VN/Myr-VC and 2.5-fold higher than 3263.4 for the SPN-
VN/Myr-VC.
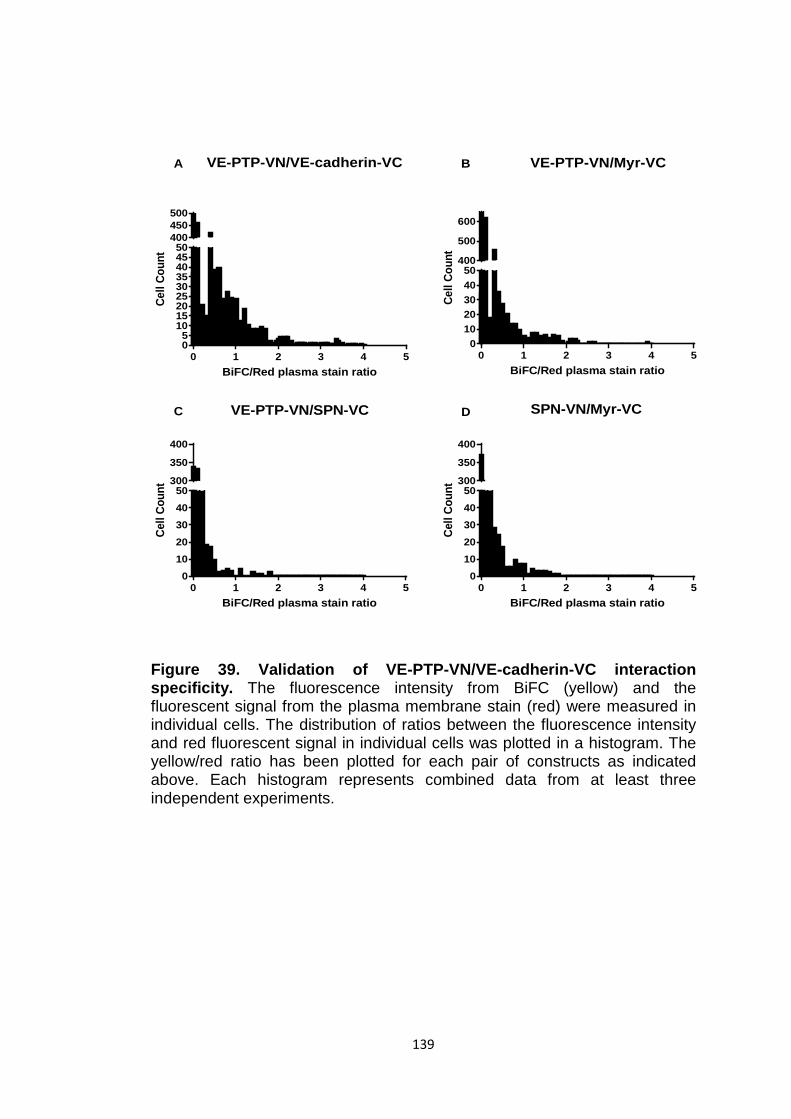
139
0 1 2 3 4 505
101520253035404550
400450500
BiFC/Red plasma stain ratio
Cell
Coun
t
0 1 2 3 4 50
1020304050
400
500
600
BiFC/Red plasma stain ratio
Cell
Coun
t
0 1 2 3 4 50
1020304050
300
350
400
BiFC/Red plasma stain ratio
Cell
Coun
t
0 1 2 3 4 50
1020304050
300
350
400
BiFC/Red plasma stain ratio
Cell
Coun
t
A B
C D
VE-PTP-VN/VE-cadherin-VC VE-PTP-VN/Myr-VC
VE-PTP-VN/SPN-VC SPN-VN/Myr-VC
Figure 39. Validation of VE-PTP-VN/VE-cadherin-VC interaction specificity. The fluorescence intensity from BiFC (yellow) and the fluorescent signal from the plasma membrane stain (red) were measured in individual cells. The distribution of ratios between the fluorescence intensity and red fluorescent signal in individual cells was plotted in a histogram. The yellow/red ratio has been plotted for each pair of constructs as indicated above. Each histogram represents combined data from at least three independent experiments.
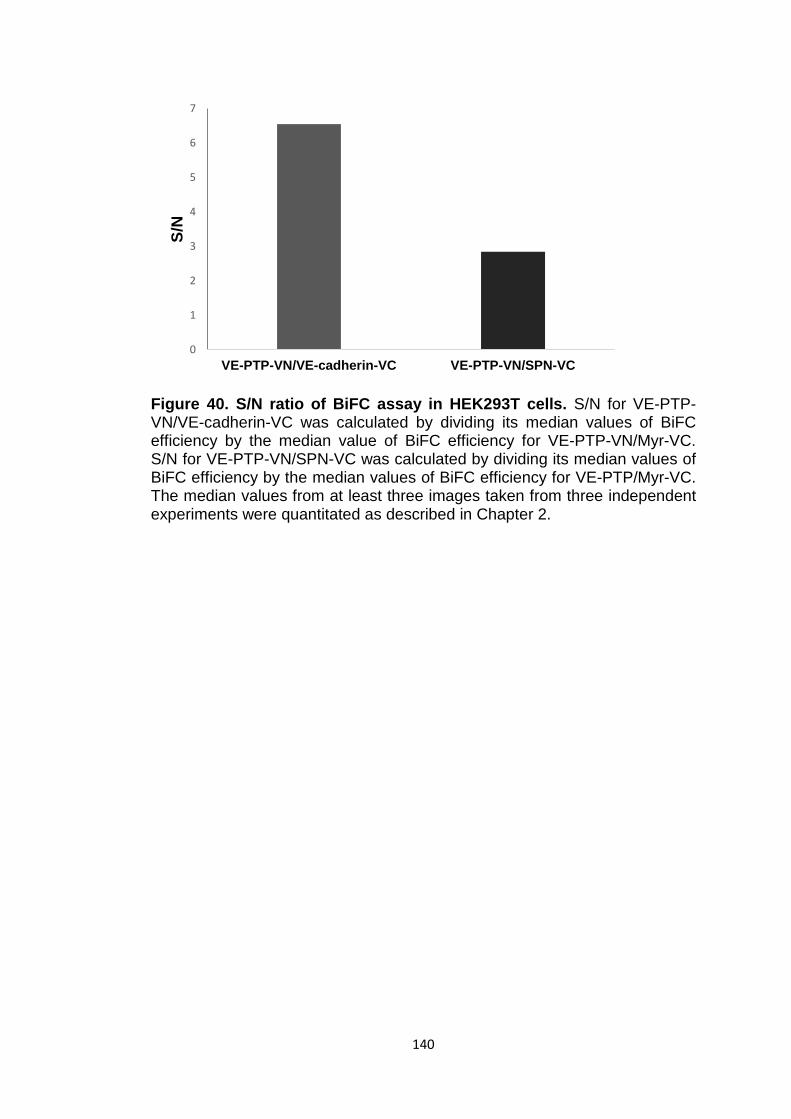
140
Figure 40. S/N ratio of BiFC assay in HEK293T cells. S/N for VE-PTP-VN/VE-cadherin-VC was calculated by dividing its median values of BiFC efficiency by the median value of BiFC efficiency for VE-PTP-VN/Myr-VC. S/N for VE-PTP-VN/SPN-VC was calculated by dividing its median values of BiFC efficiency by the median values of BiFC efficiency for VE-PTP/Myr-VC. The median values from at least three images taken from three independent experiments were quantitated as described in Chapter 2.
0
1
2
3
4
5
6
7
VE-PTP-VN/VE-cadherin-VC VE-PTP-VN/SPN-VC
S/N
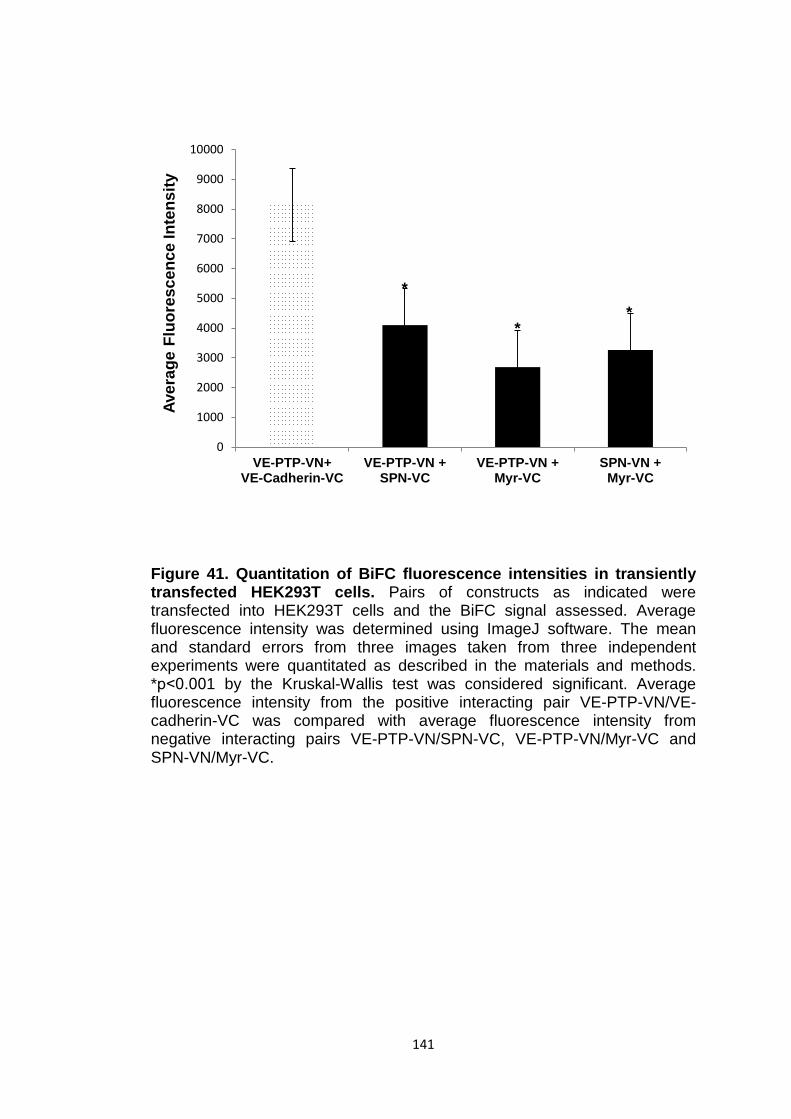
141
Figure 41. Quantitation of BiFC fluorescence intensities in transiently transfected HEK293T cells. Pairs of constructs as indicated were transfected into HEK293T cells and the BiFC signal assessed. Average fluorescence intensity was determined using ImageJ software. The mean and standard errors from three images taken from three independent experiments were quantitated as described in the materials and methods. *p˂0.001 by the Kruskal-Wallis test was considered significant. Average fluorescence intensity from the positive interacting pair VE-PTP-VN/VE-cadherin-VC was compared with average fluorescence intensity from negative interacting pairs VE-PTP-VN/SPN-VC, VE-PTP-VN/Myr-VC and SPN-VN/Myr-VC.
0
1000
2000
3000
4000
5000
6000
7000
8000
9000
10000
VE-PTP-VN+VE-Cadherin-VC
VE-PTP-VN +SPN-VC
VE-PTP-VN +Myr-VC
SPN-VN +Myr-VC
Aver
age
Fluo
resc
ence
Inte
nsity
*
* *
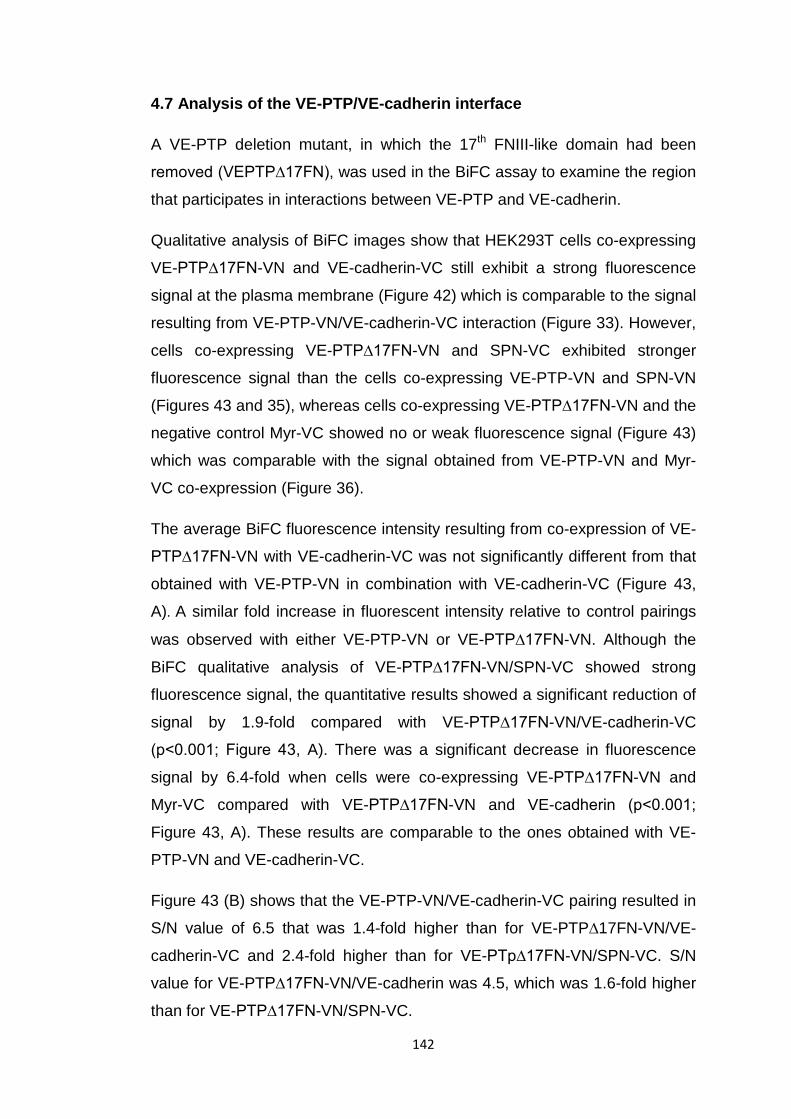
142
4.7 Analysis of the VE-PTP/VE-cadherin interface
A VE-PTP deletion mutant, in which the 17th FNIII-like domain had been
removed (VEPTP∆17FN), was used in the BiFC assay to examine the region
that participates in interactions between VE-PTP and VE-cadherin.
Qualitative analysis of BiFC images show that HEK293T cells co-expressing
VE-PTP∆17FN-VN and VE-cadherin-VC still exhibit a strong fluorescence
signal at the plasma membrane (Figure 42) which is comparable to the signal
resulting from VE-PTP-VN/VE-cadherin-VC interaction (Figure 33). However,
cells co-expressing VE-PTP∆17FN-VN and SPN-VC exhibited stronger
fluorescence signal than the cells co-expressing VE-PTP-VN and SPN-VN
(Figures 43 and 35), whereas cells co-expressing VE-PTP∆17FN-VN and the
negative control Myr-VC showed no or weak fluorescence signal (Figure 43)
which was comparable with the signal obtained from VE-PTP-VN and Myr-
VC co-expression (Figure 36).
The average BiFC fluorescence intensity resulting from co-expression of VE-
PTP∆17FN-VN with VE-cadherin-VC was not significantly different from that
obtained with VE-PTP-VN in combination with VE-cadherin-VC (Figure 43,
A). A similar fold increase in fluorescent intensity relative to control pairings
was observed with either VE-PTP-VN or VE-PTP∆17FN-VN. Although the
BiFC qualitative analysis of VE-PTP∆17FN-VN/SPN-VC showed strong
fluorescence signal, the quantitative results showed a significant reduction of
signal by 1.9-fold compared with VE-PTP∆17FN-VN/VE-cadherin-VC
(p˂0.001; Figure 43, A). There was a significant decrease in fluorescence
signal by 6.4-fold when cells were co-expressing VE-PTP∆17FN-VN and
Myr-VC compared with VE-PTP∆17FN-VN and VE-cadherin (p˂0.001;
Figure 43, A). These results are comparable to the ones obtained with VE-
PTP-VN and VE-cadherin-VC.
Figure 43 (B) shows that the VE-PTP-VN/VE-cadherin-VC pairing resulted in
S/N value of 6.5 that was 1.4-fold higher than for VE-PTP∆17FN-VN/VE-
cadherin-VC and 2.4-fold higher than for VE-PTp∆17FN-VN/SPN-VC. S/N
value for VE-PTP∆17FN-VN/VE-cadherin was 4.5, which was 1.6-fold higher
than for VE-PTP∆17FN-VN/SPN-VC.
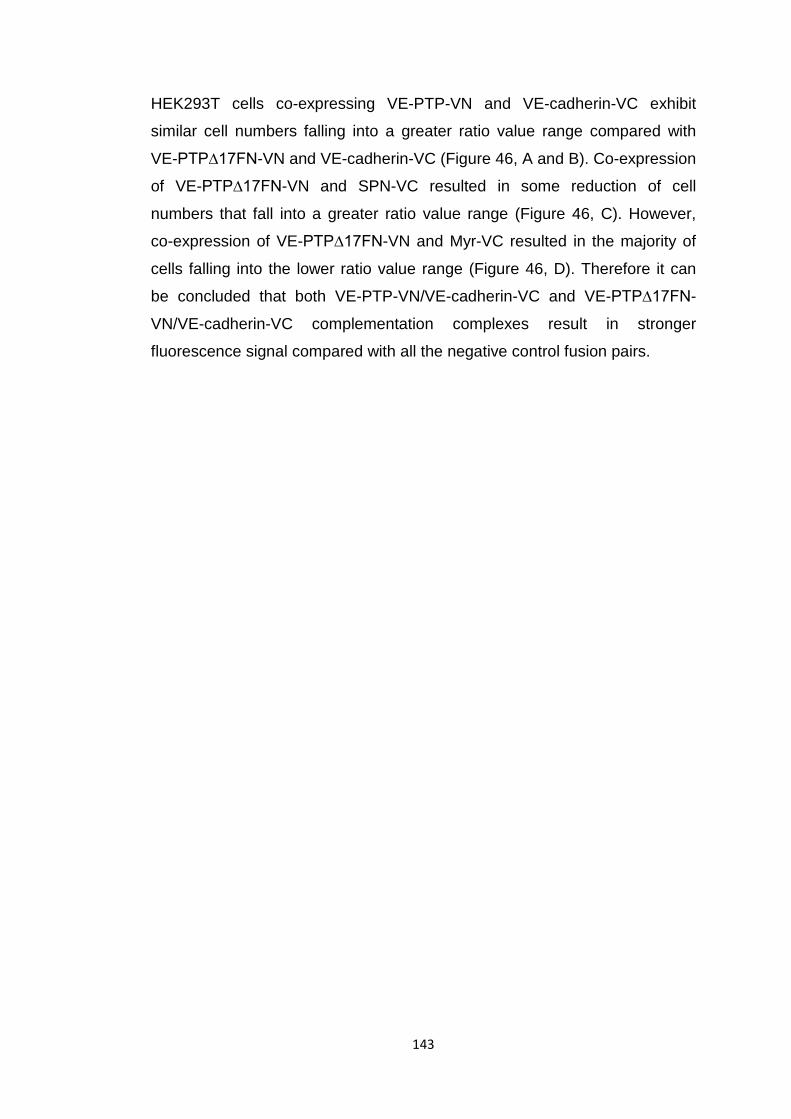
143
HEK293T cells co-expressing VE-PTP-VN and VE-cadherin-VC exhibit
similar cell numbers falling into a greater ratio value range compared with
VE-PTP∆17FN-VN and VE-cadherin-VC (Figure 46, A and B). Co-expression
of VE-PTP∆17FN-VN and SPN-VC resulted in some reduction of cell
numbers that fall into a greater ratio value range (Figure 46, C). However,
co-expression of VE-PTP∆17FN-VN and Myr-VC resulted in the majority of
cells falling into the lower ratio value range (Figure 46, D). Therefore it can
be concluded that both VE-PTP-VN/VE-cadherin-VC and VE-PTP∆17FN-
VN/VE-cadherin-VC complementation complexes result in stronger
fluorescence signal compared with all the negative control fusion pairs.
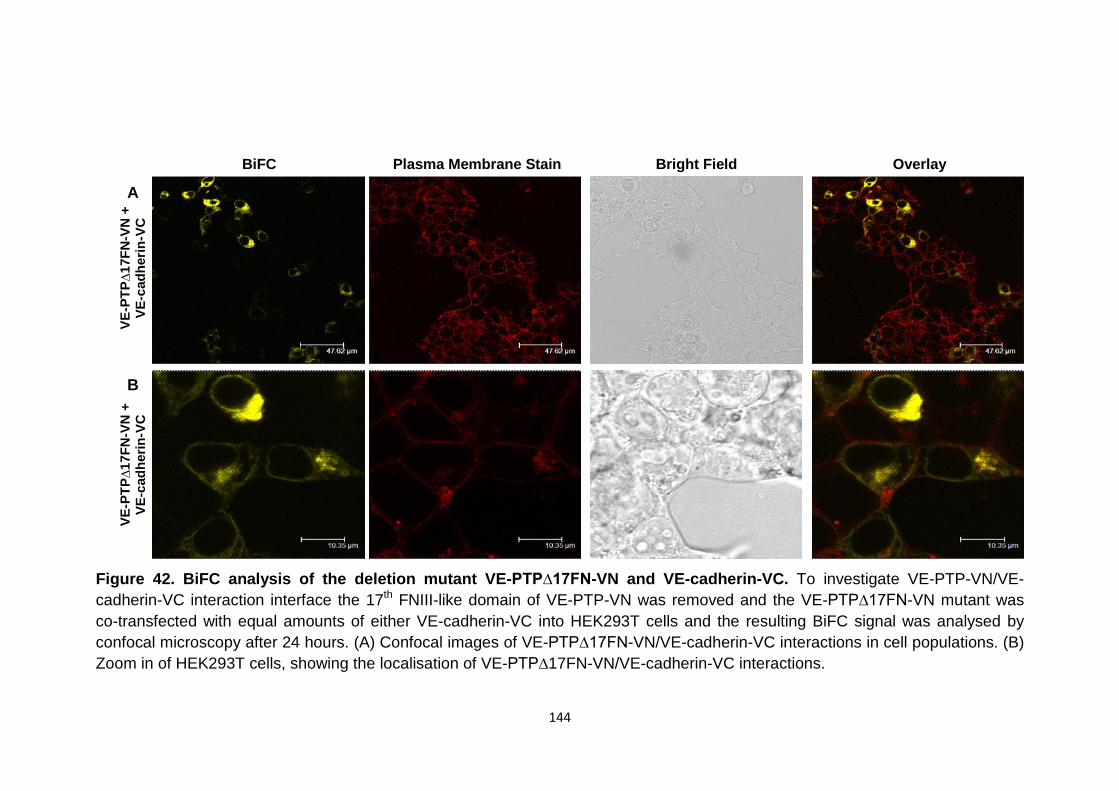
144
Figure 42. BiFC analysis of the deletion mutant VE-PTP∆17FN-VN and VE-cadherin-VC. To investigate VE-PTP-VN/VE-cadherin-VC interaction interface the 17th FNIII-like domain of VE-PTP-VN was removed and the VE-PTP∆17FN-VN mutant was co-transfected with equal amounts of either VE-cadherin-VC into HEK293T cells and the resulting BiFC signal was analysed by confocal microscopy after 24 hours. (A) Confocal images of VE-PTP∆17FN-VN/VE-cadherin-VC interactions in cell populations. (B) Zoom in of HEK293T cells, showing the localisation of VE-PTP∆17FN-VN/VE-cadherin-VC interactions.
BiFC Bright Field Plasma Membrane Stain Overlay
VE-P
TP∆1
7FN
-VN
+
VE-c
adhe
rin-V
C
VE-P
TP∆1
7FN
-VN
+
VE-c
adhe
rin-V
C
A
B
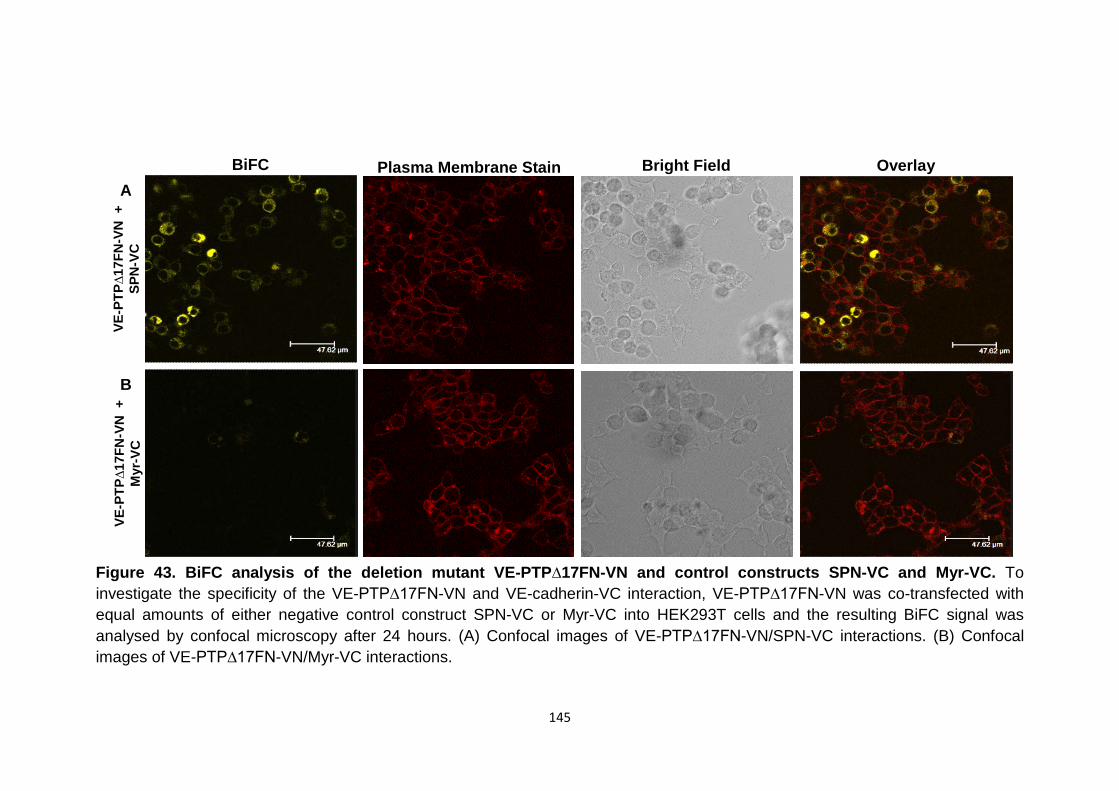
145
Figure 43. BiFC analysis of the deletion mutant VE-PTP∆17FN-VN and control constructs SPN-VC and Myr-VC. To investigate the specificity of the VE-PTP∆17FN-VN and VE-cadherin-VC interaction, VE-PTP∆17FN-VN was co-transfected with equal amounts of either negative control construct SPN-VC or Myr-VC into HEK293T cells and the resulting BiFC signal was analysed by confocal microscopy after 24 hours. (A) Confocal images of VE-PTP∆17FN-VN/SPN-VC interactions. (B) Confocal images of VE-PTP∆17FN-VN/Myr-VC interactions.
VE-P
TP∆1
7FN
-VN
+
SPN
-VC
VE
-PTP
∆17F
N-V
N +
M
yr-V
C
BiFC Bright Field Plasma Membrane Stain Overlay A
B
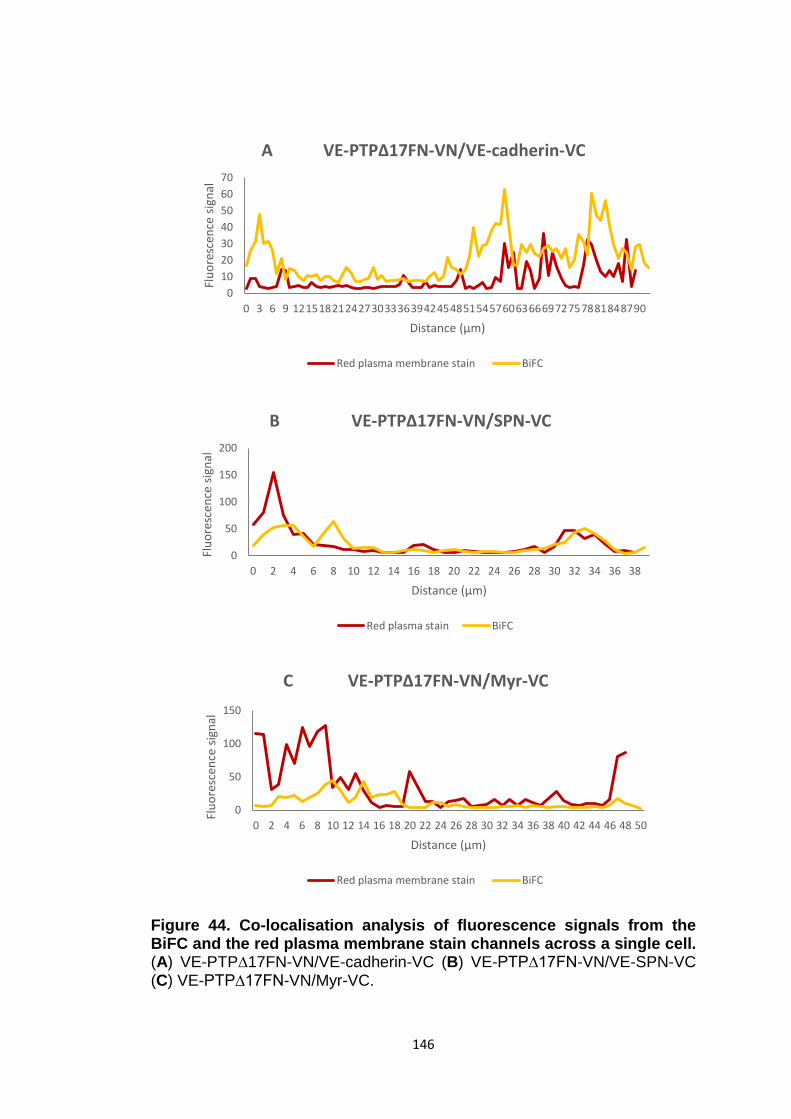
146
Figure 44. Co-localisation analysis of fluorescence signals from the BiFC and the red plasma membrane stain channels across a single cell. (A) VE-PTP∆17FN-VN/VE-cadherin-VC (B) VE-PTP∆17FN-VN/VE-SPN-VC (C) VE-PTP∆17FN-VN/Myr-VC.
010203040506070
0 3 6 9 121518212427303336394245485154576063666972757881848790
Fluo
resc
ence
sig
nal
Distance (µm)
A VE-PTP∆17FN-VN/VE-cadherin-VC
Red plasma membrane stain BiFC
0
50
100
150
200
0 2 4 6 8 10 12 14 16 18 20 22 24 26 28 30 32 34 36 38
Fluo
resc
ence
sig
nal
Distance (µm)
B VE-PTP∆17FN-VN/SPN-VC
Red plasma stain BiFC
0
50
100
150
0 2 4 6 8 10 12 14 16 18 20 22 24 26 28 30 32 34 36 38 40 42 44 46 48 50
Fluo
resc
ence
sig
nal
Distance (µm)
C VE-PTP∆17FN-VN/Myr-VC
Red plasma membrane stain BiFC
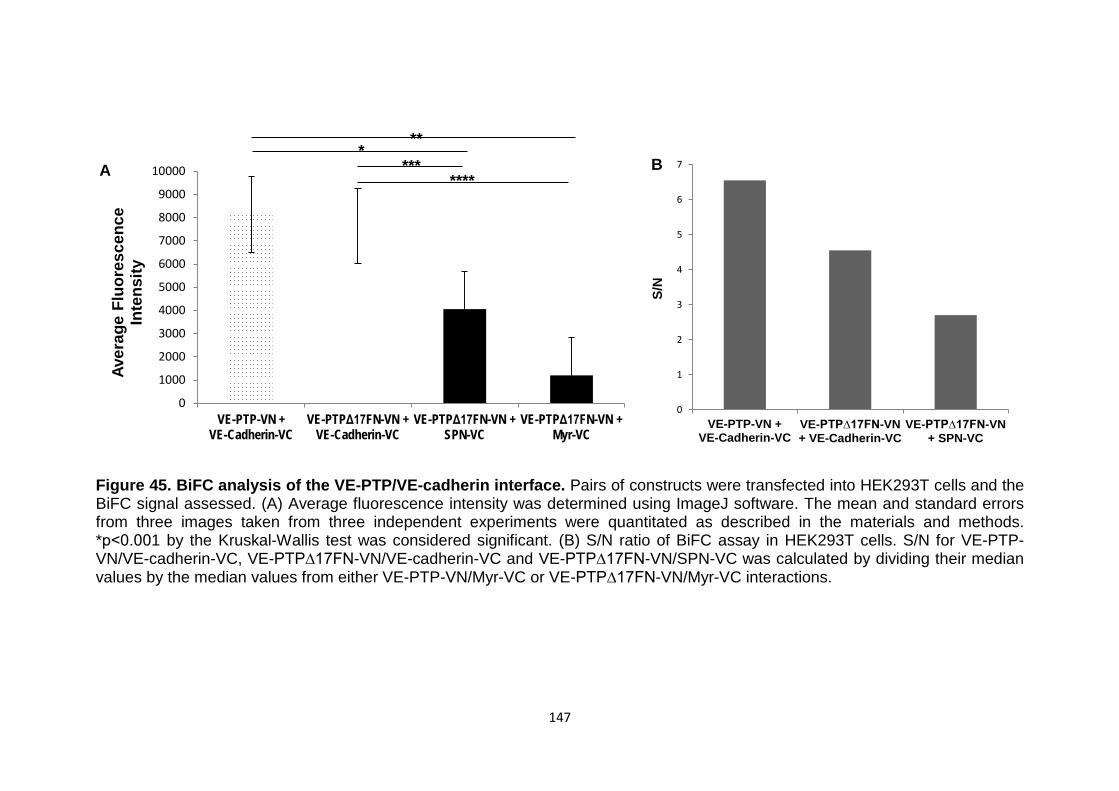
147
Figure 45. BiFC analysis of the VE-PTP/VE-cadherin interface. Pairs of constructs were transfected into HEK293T cells and the BiFC signal assessed. (A) Average fluorescence intensity was determined using ImageJ software. The mean and standard errors from three images taken from three independent experiments were quantitated as described in the materials and methods. *p˂0.001 by the Kruskal-Wallis test was considered significant. (B) S/N ratio of BiFC assay in HEK293T cells. S/N for VE-PTP-VN/VE-cadherin-VC, VE-PTP∆17FN-VN/VE-cadherin-VC and VE-PTP∆17FN-VN/SPN-VC was calculated by dividing their median values by the median values from either VE-PTP-VN/Myr-VC or VE-PTP∆17FN-VN/Myr-VC interactions.
0
1000
2000
3000
4000
5000
6000
7000
8000
9000
10000
VE-PTP-VN +VE-Cadherin-VC
VE-PTPΔ17FN-VN + VE-Cadherin-VC
VE-PTPΔ17FN-VN + SPN-VC
VE-PTPΔ17FN-VN + Myr-VC
Aver
age
Fluo
resc
ence
In
tens
ity
0
1
2
3
4
5
6
7
VE-PTP-VN +VE-Cadherin-VC
VE-PTP∆17FN-VN + VE-Cadherin-VC
VE-PTP∆17FN-VN + SPN-VC
S/N
A B *
** ***
****
148
A
Figure 46. Validation of VE-PTP-VN/VE-cadherin-VC interaction specificity. BiFC (A) VE-PTP-VN/VE-cadherin-VC, (B) VE-PTP∆17FN-VN/VE-cadherin, (C) VE-PTP∆17FN-VN/SPN-VC and (D) VE-PTP∆17FN-VN/Myr-VC fusion pairs were co-expressed in HEK293T cells and 24 hours post-transfection were stained with CellMask Deep Red plasma membrane stain. The BiFC fluorescence intensity and the red fluorescent signal from the plasma membrane stain were measured in individual cells and yellow/red ratio values calculated. The distribution of ratios in individual cells was plotted in a histogram.
149
4.8 Discussion
Vascular endothelial protein tyrosine phosphatase (VE-PTP) is recognised to
be essential for the maintenance of the endothelial barrier between blood
and tissue, maintenance and remodelling of blood vessels and control of
blood vessel permeability and leukocyte extravasation during inflammation
by potentially regulating the adhesive function of VE-cadherin in endothelial
cells (Bäumer et al, 2006; Nottebaum et al, 2008). VE-PTP is the only RPTP
reported to be expressed exclusively in endothelial cells and thus attracted
attention as a potential regulator of VE-cadherin (Bäumer et al, 2006). Co-
immunoprecipitation studies by Nawroth et al (2002) showed that indeed VE-
PTP and VE-cadherin interact together and that this interaction occurs via
their extracellular domains, independently of their cytoplasmic tails. The
same group demonstrated using deletion mutants that the fifth cadherin
domain of VE-cadherin and the 17th FNIII-like repeat of VE-PTP were
sufficient to support their interaction. While there are many studies had been
done on a whole protein (e.g. using knock-out mice) no studies to date had
been done in live cells on a functional role of the extracellular domain of VE-
PTP in regulation of vascular permeability and angiogenesis. Here we used
VE-PTP and VE-cadherin fusion constructs consisting of transmembrane
and extracellular domains fused to the N- and C-terminal parts of a Venus
yellow fluorescent protein (YFP) respectively to examine their interaction in
live cells using the bimolecular fluorescence complementation (BiFC) assay.
The qualitative BiFC analysis obtained on co-expression of VE-PTP and VE-
cadherin constructs containing the transmembrane and extracellular domains
of these molecules showed a strong fluorescence signal that was localised at
the plasma membrane with some fluorescence in endoplasmic reticulum and
probably Golgi apparatus.
To confirm that the yellow fluorescent signal originated as a result of VE-
PTP-VN and VE-cadherin-VC interaction and not from self-assembly of YFP
fragments we employed several controls. Although it is recommended to
negate a positive interaction by introducing a point mutation, it was not
practical in this project since the exact interaction site of VE-PTP and VE-
cadherin is not known. One of the controls was Sialophorin (SPN) that is not
150
homologous to any proteins investigated in this project and has a completely
different extracellular domain composition (Figure 15). It consists of a mucin-
like 235-residue extracellular region highly rich in serine, threonine and
proline uniformly distributed throughout the ECD region. It is also highly
glycosylated, containing one N-linked carbohydrate unit and approximately
84 O-linked units (Shelley et al, 1989). The expression of SPN is restricted to
haematopoietic cells, especially leukocytes (Fukuda and Tsuboi, 1999). The
fact that the extracellular domains of SPN and VE-PTP are so different and
that the two proteins are expressed in different cells made SPN a good
candidate for a control. Furthermore, it has previously been used by Cardoba
et al (2013) as a control. Fusing one of the YFP fragments to an unrelated
protein that does not interact with the protein of interest should, in theory,
reduce the background signal intensity. However, to eliminate any possible
interactions between SPN and VE-PTP an unfused YFP fragment anchored
to the plasma membrane via the membrane associated sequence from Lck
(Myr-VC and Myr-VN) was generated as additional control. Since Myr-VC
and Myr-VN entirely lack any transmembrane and extracellular domain
sequences it was predicted that the fluorescent signal would be abolished
when co-expressed with VE-PTP. Interestingly the co-expression of VE-PTP-
VN with either SPN-VC or Myr-VC negative controls also resulted in
fluorescence signal. Although the signal appeared to be reduced and less
intense, it was not possible to conclude that the fluorescence obtained with
negative interaction pairs was due to non-specific interactions or self-
assembly of the two non-fluorescence YFP fragments. Due to the nature of
the BiFC method the two non-fluorescence YFP fragments are able to
assemble spontaneously into a functional YFP, resulting in yellow
fluorescence. This could be caused by an overexpression of proteins. Under
normal physiological conditions membrane (integral) proteins are molecularly
dispersed and their two-dimensional translational diffusion (i.e. movement of
proteins perpendicular to the plane of the membrane) occurs freely (Singer
and Nicolson, 1972). However, overexpression of proteins could result in
somewhat tightly packed and ordered protein molecules with limiting spacing
in the plane of the membrane, thereby restricting planar diffusion. Such
clustering within the membrane could enhance spontaneous collisions of the
151
YFP fragments and increase the probability of irreversible bimolecular
fluorescent complexes and the false-positive fluorescence signal.
As reported by Horstman et al (2014) the vast majority of published BiFC
studies report only qualitative results and show representative examples of
detected interactions. Here we adapted three different quantitative analyses
that were performed using ImageJ software and statistically validated data.
First, the distribution of yellow/red ratio values has been determined for each
interaction pair to validate the BiFC efficiency as was recommended by
Kerppola (2008). Second, based on studies by Kodama and Hu (2010), the
signal-to-noise ratio was calculated to validate the BiFC specificity. In
addition, the average yellow fluorescence intensity for the positive interacting
pair was compared with that of the negative interacting pair. The full detailed
quantitative and statistical analyses are described in Chapter 2, section
2.5.9. All three quantitative methods showed similar results, complementing
each other. Co-expression of VE-PTP-VN and VE-cadherin resulted in more
cells exhibiting higher yellow/red ratio values, higher S/N value and a
significant increase in average yellow fluorescence signal compared with all
the negating interacting pairings. The fact that the VE-cadherin-VC was
expressed at lower level compared with negative controls SPN-VC and Myr-
VC (Figure 31, C and E) suggests that the BiFC signal from VE-PTP-VN and
VE-cadherin-VC was not an artefact of overexpression. Therefore, the
quantitative assessment of the fluorescence images obtained on co-
expression of VE-PTP and VE-cadherin constructs indicated a BiFC signal
that is due to a specific interaction, rather than self-assembly of the YFP
fragments and background fluorescence. However, the disadvantage of the
quantitative analyses used in this project is the measurement of whole cell
fluorescence as they do not allow for the evaluation of intracellular versus
membrane-localised BiFC signal. Nonetheless, the quantitation methods
were based on previous BiFC studies by various research groups who used
flow cytometry or ImageJ for fluorescence signal quantification (Kodama and
Hu, 2010; Sung and Huh, 2010; Wong and O’Bryan, 2011).
The cells were stained with plasma membrane stain to facilitate comparison
between images and identification of distinct BiFC signal localisation
152
patterns. Co-transfection of VE-PTP-VN and VE-cadherin-VC revealed a
strong YFP fluorescence that predominantly localised at the plasma
membrane as indicated by co-localisation with red plasma membrane stain
(overlay image in Figure 33 and Figure 34). The BiFC signal from VE-PTP-
VN/SPN-VC, VE-PTP-VN/Myr-VC and SPN-VN/Myr-VC fusion pairs also
predominantly localised to the plasma membrane (overlay images in Figures
35-37). However, some BiFC signal was also detected in the cytoplasm,
most likely in the endoplasmic reticulum (ER) and Golgi, for all the tested
fusion pairs. Although in this study no organelle markers have been used to
confirm the BiFC signal co-localisation at the ER and Golgi, the confocal
images closely resemble the images from other studies that used BiFC
assay to investigate membrane protein-protein interactions. For example,
similar results have been demonstrated with receptor tyrosine kinases
Anks1a/EphA2 in a BiFC study by Lee et al (2016). Most of the BiFC signal
was detected in the plasma membrane but some was also present in the ER,
which was confirmed by the ER marker. Interestingly a deletion of Anks1a
phosphotyrosine binding domain (PTB) resulted in an increased intracellular
staining for the Anks1a/EphA2 complex, suggesting that perhaps some
domains are not required for the interaction but instead are needed for the
correct cellular localisation (Lee et al, 2016). A study by Chen et al (2006)
used the BiFC method to investigate the interaction between membrane
proteins Notch2 and amyloid precursor protein (APP) in live cells. They
showed that C-terminally truncated Notch2 and APP formed heterodimers
that localised to the plasma membrane, ER and Golgi. The co-localisation of
BiFC signal at the ER and Golgi was shown using ER CFP and Golgi-DsRed
markers.
There are various reasons why the BiFC signal is present in the ER. Some
domains may not be required for the interaction but might be needed for cell
surface localisation (as in the case of Anks1a/EphA2 mentioned above) and
without the required domain proteins would not pass quality control and thus
would be retained in ER. The BiFC complex formation may also take place in
the ER where the newly synthesised proteins are modified before being
translocated to the plasma membrane, thereby bringing the YFP fragments
153
into close proximity and resulting in a fluorescence signal. Perhaps some
fusion proteins are not fully processed to the cell surface and are trapped in
the ER, most likely not passing the protein quality control. In addition, some
proteins may be retained inactive in the ER and eventually degraded if they
are not required. This was shown for the receptor tyrosine kinases (RTKs). If
there is a need for high levels of RTKs on the plasma membrane, a cell
may direct the ER membranes to rapidly release mature RTKs and send
them towards the cell surface (Lee et al, 2016). As shown by Nottebaum et
al (2008) a large fraction of the VE-PTP – containing vesicles co-localised
with endocytic vesicles. Comparison with a marker for the endocytic
recycling compartment (Rab11) also showed a partial overlap with the
staining for VE-PTP. Their results suggested that VE-PTP resides in an
endocytic compartment until it is translocated to endothelial cell contacts
once the endothelial cell junctions have matured (Nottebaum et al, 2008).
Further validation would be critical to ensure that these localisation patterns
of the bimolecular fluorescent complex are physiologically relevant. To
confirm the subcellular localisation of the BiFC signal numerous
fluorescent organelle markers, such as KDEL-mCerulean3 fusion protein
for ER or VE-cadherin-mApple fusion protein for tight junctions (both from
Addgene), can be used. As the subcellular localisation of a protein is often
tied to its function the comparison of localisation of full-length VE-PTP
fused to the full-length YFP with that of the interaction between VE-PTP
and VE-cadherin fused to the N- and C-terminal fragments of YFP would
provide some information about the molecular mechanism of VE-PTP/VE-
cadherin interaction.
Some proteins have been shown to internalise from the cell surface into
internal membrane compartments upon interaction with other proteins,
which is an important part of trafficking events in the regulation of cell
signalling, receptor turnover and magnitude, duration and nature of
signalling events. For example, the internalisation of the endothelial growth
factor receptor (EGFR) system upon ligand stimulation has been
previously demonstrated (Wilde et al, 1999). Epidermal growth factor
(EGF) binds to its receptor epidermal growth factor receptor (EGFR),
154
inducing EGFR dimerisation and intracellular autophosphorylation of key
tyrosine residues in the activation loop of its catalytic domain
(Schlessinger, 2002). This, in turn, initiates clathrin-mediated
internalisation of the EGFR, which is mediated by a RING-finger E3
ubiquitin ligase (Cbl) that binds to activated EGFR, targeting it for
endocytosis (Le Roy and Wrana, 2005). Endosomally localised EGFR was
shown to associate with many down-stream effectors, such as SH2-
domain-containing transforming protein (SHC), leading to the recruitment
and activation of signal transduction proteins Ras, Raf, MEK1 and MAPK
cascade (Le Roy and Wrana, 2005). EGFR can clearly signal from
endosomes, therefore showing that trafficking can control both the nature
and magnitude of molecular signalling events. Furthermore VE-cadherin
itself was shown to internalise upon interaction with β-arrestin. Interleukin
8 (IL9) stimulation was also shown to induce VE-cadherin internalisation in
response to PAK-mediated phosphorylation of S665 on VE-cadherin
(Kuppers et al, 2014). Therefore, it would be interesting to investigate
whether the interaction between VE-PTP and VE-cadherin results in their
internalisation.
Protein-protein interactions are essential for cellular functions and the
majority of proteins in the cell exist as part of multicomponent assemblies.
Experimentally determining and characterising VE-PTP and VE-cadherin
binding interface would give a better understanding of the mechanism of their
specific recognition and function. It was hypothesised, based on Nawroth et
al study (2002), that deleting the 17th FNIII-like domain from the ectodomain
of VE-PTP would be sufficient to abolish the VE-PTP interaction with VE-
cadherin. However, in this study this was not observed and a similar BiFC
signal was obtained with both constructs even though VE-PTP∆17FN-VN
was expressed at lower levels than VE-PTP-VN (Figure 31, A and B). One
possibility that may account for this is that both constructs were expressed at
levels in excess of VE-cadherin (Figure 31, A and B). Another routine
possibility that may explain the difference between these findings and the
Nawroth et al (2002) study is that there are species-dependent differences in
the interaction of VE-PTP and VE-cadherin, as in this study the human cDNA
155
was used and the earlier study used mouse. This seems unlikely given that
the human and mouse full-length amino acid sequences are 83% identical
and the mechanism of interaction is likely to be conserved. To generate the
VE-PTP mutant construct (VEPTP∆17FN-VN) the 17th FNIII-like domain of
VE-PTP was deleted, which brought the 16th FNIII-like domain proximal to
the transmembrane domain, whereas the earlier study used either a
construct in which FNIII domains 1-16 had been deleted or a construct which
expressed only the 17th domain. If the FNIII-like domain proximal to the
membrane is the only region involved in interaction between the two
molecules, the results obtained in this study would suggest that despite the
low sequence identity between the 16th and 17th domains, the 16th domain
when artificially moved proximal to the membrane, is able in effect to replace
the 17th domain in this position, and as a consequence the interaction is
maintained. Alternatively other regions, in addition to the 17th FNIII domain,
such as the transmembrane domain, of VE-PTP may be involved in the
interaction with VE-cadherin. This may not have been apparent in the co-
immunoprecipitation studies with detergent solubilised proteins but is of
significance when performing BiFC protein-protein interaction studies in live
cells as carried out in this study. There are many examples of membrane
proteins forming homo- and hetero-oligomers via transmembrane domains
(Strous and Gent, 2002), including receptor-type phosphatases (Tertoolen et
al, 2001). A study by Tertoolen et al (2001) demonstrated that RPTPα
dimerises in live cells and that the transmembrane domain alone was
sufficient to drive this dimerisation. Interestingly a study by Coon et al (2015)
showed through immunoprecipitation that VE-cadherin directly interacts with
vascular endothelial growth factor receptors (VEGFR) 2 and 3 and that these
interactions are mediated by their transmembrane domains (TMDs). Their
results suggest that VE-cadherin contributes to the flow signalling pathway
downstream of SFKs (Src family kinases) and upstream of PI3K
(phosphoinositide 3-kinase) through its role as an adaptor for VEGFRs
(Coon et al, 2015). This raises a question of whether VE-PTP also
contributes to VEGFR signalling since it directly binds to VE-cadherin. Co-
precipitation studies by Fachinger et al (1999) revealed that VE-PTP does
not associate directly with VEGFR2. Nonetheless, these proteins could be
156
part of a functional complex involved in maintenance of blood vessels and
endothelial cell barrier.
Future experiments are required to establish regions of VE-PTP that are
involved in interaction with VE-cadherin. The molecular binding interface of
VE-PTP and VE-cadherin interaction could be studied by generation of
various deletion mutants of VE-PTP to analyse the interaction of VE-cadherin
with each of the mutants. Whether the ECD drives the interaction or is
required only for the initial contact and whether the TMD maintains the
interaction is yet to be determined and further studies are necessary to
define the relative roles of the extracellular domain and transmembrane
domain in interaction of VE-PTP with VE-cadherin as well as to elucidate the
precise mechanism of this interaction.
Dysregulation of PTPs is often associated with many inherited or acquired
human diseases and in many cases the immune system is affected (Mustelin
et al, 2005). Both PTKs and PTPs have been shown to have activating and
inhibitory effects and the actions of both types of enzyme are required for a
physiological immune response. The role of the adherens junctions and its
key proteins VE-PTP and VE-cadherin and the associated signalling events
in leukocyte transendothelial migration are not entirely defined. During
inflammation leukocytes have to pass from the blood to the surrounding
tissue through the endothelial barrier of the blood vessel wall (leukocyte
extravasation or diapedesis). It is a multistep process in which many proteins
are involved. VE-cadherin has been shown previously to act as a barrier in
leukocyte diapedesis but it was also shown that it moves away from
endothelial cell contacts to allow leukocyte extravasation. Adhesion
molecules ICAM1 (intercellular adhesion molecule 1) and PECAM-1 (platelet
endothelial cell adhesion molecule 1) then form a ring-like structure
surrounding leukocytes at cell contact sites (Nottebaum et al, 2008).
Tyrosine phosphorylation was also shown to play a key role in this process
and tyrosine phosphorylation of adherens junction proteins has been
correlated with the loosening of cadherin-mediated adhesion in various cell
types (McLachlan and Yap, 2007). In contrast VE-PTP was shown to be
directly implicated in the regulation of endothelial barrier, enhancing the
157
adhesive function of VE-cadherin and reducing leukocyte extravasation
(Nottebaum et al, 2008). Broermann et al (2011) demonstrated that
leukocyte docking and stimulation of endothelial cells with VEGF influence
the dissociation of VE-PTP from VE-cadherin in vivo, resulting in the opening
of the endothelial cell contacts and in increased leukocyte extravasation. The
results of previous studies indicate that the VE-PTP makes an attractive
candidate as a novel therapeutic target for the treatment of pathological
vascular permeability and inflammation. Therefore it is essential to elucidate
its physiological function, its substrates, regulation and its importance in
physiological processes.
4.9 Conclusion
The quantitative data show that the BiFC signal obtained from HEK293T
cells co-expressing VE-PTP-VN/VE-cadherin-VC and VE-PTP∆17FN-
VN/VE-cadherin-VC was not due to non-specific YFP-fragments interactions
in the plasma membrane since the negative control fusion pairs showed a
significantly reduced BiFC signal even though they were expressed at much
higher levels compared with positive interaction pairs. Therefore, based on
these findings it can be concluded that VE-PTP and VE-cadherin have the
potential to interact together via their extracellular domains. In addition, the
17th FNIII-like domain of VE-PTP is not the only domain required for the
interaction and the removal of this domain did not abolish the interaction with
VE-cadherin. Further work is required to determine the molecular interface of
VE-PTP and VE-cadherin interaction.

158
Chapter 5
Investigation of a potential interaction between DEP-1, SAP-1 and GLEPP1 and VE-cadherin in live cells
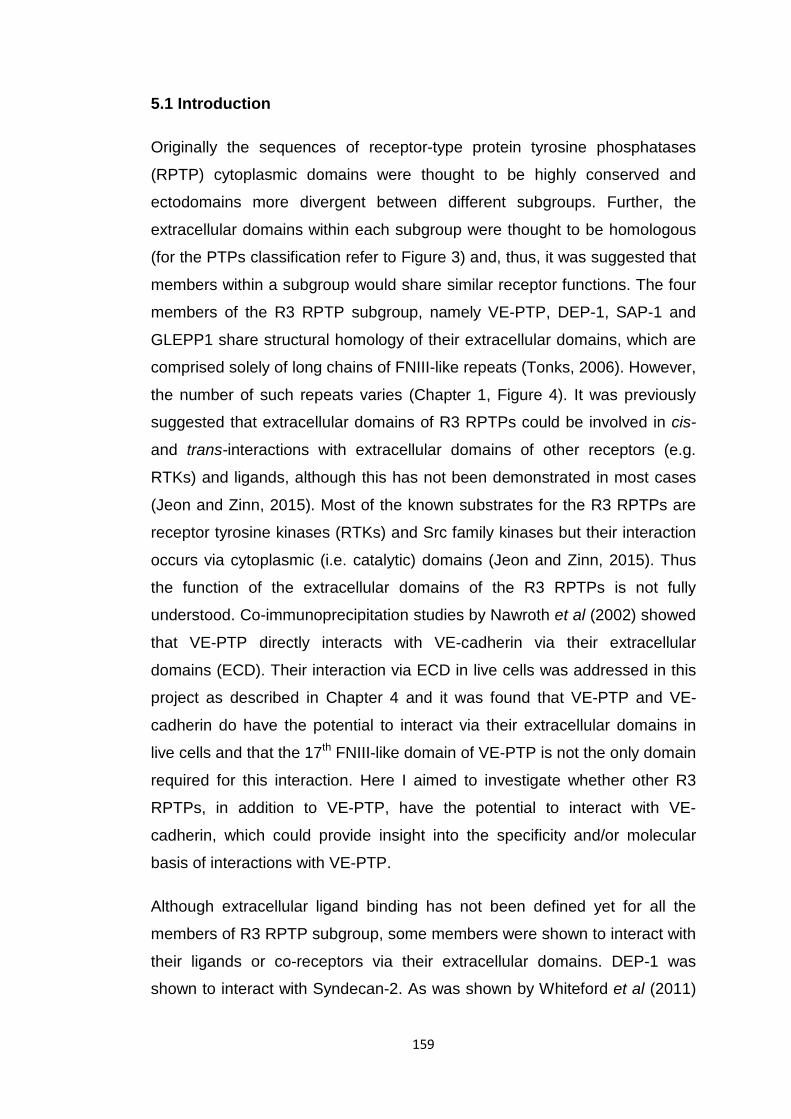
159
5.1 Introduction
Originally the sequences of receptor-type protein tyrosine phosphatases
(RPTP) cytoplasmic domains were thought to be highly conserved and
ectodomains more divergent between different subgroups. Further, the
extracellular domains within each subgroup were thought to be homologous
(for the PTPs classification refer to Figure 3) and, thus, it was suggested that
members within a subgroup would share similar receptor functions. The four
members of the R3 RPTP subgroup, namely VE-PTP, DEP-1, SAP-1 and
GLEPP1 share structural homology of their extracellular domains, which are
comprised solely of long chains of FNIII-like repeats (Tonks, 2006). However,
the number of such repeats varies (Chapter 1, Figure 4). It was previously
suggested that extracellular domains of R3 RPTPs could be involved in cis-
and trans-interactions with extracellular domains of other receptors (e.g.
RTKs) and ligands, although this has not been demonstrated in most cases
(Jeon and Zinn, 2015). Most of the known substrates for the R3 RPTPs are
receptor tyrosine kinases (RTKs) and Src family kinases but their interaction
occurs via cytoplasmic (i.e. catalytic) domains (Jeon and Zinn, 2015). Thus
the function of the extracellular domains of the R3 RPTPs is not fully
understood. Co-immunoprecipitation studies by Nawroth et al (2002) showed
that VE-PTP directly interacts with VE-cadherin via their extracellular
domains (ECD). Their interaction via ECD in live cells was addressed in this
project as described in Chapter 4 and it was found that VE-PTP and VE-
cadherin do have the potential to interact via their extracellular domains in
live cells and that the 17th FNIII-like domain of VE-PTP is not the only domain
required for this interaction. Here I aimed to investigate whether other R3
RPTPs, in addition to VE-PTP, have the potential to interact with VE-
cadherin, which could provide insight into the specificity and/or molecular
basis of interactions with VE-PTP.
Although extracellular ligand binding has not been defined yet for all the
members of R3 RPTP subgroup, some members were shown to interact with
their ligands or co-receptors via their extracellular domains. DEP-1 was
shown to interact with Syndecan-2. As was shown by Whiteford et al (2011)
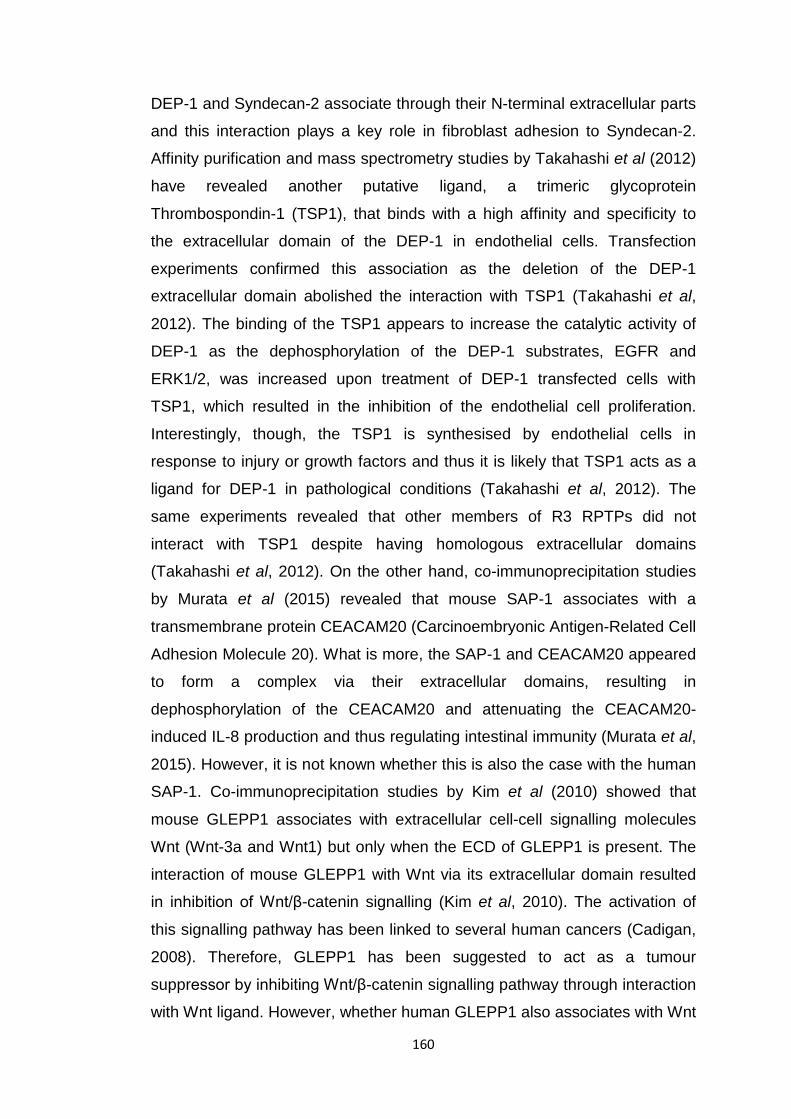
160
DEP-1 and Syndecan-2 associate through their N-terminal extracellular parts
and this interaction plays a key role in fibroblast adhesion to Syndecan-2.
Affinity purification and mass spectrometry studies by Takahashi et al (2012)
have revealed another putative ligand, a trimeric glycoprotein
Thrombospondin-1 (TSP1), that binds with a high affinity and specificity to
the extracellular domain of the DEP-1 in endothelial cells. Transfection
experiments confirmed this association as the deletion of the DEP-1
extracellular domain abolished the interaction with TSP1 (Takahashi et al,
2012). The binding of the TSP1 appears to increase the catalytic activity of
DEP-1 as the dephosphorylation of the DEP-1 substrates, EGFR and
ERK1/2, was increased upon treatment of DEP-1 transfected cells with
TSP1, which resulted in the inhibition of the endothelial cell proliferation.
Interestingly, though, the TSP1 is synthesised by endothelial cells in
response to injury or growth factors and thus it is likely that TSP1 acts as a
ligand for DEP-1 in pathological conditions (Takahashi et al, 2012). The
same experiments revealed that other members of R3 RPTPs did not
interact with TSP1 despite having homologous extracellular domains
(Takahashi et al, 2012). On the other hand, co-immunoprecipitation studies
by Murata et al (2015) revealed that mouse SAP-1 associates with a
transmembrane protein CEACAM20 (Carcinoembryonic Antigen-Related Cell
Adhesion Molecule 20). What is more, the SAP-1 and CEACAM20 appeared
to form a complex via their extracellular domains, resulting in
dephosphorylation of the CEACAM20 and attenuating the CEACAM20-
induced IL-8 production and thus regulating intestinal immunity (Murata et al,
2015). However, it is not known whether this is also the case with the human
SAP-1. Co-immunoprecipitation studies by Kim et al (2010) showed that
mouse GLEPP1 associates with extracellular cell-cell signalling molecules
Wnt (Wnt-3a and Wnt1) but only when the ECD of GLEPP1 is present. The
interaction of mouse GLEPP1 with Wnt via its extracellular domain resulted
in inhibition of Wnt/β-catenin signalling (Kim et al, 2010). The activation of
this signalling pathway has been linked to several human cancers (Cadigan,
2008). Therefore, GLEPP1 has been suggested to act as a tumour
suppressor by inhibiting Wnt/β-catenin signalling pathway through interaction
with Wnt ligand. However, whether human GLEPP1 also associates with Wnt
161
or it interacts with any other ligands via its extracellular domain had not been
tested to date.
R3 RPTP members are comprised of repetitive fibronectin like III repeats in
their extracellular domains, the physiological role of which has not been fully
defined yet. Numerous studies indicate that the extracellular domain could be
involved in interaction with substrates or ligands but the molecular basis of
these interactions is not entirely understood. Since the members of this
subfamily share similar extracellular structures, it has been proposed that
they share similar physiological functions. This gives rise to some questions.
Do all the R3 RPTP members have the potential to interact with the same
ligands via their extracellular domains? What role does the extracellular
domain of R3 RPTPs play in substrate specificity? Therefore, the purpose of
this chapter was to investigate whether DEP-1, SAP-1 and GLEPP1 also
have the potential to interact with VE-cadherin via their extracellular domains
in living cells using bimolecular fluorescence complementation (BiFC) assay
in transiently transfected HEK293T. The principle of the BiFC assay is
described in Chapter 4.
To determine the specificity and efficiency of BiFC complementation two
negative controls were generated: sialophorin (SPN) and either C- or N-
terminal fragment of a Venus YFP anchored to the plasma membrane via the
membrane association sequence from Lck (lymphocyte-specific protein
tyrosine kinase), Myr-VC and Myr-VN respectively. The rationale for using
these controls and their generation is described in Chapter 4.
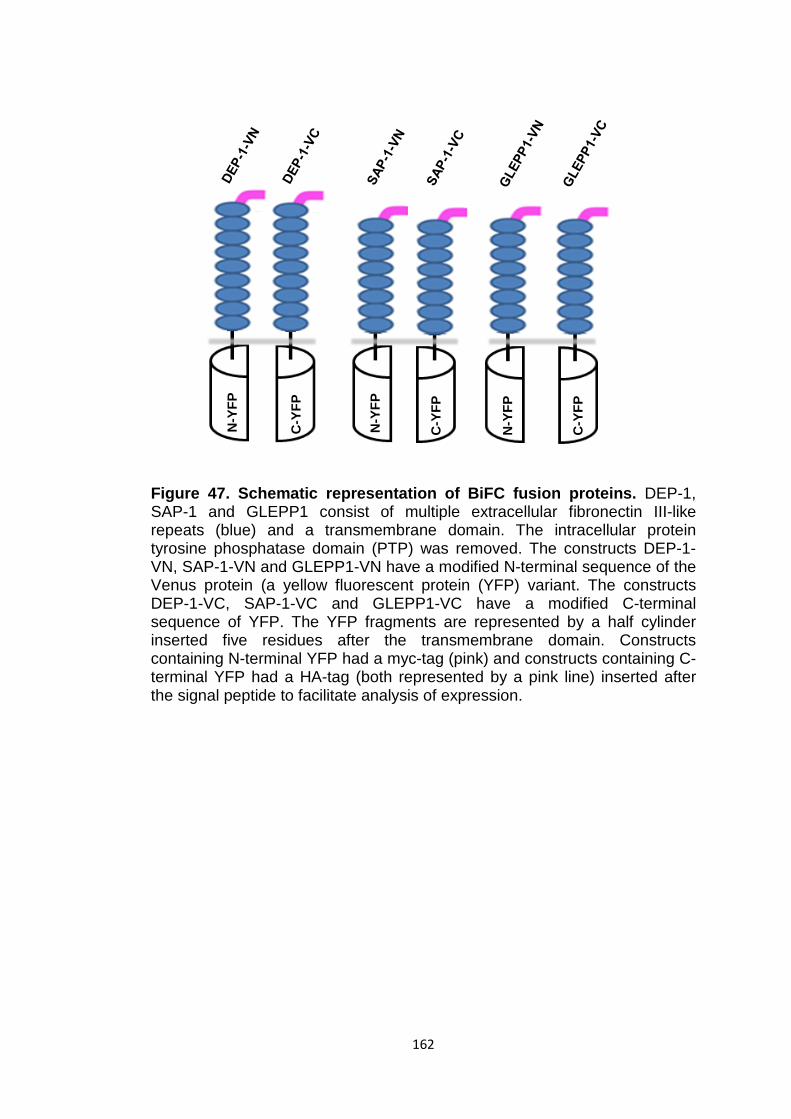
162
Figure 47. Schematic representation of BiFC fusion proteins. DEP-1, SAP-1 and GLEPP1 consist of multiple extracellular fibronectin III-like repeats (blue) and a transmembrane domain. The intracellular protein tyrosine phosphatase domain (PTP) was removed. The constructs DEP-1-VN, SAP-1-VN and GLEPP1-VN have a modified N-terminal sequence of the Venus protein (a yellow fluorescent protein (YFP) variant. The constructs DEP-1-VC, SAP-1-VC and GLEPP1-VC have a modified C-terminal sequence of YFP. The YFP fragments are represented by a half cylinder inserted five residues after the transmembrane domain. Constructs containing N-terminal YFP had a myc-tag (pink) and constructs containing C-terminal YFP had a HA-tag (both represented by a pink line) inserted after the signal peptide to facilitate analysis of expression.
N-Y
FP
N-Y
FP
N-Y
FP
C-Y
FP
C-Y
FP
C-Y
FP
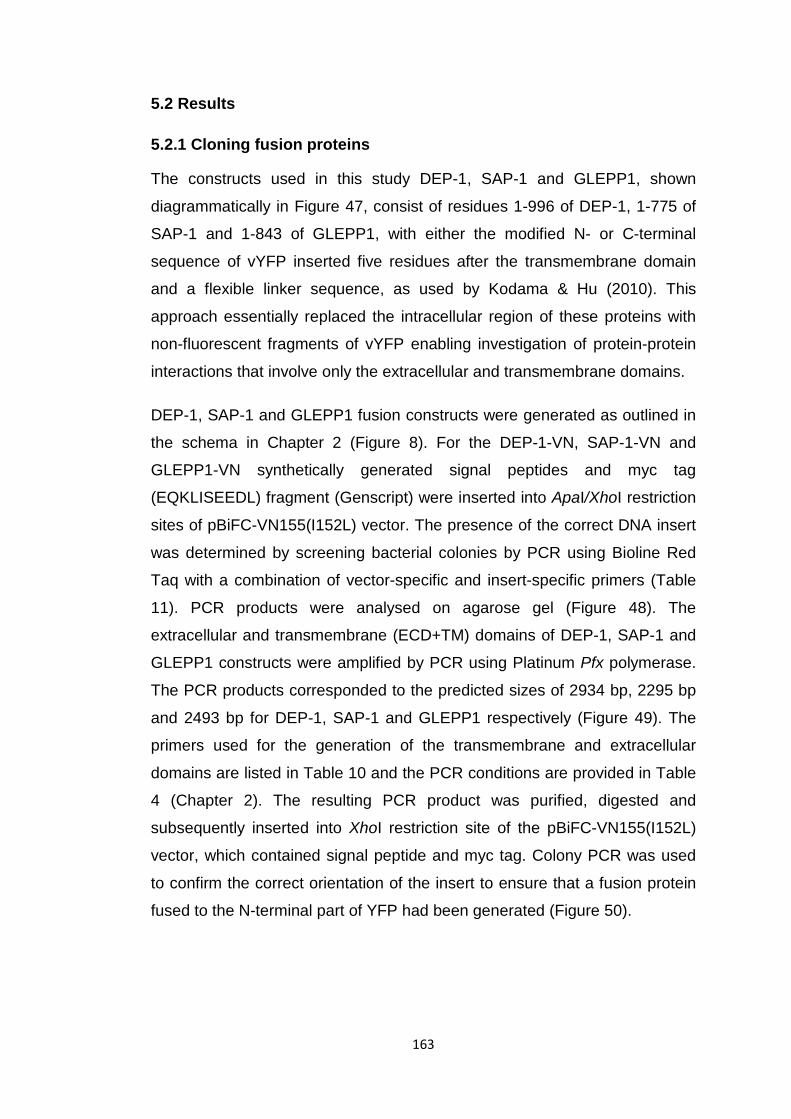
163
5.2 Results
5.2.1 Cloning fusion proteins
The constructs used in this study DEP-1, SAP-1 and GLEPP1, shown
diagrammatically in Figure 47, consist of residues 1-996 of DEP-1, 1-775 of
SAP-1 and 1-843 of GLEPP1, with either the modified N- or C-terminal
sequence of vYFP inserted five residues after the transmembrane domain
and a flexible linker sequence, as used by Kodama & Hu (2010). This
approach essentially replaced the intracellular region of these proteins with
non-fluorescent fragments of vYFP enabling investigation of protein-protein
interactions that involve only the extracellular and transmembrane domains.
DEP-1, SAP-1 and GLEPP1 fusion constructs were generated as outlined in
the schema in Chapter 2 (Figure 8). For the DEP-1-VN, SAP-1-VN and
GLEPP1-VN synthetically generated signal peptides and myc tag
(EQKLISEEDL) fragment (Genscript) were inserted into ApaI/XhoI restriction
sites of pBiFC-VN155(I152L) vector. The presence of the correct DNA insert
was determined by screening bacterial colonies by PCR using Bioline Red
Taq with a combination of vector-specific and insert-specific primers (Table
11). PCR products were analysed on agarose gel (Figure 48). The
extracellular and transmembrane (ECD+TM) domains of DEP-1, SAP-1 and
GLEPP1 constructs were amplified by PCR using Platinum Pfx polymerase.
The PCR products corresponded to the predicted sizes of 2934 bp, 2295 bp
and 2493 bp for DEP-1, SAP-1 and GLEPP1 respectively (Figure 49). The
primers used for the generation of the transmembrane and extracellular
domains are listed in Table 10 and the PCR conditions are provided in Table
4 (Chapter 2). The resulting PCR product was purified, digested and
subsequently inserted into XhoI restriction site of the pBiFC-VN155(I152L)
vector, which contained signal peptide and myc tag. Colony PCR was used
to confirm the correct orientation of the insert to ensure that a fusion protein
fused to the N-terminal part of YFP had been generated (Figure 50).
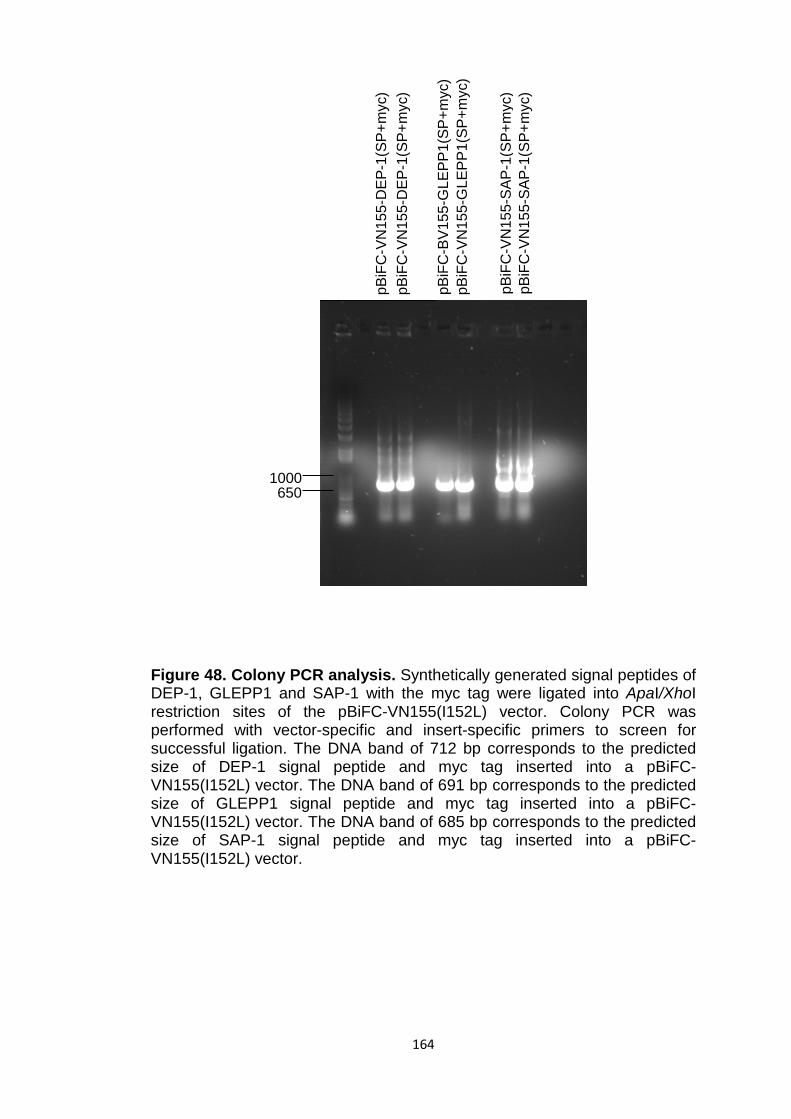
164
Figure 48. Colony PCR analysis. Synthetically generated signal peptides of DEP-1, GLEPP1 and SAP-1 with the myc tag were ligated into ApaI/XhoI restriction sites of the pBiFC-VN155(I152L) vector. Colony PCR was performed with vector-specific and insert-specific primers to screen for successful ligation. The DNA band of 712 bp corresponds to the predicted size of DEP-1 signal peptide and myc tag inserted into a pBiFC-VN155(I152L) vector. The DNA band of 691 bp corresponds to the predicted size of GLEPP1 signal peptide and myc tag inserted into a pBiFC-VN155(I152L) vector. The DNA band of 685 bp corresponds to the predicted size of SAP-1 signal peptide and myc tag inserted into a pBiFC-VN155(I152L) vector.
pBiF
C-V
N15
5-D
EP-1
(SP+
myc
)
pBiF
C-B
V155
-GLE
PP1(
SP+m
yc)
pBiF
C-V
N15
5-G
LEPP
1(SP
+myc
)
pBiF
C-V
N15
5-SA
P-1(
SP+m
yc)
pBiF
C-V
N15
5-SA
P-1(
SP+m
yc)
1000 650
pBiF
C-V
N15
5-D
EP-1
(SP+
myc
)
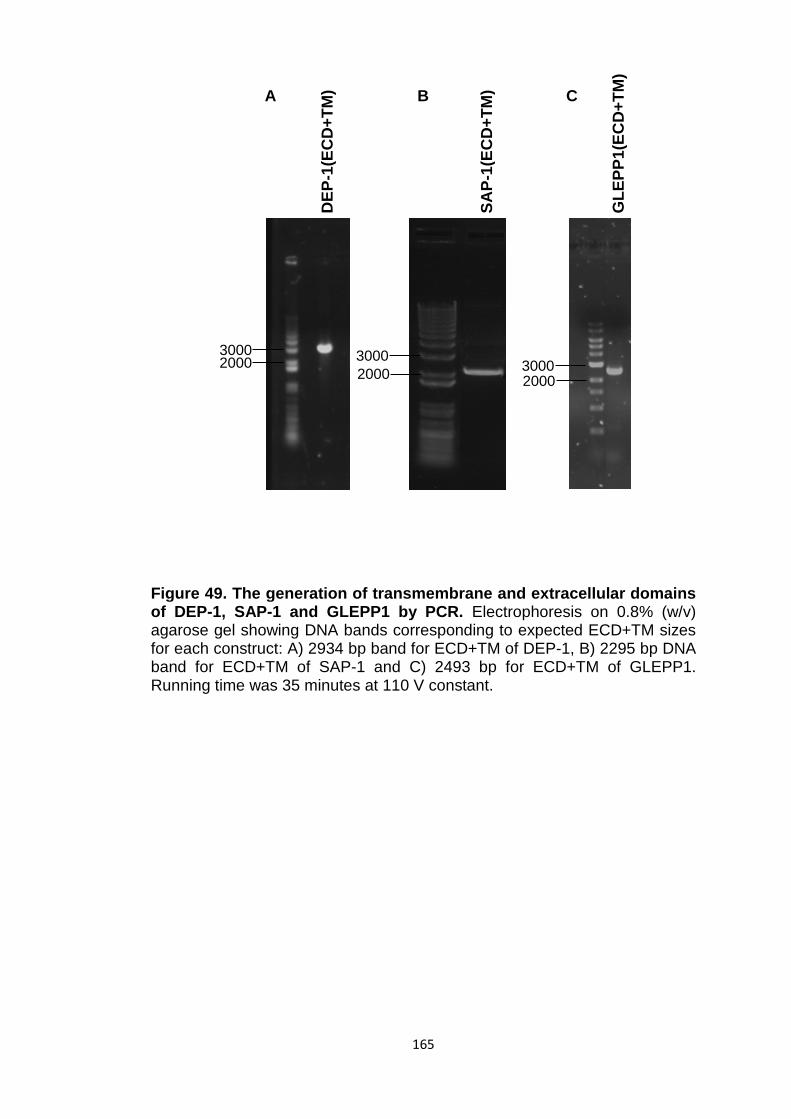
165
Figure 49. The generation of transmembrane and extracellular domains of DEP-1, SAP-1 and GLEPP1 by PCR. Electrophoresis on 0.8% (w/v) agarose gel showing DNA bands corresponding to expected ECD+TM sizes for each construct: A) 2934 bp band for ECD+TM of DEP-1, B) 2295 bp DNA band for ECD+TM of SAP-1 and C) 2493 bp for ECD+TM of GLEPP1. Running time was 35 minutes at 110 V constant.
DEP
-1(E
CD
+TM
)
SAP-
1(EC
D+T
M)
GLE
PP1(
ECD
+TM
)
A B C
2000 3000
2000 3000 2000
3000
166
Figure 50. Colony PCR to screen for successful ligation of ECD+TM domains of DEP-1, SAP-1 and GLEPP1 into pBiFC-VN155 expression vectors. Following ligation and transformation colony PCR was performed with vector-specific and insert-specific primers to screen for successful ligation. (A) The DNA band corresponds to the predicted size of 2453 bp of the DEP-1 ECD+TM inserted into a pBiFC-VN155 expression vector. (B) The DNA band corresponds to the predicted size of 2164 bp of the SAP-1 ECD+TM inserted into a pBiFC-VN155 expression vector. (C) The DNA band corresponds to the predicted size of 3184 bp of the GLEPP1 ECD+TM inserted into a pBiFC-VN155 expression vector.
DEP-1-VN A
1000
2000 3000
SAP-1-VN B
2000 1650
GLEPP1-VN C
3000 4000
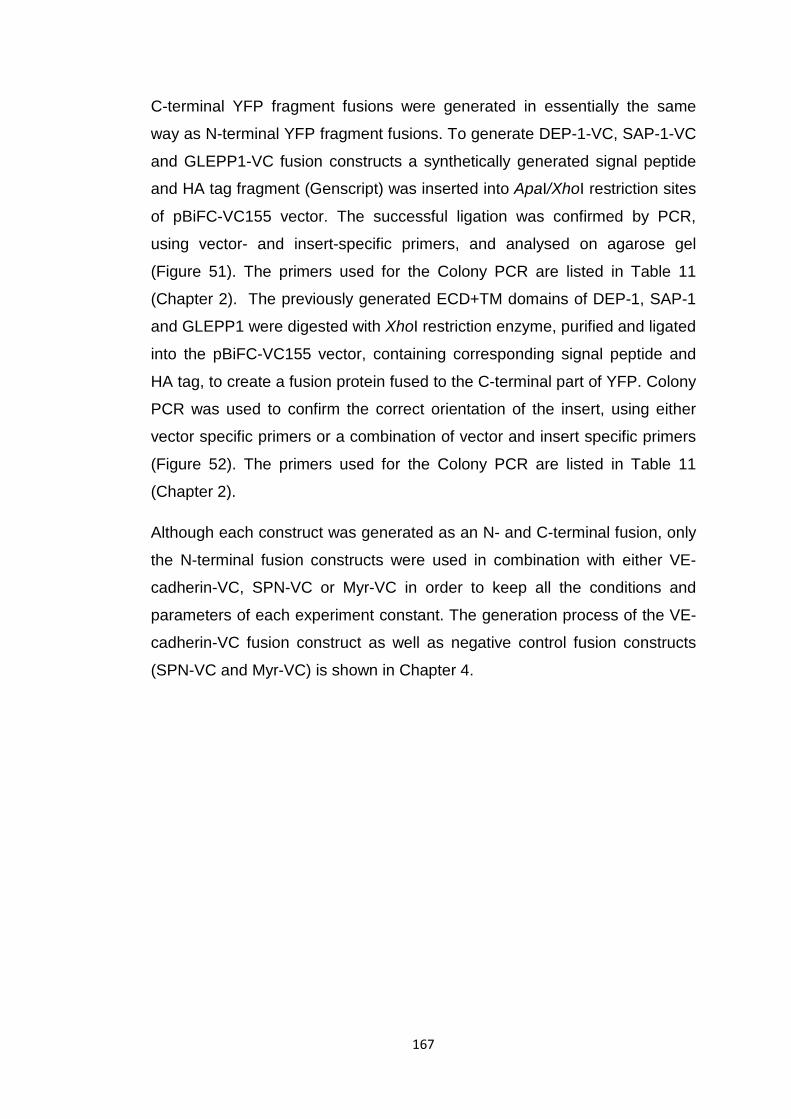
167
C-terminal YFP fragment fusions were generated in essentially the same
way as N-terminal YFP fragment fusions. To generate DEP-1-VC, SAP-1-VC
and GLEPP1-VC fusion constructs a synthetically generated signal peptide
and HA tag fragment (Genscript) was inserted into ApaI/XhoI restriction sites
of pBiFC-VC155 vector. The successful ligation was confirmed by PCR,
using vector- and insert-specific primers, and analysed on agarose gel
(Figure 51). The primers used for the Colony PCR are listed in Table 11
(Chapter 2). The previously generated ECD+TM domains of DEP-1, SAP-1
and GLEPP1 were digested with XhoI restriction enzyme, purified and ligated
into the pBiFC-VC155 vector, containing corresponding signal peptide and
HA tag, to create a fusion protein fused to the C-terminal part of YFP. Colony
PCR was used to confirm the correct orientation of the insert, using either
vector specific primers or a combination of vector and insert specific primers
(Figure 52). The primers used for the Colony PCR are listed in Table 11
(Chapter 2).
Although each construct was generated as an N- and C-terminal fusion, only
the N-terminal fusion constructs were used in combination with either VE-
cadherin-VC, SPN-VC or Myr-VC in order to keep all the conditions and
parameters of each experiment constant. The generation process of the VE-
cadherin-VC fusion construct as well as negative control fusion constructs
(SPN-VC and Myr-VC) is shown in Chapter 4.
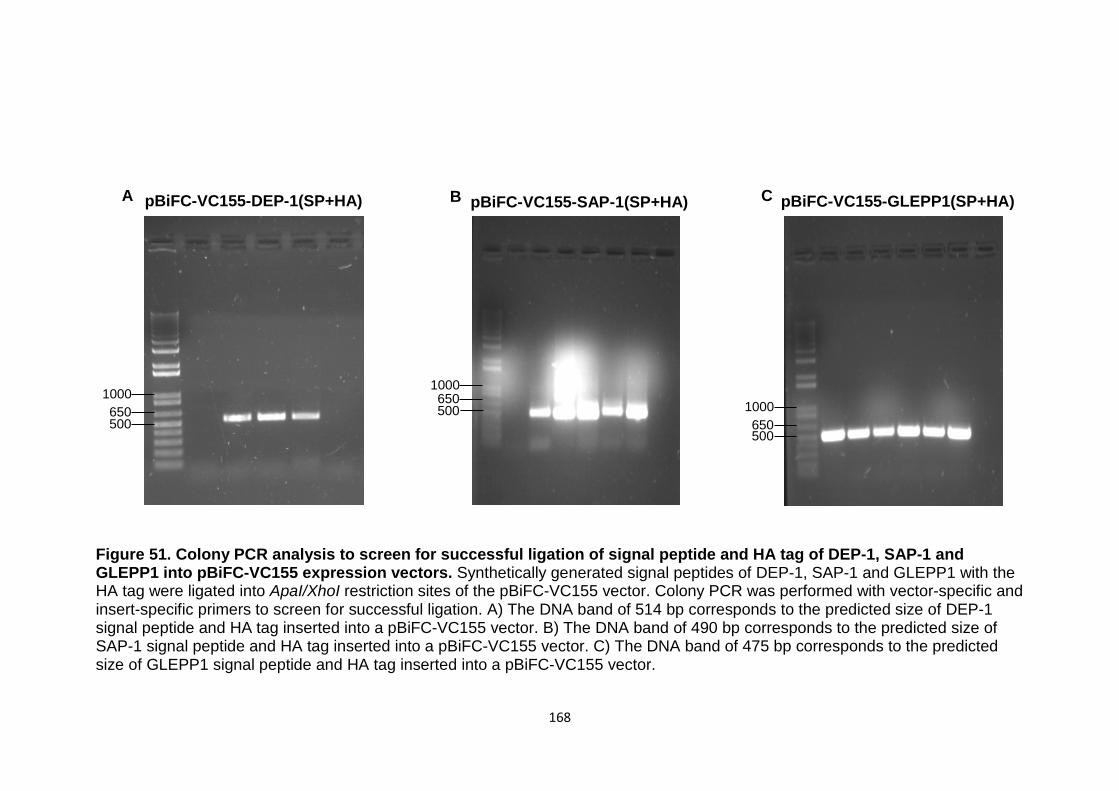
168
Figure 51. Colony PCR analysis to screen for successful ligation of signal peptide and HA tag of DEP-1, SAP-1 and GLEPP1 into pBiFC-VC155 expression vectors. Synthetically generated signal peptides of DEP-1, SAP-1 and GLEPP1 with the HA tag were ligated into ApaI/XhoI restriction sites of the pBiFC-VC155 vector. Colony PCR was performed with vector-specific and insert-specific primers to screen for successful ligation. A) The DNA band of 514 bp corresponds to the predicted size of DEP-1 signal peptide and HA tag inserted into a pBiFC-VC155 vector. B) The DNA band of 490 bp corresponds to the predicted size of SAP-1 signal peptide and HA tag inserted into a pBiFC-VC155 vector. C) The DNA band of 475 bp corresponds to the predicted size of GLEPP1 signal peptide and HA tag inserted into a pBiFC-VC155 vector.
pBiFC-VC155-DEP-1(SP+HA) A
1000 650 500
pBiFC-VC155-SAP-1(SP+HA) B
1000 650 500
pBiFC-VC155-GLEPP1(SP+HA) C
1000 650 500
169
Figure 52. Colony PCR to screen for successful ligation of ECD+TM of DEP-1, SAP-1 and GLEPP1 into pBiFC-VC155 expression vectors. Following ligation and transformation colony PCR was performed with vector-specific and insert-specific primers to screen for successful ligation. (A) The DNA band corresponds to the predicted size of 2264 bp of the DEP-1 ECD+TM inserted into a pBiFC-VC155 expression vector. (B) The DNA band corresponds to the predicted size of 3125 bp of the SAP-1 ECD+TM inserted into a pBiFC-VC155 expression vector. (C) The DNA band corresponds to the predicted size of 2968 bp of the GLEPP1 ECD+TM inserted into a pBiFC-VC155 expression vector.
DEP-1-VC A GLEPP1-VC C SAP-1-VC B
2000 3000
3000
4000 2000
3000 4000
170
5.3 Western Blot analysis of BiFC fusion proteins in HEK293T cells
Western blotting of lysates from transiently transfected HEK293T cells
confirmed the expression of all the fusion proteins close to their predicted
molecular weight (Figure 53). Western blotting with anti-myc antibody for the
DEP-1-VN, SAP-1-VN and GLEPP1-VN, which have a myc-tag inserted
following the signal peptide sequence, detected two bands for each protein.
For DEP-1-VN the bands with a molecular weight of approximately 180 kDa
and 240 kDa were detected (Figure 53, A). For SAP-1 the bands with a
molecular weight of approximately 160 kDa and 220 kDa were detected
(Figure 53, A). For GLEPP1 the bands with a molecular weight of
approximately 160 kDa and 230 kDa were detected (Figure 53, A). The
bands for GLEPP1 appeared lighter compared with other fusion proteins on
the same blot (Figure 53, A). The Western blot was repeated for the GLEPP1
fusion construct, producing the same result (Figure 53, C). The predicted
molecular weights for DEP-1-VN, SAP-1 and GLEPP1 were 107 kDa, 84 kDa
and 95 kDa respectively. The discrepancy in molecular weight is probably
accounted for by extensive glycosylation. A study by de la Fuente et al
(1998) confirmed that DEP-1 is highly glycosylated. Western blot analysis of
DEP-1 before and after the treatment with N-linked deglycosylation enzyme
N-glycosidase F detected the shift in molecular weight from 240 kDa to about
160 kDa. The treatment with O-linked deglycosylation enzyme O-Glycanase
also resulted in decreased molecular weight of about 200 kDa. These results
showed that the molecular weight of DEP-1 was modified by extensive
glycosylation (de la Fuente et al, 1998). It has been previously shown that
SAP-1 and GLEPP1 have 24 and 15 potential N-linked glycosylation sites
respectively (Matozaki et al, 1994; Thomas et al, 1993). Western blot
analyses carried out by Matozaki et al (1994) detected a band for SAP-1 with
molecular weight of 200 kDa instead of the predicted 120 kDa. Western blot
analyses of GLEPP1 from a study by Thomas et al (1993) also detected a
higher molecular weight band of 235 kDa compared with predicted 132 kDa.
In both studies the differences were accounted for by extensive
glycosylation.
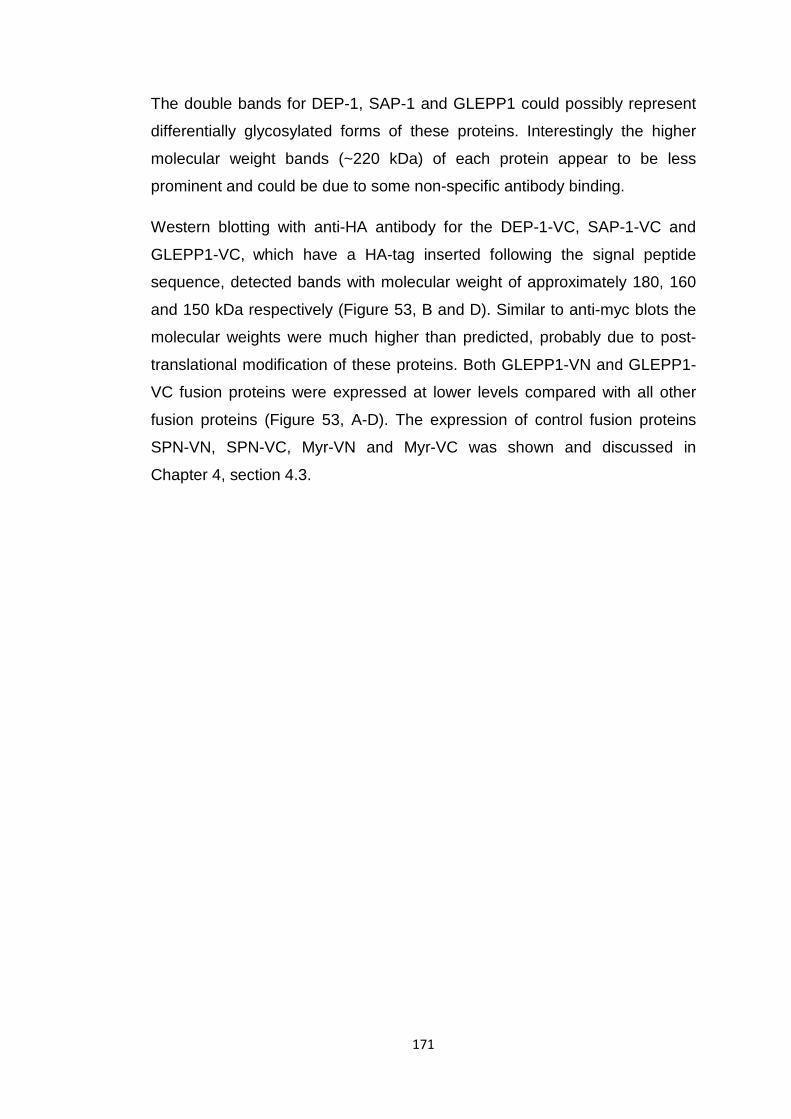
171
The double bands for DEP-1, SAP-1 and GLEPP1 could possibly represent
differentially glycosylated forms of these proteins. Interestingly the higher
molecular weight bands (~220 kDa) of each protein appear to be less
prominent and could be due to some non-specific antibody binding.
Western blotting with anti-HA antibody for the DEP-1-VC, SAP-1-VC and
GLEPP1-VC, which have a HA-tag inserted following the signal peptide
sequence, detected bands with molecular weight of approximately 180, 160
and 150 kDa respectively (Figure 53, B and D). Similar to anti-myc blots the
molecular weights were much higher than predicted, probably due to post-
translational modification of these proteins. Both GLEPP1-VN and GLEPP1-
VC fusion proteins were expressed at lower levels compared with all other
fusion proteins (Figure 53, A-D). The expression of control fusion proteins
SPN-VN, SPN-VC, Myr-VN and Myr-VC was shown and discussed in
Chapter 4, section 4.3.
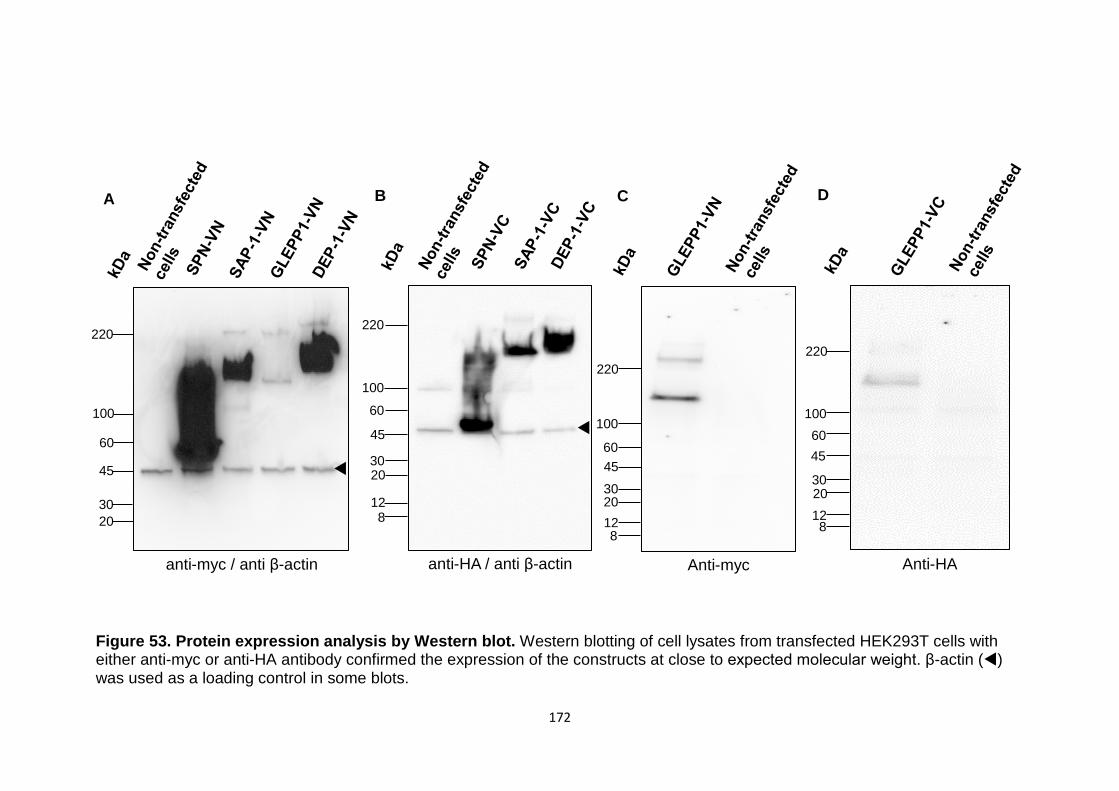
172
Figure 53. Protein expression analysis by Western blot. Western blotting of cell lysates from transfected HEK293T cells with either anti-myc or anti-HA antibody confirmed the expression of the constructs at close to expected molecular weight. β-actin () was used as a loading control in some blots.
8 12
20 30
45
60
100
220
anti-HA / anti β-actin
B
8 12 20 30
45 60
100
220
C
Anti-myc
8 12 20 30
45 60
100
220
D
Anti-HA
20 30
45
60
100
220
A
anti-myc / anti β-actin
173
5.4 Investigation of DEP-1, SAP-1 and GLEPP1 interactions with VE-cadherin in live cells using the BiFC technique
To investigate whether DEP-1, SAP-1 and GLEPP1 could have the potential
to interact with VE-cadherin via their extracellular domains in live cells, in a
similar manner to VE-PTP, the BiFC DEP-1-VN, SAP-1-VN and GLEPP1-VN
fusion proteins were generated as described above (section 5.2.1). Each
fusion protein was co-expressed with VE-cadherin-VC in HEK293T cells and
24 hours post-transfection stained prior to confocal visualisation with
CellMaskTM Plasma Membrane Stain (as detailed in method section 2.5.6).
All the transfection conditions and parameters of confocal analyses were
kept constant for all the experiments.
Co-expression of all three DEP-1-VN/VE-cadherin-VC, SAP-1-VN/VE-
cadherin-VC and GLEPP1-VN/VE-cadherin-VC fusion pairs resulted in the
occurrence of BiFC fluorescence (Figures 54, 57 and 60). For each fusion
pair the comparison of the sub-cellular localisation of the Venus YFP signal
with that of the CellMask deep red plasma stain indicated that the
fluorescence complementation signal was detected in the plasma membrane
and intracellular structures, likely to be the endoplasmic reticulum or Golgi, of
co-transfected cells (Figures 56, 59 and 62).
In order to establish that the BiFC signal resulted from the interaction of
DEP-1-VN/VE-cadherin-VC, SAP-1-VN/VE-cadherin-VC and GLEPP1-
VN/VE-cadherin-VC fusion pairs and was not due to the non-specific
assembly of YFP fragments, the R3 RPTP fusion constructs were co-
expressed with each control construct. The co-expression of DEP-1-VN with
either SPN-VC or Myr-VC both resulted in a BiFC fluorescence signal (Figure
55, A and B). However, the qualitative assessment of the images suggested
that DEP-1-VN with a negative control construct SPN-VC appeared to exhibit
a slightly reduced fluorescence signal and the number of fluorescent cells
compared with the DEP-1-VN and VE-cadherin-VC fusion pair (Figures 54
and 55 (A)). In addition, the fluorescence signal that resulted from the
interaction of negative fusion pairs appeared to be localised more in the
cytoplasm and not in the plasma membrane. The cells co-expressed with
174
DEP-1-VN and Myr-VC appeared to exhibit a greater reduction in
fluorescence signal compared with DEP-1-VN/VE-cadherin-VC and with
DEP-1-VN/SPN-VC fusion pairs (Figures 54 and 55). The qualitative
analyses of confocal images show that, similar to DEP-1-VN, SAP-1-VN and
GLEPP1-VN also formed fewer complexes when co-expressed with either
negative control than they did with VE-cadherin-VC. The BiFC signal
resulting from the SAP-1-VN/SPN-VC complex assembly appeared to be
weaker than the BiFC signal resulting from the SAP-1-VN/VE-cadherin-VC
combination (Figures 57 and 58 (A)). The SAP-1-VC/Myr-VC combination
appeared to result in even greater reduction of fluorescence signal compared
with SAP-1-VN/VE-cadherin-VC and with SAP-1-VN/SPN-VC combinations
(Figures 57 and 58). The same results were observed with the GLEPP1-VN
fusion protein. The BiFC fluorescence signal appeared to be reduced when
GLEPP1-VN was co-expressed with SPN-VC compared with the BiFC signal
resulting from GLEPP1-VN/VE-cadherin co-expression (Figures 60 and 61
(A)). When GLEPP1-VN was co-expressed with Myr-VC the fluorescence
signal appeared to be even more reduced compared with co-expression of
either GLEPP1-VN/VE-cadherin-VC or GLEPP1-VN/SPN-VC fusion pairs
(Figures 60 and 61 (B)). As with VE-PTP-VN and VE-cadherin co-expression
(discussed in Chapter 4) the BiFC signal resulting from all the fusion pairs
tested in this chapter was predominantly detected at the plasma membrane
with some fluorescence in ER and Golgi (Figures 54, 55, 57, 58, 60 and 61).
This was also confirmed by the co-localisation analysis of the fluorescence
signals from BiFC and CellMask red plasma membrane stain (Figures 56, 59
and 62).
The qualitative results described in this chapter show that the BiFC signals
for a given protein complex are difficult to interpret and a more robust
quantitative analysis is required. Although the fluorescence signal with
control fusion proteins appeared to be reduced it is difficult to conclude
whether there is any significant difference in fluorescence intensity. In
addition, the confocal images presented in Figures 54-61 are only the
representatives and the number of cells exhibiting the BiFC signal and its
intensity vary throughout randomly acquired images.
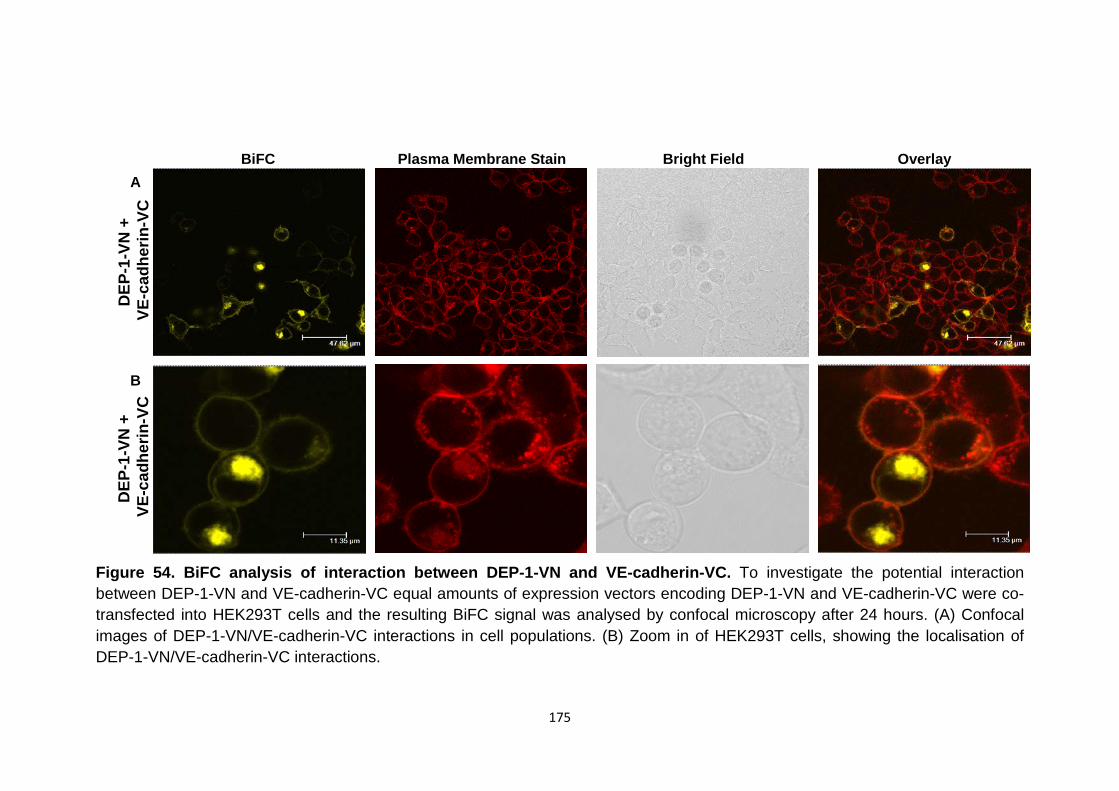
175
Figure 54. BiFC analysis of interaction between DEP-1-VN and VE-cadherin-VC. To investigate the potential interaction between DEP-1-VN and VE-cadherin-VC equal amounts of expression vectors encoding DEP-1-VN and VE-cadherin-VC were co-transfected into HEK293T cells and the resulting BiFC signal was analysed by confocal microscopy after 24 hours. (A) Confocal images of DEP-1-VN/VE-cadherin-VC interactions in cell populations. (B) Zoom in of HEK293T cells, showing the localisation of DEP-1-VN/VE-cadherin-VC interactions.
BiFC Plasma Membrane Stain Bright Field Overlay
DEP
-1-V
N +
V
E-ca
dher
in-V
C
DEP
-1-V
N +
V
E-ca
dher
in-V
C
A
B
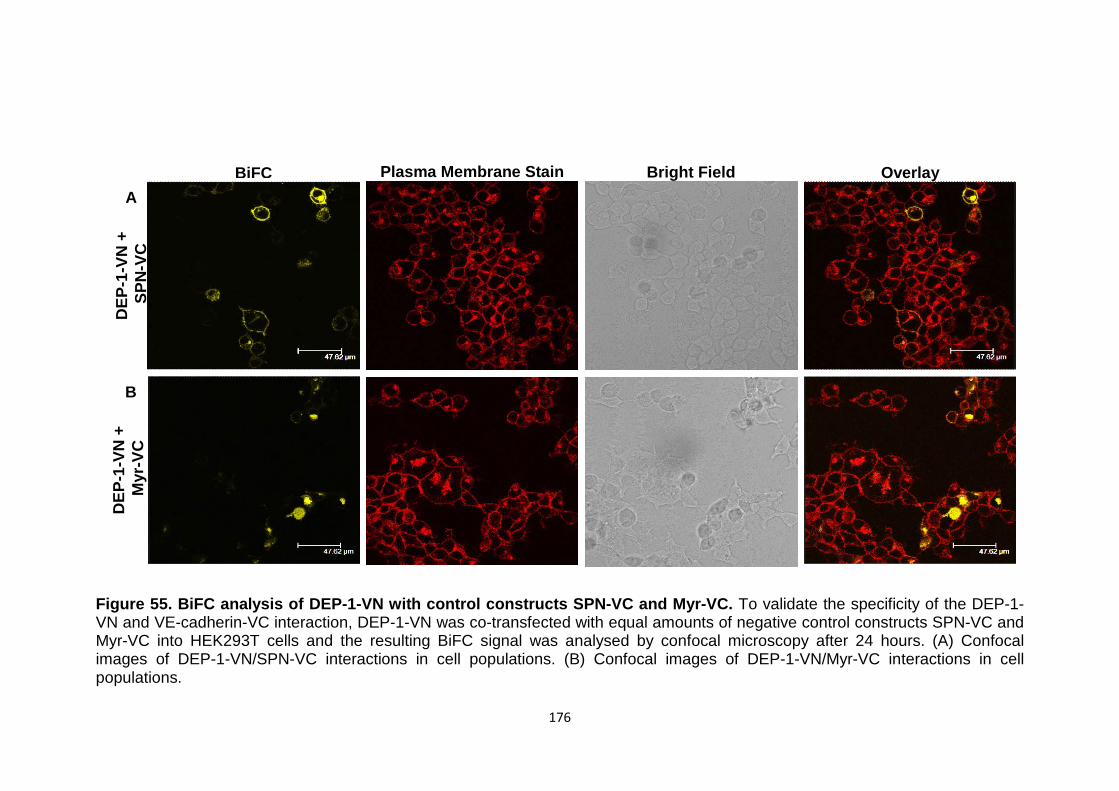
176
Figure 55. BiFC analysis of DEP-1-VN with control constructs SPN-VC and Myr-VC. To validate the specificity of the DEP-1-VN and VE-cadherin-VC interaction, DEP-1-VN was co-transfected with equal amounts of negative control constructs SPN-VC and Myr-VC into HEK293T cells and the resulting BiFC signal was analysed by confocal microscopy after 24 hours. (A) Confocal images of DEP-1-VN/SPN-VC interactions in cell populations. (B) Confocal images of DEP-1-VN/Myr-VC interactions in cell populations.
BiFC Plasma Membrane Stain Bright Field Overlay A
DEP
-1-V
N +
S
PN-V
C
B
DEP
-1-V
N +
M
yr-V
C
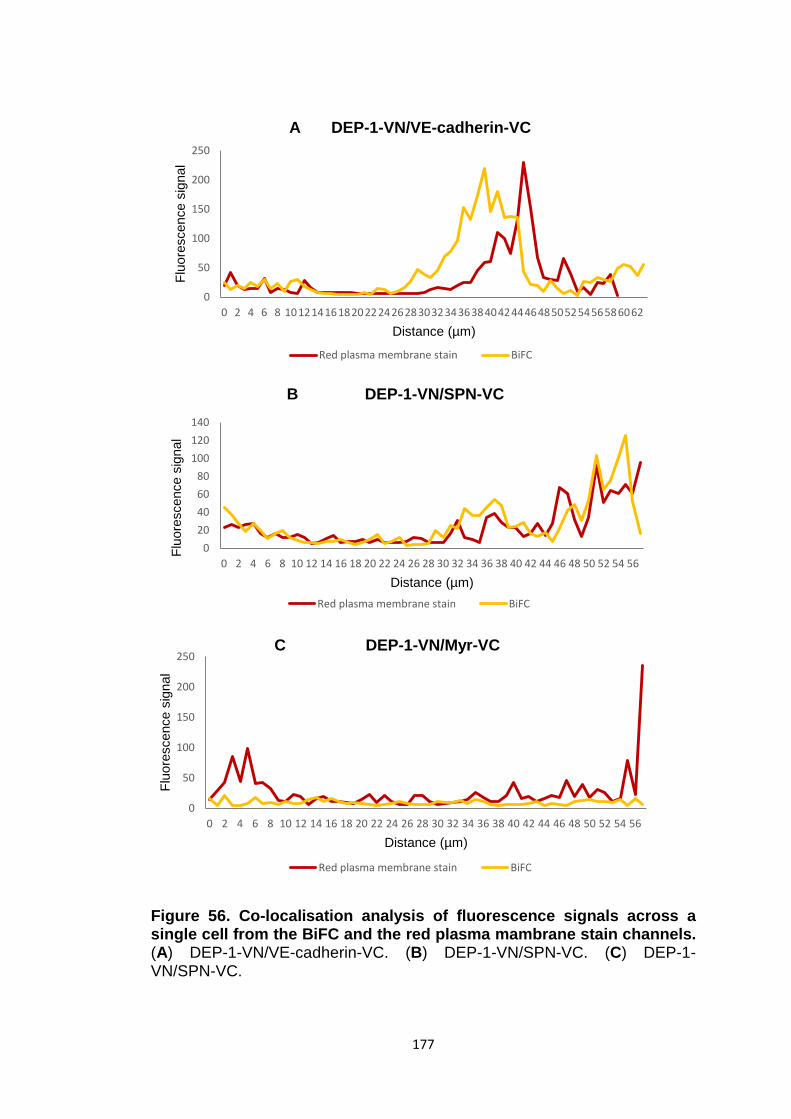
177
Figure 56. Co-localisation analysis of fluorescence signals across a single cell from the BiFC and the red plasma mambrane stain channels. (A) DEP-1-VN/VE-cadherin-VC. (B) DEP-1-VN/SPN-VC. (C) DEP-1-VN/SPN-VC.
0
50
100
150
200
250
0 2 4 6 8 101214161820222426283032343638404244464850525456586062
Fluo
resc
ence
sig
nal
Distance (µm)
A DEP-1-VN/VE-cadherin-VC
Red plasma membrane stain BiFC
020406080
100120140
0 2 4 6 8 10 12 14 16 18 20 22 24 26 28 30 32 34 36 38 40 42 44 46 48 50 52 54 56
Fluo
resc
ence
sig
nal
Distance (µm)
B DEP-1-VN/SPN-VC
Red plasma membrane stain BiFC
0
50
100
150
200
250
0 2 4 6 8 10 12 14 16 18 20 22 24 26 28 30 32 34 36 38 40 42 44 46 48 50 52 54 56
Fluo
resc
ence
sig
nal
Distance (µm)
C DEP-1-VN/Myr-VC
Red plasma membrane stain BiFC
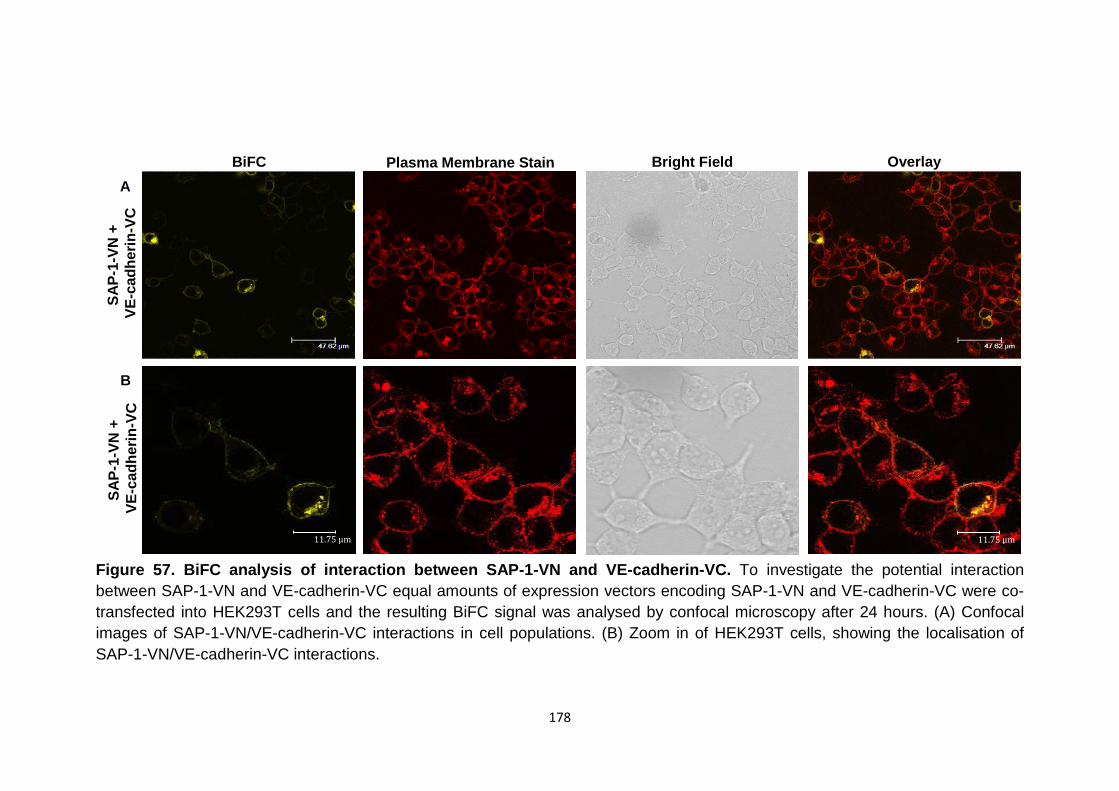
178
Figure 57. BiFC analysis of interaction between SAP-1-VN and VE-cadherin-VC. To investigate the potential interaction between SAP-1-VN and VE-cadherin-VC equal amounts of expression vectors encoding SAP-1-VN and VE-cadherin-VC were co-transfected into HEK293T cells and the resulting BiFC signal was analysed by confocal microscopy after 24 hours. (A) Confocal images of SAP-1-VN/VE-cadherin-VC interactions in cell populations. (B) Zoom in of HEK293T cells, showing the localisation of SAP-1-VN/VE-cadherin-VC interactions.
11.75 µm 11.75 µm
BiFC Plasma Membrane Stain Bright Field Overlay
SAP-
1-VN
+
VE-
cadh
erin
-VC
A
B
SAP-
1-VN
+
VE-
cadh
erin
-VC
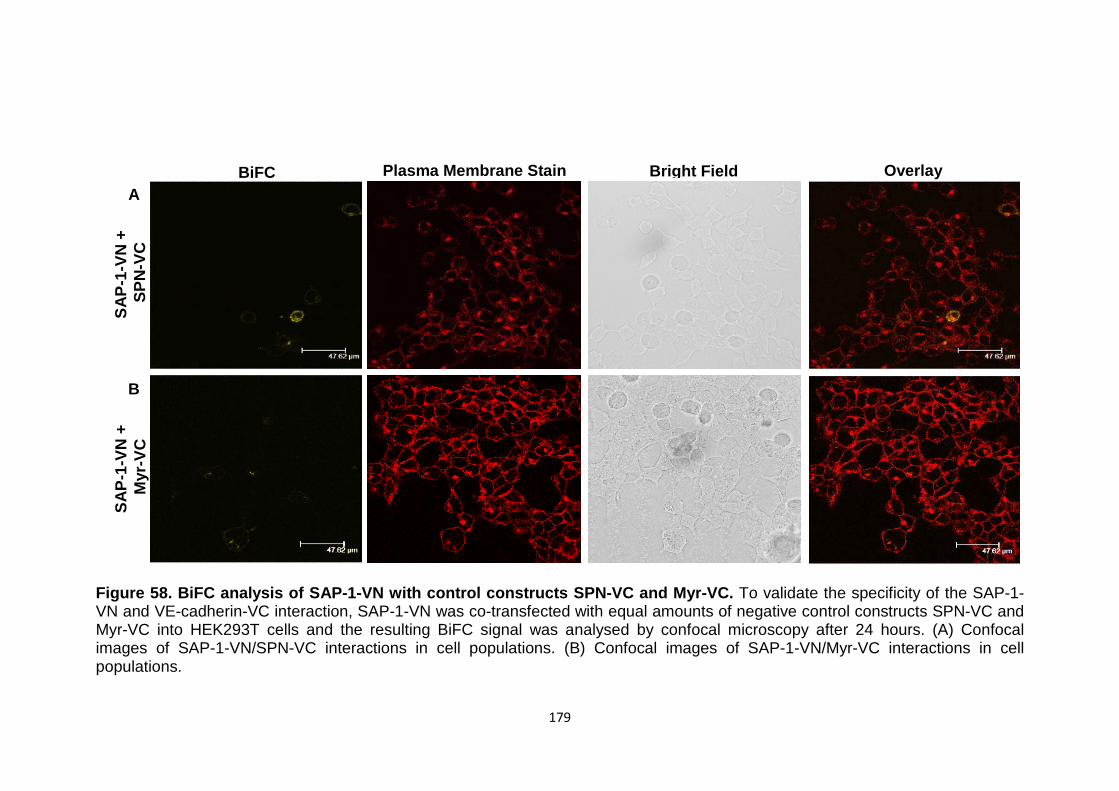
179
Figure 58. BiFC analysis of SAP-1-VN with control constructs SPN-VC and Myr-VC. To validate the specificity of the SAP-1-VN and VE-cadherin-VC interaction, SAP-1-VN was co-transfected with equal amounts of negative control constructs SPN-VC and Myr-VC into HEK293T cells and the resulting BiFC signal was analysed by confocal microscopy after 24 hours. (A) Confocal images of SAP-1-VN/SPN-VC interactions in cell populations. (B) Confocal images of SAP-1-VN/Myr-VC interactions in cell populations.
BiFC Plasma Membrane Stain Bright Field Overlay A
SAP-
1-VN
+
SPN
-VC
B
SAP-
1-VN
+
Myr
-VC
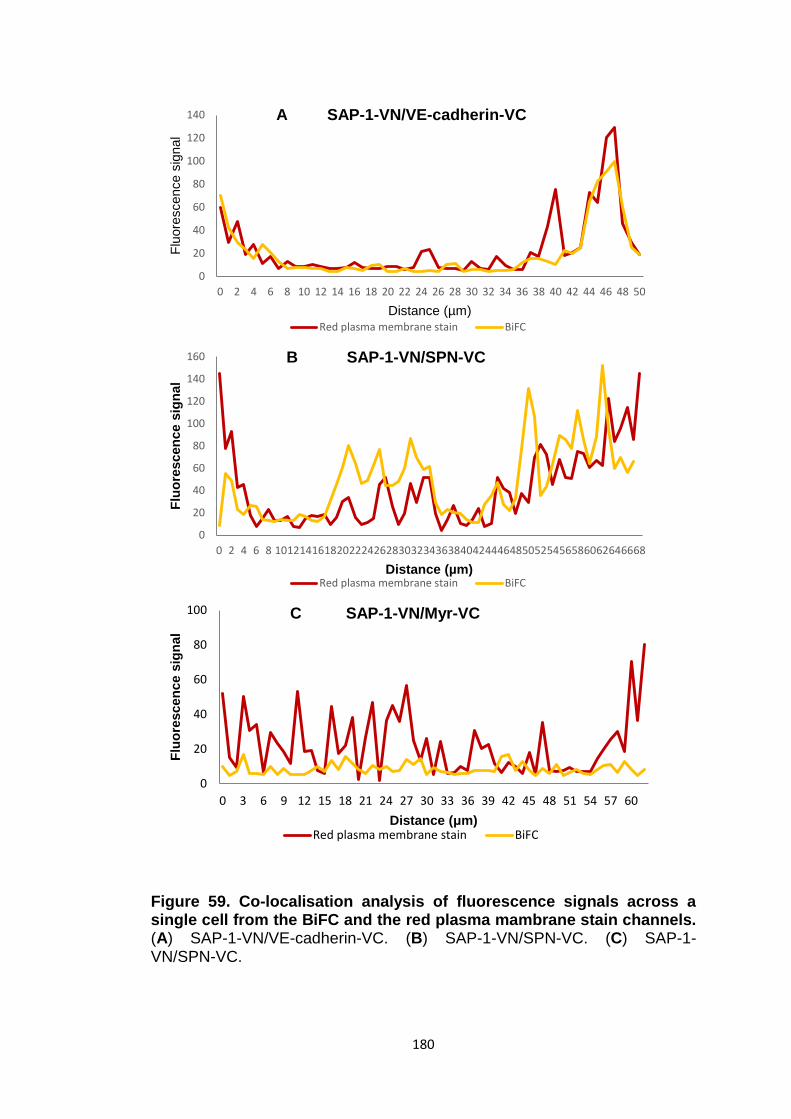
180
Figure 59. Co-localisation analysis of fluorescence signals across a single cell from the BiFC and the red plasma mambrane stain channels. (A) SAP-1-VN/VE-cadherin-VC. (B) SAP-1-VN/SPN-VC. (C) SAP-1-VN/SPN-VC.
0
20
40
60
80
100
120
140
0 2 4 6 8 10 12 14 16 18 20 22 24 26 28 30 32 34 36 38 40 42 44 46 48 50
Fluo
resc
ence
sig
nal
Distance (µm)
A SAP-1-VN/VE-cadherin-VC
Red plasma membrane stain BiFC
0
20
40
60
80
100
120
140
160
0 2 4 6 8 101214161820222426283032343638404244464850525456586062646668
Fluo
resc
ence
sig
nal
Distance (µm)
B SAP-1-VN/SPN-VC
Red plasma membrane stain BiFC
0
20
40
60
80
100
0 3 6 9 12 15 18 21 24 27 30 33 36 39 42 45 48 51 54 57 60
Fluo
resc
ence
sig
nal
Distance (μm)
C SAP-1-VN/Myr-VC
Red plasma membrane stain BiFC
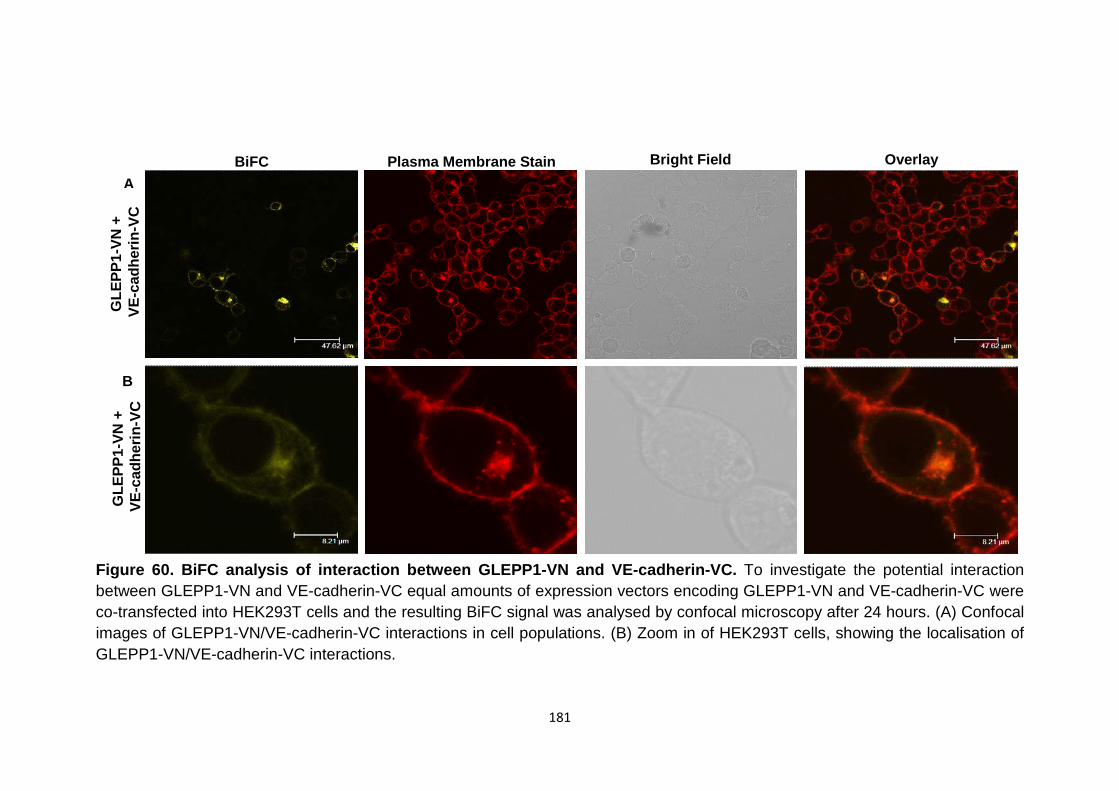
181
Figure 60. BiFC analysis of interaction between GLEPP1-VN and VE-cadherin-VC. To investigate the potential interaction between GLEPP1-VN and VE-cadherin-VC equal amounts of expression vectors encoding GLEPP1-VN and VE-cadherin-VC were co-transfected into HEK293T cells and the resulting BiFC signal was analysed by confocal microscopy after 24 hours. (A) Confocal images of GLEPP1-VN/VE-cadherin-VC interactions in cell populations. (B) Zoom in of HEK293T cells, showing the localisation of GLEPP1-VN/VE-cadherin-VC interactions.
BiFC Plasma Membrane Stain Bright Field Overlay
A
GLE
PP1-
VN +
V
E-ca
dher
in-V
C
B
GLE
PP1-
VN +
V
E-ca
dher
in-V
C
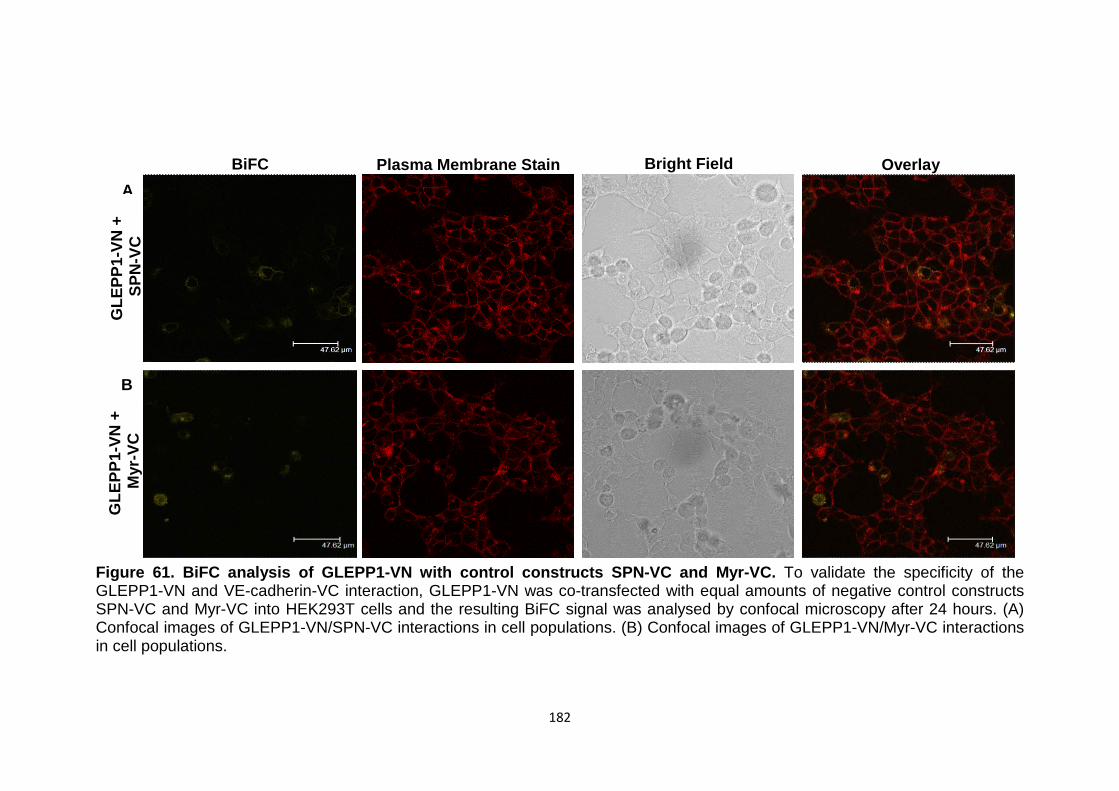
182
Figure 61. BiFC analysis of GLEPP1-VN with control constructs SPN-VC and Myr-VC. To validate the specificity of the GLEPP1-VN and VE-cadherin-VC interaction, GLEPP1-VN was co-transfected with equal amounts of negative control constructs SPN-VC and Myr-VC into HEK293T cells and the resulting BiFC signal was analysed by confocal microscopy after 24 hours. (A) Confocal images of GLEPP1-VN/SPN-VC interactions in cell populations. (B) Confocal images of GLEPP1-VN/Myr-VC interactions in cell populations.
BiFC Plasma Membrane Stain Bright Field Overlay A
GLE
PP1-
VN +
S
PN-V
C
B
GLE
PP1-
VN +
M
yr-V
C
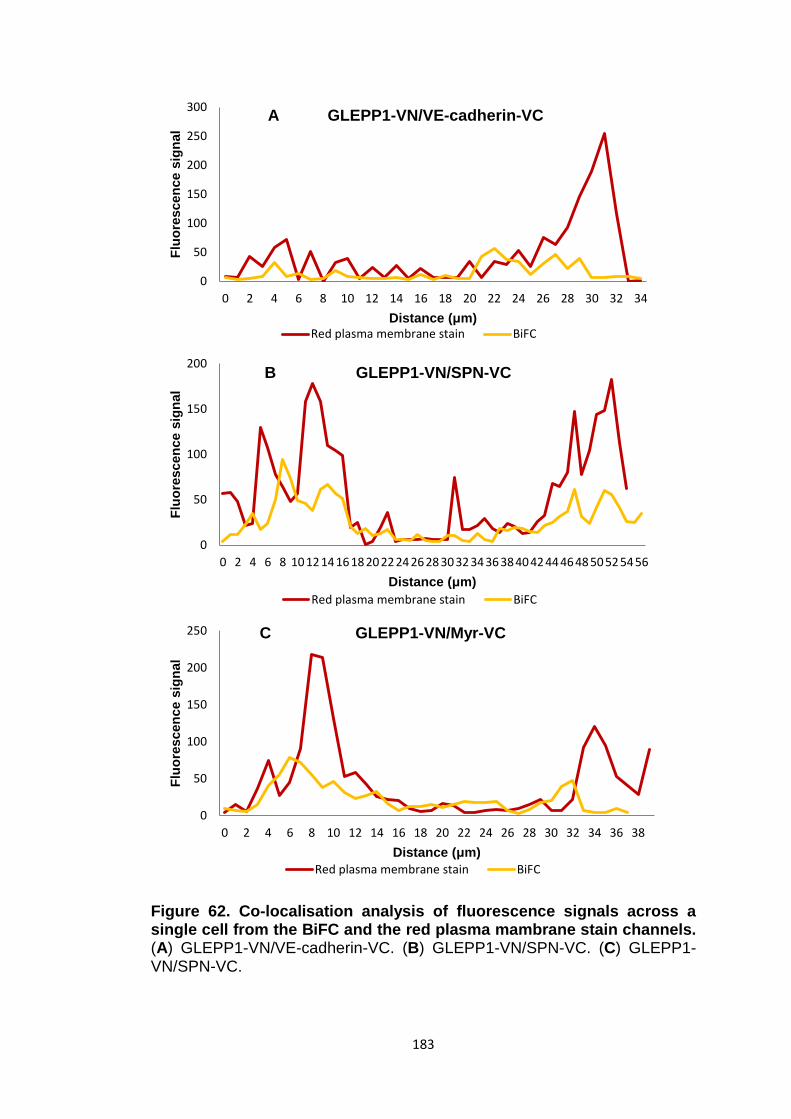
183
Figure 62. Co-localisation analysis of fluorescence signals across a single cell from the BiFC and the red plasma mambrane stain channels. (A) GLEPP1-VN/VE-cadherin-VC. (B) GLEPP1-VN/SPN-VC. (C) GLEPP1-VN/SPN-VC.
0
50
100
150
200
250
300
0 2 4 6 8 10 12 14 16 18 20 22 24 26 28 30 32 34
Fluo
resc
ence
sig
nal
Distance (μm)
A GLEPP1-VN/VE-cadherin-VC
Red plasma membrane stain BiFC
0
50
100
150
200
0 2 4 6 8 10 12 14 16 18 20 22 24 26 28 30 32 34 36 38 40 42 44 46 48 50 52 54 56
Fluo
resc
ence
sig
nal
Distance (μm)
B GLEPP1-VN/SPN-VC
Red plasma membrane stain BiFC
0
50
100
150
200
250
0 2 4 6 8 10 12 14 16 18 20 22 24 26 28 30 32 34 36 38
Fluo
resc
ence
sig
nal
Distance (μm)
C GLEPP1-VN/Myr-VC
Red plasma membrane stain BiFC
184
5.5 Quantitative analysis of BiFC data
In order to complement the qualitative BiFC interactions between DEP-1-VN,
SAP-1-VN, GLEPP1-VN and VE-cadherin-VC described above quantitative
analyses were carried out using ImageJ software. The principle and
validation of the quantitative analyses with putative interacting partners bJun
and bFos were described in Chapter 3. The same quantitative analyses were
applied to VE-PTP-VN and VE-cadherin-VC interaction study and described
in Chapter 4.
To analyse the BiFC specificity of interactions between DEP-1-VN/VE-
cadherin-VC, SAP-1-VN/VE-cadherin-VC and GLEPP1-VN/VE-cadherin-VC
fusion pairs the distribution of yellow/red ratios in individual cells was plotted
in a histogram. If the fluorescence signal resulting from DEP-1-VN/VE-
cadherin-VC, SAP-1-VN/VE-cadherin-VC or GLEPP1-VN/VE-cadherin-VC
fusion pair interaction is due to specific protein-protein interactions and not
due to the YFP fragments, then more cells would have higher yellow/red ratio
value range compared with negative controls.
The histogram in Figure 63 (A) shows that co-expression of DEP-1-VN and
VE-cadherin-VC resulted in a slightly higher number of cells that fall into
higher ratio value range between 0 and 4 compared with cells co-expressing
DEP-1-VN and SPN-VC (Figure 63, B) or DEP-1-VN and Myr-VC (Figure 63,
C) negative interacting pairs. When comparing the distribution of ratios from
DEP-1-VN/VE-cadherin-VC and DEP-1-VN/SPN-VC there appear to be
fewer cells that exhibit higher yellow/red ratio values. The yellow/red ratio
values for DEP-1-VN/SPN-VC mainly fall into a range between 0 and 2
(Figure 63, B). However, there appears to be little difference in yellow/red
ratio distribution between DEP-1-VN/SPN-VC and DEP-1-VN/Myr-VC (Figure
63, B and C). Similar results were observed with SAP-1-VN and GLEPP1-VN
fusion proteins. When SAP-1-VN was co-transfected with VE-cadherin-VC
there was a higher number of cells that have higher ratio value range
(between 0 and 4) than for cells co-expressing SAP-1-VN and SPN-VC or
SAP-1-VN and Myr-VC control pairs (Figure 64, A-C). When cells were co-
transfected with SAP-1-VN and SPN-VC there appeared to be fewer cells
185
exhibiting higher ratio values, falling into the distribution range between 0
and 3, than for cells co-expressing SAP-1-VN and VE-cadherin-VC fusion
pair (Figure 64, A and B). When cells were co-transfected with SAP-1-VN
and Myr-VC there appeared to be even greater reduction in cell numbers
with higher ratio values compared with SAP-1-VN/VE-cadherin-VC or SAP-1-
VN/SPN-VC fusion pairs. The majority of cells expressing SAP-1-VN and
Myr-VC exhibited yellow/red ratio values that ranged from 0 to 1 (Figure 64,
C). Co-expression of GLEPP1-VN and VE-cadherin-VC resulted in a higher
number of cells with higher ratio value range (between 0 and 3) compared
with co-expression of GLEPP1-VN/SPN-VC that resulted in cells with lower
ratio value range (between 0 and 2) or GLEPP1-VN/Myr-VC that resulted in
cells with even lower ratio value range (between 0 and 1) (Figure 65, A-C).
However, it is difficult to conclude whether the reduction in cells exhibiting
higher ratio value range is significant.
To supplement the above results and to measure the BiFC specificity the
signal-to-noise (S/N) ratio was calculated as described in Chapters 3 and 4.
A higher S/N ratio value reflects a more specific interaction. S/N ratio was
calculated for each interacting fusion pair, including control fusion pairs to
establish how much fluorescence signal was formed due to YFP fragments
self-assembly. S/N ratio for DEP-1-VN/VE-cadherin-VC, DEP-1-VN/SPN-VC
and DEP-1-VN/Myr-VC fusion pairs was calculated by dividing their median
values by the median value of DEP-1-VN/Myr-VC. The same was done for all
the other fusion pairs, dividing their median values by the median value of
the corresponding Myr-VC-containing fusion pair.
There are no previous documented reports about R3 RPTPs and SPN
interactions. Interestingly, while the S/N ratio value for SAP-1-VN/VE-
cadherin-VC was 3.5-fold higher than for SAP-1-VN/SPN-VC and for
GLEPP1-VN/VE-cadherin-VC was 2-fold higher than for GLEPP1-VN/SPN-
VC, the S/N for DEP-1-VN/VE-cadherin-VC was slightly lower than for DEP-
1-VN/SPN-VC control pair (Figure 66). This could suggest possible
interaction between DEP-1-VN and SPN-VC. S/N value for DEP-1-VN/VE-
cadherin-VC was 3-fold higher than for DEP-1-VN/Myr-VC. S/N value for

186
SAP-1-VN/VE-cadherin-VC was 6-fold higher compared with SAP-1-VN/Myr-
VC. The S/N value for GLEPP1-VN/VE-cadherin-VC was 4.5-fold higher than
for GLEPP1-VN/Myr-VC (Figure 66). These results suggest that interactions
between DEP-1-VN and VE-cadherin-VC, SAP-1-VN and VE-cadherin-VC
and GLEPP1-VN and VE-cadherin-VC are specific and not due to self-
assembly of the YFP fragments.
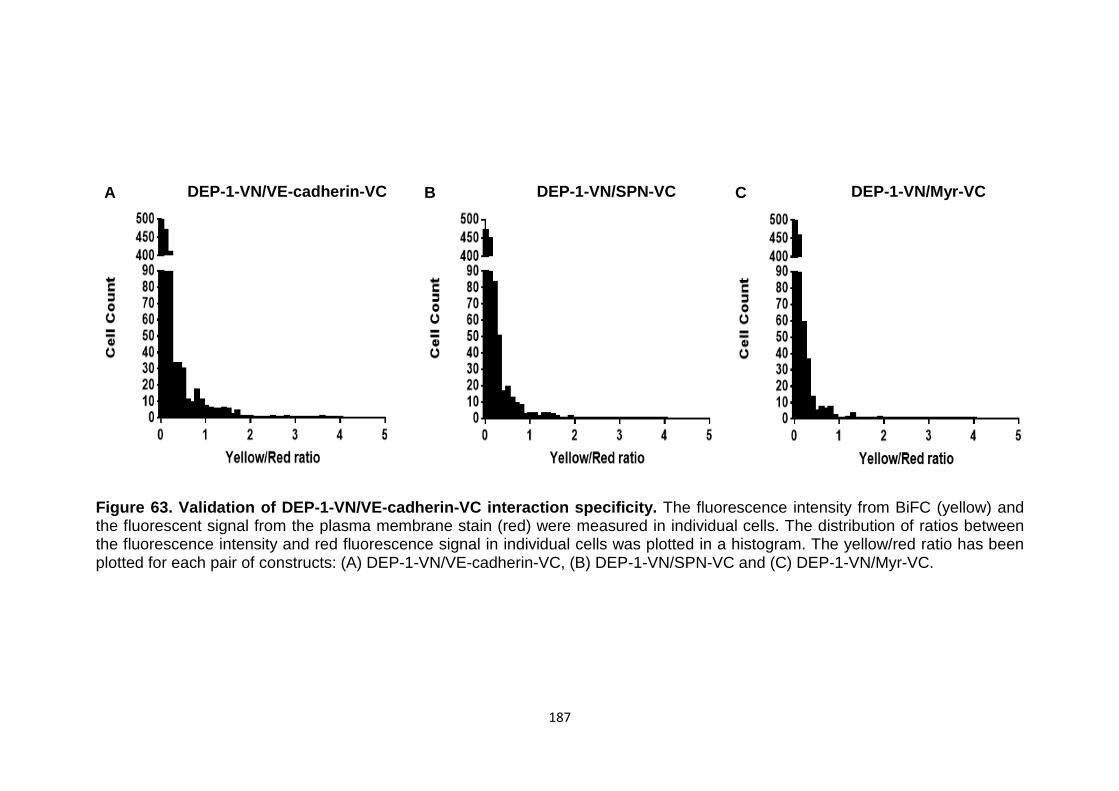
187
Figure 63. Validation of DEP-1-VN/VE-cadherin-VC interaction specificity. The fluorescence intensity from BiFC (yellow) and the fluorescent signal from the plasma membrane stain (red) were measured in individual cells. The distribution of ratios between the fluorescence intensity and red fluorescence signal in individual cells was plotted in a histogram. The yellow/red ratio has been plotted for each pair of constructs: (A) DEP-1-VN/VE-cadherin-VC, (B) DEP-1-VN/SPN-VC and (C) DEP-1-VN/Myr-VC.
A B C DEP-1-VN/VE-cadherin-VC DEP-1-VN/SPN-VC DEP-1-VN/Myr-VC
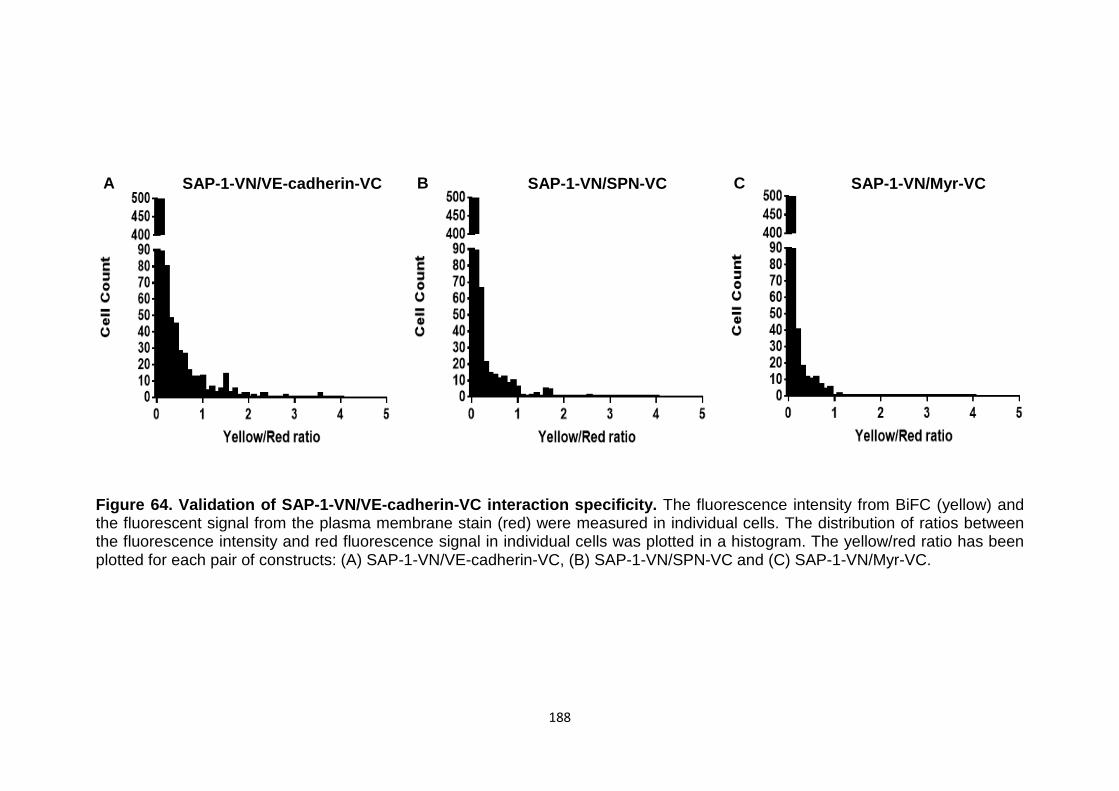
188
Figure 64. Validation of SAP-1-VN/VE-cadherin-VC interaction specificity. The fluorescence intensity from BiFC (yellow) and the fluorescent signal from the plasma membrane stain (red) were measured in individual cells. The distribution of ratios between the fluorescence intensity and red fluorescence signal in individual cells was plotted in a histogram. The yellow/red ratio has been plotted for each pair of constructs: (A) SAP-1-VN/VE-cadherin-VC, (B) SAP-1-VN/SPN-VC and (C) SAP-1-VN/Myr-VC.
A B C SAP-1-VN/VE-cadherin-VC SAP-1-VN/SPN-VC SAP-1-VN/Myr-VC
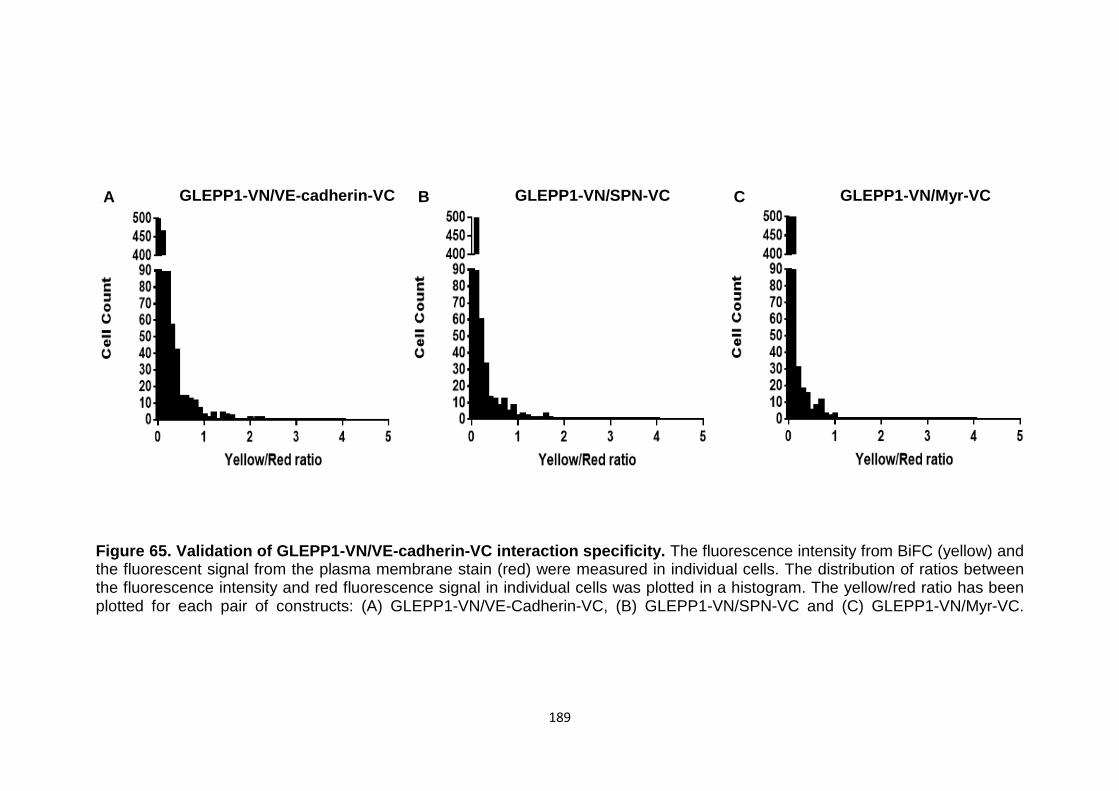
189
Figure 65. Validation of GLEPP1-VN/VE-cadherin-VC interaction specificity. The fluorescence intensity from BiFC (yellow) and the fluorescent signal from the plasma membrane stain (red) were measured in individual cells. The distribution of ratios between the fluorescence intensity and red fluorescence signal in individual cells was plotted in a histogram. The yellow/red ratio has been plotted for each pair of constructs: (A) GLEPP1-VN/VE-Cadherin-VC, (B) GLEPP1-VN/SPN-VC and (C) GLEPP1-VN/Myr-VC.
A B C GLEPP1-VN/VE-cadherin-VC GLEPP1-VN/SPN-VC GLEPP1-VN/Myr-VC
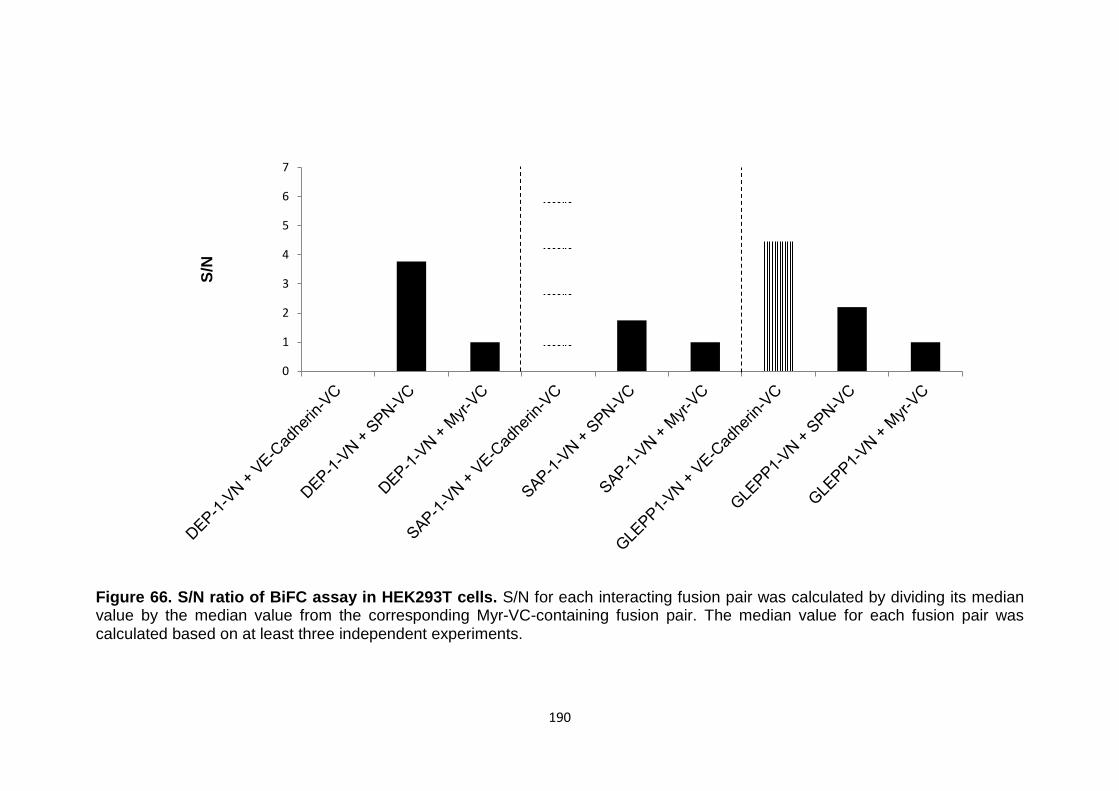
190
Figure 66. S/N ratio of BiFC assay in HEK293T cells. S/N for each interacting fusion pair was calculated by dividing its median value by the median value from the corresponding Myr-VC-containing fusion pair. The median value for each fusion pair was calculated based on at least three independent experiments.
0
1
2
3
4
5
6
7
S/N
191
An alternative approach to quantitate the data using only average
fluorescence intensity was also used. The average yellow fluorescence
intensity from at least three random fields and three or more independent
experiments was calculated for each fusion pair and used for statistical
analysis (Figure 67). Quantitative analysis of the DEP-1-VN and VE-
cadherin-VC fusion pair showed that there was no significant difference in an
average BiFC fluorescence intensity compared with DEP-1-VN and SPN-VC.
However, when DEP-1-VN was co-expressed with Myr-VC there was a
significant reduction in average fluorescence intensity by 2.5-fold and 2.2-
fold than for DEP-1-VN/VE-cadherin-VC and DEP-1-VN/SPN-VC fusion pairs
respectively (Figure 67). When SAP-1-VN was co-expressed with VE-
cadherin-VC the average fluorescence intensity was significantly higher than
for all the control pairings (p<0.001). As can be seen from Figure 67 there
was a significant decrease in fluorescence signal by about 2- and 3-fold in
SAP-1-VN/SPN-VC and SAP-1-VN/Myr-VC respectively compared with SAP-
1-VN/VE-cadherin-VC fusion pair. Similarly, when HEK293T cells were co-
transfected with GLEPP1-VN and VE-cadherin-VC the resulting fluorescence
intensity was significantly higher than for all the control pairings (p<0.001).
There was a significant decrease in fluorescence signal by 1.7- and 3.5-fold
in GLEPP1-VN/SPN-VC and GLEPP1-VN/Myr-VC respectively than for
GLEPP1-VN/VE-cadherin-VC fusion pair (Figure 67). The results of this
quantitative approach correspond to results from distribution of yellow/red
ratio values and S/N quantitative methods.
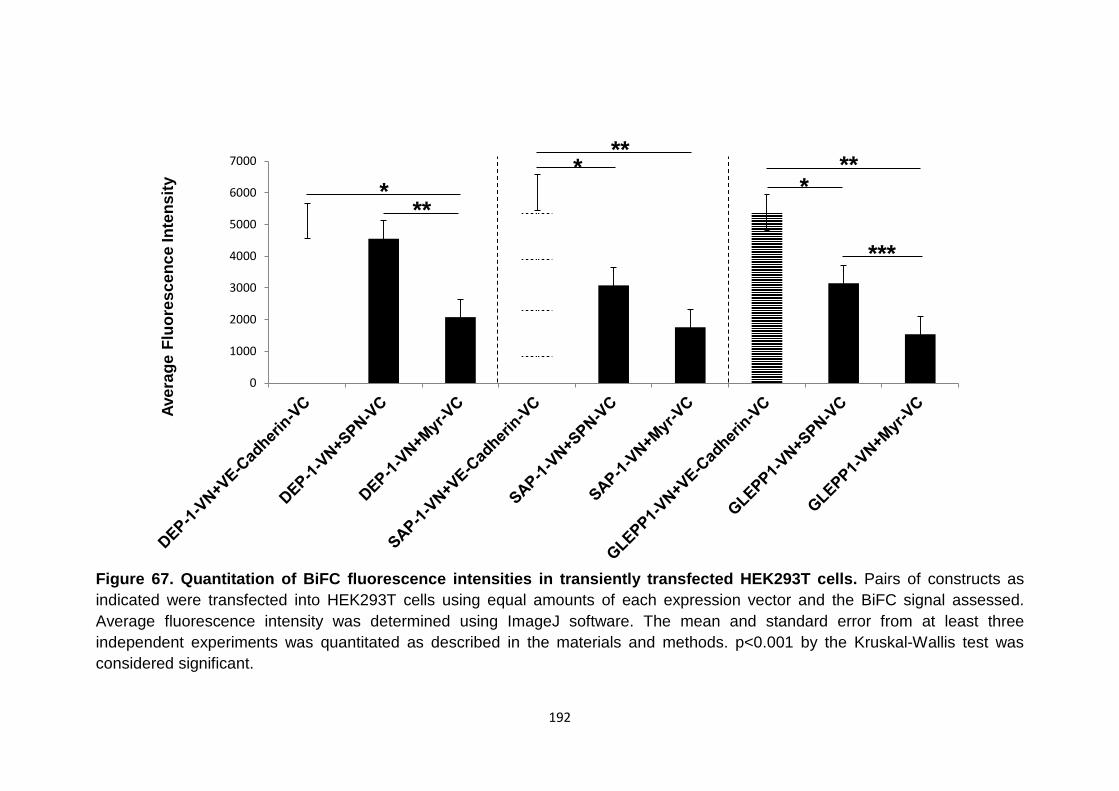
192
Figure 67. Quantitation of BiFC fluorescence intensities in transiently transfected HEK293T cells. Pairs of constructs as indicated were transfected into HEK293T cells using equal amounts of each expression vector and the BiFC signal assessed. Average fluorescence intensity was determined using ImageJ software. The mean and standard error from at least three independent experiments was quantitated as described in the materials and methods. p<0.001 by the Kruskal-Wallis test was considered significant.
0
1000
2000
3000
4000
5000
6000
7000Av
erag
e Fl
uore
scen
ce In
tens
ity
* *
**
***
**
** *
193
5.6 Discussion
Protein tyrosine phosphatases of the R3 subgroup (R3 RPTPs) share similar
structure and it has been suggested that they may share similar physiological
functions. The single intracellular catalytic domain of these proteins has
received much attention and it has been shown that the members of this
subgroup have developmental and physiological functions in several tissues
including the vascular and nervous systems (Sakuraba et al, 2013).
However, the function of the extracellular domains of R3 RPTPs that is
composed of fibronectin III-like (FNIII) repeats is less well defined. Although
the extracellular domains of these proteins are structurally similar, the
number of FNIII-like repeats varies and some previous studies have reported
little homology. Comparison of the amino acid sequence of each FNIII-like
repeat in ECD performed by Matozaki et al (1994) revealed that SAP-1 and
VE-PTP share only 24% similarity, which, in contrast to other studies,
suggested that they may have different functions. Despite such low similarity,
R3 RPTP extracellular domains may have similar functions. Interestingly
immunofluorescence staining experiments on frozen sections from human
and mouse performed by Takahashi et al (1999) showed that DEP-1 was
expressed on luminal membranes of capillary and arterial endothelium of
mature human and mouse kidney, where it accumulates at points of inter-
endothelial contact. Furthermore double-labelling studies demonstrated that
DEP-1 expression overlaps with localisation of VE-cadherin (Takahashi et al,
1999). These observations raise some speculation that perhaps DEP-1 has
similar physiological functions to VE-PTP in vascular development and in
endothelial cell-cell interactions through association with VE-cadherin.
In this chapter DEP-1-VN and VE-cadherin-VC fusion constructs consisting
of transmembrane and extracellular domains fused to the N- and C-terminal
parts of a Venus yellow fluorescent protein (YFP) respectively were used to
examine their potential interaction in live cells using the bimolecular
fluorescence complementation (BiFC) assay. In addition SAP-1-VN and
GLEPP1-VN fusion constructs fused to the N-terminal part of YFP were also
used to investigate whether all the members of R3 RPTP subgroup have the
potential to interact with VE-cadherin. The qualitative BiFC analysis obtained
194
on co-expression of DEP-1-VN/VE-cadherin-VC, SAP-1-VN/VE-cadherin-VC
or GLEPP1-VN/VE-cadherin-VC fusion pairs showed a strong fluorescence
signal for each interacting pair that was localised at the plasma membrane
with some fluorescence in endoplasmic reticulum and probably Golgi
apparatus. These results correlate with the results obtained with VE-PTP-
VN/VE-cadherin-VC interacting pair discussed in Chapter 4. To confirm the
specificity of the BiFC fluorescence signal negative controls described in
Chapter 4 were used with each R3 RPTP fusion. However, the co-
expression of DEP-1-VN, SAP-1-VN or GLEPP1-VN with either SPN-VC or
Myr-VC negative controls also resulted in fluorescence signal. Although the
signal appeared to be reduced and less intense using qualitative analysis it
was not possible to conclude that the fluorescence obtained with negative
interaction pairs was due to non-specific interactions or self-assembly of the
non-fluorescent YFP fragments that could be caused by an overexpression
of proteins.
In this chapter three different quantitative analyses were performed using
ImageJ software and statistically validated data as described in previous
Chapters 2-4. Each quantitative analysis validates the BiFC efficiency and
specificity, complementing each other to produce more robust data. The
quantitative analyses demonstrated that co-expression of each member of
R3 RPTP subgroup with either VE-cadherin or negative control construct
resulted in a similar trend of BiFC complex formation. Co-expression of
either SAP-1-VN/VE-cadherin-VC or GLEPP1-VN/VE-cadherin-VC fusion
pair resulted in more cells exhibiting higher yellow/red ratio values, higher
S/N value and a significant increase in average yellow fluorescence signal
compared with all the negative interacting pairings. Considering that the
GLEPP1-VN was expressed at lower level than for negative controls SPN-
VC and Myr-VC and that DEP-1-VN and SAP-1-VN were expressed at lower
level than for SPN-VC (Figures 31 and 53) suggests that the BiFC signal
from either SAP-1-VN/VE-cadherin-VC or GLEPP1-VN/VE-cadherin-VC was
not an artefact of overexpression. These results suggest that the interactions
between SAP-1-VN and VE-cadherin-VC and between GLEPP1-VN and VE-
cadherin-VC are bona fide protein-protein interactions rather than non-
195
specific assembly of the YFP fragments. Interestingly the fluorescence
intensity obtained with the DEP-1-VN and VE-cadherin-VC pairing, although
significantly different from DEP-1 with the Myr-VC control, was not
significantly different from DEP-1-VN and the SPN-VC control (Figure 67) as
discussed further below. In addition, the S/N value for DEP-1-VN/SPN-VC
was higher than for DEP-1-VN/VE-cadherin-VC (Figure 66). These
quantitative assessments of the fluorescence images obtained for each
interacting pair indicated a BiFC signal that is due to a specific interaction,
rather than self-assembly of the YFP fragments and background
fluorescence.
In this chapter analysis of the potential of other R3 RPTPs (DEP-1, SAP-1
and GLEPP1) to interact with VE-cadherin revealed that the series of 8-9
extracellular FNIII-like domains from any of the R3-PTPs has the potential to
mediate a direct interaction with VE-cadherin. This is of particular interest
with regard to DEP-1 since it is expressed in endothelial cells together with
VE-cadherin. It has been shown previously that DEP-1 localisation at inter-
endothelial cell contacts overlaps with VE-cadherin, where it interacts with
other endothelial cell tight junction proteins and, thus, it has been suggested
to play a role in regulation of endothelial cell permeability (Takahashi et al,
1999; Sallee and Burridge, 2009; Spring et al, 2012). It has been previously
shown that the cytoplasmic domain of VE-cadherin forms complexes with cell
adhesion catenin proteins, such as plakoglobin (also known as gamma-
catenin), p120-catenin and β-catenin (Lampugnani et al, 1995). A schematic
representation of VE-cadherin/catenin complex is shown in Figure 68. This
complex serves to strengthen adhesion forces and allows dynamic contacts
(Azzi et al, 2013). Interestingly DEP-1 was also shown to associate with and
dephosphorylate plakoglobin, p120-catenin and β-catenin through its
cytoplasmic domain (Holsinger et al, 2002). But whether DEP-1 interacts
directly with VE-cadherin in the same manner as VE-PTP has not been
defined previously. Even if DEP-1 and VE-cadherin do not interact via their
extracellular domains, the cumulative previous results suggest that these two
proteins function as part of one complex. Close localisation of DEP-1 and

196
VE-cadherin was possibly enough for BiFC complementation to occur,
resulting in fluorescence signal.
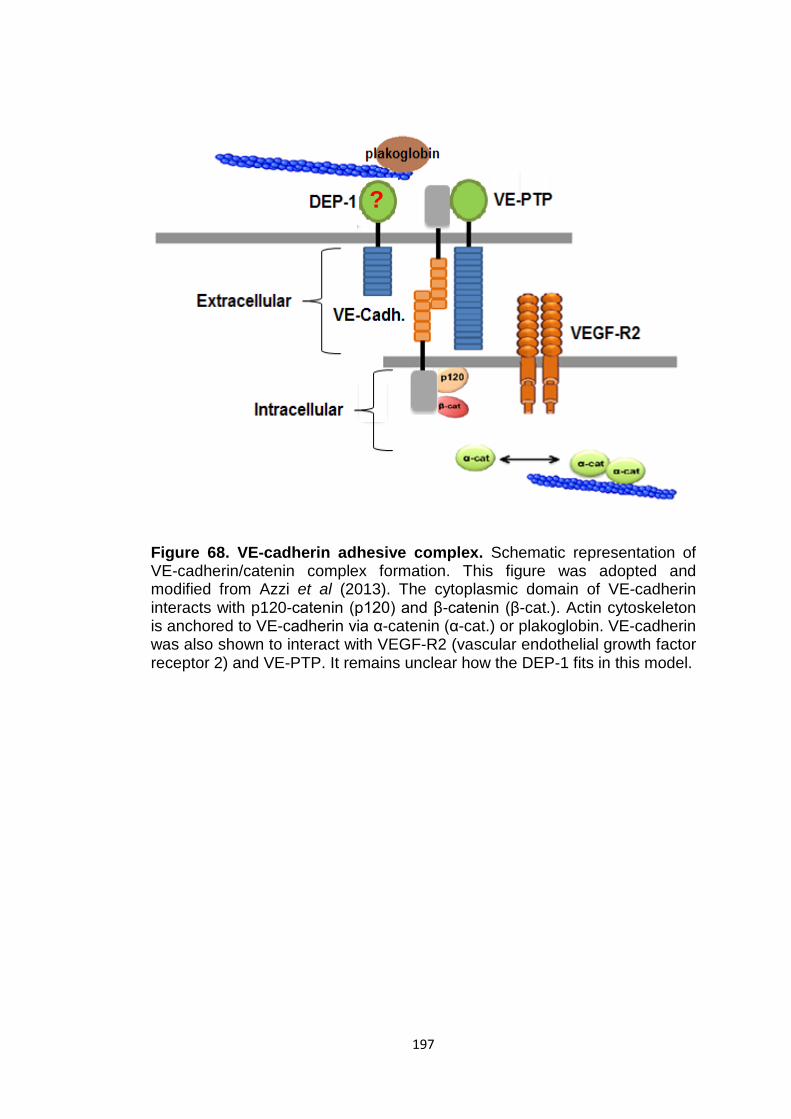
197
Figure 68. VE-cadherin adhesive complex. Schematic representation of VE-cadherin/catenin complex formation. This figure was adopted and modified from Azzi et al (2013). The cytoplasmic domain of VE-cadherin interacts with p120-catenin (p120) and β-catenin (β-cat.). Actin cytoskeleton is anchored to VE-cadherin via α-catenin (α-cat.) or plakoglobin. VE-cadherin was also shown to interact with VEGF-R2 (vascular endothelial growth factor receptor 2) and VE-PTP. It remains unclear how the DEP-1 fits in this model.
?
198
The observation that co-expression of DEP-1-VN with the SPN-VC control
was not significantly different from the DEP-1-VN/VE-cadherin-VC
combination but gave significantly higher levels of fluorescence than DEP-1-
VN with the Myr-VC control could be interpreted as a bona fide interaction
between DEP-1 and SPN. Both DEP-1 and SPN proteins are expressed in
leukocytes. However, I am not aware of any previous reports documenting
this interaction. Nonetheless, both DEP-1 and SPN have been shown to
share similar physiological functions in regulation of immune responses and
especially in regulation of T cell receptor (TCR) signalling. DEP-1, together
with another RPTP glycoprotein CD45, was suggested to regulate TCR
signalling by passive segregation from engaged TCR (kinetic-segregation
model). It has been proposed that DEP-1, due to its large extracellular
domain, is excluded from the vicinity of the engaged TCR, allowing
TCR/MHC (major histocompatibility complex) interaction and the consequent
phosphorylation of TCR ITAMs (immunoreceptor tyrosine-based activation
motifs) and other substrates to take place that result in TCR signalling
pathway activation (Cordoba et al, 2013). Fluorescent imaging revealed that
truncation of DEP-1 and CD45 extracellular domains enhanced co-
localisation with TCR and, as was confirmed by immunoblot analysis,
enabled phosphatases to dephosphorylate membrane-proximal molecules
(such as LAT) in the TCR triggering pathway (Corboda et al, 2013).
Therefore, these results suggest that the large extracellular domain of DEP-1
prevents its tyrosine phosphatase domain from inhibiting TCR signalling.
Interestingly SPN was also shown to be highly expressed in T cells and to
interact with the T cell receptor to initiate signalling events (Clark and Baum,
2012). Furthermore it has been suggested that the glycosylation of SPN
plays a key role in this interaction. SPN has about 80 O-linked, as well as
some N-linked, glycans dispersed over the entire extracellular domain. Some
studies demonstrated that the glycosylation of SPN’s extracellular domain is
regulated by T cells and that this differential glycosylation of SPN regulates
interactions with the extracellular environment that, in turn, regulate T cell
receptor signalling (Clark and Baum, 2012). As the results of this Chapter
and of some previous observations suggest, there is a possibility that DEP-1
and SPN interact together via their extracellular domains. However, further
199
experiments are required to confirm their interaction and to investigate its
molecular basis. In addition it would be interesting to examine what role the
glycosylation plays in interaction between DEP-1 and SPN, as well as
between R3 RPTPs and VE-cadherin. Additional experiments could be
performed by enzymatically removing N- and O-linked glycans, using
PNGase and O-Glycosidase.
On the other hand the physiological importance of either SAP-1 or GLEPP1
interaction with VE-cadherin is not clear. I am not aware of any reports of
SAP-1 and GLEPP1 expression in endothelial cells and, since VE-cadherin
expression is restricted to this cell type, the observed interaction is unlikely to
be of physiological relevance. Nonetheless, the results provide insight into
the molecular basis of the interaction suggesting that the interaction of VE-
PTP and VE-cadherin, or other R3 RPTPs with VE-cadherin, can be
mediated by several different FNIII domains and, potentially, their
transmembrane domains. This finding is consistent with studies in Chapter 4
of the deletion mutant suggesting that the FNIII domains could be
interchangeable. Controversially, as mentioned above, the interaction could
occur through the extensive glycosylation of these proteins in the same
manner as SPN interacts with proteins involved in T cell receptor regulation.
Since the overall sequence identity of R3 RPTPs is very low the investigation
of glycosylation involvement in protein-protein interactions would be of
particular interest in future experiments. Additionally, further experiments are
required to investigate mechanisms involved in regulation of R3 RPTPs’
functions.
200
5.7 Conclusion
The results of this Chapter suggest that all members of R3 RPTP subgroup
have the potential to interact with VE-cadherin via their extracellular domains
in live cells. Although the physiological importance of these interactions is not
yet defined, the observations of this Chapter demonstrate the importance of
the extracellular domain of R3 RPTPs in regulation of their function. Perhaps
substrate specificity is due not to structural similarity but to restricted
expression and localisation of these proteins or could be determined by the
extensive glycosylation of their extracellular domains. Conceivably a protein
could combine selectivity for specific ligands with the flexibility and possibility
for interaction with other ligands that would have different binding affinity and
signalling outcomes. Further experiments would be required to confirm the
interaction between DEP-1, SAP-1 or GLEPP1 with VE-cadherin.

201
Chapter 6
Investigation of potential homodimerisation of R3 RPTPs in live cells
202
6.1 Introduction
Dimerisation has been proposed as one of the regulatory mechanisms of
receptor protein tyrosine phosphatases (RPTPs) but its regulatory role is still
controversial. This proposed regulatory mechanism was based on many
studies showing that receptor protein tyrosine kinases (RPTKs) transduce
signals by ligand-initiated extracellular domain dimerisation to promote in
trans cytoplasmic domain tyrosine phosphorylation and subsequent
assembly of multicomponent signalling complexes. It appeared that ligand-
induced receptor dimerisation brought kinase molecules into close proximity
so that they could phosphorylate one another, leading to stimulation of the
kinase activity (Lemmon and Schlessinger, 1998). In contrast to RPTKs, the
function of RPTPs was shown to be inhibited by dimerisation. For example,
receptor protein tyrosine phosphatase alpha (RPTPα) was shown to exist on
the cell surface as monomers and dimers in equilibrium (Jiang et al, 1999).
RPTPα was shown to form spontaneous dimers and that the dimerisation
was mediated by the N-terminal D1 (active) catalytic domain and
transmembrane region (Jiang et al, 1999). In addition, immunoblotting
analysis revealed that the dimerised form of RPTPα was not able to
dephosphorylate its biological substrate c-Src, suggesting that RPTPα is
negatively regulated by dimerisation (Jiang et al, 1999).
Several studies have explored the potential of R3 subgroup PTPs to homo-
dimerise or form homophilic interactions. However, from the available data it
is difficult to develop a unifying scheme. Some members of R3 RPTPs, such
as GLEPP1 and SAP-1, do show potential dimerisation but the mechanism
of this dimerisation is not well defined. A study by Hower et al (2009) using a
chimeric approach showed that GLEPP1 can form dimers in live cells and
that this dimerisation results in a strong decrease of its intrinsic PTPase
activity, as was confirmed using a biological substrate for GLEPP1,
tropomyosin receptor kinase C (TrkC; a receptor for neurotrophin (NT)-3). In
a similar way to RPTPα, the transmembrane and intracellular domains of
GLEPP1 were sufficient for the observed dimerisation (Hower et al, 2009).
Another member of R3 RPTP subgroup SAP-1 was also shown to form
203
stable homodimers, but in contrast to GLEPP1 the dimerisation of SAP-1
was mediated by its extracellular domain, independently of cytoplasmic and
transmembrane regions. The dimerisation was suggested to be formed
through at least one cysteine (but possibly more, since it has 13 cysteines in
its extracellular domain) that forms disulfide bridges between two SAP-1
proteins (Walchli et al, 2005). Moreover, the same study by Walchli et al
(2005) also showed that SAP-1 efficiently activates its biological substrate c-
Src, but only when SAP-1 is in monomeric form, therefore suggesting that
dimerisation results in reduced catalytic activity of this enzyme (Walchli et al,
2005). The same study by Walchli et al (2005) found no evidence for
dimerisation of other R3 RPTP members. Immunoprecipitation and Western
blot analyses by Takahashi et al (2006) revealed that DEP-1 can also form
dimers as a result of ligand stimulation. It has been demonstrated that
bivalent, but not monovalent, antibody (Ab1) was accompanied by an
increase in CD148-associated PTP activity resulting in significant inhibition of
cell proliferation. Therefore, in contrast to previous observations for GLEPP1
and SAP-1, DEP-1 catalytic activity seems to increase upon ligand-induced
extracellular domain dimerisation. But further work is needed to elucidate the
mechanism of antibody-mediated dimerisation of DEP-1 (Sorby et al, 2001;
Takahashi et al, 2006). VE-PTP did not show any dimerisation under similar
experimental conditions and thus it remains unclear how the function of this
protein is regulated (Walchli et al, 2005).
All the above studies were carried out using immunoprecipitation assays.
The mechanisms regulating R3 RPTPs’ activity are still not fully defined and
further experiments are required to investigate whether the previously used
experimental procedures fully mimic natural regulation of these proteins. It
still remains unclear whether the dimerisation does occur for all R3 RPTPs
and whether it could be induced by an extracellular ligand binding. Based on
studies described above it is becoming apparent that the extracellular
domain and/or transmembrane of these phosphatases plays an important
role in the regulation (either through dimerisation or by any other means) of
their catalytic activities. Thus, further experiments are required to establish
the role of R3 RPTP extracellular domains in dimerisation. Therefore, the aim

204
of this Chapter is to examine whether R3 RPTP members can form dimers
via their extracellular and/or transmembrane domains in live cells using BiFC
assay.
205
6.2 Results
6.2.1 Fusion proteins
VE-PTP, DEP-1, SAP-1 and GLEPP1 fusion constructs were generated as
outlined in the schema in Chapter 2 (Figure 8). Each construct for each
protein was generated as N- and C-terminal YFP fragment fusion as
described in result sections of Chapters 4 and 5. The generation process of
the negative control fusion constructs SPN-VC and Myr-VC is shown in
Chapter 4. Throughout all BiFC experiments the same negative controls
fused to the C-terminal part of the YFP were used in order to keep all the
conditions constant as the position of the fused YFP fragment can affect the
interaction of proteins and thus make data interpretation difficult. R3 RPTP
fusion constructs are schematically shown in Figure 47 (Chapter 5).
6.3 Western blot analysis of BiFC fusion proteins in HEK293T cells
Expression of the constructs used in this chapter has been previously
assessed in Chapters 4 and 5 (refer to Figures 31 and 53). Western blotting
of lysates from transiently transfected HEK293T cells confirmed the
expression of all the fusion proteins above their predicted molecular weight,
indicating the presence of extensive glycosylation in their extracellular
domains. VE-PTP-VN, DEP-1-VN, SAP-1-VN, GLEPP1-VN, SPN-VN
appeared to be expressed at higher levels compared with their
corresponding –VC fusions, (Figures 31 and 53). Both GLEPP1-VN and
GLEPP1-VC fusion proteins appeared to be expressed at lower levels
compared with all other fusion proteins (Figure 53, A-D). Western blotting
was performed at least three times for each fusion construct and the results
were consistent.
206
6.4 Investigation of homodimerisation of R3 RPTPs in live cells using BiFC technique
To investigate the role of the extracellular domain in dimerisation each
construct consisting of extracellular and transmembrane domains was
generated as N- and C-terminal YFP fragment fusions (as described in
Chapters 4 and 5). Although the dimerisation of R3 RPTPs has been studied
before, no previous studies have been done in live cells to investigate the
molecular basis of dimer formation. In addition, no studies had been carried
out on the specific role of R3 RPTP extracellular domain in dimerisation.
Each N-terminal YFP fragment fusion protein was co-expressed with the
corresponding C-terminal YFP fragment fusion protein (e.g. DEP-1-VN and
DEP-1-VC) in HEK293T cells and 24 hours post-transfection stained prior to
confocal visualisation with the CellMaskTM Plasma Membrane Stain (as
detailed in method section 2.5.6). In addition, to establish the specificity of
BiFC signal, each N-terminal R3 RPTP fusion construct was co-expressed
with each control C-terminal fusion construct (SPN-VC and Myr-VC). All the
transfection conditions and parameters of confocal analyses were kept
constant for all the experiments.
Co-expression of VE-PTP-VN and VE-PTP-VC resulted in a strong
fluorescence signal (Figure 69). Co-expression of VE-PTP-VN with either
SPN-VC or Myr-VC also resulted in a fluorescence signal, but the intensity of
the signal and the number of cells exhibiting the signal appeared to be
reduced (Figure 70, A and B). The same pattern was also observed with
other members of R3 RPTPs. Co-expression of DEP-1-VN/DEP-1-VC, SAP-
1-VN/SAP-1-VC or GLEPP1-VN/GLEPP1-VC resulted in an abundant
fluorescence signal and the signal appeared to be reduced when either DEP-
1-VN, SAP-1-VN or GLEPP1-VN was co-expressed with either SPN-VC or
Myr-VC (Figures 71, 72, 73, 74, 75 and 76). Comparison of the sub-cellular
localisation of the yellow fluorescence signal with that of the red fluorescence
signal from plasma membrane stain indicated that the fluorescence
complementation signal was detected in the plasma membrane and some

207
intracellular structures, likely to be the endoplasmic reticulum and Golgi, of
co-transfected cells.
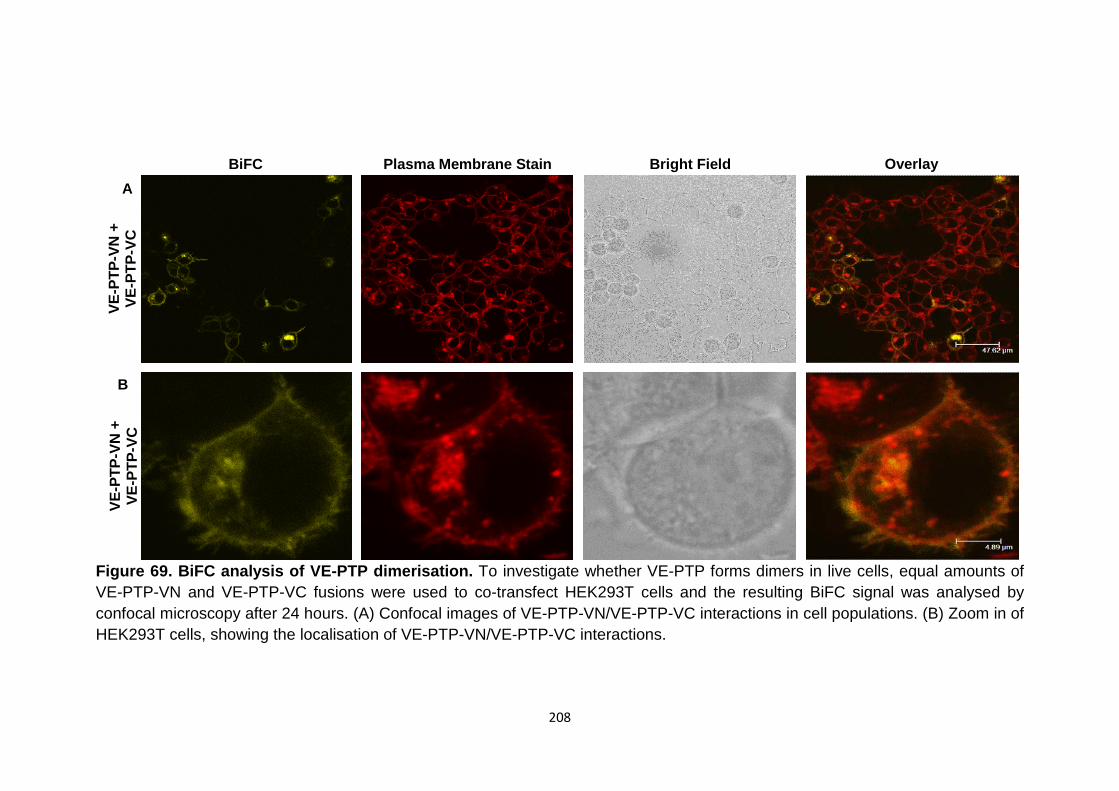
208
Figure 69. BiFC analysis of VE-PTP dimerisation. To investigate whether VE-PTP forms dimers in live cells, equal amounts of VE-PTP-VN and VE-PTP-VC fusions were used to co-transfect HEK293T cells and the resulting BiFC signal was analysed by confocal microscopy after 24 hours. (A) Confocal images of VE-PTP-VN/VE-PTP-VC interactions in cell populations. (B) Zoom in of HEK293T cells, showing the localisation of VE-PTP-VN/VE-PTP-VC interactions.
Overlay Bright Field Plasma Membrane Stain BiFC
VE-P
TP-V
N +
VE
-PTP
-VC
A
B
VE-P
TP-V
N +
VE
-PTP
-VC
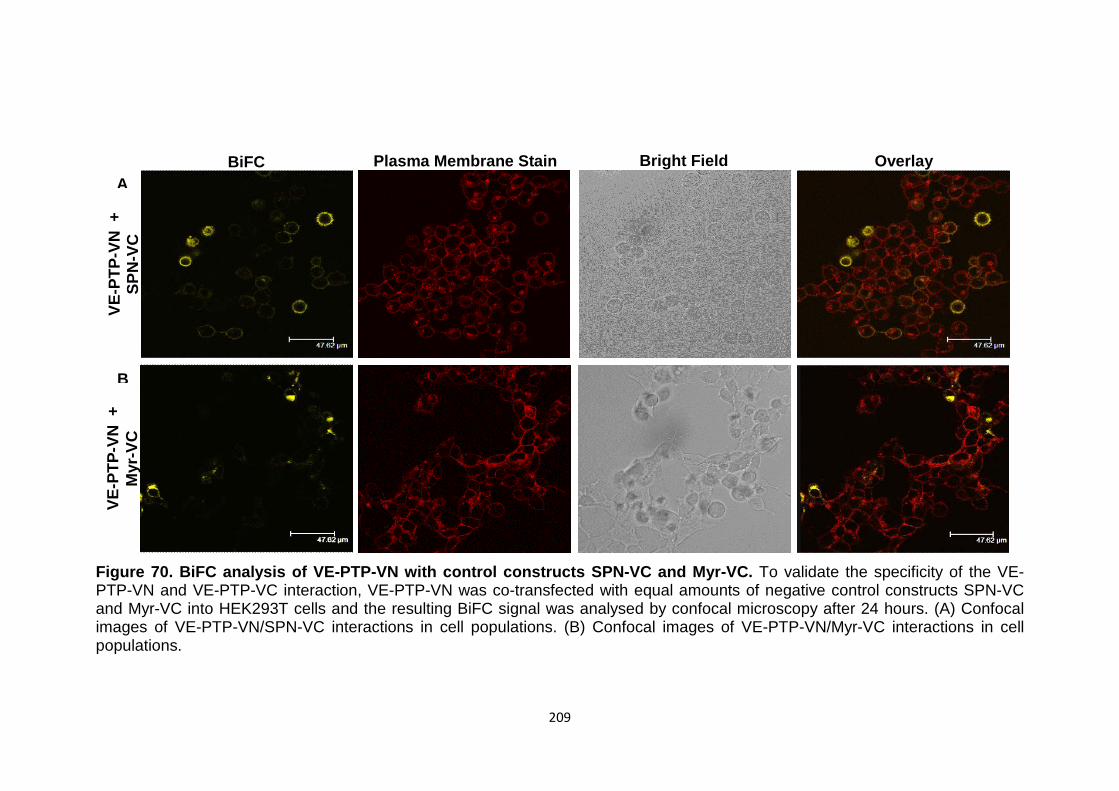
209
Figure 70. BiFC analysis of VE-PTP-VN with control constructs SPN-VC and Myr-VC. To validate the specificity of the VE-PTP-VN and VE-PTP-VC interaction, VE-PTP-VN was co-transfected with equal amounts of negative control constructs SPN-VC and Myr-VC into HEK293T cells and the resulting BiFC signal was analysed by confocal microscopy after 24 hours. (A) Confocal images of VE-PTP-VN/SPN-VC interactions in cell populations. (B) Confocal images of VE-PTP-VN/Myr-VC interactions in cell populations.
Overlay Bright Field Plasma Membrane Stain BiFC A
VE-P
TP-V
N +
SP
N-V
C
B
VE-P
TP-V
N +
M
yr-V
C
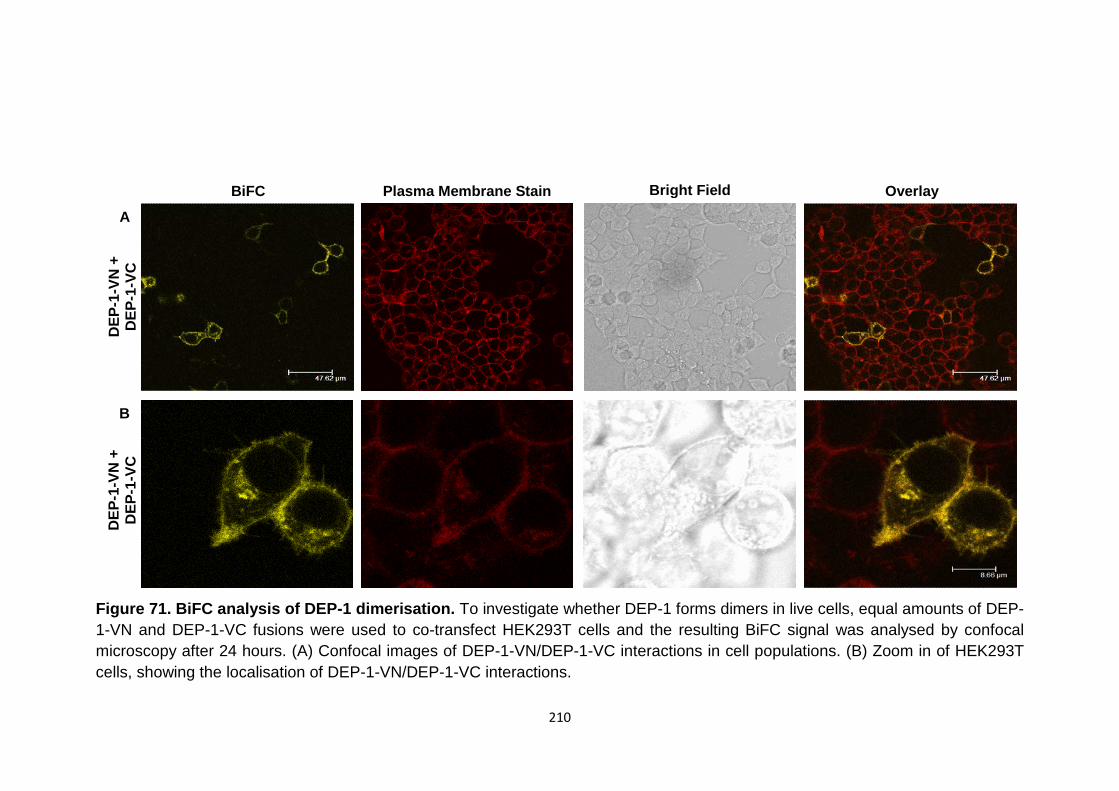
210
Figure 71. BiFC analysis of DEP-1 dimerisation. To investigate whether DEP-1 forms dimers in live cells, equal amounts of DEP-1-VN and DEP-1-VC fusions were used to co-transfect HEK293T cells and the resulting BiFC signal was analysed by confocal microscopy after 24 hours. (A) Confocal images of DEP-1-VN/DEP-1-VC interactions in cell populations. (B) Zoom in of HEK293T cells, showing the localisation of DEP-1-VN/DEP-1-VC interactions.
Overlay Bright Field Plasma Membrane Stain BiFC
DEP
-1-V
N +
D
EP-1
-VC
A
B
DEP
-1-V
N +
D
EP-1
-VC
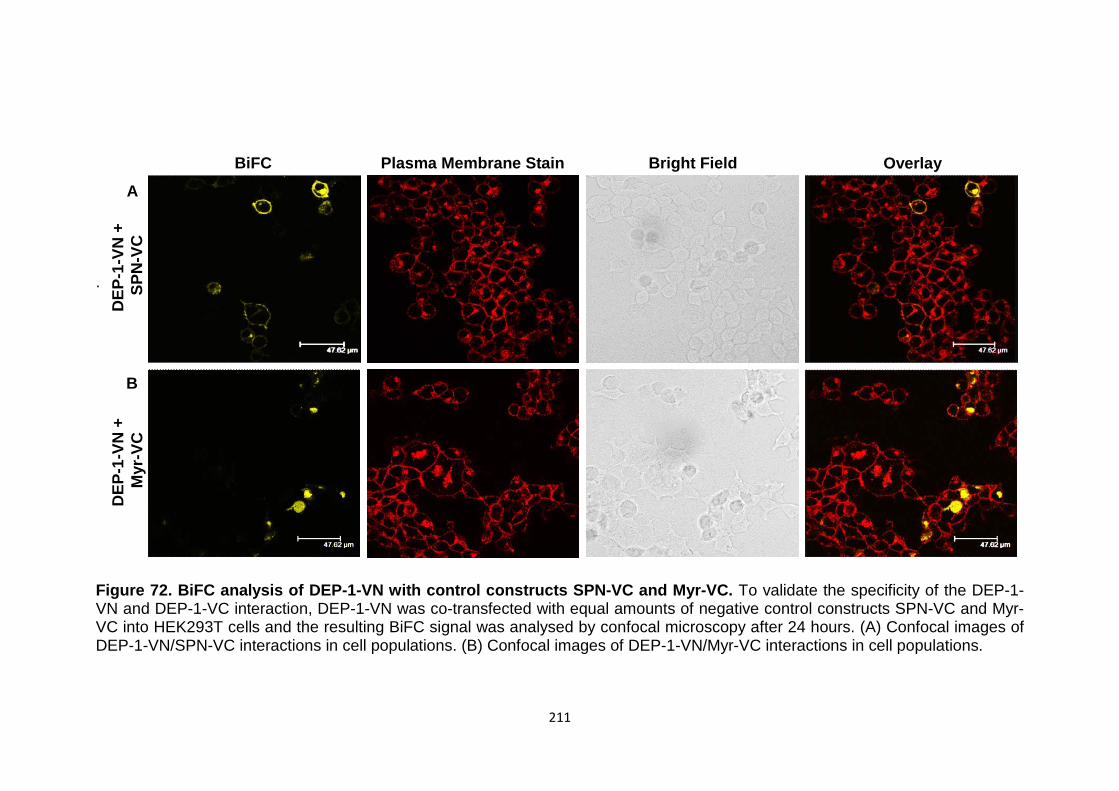
211
.
Figure 72. BiFC analysis of DEP-1-VN with control constructs SPN-VC and Myr-VC. To validate the specificity of the DEP-1-VN and DEP-1-VC interaction, DEP-1-VN was co-transfected with equal amounts of negative control constructs SPN-VC and Myr-VC into HEK293T cells and the resulting BiFC signal was analysed by confocal microscopy after 24 hours. (A) Confocal images of DEP-1-VN/SPN-VC interactions in cell populations. (B) Confocal images of DEP-1-VN/Myr-VC interactions in cell populations.
Overlay Bright Field Plasma Membrane Stain BiFC
DEP
-1-V
N +
S
PN-V
C
DEP
-1-V
N +
M
yr-V
C
A
B
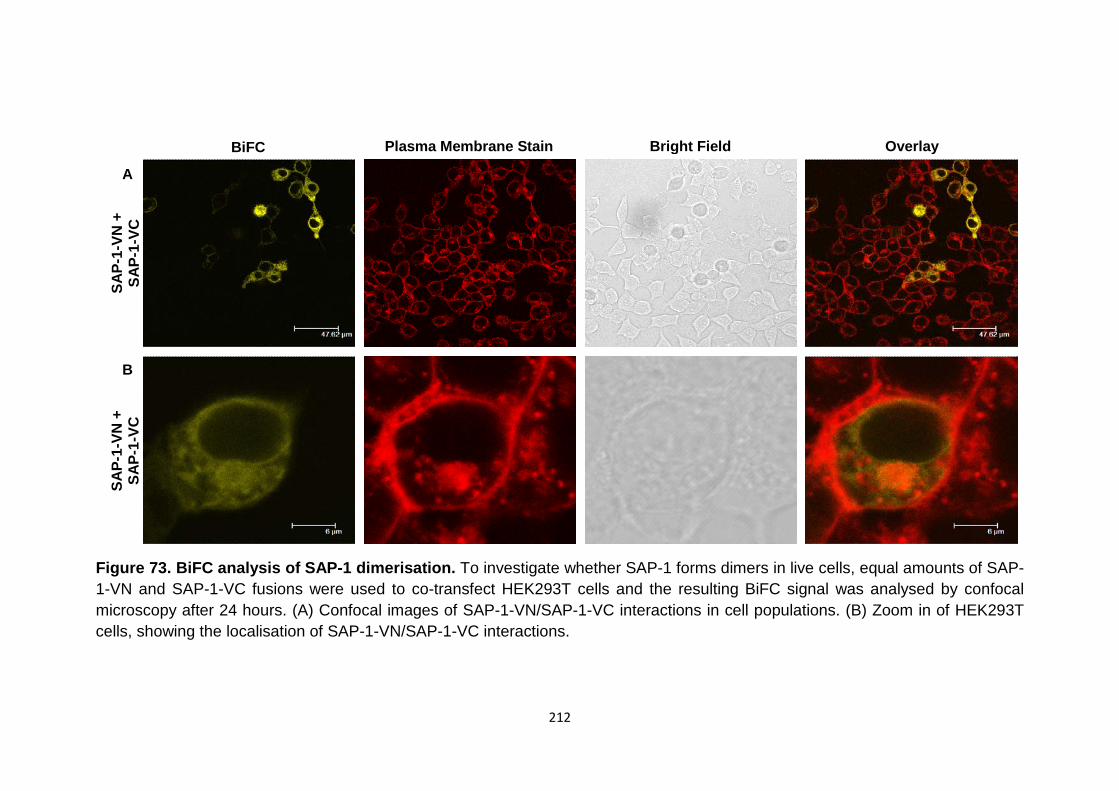
212
Figure 73. BiFC analysis of SAP-1 dimerisation. To investigate whether SAP-1 forms dimers in live cells, equal amounts of SAP-1-VN and SAP-1-VC fusions were used to co-transfect HEK293T cells and the resulting BiFC signal was analysed by confocal microscopy after 24 hours. (A) Confocal images of SAP-1-VN/SAP-1-VC interactions in cell populations. (B) Zoom in of HEK293T cells, showing the localisation of SAP-1-VN/SAP-1-VC interactions.
B
A
SAP-
1-VN
+
SAP-
1-VC
Overlay Bright Field Plasma Membrane Stain BiFC
SAP-
1-VN
+
SAP-
1-VC
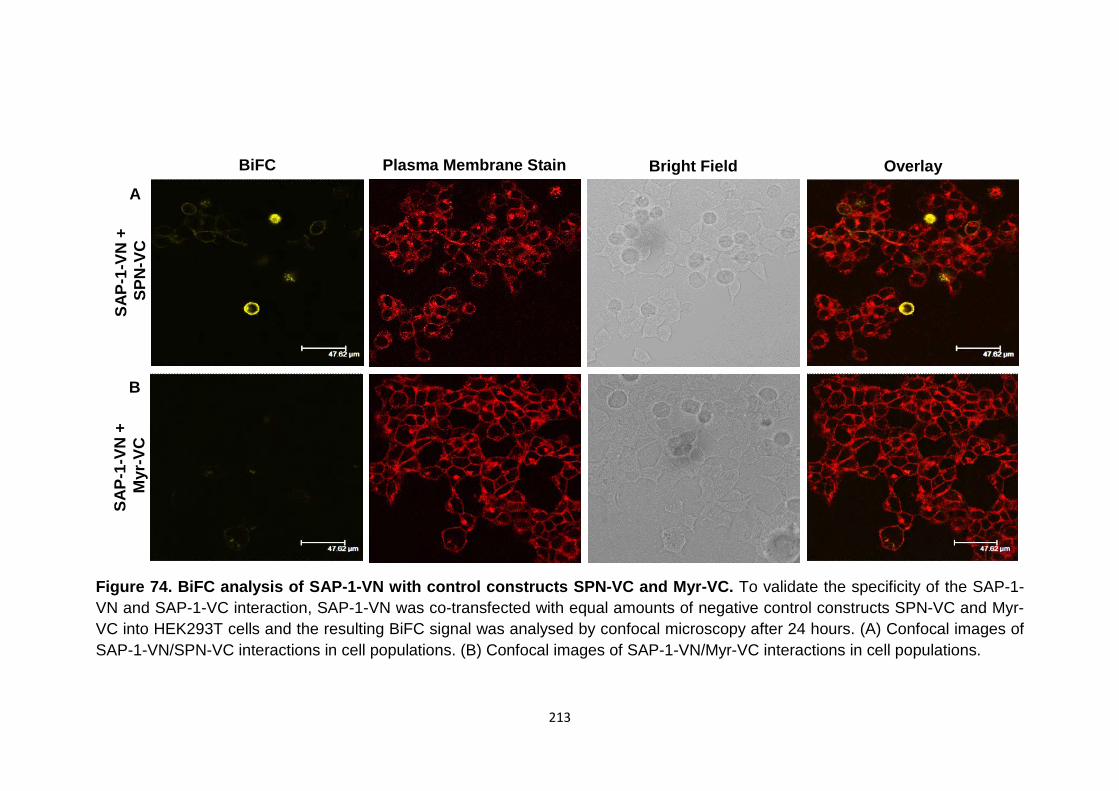
213
Figure 74. BiFC analysis of SAP-1-VN with control constructs SPN-VC and Myr-VC. To validate the specificity of the SAP-1-VN and SAP-1-VC interaction, SAP-1-VN was co-transfected with equal amounts of negative control constructs SPN-VC and Myr-VC into HEK293T cells and the resulting BiFC signal was analysed by confocal microscopy after 24 hours. (A) Confocal images of SAP-1-VN/SPN-VC interactions in cell populations. (B) Confocal images of SAP-1-VN/Myr-VC interactions in cell populations.
SAP-
1-VN
+
SPN
-VC
SA
P-1-
VN +
M
yr-V
C
A
B
Overlay Bright Field Plasma Membrane Stain BiFC
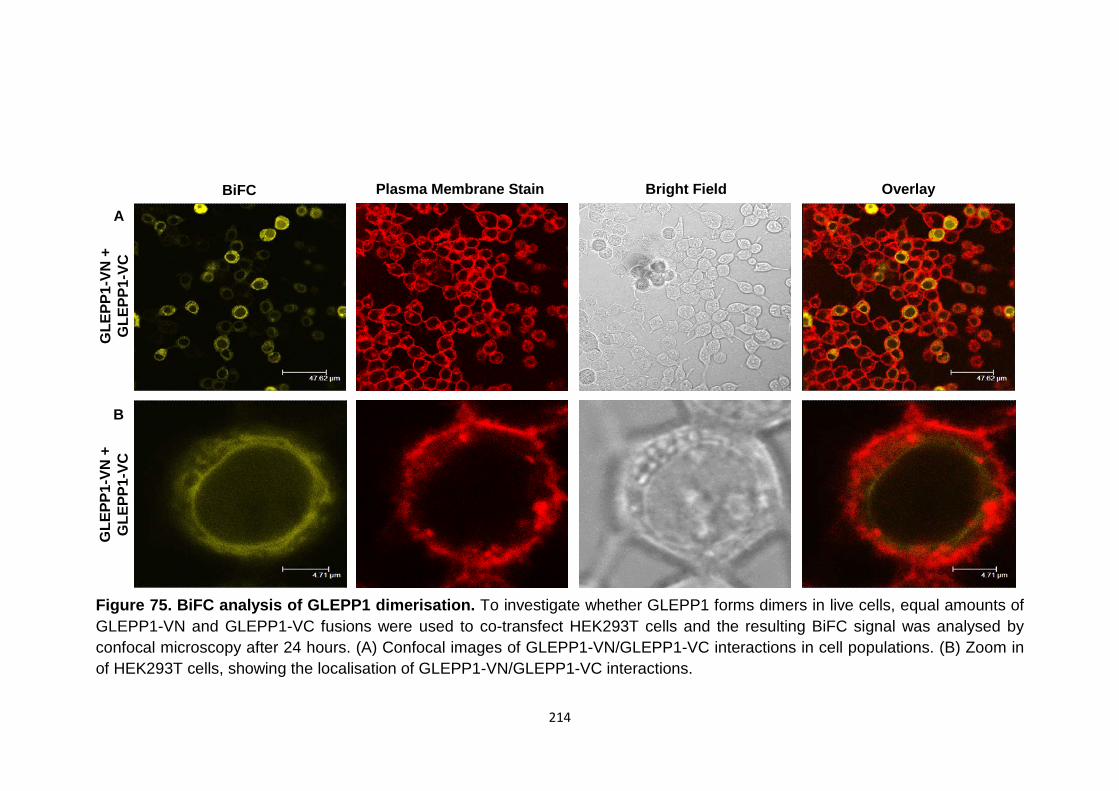
214
Figure 75. BiFC analysis of GLEPP1 dimerisation. To investigate whether GLEPP1 forms dimers in live cells, equal amounts of GLEPP1-VN and GLEPP1-VC fusions were used to co-transfect HEK293T cells and the resulting BiFC signal was analysed by confocal microscopy after 24 hours. (A) Confocal images of GLEPP1-VN/GLEPP1-VC interactions in cell populations. (B) Zoom in of HEK293T cells, showing the localisation of GLEPP1-VN/GLEPP1-VC interactions.
Overlay Bright Field Plasma Membrane Stain BiFC
GLE
PP1-
VN +
G
LEPP
1-VC
A
GLE
PP1-
VN +
G
LEPP
1-VC
B
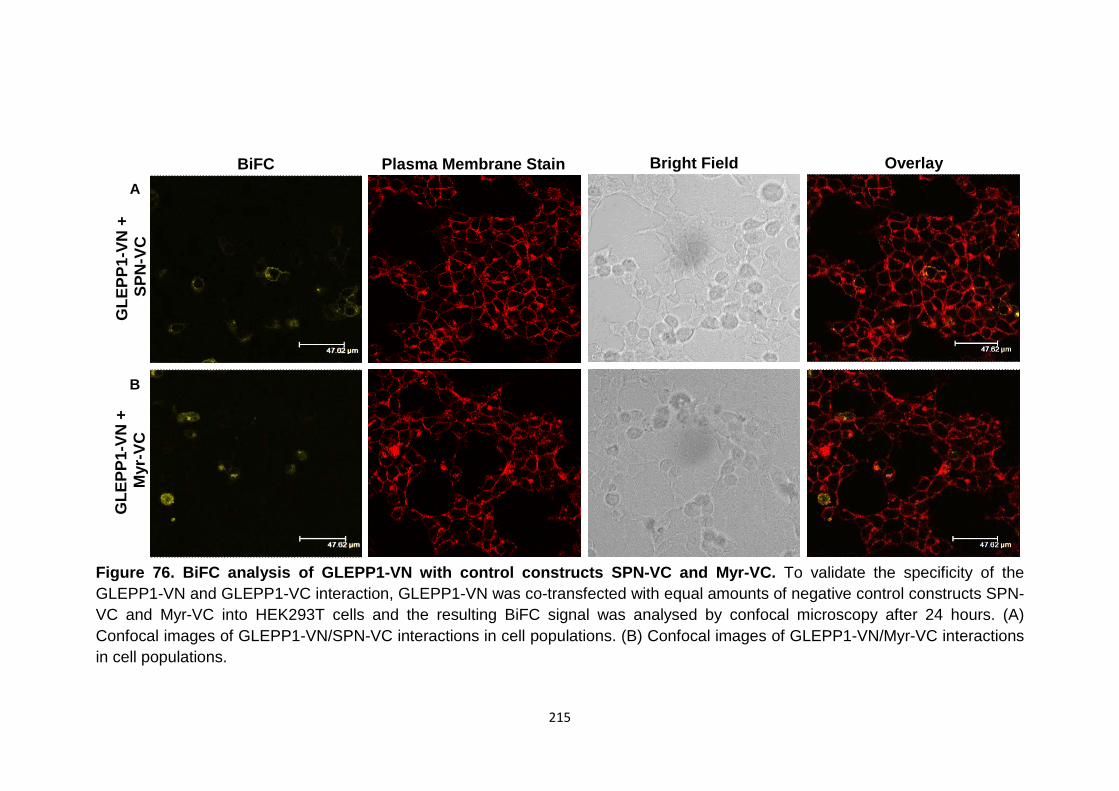
215
Figure 76. BiFC analysis of GLEPP1-VN with control constructs SPN-VC and Myr-VC. To validate the specificity of the GLEPP1-VN and GLEPP1-VC interaction, GLEPP1-VN was co-transfected with equal amounts of negative control constructs SPN-VC and Myr-VC into HEK293T cells and the resulting BiFC signal was analysed by confocal microscopy after 24 hours. (A) Confocal images of GLEPP1-VN/SPN-VC interactions in cell populations. (B) Confocal images of GLEPP1-VN/Myr-VC interactions in cell populations.
Overlay Bright Field Plasma Membrane Stain BiFC
GLE
PP1-
VN +
S
PN-V
C
GLE
PP1-
VN +
M
yr-V
C
A
B
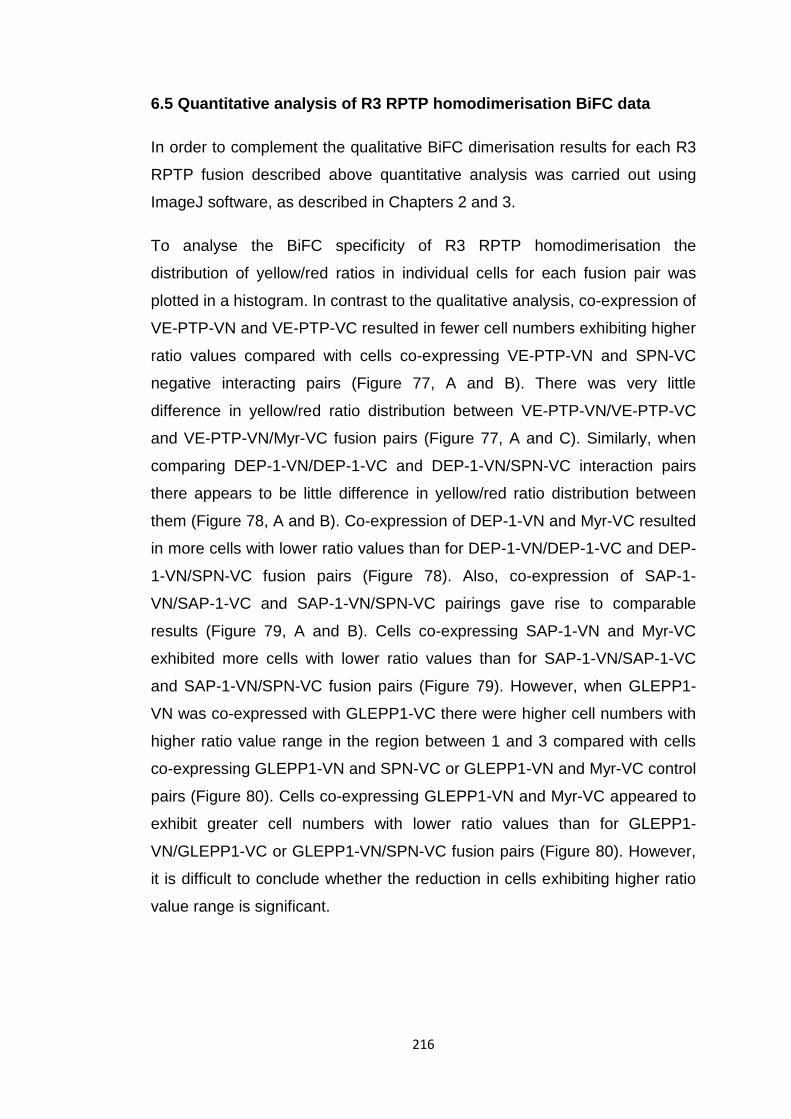
216
6.5 Quantitative analysis of R3 RPTP homodimerisation BiFC data
In order to complement the qualitative BiFC dimerisation results for each R3
RPTP fusion described above quantitative analysis was carried out using
ImageJ software, as described in Chapters 2 and 3.
To analyse the BiFC specificity of R3 RPTP homodimerisation the
distribution of yellow/red ratios in individual cells for each fusion pair was
plotted in a histogram. In contrast to the qualitative analysis, co-expression of
VE-PTP-VN and VE-PTP-VC resulted in fewer cell numbers exhibiting higher
ratio values compared with cells co-expressing VE-PTP-VN and SPN-VC
negative interacting pairs (Figure 77, A and B). There was very little
difference in yellow/red ratio distribution between VE-PTP-VN/VE-PTP-VC
and VE-PTP-VN/Myr-VC fusion pairs (Figure 77, A and C). Similarly, when
comparing DEP-1-VN/DEP-1-VC and DEP-1-VN/SPN-VC interaction pairs
there appears to be little difference in yellow/red ratio distribution between
them (Figure 78, A and B). Co-expression of DEP-1-VN and Myr-VC resulted
in more cells with lower ratio values than for DEP-1-VN/DEP-1-VC and DEP-
1-VN/SPN-VC fusion pairs (Figure 78). Also, co-expression of SAP-1-
VN/SAP-1-VC and SAP-1-VN/SPN-VC pairings gave rise to comparable
results (Figure 79, A and B). Cells co-expressing SAP-1-VN and Myr-VC
exhibited more cells with lower ratio values than for SAP-1-VN/SAP-1-VC
and SAP-1-VN/SPN-VC fusion pairs (Figure 79). However, when GLEPP1-
VN was co-expressed with GLEPP1-VC there were higher cell numbers with
higher ratio value range in the region between 1 and 3 compared with cells
co-expressing GLEPP1-VN and SPN-VC or GLEPP1-VN and Myr-VC control
pairs (Figure 80). Cells co-expressing GLEPP1-VN and Myr-VC appeared to
exhibit greater cell numbers with lower ratio values than for GLEPP1-
VN/GLEPP1-VC or GLEPP1-VN/SPN-VC fusion pairs (Figure 80). However,
it is difficult to conclude whether the reduction in cells exhibiting higher ratio
value range is significant.
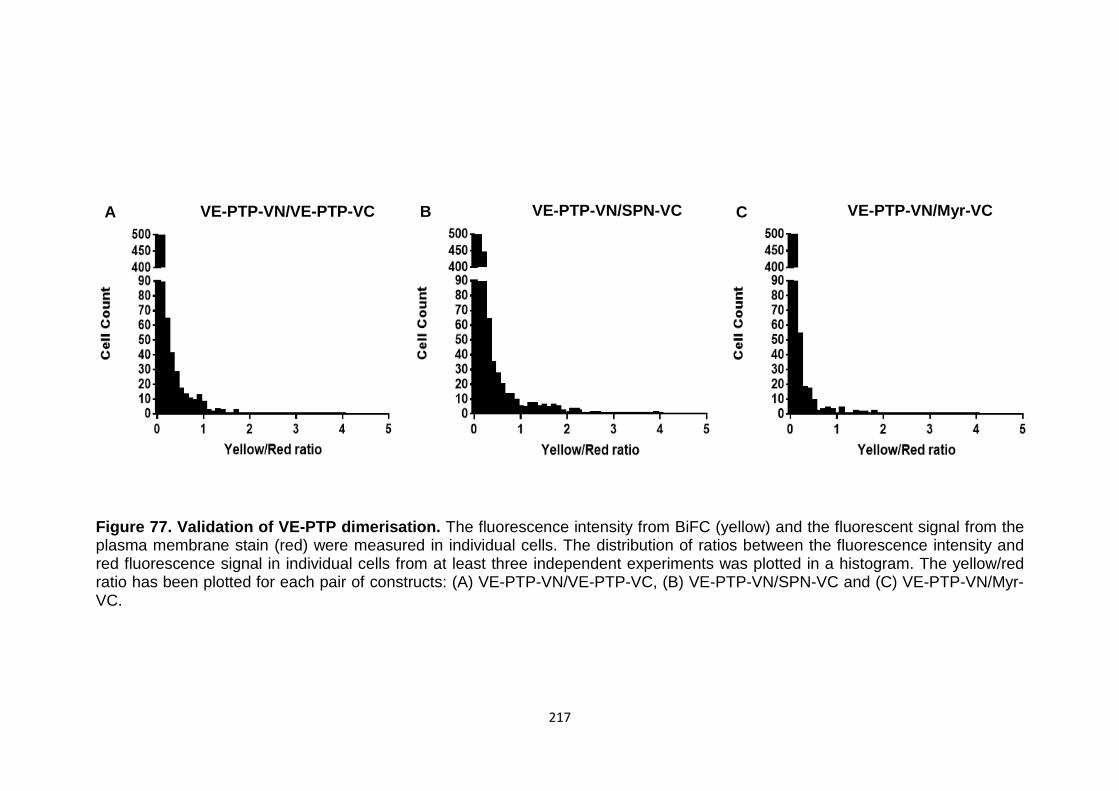
217
Figure 77. Validation of VE-PTP dimerisation. The fluorescence intensity from BiFC (yellow) and the fluorescent signal from the plasma membrane stain (red) were measured in individual cells. The distribution of ratios between the fluorescence intensity and red fluorescence signal in individual cells from at least three independent experiments was plotted in a histogram. The yellow/red ratio has been plotted for each pair of constructs: (A) VE-PTP-VN/VE-PTP-VC, (B) VE-PTP-VN/SPN-VC and (C) VE-PTP-VN/Myr-VC.
A B C VE-PTP-VN/VE-PTP-VC VE-PTP-VN/SPN-VC VE-PTP-VN/Myr-VC
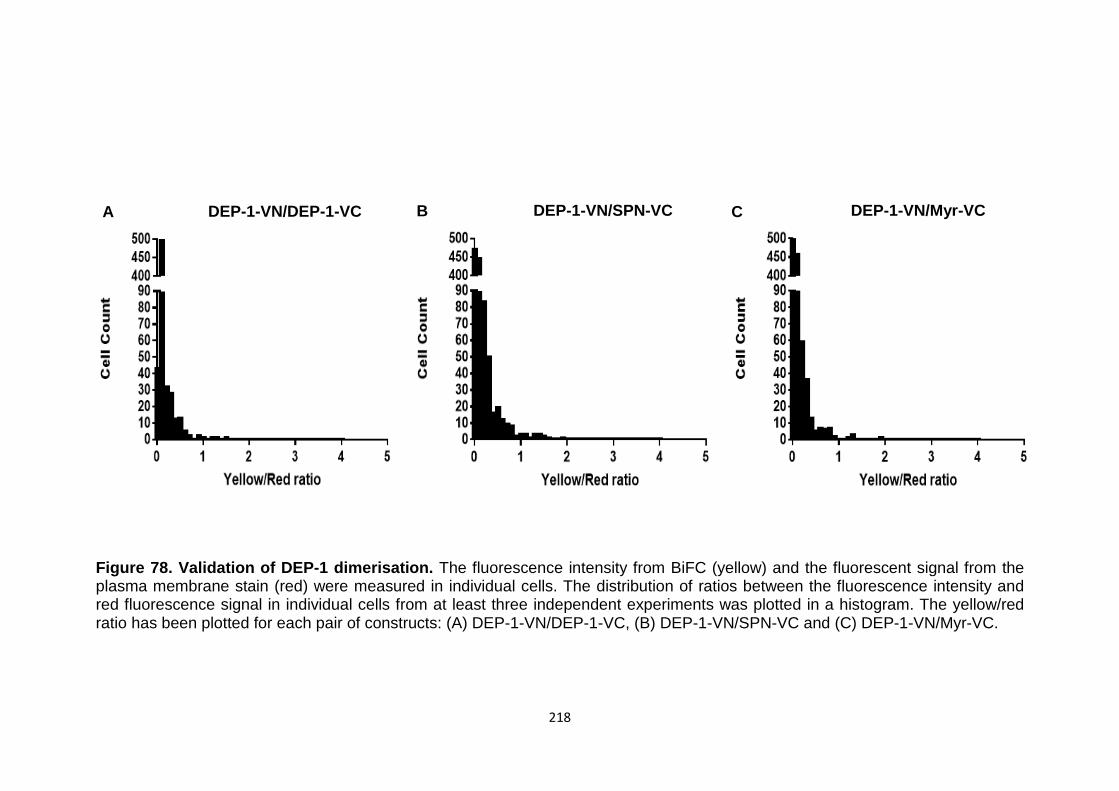
218
Figure 78. Validation of DEP-1 dimerisation. The fluorescence intensity from BiFC (yellow) and the fluorescent signal from the plasma membrane stain (red) were measured in individual cells. The distribution of ratios between the fluorescence intensity and red fluorescence signal in individual cells from at least three independent experiments was plotted in a histogram. The yellow/red ratio has been plotted for each pair of constructs: (A) DEP-1-VN/DEP-1-VC, (B) DEP-1-VN/SPN-VC and (C) DEP-1-VN/Myr-VC.
A B C DEP-1-VN/DEP-1-VC DEP-1-VN/SPN-VC DEP-1-VN/Myr-VC
219
Figure 79. Validation of SAP-1 dimerisation. The fluorescence intensity from BiFC (yellow) and the fluorescent signal from the plasma membrane stain (red) were measured in individual cells. The distribution of ratios between the fluorescence intensity and red fluorescence signal in individual cells from at least three independent experiments was plotted in a histogram. The yellow/red ratio has been plotted for each pair of constructs: (A) SAP-1-VN/SAP-1-VC, (B) SAP-1-VN/SPN-VC and (C) SAP-1-VN/Myr-VC.
A B C SAP-1-VN/SAP-1-VC SAP-1-VN/SPN-VC SAP-1-VN/Myr-VC
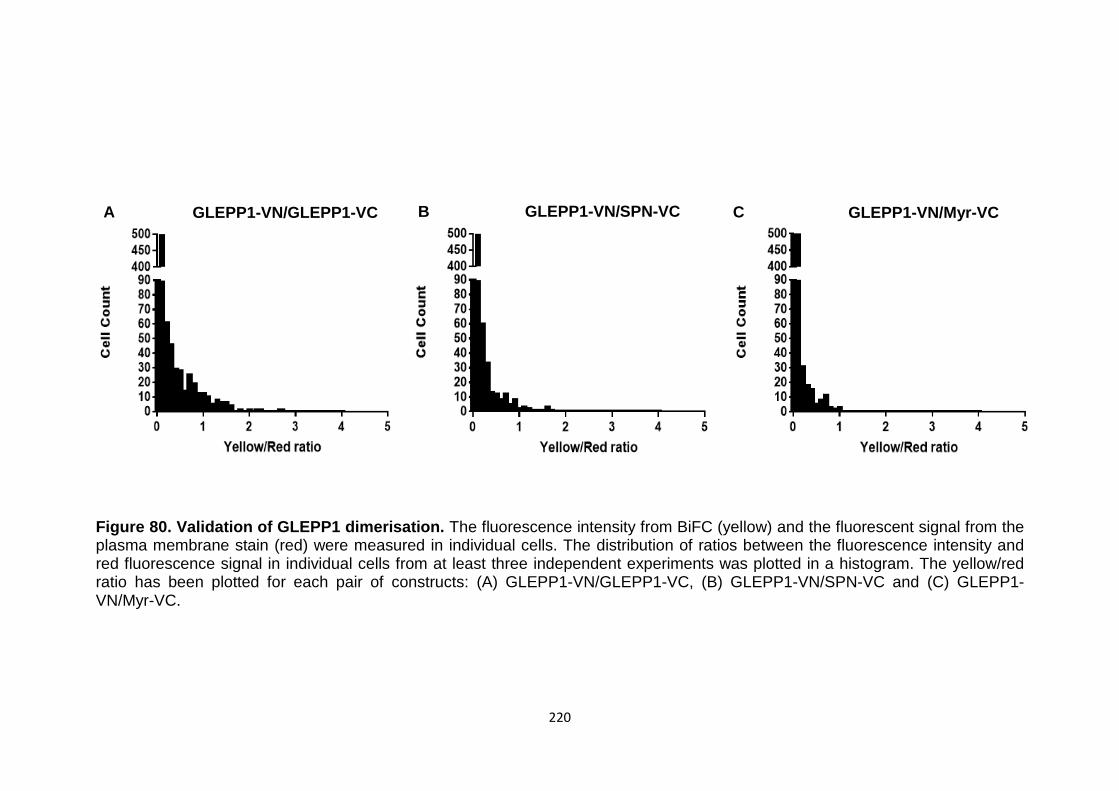
220
Figure 80. Validation of GLEPP1 dimerisation. The fluorescence intensity from BiFC (yellow) and the fluorescent signal from the plasma membrane stain (red) were measured in individual cells. The distribution of ratios between the fluorescence intensity and red fluorescence signal in individual cells from at least three independent experiments was plotted in a histogram. The yellow/red ratio has been plotted for each pair of constructs: (A) GLEPP1-VN/GLEPP1-VC, (B) GLEPP1-VN/SPN-VC and (C) GLEPP1-VN/Myr-VC.
A B C GLEPP1-VN/GLEPP1-VC GLEPP1-VN/SPN-VC GLEPP1-VN/Myr-VC
221
The BiFC specificity was also determined by measuring signal-to-noise (S/N)
ratio as described in Chapters 3 and 4 by dividing the median value of the
positive interacting pair by that of the negative interacting pair. Therefore, for
the Myr-VC-containing interacting pair the S/N ratio value was always 1,
representing the background fluorescence. A higher S/N ratio value reflects a
more specific interaction. The S/N ratio value was calculated for each
interacting fusion pair, including control fusion pairs, to establish how much
fluorescence signal was formed due to YFP fragments self-assembly. In
addition, the average fluorescence intensities were compared in all
interacting pairs as described in Chapters 3 and 4.
The S/N ratio value for VE-PTP-VN/VE-PTP-VC was 2.4 (Figure 81).
Unexpectedly, although the S/N ratio value decreased to 1.5 in VE-PTP-
VN/SPN-VC control pair, there was no significant difference in average
fluorescence intensity between both fusion pairs (Figures 81 and 82). The
S/N for VE-PTP-VN/Myr-VC control pair was 2.4 x lower than for VE-PTP-
VN/VE-PTP-VC fusion pair (Figure 81). The average fluorescence intensity
for VE-PTP-VN/Myr-VC was significantly reduced compared with VE-PTP-
VN/VE-PTP-VC and VE-PTP-VN/SPN-VC fusion pairs (Figure 82). However,
these results are considerably lower when comparing with VE-PTP-VN/VE-
cadherin interacting pair, suggesting that perhaps VE-PTP does not form
homodimers. The average fluorescence intensity for VE-PTP-VN/VE-
cadherin-VC was 1.9 x higher and the S/N was 2.7 x higher than for VE-PTP-
VN/VE-PTP-VC (Figures 40 and 41). These results suggest that VE-PTP
does not homodimerise via its extracellular domain and the fluorescence
signal was more likely due to non-specific YFP fragments interactions.
Interestingly the average fluorescence intensity in cells co-expressing DEP-
1-VN/DEP-1-/VC was significantly lower (about 1.6 x) compared with cells
co-expressing DEP-1-VN/SPN-VC (Figure 82). However, the average
fluorescence intensity for both DEP-1-VN/DEP-1-VC and DEP-1-VN/SPN-VC
interacting pairs was significantly higher than for DEP-1-VN/Myr-VC control
pair (Figure 82). Both DEP-1-VN/DEP-1-VC and DEP-1-VN/SPN-VC fusion
pairs resulted in the same S/N ratio value of 3.7, which was 3.7 x higher than
222
for DEP-1-VN/Myr-VC control pair (Figure 81). Similarly to VE-PTP, DEP-1-
VN/DEP-1-VC co-expression resulted in a significantly lower average
fluorescence intensity than for DEP-1-VN/VE-cadherin-VC (Figures 67 and
82). These results suggest that perhaps DEP-1 does not readily form
homodimers.
On the other hand, S/N ratio value and average fluorescence intensity for
SAP-1-VN/SAP-1-VC were significantly higher than for negative interacting
pairs SAP-1-VN/SPN-VC and SAP-1-VN/Myr-VC by 1.85- and 1.6-fold
respectively (Figures 81 and 82). The average fluorescence intensity in cells
co-expressing SAP-1-VN/SAP-1-VC appears to be similar to fluorescence
intensity in cells co-expressing SAP-1-VN/VE-cadherin/VC (Figures 67 and
82). However, S/N ratio value for SAP-1-VN/Sap-1-VC appears to be much
lower than for SAP-1-VN/VE-cadherin-VC (Figures 66 and 81). These results
suggest that SAP-1 has the potential to form homodimers via its extracellular
domains.
S/N ratio value for GLEPP1-VN/GLEPP1-VC was 4.8-fold higher than for
GLEPP1-VN/SPN-VC and 10.5-fold higher compared with GLEPP1-VN/Myr-
VC (Figure 81). The average fluorescence intensity in cells co-transfected
with GLEPP1-VN/GLEPP1-VC was significantly higher compared with cells
co-transfected with GLEPP1-VN/SPN-VC and GLEPP1-VN/Myr-VC. The
average fluorescence intensity for GLEPP1-VN/GLEPP1-VC was 2.2 x
higher than for GLEPP1-VN/SPN-VC and 4.5 x higher than GLEPP1-
VN/Myr-VC (Figure 82). S/N ratio value and average fluorescence intensity
for GLEPP1-VN/GLEPP1-VC were both higher than the values obtained for
GLEPP1-VN/VE-cadherin-VC (Figures 66, 67, 81 and 82). All three methods
of analysis complement each other, suggesting that GLEPP1 has the
potential to form homodimers via its extracellular domain.
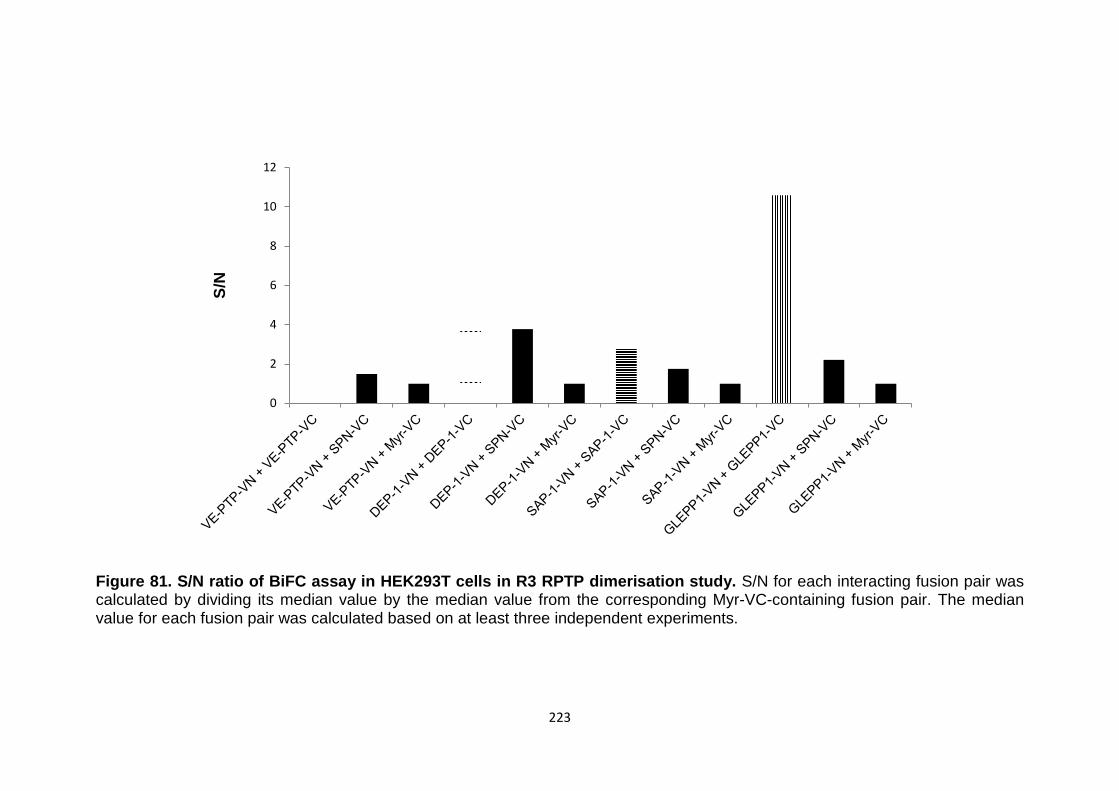
223
Figure 81. S/N ratio of BiFC assay in HEK293T cells in R3 RPTP dimerisation study. S/N for each interacting fusion pair was calculated by dividing its median value by the median value from the corresponding Myr-VC-containing fusion pair. The median value for each fusion pair was calculated based on at least three independent experiments.
0
2
4
6
8
10
12
S/N
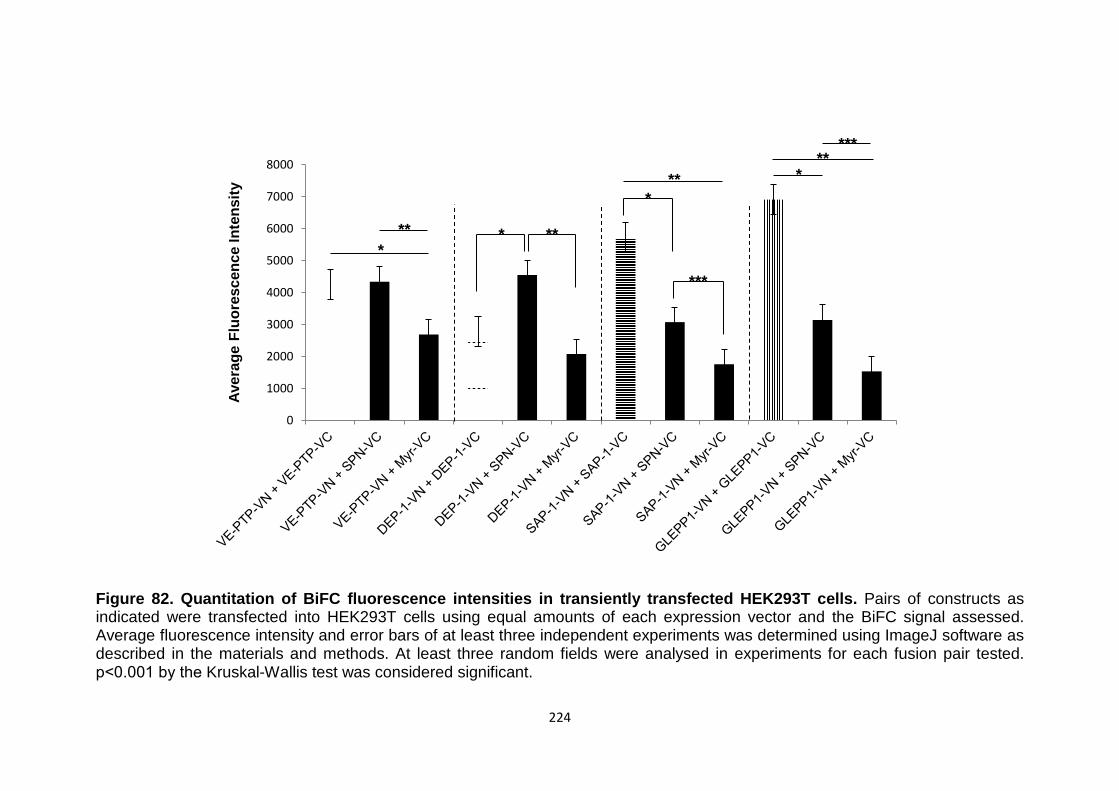
224
Figure 82. Quantitation of BiFC fluorescence intensities in transiently transfected HEK293T cells. Pairs of constructs as indicated were transfected into HEK293T cells using equal amounts of each expression vector and the BiFC signal assessed. Average fluorescence intensity and error bars of at least three independent experiments was determined using ImageJ software as described in the materials and methods. At least three random fields were analysed in experiments for each fusion pair tested. p˂0.001 by the Kruskal-Wallis test was considered significant.
0
1000
2000
3000
4000
5000
6000
7000
8000
Aver
age
Fluo
resc
ence
Inte
nsity
**
***
* * **
***
*
** ** *
225
6.6 Evaluating the fraction of BiFC constructs in the plasma membrane
Since generation of fusion proteins and deletion of the intracellular
sequence, as in this study, may affect the sub-cellular localisation of the
protein, I assessed the fraction of the DEP-1-VN construct present in the
plasma membrane relative to total cell expression and compared this with a
full-length DEP-1 expression construct. This was achieved essentially as
described in van der Wijk et al (2005). Briefly, using cells transfected with
either DEP-1-VN or DEP-1 full-length constructs, the constructs were
immunoprecipitated from whole cell lysates or immunoprecipitated after
adding the anti-myc antibody to intact cells, to detect cell-surface expression
only. The amount of immunoprecipitated protein was assessed by Western
blotting. So far the results were obtained only for DEP-1-VN fusion construct
due to availability of the corresponding full-length expression vector.
Nonetheless the results could be potentially extrapolated to other similar R3
RPTP constructs.
Comparison of the fraction of cell-surface expression of the DEP-1-VN
construct, relative to total DEP-1-VN expression, with the fraction of cell-
surface expression of full-length DEP-1 (Fig. 83) indicated that the BiFC
construct exhibited a similar fraction of cell-surface expression as DEP-1,
suggesting that the generation of the fusion protein did not detract from
effective trafficking of the protein. Degradation was not evident (Figure 77),
indicating the cell-surface localisation and protein stability were not
significantly affected by creating the fusions, although it is possible that some
degradation products lacking a myc tag are not detected by this analysis. As
observed in studies investigating interactions with VE-cadherin, in the studies
of homodimerisation in this chapter, a BiFC signal was observed in both the
plasma membrane and an intracellular structure. This is likely to be the rough
endoplasmic reticulum revealing that formation of the BiFC complex between
proteins of interest can occur in the endoplasmic reticulum during the post-
translation modifications prior to trafficking to the plasma membrane.
However, further experiments are required to confirm surface localisation of
all R3 RPTP fusion constructs.
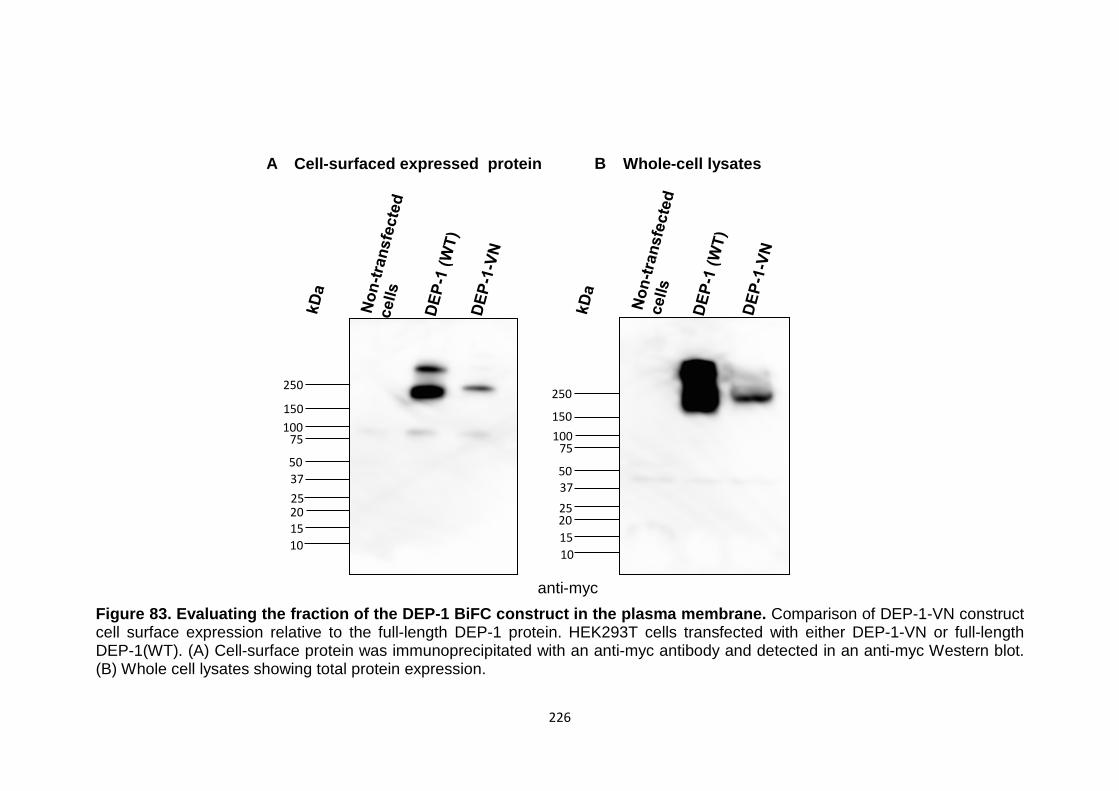
226
Figure 83. Evaluating the fraction of the DEP-1 BiFC construct in the plasma membrane. Comparison of DEP-1-VN construct cell surface expression relative to the full-length DEP-1 protein. HEK293T cells transfected with either DEP-1-VN or full-length DEP-1(WT). (A) Cell-surface protein was immunoprecipitated with an anti-myc antibody and detected in an anti-myc Western blot. (B) Whole cell lysates showing total protein expression.
10 15 20 25
50 75
150 250
100
37
Cell-surfaced expressed protein
10 15 20 25
50 75
150 250
100
37
Whole-cell lysates
anti-myc
A B
227
6.7 Discussion
Dimerisation of R3 RPTPs has been previously studied by co-
immunoprecipitation experiments, though it still remains unclear whether all
R3 RPTP members homodimerise (Hower et al, 2009; Walchli et al, 2005;
Sorby et al, 2001; Takahashi et al, 2006). It has not to date been studied in
live cells and it is not known whether all the members of the R3 subgroup
have the potential to form homodimers. In addition the role of the
extracellular domain of R3 RPTPs in dimerisation remains undefined.
Using the bimolecular fluorescence complementation technique the potential
of R3 RPTPs to homodimerise via their extracellular and transmembrane
domains was examined in live cells. Each BiFC construct consisted of the
ectodomain and transmembrane domain of these molecules (as shown in
Figures 21 and 47). Qualitative and quantitative assessments of the
fluorescence images obtained on co-expression of either VE-PTP-VN/VE-
PTP-VC, DEP-1-VN/DEP-1-VC, SAP-1-VN/SAP-1-VC or GLEPP1-
VN/GLEPP1-VC fusion pairs suggested potential homodimerisation of SAP-1
and GLEPP1 but not VE-PTP and DEP-1. Quantitative assessment of these
interacting pairs indicated that the co-expression of either SAP-1-VN/SAP-1-
VC or GLEPP1-VN/GLEPP1-VC fusion pairs resulted a BiFC signal that was
due to a specific interaction, rather than self-assembly of constructs and
background fluorescence.
The results of this chapter complement previous co-immunoprecipitation
studies that demonstrated SAP-1 homodimerisation is mediated by its
extracellular domain (Walchli et al, 2005). The finding that the extracellular
domain of SAP-1 potentially forms homodimers is reminiscent of the previous
reports on some other transmembrane proteins. For example, it has been
demonstrated that RPTPα exists predominantly as homodimers and that
both its extracellular and transmembrane domains were independently able
to form homodimers though the exact contribution of each of the individual
dimerisation domains has not yet been determined (Jiang et al, 2000).
Interestingly, different isoforms of the same protein can undergo differential
homodimerisation. A study by Xu and Weiss (2002) demonstrated that a
228
smaller isoform of CD45 formed homodimers more rapidly and efficiently
compared with a larger CD45 isoform. The dimerisation was mediated by the
extracellular domain, independently of cytoplasmic tail (Xu and Weiss, 2002).
However, in this chapter the SAP-1 construct consisted of extracellular and
transmembrane domain and there is a possibility that the observed
dimerisation could be mediated by its transmembrane region. Dimerisation of
PTPσ via its transmembrane domain was reported by Lee et al (2015). It has
been demonstrated that the transmembrane was sufficient for at least some
of the homodimerisation, though the intracellular and, to a lesser extent, the
extracellular domain of the protein could also contribute (Lee et al, 2015).
The above results suggest that the dimerisation of RPTPs could be
modulated by multiple domains and the dimerisation does not fit one model.
However, it is becoming apparent that extracellular and/or transmembrane
domains of RPTPs play an important role in their regulation and may have
physiological significance if regulated by ligands leading to changes in
phosphatase activity.
It has been previously shown that GLEPP1 can potentially form homodimers
mediated by its transmembrane and intracellular domains but not
extracellular domain (Walchli et al, 2005; Hower et al, 2009). In a co-
immunoprecipitation study by Hower et al (2009) a GLEPP1 construct was
used in which the extracellular domain had been replaced by a NGF receptor
TrkA and, thus, they could not conclude whether the extracellular domain
has a role in dimerisation or not. In this chapter, however, we show that there
is a potential involvement of the extracellular and transmembrane domains
but not intracellular domain. Both studies (i.e. the study by Hower et al
(2009) and the study of this chapter) were carried out using different
constructs; however in both cases the transmembrane domain of GLEPP1
was present. This suggests that perhaps homodimerisation of GLEPP1 is
mediated by its transmembrane domain. As already mentioned above, there
are many examples of membrane proteins forming homo- and hetero-
oligomers via transmembrane domains, including receptor-type
phosphatases. Dimerisation of sialoglycoprotein in human erythrocyte
membranes glycophorin A (GpA) was extensively studied. A pattern of seven
229
amino acids (L75IXXGVXXGVXXT87 (L, leucine; I, isoleucine; X, any amino
acid; G, glycine; V, valine; T, threonine)) in the transmembrane of GpA was
shown to be sufficient to drive its dimerisation (Lemmon et al, 1994). The
right-handed parallel transmembrane domain α-helices cross at an angle of
40° and form a supercoil with a closely packed interface (ridges-into-grooves
structure). The GXXXG motif (two glycines separated by any three residues)
within the pattern of seven amino acids of GpA was shown to facilitate
specific protein-protein dimerisation as glycine residues stabilise the
structure through Van der Waals interactions and/or hydrogen bonding with
residues on the opposite helix. This brings the interacting helices into close
proximity of each other (Strous and Gent, 2002). Mutation of glycine to
alanine was shown to distract dimerisation. The insertion of this motif into
other hydrophobic sequence backgrounds also led to dimerisation. Genetic
and statistical data suggested that the GXXXG motif is a common framework
for transmembrane domain helix-helix interactions (Strous and Gent, 2002).
These findings propose that many transmembrane domains may contain
information that regulates specific interactions, perhaps common to many
proteins, with functionally important consequences. Indeed, it has been
reported that GXXXG motifs are present in about 12 % of transmembrane
helices (Teese and Langosch, 2015). However, some previous observations
demonstrated that the presence of GXXXG motif is not an indicator of
dimerisation but influenced by sequence context presumably to ensure that
non-specific interactions of transmembrane helices are avoided. Instead, the
conserved transmembrane residues (such as GXXXG motif) could play a
role in a variety of functions, ranging from enhancing helix flexibility, lipid
interactions and cell localisation (Teese and Landosch, 2015). Interestingly,
alignment of the membrane-spanning sequences performed by Chin et al
(2005) revealed that VE-PTP, DEP-1 and SAP-1, but not GLEPP1, contain
such GXXXG motif in their transmembrane domains. In the same study Chin
et al (2005) showed that the transmembrane of DEP-1 was able to self-
interact in the membrane. What is more, G979L and G983L mutations in
GXXXG motif were found the most disruptive (Chin et al, 2005). In the same
study GLEPP1 resulted in the strongest dimerisation signal despite the lack
of GXXXG motif in its transmembrane domain (Chin et al, 2005). This
230
confirmed that more than one sequence motif in one or more domains could
influence the interaction between proteins. In this Chapter, in agreement with
previous findings, the quantitative analysis revealed that the co-expression of
GLEPP1 fusion constructs resulted in the highest average fluorescence
intensity as well as S/N ratio value, suggesting homodimerisation of this
protein. Interestingly though, sedimentation velocity measurements carried
out by Barr et al (2009) showed that GLEPP1 and DEP-1 were entirely
monomeric in solution. The presence of GXXXG motif in the transmembrane
domains of VE-PTP and SAP-1 does not seem to be involved in their
dimerisation as shown by Chin et al (2005). As outlined above, the GXXXG
motif is only a weak predictor of a dimerisation. Based on results obtained in
this project, the dimerisation of SAP-1 is more likely mediated by its
extracellular domain. This is in agreement with previous results obtained by
Walchli et al (2005), showing that the extracellular domain of SAP-1 was
sufficient to facilitate dimerisation, independently of its cytoplasmic and
transmembrane regions. On the other hand, the results on VE-PTP
dimerisation was consistent with the previous study by Chin et al (2005),
showing that this phosphatase does not dimerise. However, similarly to
DEP-1, the dimerisation could still occur on a physiological level as a result
of some ligand binding.
The results obtained in this project also suggest that DEP-1 does not
dimerise, which contradicts some previous findings. As mentioned in the
introduction of this Chapter, the study by Takahashi et al (2006) showed that
the extracellular domain of DEP-1 can form homodimers and that this forced
dimerisation mediated by bivalent antibody increases its activity. A study by
Sorby et al (2001) also demonstrated that DEP-1 activity can be increased
as a result of ligand stimulation. Stimulation of DEP-1 with MatrigelTM (a
preparation of extracellular matrix proteins secreted by Englebreth - Holm -
Swarm mouse sarcoma) had a direct agonistic effect on DEP-1, which was
mediated through interaction with the extracellular domain of DEP-1 (Sorby
et al, 2001). Therefore, despite the results of this Chapter, DEP-1 could still
have the potential to form extracellular ligand-mediated dimers in vivo.
Ligand-induced dimerisation was shown for a cell surface receptor
231
glycoprotein CD36. A study by Daviet et al (1997) demonstrated that CD36
exists predominantly as a monomer, but undergoes homodimerisation upon
extracellular binding of Thrombospondin-1. Thrombospondin-1-induced
dimerisation of CD36 was shown to be implemented in signal transduction of
angiogenic pathways (Daviet et al, 1997).
Dimerisation, whether it is homodimerisation or heterodimerisation,
represents a powerful regulatory mechanism that can have a variety of
functional consequences. Dimerisation between the same members of a
family could have distinct functional specificity, whereas dimerisation
between different members of a protein family can result in functional
diversity, when different protein combinations have distinct regulatory
properties. It is an attractive idea that RPTPs could be regulated by
dimerisation similarly to RPTKs. Understanding the molecular mechanisms
of the regulation of R3 RPTP would potentially assist in drug development for
R3 RPTPs for some diseases, such as some immune, cardiovascular and
neurological disorders or some types of cancers. For example, ligand-fusion
proteins or antibodies to the extracellular domain of R3 RPTPs could be
potentially used to regulate their activity. R3 RPTPs have been described as
tumour suppressors and dysregulation of these phosphatases has been
implicated in a variety of diseases. For example, GLEPP1 has been found to
be lost in malignant cells in colon cancer and in hepatocellular carcinomas
(Tautz et al, 2006). GLEPP1 was shown to play a role in terminal
differentiation, apoptosis and cell cycle arrest, which are some of the
hallmarks of tumour suppressor (Aguiar et al, 1999; Seimiya and Tsuruo,
1998). Using restriction landmark genome scanning (RLGS) in an animal
model of multistage tumorigenesis induced by folate/methyl-deficiency
revealed that GLEPP1 gene was silenced due to immediate promoter
methylation during hepatocarcinogenesis progression resulting in significant
reduction of GLEPP1 expression (Motiwala et al, 2003). These findings
suggested that the silencing of PTPRO in the liver could facilitate tumour
promotion either by relaxing cell cycle arrest, preventing cell contact
inhibition or developing resistance to apoptosis (Motiwala et al, 2003). A
truncated isoform of GLEPP1 (PTPROt) is expressed in B-lymphoid cells.
232
More recent study by Motiwala et al (2015) showed that PTPROt is
significantly down-regulated in the most common adult leukaemia, Chronic
Lymphocytic Leukaemia (CLL). The expression of PTPROt was shown to
prevent infiltration of inflammatory cells, such as monocytes and T-
lymphocytes that support the growth of CLL cells, into the spleen (the study
was concentrating on spleen tissue as an increased spleen weight and
accumulation of leukaemic CD5/CD19 cell population are the characteristics
of CLL) (Motiwala et al, 2015). In addition, the expression of PTPROt
appeared to suppress the leukaemic phenotype by mediating activation of a
cellular tumour protein p53 and the resultant suppression of an oncogenic
transcription factor Foxm1 expression (Motiwala et al, 2015). The collective
results suggest that GLEPP1 could be a good therapeutic target for novel
drugs against some types of cancer.
SAP-1 expressed in intestinal epithelial cell was shown to be involved in the
regulation of the intestinal immunity, partially by controlling the expression of
proinflammatory cytokines and chemokines, such as interferon-γ and IL-17,
in the colonic mucosa (Kotani et al, 2016). It has been suggested that SAP-1
regulates the intestinal immunity through its physiological substrate
CAECAM20 (carcinoembryonic antigen-related cell adhesion molecule
20). Tyrosine phosphorylation of CAECAM20 is an intestinal microvilli-
specific membrane protein that was shown to promote the binding of spleen
tyrosine kinase (Syk) and activation of nuclear factor-κB (NF-κB) in cultured
cells. This leads to the production of IL-8 chemokine that, in turn, results in
neutrophil infiltration, both of which were shown to be characteristics of
inflammatory bowel disease (Murata et al, 2015). It has been shown that
SAP-1 and CAECAM20 can associate together via their extracellular
domains, independently of their cytoplasmic tails. However, full-length of
SAP-1 is required to exert its effect on CAECAM20 as it has been shown to
dephosphorylate CAECAM20 and, thus, counteract CAECAM20-mediated
proinflammatory effects (Murata et al, 2015). Therefore, SAP-1 represents a
therapeutic potential in inflammatory bowel diseases. The therapeutic
potential of VE-PTP and DEP-1 as targets for anti-inflammatory drugs was
discussed in previous Chapters 4 and 5 with regards to their regulatory roles
233
in leukocytes extravasation and T-cell receptor signalling respectively. DEP-1
also represents an attractive therapeutic target for the treatment of the
cardiovascular diseases associated with diabetes and obesity. A study by
Shintany et al (2015) demonstrated that R3 RPTPs suppressed the insulin-
induced tyrosine phosphorylation of the insulin receptor (IR), inhibiting insulin
signalling and negatively regulating energy metabolism. However, DEP-1 is
the only R3 RPTP that is expressed in insulin target tissues such as the
skeletal muscle, liver and adipose tissue, where it was shown to co-localise
with insulin receptor in the plasma membrane (Shintany et al, 2015).
Selective DEP-1 inhibitors could have the potential to enhance the insulin-
induced activation of IR and the downstream Akt signalling, thus improving
glucose and insulin tolerance in type 2 diabetes patients.
Although R3 RPTPs represent an attractive drug target many difficulties limit
the development of PTPs’ inhibitors due to a highly charged and highly
conserved active site. Highly potent inhibitors often target multiple PTPs that
can lead to tremendous adverse effects. Despite this major drawback, there
was an influx of new strategies in developing competitive orthosteric and
allosteric PTP inhibitors to target specific PTPs (Stanford and Bottini, 2017).
One of the exciting developments in the PTP field is the development of the
first-in-class selective orthosteric small molecule VE-PTP inhibitor AKB-9778
(Campochiaro et al, 2015). This small molecule was shown to be effective in
diabetic retinopathy and retinal vein acclusion treatments as well as other
eye diseases, including neovascular age-related macular degeneration,
characterised by excessive vascular permeability and ocular
neovascularisation and it is now in clinical trials (Shen et al, 2014). VE-PTP
was shown to negatively regulate the activity of the angiopoietin-1 receptor
Tie2, which together with VE-cadherin and plakoglobin play a role in
maintaining the integrity of endothelial junctions (Fachinger et al, 1999). VE-
PTP regulation of vascular integrity via Tie2 and VE-cadherin appear to be
independent of each other. VE-PTP was shown to inhibit Tie2, resulting in
increased vascular leakage and, thus, inhibiting VE-PTP would represent an
attractive therapeutic target to decrease vascular leakage associated with
certain eye diseases as well as type 2 diabetes. Small molecule AKB-9778
234
appeared to inhibit VE-PTP catalytic activity, leading to the increased
phosphorylation of Tie2 and activation of downstream Akt signalling and
subsequent reduction in vascular leakage and occular neovascularisation
(Shen et al, 2014).
In most cases the ligands for the R3 RPTPs, the regulation of their
dimerisation state and the effects of dimerisation on their activity are not fully
defined. Nonetheless, increasing evidence shows that dimerisation can
determine enzyme activity and growing data demonstrates that generally
protein tyrosine phosphatases are inhibited by dimerisation. However, in
some cases, as was seen with DEP-1, the catalytic activity was enhanced by
artificial dimerisation. Therefore, the correlation between dimerisation and
regulation of catalytic activity should be established specifically for each
RPTP and cannot be extrapolated even to members of the same sub-type of
RPTPs. Understanding regulatory mechanisms of R3 RPTPs will shed light
on physiological roles of this subfamily and aid in development of novel
therapeutic targets. Further studies are required to define the relative roles of
the extracellular and transmembrane domains in R3 RPTP dimerisation and
perhaps explore other possible mechanisms of their regulation, such as
extracellular ligand binding or reversible oxidation.
6.8 Conclusion
Although there is growing evidence that the dimerisation of R3 RPTPs can
regulate their functions and that their extracellular and/or transmembrane
domains could be involved in the formation of dimers, the results of this
chapter clearly demonstrate that the phosphatases of this subgroup do not
behave in similar ways and, thus, it is difficult to present a unifying theme.
Based on the results obtained in this project GLEPP1 and SAP-1 have a
potential to dimerise, which is mediated by their extracellular and/or
transmembrane domains. However, the exact molecular interface of such
interactions remains unclear and requires further investigation. VE-PTP and
DEP-1 did not show the potential to dimerise via their extracellular and

235
transmembrane domains, though dimerisation can perhaps still occur under
physiological conditions through different domains (e.g. cytoplasmic domain
or full-length protein is required) or as a result of extracellular ligand binding.
There could be another regulatory mechanism altogether. Therefore, further
experiments are required to establish the potential of these phosphatases to
dimerise and to investigate other means of their regulation in order to gain
better understanding of their functions.

236
Chapter 7
Summary and Future Directions
237
This thesis uses a live cell bimolecular fluorescence complementation (BiFC)
assay and the results provide insight into functional roles and the importance
of the extracellular and transmembrane domains of protein tyrosine
phosphatases of the R3 subgroup (R3 RPTPs). This method enabled me to
confirm the interaction between VE-PTP and VE-cadherin via their
extracellular domains in live cells, representing a major step forward from
previous immunoprecipitation studies. In addition this method was used to
investigate extracellular domain interactions of other members of the R3
subgroup, namely DEP-1, SAP-1 and GLEPP1 with VE-cadherin. Despite
little homology within their extracellular domains all members of the R3
subgroup showed the potential to interact with VE-cadherin via their
extracellular and/or transmembrane domains in live cells, although the
physiological importance of these interactions remains to be defined. The
molecular basis of these interactions has to be further investigated. It is
possible that the extensive glycosylation of their extracellular domains could
also play a role in the interaction with other proteins. This project also
demonstrated that the 17th FNIII-like domain of VE-PTP is not the only
domain involved in interaction with VE–cadherin as was reported by previous
studies by Nawroth et al (2002). This raises a question whether these
protein-protein interactions are specific. Collective results over the decade
showed that phosphatases appear to exhibit high specificity towards their
substrates (Zhang et al, 1993; Zhang et al, 2002). However, whether the
specificity applies towards ligand binding is not fully defined. Based on the
expression analysis of R3 RPTPs it has been proposed that the ligand
binding specificity is determined by specific tissue and/or cell type
expression. More recent studies highlight the importance of extracellular and
transmembrane domains of R3 RPTPs in protein-protein interaction. In itself
extracellular ligand binding was proposed to be one of the regulatory
mechanisms that governs substrate specificity of RPTPs, thus regulating
their catalytic activity (den Hertog et al, 2008). Perhaps there are
combinatorial factors that determine specificity of R3 RPTP interactions.
Homophilic binding interactions have been shown for some R3 RPTPs in
238
previous immunoprecipitation studies and have been proposed as another
regulatory mechanism.
The results of this project showed that fusion constructs SAP-1 and GLEPP1
indeed have the potential to form dimers via their extracellular and/or
transmembrane domains. On the other hand, fusion constructs VE-PTP and
DEP-1 appeared not to homodimerise. However, in this project the
generated BiFC fusion constructs consisted of extracellular and
transmembrane domains fused to either N- or C-terminal part of a yellow
fluorescent protein, lacking the intracellular domain entirely. Perhaps, VE-
PTP and DEP-1 still have the potential to form homodimers in their normal
physiological environment via their intracellular domains or every domain is
required for the dimerisation to occur. In addition, the dimerisation could
occur in response to extracellular ligand binding. Based on the results of this
project and on many previous studies it appears that the regulation of R3
RPTP could be specific to each member and the results for one phosphatase
cannot be extrapolated to another even though they belong to one subgroup.
Further work is necessary to investigate the detailed molecular basis of
interactions between R3 RPTP and VE-cadherin as well as the molecular
basis of homodimerisation. We have already begun further experiments with
VE-PTP and VE-cadherin, using the same methodology. In order to
understand what particular region is essential for this interaction various
mutants of VE-PTP are being generated, each lacking two different
extracellular domains, which would be then co-expressed with VE-cadherin.
Moreover, it would be of particular interest to investigate the role of
glycosylation of the extracellular domains of R3 RPTPs in protein-protein
interactions.
The BiFC assay remains a popular tool for direct visualisation of protein-
protein interactions in live cells due to its simplicity and the ability to carry out
experiments with regular confocal microscopy. Despite many improvements
of BiFC assay the results require careful evaluation. Due to the nature of this
method split fragments of a yellow fluorescent protein (YFP) have the
tendency to self-associate spontaneously without the interaction between
proteins fused to the YFP fragments resulting in false-positive fluorescence
239
signal, especially if proteins are overexpressed, which is common in transient
transfections (Kerppola, 2006). Therefore it is advisable not to rely on only
the qualitative confocal analysis but carry out thorough quantitative and
statistical analysis that would provide more robust data. Here I adapted three
different ways of quantitative analysis to measure the average fluorescence
intensity, signal-to-noise (S/N) ratio and the distribution of yellow/red
fluorescence signal ratio. All three methods gave very similar results,
complementing each other and confirming the specificity of the BiFC method.
Furthermore, as this thesis highlights, I believe the choice of appropriate
negative controls is essential. As a control in the BiFC experiments a
transmembrane protein sialophorin (SPN) (also termed leukosialin and
CD43) was used as a fusion with the N- or C-terminal YFP sequence
(designated SPN-VN and SPN-VC respectively). The SPN protein is similar
to R3 RPTPs in that it has a large highly glycosylated extracellular domain
and a single transmembrane spanning region; however, it has no homology
to any R3 RPTPs and for these reasons has previously been used as a
control in other studies of DEP-1 function (Cordoba et al, 2013). Moreover, a
control construct that entirely lacked the extracellular domain and
transmembrane regions and was associated with the cell membrane via the
Lck myristoylation sequence (designated Myr-VC) was used as an additional
negative control. Despite negative interacting pairs exhibiting some
fluorescence signal the quantitative analysis revealed that the signal was
significantly reduced compared with positive interacting fusion pairs,
indicating specific interactions. However, one exception was the interaction
of DEP-1 with SPN control. It is interesting to note that the fluorescence
intensity obtained with the DEP-1 and VE-cadherin pairing, although
significantly different from DEP-1 with the Myr-VC control, was not
significantly different from DEP-1 and the SPN-VC control. And the
fluorescence intensity obtained from DEP-1 and SPN interaction was higher
compared with DEP-1 and DEP-1 interaction. These observations could be
interpreted as a bona fide interaction between DEP-1 and SPN. Although
both proteins are expressed in leukocytes I am not aware of any previous
reports documenting this interaction. Further experiments would be required
240
to investigate whether the interaction between DEP-1 and SPN has any
physiological significance. The findings highlight the importance of using
several controls in BiFC studies with membrane proteins which are more
prone to artefactual results than studies of freely diffusing cytoplasmic
proteins, since the sub-cellular location of these proteins is restricted to the
plane of the membrane.
An important area of future investigation in the field of R3 RPTPs is
identification of potential ligands and exploration of ligand-induced
dimerisation. With respect to R3 RPTPs, since ligands have been
documented for DEP-1 (Takahashi et al, 2012; Whiteford et al, 2011), it is
reasonable to assume that ligands exist for other R3 RPTP family members.
One approach to identify ligands involves the receptor alkaline phosphatase
(RAP) assay. This method provides a direct indicator of extracellular domain
binding and it is heat stable and, thus, can be differentiated from the heat
labile alkaline phosphatases of most tissues (Stoker, 2005). We have already
generated R3 RPTP alkaline phosphatase (AP) fusion proteins and
confirmed their expression by Western blotting. These AP fusion proteins
can be used as affinity probes to identify ligand- or receptor-expressing cells
in tissue culture or in tissue sections and the binding can be directly
visualised through simple chromogenic assays without purification,
radioactive labelling or secondary reagents. However, these results are not
included in this thesis since the experiments are still at the preliminary stage
but would be addressed in future work.
241
References
Aguiar, R. C., Yakushijin, Y., Kharbanda, S., Tiwari, S., Freeman, G. J. & Shipp, M. A. (1999) PTPROt: an alternatively spliced and developmentally regulated B-lymphoid phosphatase that promotes G0/G1 arrest. Blood, 94(7), 2403-13.
Alonso, A., Sasin, J., Bottini, N., Friedberg, I., Osterman, A., Godzik, A., Hunter, T., Dixon, J. & Mustelin, T. (2004) Protein tyrosine phosphatases in the human genome. Cell, 117(6), 699-711.
Andersen, J. N., Mortensen, O. H., Peters, G. H., Drake, P. G., Iversen, L. F., Olsen, O. H., Jansen, P. G., Andersen, H. S., Tonks, N. K. & Muller, N. P. (2001) Structural and evolutionary relationships among protein tyrosine phosphatase domains. Mol Cell Biol, 21(21), 7117-36.
Aricescu, A. R., Siebold, C., Choudhuri, K., Chang, V. T., Lu, W., Davis, S. J., van der Merwe, P. A. & Jones, E. Y. (2007) Structure of a tyrosine phosphatase adhesive interaction reveals a spacer-clamp mechanism. Science, 317(5842), 1217-20.
Azzi, S., Hebda, J. K. & Gavard, J. (2013) Vascular permeability and drug delivery in cancers. Front Oncol, 3, 211.
Barford, D., Jia, Z. & Tonks, N. K. (1995) Protein tyrosine phosphatases take off. Nat Struct Biol, 2(12), 1043-53.
Barr, A. J. (2010) Protein tyrosine phosphatases as drug targets: strategies and challenges of inhibitor development. Future Med Chem, 2(10), 1563-76.
Barr, A. J., Ugochukwu, E., Lee, W. H., King, O. N., Filippakopoulos, P., Alfano, I., Savitsky, P., Burgess-Brown, N. A., Muller, S. & Knapp, S. (2009) Large-scale structural analysis of the classical human protein tyrosine phosphatome. Cell, 136(2), 352-63.
Beltran, P. J., Bixby, J. L. & Masters, B. A. (2003) Expression of PTPRO during mouse development suggests involvement in axonogenesis and differentiation of NT-3 and NGF-dependent neurons. J Comp Neurol, 456(4), 384-95.
Benzing, T. (2004) Signaling at the slit diaphragm. J Am Soc Nephrol, 15(6), 1382-91.
Berggard, T., Linse, S. & James, P. (2007) Methods for the detection and analysis of protein-protein interactions. Proteomics, 7(16), 2833-42.
Blom, N., Sicheritz-Ponten, T., Gupta, R., Gammeltoft, S. & Brunak, S. (2004) Prediction of post-translational glycosylation and phosphorylation of proteins from the amino acid sequence. Proteomics, 4(6), 1633-49.
242
Borges, L. G., Seifert, R. A., Grant, F. J., Hart, C. E., Disteche, C. M., Edelhoff, S., Solca, F. F., Lieberman, M. A., Lindner, V., Fischer, E. H., Lok, S. & Bowen-Pope, D. F. (1996) Cloning and characterization of rat density-enhanced phosphatase-1, a protein tyrosine phosphatase expressed by vascular cells. Circ Res, 79(3), 570-80.
Bos, T. J., Rauscher, F. J., Curran, T. & Vogt, P. K. (1989) The carboxy terminus of the viral Jun oncoprotein is required for complex formation with the cellular Fos protein. Oncogene, 4(2), 123-6.
Brady-Kalnay, S. M. & Tonks, N. K. (1994a) Identification of the homophilic binding site of the receptor protein tyrosine phosphatase PTP mu. J Biol Chem, 269(45), 28472-7.
Brady-Kalnay, S. M. & Tonks, N. K. (1994b) Protein tyrosine phosphatases: from structure to function. Trends Cell Biol, 4(3), 73-6.
Brady-Kalnay, S. M. & Tonks, N. K. (1995) Protein tyrosine phosphatases as adhesion receptors. Curr Opin Cell Biol, 7(5), 650-7.
Broermann, A., Winderlich, M., Block, H., Frye, M., Rossaint, J., Zarbock, A., Cagna, G., Linnepe, R., Schulte, D., Nottebaum, A. F. & Vestweber, D. (2011) Dissociation of VE-PTP from VE-cadherin is required for leukocyte extravasation and for VEGF-induced vascular permeability in vivo. J Exp Med, 208(12), 2393-401.
Baumer, S., Keller, L., Holtmann, A., Funke, R., August, B., Gamp, A., Wolburg, H., Wolburg-Buchholz, K., Deutsch, U. & Vestweber, D. (2006) Vascular endothelial cell-specific phosphotyrosine phosphatase (VE-PTP) activity is required for blood vessel development. Blood, 107(12), 4754-62.
Bohmer, F., Szedlacsek, S., Tabernero, L., Ostman, A. & den Hertog, J. (2013) Protein tyrosine phosphatase structure-function relationships in regulation and pathogenesis. FEBS J, 280(2), 413-31.
Cadigan, K. M. (2008) Wnt-beta-catenin signaling. Curr Biol, 18(20), R943-7.
Campochiaro, P.A. (2015) Treatment of diabetic macular edema with an inhibitor of vascular endothelial-protein tyrosine phosphatase that activates Tie2. Ophthalmology 122, 545–554.
Carmeliet, P. & Collen, D. (2000) Molecular basis of angiogenesis. Role of VEGF and VE-cadherin. Ann N Y Acad Sci, 902, 249-62; discussion 262-4.
Carr, P. A., Erickson, H. P. & Palmer, A. G. (1997) Backbone dynamics of homologous fibronectin type III cell adhesion domains from fibronectin and tenascin. Structure, 5(7), 949-59.
243
Chabot, C., Spring, K., Gratton, J. P., Elchebly, M. & Royal, I. (2009) New role for the protein tyrosine phosphatase DEP-1 in Akt activation and endothelial cell survival. Mol Cell Biol, 29(1), 241-53.
Chen, C. D., Oh, S. Y., Hinman, J. D. & Abraham, C. R. (2006) Visualization of APP dimerization and APP-Notch2 heterodimerization in living cells using bimolecular fluorescence complementation. J Neurochem, 97(1), 30-43.
Chen, R., Jiang, X., Sun, D., Han, G., Wang, F., Ye, M., Wang, L. & Zou, H. (2009) Glycoproteomics analysis of human liver tissue by combination of multiple enzyme digestion and hydrazide chemistry. J Proteome Res, 8(2), 651-61.
Chiarugi, P. (2005) PTPs versus PTKs: the redox side of the coin. Free Radic Res, 39(4), 353-64.
Chida, K., Nagamori, S. & Kuroki, T. (1999) Nuclear translocation of Fos is stimulated by interaction with Jun through the leucine zipper. Cell Mol Life Sci, 55(2), 297-302.
Chin, C. N., Sachs, J. N. & Engelman, D. M. (2005) Transmembrane homodimerization of receptor-like protein tyrosine phosphatases. FEBS Lett, 579(17), 3855-8.
Clark, M. C. & Baum, L. G. (2012) T cells modulate glycans on CD43 and CD45 during development and activation, signal regulation, and survival. Ann N Y Acad Sci, 1253, 58-67.
Coon, B. G., Baeyens, N., Han, J., Budatha, M., Ross, T. D., Fang, J. S., Yun, S., Thomas, J. L. & Schwartz, M. A. (2015) Intramembrane binding of VE-cadherin to VEGFR2 and VEGFR3 assembles the endothelial mechanosensory complex. J Cell Biol, 208(7), 975-86.
Conrads, T.P. & Veenstra, T.D. (2005). An enriched look at tyrosine phosphorylation. Nature Biotechnology, 23(1), 36-37.
Cordoba, S. P., Choudhuri, K., Zhang, H., Bridge, M., Basat, A. B., Dustin, M. L. & van der Merwe, P. A. (2013) The large ectodomains of CD45 and CD148 regulate their segregation from and inhibition of ligated T-cell receptor. Blood, 121(21), 4295-302.
Daviet, L., Malvoisin, E., Wild, T. F. & McGregor, J. L. (1997) Thrombospondin induces dimerization of membrane-bound, but not soluble CD36. Thromb Haemost, 78(2), 897-901.
de la Fuente-Garcia, M. A., Nicolas, J. M., Freed, J. H., Palou, E., Thomas, A. P., Vilella, R., Vives, J. & Gaya, A. (1998a) CD148 is a membrane protein tyrosine phosphatase present in all hematopoietic lineages and is involved in signal transduction on lymphocytes. Blood, 91(8), 2800-9.
244
de Virgilio, M., Kiosses, W. B. & Shattil, S. J. (2004) Proximal, selective, and dynamic interactions between integrin alphaIIbbeta3 and protein tyrosine kinases in living cells. J Cell Biol, 165(3), 305-11.
Dejana, E., Lampugnani, M. G., Martinez-Estrada, O. & Bazzoni, G. (2000) The molecular organization of endothelial junctions and their functional role in vascular morphogenesis and permeability. Int J Dev Biol, 44(6), 743-8.
Dejana, E., Orsenigo, F. & Lampugnani, M. G. (2008) The role of adherens junctions and VE-cadherin in the control of vascular permeability. J Cell Sci, 121(Pt 13), 2115-22.
den Hertog, J., Ostman, A. & Bohmer, F. D. (2008) Protein tyrosine phosphatases: regulatory mechanisms. FEBS J, 275(5), 831-47.
Dominguez, M. G., Hughes, V. C., Pan, L., Simmons, M., Daly, C., Anderson, K., Noguera-Troise, I., Murphy, A. J., Valenzuela, D. M., Davis, S., Thurston, G., Yancopoulos, G. D. & Gale, N. W. (2007) Vascular endothelial tyrosine phosphatase (VE-PTP)-null mice undergo vasculogenesis but die embryonically because of defects in angiogenesis. Proc Natl Acad Sci U S A, 104(9), 3243-8.
Fachinger, G., Deutsch, U. & Risau, W. (1999) Functional interaction of vascular endothelial-protein-tyrosine phosphatase with the angiopoietin receptor Tie-2. Oncogene, 18(43), 5948-53.
Fang, D. & Kerppola, T. K. (2004) Ubiquitin-mediated fluorescence complementation reveals that Jun ubiquitinated by Itch/AIP4 is localized to lysosomes. Proc Natl Acad Sci U S A, 101(41), 14782-7.
Fischer, E. H., Charbonneau, H. & Tonks, N. K. (1991) Protein tyrosine phosphatases: a diverse family of intracellular and transmembrane enzymes. Science, 253(5018), 401-6.
Frye, M., Dierkes, M., Kuppers, V., Vockel, M., Tomm, J., Zeuschner, D., Rossaint, J., Zarbock, A., Koh, G. Y., Peters, K., Nottebaum, A. F. & Vestweber, D. (2015) Interfering with VE-PTP stabilizes endothelial junctions in vivo via Tie-2 in the absence of VE-cadherin. J Exp Med, 212(13), 2267-87.
Fukuda, M. & Tsuboi, S. (1999) Mucin-type O-glycans and leukosialin. Biochim Biophys Acta, 1455(2-3), 205-17.
Gao, M., Craig, D., Lequin, O., Campbell, I. D., Vogel, V. & Schulten, K. (2003) Structure and functional significance of mechanically unfolded fibronectin type III1 intermediates. Proc Natl Acad Sci U S A, 100(25), 14784-9.
Garton, A. J., Burnham, M. R., Bouton, A. H. & Tonks, N. K. (1997) Association of PTP-PEST with the SH3 domain of p130cas; a novel
245
mechanism of protein tyrosine phosphatase substrate recognition. Oncogene, 15(8), 877-85.
Gentz, R., Rauscher, F. J., Abate, C. & Curran, T. (1989) Parallel association of Fos and Jun leucine zippers juxtaposes DNA binding domains. Science, 243(4899), 1695-9.
Geyer, H., Geyer, R., Odenthal-Schnittler, M. & Schnittler, H. J. (1999) Characterization of human vascular endothelial cadherin glycans. Glycobiology, 9(9), 915-25.
Giannotta, M., Trani, M. & Dejana, E. (2013) VE-cadherin and endothelial adherens junctions: active guardians of vascular integrity. Dev Cell, 26(5), 441-54.
Gonzalez-Brito, M. R. & Bixby, J. L. (2009) Protein tyrosine phosphatase receptor type O regulates development and function of the sensory nervous system. Mol Cell Neurosci, 42(4), 458-65.
Gookin, T. E. & Assmann, S. M. (2014) Significant reduction of BiFC non-specific assembly facilitates in planta assessment of heterotrimeric G-protein interactors. Plant J, 80(3), 553-67.
Grazia Lampugnani, M., Zanetti, A., Corada, M., Takahashi, T., Balconi, G., Breviario, F., Orsenigo, F., Cattelino, A., Kemler, R., Daniel, T. O. & Dejana, E. (2003) Contact inhibition of VEGF-induced proliferation requires vascular endothelial cadherin, beta-catenin, and the phosphatase DEP-1/CD148. J Cell Biol, 161(4), 793-804.
Hayashi, M., Majumdar, A., Li, X., Adler, J., Sun, Z., Vertuani, S., Hellberg, C., Mellberg, S., Koch, S., Dimberg, A., Koh, G. Y., Dejana, E., Belting, H. G., Affolter, M., Thurston, G., Holmgren, L., Vestweber, D. & Claesson-Welsh, L. (2013) VE-PTP regulates VEGFR2 activity in stalk cells to establish endothelial cell polarity and lumen formation. Nat Commun, 4, 1672.
Holsinger, L. J., Ward, K., Duffield, B., Zachwieja, J. & Jallal, B. (2002) The transmembrane receptor protein tyrosine phosphatase DEP1 interacts with p120(ctn). Oncogene, 21(46), 7067-76.
Horstman, A., Tonaco, I. A., Boutilier, K. & Immink, R. G. (2014) A cautionary note on the use of split-YFP/BiFC in plant protein-protein interaction studies. Int J Mol Sci, 15(6), 9628-43.
Hower, A. E., Beltran, P. J. & Bixby, J. L. (2009) Dimerization of tyrosine phosphatase PTPRO decreases its activity and ability to inactivate TrkC. J Neurochem, 110(5), 1635-47.
246
Hu, C. D., Chinenov, Y. & Kerppola, T. K. (2002) Visualization of interactions among bZIP and Rel family proteins in living cells using bimolecular fluorescence complementation. Mol Cell, 9(4), 789-98.
Hu, C. D., Grinberg, A. V. & Kerppola, T. K. (2005) Visualization of protein interactions in living cells using bimolecular fluorescence complementation (BiFC) analysis. Curr Protoc Protein Sci, Chapter 19, Unit 19.10.
Hunter, T. (1995) Protein kinases and phosphatases: the yin and yang of protein phosphorylation and signaling. Cell, 80(2), 225-36.
Jensen, L. J., Gupta, R., Blom, N., Devos, D., Tamames, J., Kesmir, C., Nielsen, H., Staerfeldt, H. H., Rapacki, K., Workman, C., Andersen, C. A., Knudsen, S., Krogh, A., Valencia, A. & Brunak, S. (2002) Prediction of human protein function from post-translational modifications and localization features. J Mol Biol, 319(5), 1257-65.
Jensen, O. N. (2004) Modification-specific proteomics: characterization of post-translational modifications by mass spectrometry. Curr Opin Chem Biol, 8(1), 33-41.
Jeon, M. & Zinn, K. (2015) R3 receptor tyrosine phosphatases: conserved regulators of receptor tyrosine kinase signaling and tubular organ development. Semin Cell Dev Biol, 37, 119-26.
Jiang, G., den Hertog, J. & Hunter, T. (2000) Receptor-like protein tyrosine phosphatase alpha homodimerizes on the cell surface. Mol Cell Biol, 20(16), 5917-29.
Jiang, G., den Hertog, J., Su, J., Noel, J., Sap, J. & Hunter, T. (1999) Dimerization inhibits the activity of receptor-like protein-tyrosine phosphatase-alpha. Nature, 401(6753), 606-10.
Kang, T.H. & Kim, K.T. (2006) Negative regulation of ERK activity by VRK3-mediated activation of VHR phosphatase. Nat Cell Biol, 8, 863-869.
Kerppola, T. K. (2006) Design and implementation of bimolecular fluorescence complementation (BiFC) assays for the visualization of protein interactions in living cells. Nat Protoc, 1(3), 1278-86.
Kerppola, T. K. (2008) Bimolecular fluorescence complementation (BiFC) analysis as a probe of protein interactions in living cells. Annu Rev Biophys, 37, 465-87.
Kerppola, T. K. (2009) Visualization of molecular interactions using bimolecular fluorescence complementation analysis: characteristics of protein fragment complementation. Chem Soc Rev, 38(10), 2876-86.
247
Kerppola, T. K. (2013a) Bimolecular fluorescence complementation (BiFC) analysis of protein interactions in live cells. Cold Spring Harb Protoc, 2013(8), 727-31.
Kerppola, T. K. (2013b) Design of fusion proteins for bimolecular fluorescence complementation (BiFC). Cold Spring Harb Protoc, 2013(8), 714-8.
Kerppola, T. K. (2013c) Multicolor bimolecular fluorescence complementation (BiFC) analysis of protein interactions with alternative partners. Cold Spring Harb Protoc, 2013(9), 798-803.
Kerppola, T. K. (2013d) Simultaneous visualization of multiple protein interactions using multicolor bimolecular fluorescence complementation (BiFC) analysis. Cold Spring Harb Protoc, 2013(9), 892-5.
Kim, M., Kim, H. & Jho, E. H. (2010) Identification of ptpro as a novel target gene of Wnt signaling and its potential role as a receptor for Wnt. FEBS Lett, 584(18), 3923-8.
Kodama, Y. & Hu, C. D. (2010) An improved bimolecular fluorescence complementation assay with a high signal-to-noise ratio. Biotechniques, 49(5), 793-805.
Kohanski, R.A. & Lane, M.D. (1986) Kinetic evidence for activating and non-activating components of autophosphorylation of the insulin receptor protein kinase. Biochem Biophys Res Commun. 134, 1312-1318.
Kolmodin, K. & Aqvist, J. (2001) The catalytic mechanism of protein tyrosine phosphatases revisited. FEBS Lett, 498(2-3), 208-13.
Kotani, T., Murata, Y., Saito, Y. & Matozaki, T. (2016) Future therapeutic potential of SAP-1 in inflammatory bowel diseases. Expert Rev Gastroenterol Hepatol, 10(12), 1313-1315.
Krebs, E.G. (1992) Protein phosphorylation and cellular regulation I. Nobel Lect.72-89.
Krejsa, C. M., Nadler, S. G., Esselstyn, J. M., Kavanagh, T. J., Ledbetter, J. A. & Schieven, G. L. (1997) Role of oxidative stress in the action of vanadium phosphotyrosine phosphatase inhibitors. Redox independent activation of NF-kappaB. J Biol Chem, 272(17), 11541-9.
Krueger, N. X., Streuli, M. & Saito, H. (1990) Structural diversity and evolution of human receptor-like protein tyrosine phosphatases. EMBO J, 9(10), 3241-52.
Kuppers, V., Vockel, M., Nottebaum, A. F. & Vestweber, D. (2014) Phosphatases and kinases as regulators of the endothelial barrier function. Cell Tissue Res, 355(3), 577-86.
248
Lampugnani, M. G., Corada, M., Caveda, L., Breviario, F., Ayalon, O., Geiger, B. & Dejana, E. (1995) The molecular organization of endothelial cell to cell junctions: differential association of plakoglobin, beta-catenin, and alpha-catenin with vascular endothelial cadherin (VE-cadherin). J Cell Biol, 129(1), 203-17.
Lampugnani, M. G., Orsenigo, F., Gagliani, M. C., Tacchetti, C. & Dejana, E. (2006) Vascular endothelial cadherin controls VEGFR-2 internalization and signaling from intracellular compartments. J Cell Biol, 174(4), 593-604.
Laramee, M., Chabot, C., Cloutier, M., Stenne, R., Holgado-Madruga, M., Wong, A. J. & Royal, I. (2007) The scaffolding adapter Gab1 mediates vascular endothelial growth factor signaling and is required for endothelial cell migration and capillary formation. J Biol Chem, 282(11), 7758-69.
Le Roy, C. & Wrana, J. L. (2005a) Clathrin- and non-clathrin-mediated endocytic regulation of cell signalling. Nat Rev Mol Cell Biol, 6(2), 112-26.
Le Roy, C. & Wrana, J. L. (2005b) Signaling and endocytosis: a team effort for cell migration. Dev Cell, 9(2), 167-8.
Lee, H., Noh, H., Mun, J., Gu, C., Sever, S. & Park, S. (2016) Anks1a regulates COPII-mediated anterograde transport of receptor tyrosine kinases critical for tumorigenesis. Nat Commun, 7, 12799.
Lee, J. R. (2015) Protein tyrosine phosphatase PTPRT as a regulator of synaptic formation and neuronal development. BMB Rep, 48(5), 249-55.
Lee, S. R., Kwon, K. S., Kim, S. R. & Rhee, S. G. (1998) Reversible inactivation of protein-tyrosine phosphatase 1B in A431 cells stimulated with epidermal growth factor. J Biol Chem, 273(25), 15366-72.
Lemmon, M. A. & Schlessinger, J. (1998) Transmembrane signaling by receptor oligomerization. Methods Mol Biol, 84, 49-71.
Lemmon, M. A., Treutlein, H. R., Adams, P. D., Brunger, A. T. & Engelman, D. M. (1994) A dimerization motif for transmembrane alpha-helices. Nat Struct Biol, 1(3), 157-63.
Lievens, S., Lemmens, I. & Tavernier, J. (2009) Mamalian two-hybrids come of age. Trends Biochem. Sci. 34(11), 579-588.
Lin, M.F. & Clinton, G.M. (1988) The epidermal growth factor receptor from prostate cells is dephosphorylated by a prostate-specific phosphotyrosyl phosphatase. Mol Cell Biol. 8, 5477-5485.
Lin, H. P., Vincenz, C., Eliceiri, K. W., Kerppola, T. K. & Ogle, B. M. (2010) Bimolecular fluorescence complementation analysis of eukaryotic fusion products. Biol Cell, 102(9), 525-37.
249
Liu, T., Qian, W. J., Gritsenko, M. A., Camp, D. G., Monroe, M. E., Moore, R. J. & Smith, R. D. (2005) Human plasma N-glycoproteome analysis by immunoaffinity subtraction, hydrazide chemistry, and mass spectrometry. J Proteome Res, 4(6), 2070-80.
Magliery, T. J. & Regan, L. (2006) Reassembled GFP: detecting protein-protein interactions and protein expression patterns. Methods Biochem Anal, 47, 391-405.
Mahadev, K., Zilbering, A., Zhu, L. & Goldstein, B. J. (2001) Insulin-stimulated hydrogen peroxide reversibly inhibits protein-tyrosine phosphatase 1b in vivo and enhances the early insulin action cascade. J Biol Chem, 276(24), 21938-42.
Mann, M. (2009) Comparative analysis to guide quality improvements in proteomics. Nat Methods, 6(10), 717-19.
Martino, M. M. & Hubbell, J. A. (2010) The 12th-14th type III repeats of fibronectin function as a highly promiscuous growth factor-binding domain. FASEB J, 24(12), 4711-21.
Matozaki, T., Murata, Y., Mori, M., Kotani, T., Okazawa, H. & Ohnishi, H. (2010) Expression, localization, and biological function of the R3 subtype of receptor-type protein tyrosine phosphatases in mammals. Cell Signal, 22(12), 1811-7.
Matozaki, T., Suzuki, T., Uchida, T., Inazawa, J., Ariyama, T., Matsuda, K., Horita, K., Noguchi, H., Mizuno, H. & Sakamoto, C. (1994) Molecular cloning of a human transmembrane-type protein tyrosine phosphatase and its expression in gastrointestinal cancers. J Biol Chem, 269(3), 2075-81.
McLachlan, R. W., Kraemer, A., Helwani, F. M., Kovacs, E. M. & Yap, A. S. (2007) E-cadherin adhesion activates c-Src signaling at cell-cell contacts. Mol Biol Cell, 18(8), 3214-23.
McLachlan, R. W. & Yap, A. S. (2007) Not so simple: the complexity of phosphotyrosine signaling at cadherin adhesive contacts. J Mol Med (Berl), 85(6), 545-54.
Mellberg, S., Dimberg, A., Bahram, F., Hayashi, M., Rennel, E., Ameur, A., Westholm, J. O., Larsson, E., Lindahl, P., Cross, M. J. & Claesson-Welsh, L. (2009) Transcriptional profiling reveals a critical role for tyrosine phosphatase VE-PTP in regulation of VEGFR2 activity and endothelial cell morphogenesis. FASEB J, 23(5), 1490-502.
Meng, K., Rodriguez-Pena, A., Dimitrov, T., Chen, W., Yamin, M., Noda, M. & Deuel, T. F. (2000) Pleiotrophin signals increased tyrosine phosphorylation of beta beta-catenin through inactivation of the intrinsic catalytic activity of the receptor-type protein tyrosine phosphatase beta/zeta. Proc Natl Acad Sci U S A, 97(6), 2603-8.
250
Motiwala, T., Ghoshal, K., Das, A., Majumder, S., Weichenhan, D., Wu, Y. Z., Holman, K., James, S. J., Jacob, S. T. & Plass, C. (2003) Suppression of the protein tyrosine phosphatase receptor type O gene (PTPRO) by methylation in hepatocellular carcinomas. Oncogene, 22(41), 6319-31.
Motiwala, T., Kutay, H., Zanesi, N., Frissora, F. W., Mo, X., Muthusamy, N. & Jacob, S. T. (2015) PTPROt-mediated regulation of p53/Foxm1 suppresses leukemic phenotype in a CLL mouse model. Leukemia, 29(6), 1350-9.
Murata, Y., Kotani, T., Supriatna, Y., Kitamura, Y., Imada, S., Kawahara, K., Nishio, M., Daniwijaya, E. W., Sadakata, H., Kusakari, S., Mori, M., Kanazawa, Y., Saito, Y., Okawa, K., Takeda-Morishita, M., Okazawa, H., Ohnishi, H., Azuma, T., Suzuki, A. & Matozaki, T. (2015a) Protein tyrosine phosphatase SAP-1 protects against colitis through regulation of CEACAM20 in the intestinal epithelium. Proc Natl Acad Sci U S A, 112(31), E4264-71.
Murata, Y., Kotani, T., Supriatna, Y., Kitamura, Y., Imada, S., Kawahara, K., Nishio, M., Daniwijaya, E. W., Sadakata, H., Kusakari, S., Mori, M., Kanazawa, Y., Saito, Y., Okawa, K., Takeda-Morishita, M., Okazawa, H., Ohnishi, H., Azuma, T., Suzuki, A. & Matozaki, T. (2015b) Protein tyrosine phosphatase SAP-1 protects against colitis through regulation of CEACAM20 in the intestinal epithelium. Proc Natl Acad Sci U S A, 112(31), E4264-71.
Murata, Y., Mori, M., Kotani, T., Supriatna, Y., Okazawa, H., Kusakari, S., Saito, Y., Ohnishi, H. & Matozaki, T. (2010) Tyrosine phosphorylation of R3 subtype receptor-type protein tyrosine phosphatases and their complex formations with Grb2 or Fyn. Genes Cells, 15(5), 513-24.
Mustelin, T., Feng, G. S., Bottini, N., Alonso, A., Kholod, N., Birle, D., Merlo, J. & Huynh, H. (2002) Protein tyrosine phosphatases. Front Biosci, 7, d85-142.
Mustelin, T., Vang, T. & Bottini, N. (2005) Protein tyrosine phosphatases and the immune response. Nat Rev Immunol, 5(1), 43-57.
Nagano, H., Noguchi, T., Inagaki, K., Yoon, S., Matozaki, T., Itoh, H., Kasuga, M. & Hayashi, Y. (2003) Downregulation of stomach cancer-associated protein tyrosine phosphatase-1 (SAP-1) in advanced human hepatocellular carcinoma. Oncogene, 22(30), 4656-63.
Nakagawa, C., Inahata, K., Nishimura, S. & Sugimoto, K. (2011) Improvement of a Venus-based bimolecular fluorescence complementation assay to visualize bFos-bJun interaction in living cells. Biosci Biotechnol Biochem, 75(7), 1399-401.
Nawroth, R., Poell, G., Ranft, A., Kloep, S., Samulowitz, U., Fachinger, G., Golding, M., Shima, D. T., Deutsch, U. & Vestweber, D. (2002) VE-PTP and VE-cadherin ectodomains interact to facilitate regulation of phosphorylation and cell contacts. EMBO J, 21(18), 4885-95.
251
Neuberg, M., Adamkiewicz, J., Hunter, J. B. & Muller, R. (1989) A Fos protein containing the Jun leucine zipper forms a homodimer which binds to the AP1 binding site. Nature, 341(6239), 243-5.
Noguchi, T., Tsuda, M., Takeda, H., Takada, T., Inagaki, K., Yamao, T., Fukunaga, K., Matozaki, T. & Kasuga, M. (2001) Inhibition of cell growth and spreading by stomach cancer-associated protein-tyrosine phosphatase-1 (SAP-1) through dephosphorylation of p130cas. J Biol Chem, 276(18), 15216-24.
Noordman, Y. E., Augustus, E. D., Schepens, J. T., Chirivi, R. G., Rios, P., Pulido, R. & Hendriks, W. J. (2008) Multimerisation of receptor-type protein tyrosine phosphatases PTPBR7 and PTP-SL attenuates enzymatic activity. Biochim Biophys Acta, 1783(2), 275-86.
Nottebaum, A. F., Cagna, G., Winderlich, M., Gamp, A. C., Linnepe, R., Polaschegg, C., Filippova, K., Lyck, R., Engelhardt, B., Kamenyeva, O., Bixel, M. G., Butz, S. & Vestweber, D. (2008) VE-PTP maintains the endothelial barrier via plakoglobin and becomes dissociated from VE-cadherin by leukocytes and by VEGF. J Exp Med, 205(12), 2929-45.
Ostergaard, H.L., Shackelford, D.A., Hurley, T.R., Johnson. P., Hyman, R., Sefton, B.M. & Trowbridge, I.S. (1989) Expression of CD45 alters phosphorylation of the lck-encoded tyrosine protein kinase in murine lymphoma T-cell lines. Proc Natl Acad Sci USA, 86, 8959-8963.
Ostman, A., Hellberg, C. & Bohmer, F. D. (2006) Protein-tyrosine phosphatases and cancer. Nat Rev Cancer, 6(4), 307-20.
Ostman, A., Yang, Q. & Tonks, N. K. (1994) Expression of DEP-1, a receptor-like protein-tyrosine-phosphatase, is enhanced with increasing cell density. Proc Natl Acad Sci U S A, 91(21), 9680-4.
Petschnigg, J., Groisman, B., Kotlyar, M., Taipale, M., Zheng, Y., Kurat, C. F., Sayad, A., Sierra, J. R., Mattiazzi Usaj, M., Snider, J., Nachman, A., Krykbaeva, I., Tsao, M. S., Moffat, J., Pawson, T., Lindquist, S., Jurisica, I. & Stagljar, I. (2014) The mammalian-membrane two-hybrid assay (MaMTH) for probing membrane-protein interactions in human cells. Nat Methods, 11(5), 585-92.
Pixley, F. J., Lee, P. S., Dominguez, M. G., Einstein, D. B. & Stanley, E. R. (1995) A heteromorphic protein-tyrosine phosphatase, PTP phi, is regulated by CSF-1 in macrophages. J Biol Chem, 270(45), 27339-47.
Ransone, L. J., Visvader, J., Wamsley, P. & Verma, I. M. (1990) Trans-dominant negative mutants of Fos and Jun. Proc Natl Acad Sci U S A, 87(10), 3806-10.
252
Rose, R. H., Briddon, S. J. & Holliday, N. D. (2010) Bimolecular fluorescence complementation: lighting up seven transmembrane domain receptor signalling networks. Br J Pharmacol, 159(4), 738-50.
Sadakata, H., Okazawa, H., Sato, T., Supriatna, Y., Ohnishi, H., Kusakari, S., Murata, Y., Ito, T., Nishiyama, U., Minegishi, T., Harada, A. & Matozaki, T. (2009) SAP-1 is a microvillus-specific protein tyrosine phosphatase that modulates intestinal tumorigenesis. Genes Cells, 14(3), 295-308.
Sakuraba, J., Shintani, T., Tani, S. & Noda, M. (2013) Substrate specificity of R3 receptor-like protein-tyrosine phosphatase subfamily toward receptor protein-tyrosine kinases. J Biol Chem, 288(32), 23421-31.
Sallee, J. L. & Burridge, K. (2009) Density-enhanced phosphatase 1 regulates phosphorylation of tight junction proteins and enhances barrier function of epithelial cells. J Biol Chem, 284(22), 14997-5006.
Salmeen, A., Andersen, J. N., Myers, M. P., Tonks, N. K. & Barford, D. (2000) Molecular basis for the dephosphorylation of the activation segment of the insulin receptor by protein tyrosine phosphatase 1B. Mol Cell, 6(6), 1401-12.
Saltiel, A. R. & Kahn, C. R. (2001) Insulin signalling and the regulation of glucose and lipid metabolism. Nature, 414(6865), 799-806.
Schlessinger, J. (2002) Ligand-induced, receptor-mediated dimerization and activation of EGF receptor. Cell, 110(6), 669-72.
Seimiya, H. & Tsuruo, T. (1998) Functional involvement of PTP-U2L in apoptosis subsequent to terminal differentiation of monoblastoid leukemia cells. J Biol Chem, 273(33), 21187-93.
Sekar, R. B. & Periasamy, A. (2003) Fluorescence resonance energy transfer (FRET) microscopy imaging of live cell protein localizations. J Cell Biol, 160(5), 629-33.
Seo, Y., Matozaki, T., Tsuda, M., Hayashi, Y., Itoh, H. & Kasuga, M. (1997) Overexpression of SAP-1, a transmembrane-type protein tyrosine phosphatase, in human colorectal cancers. Biochem Biophys Res Commun, 231(3), 705-11.
Shelley, C. S., Remold-O'Donnell, E., Davis, A. E., Bruns, G. A., Rosen, F. S., Carroll, M. C. & Whitehead, A. S. (1989) Molecular characterization of sialophorin (CD43), the lymphocyte surface sialoglycoprotein defective in Wiskott-Aldrich syndrome. Proc Natl Acad Sci U S A, 86(8), 2819-23.
Shen, J., Frye, M., Lee, B.L., Reinardy, J.L., McClung, J.M., Ding, K., Kojima, M., Xia, H., Seidel, C., Lima e Silva, R., Dong, A., Hackett, S.F., Wang, J., Howard, B.W., Vestweber, D., Kontos, C.D., Peters, K.G. and Campochiaro,
253
P.A. (2014) Targeting VE-PTP activates TIE2 and stabilizes the ocular vasculature. J. Clin. Invest. 124, 4564–4576
Shintani, T., Higashi, S., Takeuchi, Y., Gaudio, E., Trapasso, F., Fusco, A. & Noda, M. (2015) The R3 receptor-like protein tyrosine phosphatase subfamily inhibits insulin signalling by dephosphorylating the insulin receptor at specific sites. J Biochem, 158(3), 235-43.
Singer, S. J. & Nicolson, G. L. (1972) The fluid mosaic model of the structure of cell membranes. Science, 175(4023), 720-31.
Singh, P., Carraher, C. & Schwarzbauer, J. E. (2010) Assembly of fibronectin extracellular matrix. Annu Rev Cell Dev Biol, 26, 397-419.
Spring, K., Chabot, C., Langlois, S., Lapointe, L., Trinh, N. T., Caron, C., Hebda, J. K., Gavard, J., Elchebly, M. & Royal, I. (2012) Tyrosine phosphorylation of DEP-1/CD148 as a mechanism controlling Src kinase activation, endothelial cell permeability, invasion, and capillary formation. Blood, 120(13), 2745-56.
Spring, K., Lapointe, L., Caron, C., Langlois, S. & Royal, I. (2014) Phosphorylation of DEP-1/PTPRJ on threonine 1318 regulates Src activation and endothelial cell permeability induced by vascular endothelial growth factor. Cell Signal, 26(6), 1283-93.
Stanford, S.M. and Bottini, N. (2017) Targeting Tyrosine Phosphatases: Time to End the Stigma. Trends in Pharmacological Sciences, 38(6), 524-540.
Stoker, A. (2005a) Methods for identifying extracellular ligands of RPTPs. Methods, 35(1), 80-9.
Stoker, A. W. (2005b) Protein tyrosine phosphatases and signalling. J Endocrinol, 185(1), 19-33.
Strous, G. J. & Gent, J. (2002) Dimerization, ubiquitylation and endocytosis go together in growth hormone receptor function. FEBS Lett, 529(1), 102-9.
Sung, M. K. & Huh, W. K. (2010) In vivo quantification of protein-protein interactions in Saccharomyces cerevisiae using bimolecular fluorescence complementation assay. J Microbiol Methods, 83(2), 194-201.
Suter, B., Kittanakom, S. & Stagljar, I. (2008) Two-hybrid technologies in proteomics research. Curr Opin Biotechnol, 19(4), 316-23.
Sorby, M., Sandstrom, J. & Ostman, A. (2001a) An extracellular ligand increases the specific activity of the receptor-like protein tyrosine phosphatase DEP-1. Oncogene, 20(37), 5219-24.
254
Sorby, M., Sandstrom, J. & Ostman, A. (2001b) An extracellular ligand increases the specific activity of the receptor-like protein tyrosine phosphatase DEP-1. Oncogene, 20(37), 5219-24.
Takagi, J., Strokovich, K., Springer, T. A. & Walz, T. (2003) Structure of integrin alpha5beta1 in complex with fibronectin. EMBO J, 22(18), 4607-15.
Takahashi, K., Mernaugh, R. L., Friedman, D. B., Weller, R., Tsuboi, N., Yamashita, H., Quaranta, V. & Takahashi, T. (2012) Thrombospondin-1 acts as a ligand for CD148 tyrosine phosphatase. Proc Natl Acad Sci U S A, 109(6), 1985-90.
Takahashi, T., Takahashi, K., Mernaugh, R., Drozdoff, V., Sipe, C., Schoecklmann, H., Robert, B., Abrahamson, D. R. & Daniel, T. O. (1999) Endothelial localization of receptor tyrosine phosphatase, ECRTP/DEP-1, in developing and mature renal vasculature. J Am Soc Nephrol, 10(10), 2135-45.
Takahashi, T., Takahashi, K., Mernaugh, R. L., Tsuboi, N., Liu, H. & Daniel, T. O. (2006) A monoclonal antibody against CD148, a receptor-like tyrosine phosphatase, inhibits endothelial-cell growth and angiogenesis. Blood, 108(4), 1234-42.
Tangye, S. G., Phillips, J. H., Lanier, L. L., de Vries, J. E. & Aversa, G. (1998) CD148: a receptor-type protein tyrosine phosphatase involved in the regulation of human T cell activation. J Immunol, 161(7), 3249-55.
Tautz, L., Pellecchia, M. & Mustelin, T. (2006) Targeting the PTPome in human disease. Expert Opin Ther Targets, 10(1), 157-77.
Teese, M. G. & Langosch, D. (2015) Role of GxxxG Motifs in Transmembrane Domain Interactions. Biochemistry, 54(33), 5125-35.
Tertoolen, L. G., Blanchetot, C., Jiang, G., Overvoorde, J., Gadella, T. W., Hunter, T. & den Hertog, J. (2001) Dimerization of receptor protein-tyrosine phosphatase alpha in living cells. BMC Cell Biol, 2, 8.
Thomas, P. E., Wharram, B. L., Goyal, M., Wiggins, J. E., Holzman, L. B. & Wiggins, R. C. (1994) GLEPP1, a renal glomerular epithelial cell (podocyte) membrane protein-tyrosine phosphatase. Identification, molecular cloning, and characterization in rabbit. J Biol Chem, 269(31), 19953-62.
Thomas, M.L. & Brown, E.J. (1999) Positive and negative regulation of Src-family membrane kinases by CD45. Immunol Today, 20, 406-411.
Tian, J., Wang, H. P., Mao, Y. Y., Jin, J. & Chen, J. H. (2007) Reduced glomerular epithelial protein 1 expression and podocyte injury in immunoglobulin A nephropathy. J Int Med Res, 35(3), 338-45.
255
Tonks, N. K. (2006) Protein tyrosine phosphatases: from genes, to function, to disease. Nat Rev Mol Cell Biol, 7(11), 833-46.
Tonks, N. K. (2013) Protein tyrosine phosphatases--from housekeeping enzymes to master regulators of signal transduction. FEBS J, 280(2), 346-78.
van der Wijk, T., Blanchetot, C. & den Hertog, J. (2005) Regulation of receptor protein-tyrosine phosphatase dimerization. Methods, 35(1), 73-9.
Vestweber, D. (2008) VE-cadherin: the major endothelial adhesion molecule controlling cellular junctions and blood vessel formation. Arterioscler Thromb Vasc Biol, 28(2), 223-32.
Walchli, S., Espanel, X. & Hooft van Huijsduijnen, R. (2005) Sap-1/PTPRH activity is regulated by reversible dimerization. Biochem Biophys Res Commun, 331(2), 497-502.
Walter, M., Chaban, C., Schutze, K., Batistic, O., Weckermann, K., Nake, C., Blazevic, D., Grefen, C., Schumacher, K., Oecking, C., Harter, K. & Kudla, J. (2004) Visualization of protein interactions in living plant cells using bimolecular fluorescence complementation. Plant J, 40(3), 428-38.
Waters, M. L. (2016) Post-translational modifications: Bonds that bind. Nat Chem Biol, 12(10), 768-9.
Wharram, B. L., Goyal, M., Gillespie, P. J., Wiggins, J. E., Kershaw, D. B., Holzman, L. B., Dysko, R. C., Saunders, T. L., Samuelson, L. C. & Wiggins, R. C. (2000) Altered podocyte structure in GLEPP1 (Ptpro)-deficient mice associated with hypertension and low glomerular filtration rate. J Clin Invest, 106(10), 1281-90.
Whiteford, J. R., Xian, X., Chaussade, C., Vanhaesebroeck, B., Nourshargh, S. & Couchman, J. R. (2011) Syndecan-2 is a novel ligand for the protein tyrosine phosphatase receptor CD148. Mol Biol Cell, 22(19), 3609-24.
Wilde, A., Beattie, E. C., Lem, L., Riethof, D. A., Liu, S. H., Mobley, W. C., Soriano, P. & Brodsky, F. M. (1999) EGF receptor signaling stimulates SRC kinase phosphorylation of clathrin, influencing clathrin redistribution and EGF uptake. Cell, 96(5), 677-87.
Wong, K. A. & O'Bryan, J. P. (2011) Bimolecular fluorescence complementation. J Vis Exp(50).
Xu, Y. & Fisher, G. J. (2012) Receptor type protein tyrosine phosphatases (RPTPs) - roles in signal transduction and human disease. J Cell Commun Signal, 6(3), 125-38.
256
Xu, Z. & Weiss, A. (2002a) Negative regulation of CD45 by differential homodimerization of the alternatively spliced isoforms. Nat Immunol, 3(8), 764-71.
Xu, Z. & Weiss, A. (2002b) Negative regulation of CD45 by differential homodimerization of the alternatively spliced isoforms. Nat Immunol, 3(8), 764-71.
Yu, K.R., Kim, Y.J., Jung, S.K., Ku, B., Park, H., Cho, S.Y. et al (2013) Structural basis for the dephosphorylating activity of PTPRQ towards phosphatidylinositide substrates. Acta Crystallogr D: Biol Crystallogr, 69, 1522-9
Zhang, Z. Y. (2002) Protein tyrosine phosphatases: structure and function, substrate specificity, and inhibitor development. Annu Rev Pharmacol Toxicol, 42, 209-34.
Zhang, Z. Y., Thieme-Sefler, A. M., Maclean, D., McNamara, D. J., Dobrusin, E. M., Sawyer, T. K. & Dixon, J. E. (1993) Substrate specificity of the protein tyrosine phosphatases. Proc Natl Acad Sci U S A, 90(10), 4446-50.
Zlatkine, P., Mehul, B. & Magee, A. I. (1997) Retargeting of cytosolic proteins to the plasma membrane by the Lck protein tyrosine kinase dual acylation motif. J Cell Sci, 110 ( Pt 5), 673-9.