Embed Size (px)
Citation preview
WestminsterResearchhttp://www.westminster.ac.uk/westminsterresearch
Partner selection in green supply chains using PSO - a practical
approach
Wu, C. and Barnes, D.
This is an Accepted Manuscript of an article published by Taylor & Francis in Production
Planning and Control, DOI: 10.1080/09537287.2016.1177233, Published online: 29 Apr
2016.
The definitive version is available online at:
http://www.tandfonline.com/10.1080/09537287.2016.1177233
The WestminsterResearch online digital archive at the University of Westminster aims to make the
research output of the University available to a wider audience. Copyright and Moral Rights remain
with the authors and/or copyright owners.
Whilst further distribution of specific materials from within this archive is forbidden, you may freely
distribute the URL of WestminsterResearch: ((http://westminsterresearch.wmin.ac.uk/).
In case of abuse or copyright appearing without permission e-mail [email protected]

- 1 -
Partner selection in green supply chains using PSO - a practical
approach
Chong Wu
School of Management, Xiamen University, Xiamen, 361005 P.R. China
Tel: +86 (0) 592 2180776
Fax: +86 (0) 592 2187289
Email: [email protected]
David Barnes
Westminster Business School, University of Westminster, London, NW1 5LS, U.K.
Tel: +44 (0) 20 7911 5000 Extension: 66531
Fax: +44 (0) 20 7911 5703
Email: [email protected]
Corresponding author’s contact details:
David Barnes
Email: [email protected]
Postal address: Westminster Business School, University of Westminster, London,
NW1 5LS, U.K.
Tel: +44 (0) 20 7911 5000 Extension: 66531
Fax: +44 (0) 20 7911 5703
Acknowledgements
This work was supported by the National Natural Science Foundation of China under
Grant 71202058; the Natural Science Foundation of Fujian Province of China under
Grant 2012J01305; and the Specialized Research Fund for the Doctoral Programme of
Higher Education under Grant 20110121120028. The authors wish to thank the
anonymous reviewers and editor for their valuable suggestions and comments.
- 2 -
Partner selection in green supply chains using PSO - a practical
approach
Abstract: Partner selection is crucial to green supply chain management as the focal
firm is responsible for the environmental performance of the whole supply chain. The
construction of appropriate selection criteria is an essential, but often neglected pre-
requisite in the partner selection process. This paper proposes a three-stage model that
combines Dempster-Shafer belief acceptability theory and particle swarm optimization
technique for the first time in this application. This enables optimization of both
effectiveness, in its consideration of the inter-dependence of a broad range of
quantitative and qualitative selection criteria, and efficiency in its use of scarce
resources during the criteria construction process to be achieved simultaneously. This
also enables both operational and strategic attributes can be selected at different levels
of hierarchy criteria in different decision-making environments. The practical efficacy
of the model is demonstrated by an application in Company ABC, a large Chinese
electronic equipment and instrument manufacturer.
Keywords: Green supply chain; Partner selection criteria; Dempster-Shafer theory;
Particle swarm optimization
1. Introduction
The growing acceptance of the concept of the Triple Bottom Line, and the need to
comply with a series of regulatory and legislative requirements for environment
protection (e.g. the WEEE and the RoHS Directives) has seen an increased concern that
organizations should strive for environmental sustainability (Tsai 2012). The behaviour
of consumers has also begun to change as they start to evaluate the environmental
impact of the products and services they buy (Montoya-Torres et al. 2015). The focus
of environmental management and operations has moved from local optimization of
environmental factors to consideration of the entire supply chain (Jayaraman et al. 2007,
Tseng et al. 2014). For the focal firm in a supply chain, this concern must also extend
to the environmental practices and performance of its partners throughout its supply
chain, as it is likely to be held responsible for any of their adverse environmental
- 3 -
impacts as well as its own (Rao and Holt 2005). The need to construct and operate green
supply chains (GSCs) was highlighted some time ago by Noci (1997). He summarised
the four key reasons why focal firms need to evaluate their supply chain partners’
environmental performance as: (1) to avoid negative managerial implications for the
customer’s value chain by reducing the quantity of supplied components with low
environmental performance, (2) to control the cost of their green products effectively,
(3) to favour frequent modification of the key product environmental performance by
reducing the company’s response time to the market, and (4) to avoid problems
associated with the company’s green image which depends on a supplier’s
environmental efficiency. Since then, the environmental performance of supply chain
partners has become an even more important issue, and hence, partner selection has
become a crucial issue in green supply chain management (Awasthi et al. 2010,
Bhattacharya et al. 2014).
Green supply chain management (GSCM) encompasses the plans and activities of a
focal firm, which integrate environmental issues into supply chain management in order
to improve the environmental performance of all its supply chain partners (Bowen et
al. 2001, Large and Thomsen 2011). GSCM has becoming one of the main issues in
supply chain management due to both dramatic increasing of air emissions and
progressive scarcity of nature resources (Savino et al. 2015). The key purpose of GSCM
is to control and reduce the environmental impact of all its supply chain activities, both
upstream and downstream, including the purchase of raw materials, the production and
delivery of products and services, and the recycling of waste products (Kuo et al.
2010a). GSCM not only enables a company to comply with different regulatory
requirements, but can also cultivate green business opportunities (Tsai 2012, Mohanty
and Prakash 2014). A commitment to environment sustainability in the supply chain
can be a source of competitive advantage and sustainable development (George et al.
2006, Large and Thomsen 2011).
The construction of a GSC requires that only the most environmentally appropriate
partners be incorporated within it. However, any process used to select supply partners
needs a comprehensive set of appropriate criteria. However, this is far from
straightforward as the criteria may vary across different product categories and
situations (Kannan and Haq 2007). Without appropriate criteria, decision-makers
- 4 -
cannot collect and evaluate adequate and appropriate information on potential partners
(Wu and Barnes 2016). Furthermore, those criteria need to reflect the relative
importance of different environmental regulations under which the focal firm and its
partners operate. Without appropriate criteria, even the most advanced models/methods
cannot perform well thereby reducing the effectiveness of the partner selection process
(De Boer et al. 2001). Without appropriate criteria, valuable evaluation resources (e.g.
time and money) will be wasted, reducing the efficiency of the partner selection process
(Wu and Barnes 2010). In short, the effectiveness and efficacy of GSC construction
process will be seriously adversely affected if there is not a systematic method to
construct a set of feasible and practicable criteria. The aim of the research is to analyse
and to assess how the most appropriate criteria for partner selection in GSCs can be
identified and organized under different decision-making situations considering the
managerial resource constraints.
The remainder of this paper is organized as follows. Section 2 presents a literature
review of criteria selection and construction in GSCs. Section 3 describes the
methodology of this research. Section 4 sets out a three-stage model for partner
selection criteria construction in GSCs based on the use of Dempster-Shafer belief
acceptability theory and particle swarm optimization technique. Section 5 tests the
efficacy of the model by presenting an empirical illustration of its application in the
Chinese Electronic Equipment & Instruments industry. Section 6 summaries a
managerial application process for the proposed model. The paper closes with some
concluding remarks in Section 7.
2. Literature Review
Noci (1997) was the first to propose that a supplier’s environmental performance should
be incorporated within a comprehensive vendor rating system. Within a pro-active
green strategy, his model identified four key measures for vendor rating and selection,
namely the potential vendors’ green competencies, their green image, their current
environmental efficiency and the net life cycle cost. Three or four sub-measures are
then included in each of the key measures. These measures can not only be used in
vendor rating systems but can also be used by firms to drive continuous improvements
in their environmental performance. Based on the empirical evidence from 119
- 5 -
manufacturing firms, Lee et al. (2015) argue that green suppliers do have positive and
significant effects on environmental performance and competitive advantage.
Therefore, green supplier selection becomes an important decision in efforts to improve
and enhance the environmental performance and competitive advantage of GSCs.
Noci’s work has provided the foundation on which much of the subsequent research on
hierarchy criteria in this field has been built. In particular, Klassen and Vachon (2003),
Zhu and Sarkis (2004), Bai and Sarkis (2010a, 2010b), Erol et al. (2011), Buyukozkan
and Cifci (2012), and Kannan et al. (2015) join Noci in including green competencies
as a partner selection criterion for GSCs. Potential partners could demonstrate their
green competencies by, for example, their efficiency at managing green supply chain
management issues, having a reverse logistics system, and transferring employees with
environmental expertise to suppliers. Melnyk et al. (2003), Matos and Hall (2007), Kuo
et al. (2010a) and Hashemi et al. (2015) also follow Noci in including green image.
Examples of meeting this criterion might include having ISO 14000 certification, the
extent to which the partner is seen to follow green policies, and the extent to which its
market share relates to green customers. Noci’s environmental efficiency criterion has
been extended by beyond emissions and energy consumption to encompass broader as
aspects of environmental performance including product recycling rates and responses
to environmental product requests (Sarkis 2003, Kassinis and Soteriou 2003,
Kleindorfer et al. 2005, Corbiere-Nicollier et al. 2011, Dey and Cheffi 2013). Similarly,
Noci’s net life cycle cost criterion has been extended to encompass other pollution
control initiatives, including Waste Electrical and Electronic Equipment (WEEE)
directive (Sroufe 2003, Linton et al. 2007, Awasthi et al. 2010, Tsai 2012). Other
researchers have put forward alternative sets of criteria to Noci (1997). Yeh and Chuang
(2011) identify four main criteria for green partner selection, whilst other researchers
have suggested as many as twelve (Awasthi et al. 2010), or in the case of Tseng and
Chiu (2013), eighteen qualitative and quantitative criteria.
As can be inferred from the above discussion, each of the potential criteria for partner
selection in green supply chains tends to consist of multiple dimensions that can be
arranged in a hierarchy. Thus, any method used in determining appropriate criteria must
also include a consideration of what sub-criteria to include within each of the chosen
top-level criteria (Wu and Barnes 2011, 2012). Based on a literature survey and the
- 6 -
approval of experts, Hashemi et al. (2015) identified their green supplier evaluation
criteria under economic and environment categories. As there are only three sub-
criteria, grouped under each of the top-level criteria, theirs is a fairly simple grouping
process. In addition, Sarkis and Dhavale (2015) proposed a set of criteria for supplier
selection for sustainable operations. They supplemented economic and environmental
criteria with a social criteria category in accordance with the theory of triple bottom
line (Elkington 1998). Similarly, three sub-criteria were identified and included in each
of the top-level criteria categories based on a literature survey. It is both efficient and
practical to identify and cluster criteria in this way, if their number is limited. However,
if the decision-making situation calls for a more compressive evaluation, then, many
more criteria need to be identified and clustered; this requires a more reliable and
systematic approach.
Kannan et al. (2015) proposed a multi-criteria decision-making approach to select the
best green supplier for a Singapore-based plastic manufacturing company. At their
criteria construction stage, they used an affinity diagram to gather large amounts of
language data and organized them into groupings based on their natural relationships.
In this way, they narrowed the green supplier selection criteria from the 26 traditional
criteria and 72 environmental criteria under 13 main criteria in the beginning to 21
traditional criteria and 39 environmental criteria under 11 main criteria in the end. This
represents significant progress in both the efficiency of green supplier selection and in
that the potential criteria can be easily identified, grouped, and filtered. Yet, this criteria
construction process is mostly qualitative and misses out on quantitative analysis and
evaluation of factors such as financial cost and management resources. Govindan et al.
(2015) reviewed thirty three papers which focused on multi criteria decision making
approaches for green supplier evaluation and selection in recent years. They pointed
out that additional research is required on identifying, defining, grouping, and filtering
the criteria of green supplier evaluation and selection. “These areas are important and
necessary directions” as they concluded.
Additionally, one of the most distinctive features of GSCM is the increased number of
performance objectives involved than would be the case for more traditional supply
chains (Seuring and Muller 2008). Thus, the challenge of developing a method to solve
this problem must take into account not only the hierarchical relationships between
- 7 -
criteria but also be able to optimize between multiple, and potentially conflicting
objectives. This makes for a much more complex problem not only than would be the
case with a single objective but also when the objectives are mainly economic in nature.
Thus, any proposed techniques must enable the problem to be solved both efficiently
and effectively having regard to resource constraints and the decision-making
environment.
A variety of methods have been applied tackle the green partner selection problem.
These have included Analytic Hierarchy Process (AHP)/Analytic Network Process
(ANP) (Sarkis 2003), ANP (Yang et al. 2010), Artificial Neural Network (ANN) (Kuo
et al. 2010a), Interpretive Structural Modelling (Kannan and Haq 2007), grey system
and rough sets (Bai and Sarkis 2010a, 2010b), DEA (Kumar et al. 2014) and multi-
objective mixed-integer programming (Abdallah et al. 2012). Whilst fuzzy logic has
been applied by Erol et al. (2011) - fuzzy entropy, Lee et al. (2009) - fuzzy AHP, and
Tseng and Chiu (2013) - fuzzy set theory. One of the common limitations of such works
has been a tendency for researchers to initiate their partner selection criteria without a
systematic way to identify, group and filter the potential criteria (Govindan et al. 2015).
Additionally, the emphasis of most current works has been placed on the partner
selection methods and approaches (Genovese et al. 2014), rather than first addressing
the more fundamental problem of constructing a set of appropriate partner selection
criteria reasonably and systematically. To date, only limited attention has been given to
partner selection criteria construction which is an essential pre-requisite in any selection
process (Wu and Barnes, 2011). Lin and Chen (2004) applied Dempster-Shafer theory
when constructing a partner selection criteria hierarchy within their strategic alliance
selection model. However, their main focus is on the strategic alliance selection
approach rather than the partner selection criteria construction, which makes their
model hard to apply by supply chain managers in practice. Wu and Barnes (2010) tried
to simplify Lin and Chen’s framework in order to make it more accessible to practicing
managers. However, their approach to constructing partner selection criteria is limited
to the use of only a single objective viewpoint and method, namely belief acceptability,
when a multi-objective approach would be more beneficial for the quality of decision-
making and closer to realistic decision-making environments.
- 8 -
In summary, the construction of a set of selection criteria is a necessary pre-requisite in
any partner selection process. Yet, current approaches to partner selection in green
supply chains do not consider how to construct an appropriate set of appropriate partner
selection criteria systematically. Current literature places the emphasis on the partner
selection method, with little or no consideration being given to the prior construction
of selection criteria. Approaches that have tackled this issue (e.g. Lin and Chen, 2004;
Wu and Barnes, 2010) can be shown to have shortcomings. This is a significant gap in
the literature. There is a need to develop a method that can systematically construct an
appropriate set of criteria for partner selection in green supply chains. Such a method
should be able to identify, group and filter all the potential criteria. This paper proposes
such a method. It is based on multiple objective programming rather than a single
objective. This enables it to be comprehensive enough to consider a broad range of
possible criteria, both qualitative and quantitative, whilst being efficient in its use of
scarce management resources during the criteria construction process.
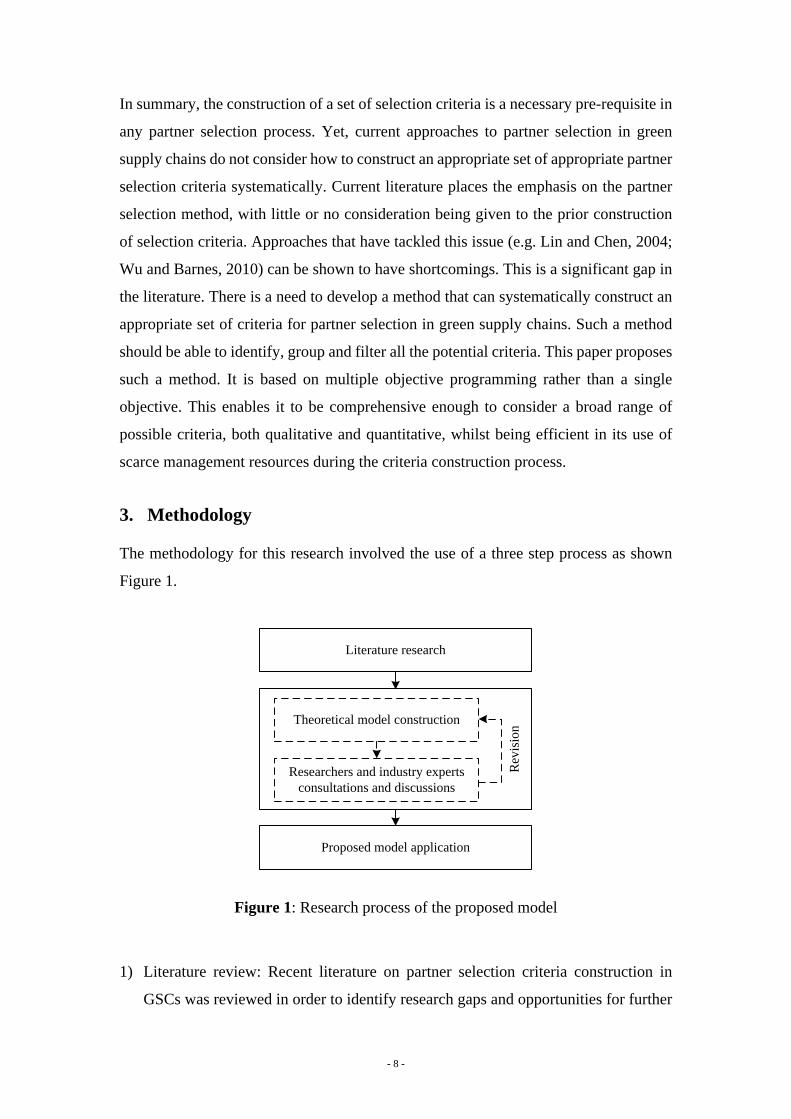
3. Methodology
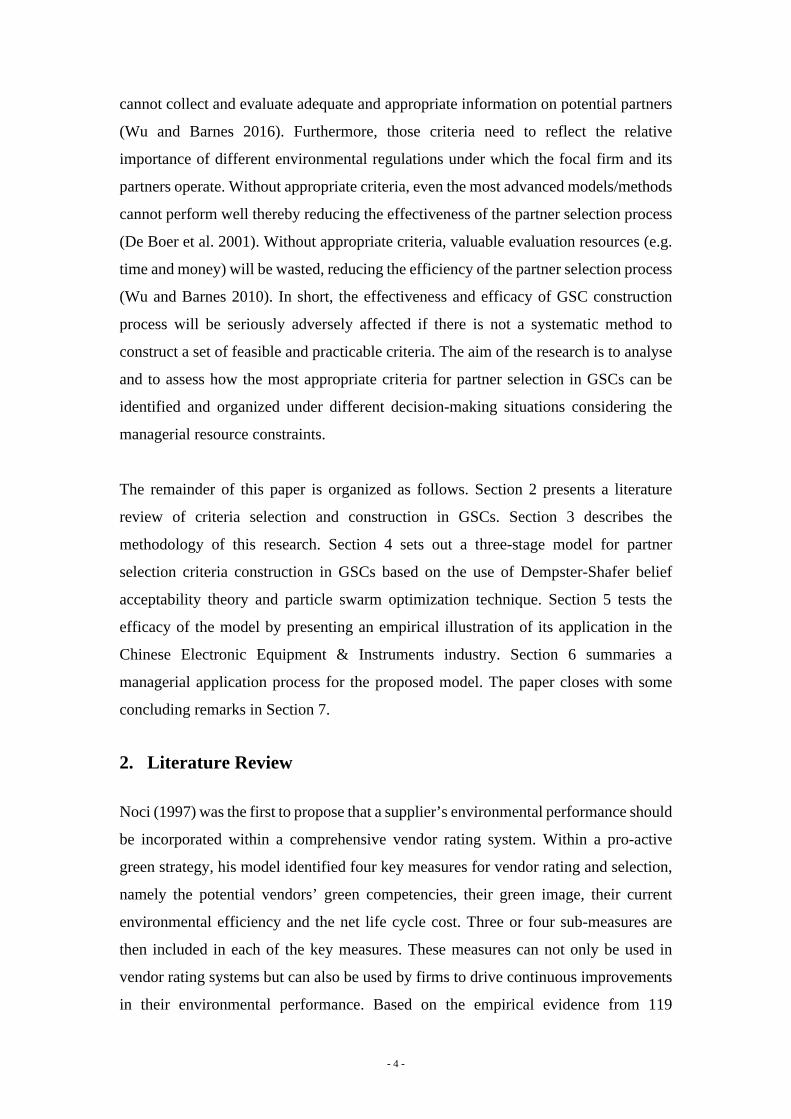
The methodology for this research involved the use of a three step process as shown
Figure 1.
Literature research
Theoretical model construction
Researchers and industry experts consultations and discussions
Proposed model application
Rev
isio
n
Figure 1: Research process of the proposed model
1) Literature review: Recent literature on partner selection criteria construction in
GSCs was reviewed in order to identify research gaps and opportunities for further
- 9 -
development. Keywords, such as partner selection, criteria construction and
formulation, and green supply chain, were used to search papers published in the
leading operations management journals from 1990s onwards in the database of ISI
Web of Knowledge. 67 papers in high ranked journals were selected for inclusion
in the review.
2) Model construction: From the literature research, a three-stage model for partner
selection criteria construction in GSCs was proposed based on the use of the
Dempster-Shafer belief acceptability theory and particle swarm optimisation
technique (see below). An expert panel of researchers and industry experts were
consulted about the proposed model. During several rounds of discussion and
revision, they provided a number of helpful comments and suggestions for
improvement, which were incorporated into the finalised proposed model.
3) Application: The efficacy and effectiveness of the proposed model was then tested
through an empirical illustration of its application in the Chinese Electronic
Equipment & Instruments industry.
This research is based on the use of the Dempster-Shafer theory and the particle swarm
optimization technique. These are now briefly explained in the following two sub-
sections.
3.1 Dempster-Shafer theory
The Dempster-Shafer theory (DST) of evidence was originated by Dempster’s concept
of lower and upper probabilities (Dempster 1967), and extended by Shafer as a theory
(Shafer 1976). The basic idea of DST is that numerical measures of uncertainty may be
assigned to overlapping sets and subsets of hypotheses or events (Beynon et al. 2000).
As it can include situations of uncertainty and ignorance in the same formulation, DST
can build a unifying framework for describing uncertainty and ignorance in the
decision-making environment (Yager 1987). Compared to probability theory, such as
the conventional Bayesian technique, DST can capture and represent more information
to support decision-making, by representing uncertain and ignorance evidence (Wu
2009). In more detail, rather than being represented by exactly specified probability
distributions as conventional Bayesian technique, DST proposes a mechanism to derive
- 10 -
solutions from various vague sets of evidence (Beynon et al. 2000). Furthermore, DST
can combine unexpected empirical evidence in decision-maker’s mind, and then
formulate a coherent picture of reality.
There are three main advantages of applying DST during the partner selection criteria
construction process. First of all, DST is a valuable tool for the evaluation of risk and
uncertainty when knowledge is obtained from experts (Sentz and Ferson, 2002). DST
can build a unifying framework for describing uncertainty and ignorance. Secondly, the
uncertainty we have to take into consideration during decision-making on partner
selection criteria construction is epistemic uncertainty. Thus, traditional probability
theory is not the most appropriate theory to apply. Compared to more traditional
Bayesian technique, DST can capture and represent more information to support
decision-making on partner selection criteria construction. Last but not least, criterion
dependency, which is a common phenomenon in multi-attribute decision-making
problems, can be considered simultaneously by applying DST. For a target criterion in
a specific layer, decision-makers can form any meaningful combination out of the
criteria in the lower layer and generate the subordinate criteria sets with their different
belief acceptabilities. More importantly, the combination of evidence can be obtained
from multiple sources (say a panel of decision-makers) in DST while the potential
conflicts among them can be well modeled. Therefore, in this research, DST is applied
for representing the uncertainty and ignorance during the prior processes of partner
selection criteria construction in GSCs.
3.2 Particle swarm optimization
Particle Swarm Optimization (PSO) is a metaheuristic algorithm based on the social
behaviour of a flock of birds or shoal of fish; it is similar to evolutionary computation
techniques, for instance, genetic algorithm. First proposed by Kennedy and Eberhart
(1995), PSO is initialized with a population of random solutions, which it then searches
for optima by updating generations. Then, unlike genetic algorithm, which is based on
the survival of fitness, the potential solutions will move through the problem space by
following the current optimum particles (Kuo et al. 2010b). In more detail, each
particle's movement is guided toward its local best known position. At the same time,
this movement is also influenced by the best known positions in the whole search space.
- 11 -
These basic characteristics are in favour of the swarm moving toward its best solution.
In addition, PSO can search very large spaces of possible solutions and so can be used
for complex optimization problems (Zhao et al. 2008, Huang et al. 2011, Che 2012).
There are two main advantages of applying PSO during the partner selection criteria
construction process. On the one hand, PSO has been proved to be a simple, sound, and
effective metaheuristic algorithm (Che 2012). Zhao et al. (2008) and Huang et al. (2011)
pointed out that PSO is an effective and efficient method to solve a complex
optimization problem. PSO offers easy programming and can be used on optimization
problems that are partially irregular, noisy and changes over time. In use, PSO provides
high efficiency as a result of its fast computation ability. PSO can search a very large
space of possible solutions, which makes it very suitable for criteria construction
problems in GSCs. In other words, compared to other multi-objective optimization
algorithms, such as genetic algorithm, PSO algorithm is a helpful metaheuristic
approach which can clearly obtain acceptable solutions (Kuo et al. 2010b). On the other
hand, the PSO technique is flexible enough to solve the multiple-objective optimization
problem, which makes it very suitable for decision-making in partner selection criteria
construction. As the proposed multiple-objective programming model is flexible
enough to incorporate an increased number of objectives and/or constraints, the PSO
technique can adapt and solve it efficiently. As such, it seems to offer an appropriate
approach to solving the partner selection criteria construction sub-problem. Therefore,
in this research, a PSO based methodology is proposed for solving the multi-objective
optimization sub-problem within the partner selection criteria construction in GSCs.
4. The three-stage DS-PSO model for partner selection criteria
construction in GSCs
This research therefore proposes a model that offers a new systematic approach to
systematically solving this complex and important problem. Its innovativeness lies in
its three-stage structure and its combination use of both Dempster-Shafer belief
acceptability theory and particle swarm optimization technique.
The proposed three stages are as follows:
(1) GSC partner selection General Hierarchy Criteria (GSC-GHC) construction;
- 12 -
(2) GSC partner selection Specific Hierarchy Criteria (GSC-SHC) construction;
(3) GSC partner selection Optimization Hierarchy Criteria (GSC-OHC) construction.
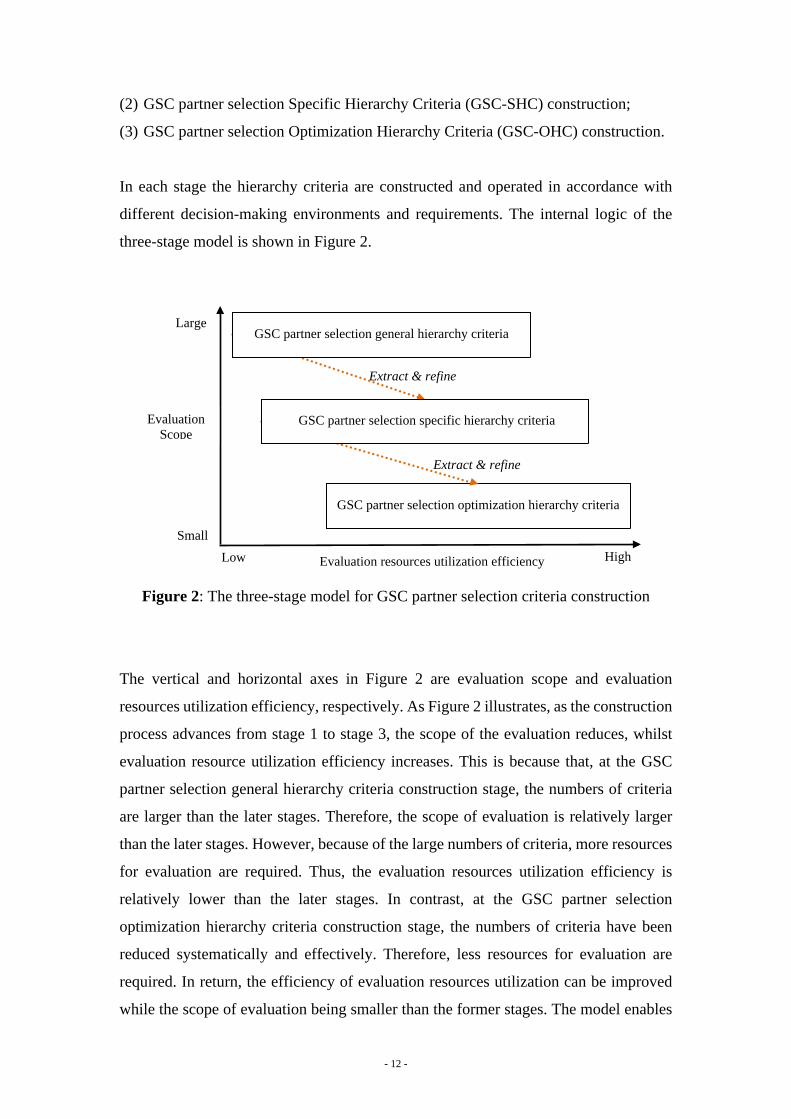
In each stage the hierarchy criteria are constructed and operated in accordance with
different decision-making environments and requirements. The internal logic of the
three-stage model is shown in Figure 2.
Extract & refine
Extract & refine
Evaluation resources utilization efficiencyLow
GSC partner selection general hierarchy criteria
GSC partner selection optimization hierarchy criteria
High
GSC partner selection specific hierarchy criteriaEvaluationScope
Small
Large
Figure 2: The three-stage model for GSC partner selection criteria construction
The vertical and horizontal axes in Figure 2 are evaluation scope and evaluation
resources utilization efficiency, respectively. As Figure 2 illustrates, as the construction
process advances from stage 1 to stage 3, the scope of the evaluation reduces, whilst
evaluation resource utilization efficiency increases. This is because that, at the GSC
partner selection general hierarchy criteria construction stage, the numbers of criteria
are larger than the later stages. Therefore, the scope of evaluation is relatively larger
than the later stages. However, because of the large numbers of criteria, more resources
for evaluation are required. Thus, the evaluation resources utilization efficiency is
relatively lower than the later stages. In contrast, at the GSC partner selection
optimization hierarchy criteria construction stage, the numbers of criteria have been
reduced systematically and effectively. Therefore, less resources for evaluation are
required. In return, the efficiency of evaluation resources utilization can be improved
while the scope of evaluation being smaller than the former stages. The model enables
- 13 -
decision-makers to find an optimization hierarchy of criteria that optimises evaluation
scope for partner selection in GSCs whilst simultaneously optimising evaluation
resource efficiency.
The advantage of a three stage structure is that it offers a well-balanced trade-off
between effectiveness and efficiency within the hierarchy criteria construction process.
On the one hand, if only one or two stages are used to construct the hierarchy criteria,
some requirements and demands of decision-making cannot be adequately fulfilled. In
particular, it would limit the development of criteria that can be tailored to specific
decision-making contexts. Therefore, the effectiveness of hierarchy criteria
construction would be affected. On the other hand, if there are more than three stages
(perhaps four or five stages), the efficiency of the hierarchy criteria construction would
be adversely affected as each additional stage requires the consumption of more
valuable resource and decision-making time. In adopting a three stage model, we follow
an approach used in previous proposals for the design and formulation of hierarchy
criteria for partner selection (e.g. Lin and Chen 2004, Wu and Barnes 2010, Kuo et al.
2010a). A three stage process has also been used in other comparable decision-making
models. For example, De Snoo et al. (2012) when developing a categorization of
scheduling performance criteria in an extended planning and scheduling theory, and
Mexas et al. (2012) when constructing criteria for the selection of ERP systems.
The use of Dempster-Shafer theory provides an effective way of giving decision-
makers confidence in the information used and thereby the value of the evaluation
criteria developed. PSO technique provides sufficient flexibility to enable the model to
be adapted for use with differing numbers of optimization objectives and/or constraints.
The use of Dempster-Shafer and PSO technique in combination provides a systematic
and comprehensive way of solving the problem efficiently and effectively, thereby
opening the way for the use of the proposed model in real business situations.
The following three sub-sections describe each of the sub-stages in the three-stage
model for GSC partner selection criteria construction in more details.
- 14 -
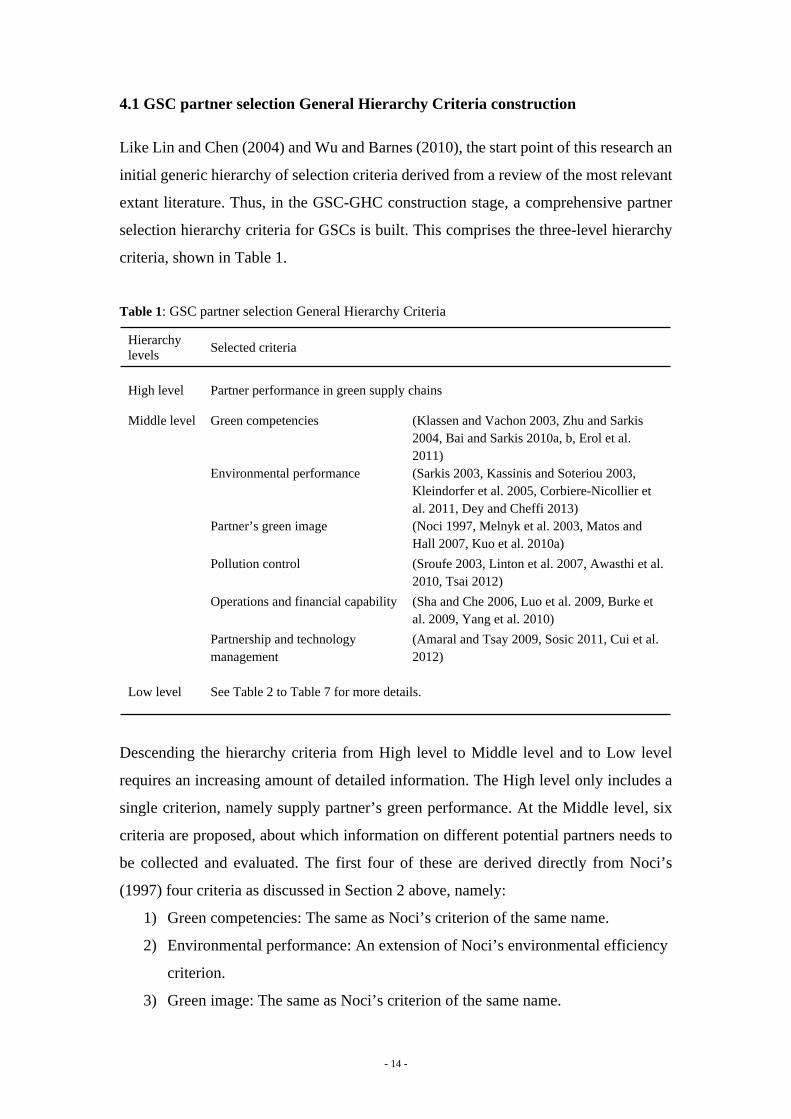
4.1 GSC partner selection General Hierarchy Criteria construction
Like Lin and Chen (2004) and Wu and Barnes (2010), the start point of this research an
initial generic hierarchy of selection criteria derived from a review of the most relevant
extant literature. Thus, in the GSC-GHC construction stage, a comprehensive partner
selection hierarchy criteria for GSCs is built. This comprises the three-level hierarchy
criteria, shown in Table 1.
Table 1: GSC partner selection General Hierarchy Criteria
Hierarchy levels
Selected criteria
High level Partner performance in green supply chains
Middle level Green competencies (Klassen and Vachon 2003, Zhu and Sarkis 2004, Bai and Sarkis 2010a, b, Erol et al. 2011)
Environmental performance (Sarkis 2003, Kassinis and Soteriou 2003, Kleindorfer et al. 2005, Corbiere-Nicollier et al. 2011, Dey and Cheffi 2013)
Partner’s green image (Noci 1997, Melnyk et al. 2003, Matos and Hall 2007, Kuo et al. 2010a)
Pollution control (Sroufe 2003, Linton et al. 2007, Awasthi et al. 2010, Tsai 2012)
Operations and financial capability (Sha and Che 2006, Luo et al. 2009, Burke et al. 2009, Yang et al. 2010)
Partnership and technology management
(Amaral and Tsay 2009, Sosic 2011, Cui et al. 2012)
Low level See Table 2 to Table 7 for more details.
Descending the hierarchy criteria from High level to Middle level and to Low level
requires an increasing amount of detailed information. The High level only includes a
single criterion, namely supply partner’s green performance. At the Middle level, six
criteria are proposed, about which information on different potential partners needs to
be collected and evaluated. The first four of these are derived directly from Noci’s
(1997) four criteria as discussed in Section 2 above, namely:
1) Green competencies: The same as Noci’s criterion of the same name.
2) Environmental performance: An extension of Noci’s environmental efficiency
criterion.
3) Green image: The same as Noci’s criterion of the same name.
- 15 -
4) Pollution control: An extension of Noci’s net life cycle cost criterion
To these four green-related criteria, we propose two additional, economic criteria:
5) Operations and financial capability
6) Partnership and technology management
The two additional factors (5 and 6 above) ensure that economic as well as
environmental objectives are incorporated into the criteria chosen for GSC construction
as firm’s will wish to optimize economic as well as environmental performance (Sha
and Che 2006, Luo et al. 2009, Sosic 2011, Cui et al. 2012, Wu and Barnes 2014).
Collecting and evaluating information directly on these six aspects of performance is
likely to be neither feasible nor effective in practice. A better and more acceptable
approach method is to break down each dimension into a set of more detailed Low level
criteria, for which comprehensive and objective performance measures are available.
These are identified from the literature relevant for each of the respective six Middle
level criteria as outlined below and shown in Tables 2 through 7. There are no consensus
rules for classification of the criteria at the lowest level of hierarchy either within
academia or practice. In this research, the classification of those criteria is based on an
analysis of their objective and relevance to each of the six aspects of performance.
Accordingly, the clustering process was discussed by the expert panel of academic
researchers and industry experts (as noted in Section 3 Methodology).
1) Green competencies can be broken down into eighteen sub-criteria (see Table
2). A supplier’s ability to design recyclable products, design renewable product
and possess a reverse logistics system are identified as green competencies by
Klassen and Vachon (2003). Similarly, Bai and Sarkis (2010a) list the abilities
to solve supplier environmental technical problems, transfer employees with
environmental expertise to suppliers, and reduce supplier’s environmental costs
as green competencies. Whilst operating appropriate technology, such as the
availability of clean technologies and use of environment friendly technology
are also green competencies (Noci 1997, Tsai 2012). Likewise, appropriate
planning & control and regulatory policies are also sources of green
competencies. For instance, green process planning, internal control process,
establishment of environmental commitment and policy, and continuous
- 16 -
monitoring and regulatory compliance (Klassen and Vachon 2003, Zhu and
Sarkis 2004, Bai and Sarkis 2010b, Corbiere-Nicollier et al. 2011). Finally, the
ability to cooperate with green partners is also a source of green competencies.
Thus identified are joint and team problem solving on environmental issues,
information sharing on environmental topics, partnership with green
organizations, green supply chain management efficiency and green market
share (Linton et al. 2007, Awasthi et al. 2010, Erol et al. 2011).
2) Environmental performance has nineteen sub-criteria (see Table 3). Product
recycling rate, product remanufacturing rate and product reuse rate all reflect
the potential partners’ environmental performance in aspects of recycling,
remanufacturing and re-use (Sarkis 2003, Kleindorfer et al. 2005). In addition,
air emissions, solid wastes and waste water represent another side of the
recycling, remanufacturing and re-use environmental performance (Noci 1997,
Matos and Hall 2007, Corbiere-Nicollier et al. 2011). Energy use as reflected
energy consumption, and energy efficiency (Bauer et al. 2010, Erol et al. 2011)
are also part of potential partners’ environmental performance. Similarly, with
the ability to co-operate with suppliers influences environmental performance.
Therefore, having environmental protection plans of suppliers, having
environmental protection policies of suppliers, supplier rewards and incentives
for environmental performance, amount of environmentally safe alternatives
and green knowledge transfer and communication (potential partner’s incentive
for green knowledge transferring within the GSCs) are all identified as criteria
(Klassen and Vachon 2003, Bai and Sarkis 2010a). Finally, ratio of green
customers to total customers, response to environmental product requests,
identification of environmental aspects, green packaging, and adherence to
environmental policies are all measures that directly show the environmental
performance of potential partners (Kassinis and Soteriou 2003, Kleindorfer et
al. 2005, Awasthi et al. 2010, Bai and Sarkis 2010b).
3) Green image has eighteen sub-criteria (see Table 4). The partner’s green image
reflects the ways in which they cooperate with their suppliers. Thus, building
top management commitment/support for supplier organization for green
supply practices, building top management commitment/support within buyer
- 17 -
organization for green supply practices, introducing a cross-functional supply
chain team with environmental presence, the participation level of suppliers in
the eco-design stage, and/or in the process of procurement and production are
identified as criteria (Zhu and Sarkis 2004, Bai and Sarkis 2010a). A partner’s
green image is enhanced and recognised by their having some environmental
related certificates (e.g. ISO 14000) and then them having respect for the policy
(the attitudes toward the environmental protection policy) (Melnyk et al. 2003,
Kassinis and Soteriou 2003, Kuo et al. 2010a). A partner’s green image is also
reflected in their relationships with their customers, employees and
stakeholders. Thus, market share related to green customers, customers’
purchase retention (it's cheaper to get current customer to purchase from you
again, therefore if you have a good green image from your current customers
who care about your environmental impact, you may have higher customer
purchase retention rate), the interests and rights of employee, and the type of
relationships with stakeholders are also recognised as criteria (Noci 1997,
Matos and Hall 2007, Kuo et al. 2010a). Additionally, information disclosure is
identified as an important aspect of a potential partner’s green image (Kuo et al.
2010a). Finally, investment and planning in relation to environmental issues
contribute to green image. Thus, green R&D investment, depreciation for
investments aimed at improving the partner’s environment performance,
planning of environmental objectives, checking and evaluation of
environmental activities, and assignment of environmental responsibility are
appropriate criteria (Zhu and Sarkis 2004, Bai and Sarkis 2010b, Corbiere-
Nicollier et al. 2011).
4) Pollution control has seventeen sub-criteria (see Table 5). Firstly,
environmental regulations provide both restrictions and motivations for
pollution control. Thus, ISO14001 certificate, Waste Electrical and Electronic
Equipment (WEEE), and Restriction of the use of certain hazardous substances
in electrical and electronic equipment (e.g. RoHS) can be used as criteria
(Melnyk et al. 2003, Tsai 2012). Secondly, the costs for pollution treatment also
influence the scale and scope of pollution control, such indicated by as air
pollution treatment costs, chemical wastes treatment costs, cost for component
disposal, energy consumption costs, solid wastes treatment costs, and water
- 18 -
pollution treatment costs can be criteria (Noci 1997, Sroufe 2003, Matos and
Hall 2007, Erol et al. 2011). Thirdly, the methods of pollution control affect the
result of pollution control. So, end-of-pipe control (pollution control capability),
pollution control initiatives, design for environment, and production of polluting
agents are also criteria (Linton et al. 2007, Awasthi et al. 2010, Bai and Sarkis
2010b). Lastly, the materials used also reflect the pollution control performance.
So type of materials used in the supplied component (environmental friendly or
not), use of environment friendly materials, use of harmful materials, and
production of toxic products are also suitable criteria (Noci 1997, Bai and Sarkis
2010b, Corbiere-Nicollier et al. 2011, Tsai 2012).
5) Operations and financial capability can be broken down into two separate
sub-categories of criteria, operations and financial- related respectively (see
Table 6). For the first sub-category, producing and delivering the required
products and services are the key functions of GSCM. To achieve their main
objective, GSCs need capabilities to provide quality product/service (Zhu and
Sarkis 2004). This also calls for the ability to meet a high level of production
volume flexibility, delivery reliability and capacity and variation in types of
products or services (Sha and Che 2006, Yang et al. 2010, Cui et al. 2012). In
addition, order lead time and order fulfilment rate are also very important
attributes when evaluating the flexibility of potential partners (Chung et al.
2005, Burke et al. 2009). As quality of products has been one of the top concerns
in literature for some time, an appropriate quality assurance system and
warranty periods are considered to be relevant criteria (Zhu and Sarkis 2004,
Xia and Wu 2007), as is good quality philosophy (Pil and Rothenberg 2003). As
product and service delivery is a key attribute of any potential partner, there is
a need to consider their geographical location (Bauer et al. 2009). Other partner
attributes identified in this category include the condition of physical facilities,
consistent conformance to specifications and design capability (Choi and
Hartley 1996, Sroufe 2003, Chung et al. 2005). Last, but not least, cost factors
are likely to influence partner selection decision-making. So, cost-reduction
capability remains vital to a GSCs’ performance (Sha and Che 2006). For the
second sub-category, prudent financial capability is the foundation of any
business operation. Accordingly, various financial accounting ratios can be used
- 19 -
as appropriate criteria. Firstly, a firm’s ability to pay its debts as they fall due
can be assessed from the asset/liability ratio, and the debt/equity ratio (Luo et
al. 2009). Secondly, a firm’s ability to grow and develop can be assessed from
the assets rates of increment, the net profits growth rates and total revenue (Lin
and Chen 2004). Thirdly, the ability of a firm to make profits, which is
fundamental to its future health, can be assessed from the gross profit margin
and the net operating margin (Burke et al. 2009). Finally, a firm’s operation
ability, which is its ability to operate smoothly on a day-to-day basis can be
assessed from the receivable turnover and the inventory turnover ratios (Luo et
al. 2009).
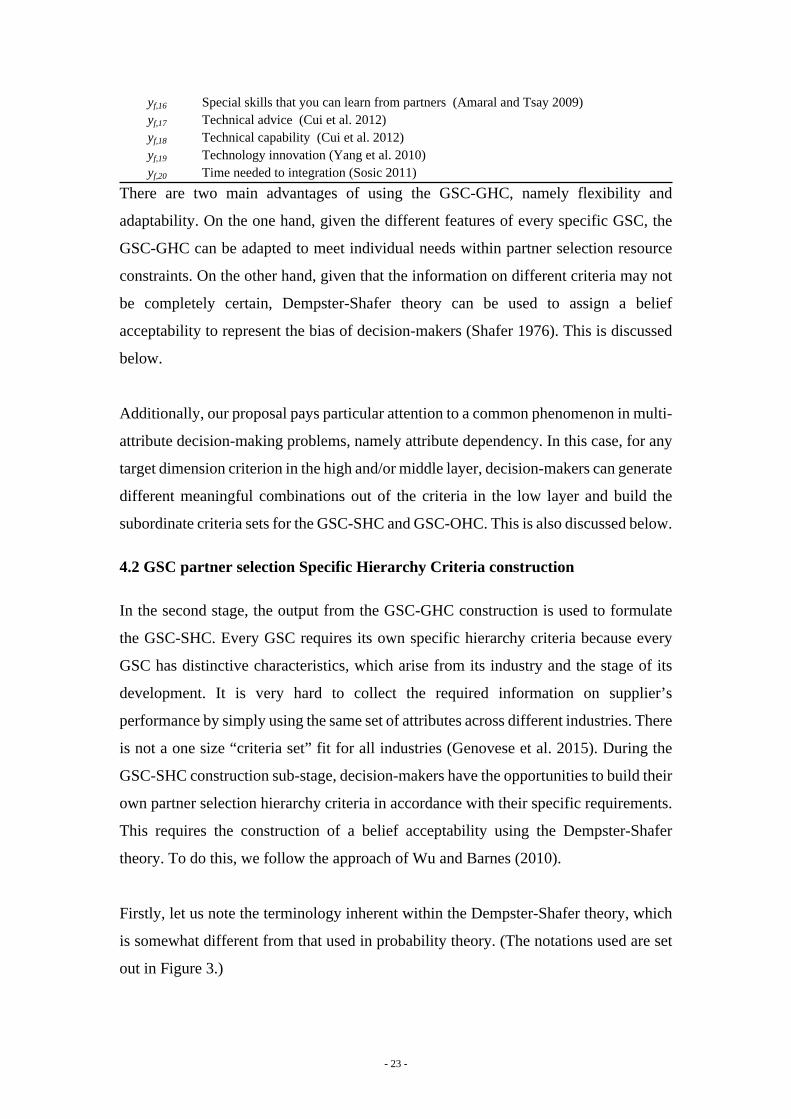
6) Partnership and technology has twenty sub-criteria (see Table 7). The ability
of a potential partner to manage technology and knowledge is one of the key
attributes in a GSC partner. Thus technical capability, technical advice,
technology innovation and knowledge of local business practices are used as
indicators of a potential supplier’s performance (Hajidimitriou and Georgiou
2002, Yang et al. 2010, Cui et al. 2012). In regard to technology management,
a partner’s equipment status, their product familiarity, and repair turnaround
time are basic criteria against which potential partners should be evaluated (Xia
and Wu 2007, Amaral and Tsay 2009, Cui et al. 2012). As technology has to be
updated continuously, the purchaser should also evaluate the cost of alternatives
before selecting a particular partner (Burke et al. 2009). As a GSC needs to be
a dynamic alliance of member companies in order to respond to fast-changing
markets, so decision-making about the formation of a new GSC is an important
consideration. Thus, relationship building flexibility and company’s reputation
to integrity should be considered as criteria, alongside the cost of integration
and the time needed to integrate (Lin and Chen 2004, Sosic 2011). Similarly,
compatible management styles and compatible organization cultures will also
influence decision making in this regard (Hajidimitriou and Georgiou 2002).
Also, likely to be included in this evaluation category are special skills that you
can learn from partners, closeness of past relationship and ease of
communication (Choi and Hartley 1996, Amaral and Tsay 2009, Yang et al.
2010). The ability to share knowledge is another key aspect of partnership
management. Thus, an ability to obtain partner’s local knowledge (Amaral and
- 20 -
Tsay 2009) and partner’s ability to acquire your firm’ special skills (Xia and
Wu 2007) are also included as criteria. Finally, it is also important to assess the
risk of failure of cooperation when choosing a supply partner in GSCs (Amaral
and Tsay 2009).
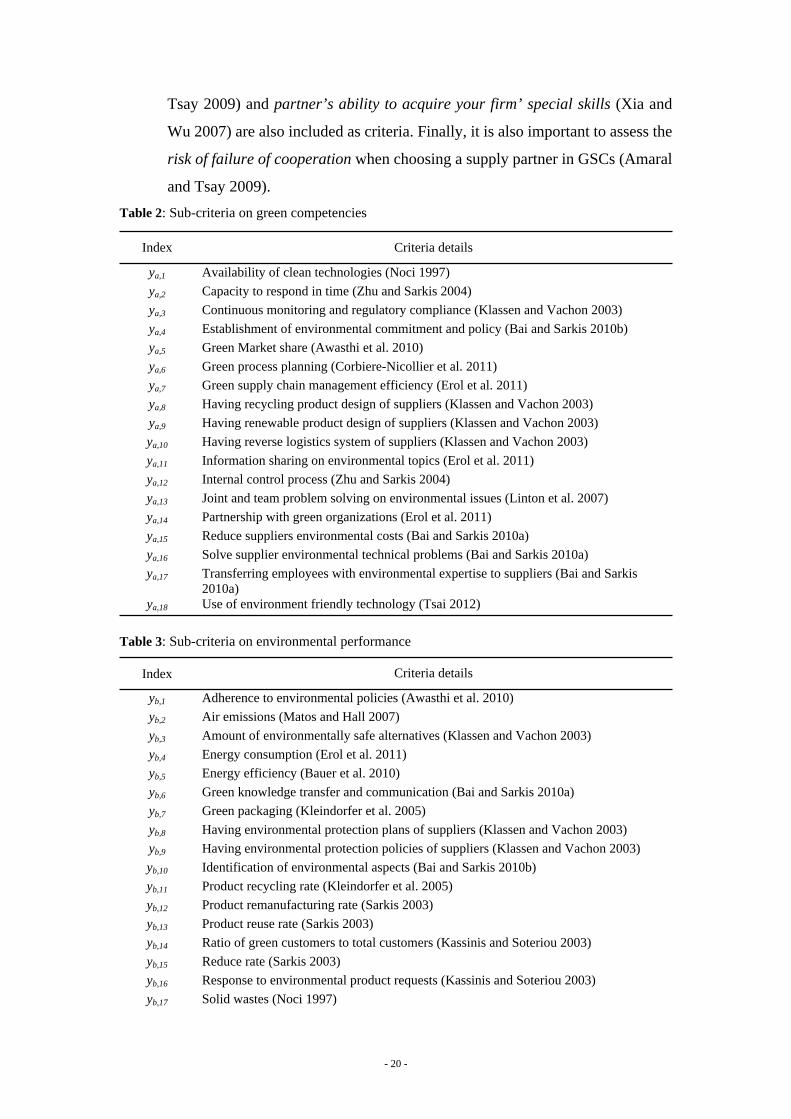
Table 2: Sub-criteria on green competencies
Table 3: Sub-criteria on environmental performance
Index Criteria details
ya,1 Availability of clean technologies (Noci 1997)
ya,2 Capacity to respond in time (Zhu and Sarkis 2004)
ya,3 Continuous monitoring and regulatory compliance (Klassen and Vachon 2003)
ya,4 Establishment of environmental commitment and policy (Bai and Sarkis 2010b)
ya,5 Green Market share (Awasthi et al. 2010)
ya,6 Green process planning (Corbiere-Nicollier et al. 2011)
ya,7 Green supply chain management efficiency (Erol et al. 2011)
ya,8 Having recycling product design of suppliers (Klassen and Vachon 2003)
ya,9 Having renewable product design of suppliers (Klassen and Vachon 2003)
ya,10 Having reverse logistics system of suppliers (Klassen and Vachon 2003)
ya,11 Information sharing on environmental topics (Erol et al. 2011)
ya,12 Internal control process (Zhu and Sarkis 2004)
ya,13 Joint and team problem solving on environmental issues (Linton et al. 2007)
ya,14 Partnership with green organizations (Erol et al. 2011)
ya,15 Reduce suppliers environmental costs (Bai and Sarkis 2010a)
ya,16 Solve supplier environmental technical problems (Bai and Sarkis 2010a)
ya,17 Transferring employees with environmental expertise to suppliers (Bai and Sarkis 2010a)
ya,18 Use of environment friendly technology (Tsai 2012)
Index Criteria details
yb,1 Adherence to environmental policies (Awasthi et al. 2010)
yb,2 Air emissions (Matos and Hall 2007)
yb,3 Amount of environmentally safe alternatives (Klassen and Vachon 2003)
yb,4 Energy consumption (Erol et al. 2011)
yb,5 Energy efficiency (Bauer et al. 2010)
yb,6 Green knowledge transfer and communication (Bai and Sarkis 2010a)
yb,7 Green packaging (Kleindorfer et al. 2005)
yb,8 Having environmental protection plans of suppliers (Klassen and Vachon 2003)
yb,9 Having environmental protection policies of suppliers (Klassen and Vachon 2003)
yb,10 Identification of environmental aspects (Bai and Sarkis 2010b)
yb,11 Product recycling rate (Kleindorfer et al. 2005)
yb,12 Product remanufacturing rate (Sarkis 2003)
yb,13 Product reuse rate (Sarkis 2003)
yb,14 Ratio of green customers to total customers (Kassinis and Soteriou 2003)
yb,15 Reduce rate (Sarkis 2003)
yb,16 Response to environmental product requests (Kassinis and Soteriou 2003)
yb,17 Solid wastes (Noci 1997)
- 21 -
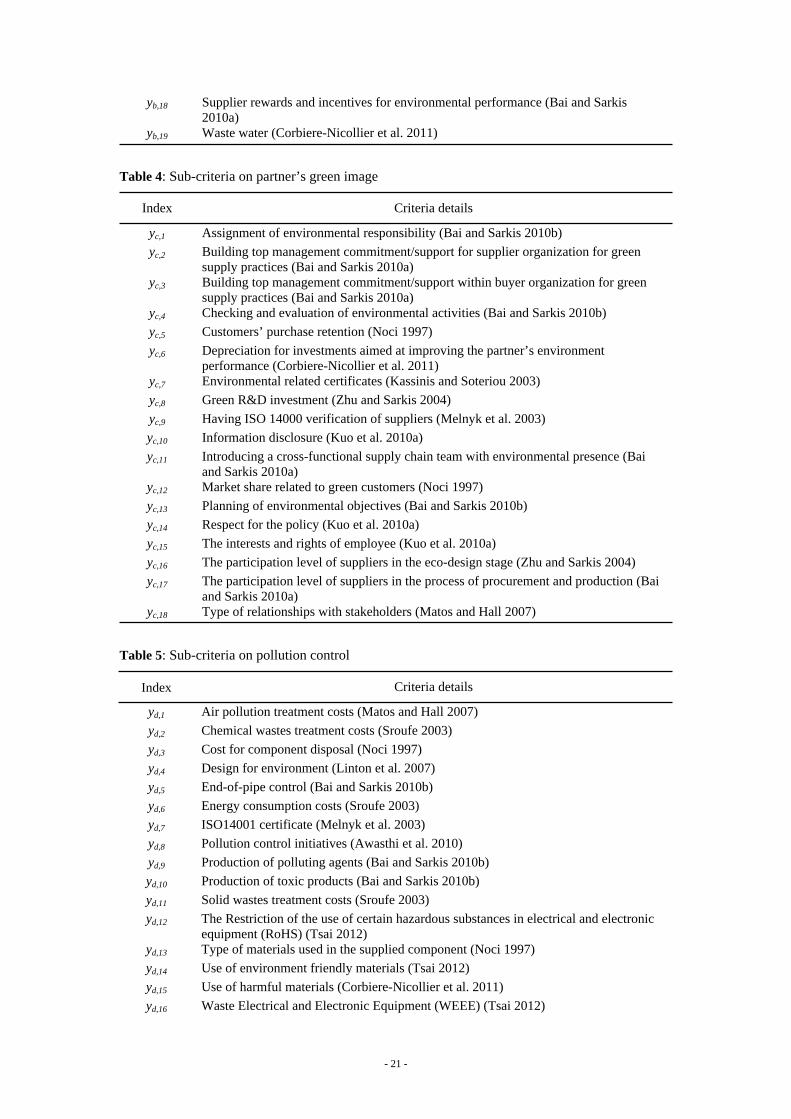
Table 4: Sub-criteria on partner’s green image
Index Criteria details
yc,1 Assignment of environmental responsibility (Bai and Sarkis 2010b)
yc,2 Building top management commitment/support for supplier organization for green supply practices (Bai and Sarkis 2010a)
yc,3 Building top management commitment/support within buyer organization for green supply practices (Bai and Sarkis 2010a)
yc,4 Checking and evaluation of environmental activities (Bai and Sarkis 2010b)
yc,5 Customers’ purchase retention (Noci 1997)
yc,6 Depreciation for investments aimed at improving the partner’s environment performance (Corbiere-Nicollier et al. 2011)
yc,7 Environmental related certificates (Kassinis and Soteriou 2003)
yc,8 Green R&D investment (Zhu and Sarkis 2004)
yc,9 Having ISO 14000 verification of suppliers (Melnyk et al. 2003)
yc,10 Information disclosure (Kuo et al. 2010a)
yc,11 Introducing a cross-functional supply chain team with environmental presence (Bai and Sarkis 2010a)
yc,12 Market share related to green customers (Noci 1997)
yc,13 Planning of environmental objectives (Bai and Sarkis 2010b)
yc,14 Respect for the policy (Kuo et al. 2010a)
yc,15 The interests and rights of employee (Kuo et al. 2010a)
yc,16 The participation level of suppliers in the eco-design stage (Zhu and Sarkis 2004)
yc,17 The participation level of suppliers in the process of procurement and production (Bai and Sarkis 2010a)
yc,18 Type of relationships with stakeholders (Matos and Hall 2007)
Table 5: Sub-criteria on pollution control
yb,18 Supplier rewards and incentives for environmental performance (Bai and Sarkis 2010a)
yb,19 Waste water (Corbiere-Nicollier et al. 2011)
Index Criteria details
yd,1 Air pollution treatment costs (Matos and Hall 2007)
yd,2 Chemical wastes treatment costs (Sroufe 2003)
yd,3 Cost for component disposal (Noci 1997)
yd,4 Design for environment (Linton et al. 2007)
yd,5 End-of-pipe control (Bai and Sarkis 2010b)
yd,6 Energy consumption costs (Sroufe 2003)
yd,7 ISO14001 certificate (Melnyk et al. 2003)
yd,8 Pollution control initiatives (Awasthi et al. 2010)
yd,9 Production of polluting agents (Bai and Sarkis 2010b)
yd,10 Production of toxic products (Bai and Sarkis 2010b)
yd,11 Solid wastes treatment costs (Sroufe 2003)
yd,12 The Restriction of the use of certain hazardous substances in electrical and electronic equipment (RoHS) (Tsai 2012)
yd,13 Type of materials used in the supplied component (Noci 1997)
yd,14 Use of environment friendly materials (Tsai 2012)
yd,15 Use of harmful materials (Corbiere-Nicollier et al. 2011)
yd,16 Waste Electrical and Electronic Equipment (WEEE) (Tsai 2012)
- 22 -
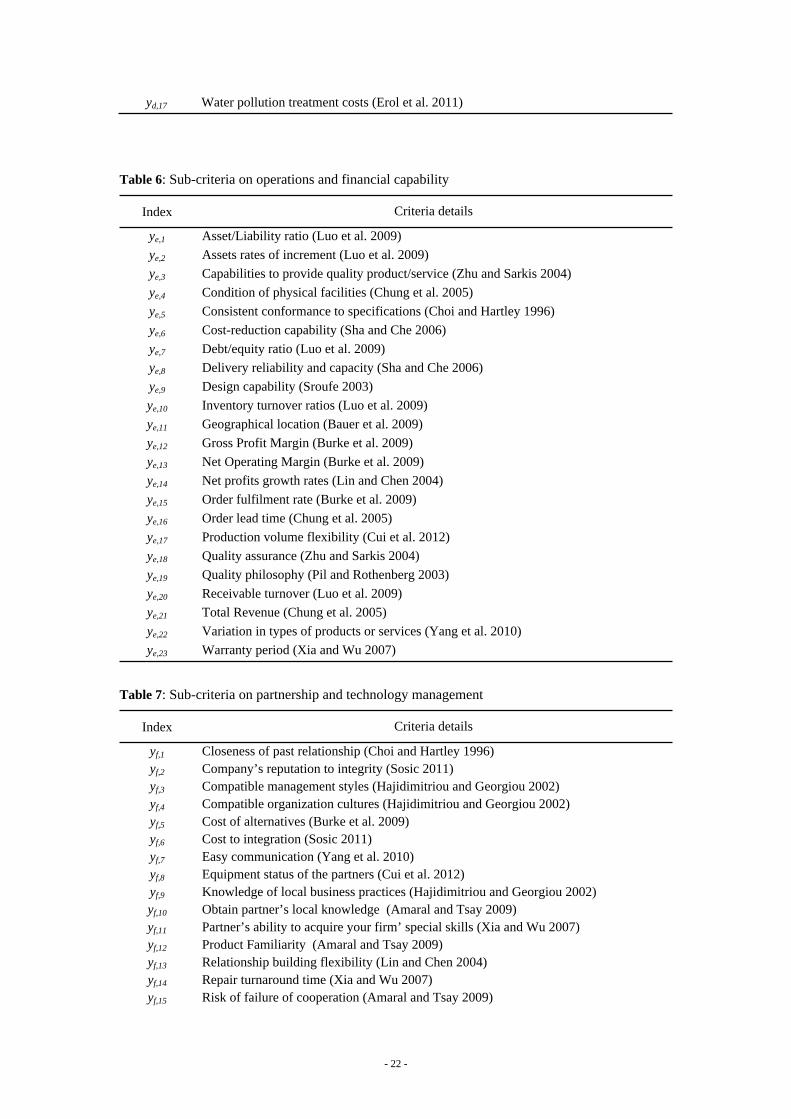
Table 6: Sub-criteria on operations and financial capability
Table 7: Sub-criteria on partnership and technology management
yd,17 Water pollution treatment costs (Erol et al. 2011)
Index Criteria details
ye,1 Asset/Liability ratio (Luo et al. 2009)
ye,2 Assets rates of increment (Luo et al. 2009)
ye,3 Capabilities to provide quality product/service (Zhu and Sarkis 2004)
ye,4 Condition of physical facilities (Chung et al. 2005)
ye,5 Consistent conformance to specifications (Choi and Hartley 1996)
ye,6 Cost-reduction capability (Sha and Che 2006)
ye,7 Debt/equity ratio (Luo et al. 2009)
ye,8 Delivery reliability and capacity (Sha and Che 2006)
ye,9 Design capability (Sroufe 2003)
ye,10 Inventory turnover ratios (Luo et al. 2009)
ye,11 Geographical location (Bauer et al. 2009)
ye,12 Gross Profit Margin (Burke et al. 2009)
ye,13 Net Operating Margin (Burke et al. 2009)
ye,14 Net profits growth rates (Lin and Chen 2004)
ye,15 Order fulfilment rate (Burke et al. 2009)
ye,16 Order lead time (Chung et al. 2005)
ye,17 Production volume flexibility (Cui et al. 2012)
ye,18 Quality assurance (Zhu and Sarkis 2004)
ye,19 Quality philosophy (Pil and Rothenberg 2003)
ye,20 Receivable turnover (Luo et al. 2009)
ye,21 Total Revenue (Chung et al. 2005)
ye,22 Variation in types of products or services (Yang et al. 2010)
ye,23 Warranty period (Xia and Wu 2007)
Index Criteria details
yf,1 Closeness of past relationship (Choi and Hartley 1996)yf,2 Company’s reputation to integrity (Sosic 2011)yf,3 Compatible management styles (Hajidimitriou and Georgiou 2002)yf,4 Compatible organization cultures (Hajidimitriou and Georgiou 2002)yf,5 Cost of alternatives (Burke et al. 2009)yf,6 Cost to integration (Sosic 2011)yf,7 Easy communication (Yang et al. 2010)yf,8 Equipment status of the partners (Cui et al. 2012)yf,9 Knowledge of local business practices (Hajidimitriou and Georgiou 2002)yf,10 Obtain partner’s local knowledge (Amaral and Tsay 2009)yf,11 Partner’s ability to acquire your firm’ special skills (Xia and Wu 2007)yf,12 Product Familiarity (Amaral and Tsay 2009)yf,13 Relationship building flexibility (Lin and Chen 2004)yf,14 Repair turnaround time (Xia and Wu 2007)yf,15 Risk of failure of cooperation (Amaral and Tsay 2009)
- 23 -
There are two main advantages of using the GSC-GHC, namely flexibility and
adaptability. On the one hand, given the different features of every specific GSC, the
GSC-GHC can be adapted to meet individual needs within partner selection resource
constraints. On the other hand, given that the information on different criteria may not
be completely certain, Dempster-Shafer theory can be used to assign a belief
acceptability to represent the bias of decision-makers (Shafer 1976). This is discussed
below.
Additionally, our proposal pays particular attention to a common phenomenon in multi-
attribute decision-making problems, namely attribute dependency. In this case, for any
target dimension criterion in the high and/or middle layer, decision-makers can generate
different meaningful combinations out of the criteria in the low layer and build the
subordinate criteria sets for the GSC-SHC and GSC-OHC. This is also discussed below.
4.2 GSC partner selection Specific Hierarchy Criteria construction
In the second stage, the output from the GSC-GHC construction is used to formulate
the GSC-SHC. Every GSC requires its own specific hierarchy criteria because every
GSC has distinctive characteristics, which arise from its industry and the stage of its
development. It is very hard to collect the required information on supplier’s
performance by simply using the same set of attributes across different industries. There
is not a one size “criteria set” fit for all industries (Genovese et al. 2015). During the
GSC-SHC construction sub-stage, decision-makers have the opportunities to build their
own partner selection hierarchy criteria in accordance with their specific requirements.
This requires the construction of a belief acceptability using the Dempster-Shafer
theory. To do this, we follow the approach of Wu and Barnes (2010).
Firstly, let us note the terminology inherent within the Dempster-Shafer theory, which
is somewhat different from that used in probability theory. (The notations used are set
out in Figure 3.)
yf,16 Special skills that you can learn from partners (Amaral and Tsay 2009)yf,17 Technical advice (Cui et al. 2012)yf,18 Technical capability (Cui et al. 2012)yf,19 Technology innovation (Yang et al. 2010)yf,20 Time needed to integration (Sosic 2011)

- 24 -
l layer index of configuration hierarchy, l = 1,2, . . . , L
yli the evaluation attribute i in layer l
yLi the evaluation attribute i which always located in the bottom layer of the attribute
configuration hierarchy
y11 the final aggregate evaluations attribute
Vlk the kth set of selected attributes s in layer l
Γ a general notation to represent the subordinate attributes set
j11Γ the jth subordinate attributes set of the final aggregate evaluation attribute
lijΓ the jth subordinate attributes set of its master attribute yli
m(·) the basic probability assignment function of a given proposition
m(lijΓ
)
the belief acceptability for of the master attribute ylilijΓ
π a general notation to represent the acceptability of an evaluation attribute
liπ the belief acceptability of the subordinate evaluation attribute yli
Vi the binary attribute selection variable that if the evaluation attributes is selected, then Vi =
1; otherwise Vi = 0
j the number of subsets on the different criteria groups of 3rd level hierarchy configuration
Figure 3: Notations used in the Dempster-Shafer theory (adopt from Wu and Barnes
2010: 292)
Let be a finite set of hypotheses (the frame of discernment). A basic x,, x,x n21 }…{=ϕ
probability assignment (bpa) is a function m: such that:]1,0[2 →ϕ
, and .0)( =φm ∑∈
=ϕ2
1)(x
xm
We use the notation because we have to consider the number of elements in the ϕ2
power set. All of the assigned probabilities sum to unity and there is no belief in the
empty set. Any subset x of the frame of discernment for which m(x) is non-zero is ϕ
called a focal element. A focal element represents the exact belief in the proposition
depicted by x. Possible propositions of interest are “the true value of z lies in Z”, where
. Thus, propositions are subsets. The value m(Z) represents the confidence that ϕ⊆Z
“the true value of z lies in Z, and not in any proper subset of Z ”.
Other measures of confidence can be defined based on the bpa. A belief measure is a
function . It is drawn from the sum of probabilities that are subsets of the ]1,0[2: →ϕBel
probabilities in question, defined by
- 25 -
, for all .∑⊆
=AB
BmABel )()( ϕ⊆A
This represents the confidence that the value of z lies in A or any subset of A. A
plausibility measure is a function Pls: , defined by]1,0[2 →ϕ
, for all ∑≠∩
=φAB
BmAPls )()( ϕ⊆A
Pls(A) represents the extent to which we fail to disbelieve A. These measures are clearly
related to one another, for example,
and ,)(1)( APlsABel −= )(1)( ABelAPls −=
where refers to ‘not A’, also Bel( ) is often called the doubt in A. Another notable A A
relationship includes;
, .1)()( ≤+ ABelABel 1)()( ≥+ APlsAPls
These two inequalities represent a major difference from the traditional simple
probability function used in the Bayesian approach. However, when each of the focal
elements are singletons, we can revert to traditional Bayesian analysis incorporating
normal probability theory, because in this case Bel(A) = Pls(A).
For any given green supply chain, taking into account its individual characteristics and
the judgment bias due to incomplete and inaccurate information used by the decision-
makers, a GSC-SHC can be extracted from the GSC-GHC with assigned belief
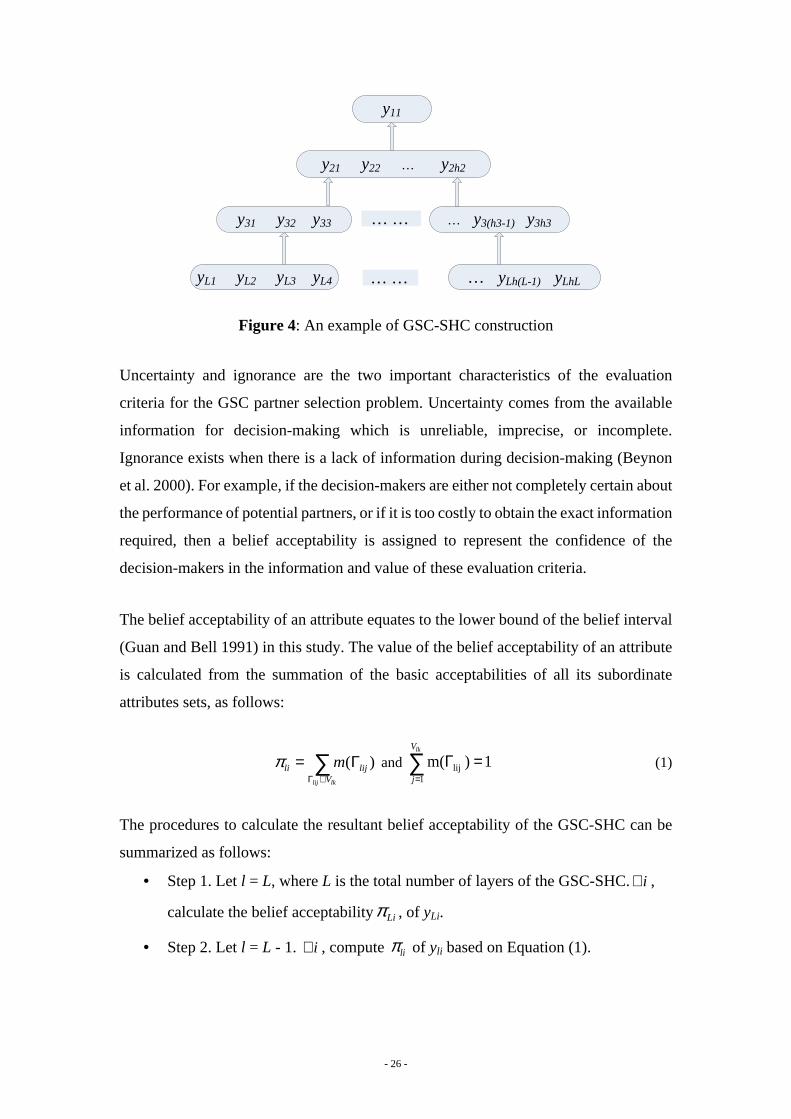
acceptabilities. An illustrative example of the GSC-SHC, where
represents the subordinate attributes set in the lower layer },{ jyyV lijlililikklk ∀Γ∈=Γ∪=
of the master evaluation criterion, yli is shown in Figure 4.
- 26 -
y11
y21 y22 … y2h2
y31 y32 y33 … y3(h3-1) y3h3
yL1 yL2 yL3 yL4 … … … yLh(L-1) yLhL
… …
Figure 4: An example of GSC-SHC construction
Uncertainty and ignorance are the two important characteristics of the evaluation
criteria for the GSC partner selection problem. Uncertainty comes from the available
information for decision-making which is unreliable, imprecise, or incomplete.
Ignorance exists when there is a lack of information during decision-making (Beynon
et al. 2000). For example, if the decision-makers are either not completely certain about
the performance of potential partners, or if it is too costly to obtain the exact information
required, then a belief acceptability is assigned to represent the confidence of the
decision-makers in the information and value of these evaluation criteria.
The belief acceptability of an attribute equates to the lower bound of the belief interval
(Guan and Bell 1991) in this study. The value of the belief acceptability of an attribute
is calculated from the summation of the basic acceptabilities of all its subordinate
attributes sets, as follows:
and (1)∑⊂Γ
Γ=lklij V
lijli m )(π 1)m(1
lij =Γ∑=
lkV
j
The procedures to calculate the resultant belief acceptability of the GSC-SHC can be
summarized as follows:
• Step 1. Let l = L, where L is the total number of layers of the GSC-SHC. , i∀
calculate the belief acceptability , of yLi.Liπ
• Step 2. Let l = L - 1. , compute of yli based on Equation (1).i∀ liπ
- 27 -
• Step 3. , repeat step 2 and calculate for y(L - 3)i, y(L - 4)i,. . ., y1i, and y11, i∀ liπ
respectively, y11 is the resultant favourability attribute of the GSC-SHC.
4.3 GSC partner selection Optimization Hierarchy Criteria construction
The final stage of the process is the construction of the GSC-OHC based on the output
of previous sub-process - the GSC-SHC. During this stage, as the evaluation scope has
been reduced further, the usage of evaluation resources needs to be strictly controlled.
This is because, in practice, any organization has only limited resources available. If no
reasonable trade-off between evaluation scope and evaluation resources were made, the
partner selection hierarchy criteria construction task is potentially inefficient and
unfeasible (Tsai 2012). Thus, obtaining the GSC-OHC requires balancing the scope of
evaluation, the belief acceptability and the usage of evaluation resources
simultaneously. In this research, we propose to do this by developing a PSO based
multiple objective programming model.
The proposed multiple-objective programming model contains two main objectives,
namely, maximizing the total belief acceptability of the GSC-OHC and minimizing the
human resource usage (including management and administration work) during the
criteria construction process. The constraints of the programming model include the
total financial costs related to each selected criterion. The optimization multiple-
objective model and constraints for the evaluation criteria are introduced as follows:
Max. ( ) (2)li il i
Vπ ×∑∑
Min. ( ) (3)li il i
h V×∑∑
s.t.:
k (4)ik i k
i
f V f× ≤∑ ∀
Vi = 0 or 1 i (5)∀
j (6)1
1j
ii
V=
≤∑ ∀
- 28 -
In more detail, objective (2) seeks to maximize the total belief acceptability of the final
GSC-OHC, whilst objective (3) seeks to minimize the required human resource usage
to construct it. At the same time, inequality (4) constrains the total financial costs of the
final GSC-OHC to equal or less than the available amount of financial resources (fk).
Equation (5) constrains the criteria selection variables to a binary value. Last but not
least, inequality (6) constrains each criterion to appear only once in the final GSC-OHC.
In the PSO algorithm, particles are represented as Xa = (xa1, xa2, … , xaM). This
expression represents a potential solution to a problem in M-dimensional space. The
velocity of this particle can be represented as Va = (va1, va2, … , vaM). In addition, the
best previous position of each particle is defined as pbest. The global best position of
the whole swarm found so far is defined as gbest. The updating rule is:
(7)11 1 2 2() ( ) () ( )n n n n
am am am amv wv c rand pbest x c rand gbest x+ = + × × − + × × −
(8)1 1n n nam am amx x v+ += +
in which, a is the particle index,
m is the dimension index,
n is the number of iterations,
w is the inertia weight,
c1 and c2 are acceleration constants,
rand1() and rand2() are independent random variables within [0, 1].
Equation (7) is applied to calculate the particle’s new velocity in accordance with its
previous velocity and the distances of its current position from the group’s best position
and its own best position (Huang et al. 2011). Rand numbers in the Equation (7) are
independent variables which can serve as the weights of speed moving towards gbest
and pbest for updating positions. Through varying the above random numbers, particle
a will attempt to move towards the best particle and provides coverage of solution space
of the potentially good solutions (Zhao et al. 2008). Equation (8), then, is used to
calculate the particle flies toward a new position. The pseudo code of the PSO algorithm
and the procedure of the PSO algorithm are shown in Appendices A and B.
- 29 -
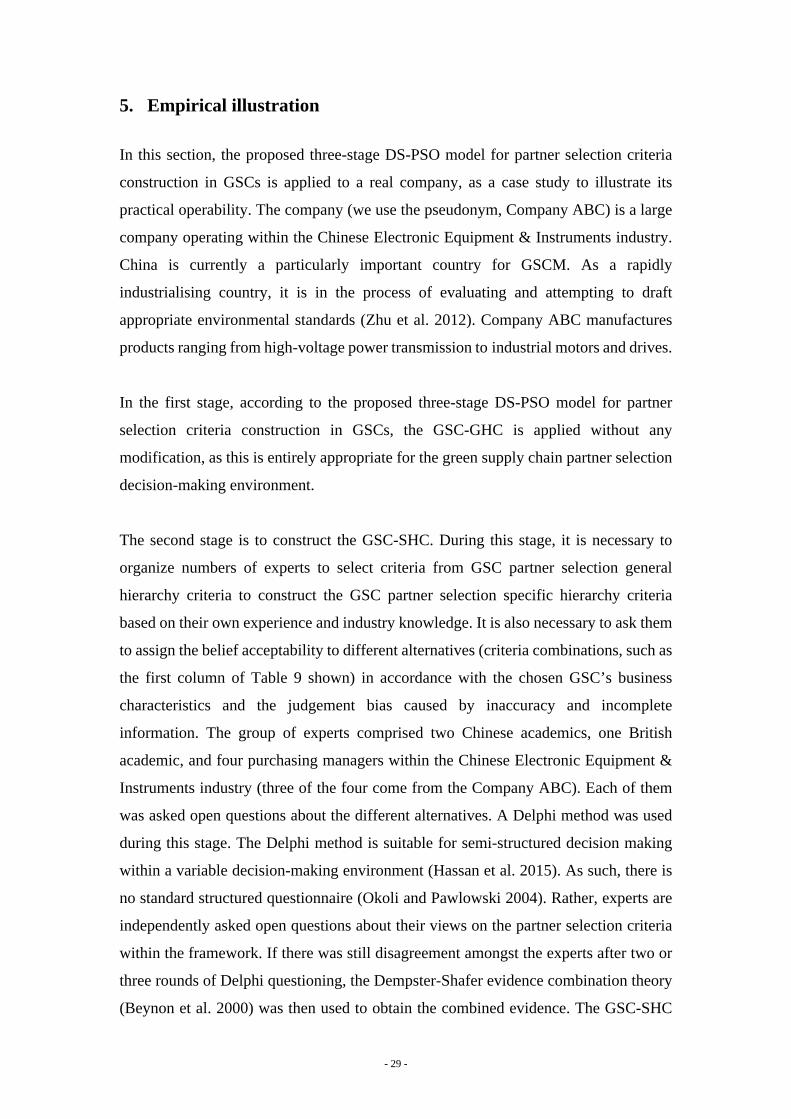
5. Empirical illustration
In this section, the proposed three-stage DS-PSO model for partner selection criteria
construction in GSCs is applied to a real company, as a case study to illustrate its
practical operability. The company (we use the pseudonym, Company ABC) is a large
company operating within the Chinese Electronic Equipment & Instruments industry.
China is currently a particularly important country for GSCM. As a rapidly
industrialising country, it is in the process of evaluating and attempting to draft
appropriate environmental standards (Zhu et al. 2012). Company ABC manufactures
products ranging from high-voltage power transmission to industrial motors and drives.
In the first stage, according to the proposed three-stage DS-PSO model for partner
selection criteria construction in GSCs, the GSC-GHC is applied without any
modification, as this is entirely appropriate for the green supply chain partner selection
decision-making environment.
The second stage is to construct the GSC-SHC. During this stage, it is necessary to
organize numbers of experts to select criteria from GSC partner selection general
hierarchy criteria to construct the GSC partner selection specific hierarchy criteria
based on their own experience and industry knowledge. It is also necessary to ask them
to assign the belief acceptability to different alternatives (criteria combinations, such as
the first column of Table 9 shown) in accordance with the chosen GSC’s business
characteristics and the judgement bias caused by inaccuracy and incomplete
information. The group of experts comprised two Chinese academics, one British
academic, and four purchasing managers within the Chinese Electronic Equipment &
Instruments industry (three of the four come from the Company ABC). Each of them
was asked open questions about the different alternatives. A Delphi method was used
during this stage. The Delphi method is suitable for semi-structured decision making
within a variable decision-making environment (Hassan et al. 2015). As such, there is
no standard structured questionnaire (Okoli and Pawlowski 2004). Rather, experts are
independently asked open questions about their views on the partner selection criteria
within the framework. If there was still disagreement amongst the experts after two or
three rounds of Delphi questioning, the Dempster-Shafer evidence combination theory
(Beynon et al. 2000) was then used to obtain the combined evidence. The GSC-SHC
- 30 -
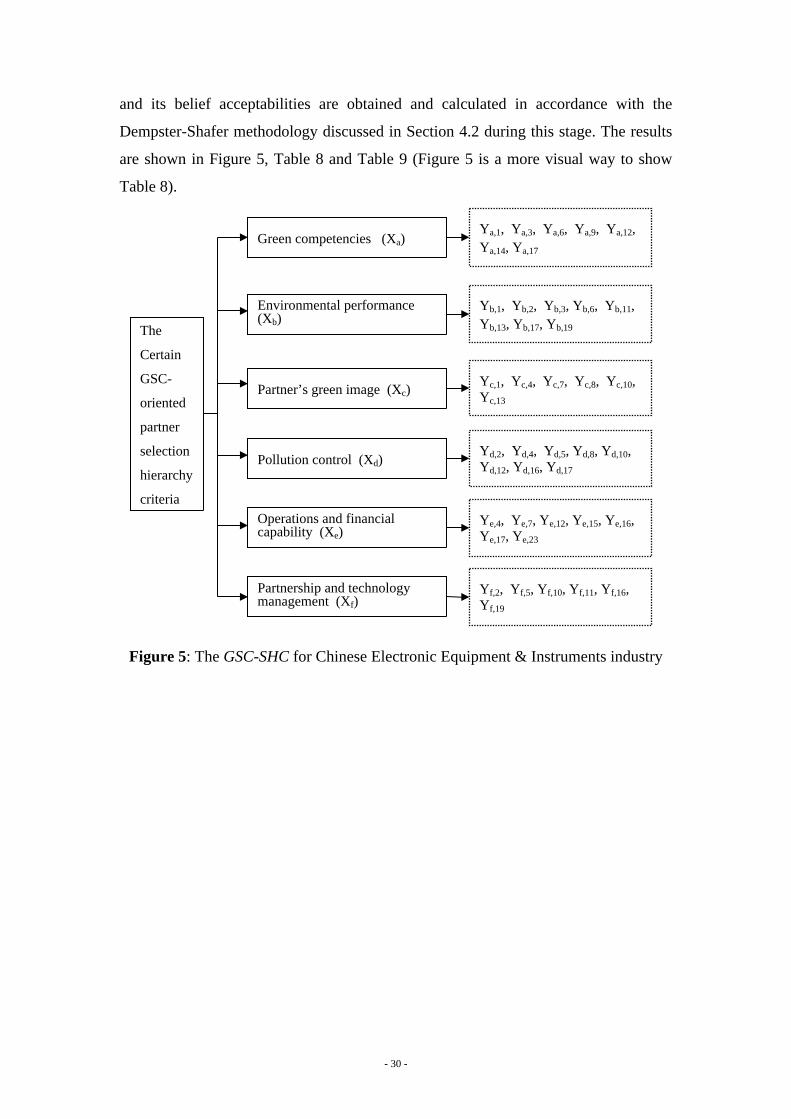
and its belief acceptabilities are obtained and calculated in accordance with the
Dempster-Shafer methodology discussed in Section 4.2 during this stage. The results
are shown in Figure 5, Table 8 and Table 9 (Figure 5 is a more visual way to show
Table 8).
Green competencies (Xa)
The
Certain
GSC-
oriented
partner
selection
hierarchy
criteria
Partner’s green image (Xc)
Pollution control (Xd)
Partnership and technology management (Xf)
Environmental performance (Xb)
Ya,1, Ya,3, Ya,6, Ya,9, Ya,12, Ya,14, Ya,17
Operations and financial capability (Xe)
Yb,1, Yb,2, Yb,3, Yb,6, Yb,11, Yb,13, Yb,17, Yb,19
Yc,1, Yc,4, Yc,7, Yc,8, Yc,10, Yc,13
Yd,2, Yd,4, Yd,5, Yd,8, Yd,10, Yd,12, Yd,16, Yd,17
Ye,4, Ye,7, Ye,12, Ye,15, Ye,16, Ye,17, Ye,23
Yf,2, Yf,5, Yf,10, Yf,11, Yf,16, Yf,19
Figure 5: The GSC-SHC for Chinese Electronic Equipment & Instruments industry
- 31 -
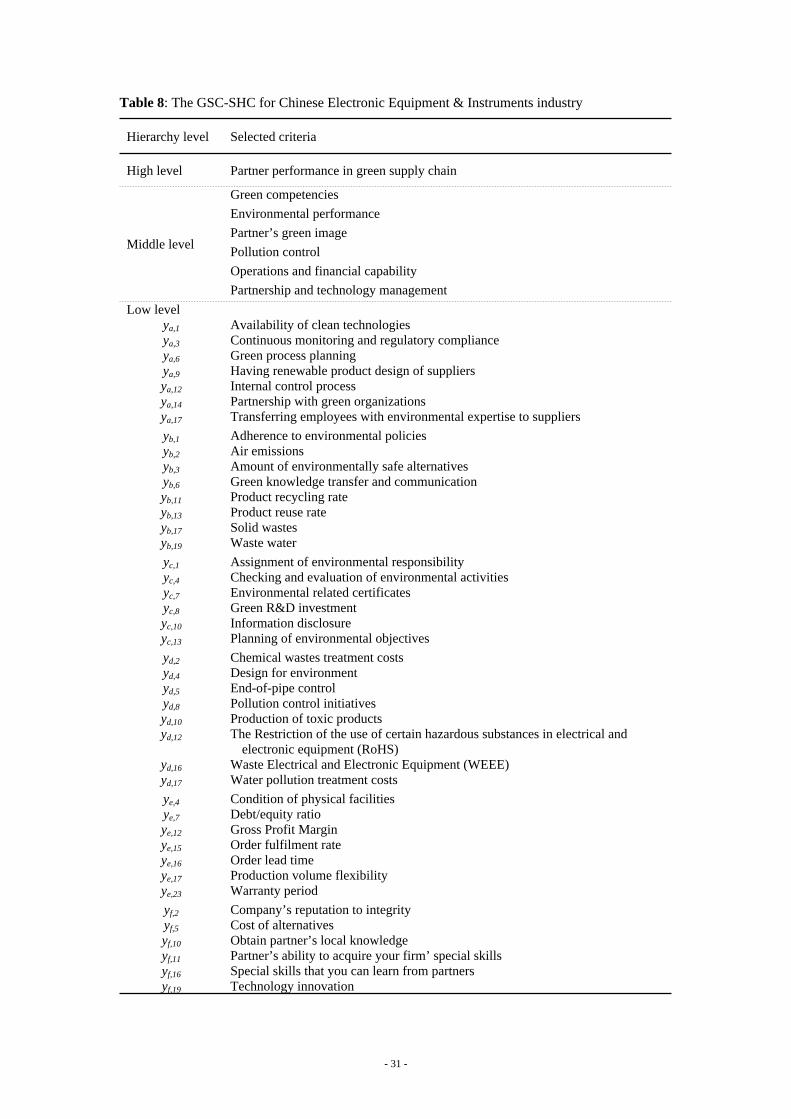
Table 8: The GSC-SHC for Chinese Electronic Equipment & Instruments industry
Hierarchy level Selected criteria
High level Partner performance in green supply chain
Middle level
Green competencies
Environmental performance
Partner’s green image
Pollution control
Operations and financial capability
Partnership and technology management
Low levelya,1 Availability of clean technologiesya,3 Continuous monitoring and regulatory compliance ya,6 Green process planning ya,9 Having renewable product design of suppliers ya,12 Internal control process ya,14 Partnership with green organizations ya,17 Transferring employees with environmental expertise to suppliers
yb,1 Adherence to environmental policiesyb,2 Air emissions yb,3 Amount of environmentally safe alternativesyb,6 Green knowledge transfer and communicationyb,11 Product recycling rate yb,13 Product reuse rate yb,17 Solid wastes yb,19 Waste water
yc,1 Assignment of environmental responsibility yc,4 Checking and evaluation of environmental activitiesyc,7 Environmental related certificates yc,8 Green R&D investment yc,10 Information disclosureyc,13 Planning of environmental objectives
yd,2 Chemical wastes treatment costsyd,4 Design for environmentyd,5 End-of-pipe controlyd,8 Pollution control initiativesyd,10 Production of toxic productsyd,12 The Restriction of the use of certain hazardous substances in electrical and
electronic equipment (RoHS)yd,16 Waste Electrical and Electronic Equipment (WEEE)yd,17 Water pollution treatment costs
ye,4 Condition of physical facilities ye,7 Debt/equity ratio ye,12 Gross Profit Marginye,15 Order fulfilment rate ye,16 Order lead time ye,17 Production volume flexibilityye,23 Warranty period
yf,2 Company’s reputation to integrityyf,5 Cost of alternativesyf,10 Obtain partner’s local knowledgeyf,11 Partner’s ability to acquire your firm’ special skillsyf,16 Special skills that you can learn from partnersyf,19 Technology innovation
- 32 -
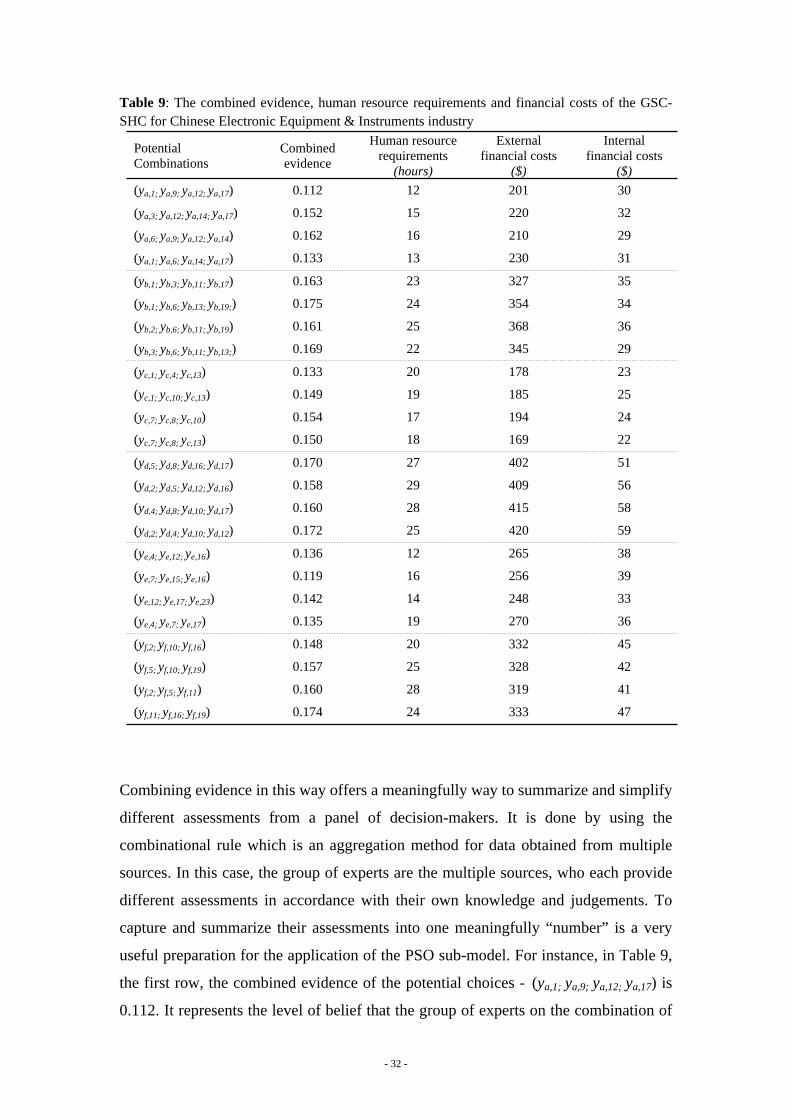
Table 9: The combined evidence, human resource requirements and financial costs of the GSC-SHC for Chinese Electronic Equipment & Instruments industry
Potential Combinations
Combined evidence
Human resource requirements
(hours)
External financial costs
($)
Internal financial costs
($)
(ya,1; ya,9; ya,12; ya,17) 0.112 12 201 30
(ya,3; ya,12; ya,14; ya,17) 0.152 15 220 32
(ya,6; ya,9; ya,12; ya,14) 0.162 16 210 29
(ya,1; ya,6; ya,14; ya,17) 0.133 13 230 31
(yb,1; yb,3; yb,11; yb,17) 0.163 23 327 35
(yb,1; yb,6; yb,13; yb,19;) 0.175 24 354 34
(yb,2; yb,6; yb,11; yb,19) 0.161 25 368 36
(yb,3; yb,6; yb,11; yb,13;) 0.169 22 345 29
(yc,1; yc,4; yc,13) 0.133 20 178 23
(yc,1; yc,10; yc,13) 0.149 19 185 25
(yc,7; yc,8; yc,10) 0.154 17 194 24
(yc,7; yc,8; yc,13) 0.150 18 169 22
(yd,5; yd,8; yd,16; yd,17) 0.170 27 402 51
(yd,2; yd,5; yd,12; yd,16) 0.158 29 409 56
(yd,4; yd,8; yd,10; yd,17) 0.160 28 415 58
(yd,2; yd,4; yd,10; yd,12) 0.172 25 420 59
(ye,4; ye,12; ye,16) 0.136 12 265 38
(ye,7; ye,15; ye,16) 0.119 16 256 39
(ye,12; ye,17; ye,23) 0.142 14 248 33
(ye,4; ye,7; ye,17) 0.135 19 270 36
(yf,2; yf,10; yf,16) 0.148 20 332 45
(yf,5; yf,10; yf,19) 0.157 25 328 42
(yf,2; yf,5; yf,11) 0.160 28 319 41
(yf,11; yf,16; yf,19) 0.174 24 333 47
Combining evidence in this way offers a meaningfully way to summarize and simplify
different assessments from a panel of decision-makers. It is done by using the
combinational rule which is an aggregation method for data obtained from multiple
sources. In this case, the group of experts are the multiple sources, who each provide
different assessments in accordance with their own knowledge and judgements. To
capture and summarize their assessments into one meaningfully “number” is a very
useful preparation for the application of the PSO sub-model. For instance, in Table 9,
the first row, the combined evidence of the potential choices - (ya,1; ya,9; ya,12; ya,17) is
0.112. It represents the level of belief that the group of experts on the combination of
- 33 -
criteria (ya,1; ya,9; ya,12; ya,17) under Green Competencies sub-criteria. (Appendix C shows
an example of the combined evidence calculation). From Table 9 we can see that
different criteria combinations have different combined evidence. These “numbers”
(the combined evidence) represent the different levels of belief the decision-makers
have on different possible criteria combinations. The higher the “number”, the higher
level of belief the decision-makers have. In addition, each possible criteria combination
corresponds to different managerial resource requirements. Therefore, it becomes an
optimization problem which will be solved in the following step by PSO sub-model
shown in Section 4.3.
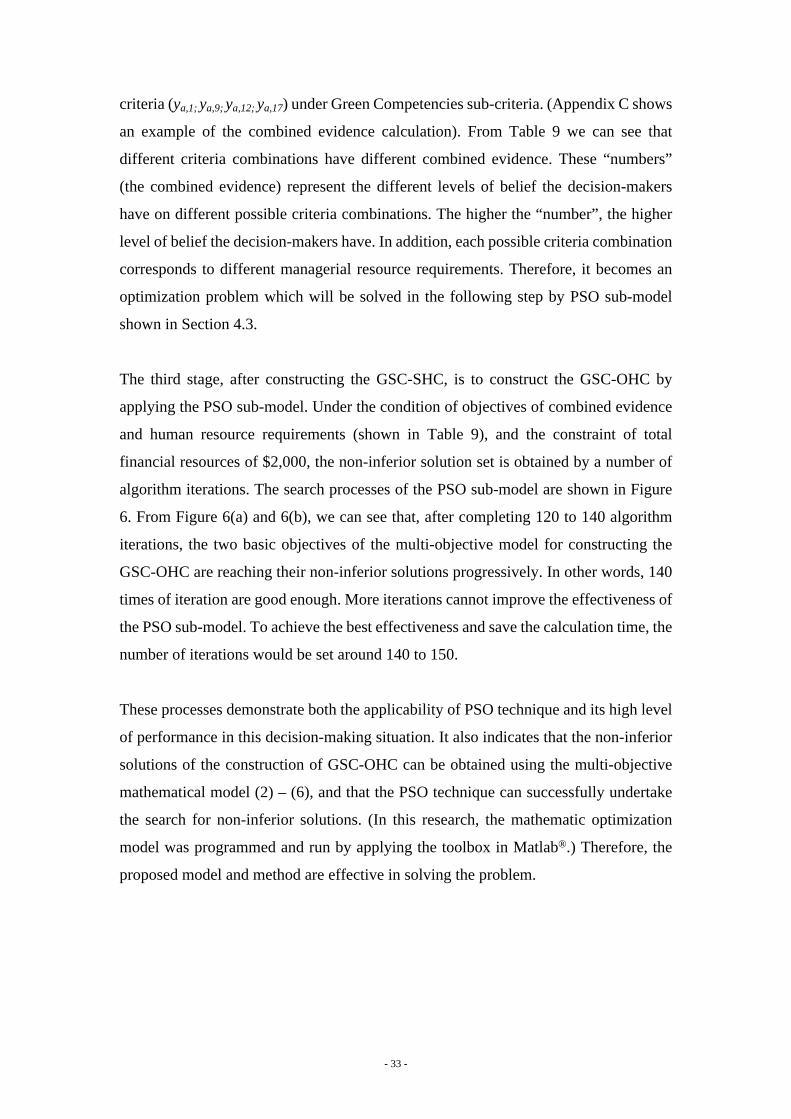
The third stage, after constructing the GSC-SHC, is to construct the GSC-OHC by
applying the PSO sub-model. Under the condition of objectives of combined evidence
and human resource requirements (shown in Table 9), and the constraint of total
financial resources of $2,000, the non-inferior solution set is obtained by a number of
algorithm iterations. The search processes of the PSO sub-model are shown in Figure
6. From Figure 6(a) and 6(b), we can see that, after completing 120 to 140 algorithm
iterations, the two basic objectives of the multi-objective model for constructing the
GSC-OHC are reaching their non-inferior solutions progressively. In other words, 140
times of iteration are good enough. More iterations cannot improve the effectiveness of
the PSO sub-model. To achieve the best effectiveness and save the calculation time, the
number of iterations would be set around 140 to 150.
These processes demonstrate both the applicability of PSO technique and its high level
of performance in this decision-making situation. It also indicates that the non-inferior
solutions of the construction of GSC-OHC can be obtained using the multi-objective
mathematical model (2) – (6), and that the PSO technique can successfully undertake
the search for non-inferior solutions. (In this research, the mathematic optimization
model was programmed and run by applying the toolbox in Matlab®.) Therefore, the
proposed model and method are effective in solving the problem.
- 34 -
0 20 40 60 80 100 120 140 160 180 200
0.925
0.93
0.935
0.94
0.945
0.95
0.955
0.96
Evolvement generations
Opt
imal
Bel
ief
Acc
epta
bili
ty
(a)
0 20 40 60 80 100 120 140 160 180 200114
115
116
117
118
119
120
Evolvement generations
Opt
imal
Hum
an R
esou
rces
Req
uire
men
t
(b)
Figure 6: Search process of the PSO technique
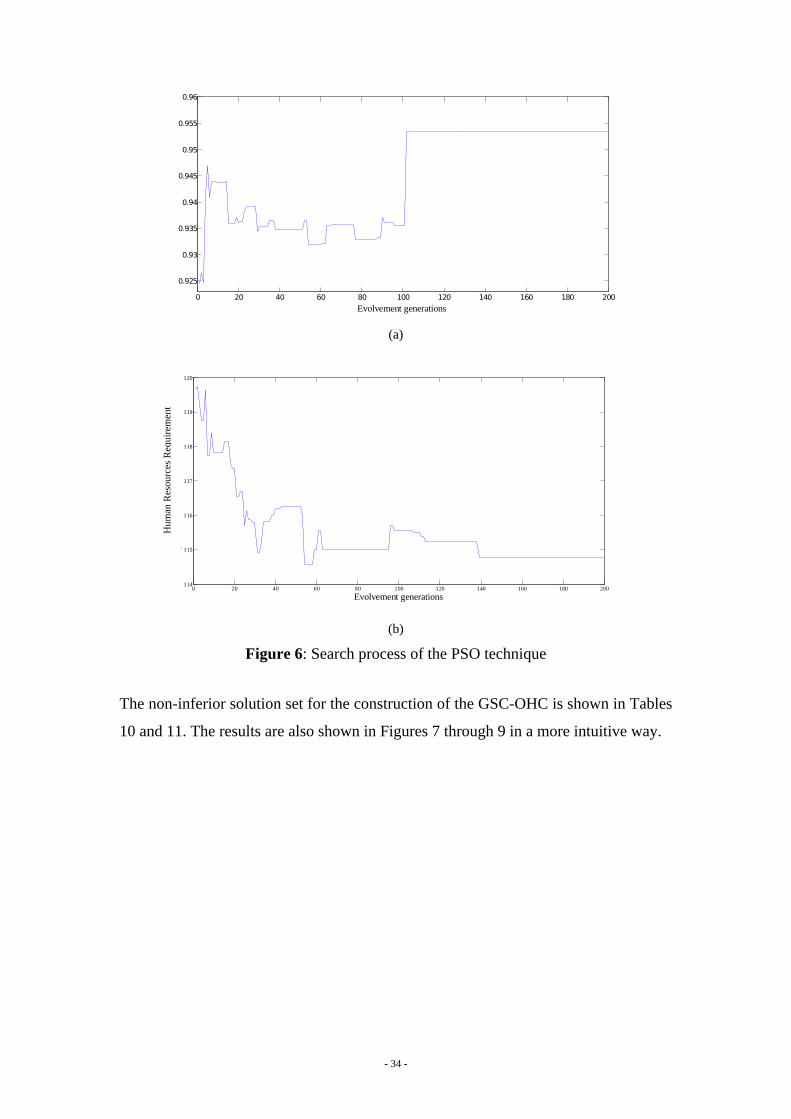
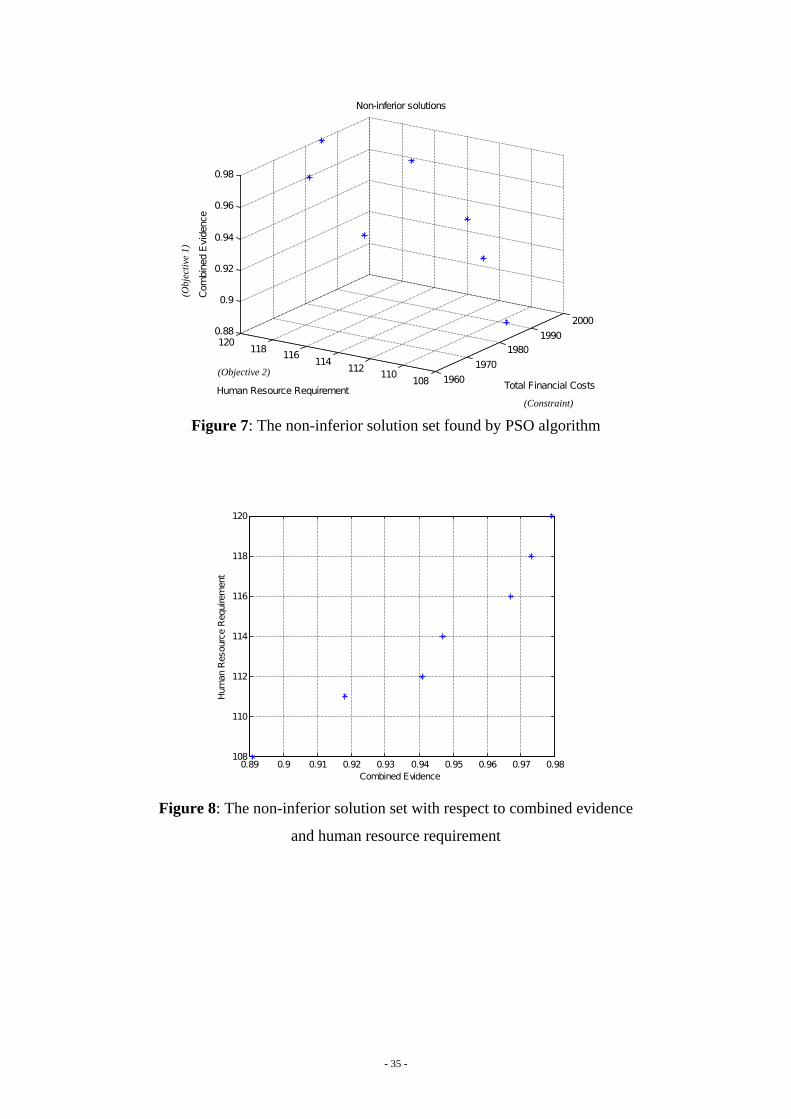
The non-inferior solution set for the construction of the GSC-OHC is shown in Tables
10 and 11. The results are also shown in Figures 7 through 9 in a more intuitive way.
Hum
an R
esou
rces
Req
uire
men
t
- 35 -
19601970
19801990
2000
1081101121141161181200.88
0.9
0.92
0.94
0.96
0.98
Total Financial Costs
Non-inferior solutions
Human Resource Requirement
Com
bine
d Ev
iden
ce
Figure 7: The non-inferior solution set found by PSO algorithm
0.89 0.9 0.91 0.92 0.93 0.94 0.95 0.96 0.97 0.98108
110
112
114
116
118
120
Combined Evidence
Hum
an R
esou
rce
Requ
irem
ent
Figure 8: The non-inferior solution set with respect to combined evidence
and human resource requirement
(Constraint)
(Objective 2)
(Obj
ecti
ve 1
)
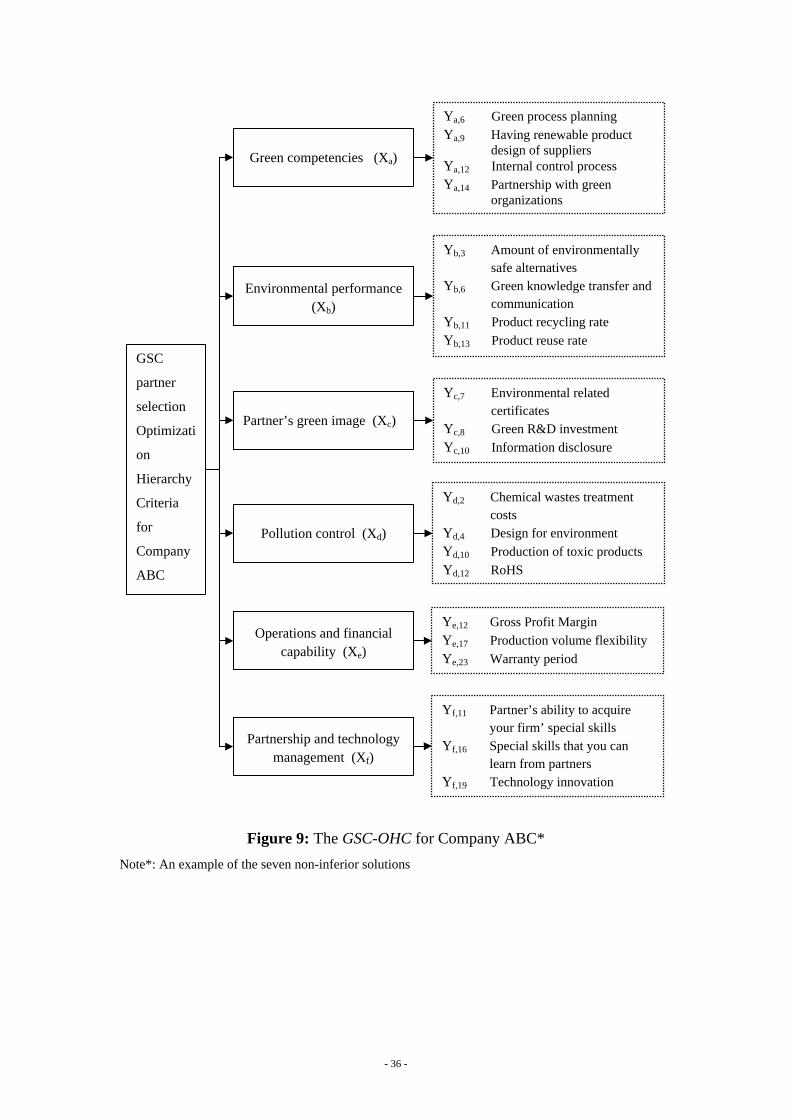
- 36 -
Green competencies (Xa)
GSC
partner
selection
Optimizati
on
Hierarchy
Criteria
for
Company
ABC
Partner’s green image (Xc)
Pollution control (Xd)
Partnership and technology management (Xf)
Environmental performance (Xb)
Ya,6 Green process planningYa,9 Having renewable product
design of suppliersYa,12 Internal control processYa,14 Partnership with green
organizations
Operations and financial capability (Xe)
Yb,3 Amount of environmentally safe alternatives
Yb,6 Green knowledge transfer and communication
Yb,11 Product recycling rateYb,13 Product reuse rate
Yc,7 Environmental related certificates
Yc,8 Green R&D investmentYc,10 Information disclosure
Yd,2 Chemical wastes treatment costs
Yd,4 Design for environmentYd,10 Production of toxic productsYd,12 RoHS
Ye,12 Gross Profit MarginYe,17 Production volume flexibilityYe,23 Warranty period
Yf,11 Partner’s ability to acquire your firm’ special skills
Yf,16 Special skills that you can learn from partners
Yf,19 Technology innovation
Figure 9: The GSC-OHC for Company ABC*
Note*: An example of the seven non-inferior solutions

- 37 -
Table 8: The GSC-SHC for Chinese Electronic Equipment & Instruments industry
Hierarchy level Selected criteria
High level Partner performance in green supply chain
Middle level
Green competencies
Environmental performance
Partner’s green image
Pollution control
Operations and financial capability
Partnership and technology management
Low levelya,1 Availability of clean technologiesya,3 Continuous monitoring and regulatory compliance ya,6 Green process planning ya,9 Having renewable product design of suppliers ya,12 Internal control process ya,14 Partnership with green organizations ya,17 Transferring employees with environmental expertise to suppliers
yb,1 Adherence to environmental policiesyb,2 Air emissions yb,3 Amount of environmentally safe alternativesyb,6 Green knowledge transfer and communicationyb,11 Product recycling rate yb,13 Product reuse rate yb,17 Solid wastes yb,19 Waste water
yc,1 Assignment of environmental responsibility yc,4 Checking and evaluation of environmental activitiesyc,7 Environmental related certificates yc,8 Green R&D investment yc,10 Information disclosureyc,13 Planning of environmental objectives
yd,2 Chemical wastes treatment costsyd,4 Design for environmentyd,5 End-of-pipe controlyd,8 Pollution control initiativesyd,10 Production of toxic productsyd,12 The Restriction of the use of certain hazardous substances in electrical and
electronic equipment (RoHS)yd,16 Waste Electrical and Electronic Equipment (WEEE)yd,17 Water pollution treatment costs
ye,4 Condition of physical facilities ye,7 Debt/equity ratio ye,12 Gross Profit Marginye,15 Order fulfilment rate ye,16 Order lead time ye,17 Production volume flexibilityye,23 Warranty period
yf,2 Company’s reputation to integrityyf,5 Cost of alternativesyf,10 Obtain partner’s local knowledgeyf,11 Partner’s ability to acquire your firm’ special skillsyf,16 Special skills that you can learn from partnersyf,19 Technology innovation
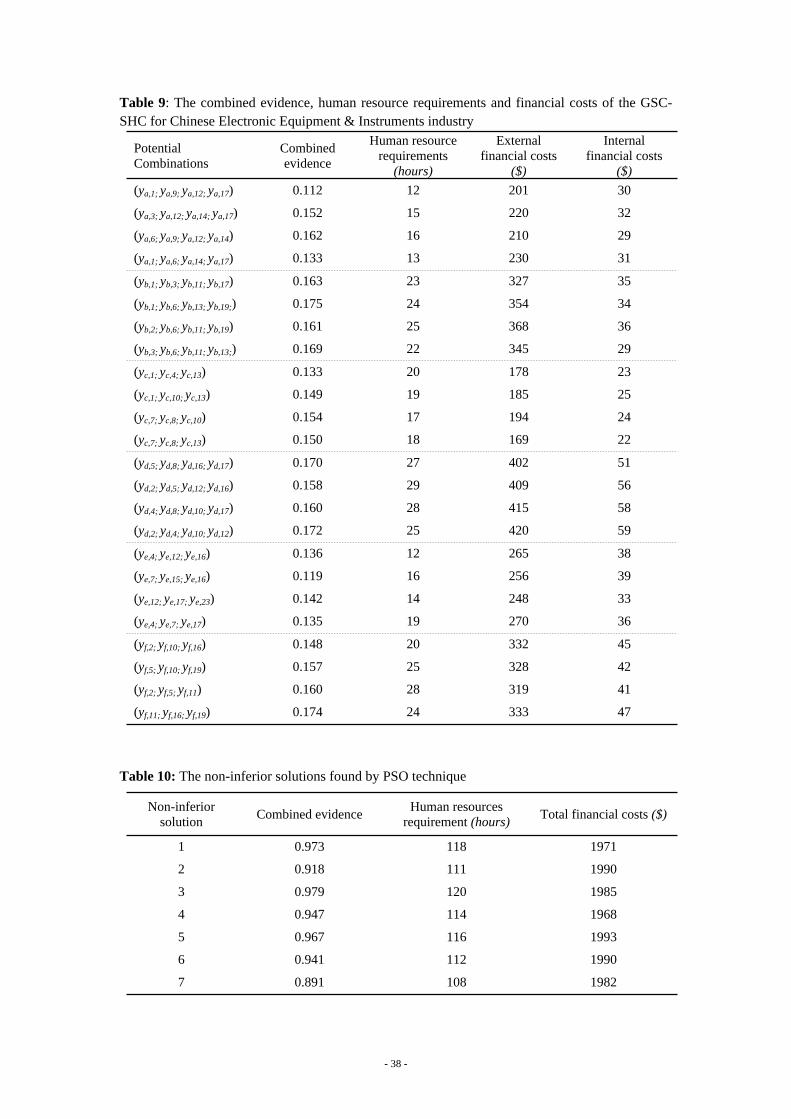
- 38 -
Table 9: The combined evidence, human resource requirements and financial costs of the GSC-SHC for Chinese Electronic Equipment & Instruments industry
Potential Combinations
Combined evidence
Human resource requirements
(hours)
External financial costs
($)
Internal financial costs
($)
(ya,1; ya,9; ya,12; ya,17) 0.112 12 201 30
(ya,3; ya,12; ya,14; ya,17) 0.152 15 220 32
(ya,6; ya,9; ya,12; ya,14) 0.162 16 210 29
(ya,1; ya,6; ya,14; ya,17) 0.133 13 230 31
(yb,1; yb,3; yb,11; yb,17) 0.163 23 327 35
(yb,1; yb,6; yb,13; yb,19;) 0.175 24 354 34
(yb,2; yb,6; yb,11; yb,19) 0.161 25 368 36
(yb,3; yb,6; yb,11; yb,13;) 0.169 22 345 29
(yc,1; yc,4; yc,13) 0.133 20 178 23
(yc,1; yc,10; yc,13) 0.149 19 185 25
(yc,7; yc,8; yc,10) 0.154 17 194 24
(yc,7; yc,8; yc,13) 0.150 18 169 22
(yd,5; yd,8; yd,16; yd,17) 0.170 27 402 51
(yd,2; yd,5; yd,12; yd,16) 0.158 29 409 56
(yd,4; yd,8; yd,10; yd,17) 0.160 28 415 58
(yd,2; yd,4; yd,10; yd,12) 0.172 25 420 59
(ye,4; ye,12; ye,16) 0.136 12 265 38
(ye,7; ye,15; ye,16) 0.119 16 256 39
(ye,12; ye,17; ye,23) 0.142 14 248 33
(ye,4; ye,7; ye,17) 0.135 19 270 36
(yf,2; yf,10; yf,16) 0.148 20 332 45
(yf,5; yf,10; yf,19) 0.157 25 328 42
(yf,2; yf,5; yf,11) 0.160 28 319 41
(yf,11; yf,16; yf,19) 0.174 24 333 47
Table 10: The non-inferior solutions found by PSO technique
Non-inferior solution
Combined evidenceHuman resources
requirement (hours)Total financial costs ($)
1 0.973 118 1971
2 0.918 111 1990
3 0.979 120 1985
4 0.947 114 1968
5 0.967 116 1993
6 0.941 112 1990
7 0.891 108 1982
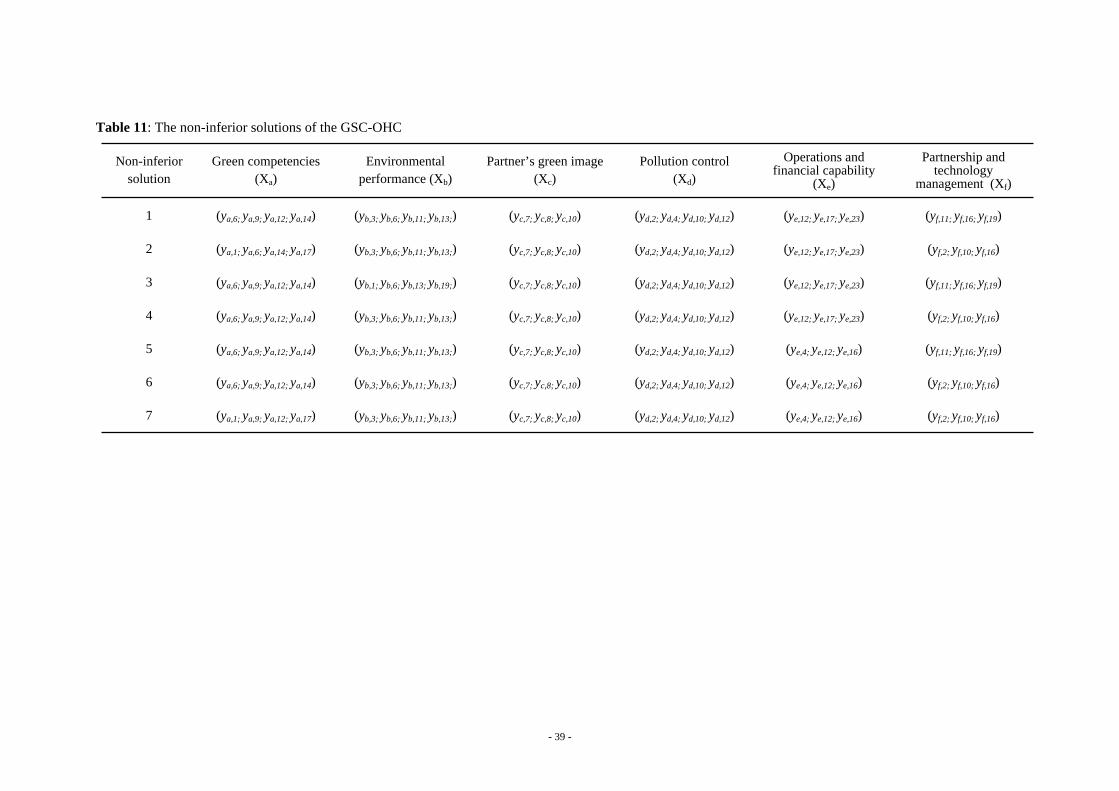
- 39 -
Table 11: The non-inferior solutions of the GSC-OHC
Non-inferior solution
Green competencies (Xa)
Environmental performance (Xb)
Partner’s green image (Xc)
Pollution control (Xd)
Operations and financial capability
(Xe)
Partnership and technology
management (Xf)
1 (ya,6; ya,9; ya,12; ya,14) (yb,3; yb,6; yb,11; yb,13;) (yc,7; yc,8; yc,10) (yd,2; yd,4; yd,10; yd,12) (ye,12; ye,17; ye,23) (yf,11; yf,16; yf,19)
2 (ya,1; ya,6; ya,14; ya,17) (yb,3; yb,6; yb,11; yb,13;) (yc,7; yc,8; yc,10) (yd,2; yd,4; yd,10; yd,12) (ye,12; ye,17; ye,23) (yf,2; yf,10; yf,16)
3 (ya,6; ya,9; ya,12; ya,14) (yb,1; yb,6; yb,13; yb,19;) (yc,7; yc,8; yc,10) (yd,2; yd,4; yd,10; yd,12) (ye,12; ye,17; ye,23) (yf,11; yf,16; yf,19)
4 (ya,6; ya,9; ya,12; ya,14) (yb,3; yb,6; yb,11; yb,13;) (yc,7; yc,8; yc,10) (yd,2; yd,4; yd,10; yd,12) (ye,12; ye,17; ye,23) (yf,2; yf,10; yf,16)
5 (ya,6; ya,9; ya,12; ya,14) (yb,3; yb,6; yb,11; yb,13;) (yc,7; yc,8; yc,10) (yd,2; yd,4; yd,10; yd,12) (ye,4; ye,12; ye,16) (yf,11; yf,16; yf,19)
6 (ya,6; ya,9; ya,12; ya,14) (yb,3; yb,6; yb,11; yb,13;) (yc,7; yc,8; yc,10) (yd,2; yd,4; yd,10; yd,12) (ye,4; ye,12; ye,16) (yf,2; yf,10; yf,16)
7 (ya,1; ya,9; ya,12; ya,17) (yb,3; yb,6; yb,11; yb,13;) (yc,7; yc,8; yc,10) (yd,2; yd,4; yd,10; yd,12) (ye,4; ye,12; ye,16) (yf,2; yf,10; yf,16)
- 40 -
From Tables 10 and 11, we can see that seven non-inferior solutions have been found
(each row of Table 11 indicates one of the non-inferior solutions). Figure 9 shows the
first row of the seven non-inferior solutions in Table 11 in a more visual way as an
example. A non-inferior solution is one in which an improvement in one objective
requires a degradation of another (also called Pareto optimality). In most of multi
objective-decision-making problems, satisfactory solutions often need to be searched
for in a non-inferior solution set. This characteristic gives the decision-makers more
flexibility than identifying a single solution only. Having several non-inferior choices
gives the different decision-makers, who have different personalities, more scope and
freedom to make the final decision under different decision-making conditions. Then,
the final decision will be the one which is based not only on concrete quantitative
calculations but also on comprehensive qualitative analysis as well.
In this practical example, decision-makers need to make the final decision on trade-offs
between the seven non-inferior solutions (shown in Figures 7 and 8). Figure 7 includes
information on the total financial costs (constraint) with other two objectives. This is
because the different solutions in the non-inferior set correspond to different levels of
total financial costs. Figure 7 aims to provide a full picture for decision-makers about
the non-inferior solutions. Therefore, the final decision on trade-off could be made
depending upon the preferred combination of human resources and/or total financial
costs. For instance, if a green supply chain has very limited financial resources during
the decision-making process but has sufficient human resources, it could choose the
non-inferior solution which requires fewer financial resources but a little higher human
resources (say non-inferior solution 1 or non-inferior solution 4).
Considering the metaheuristic algorithm attribute, the optimization results searched by
PSO technique could be the local optimization solutions only rather than the global
optimization ones. Therefore, in-depth and comprehensive analysis and comparison on
the key parameters are necessary and helpful to find the most suitable ones. Table 12
shows detailed comparisons of the key parameters (acceleration constants c1 and c2) in
the PSO sub-model. From this we can see that the mean and standard deviations of the
combined evidence varies slightly from 0.936 to 0.961 and from 0.017 to 0.034,
respectively. Also, the mean and standard deviations of the human resource requirement
varies slightly from 113.6 to 116.0 and from 3.162 to 4.536, respectively. In more detail,
- 41 -
Figures 10 and 11 indicate the variation tendency of the means of combined evidence
and human resource requirement in the non-inferior solution set. From Figure 10, it is
easy to see that the middle area and top right corner area (in purple) have higher
combined evidence than other areas. In Figure 11, as the objective is the lower the
better, so the bottom left, bottom right, and top right areas (in red) have top priority.
Combining the results of the analysis based on Figures 10 and 11, we should try our
best to choose the overlapping areas from the above identified areas to ensure the most
suitable parameters are chosen. In this case, c1 = 0.7 and c2 = 0.9 (top right areas in the
figures) is the best choice for applying PSO sub-model to solve the GSC-OHC
construction problem in the Chinese Electronic Equipment & Instruments industry and
a case company within it. With the same analysis procedures and methods, we can also
undertake more analysis and comparisons between standard deviations in the non-
inferior set.
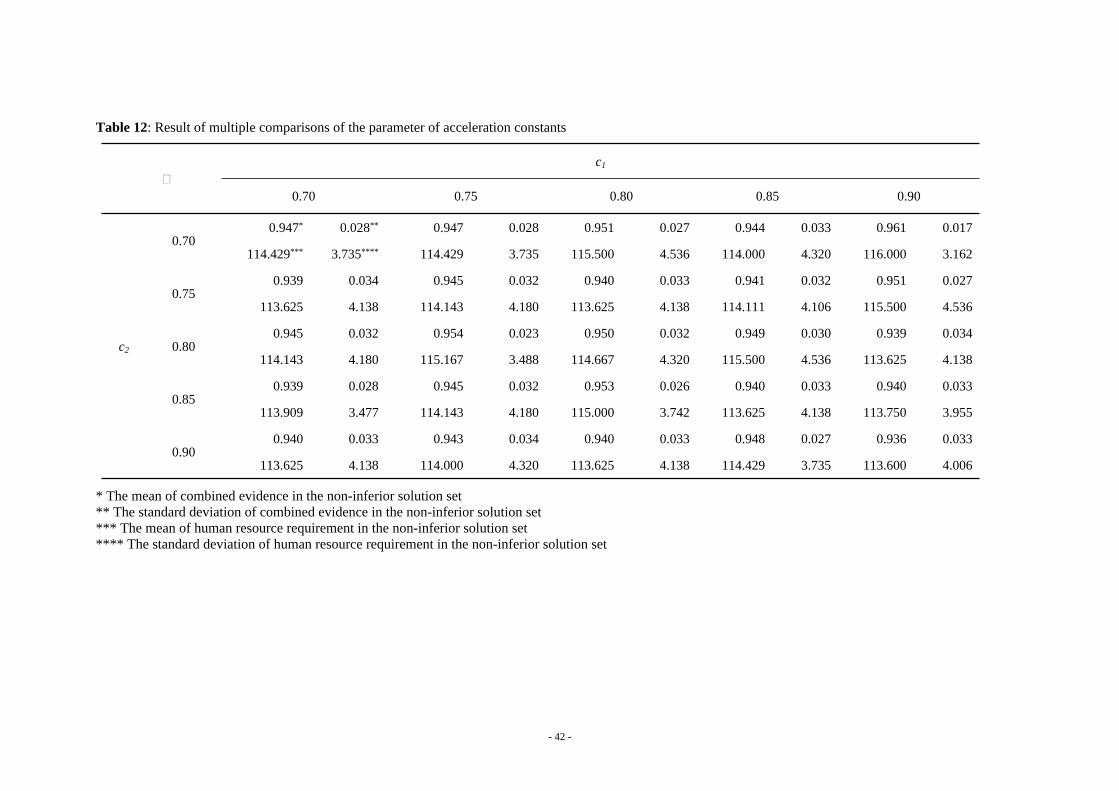
- 42 -
Table 12: Result of multiple comparisons of the parameter of acceleration constants
c1
∅0.70 0.75 0.80 0.85 0.90
0.947* 0.028** 0.947 0.028 0.951 0.027 0.944 0.033 0.961 0.0170.70
114.429*** 3.735**** 114.429 3.735 115.500 4.536 114.000 4.320 116.000 3.162
0.939 0.034 0.945 0.032 0.940 0.033 0.941 0.032 0.951 0.0270.75
113.625 4.138 114.143 4.180 113.625 4.138 114.111 4.106 115.500 4.536
0.945 0.032 0.954 0.023 0.950 0.032 0.949 0.030 0.939 0.0340.80
114.143 4.180 115.167 3.488 114.667 4.320 115.500 4.536 113.625 4.138
0.939 0.028 0.945 0.032 0.953 0.026 0.940 0.033 0.940 0.0330.85
113.909 3.477 114.143 4.180 115.000 3.742 113.625 4.138 113.750 3.955
0.940 0.033 0.943 0.034 0.940 0.033 0.948 0.027 0.936 0.033
c2
0.90113.625 4.138 114.000 4.320 113.625 4.138 114.429 3.735 113.600 4.006
* The mean of combined evidence in the non-inferior solution set** The standard deviation of combined evidence in the non-inferior solution set*** The mean of human resource requirement in the non-inferior solution set**** The standard deviation of human resource requirement in the non-inferior solution set
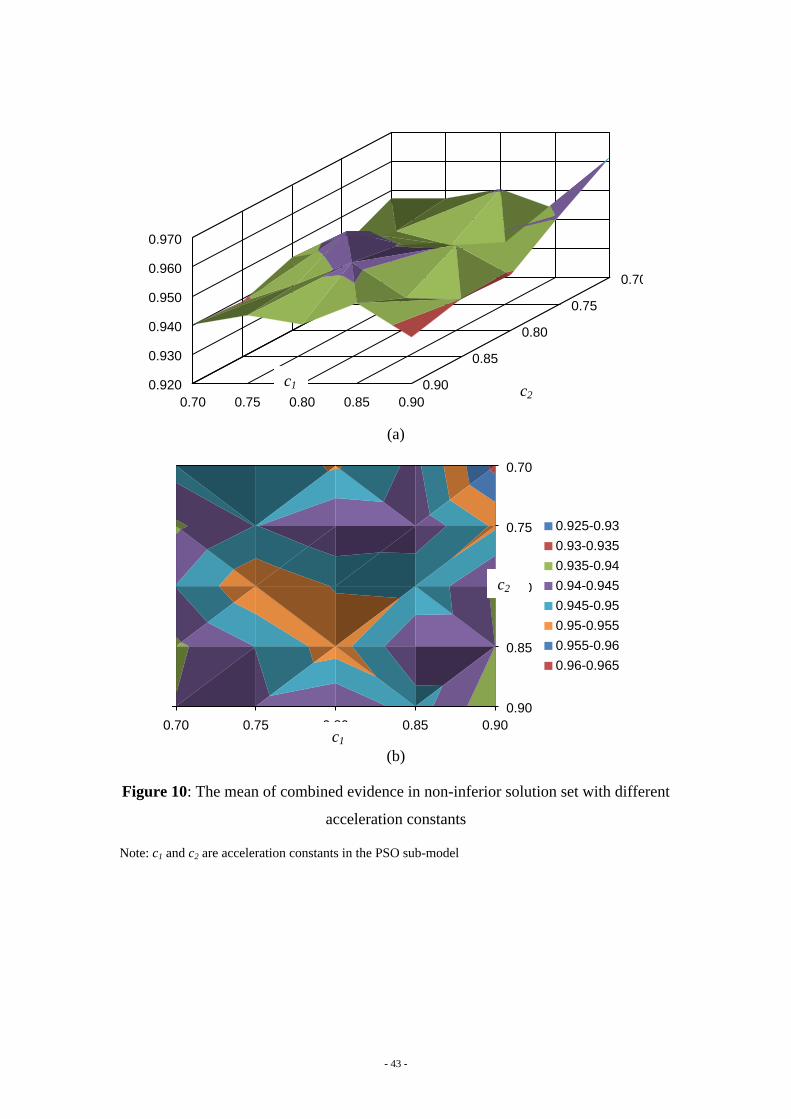
- 43 -
0.70 0.75 0.80 0.85 0.900.920
0.930
0.940
0.950
0.960
0.970
0.90
0.85
0.80
0.75
0.70
(a)
0.70 0.75 0.80 0.85 0.900.90
0.85
0.80
0.75
0.70
0.925-0.930.93-0.9350.935-0.940.94-0.9450.945-0.950.95-0.9550.955-0.960.96-0.965
(b)
Figure 10: The mean of combined evidence in non-inferior solution set with different
acceleration constants
Note: c1 and c2 are acceleration constants in the PSO sub-model
c2c1
c2
c1
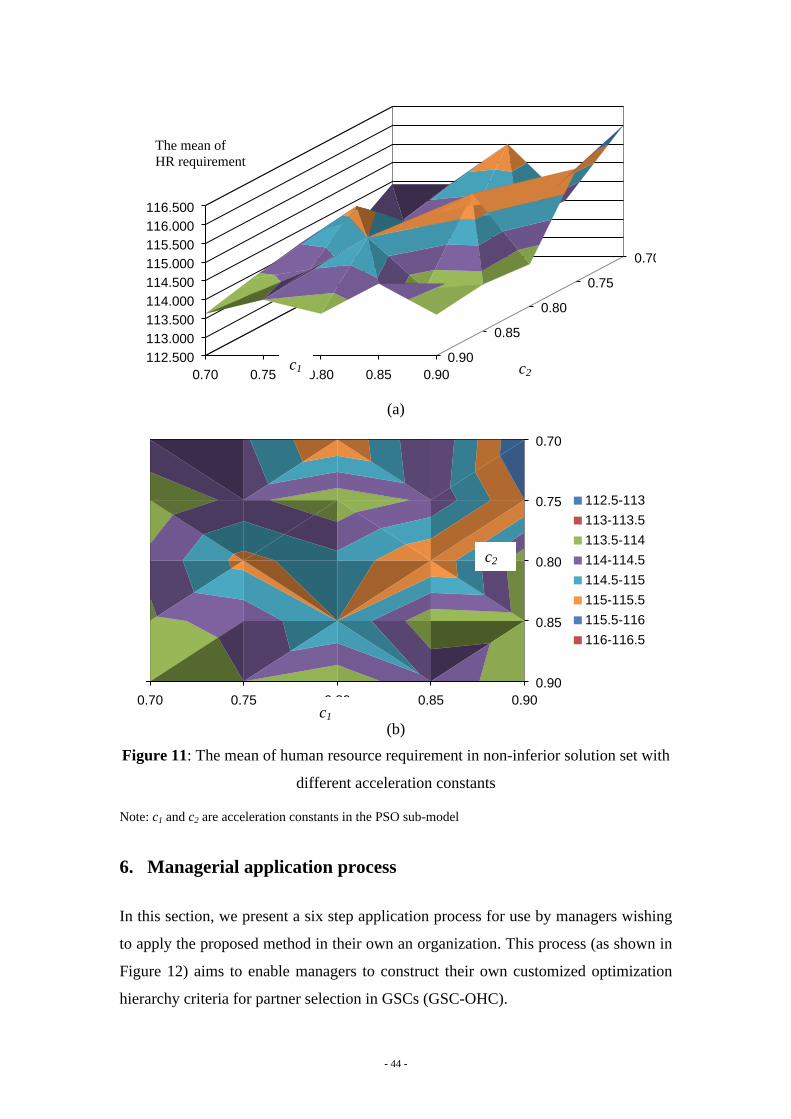
- 44 -
0.70 0.75 0.80 0.85 0.90112.500113.000113.500114.000114.500115.000115.500116.000116.500
0.90
0.85
0.80
0.75
0.70
(a)
0.70 0.75 0.80 0.85 0.900.90
0.85
0.80
0.75
0.70
112.5-113113-113.5113.5-114114-114.5114.5-115115-115.5115.5-116116-116.5
(b)
Figure 11: The mean of human resource requirement in non-inferior solution set with
different acceleration constants
Note: c1 and c2 are acceleration constants in the PSO sub-model
6. Managerial application process
In this section, we present a six step application process for use by managers wishing
to apply the proposed method in their own an organization. This process (as shown in
Figure 12) aims to enable managers to construct their own customized optimization
hierarchy criteria for partner selection in GSCs (GSC-OHC).
c2c1
c1
c2
The mean of HR requirement
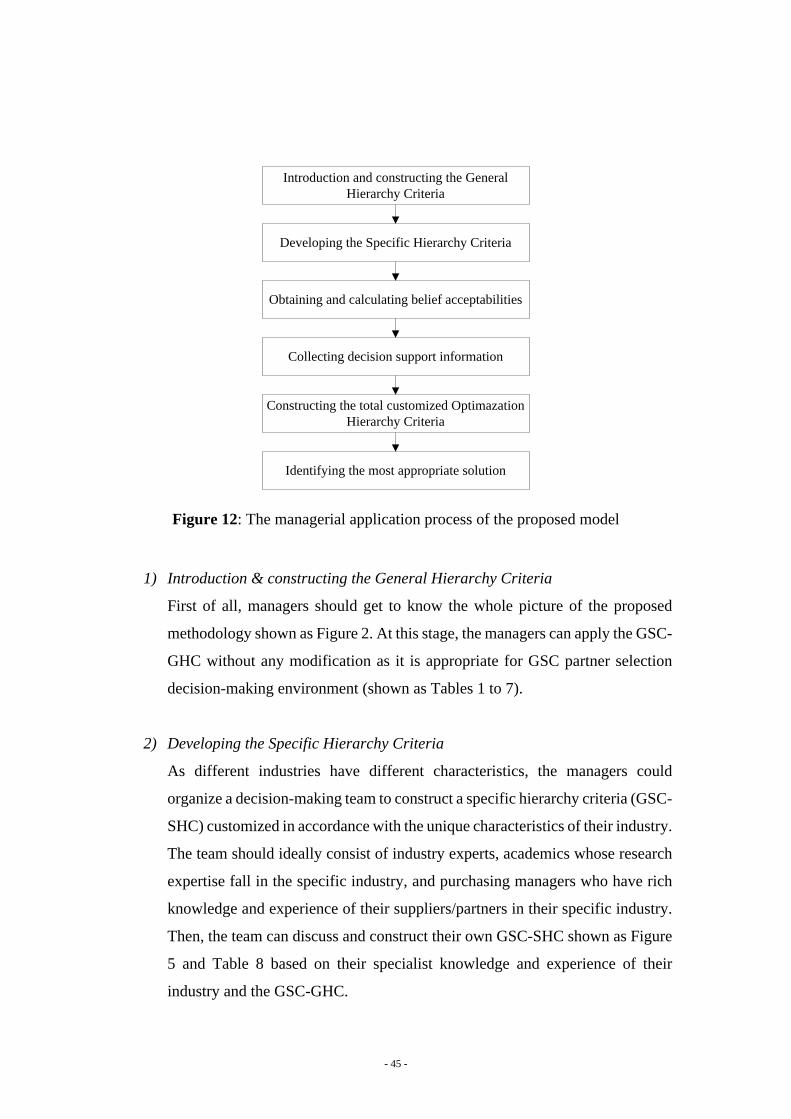
- 45 -
Introduction and constructing the General Hierarchy Criteria
Developing the Specific Hierarchy Criteria
Obtaining and calculating belief acceptabilities
Collecting decision support information
Constructing the total customized Optimazation Hierarchy Criteria
Identifying the most appropriate solution
Figure 12: The managerial application process of the proposed model
1) Introduction & constructing the General Hierarchy Criteria
First of all, managers should get to know the whole picture of the proposed
methodology shown as Figure 2. At this stage, the managers can apply the GSC-
GHC without any modification as it is appropriate for GSC partner selection
decision-making environment (shown as Tables 1 to 7).
2) Developing the Specific Hierarchy Criteria
As different industries have different characteristics, the managers could
organize a decision-making team to construct a specific hierarchy criteria (GSC-
SHC) customized in accordance with the unique characteristics of their industry.
The team should ideally consist of industry experts, academics whose research
expertise fall in the specific industry, and purchasing managers who have rich
knowledge and experience of their suppliers/partners in their specific industry.
Then, the team can discuss and construct their own GSC-SHC shown as Figure
5 and Table 8 based on their specialist knowledge and experience of their
industry and the GSC-GHC.
- 46 -
3) Obtaining and calculating belief acceptabilities
Based on the structure of the GSC-SHC, its belief acceptabilities can be
obtained by experts and then calculated by applying the Dempster-Shafer
theory. This can be done by asking open questions about the different
alternatives/combinations (such as the first column of Table 9 shown) to the
decision-making team members. The Delphi method and the Dempster-Shafer
theory (shown in Section 4.2) can be used during this step to get a consensus
view (such as the second column of Table 9 shown). The participants who will
take part in the Delphi method can be chosen in accordance with the requirement
and nature of the decision-making. If the decisions are strategic, the numbers
and level of participants should be relatively more and higher. In addition, it is
also helpful to include participants from outside of the organization (e.g.
academics, industry experts and purchasing managers from partner
organizations).
4) Collecting decision support information
Managers then need to prepare and collect the decision support information,
such as the human resources requirements, external and internal financial costs,
for each alternatives/combinations (such as the third to fifth columns of Table 9
shown) required for the subsequent optimization step.
5) Constructing the total customized Optimization Hierarchy Criteria
By applying both the optimization objectives and resource constraints
previously collected, the managers can apply the PSO sub-model (shown in
Section 4.3) to construct their own total customized optimization hierarchy
criteria for partner selection in GSCs based on the GSC-SHC and its belief
acceptabilities for different alternatives/combinations. The managers will thus
get the outputs found by the PSO sub-model (such as shown in Tables 10 and
11), which are the non-inferior solutions. Accordingly, the combined evidence,
the human resource requirements, and the total financial costs of the GSC-SHC
are the two objectives and main constraint of the PSO sub-model, respectively.
The PSO sub-model aims to find an optimization solution(s) which has the
highest combined evidence and lowest human resource requirements while
fulfilling the total financial costs constraint. The potential combinations and
- 47 -
their different characteristics for this multi-objective optimization are collected
and analysed during steps 3) and 4) discussed above (such as shown in Table
9). During this step, the managers could also compare the different outputs by
varying the parameters of the PSO sub-model to find the most appropriate
parameters (such as the acceleration constraints c1 and c2 shown in Table 12 and
Figures 10 and 11).
6) Identifying the most appropriate solution
Lastly, the managers can analysis these non-inferior solutions and make final
trade-offs to identify the most suitable solution in accordance with the different
preferences and the specific decision-making environment identified in the prior
steps. The final output of the above processes is the total customized
optimization hierarchy criteria for partner selection in GSCs (GSC-OHC) (such
as shown in Figure 9). Managers could then apply the GSC-OHC for potential
partners’ evaluation and selection by integrating it with other decision-making
methods/models, such as AHP/ANP, DEA, and mathematic programming, etc.
7. Conclusion
With changes in public policy making, environmental performance is increasingly
important for manufacturers, who are now exploring how best to improve the
sustainability of their operations across the whole supply chain (Linton et al. 2007).
Accordingly, partner selection has become a crucial issue in GSCM. However, various
studies in partner selection in GSCs conclude that there is a gap between partner
selection criteria construction theory and practice (e.g. Jayaraman et al. 2007, Singhal
and Singhal 2012). This has highlighted the need for a new method for identifying the
most appropriate selection criteria to evaluate and select partner selection criteria in the
GSC. Such a method needs to be comprehensive through its consideration of a broad
range of possible evaluation criteria but also efficient in its use of scarce resources
during the criteria selection process (Guide and Van Wassenhove 2006). It must also
be flexible in order to cope with different product categories and different decision-
making situations. Accordingly, this paper has proposed a three-stage model for the
construction of partner selection criteria in GSCs by combining Dempster-Shafer belief
acceptability theory and PSO technique. The efficacy of the model is demonstrated by
- 48 -
way of an illustrative application in Company ABC, a manufacturer in the Chinese
Electronic Equipment & Instruments industry.
The paper makes a number of contributions. Firstly, it offers an advance to current
methods used for partner selection in green supply chains by providing a systematic
method of constructing appropriate partner selection criteria. This is an essential but
often neglected pre-requisite in any partner selection process.
Secondly, the proposed model combines, for the first time, Dempster-Shafer theory and
PSO technique within a three-stage model for the construction of GSC partner selection
criteria. This model has a number of advantages:
∅ It enables the inter-dependence between criteria to be considered by applying
Dempster-Shafer theory, and enables optimization levels of both effectiveness and
efficiency in criteria construction to be achieved simultaneously through the use of
PSO technique.
∅ It enables both operational and strategic attributes to be selected at different levels
of hierarchy criteria in different specific decision-making situations and
environments.
∅ It is comprehensive enough to consider a broad range of possible criteria, both
qualitative and quantitative, whilst being efficient in its use of scarce resources
during the criteria construction process. In other words, it is feasible and practicable
in the GSC decision-making environment.
∅ It is an advance on previous single objective seeking solutions as it provides a
multiple objectives seeking solution. This enables the trade-offs between different
objectives to be achieved more effectively and practically.
Thirdly, the model incorporates a comprehensive General Hierarchy Criteria list for
partner selection in GSCs, based on in-depth analysis of the existing literatures and
expert opinion. This offers a sound basis for both future academic research and practical
applications.
Finally, the paper demonstrates the potential of this approach to be applied in practice,
through its application in a real company, Company ABC, a manufacturer in the
Chinese Electronic Equipment & Instruments industry.
- 49 -
There are three main disadvantages with the model. Firstly, there are no general
standards for coding in PSO technique. So, the coding process may be inaccurate.
However, this characteristic also gives enough flexibility to decision-makers to design
their own coding in order to accommodate their own specific requirements. Secondly,
as a metaheuristic technique, PSO does not guarantee that an optimization solution is
ever found within the non-inferior solution set. Therefore, the choice of the most
appropriate key parameters becomes more important. The cross analysis of key
parameters proposed in the Empirical illustration is one of the good solutions in this
respect. Thirdly, in the second stage of framework, the construction of GSC-SHC
depends heavily on the subjective judgements of decision-makers when assigning belief
acceptabilities to different attributes.
Further work is required to overcome the limitations of the model discussed above. In
particular, research could be undertaken to investigate if other methods/models (e.g.
DEA, fuzzy set theory, AHP/ANP, etc.) could be beneficially introduced into the stages
of the partner selection process for GSCs that follow the three-stage DS-PSO model for
the construction of selection criteria. The choices of the most appropriate combinational
rules of Dempster-Shafer theory in accordance with specific decision-making contexts
is also an important direction for future research. Further research is also required to
investigate how to group lower level criteria in order to ensure that PSO technique
programming can be undertaken more efficiently.
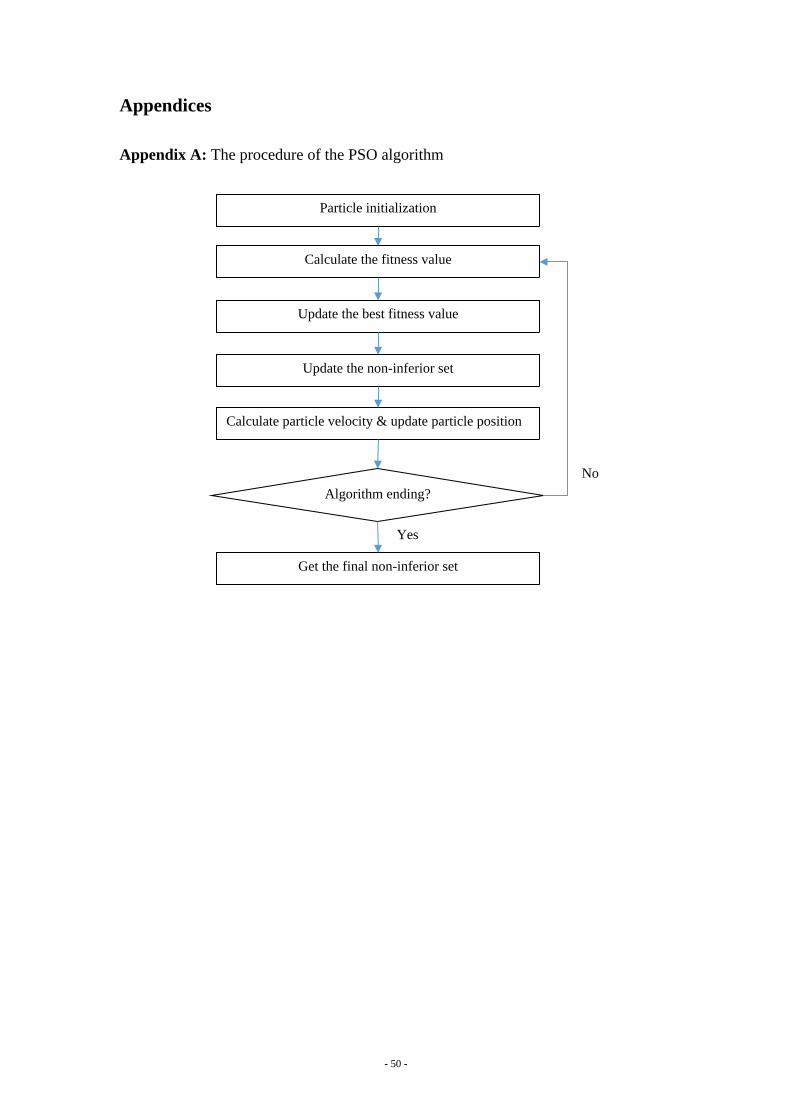
- 50 -
Appendices
Appendix A: The procedure of the PSO algorithm
Particle initialization
Calculate the fitness value
Update the best fitness value
Update the non-inferior set
Calculate particle velocity & update particle position
Get the final non-inferior set
Algorithm ending?
No
Yes
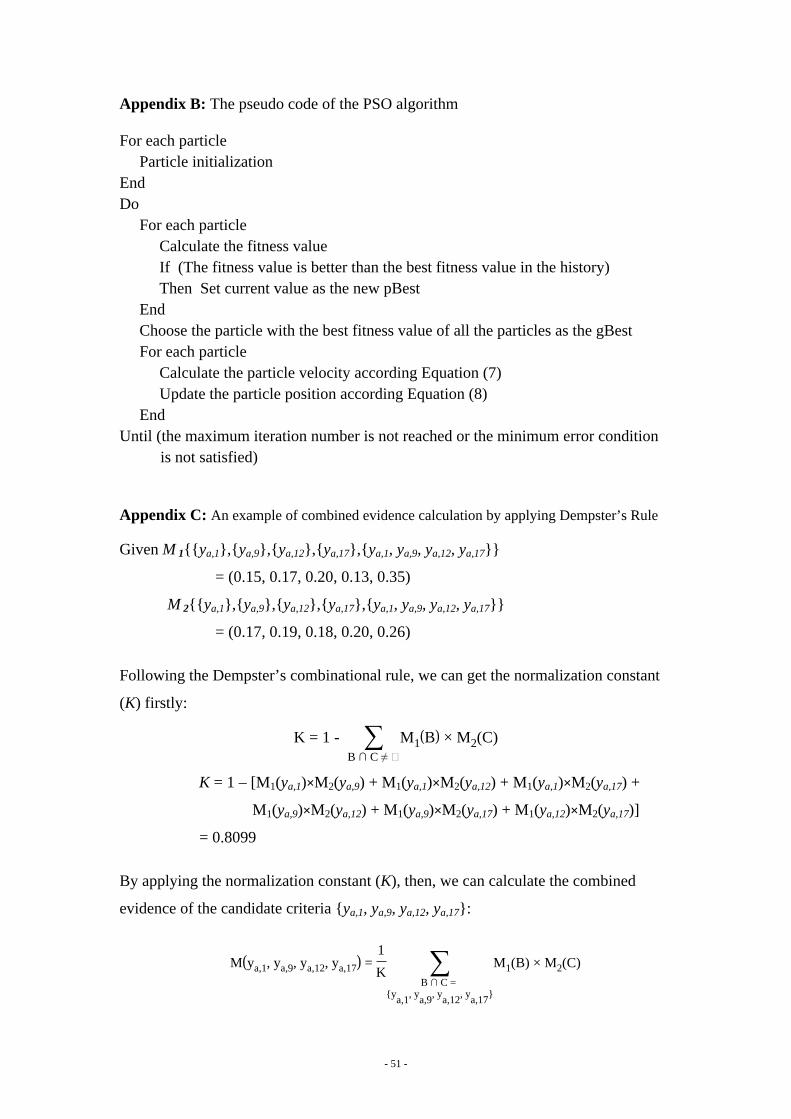
- 51 -
Appendix B: The pseudo code of the PSO algorithm
For each particle Particle initialization
EndDo
For each particle Calculate the fitness valueIf (The fitness value is better than the best fitness value in the history)Then Set current value as the new pBest
EndChoose the particle with the best fitness value of all the particles as the gBestFor each particle
Calculate the particle velocity according Equation (7)Update the particle position according Equation (8)
End Until (the maximum iteration number is not reached or the minimum error condition
is not satisfied)
Appendix C: An example of combined evidence calculation by applying Dempster’s Rule
Given M 1{{ya,1},{ya,9},{ya,12},{ya,17},{ya,1, ya,9, ya,12, ya,17}}
= (0.15, 0.17, 0.20, 0.13, 0.35)
M 2{{ya,1},{ya,9},{ya,12},{ya,17},{ya,1, ya,9, ya,12, ya,17}}
= (0.17, 0.19, 0.18, 0.20, 0.26)
Following the Dempster’s combinational rule, we can get the normalization constant
(K) firstly:
K = 1 - ∑B ∩ C ≠ ∅
M1(B) × M2(C)
K = 1 – [M1(ya,1)×M2(ya,9) + M1(ya,1)×M2(ya,12) + M1(ya,1)×M2(ya,17) +
M1(ya,9)×M2(ya,12) + M1(ya,9)×M2(ya,17) + M1(ya,12)×M2(ya,17)]
= 0.8099
By applying the normalization constant (K), then, we can calculate the combined
evidence of the candidate criteria {ya,1, ya,9, ya,12, ya,17}:
M(ya,1, ya,9, ya,12, ya,17) =1
K ∑B ∩ C =
{ya,1, ya,9, ya,12, ya,17}
M1(B) × M2(C)
- 52 -
= 0.112
References
Abdallah, T., A. Diabat, and D. Simchi-Levi. 2012. “Sustainable supply chain design: A closed-loop formulation and sensitivity analysis.” Production Planning &
Control 23 (2-3): 120-133. Amaral, J. and A.A. Tsay. 2009. “How to win spend and influence partners: Lessons in
behavioral operations from the outsourcing game.” Production and Operations
Management 18 (6): 621-634. Awasthi, A., S.S. Chauhan, and S.K. Goyal. 2010. “A fuzzy multicriteria approach for
evaluating environmental performance of suppliers.” International Journal of
Production Economics 126 (2): 370-378. Bai, C. and J. Sarkis. 2010a. “Green supplier development: Analytical evaluation using
rough set theory.” Journal of Cleaner Production 18 (12): 1200-1210. Bai, C. and J. Sarkis. 2010b. “Integrating sustainability into supplier selection with grey
system and rough set methodologies.” International Journal of Production
Economics 124 (1): 252-264. Bauer, J., T. Bektas, and T.G. Crainic. 2010. “Minimizing greenhouse gas emissions in
intermodal freight transport: An application to rail service design.” Journal of
the Operational Research Society 61 (3): 530-542. Beynon, M., B. Curry and P. Morgan. 2000. “The Dempster-Shafer theory of evidence:
An alternative approach to multicriteria decision modelling.” Omega-
International Journal of Management Science 28 (1): 37-50. Bhattacharya, A., P. Mohapatra, V. Kumar, P.K. Dey, M. Brady, M.K. Tiwari, and S.S.
Nudurupati. 2014. “Green supply chain performance measurement using fuzzy ANP-based balanced scorecard: A collaborative decision-making approach.” Production Planning & Control 25 (8): 698-714.
Bowen, F.E., P.D. Cousins, R.C. Lamming, and A.C. Farukt. 2001. “The role of supply management capabilities in green supply.” Production and Operations
Management 10 (2): 174-189. Burke, G.J., J.E. Carrillo, and A.J. Vakharia. 2009. “Sourcing decisions with stochastic
supplier reliability and stochastic demand.” Production and Operations
Management 18 (4): 475-484. Buyukozkan, G. and G. Cifci. 2012. “Evaluation of the green supply chain management
practices: A fuzzy ANP approach.” Production Planning & Control 23 (6): 405-418.
Che, Z.H. 2012. “A particle swarm optimization algorithm for solving unbalanced supply chain planning problems.” Applied Soft Computing 12 (4): 1279–1287.
Choi, T.Y. and J.L. Hartley. 1996. “An exploration of supplier selection practices across the supply chain.” Journal of Operations Management 14 (4): 333-343.
- 53 -
Chung, S.H., A.H.I. Lee, and W.L. Pearn. 2005. “Analytic network process (ANP) approach for product mix planning in semiconductor fabricator.” International
Journal of Production Economics 96 (1): 15-36. Corbiere-Nicollier, T., I. Blanc, and S. Erkman. 2011. “Towards a global criteria based
framework for the sustainability assessment of bioethanol supply chains application to the Swiss dilemma: Is local produced bioethanol more sustainable than bioethanol imported from Brazil?” Ecological Indicators 11 (5): 1447-1458.
Cui, Z.J., C. Loch, B. Grossmann, and R. He. 2012. “How provider selection and management contribute to successful innovation outsourcing: An empirical study at Siemens.” Production and Operations Management 21 (1): 29-48.
De Boer, L., E. Labro, and P. Morlacchi. 2001. “A review of methods supporting supplier selection.” European Journal of Purchasing and Supply Management
7: 75-89.De Snoo, C., W. Van Wezel, and R.J. Jorna. 2011. “An empirical investigation of
scheduling performance criteria.” Journal of Operations Management 29 (3): 181-193.
Dempster, A. 1967. “Upper and lower probabilities induced by a multivalued mapping.” Annals of Mathematical Statistics 38: 325-328.
Dey, P.K. and W. Cheffi. 2013. “Green supply chain performance measurement using the analytic hierarchy process: A comparative analysis of manufacturing organisations.” Production Planning & Control 24 (8-9): 702-720.
Elkington, J. 1998. Cannibals with forks: The triple bottom line of the twenty first
century business. London: New Society Publishers.Erol, I., S. Sencer, and R. Sari. 2011. “A new fuzzy multi-criteria framework for
measuring sustainability performance of a supply chain.” Ecological Economics
70 (6): 1088-1100. Genovese, A., S.C.L. Koh, N. Kumar, and P.K. Tripathi. 2014. “Exploring the
challenges in implementing supplier environmental performance measurement models: A case study.” Production Planning & Control 25 (13-14): 1198-1211.
Govindan, K., S. Rajendran, J. Sarkis, and P. Murugesan. 2015. “Multi criteria decision making approaches for green supplier evaluation and selection: A literature review.” Journal of Cleaner Production 98: 66-83.
Guan, J.W. and D.A. Bell, 1991. Evidence theory and its applications. New York: Elsevier Science Inc.
Guide, V.D.R. and L.N. Van Wassenhove. 2006. “Closed-loop supply chains: An introduction to the feature issue (part 1).” Production and Operations
Management 15 (3): 345-350. Hajidimitriou, Y.A. and A.C. Georgiou. 2002. “A goal programming model for partner
selection decisions in international joint ventures.” European Journal of
Operational Research 138 (3): 649-662.
- 54 -
Hassan, M., M. Ali, E. Aktas, and K. Alkayid. 2015. “Factors affecting selection decision of auto-identification technology in warehouse management: An international Delphi study.” Production Planning & Control 26 (12): 1025-1049.
Hashemi, S.H., A. Karimi, and M. Tavana. 2015. “An integrated green supplier selection approach with analytic network process and improved grey relational analysis.” International Journal of Production Economics 159: 178-191.
Huang, B., C. Gao, and L. Chen. 2011. “Partner selection in a virtual enterprise under uncertain information about candidates.” Expert Systems with Applications 38 (9): 11305-11310.
Jayaraman, V., R. Klassen, and J.D. Linton. 2007. “Supply chain management in a sustainable environment.” Journal of Operations Management 25 (6): 1071-1074.
Kannan, G. and A.N. Haq. 2007. “Analysis of interactions of criteria and sub-criteria for the selection of supplier in the built-in-order supply chain environment.” International Journal of Production Research 45 (17): 3831-3852.
Kannan, D., K. Govindan, and S. Rajendran. 2015. “Fuzzy axiomatic design approach based green supplier selection: A case study from Singapore.” Journal of
Cleaner Production 96: 194-208.Kassinis, G.I. and A.C. Soteriou. 2003. “Greening the service profit chain: The impact
of environmental management practices.” Production and Operations
Management 12 (3): 386-403. Kennedy, J. and R. Eberhart, 1995. Particle swarm optimization. IEEE International
conference on neural networks, Piscataway, NJ, USA: IEEE, 1942-1948.Klassen, R.D. and S. Vachon. 2003. “Collaboration and evaluation in the supply chain:
The impact on plant-level environmental investment.” Production and
Operations Management 12 (3): 336-352. Kleindorfer, P.R., K. Singhal, and L.N. Van Wassenhove. 2005. “Sustainable
operations management.” Production and Operations Management 14 (4): 482-492.
Kumar, A., V. Jain, and S. Kumar. 2014. “A comprehensive environment friendly approach for supplier selection.” Omega-International Journal of Management
Science 42 (1): 109-123.Kuo, R.J., Y.C. Wang, and F.C. Tien. 2010a. “Integration of artificial neural network
and Mada methods for green supplier selection.” Journal of Cleaner Production
18 (12): 1161-1170. Kuo, R.J., S.Y. Hong, and Y.C. Huang. 2010b. “Integration of particle swarm
optimization-based fuzzy neural network and artificial neural network for supplier selection.” Applied Mathematical Modelling 34 (12): 3976-3990.
Large, R.O. and C. Gimenez Thomsen. 2011. “Drivers of green supply management performance: Evidence from Germany.” Journal of Purchasing and Supply
Management 17 (3): 176-184.
- 55 -
Lee, A.H.I., H.Y. Kang, C.F. Hsu, and H.C. Hung. 2009. “A green supplier selection model for high-tech industry.” Expert Systems with Applications 36 (4): 7917-7927.
Lee, V.H., K.B. Ooi, A.Y.L. Chong, and B.S. Lin. 2015. “A structural analysis of greening the supplier, environmental performance and competitive advantage.” Production Planning & Control 26 (2): 116-130.
Lin, C.R. and H.S. Chen. 2004. “A fuzzy strategic alliance selection framework for supply chain partnering under limited evaluation resources.” Computers in
Industry 55 (2): 159-179. Linton, J.D., R. Klassen, and V. Jayaraman. 2007. “Sustainable supply chains: An
introduction.” Journal of Operations Management 25 (6): 1075-1082. Luo, X., C. Wu, D. Rosenberg, and D. Barnes. 2009. “Supplier selection in agile supply
chains: An information processing model and an illustration.” Journal of
Purchasing and Supply Management 15 (4): 249-262. Matos, S. and J. Hall. 2007. “Integrating sustainable development in the supply chain:
The case of life cycle assessment in oil and gas and agricultural biotechnology.” Journal of Operations Management 25 (6): 1083-1102.
Melnyk, S.A., R.P. Sroufe, and R. Calantone. 2003. “Assessing the impact of environmental management systems on corporate and environmental performance.” Journal of Operations Management 21 (3): 329-351.
Mexas, M.P., O.L. Goncalves Quelhas, and H.G. Costa. 2012. “Prioritization of enterprise resource planning systems criteria: Focusing on construction industry.” International Journal of Production Economics 139 (1): 340-350.
Mohanty, R.P. and A. Prakash. 2014. “Green supply chain management practices in India: An empirical study.” Production Planning & Control 25 (16): 1322-1337.
Montoya-Torres, J.R., E. Gutierrez-Franco, and E.E. Blanco. 2015. “Conceptual framework for measuring carbon footprint in supply chains.” Production
Planning & Control 26 (4): 265-279.Noci, G. 1997. “Designing 'green' vendor rating systems for the assessment of a
supplier's environmental performance.” European Journal of Purchasing and
Supply Management 3 (2): 103-114. Okoli, C. and S.D. Pawlowski. 2004. “The Delphi method as a research tool: An
example, design considerations and applications.” Information & Management
42 (1): 15-29.Pil, F.K. and S. Rothenberg. 2003. “Environmental performance as a driver of superior
quality.” Production and Operations Management 12 (3): 404-415. Rao, P. and D. Holt. 2005. “Do green supply chains lead to competitiveness and
economic performance?” International Journal of Operations & Production
Management 25 (9): 898-916. Sentz, K., and S. Ferson. 2002. Combination of evidence in Dempster-Shafer theory.
SANDIA Tech. Report. Sandia: Sandia National Laboratories
- 56 -
Sarkis, J. 2003. “A strategic decision framework for green supply chain management.” Journal of Cleaner Production 11 (4): 397-409.
Sarkis, J., and D.G. Dhavale. 2015. “Supplier selection for sustainable operations: A triple-bottom-line approach using a Bayesian framework.” International
Journal of Production Economics 166: 177-191.Savino, M.M., R. Manzini, and A. Mazza. 2015. “Environmental and economic
assessment of fresh fruit supply chain through value chain analysis. A case study in chestnuts industry.” Production Planning & Control 26 (1): 1-18.
Seuring, S. and M. Muller. 2008. “From a literature review to a conceptual framework for sustainable supply chain management.” Journal of Cleaner Production 16 (15): 1699-1710.
Sha, D.Y. and Z.H. Che. 2006. “Supply chain network design: Partner selection and production/distribution planning using a systematic model.” Journal of the
Operational Research Society 57 (1): 52-62. Shafer, G., 1976. A mathematical theory of evidence. Princeton: Princeton University
Press.Singhal, K. and J. Singhal. 2012. “Opportunities for developing the science of
operations and supply-chain management.” Journal of Operations Management
30 (3): 245-252. Sosic, G. 2011. “Impact of demand uncertainty on stability of supplier alliances in
assembly models.” Production and Operations Management 20 (6): 905-920. Sroufe, R. 2003. “Effects of environmental management systems on environmental
management practices and operations.” Production and Operations
Management 12 (3): 416-431. Tsai, C.C. 2012. “A research on selecting criteria for new green product development
project: Taking Taiwan consumer electronics products as an example.” Journal
of Cleaner Production 25: 106-115. Tseng, M.L. and A.S.F. Chiu. 2013. “Evaluating firm's green supply chain management
in linguistic preferences.” Journal of Cleaner Production 40: 22-31. Tseng, M.L., K.H. Tan, M. Lim, R.J. Lin, and Y. Geng. 2014. “Benchmarking eco-
efficiency in green supply chain practices in uncertainty.” Production Planning
& Control 25 (13-14): 1079-1090.Wu, C. and D. Barnes. 2010. “Formulating partner selection criteria for agile supply
chains: A Dempster-Shafer belief acceptability optimization approach.” International Journal of Production Economics 125 (2): 284-293.
Wu, C. and D. Barnes. 2011. “A literature review of decision-making models and approaches for partner selection in agile supply chains.” Journal of Purchasing
and Supply Management 17 (4): 256-274. Wu, C. and D. Barnes. 2012. “A dynamic feedback model for partner selection in agile
supply chains.” International Journal of Operations & Production Management
32 (1-2): 79-103.
- 57 -
Wu, C., and D. Barnes. 2014. “Partner selection in agile supply chains: a fuzzy intelligent approach.” Production Planning & Control 25 (10): 821-839.
Wu, C., and D. Barnes. 2016. “An integrated model for green partner selection and supply chain construction” Journal of Cleaner Production 112 (3): 2114-2132.
Wu, D.S. 2009. “Supplier selection in a fuzzy group setting: A method using grey related analysis and Dempster-Shafer theory.” Expert Systems with Applications
36 (5): 8892-8899.Xia, W. and Z. Wu. 2007. “Supplier selection with multiple criteria in volume discount
environments.” Omega-International Journal of Management Science 35 (5): 494-504.
Yang, Y.H., Y.V. Hui, L.C. Leung, and G. Chen. 2010. “An analytic network process approach to the selection of logistics service providers for air cargo.” Journal
of the Operational Research Society 61 (9): 1365-1376. Yager, R.R. 1987. “On the Dempster-Shafer framework and new combination rules.”
Information Sciences 41 (2): 93-137. Yeh, W.C. and M.C. Chuang. 2011. “Using multi-objective genetic algorithm for
partner selection in green supply chain problems.” Expert Systems with
Applications 38 (4): 4244-4253. Zhao, Q., X.H. Zhang, and R.B. Xiao. 2008. “Particle swarm optimization algorithm
for partner selection in virtual enterprise.” Progress in Natural Science 18 (11): 1445-1452.
Zhu, Q.H. and J. Sarkis. 2004. “Relationships between operational practices and performance among early adopters of green supply chain management practices in Chinese manufacturing enterprises.” Journal of Operations Management 22 (3): 265-289.
Zhu, Q.H., Y.H. Tian, and J. Sarkis. 2012. “Diffusion of selected green supply chain management practices: An assessment of Chinese enterprises.” Production
Planning & Control 23 (10-11): 837-850.