Embed Size (px)
Citation preview
WestminsterResearchhttp://www.westminster.ac.uk/westminsterresearch
The directional volatility connectedness between crude oil and
equity markets: New evidence from implied volatility indexes
Maghyereh, A., Awartani, B. and Bouri, E.
NOTICE: this is the authors’ version of a work that was accepted for publication in
Energy Economics. Changes resulting from the publishing process, such as peer review,
editing, corrections, structural formatting, and other quality control mechanisms may not
be reflected in this document. Changes may have been made to this work since it was
submitted for publication. A definitive version was subsequently published in Energy
Economics, 57, pp. 78-93, 2016.
The final definitive version in Energy Economics is available online at:
https://dx.doi.org/10.1016/j.eneco.2016.04.010
© 2016. This manuscript version is made available under the CC-BY-NC-ND 4.0 license
http://creativecommons.org/licenses/by-nc-nd/4.0/
The WestminsterResearch online digital archive at the University of Westminster aims to make the
research output of the University available to a wider audience. Copyright and Moral Rights remain
with the authors and/or copyright owners.
Whilst further distribution of specific materials from within this archive is forbidden, you may freely
distribute the URL of WestminsterResearch: ((http://westminsterresearch.wmin.ac.uk/).
In case of abuse or copyright appearing without permission e-mail [email protected]

�������� ����� ��
The directional volatility connectedness between crude oil and equity markets:new evidence from implied volatility indexes
Aktham I. Maghyereh, Basel Awartani, Elie Bouri
PII: S0140-9883(16)30089-5DOI: doi: 10.1016/j.eneco.2016.04.010Reference: ENEECO 3324
To appear in: Energy Economics
Received date: 25 December 2015Revised date: 29 March 2016Accepted date: 20 April 2016
Please cite this article as: Maghyereh, Aktham I., Awartani, Basel, Bouri, Elie, The direc-tional volatility connectedness between crude oil and equity markets: new evidence fromimplied volatility indexes, Energy Economics (2016), doi: 10.1016/j.eneco.2016.04.010
This is a PDF file of an unedited manuscript that has been accepted for publication.As a service to our customers we are providing this early version of the manuscript.The manuscript will undergo copyediting, typesetting, and review of the resulting proofbefore it is published in its final form. Please note that during the production processerrors may be discovered which could affect the content, and all legal disclaimers thatapply to the journal pertain.

ACC
EPTE
D M
ANU
SCR
IPT
ACCEPTED MANUSCRIPT
1
The directional volatility connectedness between crude oil and equity markets: new evidence
from implied volatility indexes
Aktham I. Maghyereha
Basel Awartanib*
Elie Bouric
a Department of Economics and Finance, United Arab Emirates University, E-mail: [email protected]
b* (corresponding author): Plymouth Business School, Plymouth University, Drake Circus, Plymouth, United Kingdom, PL4 8AA, E-
mail: [email protected]
c USEK Business School, Holy Spirit University of Kaslik, E-mail: [email protected]
Abstract
In this paper, we use a set of newly introduced implied volatility indices to investigate the directional
connectedness between oil and equities in eleven major stock exchanges around the globe from 2008
to 2015. The inference on the oil-equity implied volatility relationships depends on Diebold and
Yilmaz (2012, 2014, 2015) who proposed a set of directional measures that enable the dynamic and
directional characterization of the relationships among financial variables. We find uniform results
across the sample countries indicating that the connectedness between oil and equity is established
by the bi-directional information spillovers between the two markets. However, we find that the bulk
of association is largely dominated by the transmissions from the oil market to equity markets and
not the other way around. The pattern of transmissions is varying over the sample period; however
most of the linkages between oil and equities are established from the mid of 2009 to the mid of
2012 which is a period that witnessed the start of global recovery.
Keywords: Oil price volatility; equity market volatility; directional connectedness; implied volatility
indexes.
JEL Classification: C1, G1.

ACC
EPTE
D M
ANU
SCR
IPT
ACCEPTED MANUSCRIPT
2
The directional volatility connectedness between crude oil and equity markets: new evidence
from implied volatility indexes
Abstract
In this paper, we use a set of newly introduced implied volatility indices to investigate the directional
connectedness between oil and equities in eleven major stock exchanges around the globe from 2008
to 2015. The inference on the oil-equity implied volatility relationships depends on Diebold and
Yilmaz (2012, 2014, 2015) who proposed a set of directional measures that enable the dynamic and
directional characterization of the relationships among financial variables. We find uniform results
across the sample countries indicating that the connectedness between oil and equity is established
by the bi-directional information spillovers between the two markets. However, we find that the bulk
of association is largely dominated by the transmissions from the oil market to equity markets and
not the other way around. The pattern of transmissions is varying over the sample period; however
most of the linkages between oil and equities are established from the mid of 2009 to the mid of
2012 which is a period that witnessed the start of global recovery.
Keywords: Oil price volatility; equity market volatility; directional connectedness; implied
volatility indexes.
JEL Classification: C1, G1.

ACC
EPTE
D M
ANU
SCR
IPT
ACCEPTED MANUSCRIPT
3
1. Introduction
The relationship between oil and equity prices has attracted a lot of research. However, there have
been a few studies that have focused on the relationship between oil and stock prices’ volatility,
particularly in the period following the financial global crisis. Moreover, most of research on the oil-
equity relationship is based on statistical model volatilities and not on the volatilities used by the
market to price options. In this paper, we examine the after crisis connectedness between oil implied
volatility and equity implied volatilities in eleven major stock exchanges around the globe.1 To the
best of our knowledge, this has not been done before in the oil-equity volatility relationship
literature.
The study was not possible without the recently published crude oil implied volatility index
(OVX) by the Chicago Board Options Exchange (CBOE) which has allowed for the investigation of
the volatility connectedness between oil and equities that is implied by option market prices and not
by historical returns. This type of analysis can provide another perspective on the association
between oil and equities for many reasons. First, implied volatilities are more accurate measures of
the latent volatility process than either ARCH models or even realized volatilities.2 Second, as
volatilities are derived from market option prices, they are forward looking and thus they represent
the markets’ consensus on the expected future uncertainty. The implied volatility linkages across
markets are informative about the relation between market participants’ expectations of future
uncertainty. This is important as it provides insights into ways of building accurate equity and option
valuation models and improves forecasts of cross market volatility. Third, implied volatilities depend
on fear and not only on the markets’ expectations of future volatility. When fear is high, a risk
1 These countries are: USA, Canada, Japan, UK, Germany, Russia, Sweden, Switzerland, India, South Africa and
Mexico. 2 See Poon and Taylor (2010) for more information about the in sample accuracy of implied volatility compared to other
volatility. Furthermore, the studies of Christensen and Prabhala (1998), Fleming (1998), Jorion (1995), Blair et al.,
(2001) have all found evidence that implied volatilities are more accurate than historical model volatilities in the
prediction of the latent volatility process.

ACC
EPTE
D M
ANU
SCR
IPT
ACCEPTED MANUSCRIPT
4
premium follows and options are priced with higher volatilities than the volatilities used when fear is
low. In that sense, the implied volatility analysis tracks the investors’ sentiment and therefore, the
inferred volatility connectedness reflects fear connectedness that is expressed by market participants
as they trade.3 Fourth, in the recent years and with the growing activity in the oil paper market, many
financial market traders such as speculators, arbitrageurs, and convergence traders have started to
invest in oil. These traders are highly leveraged and their trading is occasionally based on sentiment
and risk aversion; their presence has hence intensified co-movements of risk across markets. The
positive connectedness between oil and equities due to the change and increase in market participants
is best captured by focusing on implied volatility linkages that account for cross market sentiments.
Therefore, studying short term implied volatility connectedness may provide additional insights on
the influence of the change in participants and trading activity on the linkages between oil and equity
markets.4 Furthermore, the different nature of risk transfer between oil and equity markets is useful
information for risk management and diversification in derivatives portfolios.
Hence, in this paper we provide a recent picture about the risk transfer between oil and equities
following 2008. We chose to start our estimation sample in 2008 because this year coincides with the
beginning of the global financial crisis. Furthermore, during this period the shale oil production
industry becomes a consolidated major player in the oil market. The period have also witnessed the
collapse of cooperation among OPEC members, the slowdown of the biofuel industry, the Eurozone
debt crisis and the slowdown of China which is a major source of demand for oil.
3 The most popular and monitored implied volatility index in the US is the VIX. It is touted as an investor fear gauge. In
Whaley (2008), it is argued that the VIX is a barometer of investors’ fear in a bear market and investors’ excitement in a
market rally. 4 For more information on this structural change and its impact on markets’ linkages, see Kyle and Xiong (2001), Kodres
and Pritsker (2002), Boner et al.(2006), Pavlova and Rigobon (2008), Danielsson et al (2011), and Büyükşahin and Robe
(2014)
ACC
EPTE
D M
ANU
SCR
IPT
ACCEPTED MANUSCRIPT
5
In principle, oil volatility can be interrelated with equity volatility through many channels. 5
For
instance, the recent plunge in oil prices to $27.62 in January 2016 has dragged down the S&P500
index by 9%. This simultaneous drastic drop in oil and equity prices reflects as well an association of
volatility between the two markets. These linkages in volatilities are driven by many factors. The
volatility in oil prices may cause corresponding variations in the earnings of oil related companies
and hence, uncertainty regarding the equity prices of these companies is increased. Similarly, the
volatility of oil prices may cause volatility in the prices of banks and financial institutions that are
exposed to oil and oil related companies. Depending on the extent to which volatility in the oil
market reflects uncertainty regarding economic growth; it may cause volatilities in other equity
markets to rise. The recent increase in the volatility of oil in January 2016 is caused by the
heightened worries concerning the future growth of the Chinese economy; it was hence translated to
high volatilities across global equity markets.
The bulk of research on the co-movement of oil focuses on oil price connectedness with equities.
Little research has dealt with volatility spillovers. Moreover, the analysis in the studies that address
risk transmission between oil and equities depends on statistical volatilities that are either model
based or computed from historical returns. These volatilities are not accurate measures of the latent
volatility such as the volatilities implied from option prices.6 Therefore, in this paper we contribute
to the literature by giving new insights on implied volatility spillovers following the global financial
crisis.
5 In terms of returns, there are many reasons why the oil market and equity markets may be interrelated. The higher oil
prices can be translated into higher production costs, lower productivity of labor and capital, lower household disposable
income, lower demand for energy using durable goods and lower corporate earnings and equity prices. High prices can
also mean higher earnings and equity values in the mining, oil, gas and other related industries (Nandha and Faff, 2008;
El-Sharif, 2005). Or alternatively, it may have no influence whatsoever (Chen, 2010). 6 For instance, the widely used ARCH models are found to explain less than 10% of the movement in the latent volatility
and hence, the information content of these volatilities may be questionable (See Akgiray, 1989; Figlewski, 1997;
Franses and Van Dijk, 1995; Brailsford and Faff, 1996).

ACC
EPTE
D M
ANU
SCR
IPT
ACCEPTED MANUSCRIPT
6
In comparison with the related literature, our methodology is different and depends on a set of
connectedness measures that are proposed by Diebold and Yilmaz (2012, 2014, and 2015). The
biggest advantage of this method is that the proposed measures are dynamic and directional. For
instance, according to these measures we may judge the extent of information transmission or
volatility connectedness between oil and equities at any particular date. Moreover, as the measures
are directional, they become revealing in terms of the origin of the bulk of informational
transmission between the oil market and equity markets. Hence, the measures indicate on which
market is contributing the most to the connectedness of volatilities.
Our results show that the transmission of information between oil implied volatility and equity
implied volatilities is bi-directional and asymmetric. In particular, we find that the directional
connectedness from the oil market to equity markets is higher than the directional connectedness in
the opposite direction. The highest pairwise volatility connectedness measure observed in the sample
is from oil to Canadian equities of around 26.9%. The second and third highest observed is to the US
and to UK equities where oil contribution amounts to 18.4% and 19.5% respectively. Moreover, oil
was a net contributor of volatility to all stock markets included in the study.7
The dyamnic analysis of connectedness clearly shows that the information transmission from the
crude oil uncertainty to other equity markets are more pronounced and larger in magnitude than the
transmissions in the opposite direction. The nature of spillover during the sample period is
characterized by weak transmission at the beginning of the sample (first quarter of 2008 up to mid of
2009). The risk transfer from oil to equities has picked up and it has increased following the mid of
2009 and to the mid of 2012. As we approached the end of the sample oil transmission decreases.8
Over the sample period, the volatility transmission is dominated by the oil market.
7 The net total directional volatility transmission is only positive in the US and in the oil market. This indicates that these
two markets are a net spillers of volatility to other equities. 8 On the contrary, at the start of the sample in 2008, the US dominates the information transmission with the oil market.

ACC
EPTE
D M
ANU
SCR
IPT
ACCEPTED MANUSCRIPT
7
The Granger causality tests of the time series of implied volatilities is consistent with the
directional connectedness measures. The direction of causality between implied volatilities of equity
and oil markets is dominated by oil. The only exception is the US market where causality is found to
be bi-directional. Finally, the dynamic conditional correlations show that correlations are average
and varying across countries and time.
Our results are consistent with the bulk of literature that finds significant linkages between the
volatility in the oil market and equity volatilities. They conform nicely to the strand of literature that
finds that the main information crosses are from the oil market to the other equity markets (Arouri et
al. 2011; Awartani and Maghyereh, 2013; Bouri, 2015a; Bouri, 2015b; Bouri and Demirer, 2016;
Malik and Hammoudeh, 2007; Malik and Ewing, 2009). However we are different from all in terms
of methothodology and in that we focus on the linkages of implied volatlities that are used to price
oil and equity option.
The rest of the paper is organized as follows: The next section summarizes the literature. Section
3 outlines the directional connectedness measures proposed by Diebold and Yilmaz (2015). Section 4
provides a description of the data set and some preliminary statitics of the implied volatility indices
included in the study. In Section 5, we perform a full sample static analysis in which we characterize
the connectedness among oil and equity volatilities. Also in this section, we perform a rolling sample
analysis to check the dynamics of the connectedness across time. The robustness analysis is included
in section 6. The section presents the results of the Granger Causality tests and the dynamic
conditional correlations. Finally section 7 contains some concluding remarks.

ACC
EPTE
D M
ANU
SCR
IPT
ACCEPTED MANUSCRIPT
8
2. Literature Review
The literature on the oil equity relationship contains numerous studies.9 The early research of
Kling (1985) indicates that oil price is negatively related to the performance of US equities. Similarly
are the results of the present value model of John and Kaul (1996) which finds that changes in oil
prices may explain changes in equity returns in Canada, Japan, the UK and the US through the
impact on current and futures cash flows. The group of studies in the subsequent literature includes
the studies by Huang et al. (1996), Sadorsky (1999), Park and Ratti (2008), and Apergis and Miller
(2009). These studies rely on various methodologies such as vector auto regression models,
international capital asset pricing models, integration tests and vector error correction models. They
all arrive to a similar conclusion that oil price changes matters and influence equity returns. In the
context of emerging markets, there are also a number of papers that have shown that oil shocks have
long and short term impact on equity returns (Papapetrou, 2001; Basher and Sadorsky, 2006; Naryan
and Narayan, 2010).
Motivated by the non-uniformity of impact of oil shocks on various sectors, some studies have
examined the linkage with oil on a sector by sector basis. The studies by Sadorsky (2001), Boyer and
Filion (2007) show that share prices of Canadian oil and gas companies are positively related to the
price of oil. The study by El-Sharif et al. (2005) show that same results apply also for the gas and oil
sector in the UK but to a lower extent. The work of Nandha and Faff (2008) produces similar results
in the US. The significant impact of oil shocks on the transport sector in thirty eight developed
countries around the world is reported by Nandha and Brooks (2009).
In principle, there is a valid reason to believe that uncertainty in the oil markets may well
introduce uncertainty in company earnings and reduce stock values. Hence, the oil- equity research
9 See Maghyereh (2004), Maghyereh and Al-Kandari (2007), Kilian (2008), Nandha and Faff (2008), Cong et al.(2008),
Chen (2010), Arouri and Rault (2012), El-Sharif et al.(2005), Apergis and Miller (2009), Driesprong et al. (2008) Park
and Ratti (2008), Hammoudeh and Aleisa (2004), Bachmeier (2008), Sari et al. (2010), Awartani and Maghyereh (2013),
Mollick and Assefa (2013), Bouri (2015a), Bouri (2015b), Tsai (2015) and Bouri and Demirer (2016) among many
others.
ACC
EPTE
D M
ANU
SCR
IPT
ACCEPTED MANUSCRIPT
9
contains some papers that assess the impact of oil price uncertainty on equity returns. For instance,
the study of Nandha and Hammoudeh (2007) focuses on the association between market beta risk
and equity returns in the presence of oil price and exchange rate uncertainty in the Asia-Pacific
region. The multi-factor model used shows significant influence of oil price uncertainty in two of the
countries of the sample. Similarly, the vector error correction model employed by Masih et al. (2011)
shows a profound negative effect of oil volatility on South Korean equities. The impact of oil
uncertainty on Eastern European equities is studied by Asteriou and Bashmakova (2013). They use a
multi-factor model and find that the influence of oil price beta is negative and significant. The recent
study of Wang et al. (2013) employs a structural VAR model and investigates the effect of oil price
uncertainty on stock market returns. They find that both oil supply and demand uncertainty have
negative effect on equity returns. All these studies suggest that oil price uncertainty is an important
factor in determining stock market performance and volatility.
The aforementioned literature looks at the influence of oil price changes on the performance of
equities and without addressing the issue of volatility spillovers between oil and equities. This issue
is addressed lately in the context of multivariate GARCH processes by another group of papers.
Malik and Hammoudeh (2007) and Maghyereh and Awartani (2015) report significant transmissions
of oil volatility to equity volatilities in the Middle East countries. The transmissions from equity
volatility to oil volatility are found to be insignificant in all markets except for the Saudi market.
Malik and Ewing (2009) find significant volatility transmissions between oil volatility and equity
volatilities in the financials, industrial consumer services, health care, and technology sectors in the
US. Arouri et al. (2011) find significant volatility spillovers from oil to equities in Europe and the
US and insignificant spillovers from equities to oil. Bouri (2015b) finds weak unidirectional
volatility spillovers from oil prices to the Lebanese stock market.

ACC
EPTE
D M
ANU
SCR
IPT
ACCEPTED MANUSCRIPT
10
Recently, Bouri (2015a) uses causality-in-variance tests and highlights the dynamic effects of the
global financial crisis on the volatility transmissions between oil prices and stock indices of oil-
importing countries. Whereas, Bouri and Demirer (2016) find unidirectional volatility transmissions
from oil prices to emerging stock markets, particularly in the case of the net exporting nations of
Kuwait, Saudi Arabia and UAE.
The studies above infer risk transmission by studying statistical volatilities that are either model
based or computed from historical returns. Instead, in this paper we contribute to the literature by
giving new insights on risk transfer between oil and other equities which is based on implied
volatilities. The inference based on implied volatility is important as these volatilities are derived
from market option prices and hence they represent the markets’ consensus on the expected future
uncertainty. Moreover, the implied volatility indexes are considered as gauges for fear and in that
sense the inferred implied volatility connectedness reflects the fear connectedness that is expressed
by traders and market investors. Therefore, implied volatilities are more able to capture volatility
crossovers that are related to market sentiment than historical volatilities. They are also more suitable
to capture cross market fluctuations that are related to portfolio rebalancing and speculative activities
that have increased recently in the paper oil market. 10
In comparison with the related literature, our methodology is different and depends on a set of
connectedness measures that are proposed by Diebold and Yilmaz. The advantage of this method is
that it allows us to dynamically track down the extent of linkages as well as its direction.11
In the
context of oil equity volatility spillovers, these measures are used by Awartani and Maghyereh
10
The implied volatility as a forecast is also more accurate. For instance, the widely used ARCH models are found to
explain less than 10% of the movement in the latent volatility and hence, the information content of these volatilities may
be questionable (See Akgiray, 1989; Figlewski, 1997; Franses and Van Dijk, 1995; Brailsford and Faff, 1996). 11
These measures are recently proposed by Diebold and Yilmaz in a series of papers (Diebold and Yilmaz, 2009;
Diebold and Yilmaz, 2012; Diebold and Yilmaz 2014) and then unified in Diebold and Yilmaz (2015).

ACC
EPTE
D M
ANU
SCR
IPT
ACCEPTED MANUSCRIPT
11
(2013) who provided evidence that the volatility transmission mechanism in the GCC countries is
dominated by volatility transmissions from the oil market.12
3. Empirical methodology
We utilize the directional connectedness measures that are introduced by Diebold and Yilmaz
(2012, 2014, 2015). The objective of this econometric technique is to compute various interesting
measures from the transmissions of implied volatilities in a system that contains the oil market and
the eleven equity markets included in the study. 13
Assume that implied volatility indices, are modeled as a vector autoregressive process,
that can be written as14
where is a matrix of parameters to be estimated. Also assume that the vector of error terms
is independently and identically distributed with zero mean, and covariance matrix. If the
system above is covariance stationary, then there exists a moving average representation that is given
by ,where the coefficient matrices obey a recursion of the form
with is the identity matrix and .
The moving average coefficients are important to understand the dynamics as the variance
decompositions are computed as transformation of the coefficients in the moving average
representation above. The variance decompositions (or impulse responses) allow us to split the H-
step ahead of forecast errors of each variable into parts that can be attributable to the various market
12
The GCC stands for the Gulf Cooperation Council which is a group of oil producing countries that consists of Saudi
Arabia, Oman, Kuwait, the United Arab Emirates, Bahrain and Qatar. 13
This procedure has been rapidly adopted in the relevant literature; refer for example to McMillan and Speight (2010),
Antonakakis (2012), Awartani and Maghyereh (2013), Awartani, et al., (2013), and Maghyereh et al. (2015). 14
Note that the text and notation in this section are quoted from Diebold and Yilmaz (2012, 2014, 2015).

ACC
EPTE
D M
ANU
SCR
IPT
ACCEPTED MANUSCRIPT
12
shocks. The aggregation of these decompositions will be subsequently used to compute the
directional connectedness of a particular market to any or to all of the markets included.
The variance decompositions computation is usually done using orthogonal VAR shocks. The
Cholesky identification scheme achieves orthogonality but the computed variance decompositions
are then unstable and are dependent on the ordering of the markets.15
Thus, Cholesky decomposition
is not suitable. A framework that produces invariant decompositions is the generalized VAR that
allows correlated shocks but accounts for them appropriately. The framework has been first proposed
by Koop et al. (1996) and Pesaran and Shin (1998) and is called the KPPS hereinafter. Following
Diebold and Yilmaz, the KPPS H-step-ahead forecast error variance decompositions for
is computed as16
where ∑ is the variance matrix of the vector of errors ε, and is the standard deviation of the error
term of the market. Finally, is a selection vector with one on the element, and zero
otherwise. In order to get a unit sum of each row of the variance decomposition, Diebold and Yilmaz
normalize each entry of the matrix by the row sum as17
Note that the sum of decompositions across any particular market
, and across
markets
. Therefore, can be seen as a natural measure of the pairwise
directional connectedness from market to market at horizon . To make (4) more intuitive, we
15
Different orderings may result in significantly different spillover estimates (Klößner and Wagner, 2014). 16
In particular, the represents the contribution of a one-standard deviation shock of to the variance of the
ahead forecast error of . 17
Though the KPPS is robust to ordering, its decompositions do not sum up to one as in Cholesky factorization. Thus,
the normalization of the sum will enable an intuitive computation of the contribution of a particular market, and an
intuitive sum of contributions across markets.

ACC
EPTE
D M
ANU
SCR
IPT
ACCEPTED MANUSCRIPT
13
use the notation to represent this transmission. In the same way, we might also compute the
pairwise directional connectedness in the opposite direction as . The two statistics allow us
to compute the net pairwise directional connectedness as
This is interesting statistics that indicate which market is playing the dominant role in the
information transmission between the two markets.
In our case, we are particularly interested in determining how all markets together are contributing
to a single market, so we aggregate partially. The total directional connectedness from all markets to
market is denoted as and it can be computed as
Using the same logic we are also able to compute how a particular market is contributing to the
shocks of all other markets by aggregating partially. The total directional connectedness from market
to all markets is denoted as and it can be computed as
This is also an informative connectedness measure. Together with the previous statistics it may
define the role of the market in the whole system of markets as a net transmitter or receiver of
shocks. In particular, we are occasionally interested in computing the net total directional
connectedness which can be calculated as
The total aggregation of the variance decompositions across all markets measures the system wide
connectedness. The total connectedness in all markets can be computed as

ACC
EPTE
D M
ANU
SCR
IPT
ACCEPTED MANUSCRIPT
14
This is only the ratio of the sum of all off diagonal elements in the variance decomposition matrix
of all markets to the sum of all elements (off diagonal and own shocks). It measures the total
information flow among all markets under consideration.
4. Data description and preliminary statistics
4.1 The implied volatility indexes
The implied volatility indexes are termed as the VIX indexes and they are constructed and
published by the CBOE. The VIX indexes are computed from the market prices of out-of-the-money
calls and puts and without the use of any pricing models. The indexes are calculated using the
following formula:
where is defined as the VIX/100 and hence, the VIX = , is the time to the maturity of the
set of options, is the forward price level derived from the lowest call-put option premium
difference, R is the risk free interest rate,
is a measure of the average interval
between the strike price of the options adjacent to option and the strike price of option , is the
first strike price below the forward price level . Finally denotes the option premium
computed as the mid- point of the bid-ask spread of each option with strike .
The inclusion criteria into these indexes is designed such that it includes all out-of-the-money puts
and calls that are centered around an at-the-money strike, . However, if there are no bids for an
out-of-the-money option at a certain strike, then this option and all other options at higher (or lower
in the case of puts) strikes are excluded from the computation of the index. Note that in high

ACC
EPTE
D M
ANU
SCR
IPT
ACCEPTED MANUSCRIPT
15
volatility markets, demand for out-of-the-money options is strong and more options are included in
the construction of the index.
Once the options from which VIX is going to be constructed are selected, the weighting criterion
of each option in the index is proportional to its premium and to the average distance of the strike of
option with adjacent strikes that have non-zero bids. The option weight is also inversely proportional
to the square of the option’s strike.
To construct the index, the CBOE computes implied volatility using equation (9) for two sets of
options: the near term options and the next near term options. Both sets last for more than 23 days
but expire in less than 37 days. For instance, suppose that in any one day the two sets of options
expire in 24 and 31 days respectively. Then we compute equation (9) twice: once for the near term
options with 24 days to maturity and another for the next near term options with 31 days to
expiration. The VIX index which represents the 30-day volatility implied by option prices is
interpolated from these two implied volatilities. Thus, the VIX index is a measure of forward-looking
measures of stock market volatility that investors might expected to see over the next 30-day (i.e., it
represents what investors believe today volatility will be in the future).
From (9), we can see that the VIX index is computed without any option valuation model and in
that sense it is model free. The VIX index is directly related to the market values of calls and puts
and, hence, it reflects what the option traders think of future market volatility. The forward looking
nature of option prices is the most important distinguishing feature of the VIX index. Accordingly,
the implied volatility indexes have been shown to be more informative than historical volatility in
terms of volatility measurement and prediction.18
18
See for instance, Poon and Granger (2003), Whaley (2008), Carr and Wu (2006), Granger (2003), Corrado and Miller
(2005), and Bentes (2015), Kanas (2012), and Gonzalez-Perez (2015).

ACC
EPTE
D M
ANU
SCR
IPT
ACCEPTED MANUSCRIPT
16
4.2 Preliminary Statistics
As mentioned previously, to understand the cross transmission of volatility between oil and major
equity markets, we use implied volatility indices. The volatility used to price options not only
includes the consensus of the market regarding future volatility but it is also more accurate and
contains a premium for fear. Therefore, these indices are more suitable in our context than realized or
historical volatility measures that are less informative on the latent volatility and do not account for
fear.
Hence, the implied volatility indices for crude oil and other 11 major countries around the globe
are collected. The countries included in the sample are: USA, Canada, UK, India, Mexico, Japan,
Sweden, Russia, South Africa, Germany and Switzerland. The data comprises daily closing price of
the implied volatility index of crude oil and that of each of the 11 countries under study. The
symbols of the indices included are: AEXVOLI for USA, CACVOLI for Canada, VFTSEIX for the
UK, NIFVIXI for India, VIMEXVI for Mexico, VXJINDX for Japan, SIXVXVL for Sweden,
RTSVXVL for Russia, JSAVIVI for South Africa, VDAXNEW for Germany, and finally VSMI01M
for Switzerland.
The data on the indices is downloaded from Thomson Reuters DataStream. As the crude oil
implied-volatility index is only available after the 3rd
of March 2008, our sample is restricted and
only covers the period that is following the 3rd
of March 2008. It extends to the 3rd
of February 2015
for a total of 1806 daily observations. Hence, in this paper, we provide a recent picture about risk
transfer from oil to equities following the global financial crisis. The period under study has also
witnessed the rise in the oil paper market where many equity investors have started to invest in oil.
The presence of these traders in both the equity and oil markets may have implications on risk
transfer and linkages between oil and equities.

ACC
EPTE
D M
ANU
SCR
IPT
ACCEPTED MANUSCRIPT
17
Figure 1 displays the time series plot of the implied volatility index of crude oil and the US equity
market over the sample period.19
As can be seen in the figure, the volatilities with which oil and
equity options are priced move closely together across time. Moreover, the implied volatility of oil
and equities show common spikes. For instance, volatilities spike around the mid of 2008 and during
the global financial turmoil which has created big uncertainties regarding the future global growth,
the demand for oil and equity markets’ performance. Similarly large revisions of oil and equity
volatility predictions occur towards the end of 2009 due to the increased uncertainty of the Greek
sovereign debt crisis. Another common spike of oil and equity market implied volatility occurred
near the beginning of 2011 and with the increase in worries about the sovereign debt and banking
problems in Italy and Spain.
INSERT FIGURE 1
The common trends in implied volatilities are not surprising as oil and equity price changes were
severe during that sample period. For instance, the price of crude oil dropped from a high of $146 per
barrel to a low of $39 with the financial meltdown that started with the collapse of Lehman Brothers
in August 2008. Unlike equities which recovered slowly, oil has fastly recouped its losses and
reached around $100 in early 2010. This was due to the continued strong demand from emerging
economies and China. Opposite to the US and most European Union countries that slowed down,
these economies surprisingly continued to grow at a high pace despite the financial crisis. Equities
have also experienced large fluctuations during the sample period. They dropped signifcantly over
the various stages of the global financial crisis following 2008, all the way to mid-2009 and then
after a slight recovery, they experienced big variations with the European Sovereign debt crisis that
started in Greece in late 2009 and early 2010 and folded only recently.
19
The implied volatility indexes of other countries display similar pattern. Hence, we plot only oil and US implied
volatility indexes for exposition. The analyses that follow still describe the common trends between the oil implied
volatility and equity implied volatility in US and non-US countries.

ACC
EPTE
D M
ANU
SCR
IPT
ACCEPTED MANUSCRIPT
18
However, the common trends in volatilities between oil and equity were broken by the end of the
sample in 2014 and 2015. Figure 1 shows that in July 2014 there was a spike in the volatility of
prices of short-term oil options that was not matched by the volatility of pricing equity options. This
indicates that oil volatility in the recent years is more driven by the factors that are less likely to
influence equity markets and equity volatilities. These factors are related to the fundamentals of oil
as a commodity and to the increase in shale oil production and the plentiful global supplies that led to
big declines in the price of the crude.20
It is worth to mention here the increase in the inter-relationships observed recently. The sever
drop in oil prices in January 2016 to $27 has led to big losses in global equity markets. For instance,
the S&P500 has lost 9% of its value on the same day. This demonstrates clearly how oil volatility is
intertwined with equity volatility, particularly when oil volatility reflects news that is crossing to
other markets. The recent drop in oil prices revealed the likelihood of a Chinese slowdown and
therefore it increased the uncertainty of equity values and markets.
To compare the statistical properties of the crude oil implied volatility index with the indices of
the equity markets, we computed a variety of summary statistics. Table 1 Panel A and Panel B report
the summary statistics of the levels and the log changes of implied volatility indices of crude oil and
equity markets respectively. Panel A displays the mean, the standard error, the minimum, the
maximum, the skewness, the excess kurtosis and the Jarque-Bera statistics to test the null hypothesis
that implied volatility forecasts are normally distributed. On average the panel shows that the level of
crude oil implied volatility and its standard error are higher than equity markets. The higher average
level indicates that crude oil options are priced with higher volatilities than equity options in all
investigated markets. The higher standard error shows that the market expectations measure of
20
The oil traded above $100 per barrel until the end of July, 2014. At that point, prices started to collapse falling to
approximately $44 by March 2015. The OPEC announcement on November 27, 2014 to hold crude oil supplies steady at
30 million barrels per day led to an 11.2% decline in the price of the crude in that day alone. The recent slowdown of the
Chinese economy has also contributed to weakening the oil market.

ACC
EPTE
D M
ANU
SCR
IPT
ACCEPTED MANUSCRIPT
19
volatility is more volatile in the crude oil market when it is compared with equity markets. The
markets are more confident in predicting equity volatility than oil volatility. The higher standard
error is also reflected in wider range of the oil index compared to equity indices as indicated by the
minumum and maximum levels in Table 1. The only exceptional market is Russia which exhibited
higher volatility and standard errors in volatility levels compared to oil. The log volatilty changes in
Panel B points out that over the sample period, the net change in market expectation of equity
implied volatilities are negative in all equity markets, and positive in the oil market. Hence, the
volatilty with which options are priced has increased on average for oil options, while it has
decreased for equity options over the sample period.21
Table 1 also shows that the distributional properties of the oil implied volatility index is far from
being normal. The index is positively skewed and leptokurtic and the Jarque-Bera statistics rejects
the null hypothesis of normality very strongly. The skewness and kurtosis of the index indicates
serious upward volatility revisions in pricing oil options during the sample period. The distributional
properties of the levels of implied volatility of equities is similar and conveys the same story. They
are positively skewed, kurtic and non-normal.22
The Ljung-Box portmanteau statistics reported in Table 1 is computed for the last four weeks of
the levels and the log changes of implied volatility. As can be seen in the table, all indices are highly
serially correlated indicating the presence of temporal dependence in the implied volatility process
and its log difference. As a response to the arrival of new information, the market adjusts the
volatility prediction and consequently options prices. In this respect, implied volatility is similar to
historical volatility which is characterized by clustering and serial correlations.
21
The exception was Russia where the log changes in volatility was positive over the sample period. 22
The same applies to the distributional properties of the log volatilty changes reported in Panel B of Table 1. Compared
to the levels, these exhibit lower positive skewness and higher kurtosis.

ACC
EPTE
D M
ANU
SCR
IPT
ACCEPTED MANUSCRIPT
20
The results of the unit root test for the levels of the indices are reported in the last two columns of
Table 1. The null hypothesis of the ADF test is that there is a unit root in the variable. We tested two
specifications of the implied volatility process to infer stationarity. As can be seen in the table, the
implied volatility of equities are all stationary at the 5% level, while the implied volatilities processes
of oil and the volatility of Mexican, Russian and South African equity may contain a unit root.
However, when we tested the changes in log implied volatility indices, the null of non statitionarity
was rejected at a 1% level in all markets as can be seen in Panel B of Table 1.
INSERT TABLE 1
To get an idea on how the volatility pricing options in the oil market is related to the volatility
used to price equity options, we computed the simple correlation coefficients between the implied
volatilities of oil and equities. The correlation matrix is presented in Table 2. Panel A of the table
reports correlations at the levels of the index, while Panel B reports log volatility’s changes. At the
price levels, the implied volatility of oil is highly correlated with equity volatility in all equity
markets. The correlation between oil and equity volatility is greater than 0.72 in all markets. This
indicates that equity options are priced with volatilities that are not independent from the uncertainty
in the oil market. Similarly, the level of associations among equity markets’ volatilities which is
even higher and reflects the high extent to which volatilities used to price options are related across
equity markets.
The highest correlations are with the US. The simple correlation coefficient between the US
implied volatility and other equity markets’ implied volatility is not less than 0.81. This correlation is
more pronouced among European and North American equities than with other stock markets. For
instance, the correlation between the US and European equity volatility is not less than 0.92 and it
reaches 0.98 with the UK. This reflects the level of equity market integration and volatility
association between the US and Europe.

ACC
EPTE
D M
ANU
SCR
IPT
ACCEPTED MANUSCRIPT
21
Panel B reports the correlation matrix for the log volatility changes. In the panel, the correlation
between oil and equity daily implied volatility changes is average and significantly lower than the
association in levels. The correlations between changes in oil volatility and changes in the volatility
of the US, UK, Germany, and Canada are 0.29, 0.30, 0.34 and 0.28 respectively. The high
association in the levels of oil-equity implied volatilities and the relatively lower correlation of
changes shows that in general the levels of uncertainty in equity markets are associated with the
levels of uncertainty in the oil market. However, the daily changes in equity implied volatilities may
not be closely related to the daily dynamics of oil volatility which may be driven by other factors.
It is worth to mention here that changes in implied volatility remain high among equity markets in
Europe and North America. For instance, the correlations between changes in US implied volatility
and changes in the implied volatilities of the UK, Canada, Sweden, and Germany are 0.70, 0.72, 0.61
and 0.76 respectively. Similary Panel B reports high pairwise correlations among changes in the
volatility in any two European countries. For example, the changes in implied volatility of German
equities is highly correlated with the changes in Canada, the UK and Sweden. At the same time it is
weakly correlated with either the crude oil or other equity markets outside the US or Europe.
INSERT TABLE 2
5. Empirical results
5.1 Static volatility connectedness analysis
The matrix presented in Table 4 reports the full sample cross market connectedness of the first
difference of implied volatilities.23
The diagonal elements of the matrix represent the own market
connectedness and are not particulary interesting in our context. The off diagonal elements
(i.e. ) of the matrix measures the pairwise volatility directional connections and are
23
All the results in the table are based on vector autoregression of order 2, and generalized variance decompositions of
10-day ahead forecast errors. We also use Cholesky-factorizations with alternative orderings. The results (are not
reported but available from the authors upon request) remain qualitatively similar.

ACC
EPTE
D M
ANU
SCR
IPT
ACCEPTED MANUSCRIPT
22
particularly important for our study. Most importantly is the first column which measures the
directional connectedness from the crude to US equity (i.e. ). Similarly, the first row of the
table is important as it measures the directional connectedness into the oil market from other equity
markets (i.e. ).
For instance, the highest oil volatility pairwise connectedness measure observed is from oil to
Canada of around 26.9% (See first column, third row). In return the pairwise connectedness from
Canada to oil is almost nil (See first row, third column). The difference between the two pairwise
directional connectedness measures implies that the net pairwise connectedness is from oil implied
volatility to the implied volatility of the Canadian equities. This is expected as oil is an important
factor that is weighted heavily by Candian stock market investors.24
The second and third highest oil volatility conectedness observed is in the US and the UK markets
where oil’s contribution amounts to 18.4% and 19.5% for the two markets respectively and the two
markets contributes only with a 0.2% rate to oil volatility. Hence, the net pairwise connectedness is
from oil to the US and UK equities. Similar patterns of oil equity market connectedness is observed
with the rest of markets. One factor behind the relatively higher pairwise directional connectedness
with Canada, the UK and the US is that the three economies are among the top oil producers in the
world which is likely to increase the ties with oil.25
Russia is a big producer of oil. But the risk transfer from oil to its equities is not found to be as
strong as in oil producing countries (Canada, the US and the UK) over the sample period. On the
other hand, Germany is not an oil producer but with a high connectedness that is almost equal to the
UK’s. Therefore, the level of connectedness is not exactly explained by being an oil producer.
24
For instance, the drop in oil prices following the mid of 2014 led to more than 20% drop in the value of Canadian
equities. 25
The US is number 1, Canada number 5 and the UK number 23. For more information see
http://www.eia.gov/beta/international/rankings/#?prodact=53-1&cy=2014.

ACC
EPTE
D M
ANU
SCR
IPT
ACCEPTED MANUSCRIPT
23
Another possible explanation lies in the high presence of oil option and equity traders in the group of
high connected countries. These traders are active in both the oil and the equity market and hence
their presence creates common volatility linkages.26
However, the dynamic rolling estimation of risk transfer from oil to Russian equities shows
significant risk transfer in the samples that spans the period 2010-2013 (See Figure 3). As the sample
moves out to 2014, the risk transmission to Russian equities fades. The sanctions that were imposed
on the Russian economy in February 2014 upon the annexation of Crimea and the Ukraine crisis is a
possible explanation. While the nature of the impact of oil on Russian stocks is known, the impact of
these sanctions is ambiguous. Hence, we may conclude that after 2014, the volatility of Russian
equities was more driven by sanctions news rather than oil volatility.27
It is worth to mention here that while return transmission from oil and equities can have a positive
or a negative impact28
, the risk transfer has always a negative influence as it increases uncertainty in
the receiving market. For instance, the volatility transmistion from oil to equities in oil producing
countries creates uncertainties regarding the future prospects of oil and oil related companies. It also
casts uncertainties on banks’ future perfromance that are exposed to the oil and gas sector.
Particuarly, in cases where government spending depends on oil, there are also uncertainties
regarding future public spending and economic activity.
The oil cross country directional connectedness observed shows that pairwise connectedness of
oil is greater with North American and Western European countries that have well developed and
mature equity markets. For instance, the connectedness measure observed from oil to Germany and
26
This point has been brought to our attention by one of the referees. 27
The Moscow stock exchange shows resilience during this period. There is an increase in volatility and a drop in prices
before one stage of sanctions is implemented, but then the market rebounds to recoup losses afterwards. 28
In general it is positive in net oil exporter countries and negative in net oil importer countries. The nature of the impact
is also sectoral. In general, a decrease in oil prices benefits airline and transportation, manufactures, household, water and
utilities; but it harms the oil and gas sectors.

ACC
EPTE
D M
ANU
SCR
IPT
ACCEPTED MANUSCRIPT
24
Switzerland is 18.1% and 12.4%, whereas it is 3.9%, 11.3%, 8%, 11.6% for India, Mexico, Russia
and South Africa respectively.
There are many theoretical channels of information transmission from oil volatility to equity
volatility. For instance, high volatility in the oil market can be translated into higher earnings
volatility in oil and oil related companies. Oil price volatility may create comparable uncertainties
regarding business cost, disposable income and consumer spending on energy using durable goods.
Volatile oil markets may also convey information on future global economic uncertainty and hence,
they can influence global equity markets’ volatility. Therefore we expect high transmissions from oil
volatility to equity volatility.29
The row sum of the pairwise connectedness measures the aggregate contribution of all others to
each of the twelve markets in the study (the total directional connectedness). In other words, the
contribution from others in the last column of the matrix is the sum of the volatility transmission
from all markets to a particular market. Similarly, the column sum of all pairwise connectedness
measures the total directional connectedness to others from the corresponding market. This means
that the contribution to others is the sum of pairwise directional transmission of implied volatility
from a market to all other markets.30
The oil implied volatility’s contribution amounts to 139% to the
equity volatility of all markets in the system while it only recieves a 6% contribution from others. In
that sense, oil is differentiated as a transmitter of shocks to equities.
In the system of countries that we have, the US and the oil market are the only two markets of the
twelve markets under study in which the contribution to others’ connectedness is higher than the
contribution from others connectedness. The positive net connectedness of the oil market with all
other markets is 133% indicating that it is a net transmisster of volatility shocks to others. The US
29
If US equity reflects the health of the global economy and the future demand for oil, then transmissions from equity to
oil should be expected as well. However, these transmissions are less direct than the direct spillover of oil volatility on
corporate earnings and returns. 30
Note that the contribution to others’ forecast error variance is not constrained and it may exceed 100%.

ACC
EPTE
D M
ANU
SCR
IPT
ACCEPTED MANUSCRIPT
25
market is also a net giver to all others and its net contribution is two and a half folds the net
contribution of oil at around 317%. The net connectedness of the rest of markets is negative which
indicates that they are net recepients of volatility shocks from other markets. Among the markets that
have negative net total connectedness, Germany has the highest value at -81%, followed by Canada
at -77%, Switzerland at -68%,South Africa at -47% and the UK at -46%.
The total connectedness of implied volatilitis that is reported in the lower right corner of the table
is 52%. This is relatively high compared to the same measure computed for volatility connectedness
among the same markets using range based historical volatility estimators instead of implied
volatilities from option prices. For instance, it is higher than the total volatility spillover computed by
Diebold and Yilmaz (2009) for the same markets.31
Given the uncertain period of the study that
contains the financial crisis in 2008, the European sovereign debt crisis following the Greek crisis in
late 2009 and early 2010, the US fiscal cliff and the oil price collapse, there is a high degree of
connectedness in the sample.32
There is another reason for the total connectedness of implied
volatilities to be higher than historical or range based volatilities. The connectedness of implied
volatilities measures fear connectedness in addition to volatility association. Options are priced with
higher volatilities than the expected volatility in volatile markets.33
Hence, implied volatility
association not only reflects volatility crossovers but also the fear premium transmissions among
markets.
INSERT TABLE 3
31
In the study of Diebold and Yilmaz (2009), the total connectedness is found to be 39.5%. The markets in their sample
are different, but still we share the following countries with them: the US, the UK, Germany, India and Mexico. 32
The fiscal cliff refers to the Republican-Democratic disagreement regarding spending cuts towards the end of 2012.
The failure to reach a compromise by the two parties unnerved the US financial markets. 33
In this sense the implied volatility used to price options can be considered as a composite measure of volatility that
reflects both the expected future volatility and the uncertainty around that expected volatility or alternatively the fear
premium.

ACC
EPTE
D M
ANU
SCR
IPT
ACCEPTED MANUSCRIPT
26
5.2 Dynamic volatility connectedness analysis
The static connectedness analysis provides a good charcaterization of the connectedness of
implied voaltilities over the full sample period. However, it is not helpful in understanding how
connectedness changes over time. To obtain that we estimate the vector autoregression using 200
days rolling window, and then we assess the extent and nature of connectedness over time using the
corresponding time series of the total directional connectedness measure.34
Figure 2, Panel (a)
presents plots of total directional connectedness of implied volatility originating from the oil market
and transmisting to other equity markets (i.e. ). Panel (b) of the same graph presents the
transmissions of implied volatility in the opposite direction (i.e. from all equity markets to the oil
market) (i.e. ). The net transmissions are presented in Panel (c) (i.e. ).
The figure shows that the connectedness is largely dominated by the information transmission
from the crude oil market to other equity markets and not the other way around. This is clear from
the order of magnitude of the information spills in Panels (a) and (c) in the Figure. The crude oil
transmits to the rest of equity markets in the order of 100s while it receives in the order of 10s.
Hence, there is a positive net transmission of information from the oil market to other equity
markets. The graph of the net transmissions is presented in Panel (c) and it shows clearly that for
most of the sample period the directional connectedness is established more by the transmissions
from the oil market to other markets. The only exception occured at the start of the sample (in 2008)
when the directional connectedness with oil was more related to transmissions from equities. This
can be explained by the financial crisis that started in the US and rippled off across to global equity,
asset and commodity markets in 2008.35
The US market during that period has dominated the
34
We also used various lags in the VAR models to check the sensitivity to the number of lags. We found that our results
are robust to lag selection. 35
As we will see in the analysis of pairwise directional connectedness, we have also found a dominant role of the US
equity at the start of the sample.

ACC
EPTE
D M
ANU
SCR
IPT
ACCEPTED MANUSCRIPT
27
information transmission across global markets including the oil market.36
This result is consistent
with the empirical evidence of Diebold and Yilmaz (2010) who found that volatility transmissions
from the equity market to the commodity market intensify during periods of stress.
Figure 2 also shows that the directional connectedness is time varying. Three cycles of
connectedness can be spotted in the graph. The first corresponds to the beginning of the sample and
extends from the first quarter of 2008 to the first quarter of 2009. The second cycle corresponds to
the period of recovery in the global economy which extends from the second quarter of 2009 to mid
2012. Finally, the third cycle represents the period that covers the mid of 2012 to the end of the
sample in 2015.
INSERT FIGURE 2
In the first cycle, the directional connectedness between oil and equity is low especially from the
direction of the oil market to equity markets. It is only during the financial meltdown (in September
2008) that transmissions from equities to oil intensified and hence, the connectedness during that
period was dominated by equities. The second cycle witnessed an increased transmission from the oil
market to equities with no significant changes in the information flow in the opposite direction. The
directional connectedness in the second cycle is dominated by the oil market volatility. A possible
explanation is that the influence of uncertainty in the oil market is higher during initial growth stages
as it may threaten the recovery of the global economy and, consequently, equity markets
performance. Therefore, oil uncertainty is closely watched by all markets. Its influence is less in the
relatively stable macroeconomic environment that prevailed during the last cycle as the
connectedness decreased though it was still dominated by oil, albeit to a much lower extent.
36
At the price levels, both the crude oil and the S&P500 had crashed in the wake of the Lehman Brothers collapse in
September 2008. The price of oil dropped from $140 to around $39, while the stock index decreased from 1600 to 400
points in the same period.

ACC
EPTE
D M
ANU
SCR
IPT
ACCEPTED MANUSCRIPT
28
To zoom into the association bewteen oil and individual equity markets, we computed the net
paiwise directional connectedness of oil with each of the markets included in the study. Figure 3
presents the plots of net pairwise directional dynamic connectedness of oil volatility with the
volatility of each of the equity markets over the sample period. As can be seen in the figure, the net
paiwise transmissions from the oil market to equities are positive. This indicates that risk transfer
between the oil market and other equity markets is asymmetric and dominated by the transmissions
from the oil market. The result is unifromly valid across all the equity markets included in the
sample. Therefore, we may conclude that oil is the important market in establishing the association
with other equity markets. Finally, notice that the pairwise analysis of connectedness repeats the
same patterns that was observed before. For instance, the pairwise connectedness in 2008 was
dominated by equities particularly in the oil producing countries such as USA, UK, and Canada.37
Similarly, the figure shows that the connectedness is weak at the beginning of the sample or over the
period from the first quarter of 2008 to the mid of 2009 and that it increased with the connectedness
dominated by the oil market from the mid of 2009 to the mid of 2012. It then decreased as we
approached the end of the sample with the net pairwise directional connectedness being still
dominated by oil but to a lower extent.
INSERT FIGURE 3
6. Robustness of results
This section checks whether results in Sections 5 are robust to the choice of the volatility measure.
In this section we also use Granger causality tests to investigate the short run lead-lag relatioship
between oil and equity volatilities.
37
Although Russia is a big producer of oil, the connectedness of its equity to oil is less pronounced in the figure.

ACC
EPTE
D M
ANU
SCR
IPT
ACCEPTED MANUSCRIPT
29
6.1 Alternative volatility measures
To check robustness to the latent variance measure, we use two alternative volatility estimates that
are widely used in the literature: these are the squared returns and the conditional volatility based on
a GARCH model.
First we use daily squared returns to proxy the latent volatility process.38
To construct the equity
return series of the equity markets, we compiled the Morgan Stanley Capital international (MSCI)
stock market indexes for the relevant countries. These indexes are capital weighted and float adjusted
indexes. They include all companies traded in each equity market. For each of the index series we
computed daily continuously compounded returns as the change in log prices. The squared returns of
the markets are computed across the same sample length which covers the period from 3rd
of March
2008 to the 3rd
of February 2015. The price data on all series is compiled from Thomson Reuters
DataStream.
Table 4, Panel A reports the matrix of markets’ spillovers. The panel shows similar and different
transmission patterns as those reported in section 5. As can be seen in the table, the oil market is a
net transmitter of volatility to all markets in the system. The total transmission of shocks in the
system is a round 55% which is comparable to the total spillover index computed previously. These
results conform nicely with the analysis in section 5. However, the table also shows that the
connectedness of the oil market with the group of oil producing countries is less pronounced than the
results reported using implied volatilities in Table 4. For instance, the pairwise conectedness of oil is
higher in Germany and Switzeland (16.1% and 15.3%) than in either the US (13.2%) or in Canada
(14.7%). The highest connection is with the UK where oil spills 17.2% on British equities. As
previously stated, the connectedness of Russia, a big oil producer, remains relatively low when
38
On using squared returns to measure volatility See Foster and Nelson (1996) and Triacca (2007).

ACC
EPTE
D M
ANU
SCR
IPT
ACCEPTED MANUSCRIPT
30
compared to either the rest of oil producing countries (UK,US and Canada) or to other countries
(Germany, Switzerland, Mexico).
The inference from realized volatilities is also less revealing in terms of the difference between
developed and developing equity market linkages. As mentioned previously, the analysis based on
implied volatility reveals a clear distinction between transmissions from oil to developed markets’
equities and to other equities where transmissions is found to be higher in developed markets (see
Table 3). However, when we change the latent volatility measure to squared returns, this distinction
disappears and oil risk transfer follows similar pattern across all developed and developing equity
markets.
INSERT TABLE 4
It is well known that squared returns is a noisy measure of volatility. Therefore, we use another
measure volatility by taking the fitted values of a GARCH model as a measure of the latent volatility.
In particular, we estimated an AR(1)-GARCH(1,1) model for each of the return series. This measure
is then used to analyze volatility spillovers.
Panel B of Table 4 reports the results that are based on GARCH volatilities. As can be seen in the
table, there isn’t much change in the results as compared to Panel A. The GARCH volatilities of oil
are still at the center of transmissions in the system. Oil has remained the net transmittor of shocks to
all equity markets. Similar to squared returns, the GARCH measure is less able to distinguish
between oil and non-oil producing countries. The measure is also less revealing in terms of
distinguishing between developed and developing countries and therefore, we may conclude that
implied volatilities provide more information of the nature of oil equity relationship.
Finally, Panels (a) and (b) in the Figure 4 presents the plots of net pairwise directional dynamic
connectedness of oil volatility with the volatility of each of the equity markets over the sample
period using the two alternative volatility measures. The figure shows that the connectedness is

ACC
EPTE
D M
ANU
SCR
IPT
ACCEPTED MANUSCRIPT
31
largely dominated by the information transmission from the crude oil market to other equity markets
and not the other way around. These findings are largely consistent with the previous results obtained
from implied volatility measure.39
INSERT FIGURE 3
To further investigate the association between oil and equities we also test for causality between
the oil implied volatility index and the other implied volatility indexes. The tests complements the
prevuious analysis in which no formal testing for the results is conducted. Moreover, the test checks
if the association between oil and equity volatilities can stand a change in the model from which
inference is taken.
6.2 Granger Causality tests
The analysis in the previous section stresses the importance of oil transmissions in the directional
connectedness between oil and implied volatilities. In this section we investigate risk transfer from
oil to equity using Granger causality tests.
The tests are employed to investigate lead (lag) transmission of volatility from oil to equities and
vice versa. A significant risk transfer from oil to equity volatility and an insignificant transmission in
the opposite direction confirms the previously observed patterns.
Table 5 reports the results of the tests for the log differences in the volatility indices. 40
The
appropriate number of lags in the analysis was chosen by using the Schwartz information criteria and
the Lutkepohl’s likelihood ratio test. Table 5 shows significant results that the lagged changes in oil
implied volatility is informative of the future changes in equity volatility in all markets. The causality
39
We also conduct the net pairwise directional dynamic connectedness of oil volatility with the volatility of each of the
equity markets over the sample period. The plots show a similar pattern to those shown in Figure 3. To conserve space,
the plots are not reported in the paper but they are available from the authors upon request. 40
We also conduct the Granger causality test using the levels of volatility indexes. Results are qualitatively similar and
therefore are not reported. They are available from the authors upon request.

ACC
EPTE
D M
ANU
SCR
IPT
ACCEPTED MANUSCRIPT
32
in the other direction is insignificant at conventional levels.41
This can be explained by the sensitivity
of equity implied volatility indices to macroeconomic fundamentals where oil is a factor to a certain
extent. The uncertainty changes in the oil market may have its implications on the expected
macroeconomic environment and capital market expectations and hence it can easily transmit to
equities. Thus, we may conclude that oil plays an important role in the directional connectedness
between oil and equity volatility in the sample of countries during the sample period.42
It is worth to mention here that the causality in volatility is sometimes not independent of the
corresponding return causalities. With the opening of markets, information starts flowing from one
market to another thus moving both returns and volatilities. These patterns can be seen clearly during
market stress. For instance, the recent plunge in oil prices to $27.62 in January 2016 has dragged
down the S&P500 index by 9%. This simultaneous drastic drop in oil and equity prices reflects as
well an association of volatility between the two markets.
INSERT TABLE 5
7. Conclusion
The previous studies have concentrated on the impact of oil price changes, on equity price
changes, and on using ARCH or realized volatilities to measure the latent volatility process.
Moreover, the causality between oil and equity volatility was largely derived from static models that
cover the whole sample period. Instead, in this paper, we exploit newly introduced implied volatility
indices and new directional connectedness measures to study risk transfer between the oil market and
a group of global equity markets. The inference in this paper is different in that it is based on a more
accurate measure of risk that reflects the consensus of the market on oil and equity volatilities.
Hence, in this study, we are interested in inferring from the relationships that are implied by the
41
The only exception is the US market where the change in equity volatility (the VIX) is also predictive of changes in oil
volatility. The VIX is a benchmark that is closely watched by all markets especially after the global crisis in 2008. 42
The results are robust to the choice of lags in the Granger causality tests. The results are for various lags are not
reported but available from the authors upon request.

ACC
EPTE
D M
ANU
SCR
IPT
ACCEPTED MANUSCRIPT
33
market prices of oil and equity options. Moreover, compared to previous studies, our methods are
more revealing. In particular, the directional connectedness measures are informative of the market
which is important to establish the linkages and see how these linkages are changing over time.
In particular, we studied the connectedness between the oil implied volatility and the implied
volatility of equities in eleven major equity markets around the global in the period that followed the
financial crisis in 2008. It is worth to mention that there are not many studies on the oil equity
relationship during this period.43
Our results indicate that the oil market is playing the dominant role
in the oil equity volatility relationship. The transmission mechanism of information is skewed in that
the information transmission from oil to equities is larger than the transmission in the opposite
direction. Moreover, the pattern of transmission is found to be time varying with large transmissions
in the period that extends from the mid of 2009 to the mid of 2012 or during the global recovery.
This implies that oil uncertainty matters more for equities at initial recovery stages and when growth
is fragile. It also implies that equity options cannot be priced in isolation of the uncertainty that is
perceived in the oil market particularly during periods of recovery.
It is worth to recognize here the limitation of the short length of the period under study due to the
data availability. However, there are clear advantages of using implied volatility over historical
volatility in analyzing risk transfer between oil and equities. For instance, we find that the analysis
based on implied volatility distinguishes more between risk transmission from oil to oil producing
countries as opposed to non-oil producing countries. It also differentiates the patterns of risk transfer
to developing countries versus developed countries. The extra information disappears when historical
volatility measures are used.
These results are important for investors who assume exposures in oil and equity derivatives such
as hedge funds. These investors assume non-linear exposures that are volatility sensitive and option
43
For instance, see Mollick and Assefa (2013), Awartani and Maghyereh (2013), and Tsai (2015).

ACC
EPTE
D M
ANU
SCR
IPT
ACCEPTED MANUSCRIPT
34
like. For instance, the strong linkages between oil and equity imply less diversification benefits of
including oil and equity options in a derivative portfolio, particularly when the underlying companies
operate in an oil producing country.
The evidence on the connectedness of implied volatilities of oil and equities constitutes useful
information for energy risk management, asset pricing and hedging practices. For instance, the oil
equity implied volatility connectedness implies that oil price uncertainty cannot be ignored as a
major factor in building a valuation model of equity options. Accounting for the connectedness may
also help in constructing more accurate models in forecasting both equity and oil volatility. These
results are also useful in managing portfolios that include energy and equity options in their asset
allocation. Finally, policy-makers should be aware of the fact that oil uncertainty is quite relevant
and should hence incorporate measures that increase equity markets resiliency to absorb oil shocks
and maintain efficiency.
References
Akgiray, V. (1989). Conditional heteroscedasticity in time series of stock returns: Evidence and
forecasts. Journal of business, 55-80.
Apergis, N., & Miller, S. M. (2009). Do structural oil-market shocks affect stock prices?. Energy
Economics, 31(4), 569-575.
Arouri, M. E. H., & Rault, C. (2012). Oil prices and stock markets in GCC countries: empirical
evidence from panel analysis. International Journal of Finance & Economics, 17(3), 242-253.
Arouri, M. E. H., Jouini, J., & Nguyen, D. K. (2011). Volatility spillovers between oil prices and
stock sector returns: implications for portfolio management. Journal of International money and
finance, 30(7), 1387-1405.
Arouri, M. E. H., & Rault, C. (2010). Oil prices and stock markets: What drives what in the gulf
corporation council countries?.
Asteriou, D., & Bashmakova, Y. (2013). Assessing the impact of oil returns on emerging stock
markets: A panel data approach for ten Central and Eastern European Countries. Energy Economics,
38, 204-211.

ACC
EPTE
D M
ANU
SCR
IPT
ACCEPTED MANUSCRIPT
35
Antonakakis, N. (2012). Exchange return co-movements and volatility spillovers before and after the
introduction of euro. Journal of International Financial Markets, Institutions and Money, 22(5),
1091-1109.
Awartani, B., & Maghyereh, A. I. (2013). Dynamic spillovers between oil and stock markets in the
Gulf Cooperation Council Countries. Energy Economics, 36, 28-42.
Awartani, B., Maghyereh, A. I., & Al Shiab, M. (2013). Directional spillovers from the US and the
Saudi market to equities in the Gulf Cooperation Council countries. Journal of International
Financial Markets, Institutions and Money, 27, 224-242.
Bachmeier, L. (2008). Monetary policy and the transmission of oil shocks. Journal of
Macroeconomics, 30(4), 1738-1755.
Blair, B. J., Poon, S. H., & Taylor, S. J. (2001). Modelling S&P 100 volatility: The information
content of stock returns. Journal of banking & finance, 25(9), 1665-1679.
Boyer, M.M., & Fillion, D. (2007). Common and fundamental factors in stock returns of Canadian
oil and gas companies. Energy Economics 29, 428-453.
Bouri, E. (2015a). Oil volatility shocks and the stock markets of oil-importing MENA economies: a
tale from the financial crisis. Energy Economics, 51, 590-598.
Bouri, E. (2015b). Return and volatility linkages between oil prices and the lebanese stock market in
crisis periods. Energy, 89, 365-371.
Bouri, E., & Demirer, R. (2016). On the volatility transmission between global oil and stock markets:
A comparison of emerging importers and exporters. Economia Politica, 1-20.
http://link.springer.com/article/10.1007/s40888-016-0022-6.
Brailsford, T. J., & Faff, R. W. (1996). An evaluation of volatility forecasting techniques. Journal of
Banking & Finance, 20(3), 419-438.
Broner, F. A., Gelos, R. G., & Reinhart, C. M. (2006). When in peril, retrench: Testing the portfolio
channel of contagion. Journal of International Economics, 69(1), 203-230.
Büyükşahin, B., & Robe, M. A. (2014). Speculators, commodities and cross-market linkages.
Journal of International Money and Finance, 42, 38-70.
Chen, S. S. (2010). Do higher oil prices push the stock market into bear territory? Energy
Economics, 32(2), 490-495.
Christensen, B. J., & Prabhala, N. R. (1998). The relation between implied and realized volatility.
Journal of Financial Economics, 50(2), 125-150.
Cong, R. G., Wei, Y. M., Jiao, J. L., & Fan, Y. (2008). Relationships between oil price shocks and
stock market: An empirical analysis from China. Energy Policy, 36(9), 3544-3553.

ACC
EPTE
D M
ANU
SCR
IPT
ACCEPTED MANUSCRIPT
36
Danielsson, J., Song Shin, H., & Zigrand, J. P. (2011). Balance sheet capacity and endogenous risk,
working paper, London School pf Economics and Princeton University.
Diebold, F. X., & Yilmaz, K. (2012). Better to give than to receive: Predictive directional
measurement of volatility spillovers. International Journal of Forecasting, 28(1), 57-66.
Diebold, F. X., & Yilmaz, K. (2009). Measuring financial asset return and volatility spillovers, with
application to global equity markets. The Economic Journal, 119(534), 158-171.
Diebold, F. X., & Yılmaz, K. (2014). On the network topology of variance decompositions:
Measuring the connectedness of financial firms. Journal of Econometrics, 182(1), 119-134.
Diebold, F. X., & Yilmaz, K. (2015). Financial and Macroeconomic Connectedness: A Network
Approach to Measurement and Monitoring. Oxford University Press.
Driesprong, G., Jacobsen, B., & Maat, B. (2008). Striking oil: Another puzzle?. Journal of Financial
Economics, 89(2), 307-327.
El-Sharif, I., Brown, D., Burton, B., Nixon, B., & Russell, A. (2005). Evidence on the nature and
extent of the relationship between oil prices and equity values in the UK. Energy Economics, 27(6),
819-830.
Engle, R. (2002). Dynamic conditional correlation: A simple class of multivariate generalized
autoregressive conditional heteroskedasticity models. Journal of Business & Economic Statistics,
20(3), 339-350.
Faff, R., & Brailsford, T. (1999). Oil price risk and the Australian stock market. Journal of Energy
Finance & Development, 4, 69-87.
Figlewski, S. (1997). Forecasting volatility. Financial markets, institutions & instruments, 6(1), 1-
88.
Filis, G., Degiannakis, S., & Floros, C., 2011. Dynamic correlation between stock market and oil
prices: The case of oil importing and oil exporting countries. International Review of Financial
Analysis, 20, 152-164.
Fleming, J. (1998). The quality of market volatility forecasts implied by S&P 100 index option
prices. Journal of Empirical Finance , 5, 317-345.
Foster, D. P., & Nelson, D. B., (1996). Continuous record asymptotics for rolling sample variance
estimators. Econometrica, 64(1), 139-174.
Franses, P. H., & Van Dijk, D. (1996). Forecasting stock market volatility using (nonlinear) GARCH
models. Journal of Forecasting, 229-235.
Hamilton, J. D. (1983). Oil and the macroeconomy since World War II. The Journal of Political
Economy, 228-248.

ACC
EPTE
D M
ANU
SCR
IPT
ACCEPTED MANUSCRIPT
37
Hamilton, J. D. (2009). Causes and Consequences of the Oil Shock of 2007-08 (No. w15002).
National Bureau of Economic Research.
Hammoudeh, S., & Aleisa, E. (2004). Dynamic relationships among GCC stock markets and
NYMEX oil futures. Contemporary Economic Policy, 22(2), 250-269.
Huang, R. D., Masulis, R. W., & Stoll, H. R. (1996). Energy shocks and financial markets. Journal
of Futures Markets, 16(1), 1-27.
Jammazi, R. (2012). Oil shock transmission to stock market returns: Wavelet-multivariate Markov
switching GARCH approach. Energy, 37(1), 430-454.
Jin, X., Lin, S. X., & Tamvakis, M. (2012). Volatility transmission and volatility impulse response
functions in crude oil markets. Energy Economics, 34(6), 2125-2134.
Jones, C. M., & Kaul, G. (1996). Oil and the stock markets. The Journal of Finance, 51(2), 463-491.
Jorion, P. (1995). Predicting volatility in the foreign exchange market. The Journal of Finance, 50(2),
507-528.
Kilian, L. (2008). Exogenous oil supply shocks: how big are they and how much do they matter for
the US economy?. The Review of Economics and Statistics, 90(2), 216-240.
Kilian, L., & Park, C. (2009). The impact of oil price shocks on the US stock market. International
Economic Review, 50(4), 1267-1287.
Kling, J.I. (1985). Oil price shocks and stock market behaviour. Journal of Portfolio Management,
12 (1), 34-39.
Klößner, S., & Wagner, S. (2014). Exploring all VAR orderings for calculating spillovers? yes, we
can!—a note on Diebold and Yilmaz (2009). Journal of Applied Econometrics, 29(1), 172-179.
Kodres, L. E., & Pritsker, M. (2002). A rational expectations model of financial contagion. The
journal of finance, 57(2), 769-799.
Koop, G., Pesaran, M.H., & Potter, S.M. (1996). Impulse response analysis in nonlinear multivariate
models. Journal of Econometrics, 74, 119-147.
Kyle, A. S., & Xiong, W. (2001). Contagion as a wealth effect. The Journal of Finance, 56(4), 1401-
1440.
McMillan, D. G., & Speight, A. E. (2010). Return and volatility Spillovers in Three Euro Exchange
Rates. Journal of Economics and Business, 62 (2), 79-93.
Maghyereh, A. (2004). Oil Price Shocks and Emerging Stock Markets: A Generalized VAR
Approach. International Journal of Applied Econometrics & Quantitative Studies, 1(2), 27-40.

ACC
EPTE
D M
ANU
SCR
IPT
ACCEPTED MANUSCRIPT
38
Maghyereh, A., & Al-Kandari, A. (2007). Oil Prices and Stock Markets in GCC Countries: New
Evidence from Nonlinear Cointegration Analysis. Managerial Finance, 33 (7), 449-460.
Maghyereh, A. & Awartani, B. (2015). Oil price uncertainty and equity returns: Evidence from oil
importing and exporting countries in the MENA region. Journal of Financial Economic Policy.
forthcoming
Maghyereh, A., Awartani, B., & Al Hilu, K. (2015). Dynamic transmissions between the US and
equity markets in the MENA countries: New evidence from pre-and post-global financial crisis. The
Quarterly Review of Economics & Finance, 56, 123-138.
Malik, F., & Ewing, B. T. (2009). Volatility transmission between oil prices and equity sector
returns. International Review of Financial Analysis, 18(3), 95-100.
Malik, F., & Hammoudeh, S. (2007). Shock and volatility transmission in the oil, US and Gulf equity
markets. International Review of Economics & Finance, 16(3), 357-368.
Masih, R., Peters, S., & De Mello, L. (2011). Oil price volatility and stock price fluctuations in an
emerging market: evidence from South Korea. Energy Economics, 33(5), 975-986.
Miller, J. I., & Ratti, R. A. (2009). Crude oil and stock markets: Stability, instability, and bubbles.
Energy Economics, 31(4), 559-568.
Mohanty, S., Nandha, M., & Bota, G. (2010). Oil shocks and stock returns: The case of the Central
and Eastern European (CEE) oil and gas sectors. Emerging Markets Review, 11(4), 358-372.
Mollick, A. V., & Assefa, T. A. (2013). US stock returns and oil prices: The tale from daily data and
the 2008–2009 financial crisis. Energy Economics, 36, 1-18.
Nandha, M., & Brooks, R. (2009). Oil price and transport sector returns: an international analysis.
Review of Quantitative Finance & Accounting, 33, 393-409.
Nandha, M., & Faff, R. (2008). Does oil move equity prices? A global view. Energy Economics,
30(3), 986-997.
Nandha, M., & Hammoudeh, S. (2007). Systematic risk, and oil price and exchange rate sensitivities
in Asia-Pacific stock markets. Research in International Business & Finance, 21(2), 326-341.
Narayan, P.K., & Narayan, S., (2010). Modelling the impact of oil prices on Vietnam’s stock prices.
Applied Energy, 87, 356-361.
Papapetrou, E. (2001). Oil price shocks, stock market, economic activity and employment in Greece.
Energy Economics, 23(5), 511-532.
Park, J., & Ratti, R. A. (2008). Oil price shocks and stock markets in the US and 13 European
countries. Energy Economics, 30(5), 2587-2608.

ACC
EPTE
D M
ANU
SCR
IPT
ACCEPTED MANUSCRIPT
39
Pavlova, A., & Rigobon, R. (2008). The role of portfolio constraints in the international propagation
of shocks. The Review of Economic Studies, 75(4), 1215-1256.
Pesaran, M.H. & Shin, Y. (1998). Generalized impulse response analysis in linear multivariate
models. Economics Letters, 58, 17-29.
Blair, B. J., Poon, S. H., & Taylor, S. J. (2010). Forecasting S&P 100 volatility: the incremental information content of
implied volatilities and high-frequency index returns. In Handbook of Quantitative Finance and Risk Management (pp.
1333-1344). Springer US.
Sadorsky, P. (1999). Oil price shocks and stock market activity. Energy Economics, 21(5), 449-469.
Sadorsky, P. (2006). Modeling and forecasting petroleum futures volatility. Energy Economics,
28(4), 467-488.
Sari, R., Hammoudeh, S., & Soytas, U. (2010). Dynamics of oil price, precious metal prices, and
exchange rate. Energy Economics, 32(2), 351-362.
Triacca, U. (2007). On the variance of the error associated to the squared return as proxy for
volatility. Applied Financial Economics Letters, 3, 255–27.
Tsai, C. L. (2015). How do US stock returns respond differently to oil price shocks pre-crisis, within
the financial crisis, and post-crisis?. Energy Economics, 50, 47-62.
Wang, Y., Wu, C., & Yang, L. (2013). Oil price shocks and stock market activities: Evidence from
oil-importing and oil-exporting countries. Journal of Comparative Economics, 41(4), 1220-1239.
Whaley, R. E. (2008). Understanding vix. Available at SSRN 1296743.

ACC
EPTE
D M
ANU
SCR
IPT
ACCEPTED MANUSCRIPT
40
Table 1: Descriptive statistics of the implied volatility indices
Mean Std. Dev. Min Max Skewness Kurtosis Jarque-Bera Q ( 20) ADF Constant ADF Intercept and trend
Panel A: Levels
Crude oil 37.011 15.401 14.500 100.420 1.334 2.228 953.030*** 33901.900*** -2.592 -3.111
USA 23.310 11.047 5.770 81.220 1.932 4.406 2708.800*** 31454.800*** -3.258** -4.107**
Canada 24.261 9.201 11.819 78.050 1.908 5.051 3160.900*** 28392.200*** -4.122*** -4.917***
UK 20.936 9.538 9.672 75.540 2.108 5.943 4187.100*** 29700.700*** -3.686*** -4.771***
India 24.636 10.331 11.560 85.130 1.549 2.898 1419.500*** 30991.100*** -3.181** -4.384**
Mexico 22.744 10.389 10.140 68.120 1.958 4.286 2658.900*** 34193.000*** -2.199 -2.659
Japan 27.500 11.036 14.000 91.450 2.615 8.389 7707.900*** 28416.000*** -4.060*** -4.614***
Sweden 21.936 10.280 9.300 77.920 1.766 3.933 2204.200*** 31653.000*** -3.258** -4.333**
Russia 40.052 24.668 15.420 200.495 3.121 12.520 15436.000*** 29892.700*** -3.124** -3.412*
South Africa 23.262 7.625 0.000 57.970 1.565 3.209 1584.300*** 34064.000*** -2.150 -3.113
Germany 24.383 9.872 12.170 83.230 2.124 5.869 4140.200*** 29841.500*** -3.939*** -4.519***
Switzerland 20.900 10.848 8.756 88.032 2.704 9.299 9126.800*** 25366.500*** -5.837*** -6.945***
Panel B: Log volatility changes
Crude oil 0.00001 0.049 -0.440 0.425 0.88829 12.559 11932.000*** 90.992*** -26.929*** -26.930***
USA -0.00021 0.071 -1.046 1.062 0.40806 51.805 199090.000*** 79.897*** -27.740*** -27.733***
Canada -0.00012 0.067 -0.372 0.487 0.42034 3.315 867.490*** 63.328*** -27.432*** -27.425***
UK -0.00040 0.069 -0.365 0.372 0.31089 2.590 526.190*** 37.654* -26.814*** -26.807***
India -0.00038 0.061 -0.470 0.457 0.089124 9.876 7236.200*** 79.206*** -26.966*** -26.959***
Mexico -0.00038 0.050 -0.452 0.492 0.41875 5.176 2038.900*** 29.593*** -26.594*** -26.595***
Japan -0.00041 0.059 -0.327 0.541 1.7984 13.239 13959.000*** 49.537*** -26.640*** -26.635***
Sweden -0.00024 0.071 -0.333 0.358 0.35962 2.503 502.970*** 86.427*** -28.731*** -28.723***
Russia 0.00012 0.071 -0.299 0.912 1.794 18.499 26335.000*** 78.386*** -26.472*** -26.466***
South Africa -0.00021 0.031 -0.346 0.393 0.77326 26.164 50949.000*** 40.708*** -27.049*** -27.042***
Germany -0.00011 0.056 -0.256 0.306 0.69931 2.838 742.600*** 54.874*** -26.762*** -26.756***
Switzerland -0.00032 0.099 -0.822 0.457 -0.9604 9.836 7448.300*** 137.748*** -27.024*** -27.017***
Notes: This table reports summary statistics of the implied volatility indices. The number of daily observations is equal to 1893 from 3rd of March, 2008 to 3rd of February, 2015. Panel
A reports statistics for the levels, while Panel B reports results for log differences. ADF is the t‐statistics for the Augmented Dickey‐Fuller test. ***, ** and * denote significance at the
1%, 5%, and 10% levels, respectively.
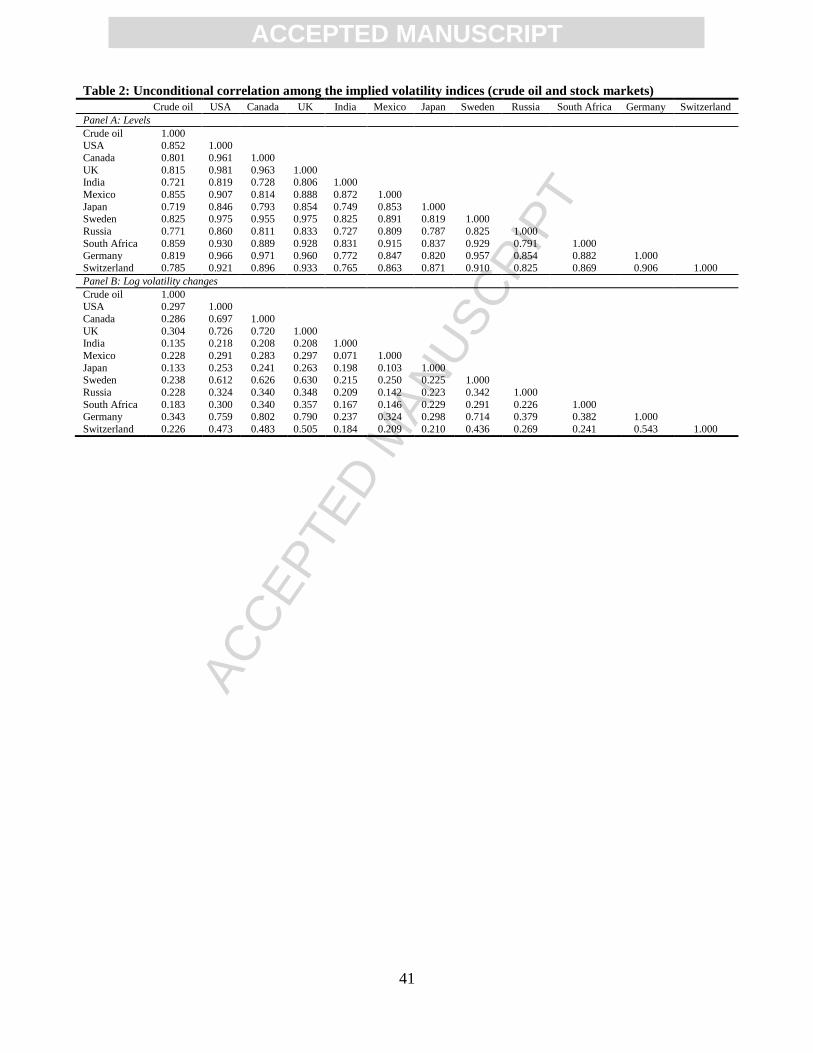
ACC
EPTE
D M
ANU
SCR
IPT
ACCEPTED MANUSCRIPT
41
Table 2: Unconditional correlation among the implied volatility indices (crude oil and stock markets)
Crude oil USA Canada UK India Mexico Japan Sweden Russia South Africa Germany Switzerland
Panel A: Levels
Crude oil 1.000 USA 0.852 1.000
Canada 0.801 0.961 1.000
UK 0.815 0.981 0.963 1.000 India 0.721 0.819 0.728 0.806 1.000
Mexico 0.855 0.907 0.814 0.888 0.872 1.000
Japan 0.719 0.846 0.793 0.854 0.749 0.853 1.000 Sweden 0.825 0.975 0.955 0.975 0.825 0.891 0.819 1.000
Russia 0.771 0.860 0.811 0.833 0.727 0.809 0.787 0.825 1.000
South Africa 0.859 0.930 0.889 0.928 0.831 0.915 0.837 0.929 0.791 1.000 Germany 0.819 0.966 0.971 0.960 0.772 0.847 0.820 0.957 0.854 0.882 1.000
Switzerland 0.785 0.921 0.896 0.933 0.765 0.863 0.871 0.910 0.825 0.869 0.906 1.000
Panel B: Log volatility changes
Crude oil 1.000 USA 0.297 1.000
Canada 0.286 0.697 1.000
UK 0.304 0.726 0.720 1.000 India 0.135 0.218 0.208 0.208 1.000
Mexico 0.228 0.291 0.283 0.297 0.071 1.000
Japan 0.133 0.253 0.241 0.263 0.198 0.103 1.000 Sweden 0.238 0.612 0.626 0.630 0.215 0.250 0.225 1.000
Russia 0.228 0.324 0.340 0.348 0.209 0.142 0.223 0.342 1.000
South Africa 0.183 0.300 0.340 0.357 0.167 0.146 0.229 0.291 0.226 1.000 Germany 0.343 0.759 0.802 0.790 0.237 0.324 0.298 0.714 0.379 0.382 1.000
Switzerland 0.226 0.473 0.483 0.505 0.184 0.209 0.210 0.436 0.269 0.241 0.543 1.000

ACC
EPTE
D M
ANU
SCR
IPT
ACCEPTED MANUSCRIPT
42
Table 3: Full Sample Directional of implied volatility connectedness
From market
To market Crude oil USA Canada UK India Mexico Japan Sweden Russia South Africa Germany Switzerland Connectedness from others
Crude oil 94.4 0.2 0.0 0.2 0.3 1.9 0.2 0.1 1.4 0.7 0.6 0.0 6
USA 18.4 71.7 0.1 2.0 0.0 3.4 0.3 1.4 1.3 0.1 0.8 0.5 28 Canada 26.9 55.3 18.0 3.8 0.3 1.7 0.4 1.6 0.6 0.4 0.4 0.6 92
UK 19.5 57.1 2.1 17.3 0.0 3.1 0.1 2.5 0.8 0.2 1.3 0.1 87
India 3.9 8.2 0.1 0.5 82.3 3.5 0.1 0.6 0.2 0.2 0.1 0.1 18 Mexico 11.3 13.5 1.1 2.4 0.5 66.6 0.3 0.6 1.9 0.1 1.6 0.2 33
Japan 0.9 27.1 0.3 4.5 0.1 3.8 54.0 0.1 0.7 0.3 0.2 0.2 46
Sweden 14.4 47.6 1.8 5.7 0.3 4.1 0.5 23.2 0.6 0.4 0.5 0.7 77
Russia 8.0 22.5 0.3 1.8 0.4 0.8 0.1 1.3 64.5 0.0 0.3 0.0 35 South Africa 11.6 23.3 1.1 7.4 0.5 3.1 0.2 0.8 0.5 50.5 1.2 0.0 50
Germany 18.1 53.0 5.6 4.4 0.0 3.1 0.3 3.5 1.2 0.0 10.0 0.8 90
Switzerland 12.4 36.9 2.2 8.2 0.1 2.5 2.1 3.1 2.0 0.1 1.8 28.7 71 Connectedness to others 139 345 15 41 3 31 5 16 11 3.0 9.0 3.0 619 Connectedness including own 248 416 33 58 85 98 59 39 76 53 19 32 Total Connectedness=51.60%
Notes: The underlying variance decomposition is based on a daily VAR system with two lags. The value is the estimated contribution to the variance of the 10 step ahead implied volatility forecast error
of market coming from innovations to implied volatility of market . The decomposition is generalized, and thus it is robust to the ordering shown in the column heading. The last column (labeled ‘Connectedness from others’) is equal to the row sum excluding the diagonal elements, and gives the total directional spillovers from all others to markets. The row at the bottom (labeled ‘Connectedness to
others’) is equal to the column sum excluding the diagonal elements, and reports the total directional spillover from market to others. Finally, the lower right corner is expressed in percentage points and reports the total connectedness which equals to the grand off-diagonal column sum relative to the grand column sum including diagonals.

ACC
EPTE
D M
ANU
SCR
IPT
ACCEPTED MANUSCRIPT
43
Table 4: Directional connectedness using alternative volatility measures
From market
To market Crude oil USA Canada UK India Mexico Japan Sweden Russia South Africa Germany Switzerland Connectedness from others
Panel A: Realized volatility
Crude oil 86.6 2.5 3.5 1.3 0.8 1.7 0.8 1 0.4 0.4 0.4 0.6 13
USA 13.2 69.8 12 0.7 2.7 1.5 2.3 1.2 1.1 2.8 0.2 2.6 40
Canada 14.7 31.9 50.2 0.7 4 2.3 1.4 0.5 1 1.7 0.8 0.7 60
UK 17.2 21.4 20.7 38.7 2.7 2.1 1.7 0.8 0.1 1.1 2.4 1.3 72
India 12.1 2.5 3 4 84.2 2 0.5 0.2 0.2 0.3 0.8 0.1 26
Mexico 13.7 31 14.7 10.3 2.8 27.5 1.1 1.5 3.7 1.7 0.5 1.5 83
Japan 2.7 12.2 10 4.5 2.2 1.3 57.9 2.9 0.2 0.9 3.4 1.8 42
Sweden 8.5 18 14.1 23.2 2.1 1.3 0.9 29.1 0 0.9 0.5 1.3 71
Russia 9.1 10.3 13.1 12.4 2.7 3.9 0.4 1.7 49.4 1.3 1.8 1 58
South Africa 10 13.5 18.5 12.6 2.5 1.7 4.7 2.3 3 35.4 0.9 1 71
Germany 16.1 25.6 10.1 19.9 2.7 2.7 1.9 6.9 1.4 1.5 19.4 1.8 91
Switzerland 15.3 21.4 14 24.3 2.5 2 1.9 3.1 0.5 0.9 4.9 19.3 91
Connectedness to others 139 190 134 114 28 23 18 22 12 14 16 14 716
Connectedness incl.own 248 416 33 58 85 98 59 39 76 53 19 32 Total Connectedness=54.88%
Panel B: Conditional volatility
Crude oil 86.9 2.3 4.4 3.5 0 0.1 0.3 0.2 0.2 0.5 0.2 1.5 13
USA 12 79.8 4.2 3.9 0.7 0.1 0.7 0.3 5.9 1.9 0.2 0.6 31
Canada 12.3 47 41.5 0.7 1.7 1.2 0.1 0.2 2.7 1.2 0.8 0.5 68
UK 19.6 44.1 7 31 0.7 1 0.3 0.5 3.4 0.4 1.4 0.5 79
India 10.4 0.8 0 4.9 86.2 5.6 0.1 0.1 0.1 0 1.7 0.2 24
Mexico 14 33.8 3.1 17.4 0.8 30.7 0.1 0.4 7.2 0.9 0.6 0.8 79
Japan 15.7 9.1 1 8.5 0.1 4.6 64.8 3.6 0.7 1.1 0.2 0.7 45
Sweden 10.1 32.6 7.1 20.3 0.6 0 0.2 26.1 0.2 2 0.7 0.1 74
Russia 8.2 12.4 2.9 13.7 1.2 1.8 0 0.4 61.2 0.1 0.1 2.1 43
South Africa 8.2 35.4 6.5 17.3 1.9 3.5 1.4 0.7 5.8 17.3 0.5 1.4 83
Germany 16.9 34.3 2.5 19.5 1 2.2 1 6.7 1.4 1.6 21.6 1.3 88
Switzerland 15.3 36.3 4.6 22.6 0.4 2.6 1.3 0.7 3.3 0.2 6.1 16.7 93
Connectedness to others 143 288 43 132 9 23 5 14 31 10 12 10 721
Connectedness incl.own 230 368 85 163 95 53 70 62 92 27 34 26 Total Connectedness=55.16%
Notes: Realized volatility is measured as square returns . The conditional volatility is estimated by the AR(1)- GARCH (1,1) model. The underlying variance decomposition is based on a daily VAR system with two lags. The value
is the estimated contribution to the variance of the 10 step ahead volatility forecast error of market coming from innovations to implied volatility of market . The decomposition is generalized, and thus it is robust to the ordering shown
in the column heading. The last column (labeled ‘Contribution from others’) is equal to the row sum excluding the diagonal elements, and gives the total directional spillovers from all others to markets. The row at the bottom is (labeled
‘Contributions to others’) equal to the column sum excluding the diagonal elements, and reports the total directional spillover from market to others. Finally, The lower right corner is expressed in percentage points and reports the total
volatility spillover index which equal to the grand off-diagonal column sum relative to the grand column sum including diagonals.

ACC
EPTE
D M
ANU
SCR
IPT
ACCEPTED MANUSCRIPT
44
Table 5: Granger causality test for implied volatility indices Null Hypothesis F-statistic
Causality decision
US does not Granger Cause Crude oil 3.0546*** (0.0095) Crude oil ↔ USA
Crude oil does not Granger Cause USA 10.885*** (0.0000)
Canada does not Granger Cause Crude oil 1.6590 (0.1413) Crude oil → Canada
Crude oil does not Granger Cause Canada 7.7465*** (0.0000)
UK does not Granger Cause Crude oil 2.0640* (0.0672) Crude oil → UK
Crude oil does not Granger Cause UK 9.2530*** (0.0000)
India does not Granger Cause Crude oil 0.8368 (0.5235) Crude oil → Canada
Crude oil does not Granger Cause India 8.0711*** (0.0000)
Mexico does not Granger Cause Crude oil 0.8299 (0.5002) Crude oil → Mexico
Crude oil does not Granger Cause Mexico 3.9265*** (0.0015)
Japan does not Granger Cause Crude oil 2.0637* (0.0672) Crude oil → Japan
Crude oil does not Granger Cause Japan 16.7325*** (0.0000)
Sweden does not Granger Cause Crude oil 1.3674 (0.1050) Crude oil → Sweden
Crude oil does not Granger Cause Sweden 11.8314*** (0.0000)
Russia does not Granger Cause Crude oil 1.0738 (0.3729) Crude oil → Russia
Crude oil does not Granger Cause Russia 3.6853*** (0.0025)
South Africa does not Granger Cause Crude oil 0.5179 (0.7630) Crude oil → South Africa
Crude oil does not Granger Cause South Africa 8.2805*** (0.0000)
Germany does not Granger Cause Crude oil 1.3133 (0.1055) Crude oil → Germany
Crude oil does not Granger Cause Germany 6.0684*** (0.0000)
Switzerland does not Granger Cause Crude oil 1.4447 (0.2051) Crude oil → Switzerland
Crude oil does not Granger Cause Switzerland 7.8412*** (0.0000)
Notes: The table reports the results of the Granger causality tests for the log differences of the indices. Akaike's (AIC), Schwartz's
(SIC) information criteria, and Lutkepohl's modified likelihood ratio (LR) test are used to determine the appropriate number of lags for
the VAR( p) system. ↔, →, indicate bidirectional and unidirectional causality, respectively. Parentheses indicate the probability
level.***, ** and * denote significance at the 1%, 5%, and 10% levels, respectively.

ACC
EPTE
D M
ANU
SCR
IPT
ACCEPTED MANUSCRIPT
45
Figure 1: Time series plot of the implied volatility indices
Notes: This figure shows the time series plot of the implied volatility indices of crude oil and stock markets over the sample period from 3
rd of March
2008 to 3rd February 2015.

ACC
EPTE
D M
ANU
SCR
IPT
ACCEPTED MANUSCRIPT
46
Figure 2: Directional implied volatility connectedness
Notes: This figure shows the directional volatility connectedness from oil to all markets over the sample period of 3rd of March, 2008
to 3rd of February, 2015 estimated with a rolling window of 200-day. The predictive horizon of the underlying variance decomposition
is 10-days ahead.

ACC
EPTE
D M
ANU
SCR
IPT
ACCEPTED MANUSCRIPT
47
Figure 3: Pairwise directional net implied volatility connectedness
Notes: This figure shows the net pairwise directional connectedness from oil to each market over the sample period of 3rd of March, 2008 to 3rd of February, 2015 estimated with a
rolling window of 200- day. The predictive horizon of the underlying variance decomposition is 10-day ahead. Positive (negative) values indicate that oil is a net transmitter (receiver)
of shocks to the respective market.

ACC
EPTE
D M
ANU
SCR
IPT
ACCEPTED MANUSCRIPT
48
Figure 4: Directional connectedness using alternative volatility measures
Panel A: Realized volatility
Panel B: Conditional volatility
Notes: This figure shows the directional volatility connectedness from oil to all markets using two alternative volatility measures (realized and conditional volatility) over the sample period of 3rd of March, 2008 to 3rd of February, 2015 estimated with a rolling window of 200-day. The
predictive horizon of the underlying variance decomposition is 10-days ahead.

ACC
EPTE
D M
ANU
SCR
IPT
ACCEPTED MANUSCRIPT
49
HIGHLIGHTS
Investigate the directional connectedness between oil and equities in eleven major stock
exchanges around the globe from 2008 to 2015.
The article exploits a new spillover directional measure proposed by Diebold and Yilmaz (2014,
2015) to investigate the oil-equity implied volatility relationships.
The connectedness between oil and equity is established by the bi-directional information
spillovers between the two markets.
The bulk of association is largely dominated by the transmissions from the oil market to equity
markets and not the other way around.
The pattern over the sample period is weak connectedness at the beginning of the sample or over
the period from the first quarter of 2008 to the mid of 2009 and then connectedness increases
from the mid of 2009 to the mid of 2012 with the oil market playing the dominant role.