Embed Size (px)
Citation preview
West Auckland Integrated Care Project
Locality and Cluster Level Analysis October 2012 Sam Martin, Analyst Lifeng Zhou, Senior Epidemiologist Planning and Funding Team, Waitemata District Health Board

i
Disclaimer The information in this report can be freely used and distributed provided the source is acknowledged. Every effort has been made to ensure that the information in this report is correct. Waitemata DHB and the authors will not accept any responsibility for information which is incorrect or where action has been taken as a result of the information in this report. Published in October 2012 by Waitemata District Health Board, Private Bag 93503, Takapuna, Auckland 0740, New Zealand. ISBN 978-0-473-22568-1 (paperback) ISBN 978-0-473-22569-8 (PDF) Suggested Citation: Martin, S and Zhou L, West Auckland Integrated Care Project: Locality and Cluster Level Analysis. Auckland: Waitemata District Health Board, 2012.
ii
Foreword A locality is defined as a geographic area that encompasses all people usually resident in the area. A locality approach aims to place local communities at the heart of health service planning and delivery, and better co-ordinate and integrate health services at the locality level. This report was commissioned as a contribution to the on-going locality planning work underway in West Auckland. The West Auckland locality consists of a diverse population in terms of ethnicity, age, deprivation, and health need. In 2011 about 242,000 people lived in the West Auckland locality and the population is growing rapidly. This locality and cluster profile makes a valuable contribution to an understanding of the particular health needs in and within West Auckland, and will be of use in informing health planning at the locality and the cluster level. Three clusters of practices have been presented in this profile to provide an insight into the differences within the West Auckland locality itself. The New Lynn cluster is the largest of the clusters and has the highest proportion of older people. The Massey cluster is the smallest with the highest proportion of children. The Henderson cluster has the largest proportion of Maori/Pacific population and across a number of measures is shown to have the highest health need of the three clusters. The information provided in this profile serves to reinforce the focus on planning around child health, diabetes, and urgent care for the West Auckland locality. The methods established will certainly benefit future locality planning work. Many thanks to Sam Martin and Dr Lifeng Zhou for bringing this report to completion and the resource that it provides in the on-going locality planning work in West Auckland. Dr. Debbie Holdsworth Chief Planning and Funding Officer Waitemata District Health Board

iii
Executive Summary Introduction This executive summary briefly describes the aims, methods, and content of this West Auckland locality and cluster analysis. It also includes a brief summary of the demography and health status of the West Auckland locality population and the populations of the three clusters within West Auckland; Henderson, Massey, and New Lynn.
Aims The purpose of this locality and cluster analysis is to describe the health needs and population characteristics of the West Auckland locality and practice clusters. The report attempts to describe the health needs of these groups through looking at different aspects of the population groups of interest including demographics, social and economic factors, health status, disease and risk factor prevalence/incidence and utilisation of health services.
Methods This report was written using routinely collected data and results from published national surveys and statistical reports. Most information was of a quantitative nature. Some detail is provided below outlining particular methods used in the analysis of the data: Age Standardisation: Many rates presented below are age-standardised. The rates are age-standardised using the WHO standard population. By taking age-specific rates for each population and applying these to the same standard hypothetical population by age group a valid comparison between each population can be made which accounts for the difference in the populations’ respective age structures. Data Matching: For the cluster analysis the population of each cluster is determined by the aggregated enrolled populations of the general practices associated with each cluster. To determine each cluster’s access of secondary services, PHO Enrolment data has then been linked with secondary services data by encrypted NHI. While practice registers will change over time, for the purposes of this analysis the cluster populations were determined by a snapshot of the enrolled population as at 2012 Quarter 1.
Summary of Findings: Locality Level Summary West Auckland includes Waitakere and Whau wards, and is made up of three local boards: Henderson & Massey, Waitakere Ranges and Whau. Whau is shared between Auckland District Health Board (DHB) and Waitemata DHB which accounts for 45% of the Whau population. The estimated population of West Auckland as at 30 June 2011 was 241,780, which was approximately 16% of the population in Auckland. According to Census 2006, West Auckland had a slightly younger population than Waitemata DHB as a whole, though they had similar age structures otherwise. West

iv
Auckland was also diverse in ethnicity with higher proportions of Maori, Pacific and Asians (‘Other’: 57% in West Auckland and 71% in Waitemata DHB). More people lived in deprived areas in West Auckland than the DHB as a whole. West Auckland has historically grown and is projected to grow at a faster rate than the total DHB (37% vs. 32% over 20 years). This population is also ageing, with the 65+ population to increase from 9% of the total to 14% (cf. WDHB, 11% to 17%) from 2006 to 2026. Regarding the health determinants, there is no data available at locality level except for smoking; therefore WDHB data has been used as a proxy. 19% of West Auckland adults (15+ years) smoked, according to Census 2006. Approximately 8% of the Waitemata DHB adult population took medication for high cholesterol in NZHS 06/07, while the rate was 14% for treating high blood pressure in this population. 6% of children and 21% of adults in Waitemata DHB were obese in the 2006/07 survey. 16% of Waitemata DHB adult population had hazardous drinking in the survey. Only 56% of Waitemata DHB adults had an adequate vegetable intake and 47% of the adults had regular physical activities. Based on three years mortality data (2007-2009), the life expectancy at birth for West Auckland was 81 years, lower than 83 years for the DHB. There was also variation in life expectancy between ethnicities, with Maori/Pacific having the lowest figures (76 years for Maori and 77 years for Pacific). West Auckland had a higher PAM of 112 per 100,000 than Waitemata DHB (92 per 100,000). Coronary disease/cerebrovascular disease, suicide and diabetes were the top three conditions for adults. 4% and 5% of Waitemata DHB adults had diagnosed diabetes and diagnosed ischaemic heart disease in the 2006/07 survey. Close to 10% of the Waitemata DHB adult population took medications for asthma in the NZ Health Survey. 97% of the Waitemata children and 93% of the DHB’s adults had a primary health care provider in the national health survey. About 94% of the Waitemata DHB population was enrolled with a primary health organisation (PHO) as of Quarter 1, 2012, while Asian had the lowest PHO enrolment rate (75%), with combined Maori/Pacific rate being 85%. West Auckland had a higher pharmaceutical utilisation than the DHB as a whole (7.6 scripts vs. 6.9 scripts per person); however, for laboratory use, the average was 5.2 laboratory tests per person for West Auckland while it was 5.4 for the DHB as a whole. For secondary care services, the age standardised rate of PAH for West Auckland was much higher (3,915 per 100,000) than the WDHB total (3,151 per 100,000). The top three PAH conditions were angina/chest pain, cellulitis and myocardial infarction (data 2009-2011). The order of the top ten PAH conditions varied across ethnicities. Just like the PAH rate, West Auckland also had a higher ASH rate compared with Waitemata as a whole (2,891 per 100,000 vs. 2,242 per 100,000). The admission rates for CVD and diabetes as primary diagnoses were also higher for West Auckland adults than the DHB total (1,900 and 336 per 100,000 for West Auckland, vs. 1,563 and 228 per 100,000 for WDHB total). However, there was no significant difference of mental health admissions between the two. West Auckland had a higher rate of outpatient visits (medical/surgical FSAs and follow-ups) in 2010/11, and also with ED attendances (22.4% vs. 19.1%). The age standardised elective surgery rate was also higher for West Auckland than the DHB total (3,142 per 100,000 vs. 2,718 per 100,000). The infant mortality rate for West Auckland was 3.9 per 100,000 live births for 2007-2009 (c.f. 3.1 per 100,000 live births for WDHB). West Auckland also had higher rates for SUDI and child mortality, child PAM and low birth weight, but the differences were not significant. Asian seemed to have a higher rate for low birth weight, which may be mainly associated with South Asian. About 93% of West Auckland children had immunisation at two years, though there was variation across ethnicities. Approximately 14% of WDHB children took medication for asthma in the 2006/07 survey. The age standardised rate for asthma admissions was higher for West Auckland (683 per 100,000),

v
compared with WDHB total (559 per 100,000). West Auckland children also had a higher age standardised rate for rheumatic fever admissions, but the difference was not significant. However, there was a slightly lower age standardised rate for injury admissions for West Auckland. West Auckland had higher child PAH and ASH rates than the WDHB total for 2009-2011 (4,639 and 3,377 per 100,000 for West Auckland 3,899 and 2,849 per 100,000 for WDHB total). Finally, the age standardised rate for dental caries and oral health admissions was higher for West Auckland as well (643 and 566 per 100,000 for West Auckland and WDHB total respectively).
Cluster Level Summary There are three clusters in the West Auckland Integrated Care Project: Henderson (14 practices), Massey (7 practices) and New Lynn (22 practices). The enrolled populations as at Q1 2012 were 81911, 31087 and 105192 for Henderson, Massey and New Lynn respectively. New Lynn had the highest proportion of 65+ years old, while Massey the highest proportion of children (25%). Henderson cluster had the largest proportion of Maori/Pacific (34%) and Massey the smallest (18%). The Maori/Pacific population was also younger than the total across the three clusters (close to one third children). Massey cluster was the least deprived and Henderson the most deprived. Not surprisingly, Henderson had the highest proportion of ‘high needs’ (43%) and Massey the lowest (23%). Massey cluster has grown the fastest compared with Q1 2007 (15% from Q1 2007 to Q1 2012), and Henderson has had the largest increase in enrolment in absolute terms. As for secondary care services, Henderson had the highest ASR PAH of the three clusters. The top three PAH conditions were angina and chest pain, cellulitis and myocardial infarction across the three clusters. Similar to ASR PAH, Henderson again had the largest ASR ASH. The top three ASH conditions were angina and chest pain, cellulitis and gastroenteritis & dehydration across the three clusters. Henderson cluster had the highest age standardised rates for CVD, diabetes and mental health admissions (as primary diagnosis) during 2009-2011. The cluster with the largest ASR for elective surgery was Henderson, while the other two clusters had quite similar rates. Henderson cluster had the largest ASR for emergency department attendances in 2009/10. When we look at child health, similar to adult ASR PAH, Henderson had the highest rate for age standardised PAH for children. The order of the top ten PAH conditions for children varied across clusters, but the top five conditions were generally asthma, respiratory infections – acute bronchitis, gastroenteritis, cellulitis and respiratory infections – pneumonia. Maori/Pacific had higher proportions of ASH/PAH of total acute admissions across clusters. Just like ASR PAH, Henderson had the highest ASR ASH with Massey the lowest. The three clusters had similar ASR for asthma, but Henderson had the highest ASR for injury. Falls and exposure to inanimate mechanical forces were the top two categories of injury hospitalisations (approximately 45% and 24% respectively) during 2009-2011. The numbers for rheumatic fever admissions were too small to make any useful comparisons between the three clusters. Henderson had a slightly higher ASR for dental caries and oral health admissions, but the difference was not significant. Again, Henderson cluster had the highest ASR for ED attendances, followed by New Lynn.

vi
Cluster Highlights
Henderson Massey 81,900 people (14 practices) (38% of the 3 clusters) Highest proportion of Maori/Pacific (34%) Highest proportion 'High Needs' (43%) Highest age-standardised PAH and ASH rate for adults and children Top 3 ASH conditions: angina & chest pain, cellulitis, and gastroenteritis & dehydration Highest age-standardised adult hospitalisation rate for CVD, Diabetes, and Mental Health Highest rate of ED attendance for adults and children
31,100 people (7 practices) (14% of the 3 clusters) Lowest proportion of Maori/Pacific (18%) Highest proportion of children (0-14) (25%) Smallest proportion 'High Needs' (23%) Top 3 ASH conditions: angina & chest pain, cellulitis, and gastroenteritis & dehydration Lowest age-standardised PAH and ASH rate for children
New Lynn
105,200 people (22 practices) (48% of the 3 clusters) Proportion of Maori/Pacific (18%) Highest proportion 65+ (12%) Most deprived (20% Decile 9 & 10) Top 3 ASH conditions: angina & chest pain, cellulitis, and gastroenteritis & dehydration Highest age-standardised asthma hospitalisation rate for children

vii
Acknowledgments The authors would like to thank all of the people who have contributed in different ways to the completion of this report. The following people in particular deserve special mention for their support and assistance: Gary Blick (Managing Economist, Sapere Research Group Limited) David Moore (CEO, Sapere Research Group Limited) Janine Pratt (Group Planning Manager, WDHB) Sam Smorenburg (Graphic Designer, WDHB)

viii
Abbreviations ASH Ambulatory Sensitive Hospitalisations
ARF Acute Rheumatic Fever
ASR Age-Standardised Rate
BMI Body Mass Index
CI Confidence Interval
COPD Chronic Obstructive Pulmonary Disease
CORD Chronic Obstructive Respiratory Disease
CVD Cardiovascular Disease
DHB District Health Board
ED Emergency Department
GP General Practitioner
HNA Health Needs Assessment
ICD International Classification of Disease
MoH Ministry of Health
NHI National Health Index
NMDS National Minimum Data Set
NZ New Zealand
NZDep New Zealand Deprivation Index
NZHS New Zealand Health Survey
PAH Potentially Avoidable Hospitalisation
PAM Potentially Avoidable Mortality
PHO Primary Health Organisation
SNZ Statistics New Zealand
SUDI Sudden Unexpected Death in Infancy
WDHB Waitemata District Health Board
WHO World Health Organisation

ix
Table of Contents Locality Level Profile ............................................................................................................................... 1
1. Population Demographics .............................................................................................................. 1 1.1 Boundaries of West Auckland Locality ..................................................................................... 1 1.2 Population Estimate 2011 ........................................................................................................ 3 1.3 Population by Age and Gender – Census 2006 ........................................................................ 3 1.4 Population by Ethnicity and Age – Census 2006 ...................................................................... 5 1.5 Population by Deprivation – Census 2006 ............................................................................... 8 1.6 Population Growth and Projection .......................................................................................... 8
2 Health Determinants ..................................................................................................................... 11 2.1 Smoking .................................................................................................................................. 11 2.2 High Cholesterol and High Blood Pressure ............................................................................. 12 2.3 Overweight and Obesity ......................................................................................................... 12 2.4 Alcohol Use ............................................................................................................................. 13 2.5 Physical Activity ...................................................................................................................... 13 2.6 Fruit and Vegetable Consumption ......................................................................................... 14
3 Health Outcomes ........................................................................................................................... 15 3.1 Life Expectancy ....................................................................................................................... 15 3.2 Potentially Avoidable Mortality ............................................................................................. 17 3.3 Prevalence of Diabetes ........................................................................................................... 19 3.4 Prevalence of CVD .................................................................................................................. 19 3.5 Prevalence of Asthma ............................................................................................................ 20
4 Primary Care Services .................................................................................................................... 21 4.1 PHO Enrolment and Utilisation Rate ...................................................................................... 21 4.2 Pharmaceutical Use ................................................................................................................ 21 4.3 Lab Use ................................................................................................................................... 23
5 Secondary Care Services ................................................................................................................ 25 5.1 Avoidable Hospitalisations – PAH and ASH ............................................................................ 25 5.2 Potentially Avoidable Hospitalisations ................................................................................... 25 5.3 Ambulatory Sensitive Hospitalisations ................................................................................... 30 5.4 CVD Admissions ...................................................................................................................... 32 5.5 Diabetes Admissions .............................................................................................................. 33 5.6 Mental Health Admissions ..................................................................................................... 34 5.7 Outpatient Visits ..................................................................................................................... 35 5.8 Emergency Department Attendances .................................................................................... 37 5.9 Elective Surgery ...................................................................................................................... 38
6 Child Health ................................................................................................................................... 39 6.1 Infant Mortality ...................................................................................................................... 39 6.2 SUDI ........................................................................................................................................ 39 6.3 Child Mortality ........................................................................................................................ 40 6.4 Child Potentially Avoidable Mortality .................................................................................... 41 6.5 Low Birth Weight .................................................................................................................... 42 6.6 Immunisation ......................................................................................................................... 43 6.7 Prevalence of Asthma ............................................................................................................ 44 6.8 Avoidable Hospitalisations – PAH and ASH ............................................................................ 44 6.9 Potentially Avoidable Hospitalisations ................................................................................... 44 6.10 Ambulatory Sensitive Hospitalisations ................................................................................. 45 6.11 Asthma Admissions .............................................................................................................. 47 6.12 Rheumatic Fever Admissions ............................................................................................... 49

x
6.13 Injury Admissions ................................................................................................................. 50 6.14 Oral Health ........................................................................................................................... 52 6.15 Emergency Department Attendances .................................................................................. 53
Cluster Level Profile .............................................................................................................................. 54 7 Definition of Clusters ..................................................................................................................... 54 8 Enrolled Population Demographics ............................................................................................... 55
8.1 Population by Age and Gender .............................................................................................. 55 8.2 Population by Age and Ethnicity ............................................................................................ 57 8.3 Population by Deprivation ..................................................................................................... 62 8.4 High Needs Population ........................................................................................................... 64 8.5 Population Growth ................................................................................................................. 64
9 Secondary Care Services (Adults) .................................................................................................. 66 9.1 Avoidable Hospitalisations – PAH and ASH ............................................................................ 66 9.2 Potentially Avoidable Hospitalisations ................................................................................... 66 9.3 Ambulatory Sensitive Hospitalisations ................................................................................... 69 9.4 CVD Admissions ...................................................................................................................... 71 9.5 Diabetes Admissions .............................................................................................................. 72 9.6 Mental Health Admissions ..................................................................................................... 73 9.7 Elective Surgery ...................................................................................................................... 74 9.8 Emergency Department Attendances .................................................................................... 75
10 Child Health ................................................................................................................................. 76 10.1 Avoidable Hospitalisations – PAH and ASH .......................................................................... 76 10.2 Potentially Avoidable Hospitalisations ................................................................................. 76 10.3 Ambulatory Sensitive Hospitalisations ................................................................................. 79 10.4 Asthma Admissions .............................................................................................................. 82 10.5 Rheumatic Fever Admissions ............................................................................................... 83 10.6 Injury Admissions ................................................................................................................. 84 10.7 Oral Health Admissions ........................................................................................................ 88 10.8 Emergency Department Attendances .................................................................................. 89
Appendices ............................................................................................................................................ 90 Appendix 1 - WHO Standard Population .......................................................................................... 90 Appendix 2 - Ethnicity ....................................................................................................................... 91 Appendix 3 - Potentially Avoidable Mortality (PAM) indicators and their ICD 10 Codes ................. 92 Appendix 4 - Potentially Avoidable Hospitalisation (PAH) indicators and their ICD 10 Codes ......... 93 Appendix 5 - Ambulatory Sensitive Hospitalisation (ASH) indicators and their ICD 10 Codes ......... 94 Appendix 6 - Data Sources ................................................................................................................ 95
Bibliography .......................................................................................................................................... 97

xi
List of Figures Figure 1: West Auckland and WDHB – Population Structure Comparison – Census 2006 ..................... 5 Figure 2: West Auckland and WDHB, % Population by Ethnicity (Prioritised) – Census 2006 ............... 6 Figure 3: West Auckland and WDHB, Proportion Population by NZDep2006 Decile - Census 2006 ...... 8 Figure 4: WDHB and West Auckland, Historic Population Growth and Population Projection .............. 9 Figure 5: West Auckland – Projected Age Structure Change – 2006-2026 ........................................... 10 Figure 6: WDHB – Projected Age Structure Change – 2006-2026 ........................................................ 10 Figure 7: Life Expectancy at Birth – WDHB & West Auckland – 2007-2009 – By Sex ........................... 15 Figure 8: Life Expectancy at Birth – West Auckland, 2007-2009 – By Ethnicity ................................... 16 Figure 9: Life Expectancy at Birth – WDHB and West Auckland, 2007-2009 – By Ethnicity ................. 16 Figure 10: Adult (15-74 years) Age Standardised PAM Rate, WDHB and West Auckland, 2007-2009 17 Figure 11: % PAM by Condition (Top 10 West) – 2007-2009, ............................................................... 19 Figure 12: Age Standardised Pharmaceutical Script Utilisation Rate, WDHB and West Auckland, 2010/11 ................................................................................................................................................. 22 Figure 13: West Auckland Pharmaceutical Use (Scripts) and West Auckland population, .................. 22 Figure 14: Age Standardised Community Lab Test Utilisation Rate, .................................................... 23 Figure 15: West Auckland Community Lab Test Use and West Auckland population, ........................ 24 Figure 16: Adult (15-74 years) Age Standardised PAH Rate, WDHB and West Auckland, 2009-2011 . 26 Figure 17: % PAH by Condition (Top 10 West) – 2009-2011, ............................................................... 27 Figure 18: % Acute Admissions PAH – 2009-2011, West Auckland Adults (15-74) by Ethnicity .......... 28 Figure 19: Adult (15-74 years) Age Standardised ASH Rate, WDHB and West Auckland, 2009-2011 .. 30 Figure 20: % ASH by Condition (Top 10 West) – 2009-2011, ................................................................ 31 Figure 21: Age Standardised CVD Admission Rate, WDHB and West Auckland, 2009-2011 ................ 32 Figure 22: West Auckland CVD Admissions and West Auckland Population, ....................................... 32 Figure 23: Age Standardised Diabetes Admission Rate, WDHB and West Auckland, 2009-2011 ........ 33 Figure 24: West Auckland Diabetes Admissions and West Auckland Population, ............................... 33 Figure 25: Age Standardised Mental Health Admission Rate, WDHB and West Auckland, 2009-201134 Figure 26: West Auckland Mental Health Admissions and West Auckland Population, ..................... 34 Figure 27: Age Standardised Outpatient Attendance Rate, (Med/Surg FSAs and Follow Ups), ........... 35 Figure 28: West Auckland Outpatient Attendances and West Auckland Population, .......................... 36 Figure 29: Age Standardised Emergency Department Visit Rate, WDHB and West Auckland, 2010/11 .............................................................................................................................................................. 37 Figure 30: West Auckland ED Visits and West Auckland Population, 2009-2011, proportion by Age . 37 Figure 31: Age Standardised Elective Surgery Admission Rate, WDHB and West Auckland, 2009-2011 .............................................................................................................................................................. 38 Figure 32: West Auckland Elective Surgery Admissions and West Auckland Population, .................... 38 Figure 33: Infant Mortality Rate (per 1,000 live births), WDHB and West Auckland, 2007-2009 ........ 39 Figure 34: SUDI Mortality Rate (per 1,000 live births), WDHB and West Auckland, 2007-2009 .......... 40 Figure 35: Child Age Standardised Mortality Rate, WDHB and West Auckland, 2007-2009 ................ 40 Figure 36: Child Age Standardised PAM rate, WDHB and West Auckland, 2007-2009 ........................ 41 Figure 37: Low Birth Weight Rate (per 1,000 live hospital births), WDHB and West Auckland, 2009-2011 ...................................................................................................................................................... 42 Figure 38: Low Birth Weight Rate (per 1,000 live hospital births), West Auckland by Ethnicity, 2009-2011 ...................................................................................................................................................... 42 Figure 39: Child Age Standardised PAH Rate, WDHB and West Auckland, 2009-2011 ........................ 44 Figure 40: Child Age Standardised ASH Rate, WDHB and West Auckland, 2009-2011 ........................ 46 Figure 41: Child Age Standardised Rate – Asthma Admissions, ........................................................... 47 Figure 42: Child Age Standardised Rate – Asthma Admissions, ........................................................... 48 Figure 43: West Auckland Asthma Admissions and West Auckland Population, 2009-2011, proportion
xii
by Age ................................................................................................................................................... 48 Figure 44: Child Age Standardised Rate – ARF Admissions, WDHB and West Auckland, 2009-2011 ... 49 Figure 45: West Auckland ARF Admissions and West Auckland Population, 2009-2011, proportion by Age ........................................................................................................................................................ 49 Figure 46: Child Age Standardised Rate – Injury Admissions,............................................................... 50 Figure 47: West Auckland Injury Admissions and West Auckland Population, 2009-2011, proportion by Age ................................................................................................................................................... 50 Figure 48: Child Age Standardised Rate – Dental Caries and Oral Health Admissions, ........................ 52 Figure 49: West Auckland Dental Caries and Oral Health Admissions and West Auckland Population, .............................................................................................................................................................. 52 Figure 50: Age Standardised Emergency Department Visit Rate, WDHB and West Auckland, 2010/11, Children (0-14) ...................................................................................................................................... 53 Figure 51: Henderson Cluster Population Structure, 2012 Q1 ............................................................. 56 Figure 52: Massey Cluster Population Structure, 2012 Q1 ................................................................... 56 Figure 53: New Lynn Cluster Population Structure, 2012 Q1 ............................................................... 57 Figure 54: Henderson, Massey, New Lynn, % Population by Ethnicity, 2012 Q1 ................................. 58 Figure 55: Henderson Cluster Population Structure, 2012 Q1 ............................................................. 60 Figure 56: Massey Cluster Population Structure, 2012 Q1 ................................................................... 61 Figure 57: New Lynn Cluster Population Structure, 2012 Q1 ............................................................... 61 Figure 58: Henderson Cluster Population % by NZDep2006 Decile, 2012 Q1 ...................................... 62 Figure 59: Massey Cluster Population % by NZDep2006 Decile, 2012 Q1 ........................................... 63 Figure 60: New Lynn Cluster Population % by NZDep2006 Decile, 2012 Q1 ........................................ 63 Figure 61: % Population High Needs, Q1 2007 - Q1 2012 .................................................................... 64 Figure 62: Cluster Population Change, PHO Enrolment Data, Q1 2007 - Q1 2012 ............................... 65 Figure 63: Adult (15-74 years) Age Standardised PAH Rate, Henderson, Massey, New Lynn - 2009-2011 ...................................................................................................................................................... 67 Figure 64: Adult (15-74 years) Age Standardised ASH Rate, Henderson, Massey, New Lynn - 2009-2011 ...................................................................................................................................................... 69 Figure 65: Adult (15+) Age Standardised CVD Admission Rate, ............................................................ 71 Figure 66: Adult (15+) Age Standardised Diabetes Admission Rate, .................................................... 72 Figure 67: Adult (15+) Age Standardised Mental Health Admission Rate, ........................................... 73 Figure 68: Adult (15+) Age Standardised Elective Surgery Admission Rate, ......................................... 74 Figure 69: Adult (15+) Age Standardised ED Attendance Rate, Henderson, Massey, New Lynn - 2009/10 ................................................................................................................................................. 75 Figure 70: Child Age Standardised PAH Rate, Henderson, Massey, New Lynn - 2009-2011 ................ 77 Figure 71: Child Age Standardised ASH Rate, Henderson, Massey, New Lynn - 2009-2011 ................ 80 Figure 72: Child Age Standardised Asthma Admission Rate, Henderson, Massey, New Lynn - 2009-2011 ...................................................................................................................................................... 82 Figure 73: Child Age Standardised Rheumatic Fever Admission Rate, ................................................. 83 Figure 74: Child Age Standardised Injury Admission Rate, Henderson, Massey, New Lynn - 2009-2011 .............................................................................................................................................................. 84 Figure 75: Child Age Standardised Dental Caries and Oral Health Admission Rate, ............................ 88 Figure 76: Child Age Standardised ED Attendance Rate, Henderson, Massey, New Lynn - 2009/10 .. 89

xiii
List of Tables Table 1: Population Estimate 2011 by Age, West Auckland, Waitemata DHB, Auckland Region .......... 3 Table 2: West Auckland Locality by Age and Gender – Census 2006 ..................................................... 3 Table 3: Waitemata DHB by Age and Gender – Census 2006 ................................................................. 4 Table 4: West Auckland and WDHB - % Population by Age – Census 2006 ........................................... 4 Table 5: West Auckland and WDHB, Population by Ethnicity (Prioritised) – Census 2006 .................... 5 Table 6: West Auckland by Ethnicity (Prioritised) and Age – Census 2006 ............................................ 6 Table 7: West Auckland by Ethnicity (Prioritised) and Age % – Census 2006 ......................................... 7 Table 8: Waitemata DHB by Ethnicity (Prioritised) and Age – Census 2006 ........................................... 7 Table 9: Waitemata DHB by Ethnicity (Prioritised) and Age % – Census 2006 ....................................... 7 Table 10: West Auckland and WDHB Adult Smoking Status ................................................................. 11 Table 11: Prevalence of Adult Smokers, WDHB & NZ ........................................................................... 11 Table 12: % Adults Taking Medication for High Cholesterol, WDHB & NZ ........................................... 12 Table 13: % Adults Taking Medication for High Blood Pressure, WDHB & NZ ..................................... 12 Table 14: % Children Obese, WDHB & NZ ............................................................................................. 13 Table 15: % Adults Obese, WDHB & NZ ................................................................................................ 13 Table 16: % Adults Hazardous Drinkers, WDHB & NZ ........................................................................... 13 Table 17: % Adults Regularly Physically Active, WDHB & NZ ................................................................ 13 Table 18: % Adults Adequate Vegetable Intake, WDHB & NZ .............................................................. 14 Table 19: % Adults Adequate Fruit Intake, WDHB & NZ ....................................................................... 14 Table 20: PAM by Condition (Top 10), 2007-2009 - West Auckland Adults (15-74) ............................. 18 Table 21: % Adults Diagnosed with Diabetes, WDHB & NZ – NZHS 06/07 ........................................... 19 Table 22: % Adults Diagnosed with Ischaemic Heart Disease, WDHB & NZ – NZHS 06/07 .................. 20 Table 23: % Adults with Medicated Asthma, WDHB & NZ – NZHS 06/07 ............................................ 20 Table 24: % Population with a Primary Health Care Provider, WDHB & NZ – NZHS 06/07 .................. 21 Table 25: % Waitemata DHB Population enrolled with a PHO, by ethnicity, 2012 Q1 ......................... 21 Table 26: PAH by Category (top 10) – 2009-2011, West Auckland Adults (15-74) ............................... 26 Table 27: PAH by Category (Top 10) – 2009-2011, West Auckland Adults (15-74) – Maori ................. 28 Table 28: PAH by Category (Top 10) – 2009-2011, West Auckland Adults (15-74) – Pacific ................ 29 Table 29: PAH by Category (Top 10) – 2009-2011, West Auckland Adults (15-74) – Asian .................. 29 Table 30: PAH by Category (Top 10) – 2009-2011, West Auckland Adults (15-74) – Other ................. 30 Table 31: ASH by Category (Top 10) – 2009-2011, West Auckland Adults (15-74) .............................. 31 Table 32: PAM by Condition (Top 5) – 2007-2009, West Auckland children ........................................ 41 Table 33: Immunisation Coverage for WDHB Children by milestone age, 12/02/2012 – 11/05/2012 43 Table 34: Immunisation Coverage for WDHB Children by milestone age, 12/02/2012 – 11/05/2012, ethnicity ................................................................................................................................................ 43 Table 35: % Children with Medicated Asthma, WDHB & NZ – NZHS 06/07 ......................................... 44 Table 36: PAH by Category (Top 10) – 2009-2011, West Auckland Children ....................................... 45 Table 37: ASH by Category (Top 10) – 2009-2011, West Auckland Children ........................................ 46 Table 38: Injury Hospitalisations by Category (Top 20) – 2009-2011, West Auckland Children .......... 51 Table 39: Clusters by Practice ............................................................................................................... 54 Table 40: Clusters by Age, 2012 Q1 ...................................................................................................... 55 Table 41: Clusters by Age %, 2012 Q1................................................................................................... 55 Table 42: Clusters by Ethnicity, 2012 Q1 .............................................................................................. 57 Table 43: Clusters by Ethnicity %, 2012 Q1 ........................................................................................... 57 Table 44: Henderson Cluster by Ethnicity and Age, 2012 Q1 ............................................................... 58 Table 45: Massey Cluster by Ethnicity and Age, 2012 Q1 ..................................................................... 58 Table 46: New Lynn Cluster by Ethnicity and Age, 2012 Q1 ................................................................. 59 Table 47: Henderson Cluster by Ethnicity and Age %, 2012 Q1 ........................................................... 59
xiv
Table 48: Massey Cluster by Ethnicity and Age %, 2012 Q1 ................................................................. 59 Table 49: New Lynn Cluster by Ethnicity and Age %, 2012 Q1 ............................................................. 59 Table 50: Cluster Population Change, Q1 2007 - Q1 2012 ................................................................... 64 Table 51: PAH and Total Acute Admissions, 2009-2011, by Cluster (15-74) ........................................ 66 Table 52: % Acute Admissions PAH, 2009-2011, by Ethnicity and Cluster (15-74) ............................... 66 Table 53: PAH by Category (Top 10) – 2009-2011, Henderson Cluster Adults (15-74) ........................ 67 Table 54: PAH by Category (Top 10) – 2009-2011, Massey Cluster Adults (15-74) .............................. 68 Table 55: PAH by Category (Top 10) – 2009-2011, New Lynn Cluster Adults (15-74) .......................... 68 Table 56: ASH and Total Acute Admissions, 2009-2011, by Cluster Adults (15-74) ............................. 69 Table 57: % Acute Admissions ASH, 2009-2011, by Ethnicity and Cluster (15-74) ............................... 69 Table 58: ASH by Category (Top 10) – 2009-2011, Henderson Cluster Adults (15-74)......................... 70 Table 59: ASH by Category (Top 10) – 2009-2011, Massey Cluster Adults (15-74) .............................. 70 Table 60: ASH by Category (Top 10) – 2009-2011, New Lynn Cluster Adults (15-74) .......................... 70 Table 61: Child PAH and Total Acute Admissions, 2009-2011, by Cluster ............................................ 76 Table 62: Child % Acute Admissions PAH, 2009-2011, by Ethnicity and Cluster .................................. 76 Table 63: PAH by Category (Top 10) – 2009-2011, Henderson Cluster Children .................................. 77 Table 64: PAH by Category (Top 10) – 2009-2011, Massey Cluster Children ....................................... 78 Table 65: PAH by Category (Top 10) – 2009-2011, New Lynn Cluster Children ................................... 78 Table 66: Child ASH and Total Acute Admissions, 2009-2011, by Cluster ............................................ 79 Table 67: Child % Acute Admissions ASH, 2009-2011, by Ethnicity and Cluster .................................. 79 Table 68: ASH by Category (Top 10) – 2009-2011, Henderson Cluster Children .................................. 80 Table 69: ASH by Category (Top 10) – 2009-2011, Massey Cluster Children ....................................... 81 Table 70: ASH by Category (Top 10) – 2009-2011, New Lynn Cluster Children .................................... 81 Table 71: Injury Hospitalisations by Category (Top 20) – 2009-2011, Henderson Cluster Children .... 85 Table 72: Injury Hospitalisations by Category (Top 20) – 2009-2011, Massey Cluster Children .......... 86 Table 73: Injury Hospitalisations by Category (Top 20) – 2009-2011, New Lynn Cluster Children ...... 87

xv
List of Maps Map 1: Auckland Region by Local Board ................................................................................................. 1 Map 2: Waitakere Ward.......................................................................................................................... 2 Map 3: Whau Ward ................................................................................................................................. 2

1
Locality Level Profile 1. Population Demographics
1.1 Boundaries of West Auckland Locality There are three localities in Auckland: West Auckland, North Auckland and Central Auckland. The map below shows West Auckland’s place in the context of the greater Auckland area. The West Auckland locality includes two wards: Waitakere and Whau. About half of the Whau ward is within the boundaries of ADHB and half within WDHB. Within these two wards there are three local boards: Henderson & Massey, Waitakere Ranges, and Whau. (See maps 1 – 3 below).
Map 1: Auckland Region by Local Board

2
Map 2: Waitakere Ward
Source: Auckland Council, 2011
Map 3: Whau Ward
Source: Auckland Council, 2011
3
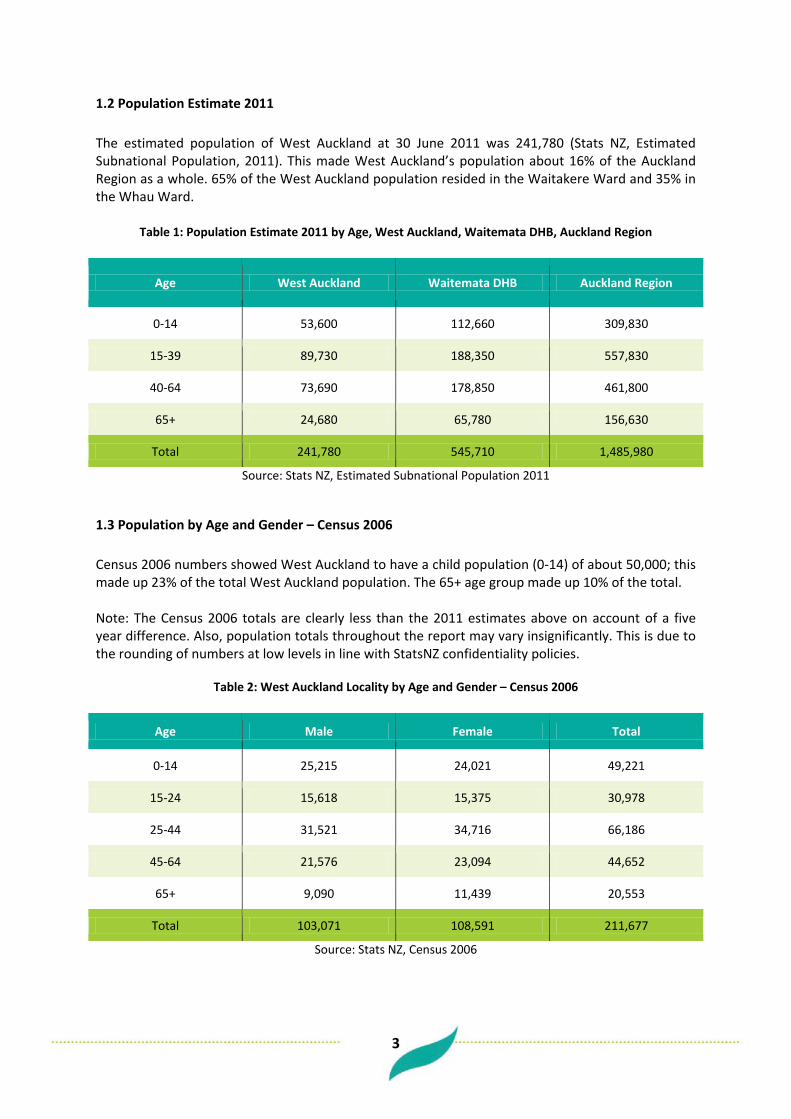
1.2 Population Estimate 2011 The estimated population of West Auckland at 30 June 2011 was 241,780 (Stats NZ, Estimated Subnational Population, 2011). This made West Auckland’s population about 16% of the Auckland Region as a whole. 65% of the West Auckland population resided in the Waitakere Ward and 35% in the Whau Ward.
Table 1: Population Estimate 2011 by Age, West Auckland, Waitemata DHB, Auckland Region
Age West Auckland Waitemata DHB Auckland Region
0-14 53,600 112,660 309,830
15-39 89,730 188,350 557,830
40-64 73,690 178,850 461,800
65+ 24,680 65,780 156,630
Total 241,780 545,710 1,485,980
Source: Stats NZ, Estimated Subnational Population 2011
1.3 Population by Age and Gender – Census 2006 Census 2006 numbers showed West Auckland to have a child population (0-14) of about 50,000; this made up 23% of the total West Auckland population. The 65+ age group made up 10% of the total. Note: The Census 2006 totals are clearly less than the 2011 estimates above on account of a five year difference. Also, population totals throughout the report may vary insignificantly. This is due to the rounding of numbers at low levels in line with StatsNZ confidentiality policies.
Table 2: West Auckland Locality by Age and Gender – Census 2006
Age Male Female Total
0-14 25,215 24,021 49,221
15-24 15,618 15,375 30,978
25-44 31,521 34,716 66,186
45-64 21,576 23,094 44,652
65+ 9,090 11,439 20,553
Total 103,071 108,591 211,677
Source: Stats NZ, Census 2006

4
Waitemata DHB as a whole had a similar age structure to West Auckland - West Auckland’s population being proportionately slightly younger. Census 2006 numbers showed Waitemata DHB to have a child population (0-14) of about 105,000; this made up 22% of the total Waitemata DHB population. The 65+ age group made up 11% of the total.
Table 3: Waitemata DHB by Age and Gender – Census 2006
Age Male Female Total
0-14 53,514 50,982 104,553
15-24 34,425 33,273 67,707
25-44 67,938 75,120 143,034
45-64 54,897 58,359 113,184
65+ 23,481 29,409 53,001
Total 234,441 247,161 481,641
Source: Stats NZ, Census 2006
Table 4: West Auckland and WDHB - % Population by Age – Census 2006
Age West Auckland WDHB
0-14 23% 22%
15-24 15% 14%
25-44 31% 30%
45-64 21% 23%
65+ 10% 11%
Total 100% 100%
Source: Stats NZ, Census 2006
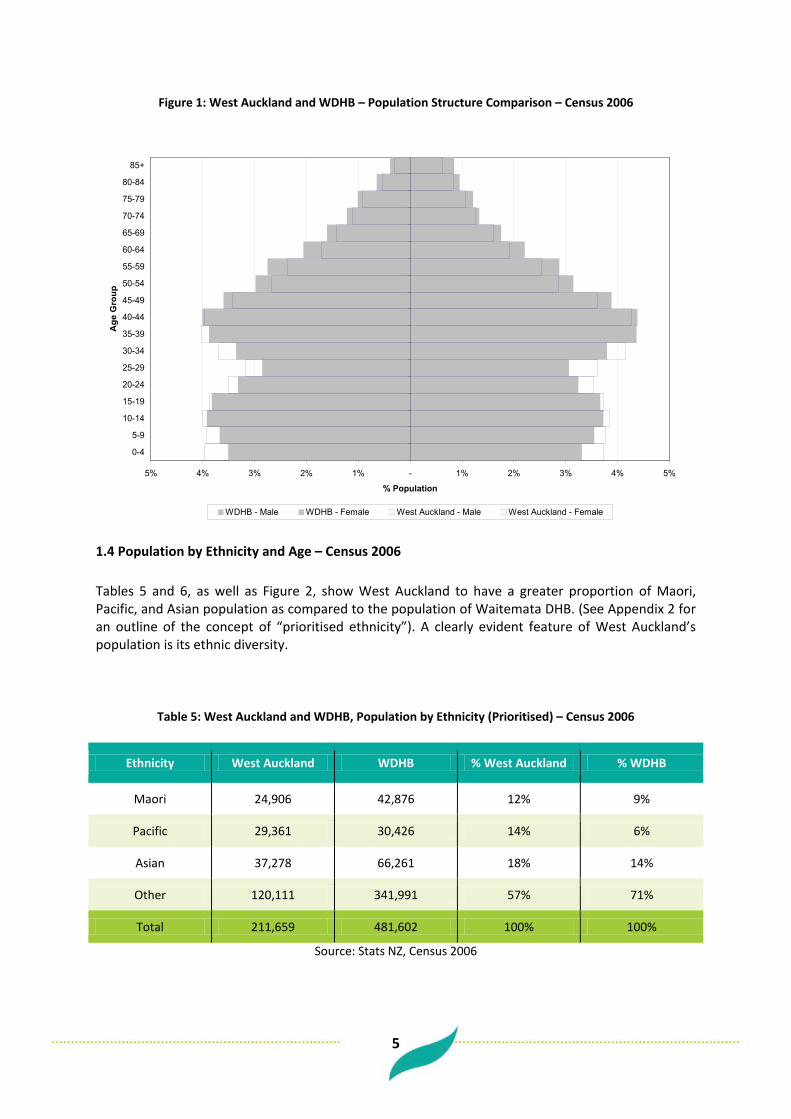
Figure 1 below shows the similarities between the age structure of the West Auckland population and the Waitemata DHB population; West Auckland had a slightly younger population. However, these age structure differences vary widely by ethnicity.
5
Figure 1: West Auckland and WDHB – Population Structure Comparison – Census 2006
5% 4% 3% 2% 1% - 1% 2% 3% 4% 5%
0-4
5-9
10-14
15-19
20-24
25-29
30-34
35-39
40-44
45-49
50-54
55-59
60-64
65-69
70-74
75-79
80-84
85+
Age
Gro
up
% Population
WDHB - Male WDHB - Female West Auckland - Male West Auckland - Female
1.4 Population by Ethnicity and Age – Census 2006 Tables 5 and 6, as well as Figure 2, show West Auckland to have a greater proportion of Maori, Pacific, and Asian population as compared to the population of Waitemata DHB. (See Appendix 2 for an outline of the concept of “prioritised ethnicity”). A clearly evident feature of West Auckland’s population is its ethnic diversity.
Table 5: West Auckland and WDHB, Population by Ethnicity (Prioritised) – Census 2006
Ethnicity West Auckland WDHB % West Auckland % WDHB
Maori 24,906 42,876 12% 9%
Pacific 29,361 30,426 14% 6%
Asian 37,278 66,261 18% 14%
Other 120,111 341,991 57% 71%
Total 211,659 481,602 100% 100%
Source: Stats NZ, Census 2006

6
Figure 2: West Auckland and WDHB, % Population by Ethnicity (Prioritised) – Census 2006
12%14%
18%
57%
9%6%
14%
71%
0%
10%
20%
30%
40%
50%
60%
70%
80%
Maori Pacific Asian Other
Ethnicity
% P
opul
atio
n
West Auckland WDHB
Maori and Pacific populations in West Auckland have a much larger proportion of children and smaller proportion of older adults when compared to “Other” ethnic groups. Similar age structure differences by ethnic group are seen in the Waitemata DHB population. (See Tables 6 to 9 below).
Table 6: West Auckland by Ethnicity (Prioritised) and Age – Census 2006
Age Maori Pacific Asian Other Total
0-14 9,123 9,687 8,313 22,062 49,224
15-24 4,533 5,118 6,924 14,346 31,002
25-44 7,080 8,604 13,578 36,963 66,228
45-64 3,450 4,626 6,744 29,805 44,670
65+ 696 1,290 1,710 16,629 20,529
Total 24,906 29,361 37,278 120,111 211,659
Source: Stats NZ, Census 2006

7
Table 7: West Auckland by Ethnicity (Prioritised) and Age % – Census 2006
Age Maori Pacific Asian Other Total
0-14 37% 33% 22% 18% 23%
15-24 18% 17% 19% 12% 15%
25-44 28% 29% 36% 31% 31%
45-64 14% 16% 18% 25% 21%
65+ 3% 4% 5% 14% 10%
Total 100% 100% 100% 100% 100%
Source: Stats NZ, Census 2006
Table 8: Waitemata DHB by Ethnicity (Prioritised) and Age – Census 2006
Age Maori Pacific Asian Other Total
0-14 15,324 10,146 14,457 64,425 104,535
15-24 7,851 5,238 13,344 40,881 67,689
25-44 12,318 9,033 22,980 98,529 143,097
45-64 6,126 4,548 12,564 89,811 113,283
65+ 1,065 1,041 2,688 47,412 52,944
Total 42,876 30,426 66,261 341,991 481,602
Source: Stats NZ, Census 2006
Table 9: Waitemata DHB by Ethnicity (Prioritised) and Age % – Census 2006
Age Maori Pacific Asian Other Total
0-14 36% 33% 22% 19% 22%
15-24 18% 17% 20% 12% 14%
25-44 29% 30% 35% 29% 30%
45-64 14% 15% 19% 26% 24%
65+ 2% 3% 4% 14% 11%
Total 100% 100% 100% 100% 100%
Source: Stats NZ, Census 2006

8
12%
14%13%
12%11% 11%
10%
8%
6%
2%
6%6%
6%
7%
10%
13%
15%
18%
14%
5%
0%
2%
4%
6%
8%
10%
12%
14%
16%
18%
20%
1 2 3 4 5 6 7 8 9 10
NZDep2006
%
% Waitemata DHB % West Auckland
1.5 Population by Deprivation – Census 2006 The NZ Deprivation score provides a measure of relative socioeconomic deprivation for all areas in New Zealand. It is calculated by taking into account a variety of Census variables which reflect different dimensions of deprivation. The NZDep2006 score of 1 represents the least deprived areas and the score of 10 represents the most deprived areas. As this is a relative scale, by definition 10% of all mesh blocks (small geographical areas) in the country make up each NZDep2006 index score. Figure 3 below shows that much of West Auckland’s population lived in relatively deprived areas according to NZDep2006. About 65% of the population lived in the more deprived half of NZ areas (NZdep2006 scores 6 to 10). For Waitemata DHB the proportion was less; about 37% of the population lived in the most deprived half of areas.
Figure 3: West Auckland and WDHB, Proportion Population by NZDep2006 Decile - Census 2006
1.6
Population Growth and Projection In the 10 years between 1996 and 2006 the West Auckland population grew by 25% (about 46,000 people). Looking ahead, current projections suggest that in the 20 years from 2006 to 2026 the West Auckland population will grow by a further 37% (about 87,000 people). For the Waitemata DHB, in the 10 years between 1996 and 2006 the DHB’s population grew by 23% (about 94,000 people). Looking ahead current projections suggest that in the 20 years from 2006 to 2026 the population will grow by a further 32% (about 160,000 people). The comparison shows that West Auckland has historically grown, and is projected to continue to grow, at a faster rate than that of the WDHB population. (See Figure 4 below).

9
Figure 4: WDHB and West Auckland, Historic Population Growth and Population Projection
410,853449,046
504,729
545,928
586,902
626,954666,769
704,022
185,711206,402
232,207255,450
276,818297,608
319,042339,704
0
100,000
200,000
300,000
400,000
500,000
600,000
700,000
800,000
1996 2001 2006 2011 2016 2021 2026 2031
Year
Popu
latio
n
Waitemata District Health Board West Auckland
Importantly, current projections expect not only growth in West Auckland’s total population but also aging. The 65+ population is expected to grow by about 22,000 people between 2006 and 2026; meaning the 65+ population of West Auckland would go from making up 9% of the total to 14% of the total. (See Figure 5 below) Waitemata DHB’s population is expected to face a similar change in age structure. The 65+ population is expected to grow by about 60,000 people between 2006 and 2026; meaning the 65+ population of Waitemata DHB would go from making up 11% of the total to 17% of the total. (See Figure 6 below)

10
Figure 5: West Auckland – Projected Age Structure Change – 2006-2026
5% 4% 3% 2% 1% - 1% 2% 3% 4% 5%
0-4
5-9
10-14
15-19
20-24
25-29
30-34
35-39
40-44
45-49
50-54
55-59
60-64
65-69
70-74
75-79
80-84
85+
Age
% Population
2006 -Male 2006 -Female 2026 -Male 2026 -Female
Figure 6: WDHB – Projected Age Structure Change – 2006-2026
5% 4% 3% 2% 1% - 1% 2% 3% 4% 5%
0-4
5-9
10-14
15-19
20-24
25-29
30-34
35-39
40-44
45-49
50-54
55-59
60-64
65-69
70-74
75-79
80-84
85+
Age
% Population
2006 -Male 2006 -Female 2026 -Male 2026 -Female
11
2 Health Determinants Given that the New Zealand Health Survey 2006/07 data is not available by geographic identifiers because of confidentiality policies, the following picture of health determinants will be shown for Waitemata DHB as a whole only (with the one exception of smoking). This should at least give a general sense of the picture for West Auckland and surrounding areas. However, care should be taken in interpreting the numbers, especially given the information of the previous section which shows West Auckland to be both a more ethnically diverse and a more deprived population than Waitemata DHB’s total. Given other results of the New Zealand Health Survey by ethnicity and NZDep2006 we would expect West Auckland’s population to not fare as well as Waitemata’s total in regards to a number of these health determinants measures. There may also be variations across ethnicities; however, these will not be included here as they have been included in the 2009 HNAs by Waitemata DHB (see Bibliography). Unless otherwise noted all measures are for the adult population (Age = 15+) and are unadjusted for differences in population structure.
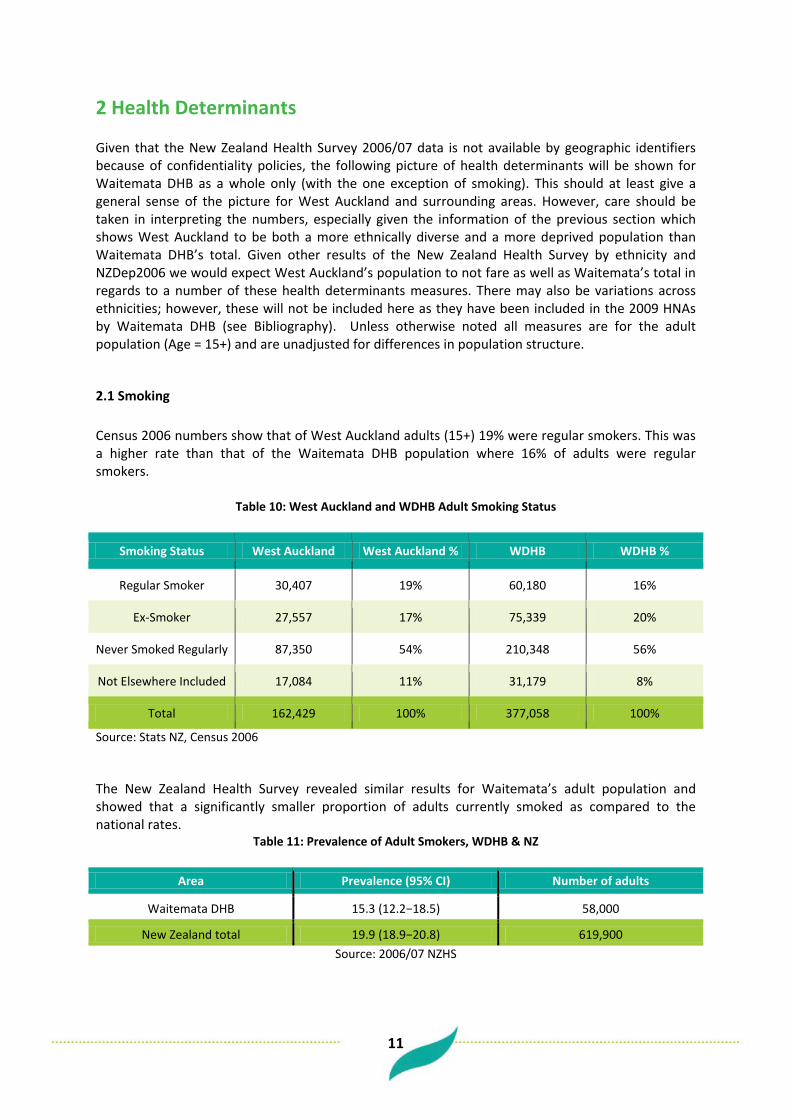
2.1 Smoking Census 2006 numbers show that of West Auckland adults (15+) 19% were regular smokers. This was a higher rate than that of the Waitemata DHB population where 16% of adults were regular smokers.
Table 10: West Auckland and WDHB Adult Smoking Status
Smoking Status West Auckland West Auckland % WDHB WDHB %
Regular Smoker 30,407 19% 60,180 16%
Ex-Smoker 27,557 17% 75,339 20%
Never Smoked Regularly 87,350 54% 210,348 56%
Not Elsewhere Included 17,084 11% 31,179 8%
Total 162,429 100% 377,058 100%
Source: Stats NZ, Census 2006
The New Zealand Health Survey revealed similar results for Waitemata’s adult population and showed that a significantly smaller proportion of adults currently smoked as compared to the national rates.
Table 11: Prevalence of Adult Smokers, WDHB & NZ
Area Prevalence (95% CI) Number of adults
Waitemata DHB 15.3 (12.2−18.5) 58,000
New Zealand total 19.9 (18.9−20.8) 619,900 Source: 2006/07 NZHS

12
2.2 High Cholesterol and High Blood Pressure About 8% of the Waitemata DHB adult population were noted to be taking medication for high cholesterol. This proportion was not significantly different than the proportion across New Zealand as a whole.
Table 12: % Adults Taking Medication for High Cholesterol, WDHB & NZ
Area Prevalence (95% CI) Number of adults
Waitemata DHB 8.3 (6.4−10.2) 31,600
New Zealand total 8.4 (7.7−9.0) 260,600 Source: 2006/07 NZHS
A higher proportion of WDHB adults were taking medication for high blood pressure; about 14%. Again this proportion was not significantly different from the proportion across New Zealand as a whole.
Table 13: % Adults Taking Medication for High Blood Pressure, WDHB & NZ
Area Prevalence (95% CI) Number of adults
Waitemata DHB 14.3 (11.8−16.8) 54,100
New Zealand total 13.6 (13.0−14.3) 425,500 Source: 2006/07 NZHS
2.3 Overweight and Obesity Obesity in the New Zealand Health Survey was measured in line with international standard definitions defined by Body Mass Index cut-off points. The Survey provides the following definition of BMI: “Body mass index (BMI) is a measure of weight adjusted for height, and is calculated by dividing weight in kilograms by height in metres squared (kg/m
2). BMI is used internationally to classify
underweight, overweight and obesity. Since BMI does not distinguish between weight associated with muscle and weight associated with fat, it provides only a crude measure of body fatness in individuals. However, it does provide a good estimate of the proportion of the population with increased risk of health conditions associated with obesity (World Health Organization 2000).” (2006/07, NZHS) The BMI cut-off points are different for adults (15+) and children. For children the cut-off points are age-specific. For children aged between 2 and 17, the BMI cut off points used were those developed by the International Obesity Taskforce (IOTF). These cut-off points define thinness, overweight and obesity and are sex and age-specific. (2006/07, NZHS) Waitemata DHB had a significantly lower prevalence of obesity than the national total for both children and adults. The proportion of Waitemata DHB children defined as obese was about 6 % and for adults about 21%. (See Tables 14 and 15 below)

13
Table 14: % Children Obese, WDHB & NZ
Area Prevalence (95% CI) Number of children
Waitemata DHB 5.9 (3.4−8.3) 5,200
New Zealand total 8.3 (7.4−9.3) 61,700 Source: 2006/07 NZHS
Table 15: % Adults Obese, WDHB & NZ
Area Prevalence (95% CI) Number of adults
Waitemata DHB 20.5 (17.3–23.7) 77,600
New Zealand total 26.5 (25.5-27.5) 826,100 Source: 2006/07 NZHS
2.4 Alcohol Use Hazardous drinking in the NZ Health Survey was defined by cut off points derived from the standard Alcohol Use Disorders Identification Test (AUDIT) questionnaire. This 10 question questionnaire was developed by the WHO and covers information such as the volume and frequency of alcohol consumed, alcohol-related problems, and abnormal drinking behaviour. The prevalence of hazardous drinking amongst Waitemata adults was about 19% for the population of drinkers and 16% for the total adult population. These results were not significantly different from the New Zealand totals.
Table 16: % Adults Hazardous Drinkers, WDHB & NZ
Area Prevalence for drinkers (95% CI)
Prevalence for total adults (95% CI) Number of adults
Waitemata DHB 19.4 (15.8−22.9) 16.2 (13.2−19.2) 61,400
New Zealand total 21.1 (20.1−22.2) 17.7 (16.8−18.5) 551,300 Source: 2006/07 NZHS
2.5 Physical Activity Being “regularly physically active” was defined in the NZ Health Survey as doing at least 30 minutes of physical activity per day on five or more days of the week. According to this measure about 47% of Waitemata DHB adults were regularly physically active. This was not significantly different from the New Zealand total.
Table 17: % Adults Regularly Physically Active, WDHB & NZ
Area Prevalence (95% CI) Number of adults
Waitemata DHB 46.7 (42.4−51.0) 176,900
New Zealand total 50.5 (49.2−51.9) 1,576,500 Source: 2006/07 NZHS

14
2.6 Fruit and Vegetable Consumption Adequate vegetable intake was defined in the NZ Health Survey as an average intake of three or more servings of vegetables each day. According to this measure about 56% of Waitemata DHB adults had an adequate vegetable intake. This was a significantly lower prevalence than the New Zealand total.
Table 18: % Adults Adequate Vegetable Intake, WDHB & NZ
Area Prevalence (95% CI) Number of adults
Waitemata DHB 55.7 (51.1-60.3) 211,000
New Zealand total 64.1 (62.8-65.3) 1,999,300 Source: 2006/07 NZHS
Similarly, adequate fruit intake was defined in the NZ Health Survey as an average intake of the recommended two or more servings of fruit each day. The prevalence of adequate fruit intake for Waitemata DHB adults was about 62%. This was not significantly different from the New Zealand total prevalence.
Table 19: % Adults Adequate Fruit Intake, WDHB & NZ
Area Prevalence (95% CI) Number of adults
Waitemata DHB 61.6 (58.6−64.7) 233,500
New Zealand total 60.0 (58.8−61.3) 1,873,700 Source: 2006/07 NZHS

15
3 Health Outcomes
3.1 Life Expectancy Life expectancy at birth is defined as the number of years a newborn would be expected to live based on today’s pattern of death rates, the definition excludes stillbirths. The life expectancy at birth for West Auckland, based on three years deaths from 2007 to 2009, was 81 years. Compared to this, the life expectancy at birth for the Waitemata DHB population as a whole over the same time period was 83 years. The life expectancy for West Auckland males was about 79 and for females 83; both less than the corresponding Waitemata DHB life expectancies. (See Figure 7 below)
Figure 7: Life Expectancy at Birth – WDHB & West Auckland – 2007-2009 – By Sex
8185
83
79
8381
0
10
20
30
40
50
60
70
80
90
Male Female Total
Sex
Life
Exp
ecta
ncy
at B
irth
Waitemata DHB West Auckland
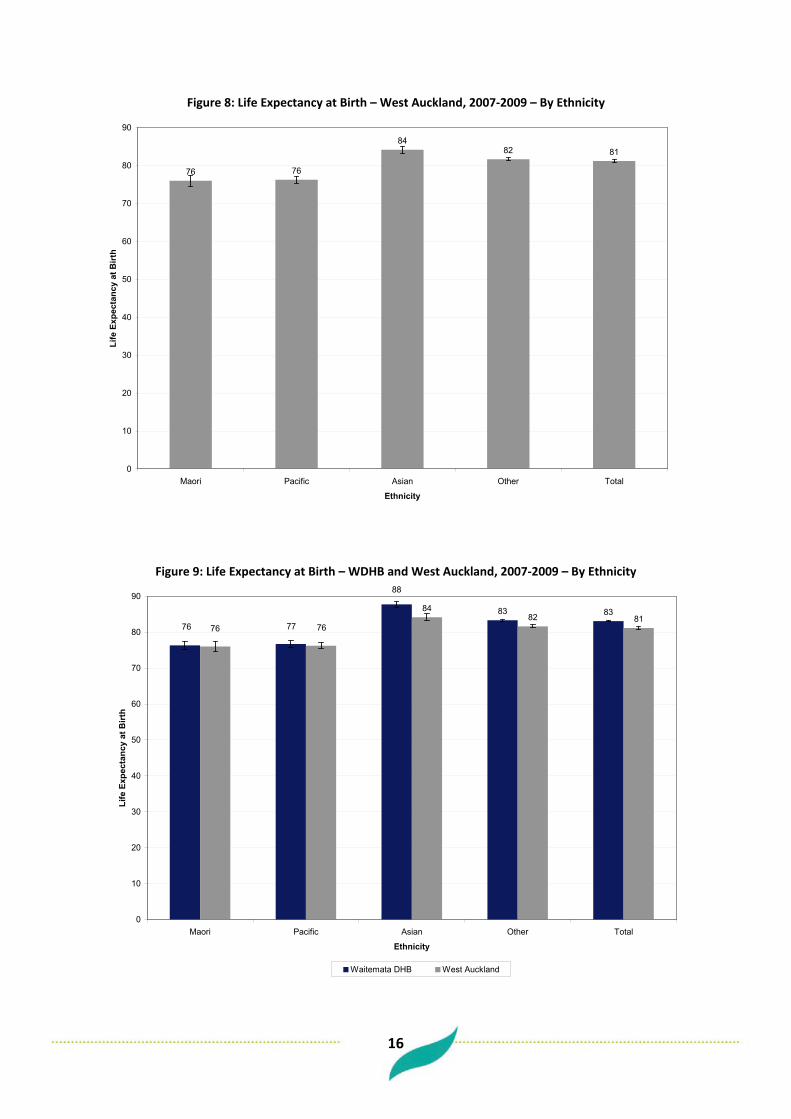
When looked at by ethnicity, both Maori and Pacific in West Auckland had lower life expectancies than the West Auckland total. Both the Maori and the Pacific population had a life expectancy of 76 years. The Asian population in West Auckland had a higher life expectancy than the total with a life expectancy of 84 (this could possibly be accounted for by the so-called “healthy migrant” effect). Life expectancy by ethnicity was similar when comparing the Waitemata DHB total with West Auckland. However, the life expectancy of the DHB total for Asian was higher than that of West Auckland. (See Figures 8 and 9 below)
16
Figure 8: Life Expectancy at Birth – West Auckland, 2007-2009 – By Ethnicity
76 76
8482 81
0
10
20
30
40
50
60
70
80
90
Maori Pacific Asian Other Total
Ethnicity
Life
Exp
ecta
ncy
at B
irth
Figure 9: Life Expectancy at Birth – WDHB and West Auckland, 2007-2009 – By Ethnicity
83 838482 81
88
7776 7676
0
10
20
30
40
50
60
70
80
90
Maori Pacific Asian Other Total
Ethnicity
Life
Exp
ecta
ncy
at B
irth
Waitemata DHB West Auckland

17
3.2 Potentially Avoidable Mortality PAM is an indicator that seeks to show those deaths which occur from conditions determined to be either treatable or preventable (assuming current knowledge of health behaviour, health care, social and economic policy, and other factors). PAM numbers exclude deaths of people aged over 75 years as there is a high prevalence of multiple co-morbidities in this age group. For the three years 2007-2009 there were 1,477 deaths of 15-74 year olds from the West Auckland population. Of these deaths, 42% (616) were considered potentially avoidable. This was the same proportion as seen among the Waitemata DHB population as a whole. However, Figure 10 shows that West Auckland had a higher PAM age standardised rate than that of Waitemata DHB; 112 per 100,000 compared with 92 per 100,000.
Figure 10: Adult (15-74 years) Age Standardised PAM Rate, WDHB and West Auckland, 2007-2009
112
92
0
20
40
60
80
100
120
140
Waitemata DHB West Auckland
Area
PA
M R
ate
(per
100
,000
)
18
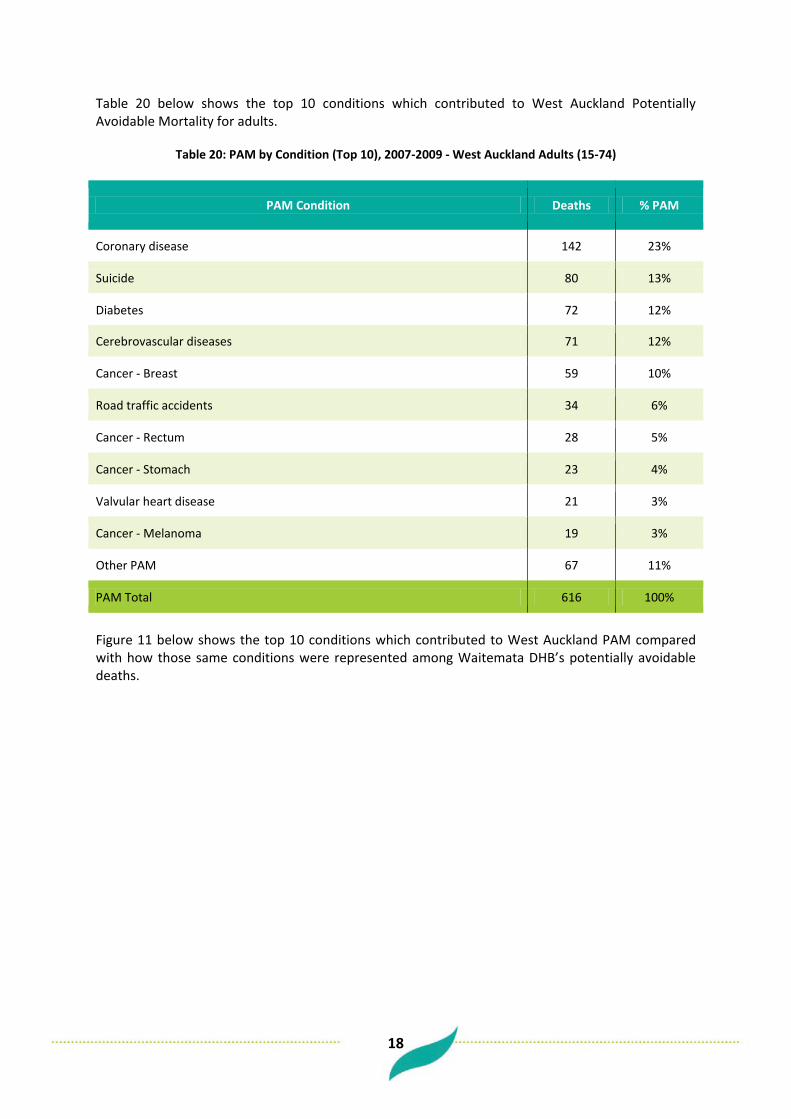
Table 20 below shows the top 10 conditions which contributed to West Auckland Potentially Avoidable Mortality for adults.
Table 20: PAM by Condition (Top 10), 2007-2009 - West Auckland Adults (15-74)
PAM Condition Deaths % PAM
Coronary disease 142 23%
Suicide 80 13%
Diabetes 72 12%
Cerebrovascular diseases 71 12%
Cancer - Breast 59 10%
Road traffic accidents 34 6%
Cancer - Rectum 28 5%
Cancer - Stomach 23 4%
Valvular heart disease 21 3%
Cancer - Melanoma 19 3%
Other PAM 67 11%
PAM Total 616 100%
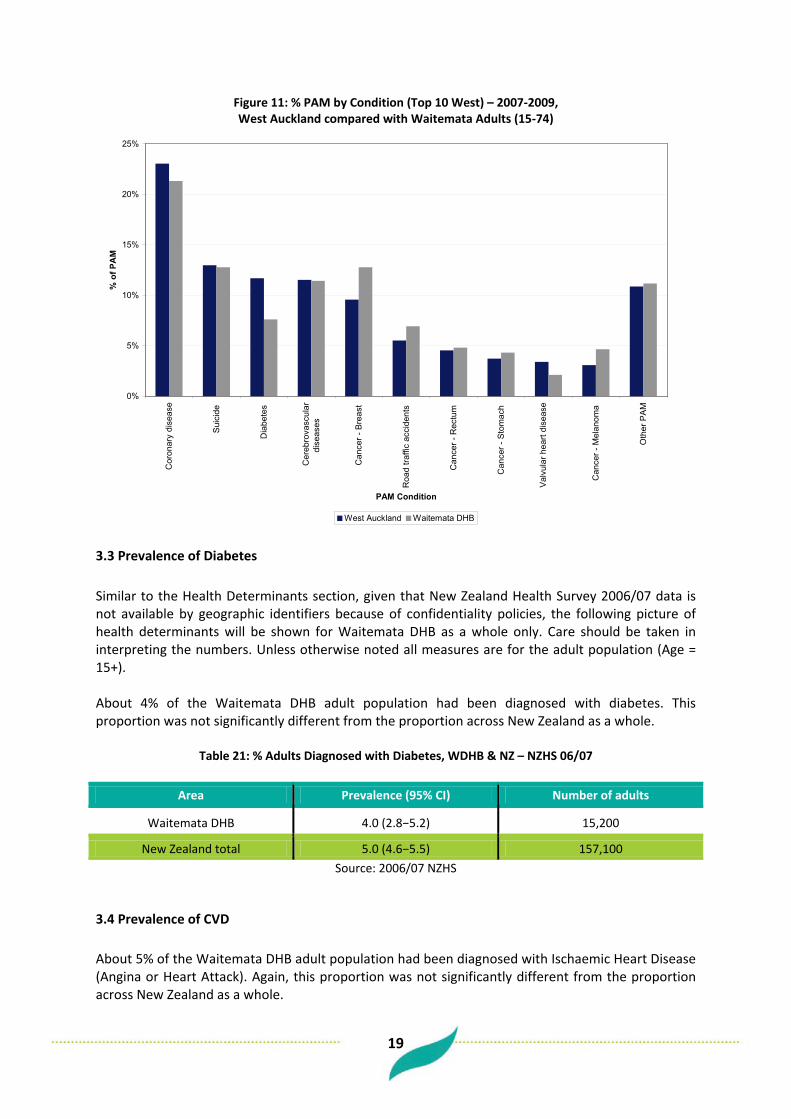
Figure 11 below shows the top 10 conditions which contributed to West Auckland PAM compared with how those same conditions were represented among Waitemata DHB’s potentially avoidable deaths.
19
Figure 11: % PAM by Condition (Top 10 West) – 2007-2009, West Auckland compared with Waitemata Adults (15-74)
0%
5%
10%
15%
20%
25%
Cor
onar
y di
seas
e
Sui
cide
Dia
bete
s
Cer
ebro
vasc
ular
dise
ases
Can
cer -
Bre
ast
Roa
d tra
ffic
acci
dent
s
Can
cer -
Rec
tum
Can
cer -
Sto
mac
h
Val
vula
r hea
rt di
seas
e
Can
cer -
Mel
anom
a
Oth
er P
AM
PAM Condition
% o
f PA
M
West Auckland Waitemata DHB
3.3 Prevalence of Diabetes Similar to the Health Determinants section, given that New Zealand Health Survey 2006/07 data is not available by geographic identifiers because of confidentiality policies, the following picture of health determinants will be shown for Waitemata DHB as a whole only. Care should be taken in interpreting the numbers. Unless otherwise noted all measures are for the adult population (Age = 15+). About 4% of the Waitemata DHB adult population had been diagnosed with diabetes. This proportion was not significantly different from the proportion across New Zealand as a whole.
Table 21: % Adults Diagnosed with Diabetes, WDHB & NZ – NZHS 06/07
Area Prevalence (95% CI) Number of adults
Waitemata DHB 4.0 (2.8−5.2) 15,200
New Zealand total 5.0 (4.6−5.5) 157,100 Source: 2006/07 NZHS
3.4 Prevalence of CVD About 5% of the Waitemata DHB adult population had been diagnosed with Ischaemic Heart Disease (Angina or Heart Attack). Again, this proportion was not significantly different from the proportion across New Zealand as a whole.

20
Table 22: % Adults Diagnosed with Ischaemic Heart Disease, WDHB & NZ – NZHS 06/07
Area Prevalence (95% CI) Number of adults
Waitemata DHB 4.8 (3.3−6.3) 18,100
New Zealand total 5.2 (4.7−5.6) 161,000 Source: 2006/07 NZHS
3.5 Prevalence of Asthma About 10% of the Waitemata DHB adult population were taking medication for asthma. This proportion also was not significantly different from the proportion across New Zealand as a whole.
Table 23: % Adults with Medicated Asthma, WDHB & NZ – NZHS 06/07
Area Prevalence (95% CI) Number of adults
Waitemata DHB 9.7 (7.5−11.9) 36,700
New Zealand total 11.2 (10.4−11.9) 348,400 Source: 2006/07 NZHS
21
4 Primary Care Services
4.1 PHO Enrolment and Utilisation Rate Given some unreliability in the recording of domiciles it is hard to give a completely accurate impression of the PHO Enrolment rate among West Auckland’s population. However, numbers for Waitemata DHB may provide some sort of guide. As of Quarter 1 2012 about 94% of Waitemata DHB’s population was enrolled with a PHO. According to the NZ Health Survey 2006/07, about 97% of the Waitemata DHB child population and 93% of the adult population had a primary health care provider that they went to first when needed. These proportions were not significantly different from the proportions across New Zealand as a whole.
Table 24: % Population with a Primary Health Care Provider, WDHB & NZ – NZHS 06/07
Area Prevalence in children (95% CI) Number of children Prevalence in
adults (95% CI) Number of adults
Waitemata DHB 97.1 (95.0–98.5) 101,100 92.8 (91.0–94.5) 351,400
New Zealand 97.4 (96.8–98.0) 832,200 93.8 (93.3–94.3) 2,928,500 Source: 2006/07 NZHS
PHO Enrolment numbers for the first quarter of 2012 showed lower enrolment rates among Waitemata DHB’s Asian and Maori/Pacific population compared to total enrolment rates. Similar rates could be expected among West Auckland’s population by ethnicity.
Table 25: % Waitemata DHB Population enrolled with a PHO, by ethnicity, 2012 Q1
Ethnicity % Population Enrolled
Maori & Pacific 85%
Asian 75%
Other 100%
Total 94%
Source: PHO Enrolment Database
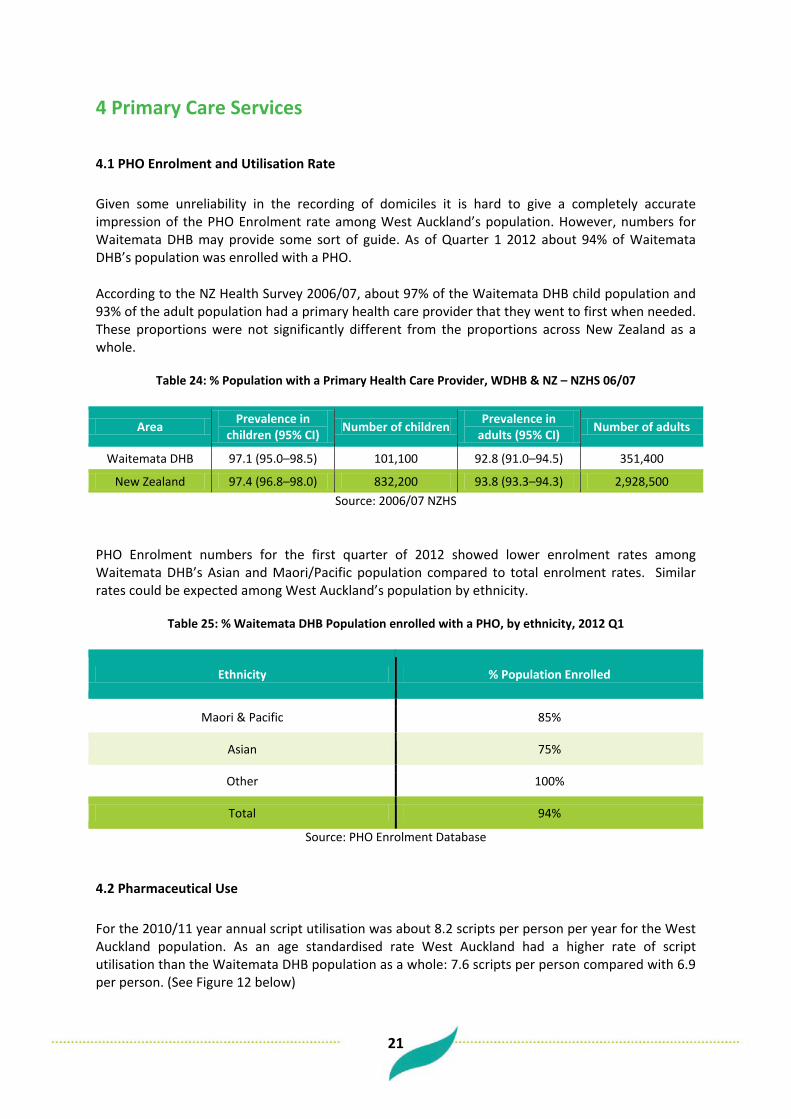
4.2 Pharmaceutical Use For the 2010/11 year annual script utilisation was about 8.2 scripts per person per year for the West Auckland population. As an age standardised rate West Auckland had a higher rate of script utilisation than the Waitemata DHB population as a whole: 7.6 scripts per person compared with 6.9 per person. (See Figure 12 below)

22
Figure 13 below shows where the burden of pharmaceutical use lies in terms of age compared to the structure of West Auckland’s population. Proportionately it is among the older population that the majority of pharmaceutical use lies.
Figure 12: Age Standardised Pharmaceutical Script Utilisation Rate, WDHB and West Auckland, 2010/11
6.97.6
0
1
2
3
4
5
6
7
8
9
Waitemata DHB West Auckland
Area
Scrip
t Util
isat
ion
Rate
(per
per
son)
Figure 13: West Auckland Pharmaceutical Use (Scripts) and West Auckland population, 2010/11, proportion by Age
0% 1% 2% 3% 4% 5% 6% 7% 8% 9% 10%
0 to 4
5 to 9
10 to 14
15 to 19
20 to 24
25 to 29
30 to 34
35 to 39
40 to 44
45 to 49
50 to 54
55 to 59
60 to 64
65 to 69
70 to 74
75 to 79
80 to 84
85+
Age
%
Population Scripts
23
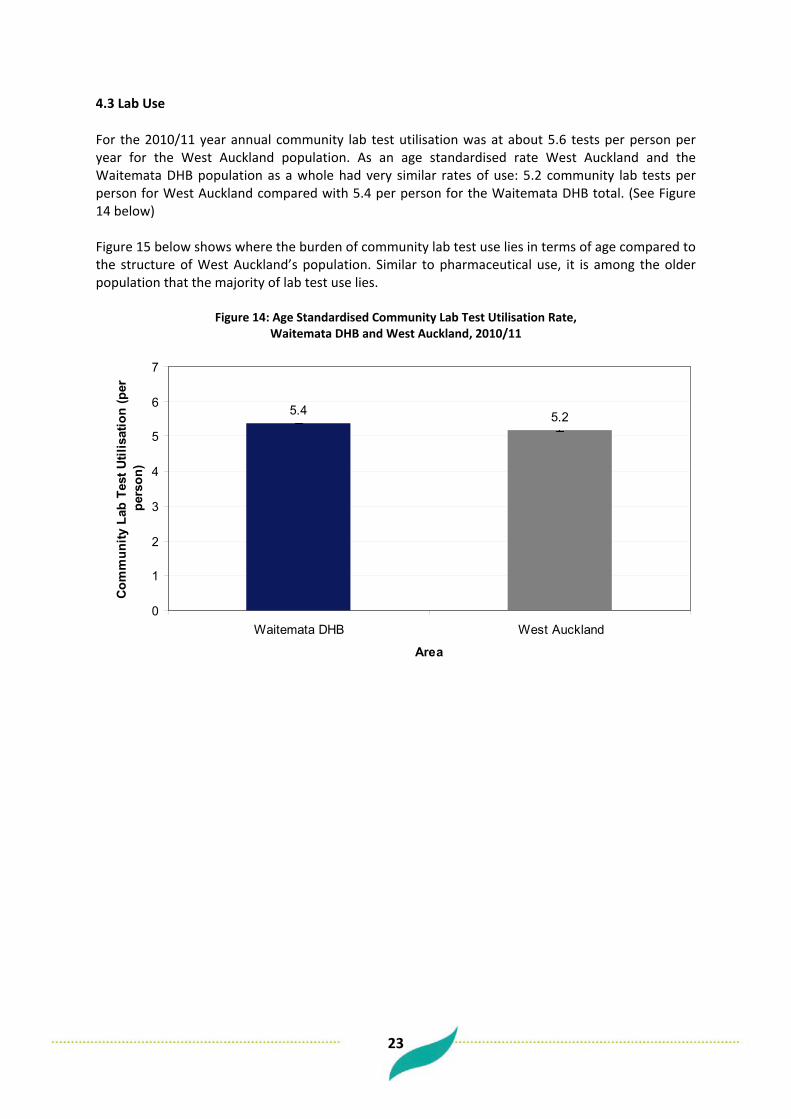
4.3 Lab Use For the 2010/11 year annual community lab test utilisation was at about 5.6 tests per person per year for the West Auckland population. As an age standardised rate West Auckland and the Waitemata DHB population as a whole had very similar rates of use: 5.2 community lab tests per person for West Auckland compared with 5.4 per person for the Waitemata DHB total. (See Figure 14 below) Figure 15 below shows where the burden of community lab test use lies in terms of age compared to the structure of West Auckland’s population. Similar to pharmaceutical use, it is among the older population that the majority of lab test use lies.
Figure 14: Age Standardised Community Lab Test Utilisation Rate, Waitemata DHB and West Auckland, 2010/11
5.4 5.2
0
1
2
3
4
5
6
7
Waitemata DHB West Auckland
Area
Com
mun
ity L
ab T
est U
tilis
atio
n (p
er
pers
on)

24
Figure 15: West Auckland Community Lab Test Use and West Auckland population, 2010/11, proportion by Age
0% 1% 2% 3% 4% 5% 6% 7% 8% 9% 10%
0 to 4
5 to 9
10 to 14
15 to 19
20 to 24
25 to 29
30 to 34
35 to 39
40 to 44
45 to 49
50 to 54
55 to 59
60 to 64
65 to 69
70 to 74
75 to 79
80 to 84
85+
Age
%
Population Lab Tests

25
5 Secondary Care Services
5.1 Avoidable Hospitalisations – PAH and ASH Potentially Avoidable Hospitalisations (PAH) are proxy indicators of ‘non-fatal’ avoidable health outcomes and are defined by the following three sub-categories:
Preventable hospitalisations (PH): hospitalisations resulting from diseases preventable through population-based health promotion strategies. Ambulatory-sensitive hospitalisations (ASH): hospitalisations resulting from diseases sensitive to prophylactic or therapeutic interventions deliverable in a primary health care setting. Injury-preventable hospitalisations (IP): hospitalisations avoidable through injury prevention.
In adults (15 years +), an upper age threshold of 75 years is used when reporting on PAH and ASH indicators as there is a high level of co-morbidities from age 75 years up. (Source: Perumal L. (2010). Health Needs Assessment of Middle Eastern, Latin American and African people living in the Auckland region. Auckland: Auckland District Health Board) This analysis of PAH excludes ‘Injury preventable hospitalisation’ data, as different preventive strategies are needed to address them. Further, only acute admissions are counted in this analysis as potentially avoidable.
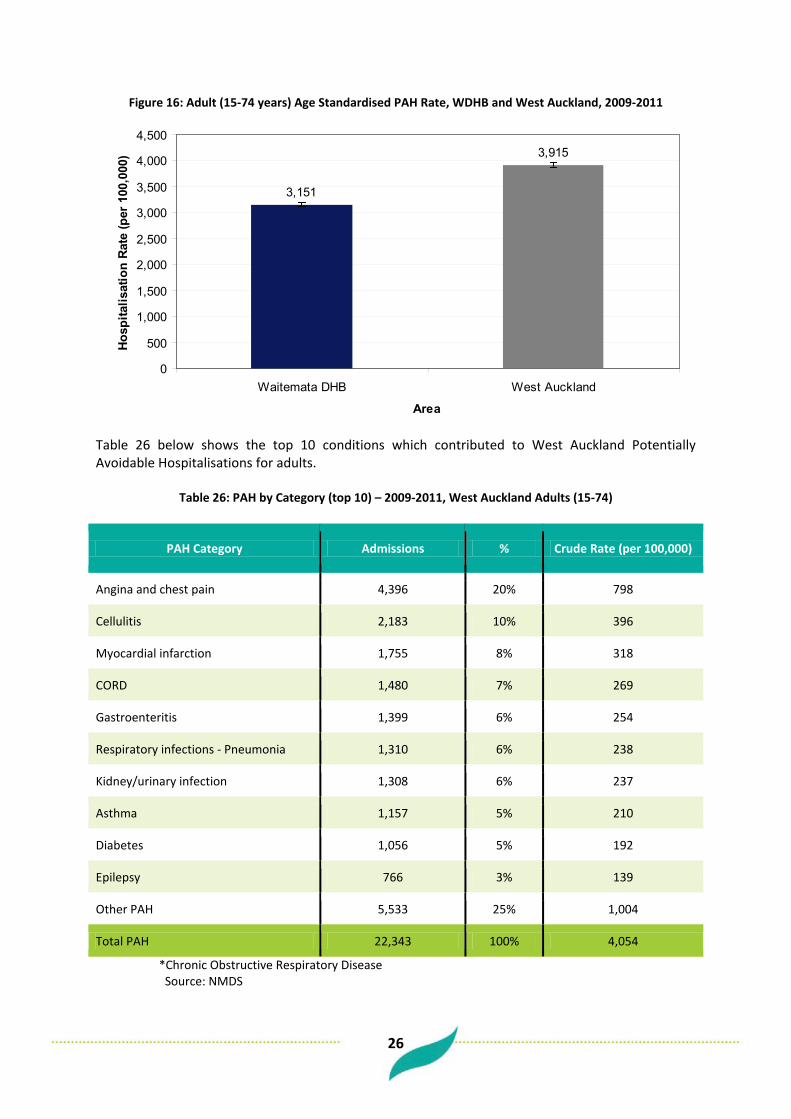
5.2 Potentially Avoidable Hospitalisations Of all acute hospital admissions for the West Auckland population over the three years 2009 – 2011, 24% of acute adult admissions (15-74) were potentially avoidable (22,000 admissions out of a total of 94,000 acute admissions). This was a higher proportion than the corresponding one for the Waitemata DHB population as a whole of 22%. Figure 16 shows that as an age-standardised rate, West Auckland had a much higher PAH rate than Waitemata DHB among adults.
26
Figure 16: Adult (15-74 years) Age Standardised PAH Rate, WDHB and West Auckland, 2009-2011
3,151
3,915
0
500
1,000
1,500
2,000
2,500
3,000
3,500
4,000
4,500
Waitemata DHB West Auckland
Area
Hosp
italis
atio
n Ra
te (p
er 1
00,0
00)
Table 26 below shows the top 10 conditions which contributed to West Auckland Potentially Avoidable Hospitalisations for adults.
Table 26: PAH by Category (top 10) – 2009-2011, West Auckland Adults (15-74)
PAH Category Admissions % Crude Rate (per 100,000)
Angina and chest pain 4,396 20% 798
Cellulitis 2,183 10% 396
Myocardial infarction 1,755 8% 318
CORD 1,480 7% 269
Gastroenteritis 1,399 6% 254
Respiratory infections - Pneumonia 1,310 6% 238
Kidney/urinary infection 1,308 6% 237
Asthma 1,157 5% 210
Diabetes 1,056 5% 192
Epilepsy 766 3% 139
Other PAH 5,533 25% 1,004
Total PAH 22,343 100% 4,054
*Chronic Obstructive Respiratory Disease Source: NMDS

27
Figure 17 below shows the top 10 conditions which contributed to West Auckland PAH compared with how those same conditions were represented among Waitemata DHB’s potentially avoidable hospitalisations.
Figure 18 shows that West Auckland’s Pacific population had the highest proportion of acute admissions considered as potentially avoidable (27%) and Asian the least (20%).
Figure 17: % PAH by Condition (Top 10 West) – 2009-2011, West Auckland compared with Waitemata Adults (15-74)
0%
5%
10%
15%
20%
25%
30%
Angi
na a
nd c
hest
pai
n
Cel
lulit
is
Myo
card
ial i
nfar
ctio
n
CO
RD
Gas
troen
terit
is
Res
pira
tory
infe
ctio
ns- P
neum
onia
Kidn
ey/u
rinar
yin
fect
ion
Asth
ma
Dia
bete
s
Epile
psy
Oth
er P
AH
PAH Category
% o
f PA
H
% West Auckland % Waitemata DHB

28
Figure 18: % Acute Admissions PAH – 2009-2011, West Auckland Adults (15-74) by Ethnicity
25%
27%
20%
23%24%
0%
10%
20%
30%
Mao
ri
Pac
ific
Asi
an
Oth
er
Tota
l
Ethnicity
% A
cute
Hos
pita
l Adm
issi
ons
Pote
ntia
lly A
void
able
Tables 27 to 30 below show which conditions contributed most to Potentially Avoidable hospitalisations for West Auckland’s population by ethnicity.
Table 27: PAH by Category (Top 10) – 2009-2011, West Auckland Adults (15-74) – Maori
PAH Category Admissions %
Angina and chest pain 522 14%
Cellulitis 460 12%
Asthma 304 8%
CORD 268 7%
Kidney/urinary infection 244 7%
Respiratory infections - Pneumonia 237 6%
Myocardial infarction 202 5%
Gastroenteritis 179 5%
Diabetes 167 5%
Epilepsy 158 4%
Other PAH 949 26%
Total PAH 3,690 100%
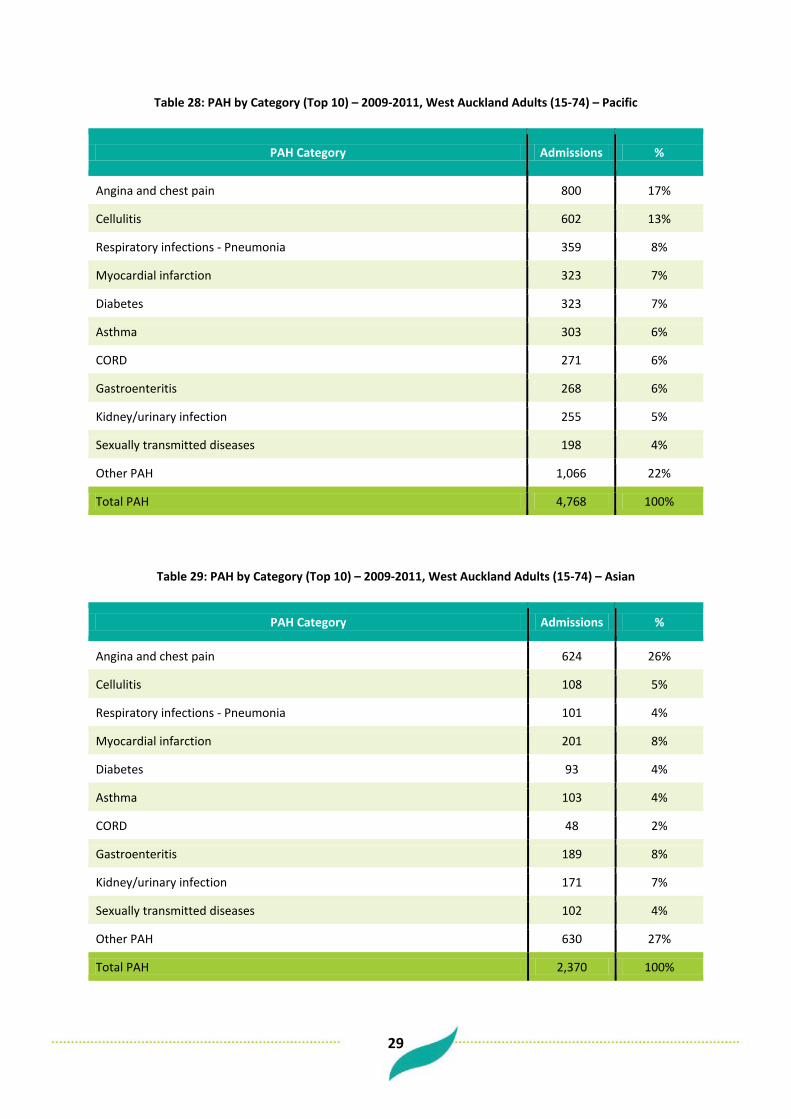
29
Table 28: PAH by Category (Top 10) – 2009-2011, West Auckland Adults (15-74) – Pacific
PAH Category Admissions %
Angina and chest pain 800 17%
Cellulitis 602 13%
Respiratory infections - Pneumonia 359 8%
Myocardial infarction 323 7%
Diabetes 323 7%
Asthma 303 6%
CORD 271 6%
Gastroenteritis 268 6%
Kidney/urinary infection 255 5%
Sexually transmitted diseases 198 4%
Other PAH 1,066 22%
Total PAH 4,768 100%
Table 29: PAH by Category (Top 10) – 2009-2011, West Auckland Adults (15-74) – Asian
PAH Category Admissions %
Angina and chest pain 624 26%
Cellulitis 108 5%
Respiratory infections - Pneumonia 101 4%
Myocardial infarction 201 8%
Diabetes 93 4%
Asthma 103 4%
CORD 48 2%
Gastroenteritis 189 8%
Kidney/urinary infection 171 7%
Sexually transmitted diseases 102 4%
Other PAH 630 27%
Total PAH 2,370 100%

30
Table 30: PAH by Category (Top 10) – 2009-2011, West Auckland Adults (15-74) – Other
PAH Category Admissions %
Angina and chest pain 2,451 21%
Myocardial infarction 1,030 9%
Cellulitis 1,014 9%
CORD 893 8%
Gastroenteritis 763 7%
Kidney/urinary infection 640 6%
Respiratory infections - Pneumonia 613 5%
Alcohol related conditions 497 4%
Diabetes 473 4%
Asthma 448 4%
Other PAH 2,700 23%
Total PAH 11,522 100% Source: NMDS
5.3 Ambulatory Sensitive Hospitalisations Of all acute hospital admissions for the West Auckland adult population (15-74) over the three years 2009 – 2011, 17% were ambulatory sensitive (16,000 admissions out of a total of 94,000 acute admissions). This was a higher proportion than the corresponding rate for the Waitemata DHB population as a whole of 15%. Expressed as an age-standardised rate, West Auckland had a much higher ASH rate than Waitemata DHB among adults.
Figure 19: Adult (15-74 years) Age Standardised ASH Rate, WDHB and West Auckland, 2009-2011
2,242
2,819
0
500
1,000
1,500
2,000
2,500
3,000
3,500
Waitemata DHB West Auckland
Area
Hosp
italis
atio
n Ra
te (p
er 1
00,0
00)

31
Table 31 shows the top 10 conditions which contributed to West Auckland Ambulatory Sensitive Hospitalisations for adults. (Important to note is that due to the fact that some ASH condition admissions are weighted, differences will be evident between ASH numbers and PAH numbers (e.g. For hospitalisation due to Angina and Chest Pain the ASH definition determines that only half of these are ambulatory sensitive). (See Appendix 5 for more detail)
Table 31: ASH by Category (Top 10) – 2009-2011, West Auckland Adults (15-74)
ASH Category Admissions % Crude Rate (per 100,000)
Angina and chest pain 2,198 14% 399 Cellulitis 2,137 13% 388 Gastroenteritis/dehydration 1,653 10% 300 Kidney/urinary infection 1,322 8% 240 Respiratory infections - Pneumonia 1,310 8% 238 Asthma 1,157 7% 210 Diabetes 1,056 7% 192 Myocardial infarction 878 5% 159 Epilepsy 766 5% 139 Upper respiratory tract and ENT infections 638 4% 116 Other ASH 2,883 18% 523 Total ASH 15,997 100% 2,902 Figure 20 below shows the top 10 conditions which contributed to West Auckland ASH compared with how those same conditions were represented among Waitemata DHB’s ASH.
Figure 20: % ASH by Condition (Top 10 West) – 2009-2011, West Auckland compared with Waitemata Adults (15-74)
0%
5%
10%
15%
20%
25%
Angi
na a
nd c
hest
pai
n
Cel
lulit
is
Gas
troen
terit
is/d
ehyd
ratio
n
Kidn
ey/u
rinar
y in
fect
ion
Res
pira
tory
infe
ctio
ns -
Pneu
mon
ia
Asth
ma
Dia
bete
s
Myo
card
ial i
nfar
ctio
n
Epile
psy
Upp
er re
spira
tory
trac
t and
ENT
infe
ctio
ns
Oth
er A
SH
ASH Category
% o
f ASH
% West Auckland % Waitemata DHB

32
5.4 CVD Admissions Over the three years 2009 – 2011, there were 12,400 hospital admissions with a CVD primary diagnosis from West Auckland’s adult population (15+) (electives and acutes). Figure 21 shows that as an age-standardised rate West Auckland had a higher rate of CVD admissions than that of Waitemata DHB’s adult population. Figure 22 below shows where the burden lies in terms of age.
Figure 21: Age Standardised CVD Admission Rate, WDHB and West Auckland, 2009-2011
1,563
1,900
0
500
1,000
1,500
2,000
2,500
Waitemata DHB West Auckland
Area
Hos
pita
lisat
ion
Rat
e (p
er 1
00,0
00)
Figure 22: West Auckland CVD Admissions and West Auckland Population,
2009-2011, proportion by Age
0% 2% 4% 6% 8% 10% 12% 14%
0 to 4
5 to 9
10 to 14
15 to 19
20 to 24
25 to 29
30 to 34
35 to 39
40 to 44
45 to 49
50 to 54
55 to 59
60 to 64
65 to 69
70 to 74
75 to 79
80 to 84
85+
Age
%
Population CVD Admissions
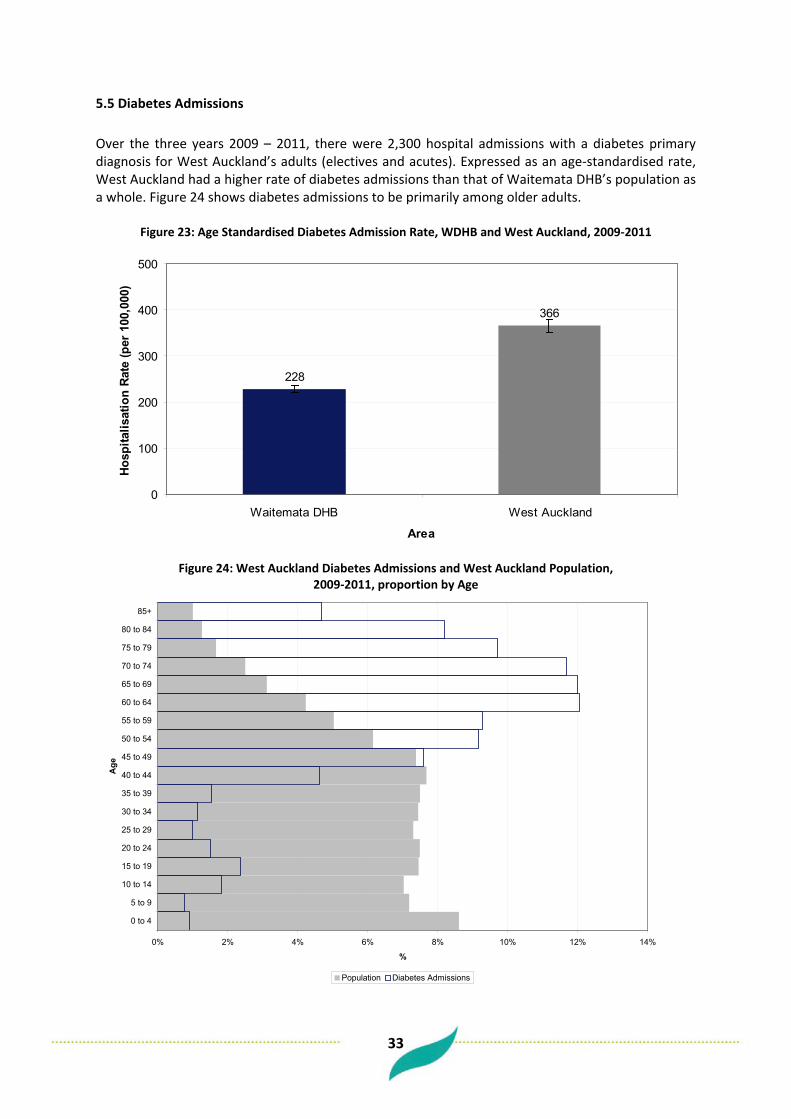
33
5.5 Diabetes Admissions Over the three years 2009 – 2011, there were 2,300 hospital admissions with a diabetes primary diagnosis for West Auckland’s adults (electives and acutes). Expressed as an age-standardised rate, West Auckland had a higher rate of diabetes admissions than that of Waitemata DHB’s population as a whole. Figure 24 shows diabetes admissions to be primarily among older adults.
Figure 23: Age Standardised Diabetes Admission Rate, WDHB and West Auckland, 2009-2011
228
366
0
100
200
300
400
500
Waitemata DHB West Auckland
Area
Hosp
italis
atio
n Ra
te (p
er 1
00,0
00)
Figure 24: West Auckland Diabetes Admissions and West Auckland Population,
2009-2011, proportion by Age
0% 2% 4% 6% 8% 10% 12% 14%
0 to 4
5 to 9
10 to 14
15 to 19
20 to 24
25 to 29
30 to 34
35 to 39
40 to 44
45 to 49
50 to 54
55 to 59
60 to 64
65 to 69
70 to 74
75 to 79
80 to 84
85+
Age
%
Population Diabetes Admissions
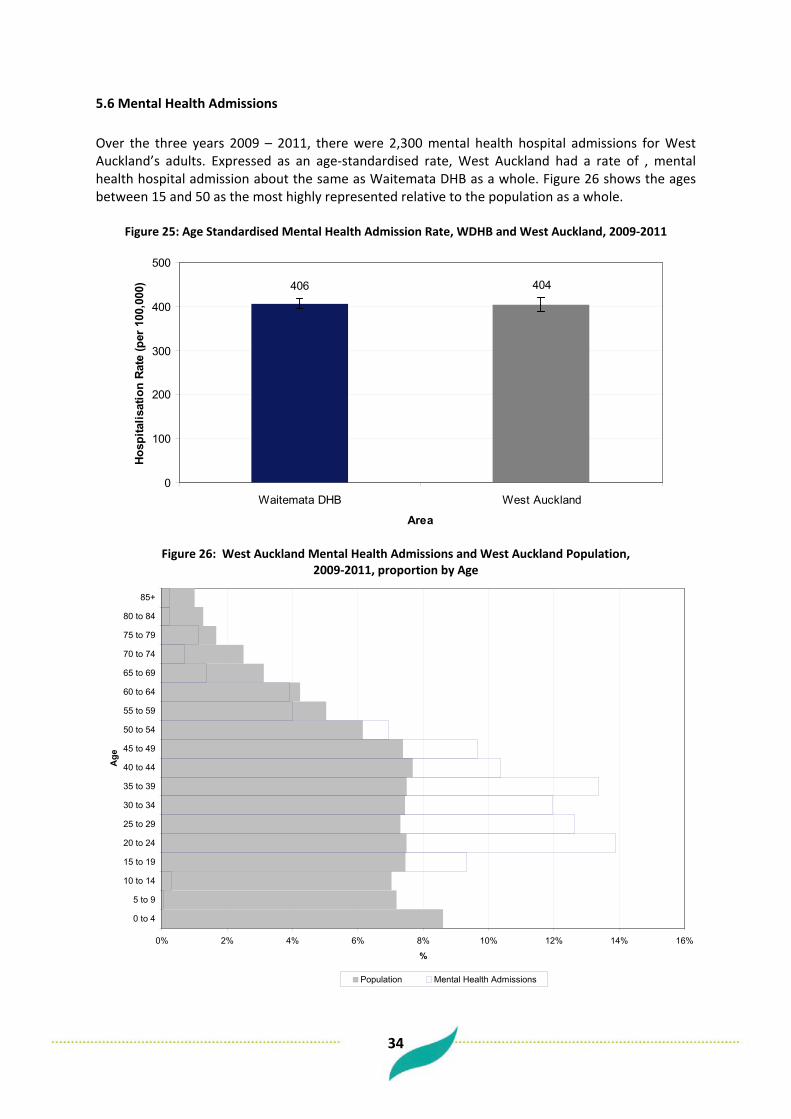
34
5.6 Mental Health Admissions Over the three years 2009 – 2011, there were 2,300 mental health hospital admissions for West Auckland’s adults. Expressed as an age-standardised rate, West Auckland had a rate of , mental health hospital admission about the same as Waitemata DHB as a whole. Figure 26 shows the ages between 15 and 50 as the most highly represented relative to the population as a whole.
Figure 25: Age Standardised Mental Health Admission Rate, WDHB and West Auckland, 2009-2011
406 404
0
100
200
300
400
500
Waitemata DHB West Auckland
Area
Hosp
italis
atio
n Ra
te (p
er 1
00,0
00)
Figure 26: West Auckland Mental Health Admissions and West Auckland Population,
2009-2011, proportion by Age
0% 2% 4% 6% 8% 10% 12% 14% 16%
0 to 4
5 to 9
10 to 14
15 to 19
20 to 24
25 to 29
30 to 34
35 to 39
40 to 44
45 to 49
50 to 54
55 to 59
60 to 64
65 to 69
70 to 74
75 to 79
80 to 84
85+
Age
%
Population Mental Health Admissions
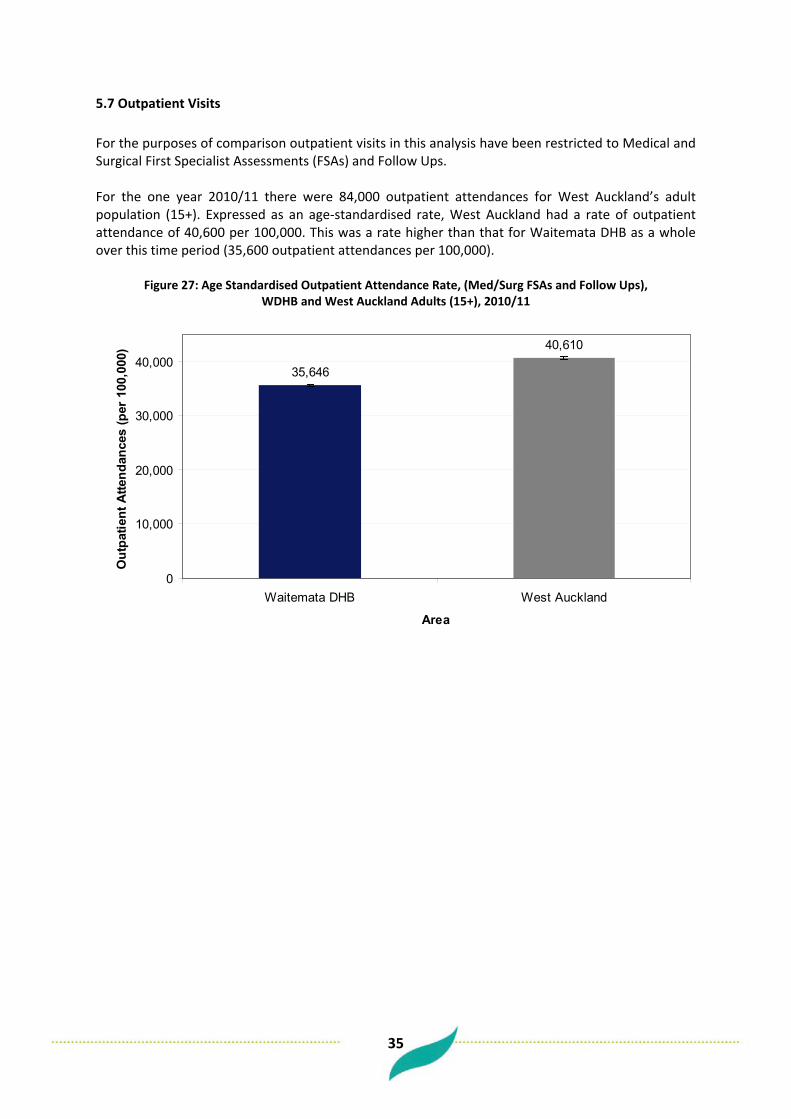
35
5.7 Outpatient Visits For the purposes of comparison outpatient visits in this analysis have been restricted to Medical and Surgical First Specialist Assessments (FSAs) and Follow Ups. For the one year 2010/11 there were 84,000 outpatient attendances for West Auckland’s adult population (15+). Expressed as an age-standardised rate, West Auckland had a rate of outpatient attendance of 40,600 per 100,000. This was a rate higher than that for Waitemata DHB as a whole over this time period (35,600 outpatient attendances per 100,000).
Figure 27: Age Standardised Outpatient Attendance Rate, (Med/Surg FSAs and Follow Ups), WDHB and West Auckland Adults (15+), 2010/11
35,646
40,610
0
10,000
20,000
30,000
40,000
Waitemata DHB West Auckland
Area
Out
patie
nt A
ttend
ance
s (p
er 1
00,0
00)
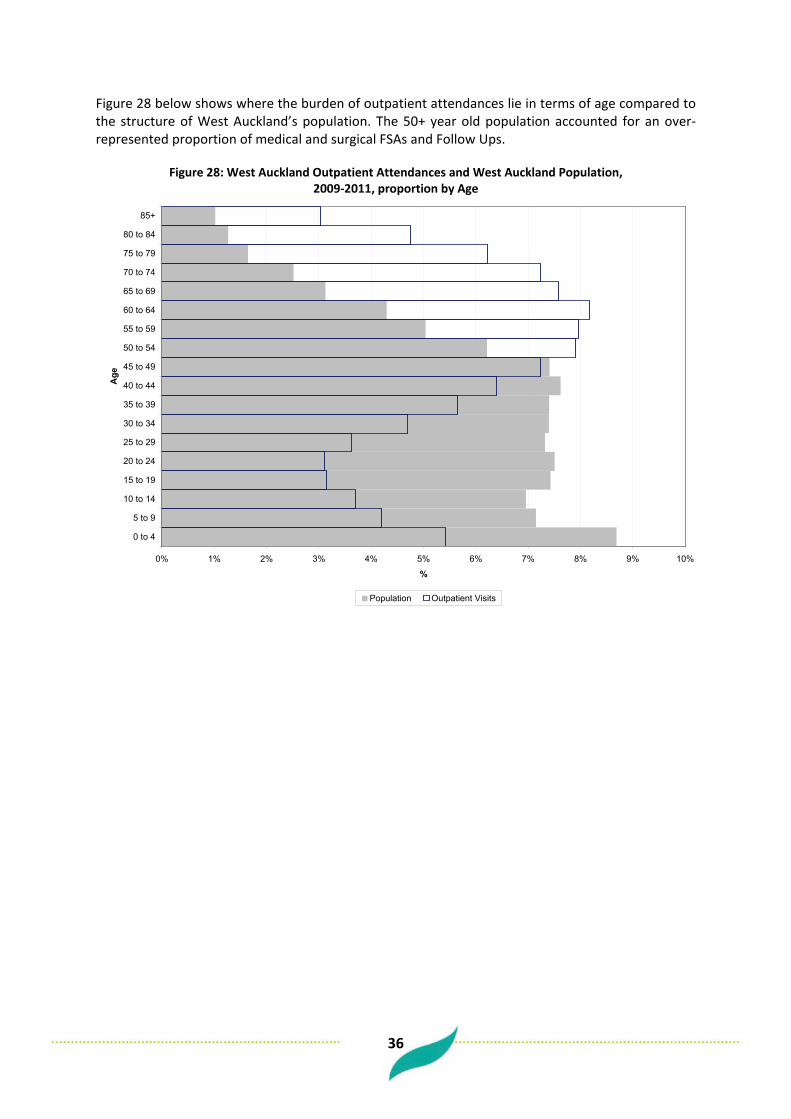
36
Figure 28 below shows where the burden of outpatient attendances lie in terms of age compared to the structure of West Auckland’s population. The 50+ year old population accounted for an over-represented proportion of medical and surgical FSAs and Follow Ups.
Figure 28: West Auckland Outpatient Attendances and West Auckland Population,
2009-2011, proportion by Age
0% 1% 2% 3% 4% 5% 6% 7% 8% 9% 10%
0 to 4
5 to 9
10 to 14
15 to 19
20 to 24
25 to 29
30 to 34
35 to 39
40 to 44
45 to 49
50 to 54
55 to 59
60 to 64
65 to 69
70 to 74
75 to 79
80 to 84
85+
Age
%
Population Outpatient Visits

37
5.8 Emergency Department Attendances For the one year 2010/11, there were 41,600 Emergency Department visits from West Auckland’s adult (15+) population. Expressed as an age-standardised rate, West Auckland had a rate of ED attendance of 20,800 per 100,000 adults. This was a rate higher than that for Waitemata DHB as a whole over this time period (17,900 ED visits per 100,000). Figure 30 shows the 0-4 population as well over-represented in ED attendances relative to West Auckland’s total population.
Figure 29: Age Standardised Emergency Department Visit Rate, WDHB and West Auckland, 2010/11
17,855
20,815
0
5,000
10,000
15,000
20,000
25,000
Waitemata DHB West Auckland
Area
ED V
isits
(per
100
,000
)
Figure 30: West Auckland ED Visits and West Auckland Population, 2009-2011, proportion by Age
0% 2% 4% 6% 8% 10% 12% 14% 16% 18%
0 to 4
5 to 9
10 to 14
15 to 19
20 to 24
25 to 29
30 to 34
35 to 39
40 to 44
45 to 49
50 to 54
55 to 59
60 to 64
65 to 69
70 to 74
75 to 79
80 to 84
85+
Age
%
Population ED Visits
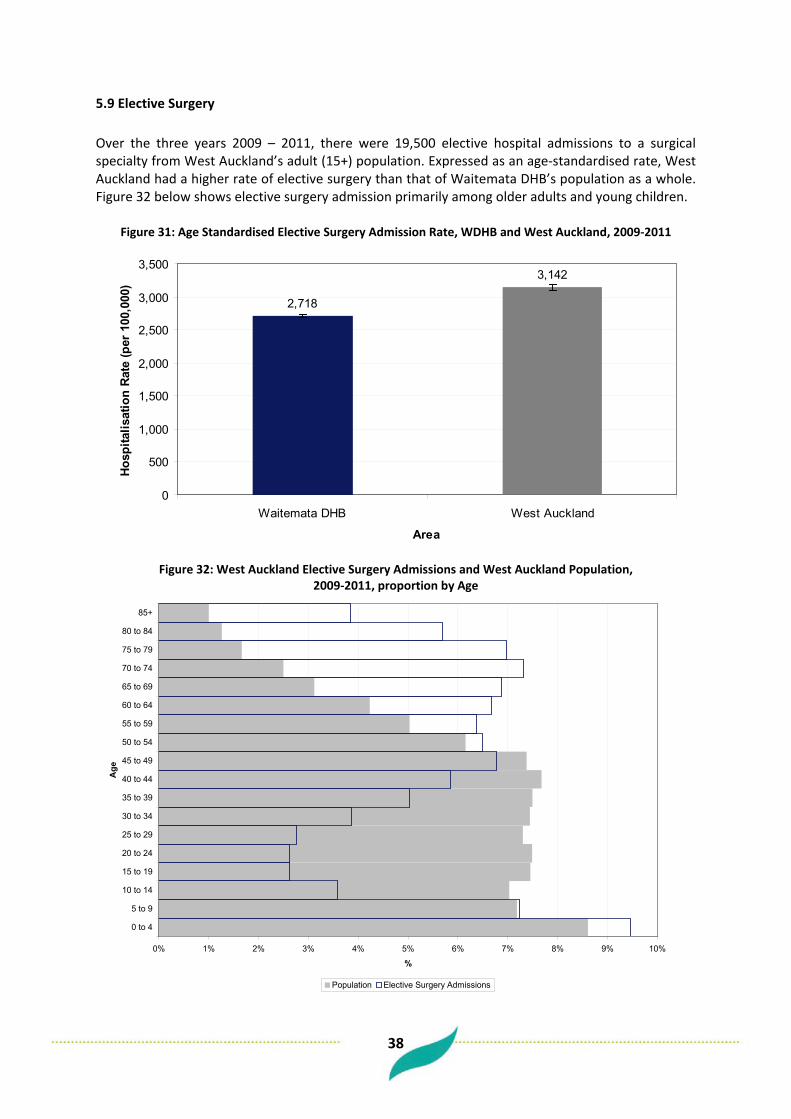
38
5.9 Elective Surgery Over the three years 2009 – 2011, there were 19,500 elective hospital admissions to a surgical specialty from West Auckland’s adult (15+) population. Expressed as an age-standardised rate, West Auckland had a higher rate of elective surgery than that of Waitemata DHB’s population as a whole. Figure 32 below shows elective surgery admission primarily among older adults and young children.
Figure 31: Age Standardised Elective Surgery Admission Rate, WDHB and West Auckland, 2009-2011
2,718
3,142
0
500
1,000
1,500
2,000
2,500
3,000
3,500
Waitemata DHB West Auckland
Area
Hosp
italis
atio
n Ra
te (p
er 1
00,0
00)
Figure 32: West Auckland Elective Surgery Admissions and West Auckland Population,
2009-2011, proportion by Age
0% 1% 2% 3% 4% 5% 6% 7% 8% 9% 10%
0 to 4
5 to 9
10 to 14
15 to 19
20 to 24
25 to 29
30 to 34
35 to 39
40 to 44
45 to 49
50 to 54
55 to 59
60 to 64
65 to 69
70 to 74
75 to 79
80 to 84
85+
Age
%
Population Elective Surgery Admissions

39
6 Child Health
6.1 Infant Mortality Infant mortality is an important measure of social wellbeing. For the three years 2007-2009 there were 45 live born infants who died before one year of life from West Auckland. For this period the infant mortality rate for West Auckland was 3.9 infant deaths per 1,000 live births. This was a higher infant mortality rate than that of Waitemata DHB as a whole for this period but the difference was not statistically significant. (See Figure 33 below)
Figure 33: Infant Mortality Rate (per 1,000 live births), WDHB and West Auckland, 2007-2009
3.1
3.9
0
1
2
3
4
5
6
WDHB West Auckland
Area
Infa
nt M
orta
lity
Rate
(per
1,0
00 li
ve b
irth
s)
6.2 SUDI Sudden Unexpected Death in Infancy (SUDI) accounts for all deaths of live born infants before one year of life where the cause of death is attributed to SIDS (Sudden Infant Death Syndrome), Accidental Suffocation / Strangulation in Bed, or death from Ill-Defined / Unspecified causes. For the three years 2007-2009 there were 11 live born infants who died before one year of life in West Auckland with SUDI as the cause of death. For this period the infant mortality rate with SUDI as cause of death for West Auckland was 1 per 1,000 live births. This was a similar SUDI mortality rate to that of Waitemata DHB as a whole; 0.6 SUDI deaths per 1,000 live births. (See Figure 34 below) Maori had a higher SUDI rate but due to small numbers of SUDI no more analysis by ethnicity could be done.
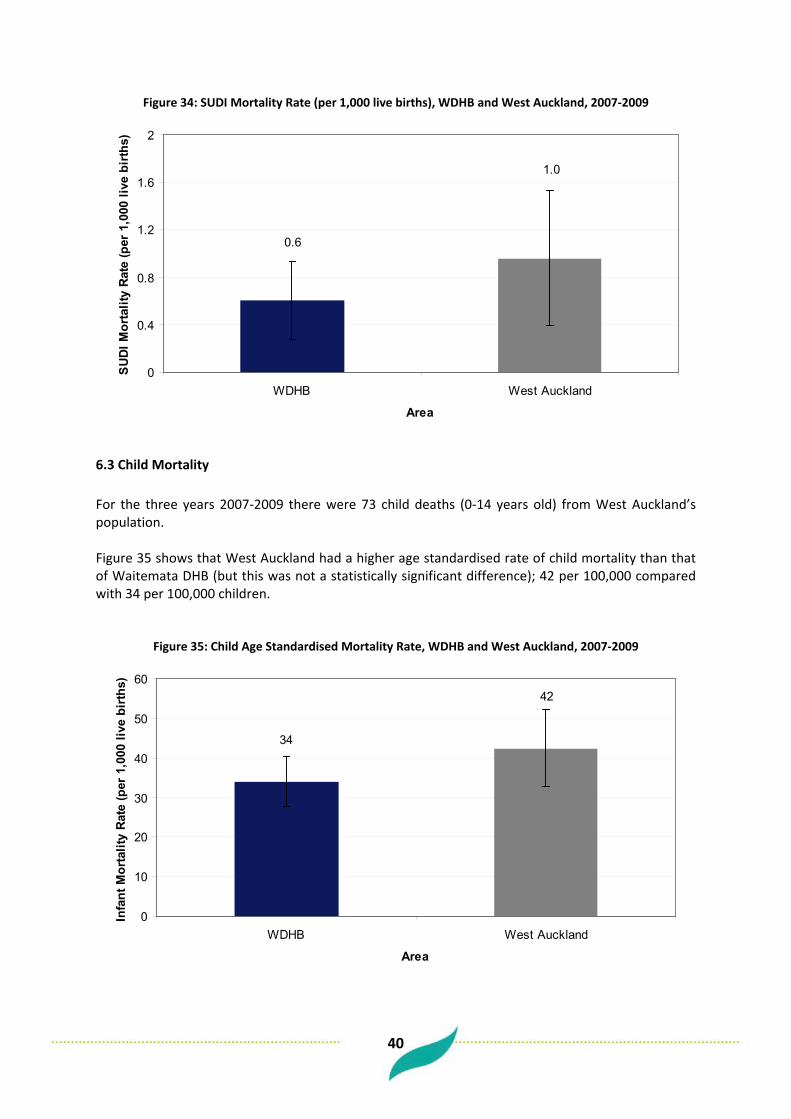
40
Figure 34: SUDI Mortality Rate (per 1,000 live births), WDHB and West Auckland, 2007-2009
1.0
0.6
0
0.4
0.8
1.2
1.6
2
WDHB West Auckland
Area
SU
DI M
orta
lity
Rat
e (p
er 1
,000
live
bir
ths)
6.3 Child Mortality For the three years 2007-2009 there were 73 child deaths (0-14 years old) from West Auckland’s population. Figure 35 shows that West Auckland had a higher age standardised rate of child mortality than that of Waitemata DHB (but this was not a statistically significant difference); 42 per 100,000 compared with 34 per 100,000 children.
Figure 35: Child Age Standardised Mortality Rate, WDHB and West Auckland, 2007-2009
42
34
0
10
20
30
40
50
60
WDHB West Auckland
Area
Infa
nt M
orta
lity
Rat
e (p
er 1
,000
live
bir
ths)
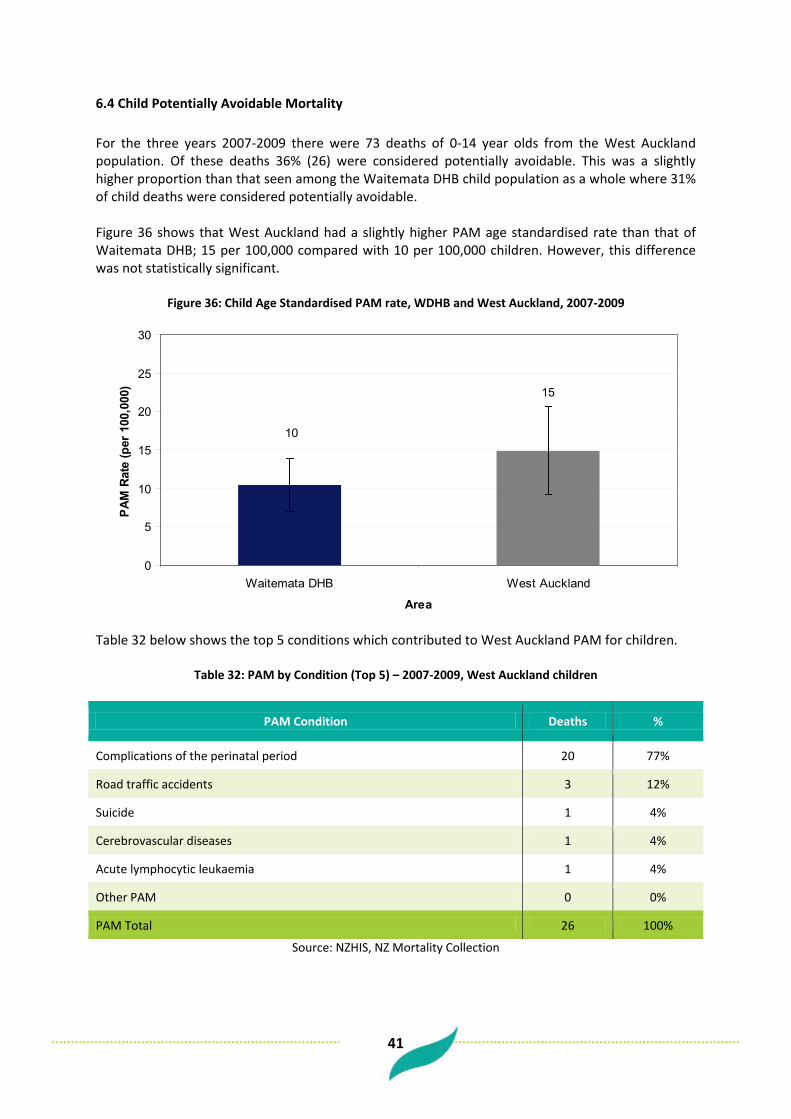
41
6.4 Child Potentially Avoidable Mortality For the three years 2007-2009 there were 73 deaths of 0-14 year olds from the West Auckland population. Of these deaths 36% (26) were considered potentially avoidable. This was a slightly higher proportion than that seen among the Waitemata DHB child population as a whole where 31% of child deaths were considered potentially avoidable. Figure 36 shows that West Auckland had a slightly higher PAM age standardised rate than that of Waitemata DHB; 15 per 100,000 compared with 10 per 100,000 children. However, this difference was not statistically significant.
Figure 36: Child Age Standardised PAM rate, WDHB and West Auckland, 2007-2009
10
15
0
5
10
15
20
25
30
Waitemata DHB West Auckland
Area
PAM
Rat
e (p
er 1
00,0
00)
Table 32 below shows the top 5 conditions which contributed to West Auckland PAM for children.
Table 32: PAM by Condition (Top 5) – 2007-2009, West Auckland children
PAM Condition Deaths %
Complications of the perinatal period 20 77%
Road traffic accidents 3 12%
Suicide 1 4%
Cerebrovascular diseases 1 4%
Acute lymphocytic leukaemia 1 4%
Other PAM 0 0%
PAM Total 26 100%
Source: NZHIS, NZ Mortality Collection
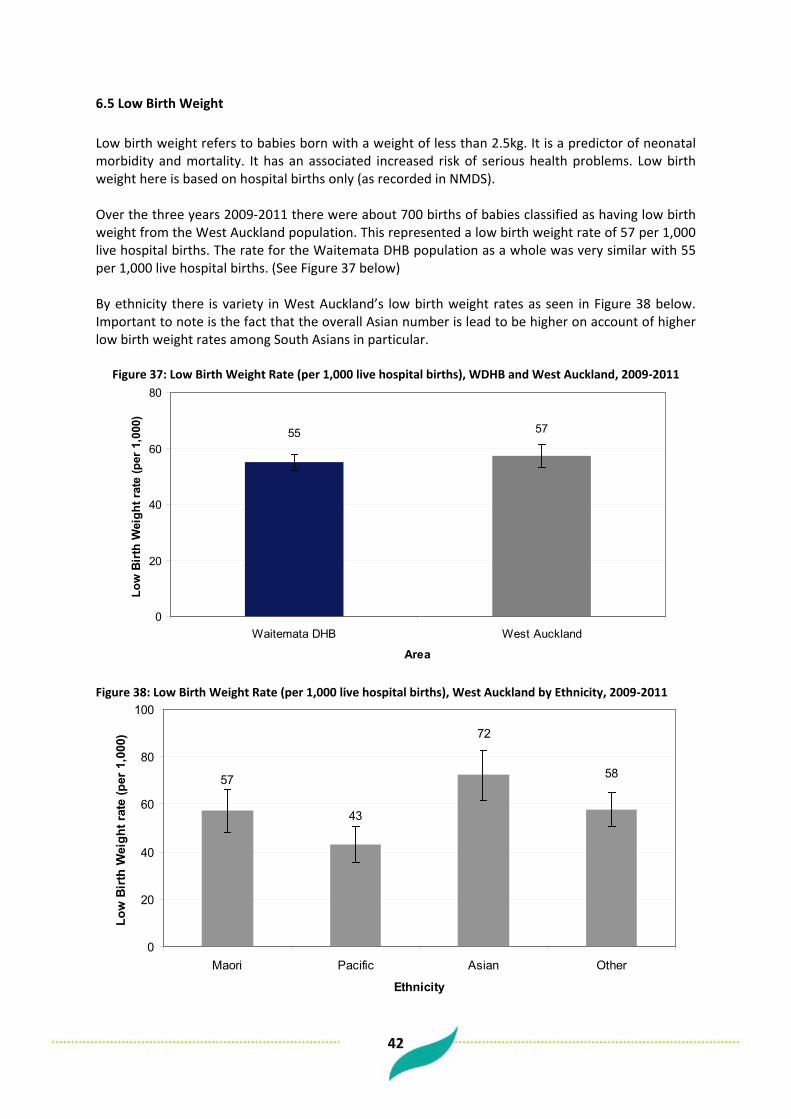
42
6.5 Low Birth Weight Low birth weight refers to babies born with a weight of less than 2.5kg. It is a predictor of neonatal morbidity and mortality. It has an associated increased risk of serious health problems. Low birth weight here is based on hospital births only (as recorded in NMDS). Over the three years 2009-2011 there were about 700 births of babies classified as having low birth weight from the West Auckland population. This represented a low birth weight rate of 57 per 1,000 live hospital births. The rate for the Waitemata DHB population as a whole was very similar with 55 per 1,000 live hospital births. (See Figure 37 below) By ethnicity there is variety in West Auckland’s low birth weight rates as seen in Figure 38 below. Important to note is the fact that the overall Asian number is lead to be higher on account of higher low birth weight rates among South Asians in particular.
Figure 37: Low Birth Weight Rate (per 1,000 live hospital births), WDHB and West Auckland, 2009-2011
5755
0
20
40
60
80
Waitemata DHB West Auckland
Area
Low
Birt
h W
eigh
t rat
e (p
er 1
,000
)
Figure 38: Low Birth Weight Rate (per 1,000 live hospital births), West Auckland by Ethnicity, 2009-2011
58
72
57
43
0
20
40
60
80
100
Maori Pacific Asian Other
Ethnicity
Low
Bir
th W
eigh
t rat
e (p
er 1
,000
)

43
6.6 Immunisation With unavailability of immunisation data at the locality level of West Auckland, the rates for Waitemata DHB below give some sort of guide to immunisation rates in the locality. Particularly important is the difference in immunisation rates evident between ethnicities. The following tables show immunisation coverage for children who have reached the milestone ages (6 months, 12 months, 18 months, 24 months, 5 years) and who have completed their age appropriate immunisations. When looked at by ethnicity among Waitemata DHB children, Maori children show lower rates of coverage at each age group while Asian children show higher rates of coverage at each milestone age than the comparable totals.
Table 33: Immunisation Coverage for WDHB Children by milestone age, 12/02/2012 – 11/05/2012
Milestone Age No. Eligible Fully Immunised for Age %
6 Month 2,032 1,493 73%
12 Month 1,884 1,729 92%
18 Month 2,086 1,737 83%
24 Month 1,973 1,836 93%
5 Year 1,994 1,573 79%
Source: National Immunisation Register
Table 34: Immunisation Coverage for WDHB Children by milestone age, 12/02/2012 – 11/05/2012, ethnicity
Milestone Age Maori Pacific Asian Other Total
6 Month 58% 67% 88% 75% 73%
12 Month 88% 96% 97% 90% 92%
18 Month 75% 86% 91% 83% 83%
24 Month 92% 97% 97% 91% 93%
5 Year 73% 81% 80% 80% 79%
Source: National Immunisation Register

44
6.7 Prevalence of Asthma There is no reliable data for West Auckland measuring asthma prevalence. However, the WDHB rate from the New Zealand Health Survey will be suggestive. According to the NZHS 06/07, about 14% of the Waitemata DHB child population were taking medication for asthma. This proportion was not significantly different from the proportion across New Zealand as a whole.
Table 35: % Children with Medicated Asthma, WDHB & NZ – NZHS 06/07
DHB Prevalence (95% CI) Number of children
Waitemata 13.9 (9.3−18.5) 12500
New Zealand 14.8 (13.5−16.2) 109,900
Source: 2006/07 NZHS
6.8 Avoidable Hospitalisations – PAH and ASH
6.9 Potentially Avoidable Hospitalisations Of all acute hospital admissions for the West Auckland child population (0-14) over the three years 2009 – 2011, 24% were potentially avoidable (8,500 admissions out of a total of 35,000 acute admissions). This was a higher proportion than the corresponding rate for the Waitemata DHB population as a whole of 21%. Expressed as an age-standardised rate, West Auckland had a higher rate of Potentially Avoidable Hospitalisation than Waitemata DHB among children.
Figure 39: Child Age Standardised PAH Rate, WDHB and West Auckland, 2009-2011
3,899
4,639
0
500
1,000
1,500
2,000
2,500
3,000
3,500
4,000
4,500
5,000
5,500
Waitemata DHB West Auckland
Area
Hos
pita
lisat
ion
Rat
e (p
er 1
00,0
00)

45
Table 36 below shows the top 10 conditions which contributed to PAH for West Auckland’s children.
Table 36: PAH by Category (Top 10) – 2009-2011, West Auckland Children
PAH Category Admissions %
Respiratory infections - Acute bronchiolitis 1,456 17%
Asthma 1,219 14%
Gastroenteritis 1,179 14%
Cellulitis 1,021 12%
Respiratory infections - Pneumonia 926 11%
Respiratory infections - Other 712 8%
Epilepsy 531 6%
Kidney/urinary infection 383 5%
ENT infections 335 4%
Dental conditions 119 1%
Other PAH 592 7%
Total 8,473 100%
Source: NMDS
6.10 Ambulatory Sensitive Hospitalisations Of all acute hospital admissions for the West Auckland child population over the three years 2009 – 2011, 18% were ambulatory sensitive (6,000 admissions out of a total of 35,000 acute admissions over three years). This was a higher proportion than the corresponding one for the Waitemata DHB population as a whole of 16%. Expressed as an age-standardised rate, West Auckland had a higher rate of Ambulatory Sensitive Hospitalisation than Waitemata DHB among children.

46
Figure 40: Child Age Standardised ASH Rate, WDHB and West Auckland, 2009-2011
2,849
3,377
0
500
1,000
1,500
2,000
2,500
3,000
3,500
4,000
Waitemata DHB West Auckland
Area
Hosp
italis
atio
n Ra
te (p
er 1
00,0
00)
Table 37 below shows the top 10 conditions which contributed to ASH for West Auckland children.
Table 37: ASH by Category (Top 10) – 2009-2011, West Auckland Children
ASH Category Admissions %
Gastroenteritis/dehydration 1,311 22%
Asthma 1,219 20%
Cellulitis 997 16%
Respiratory infections - Pneumonia 926 15%
Upper respiratory tract and ENT infections 901 15%
Constipation 171 3%
Dermatitis & eczema 143 2%
Kidney/urinary infection 123 2%
Dental conditions 110 2%
GORD (Gastro-oesophageal reflux disease) 66 1%
Other ASH 125 2%
Total 6,092 100%
Source: NMDS

47
6.11 Asthma Admissions Over the three years 2009-2011 there were 1,200 hospital admissions for West Auckland children with a primary diagnosis of asthma. This represented an age-standardised rate of 683 admissions per 100,000 children, a rate significantly higher than the Waitemata DHB rate of 559 admissions per 100,000 children. (See Figure 41) These rates varied by ethnicity with both Maori and Pacific children having rates of asthma admission higher than the rest. (See Figure 42 below)
Figure 41: Child Age Standardised Rate – Asthma Admissions, WDHB and West Auckland, 2009-2011
559
683
0
100
200
300
400
500
600
700
800
Waitemata DHB West Auckland
Area
Hosp
italis
atio
n Ra
te (p
er 1
00,0
00
child
ren)
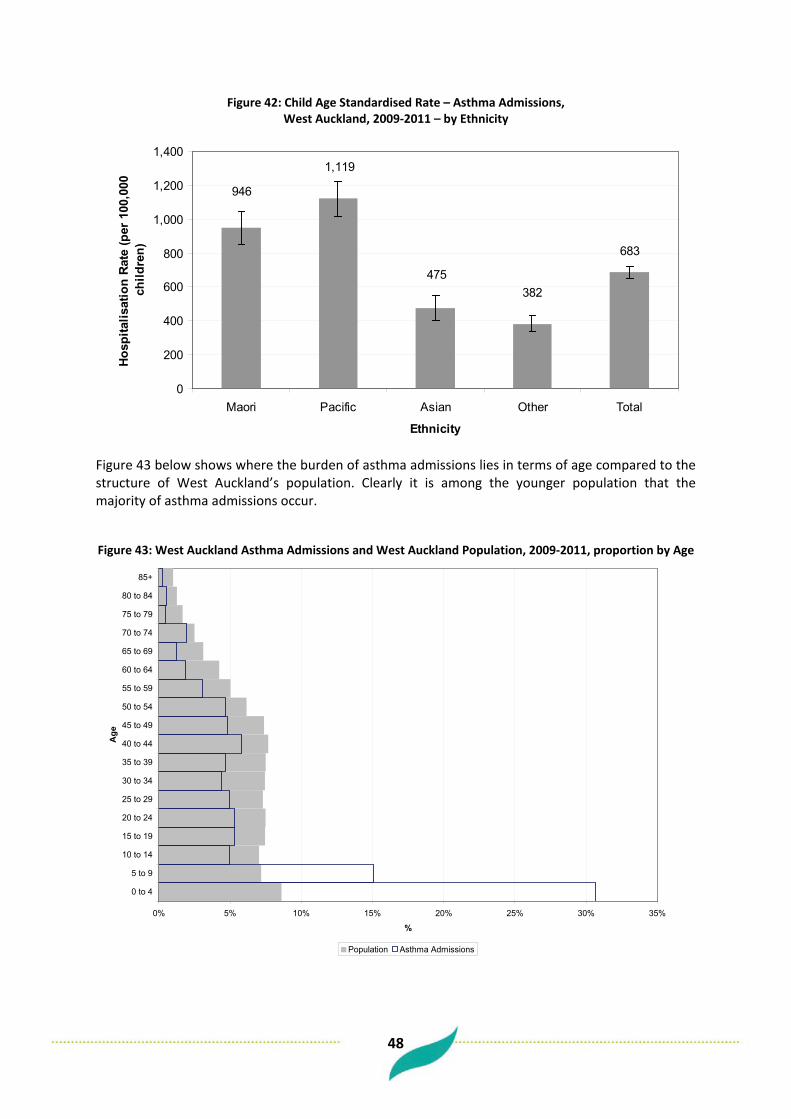
48
Figure 42: Child Age Standardised Rate – Asthma Admissions, West Auckland, 2009-2011 – by Ethnicity
683
382475
1,119
946
0
200
400
600
800
1,000
1,200
1,400
Maori Pacific Asian Other Total
Ethnicity
Hos
pita
lisat
ion
Rat
e (p
er 1
00,0
00
child
ren)
Figure 43 below shows where the burden of asthma admissions lies in terms of age compared to the structure of West Auckland’s population. Clearly it is among the younger population that the majority of asthma admissions occur.
Figure 43: West Auckland Asthma Admissions and West Auckland Population, 2009-2011, proportion by Age
0% 5% 10% 15% 20% 25% 30% 35%
0 to 4
5 to 9
10 to 14
15 to 19
20 to 24
25 to 29
30 to 34
35 to 39
40 to 44
45 to 49
50 to 54
55 to 59
60 to 64
65 to 69
70 to 74
75 to 79
80 to 84
85+
Age
%
Population Asthma Admissions

49
6.12 Rheumatic Fever Admissions Over the three years 2009-2011 there were 48 hospital admissions for West Auckland children with a primary diagnosis of acute rheumatic fever. This represented an age-standardised rate of 29 admissions per 100,000 children, a rate higher (though not a statistically significant difference) than the Waitemata DHB rate of 18 admissions per 100,000 children. Figure 45 shows that it was among children that the majority or acute rheumatic fever admissions occur.
Figure 44: Child Age Standardised Rate – ARF Admissions, WDHB and West Auckland, 2009-2011
29
18
0
10
20
30
40
50
Waitemata DHB West Auckland
Area
Hosp
italis
atio
n Ra
te (p
er 1
00,0
00
child
ren)
Figure 45: West Auckland ARF Admissions and West Auckland Population, 2009-2011, proportion by Age
0% 5% 10% 15% 20% 25% 30% 35% 40% 45%
0 to 4
5 to 9
10 to 14
15 to 19
20 to 24
25 to 29
30 to 34
35 to 39
40 to 44
45 to 49
50 to 54
55 to 59
60 to 64
65 to 69
70 to 74
75 to 79
80 to 84
85+
Age
%
Population Rheumatic Fever Admissions
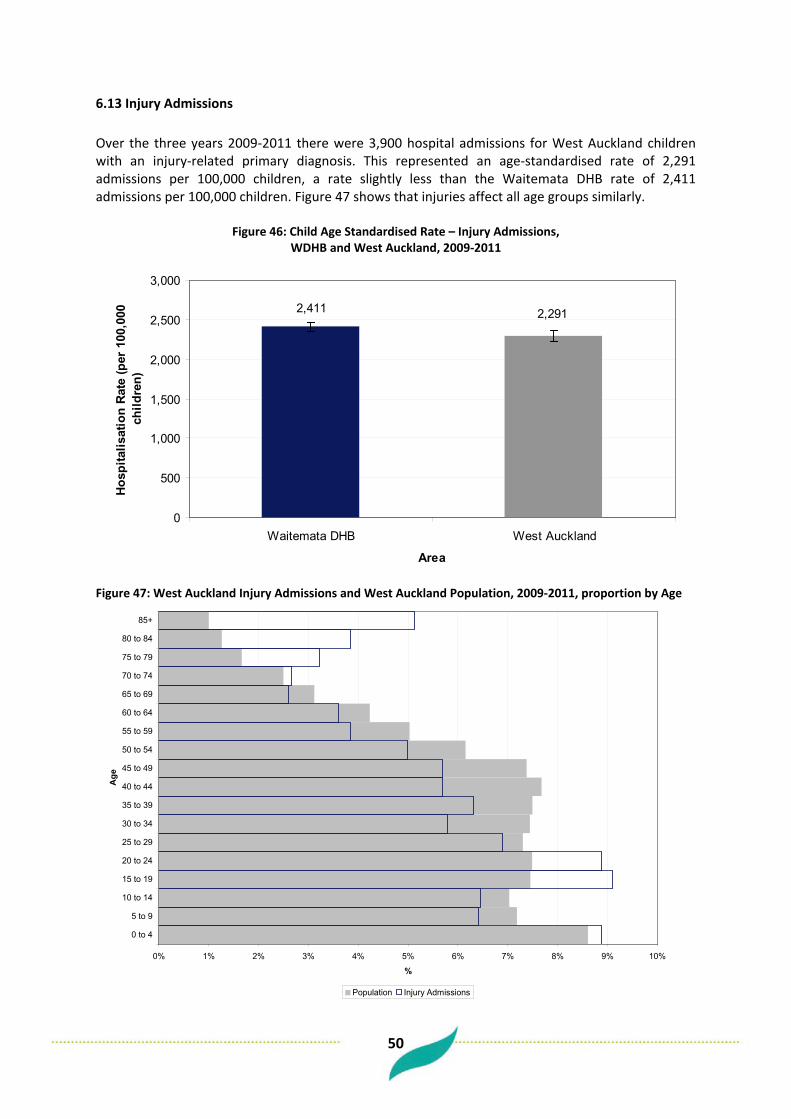
50
6.13 Injury Admissions Over the three years 2009-2011 there were 3,900 hospital admissions for West Auckland children with an injury-related primary diagnosis. This represented an age-standardised rate of 2,291 admissions per 100,000 children, a rate slightly less than the Waitemata DHB rate of 2,411 admissions per 100,000 children. Figure 47 shows that injuries affect all age groups similarly.
Figure 46: Child Age Standardised Rate – Injury Admissions, WDHB and West Auckland, 2009-2011
2,411 2,291
0
500
1,000
1,500
2,000
2,500
3,000
Waitemata DHB West Auckland
Area
Hos
pita
lisat
ion
Rat
e (p
er 1
00,0
00
child
ren)
Figure 47: West Auckland Injury Admissions and West Auckland Population, 2009-2011, proportion by Age
0% 1% 2% 3% 4% 5% 6% 7% 8% 9% 10%
0 to 4
5 to 9
10 to 14
15 to 19
20 to 24
25 to 29
30 to 34
35 to 39
40 to 44
45 to 49
50 to 54
55 to 59
60 to 64
65 to 69
70 to 74
75 to 79
80 to 84
85+
Age
%
Population Injury Admissions

51
Table 38 below shows which categories of injury contributed towards the hospitalisation of West Auckland children. Falls accounted for almost half of all injury-related admissions.
Table 38: Injury Hospitalisations by Category (Top 20) – 2009-2011, West Auckland Children
Injury Category Admissions %
Falls 1,749 45%
Exposure to inanimate mechanical forces 947 24%
Exposure to animate mechanical forces 223 6%
Pedal cyclist injured in transport accident 202 5%
Accidental poisoning by and exposure to noxious substances 122 3%
Accidental exposure to other and unspecified factors 99 3%
Car occupant injured in transport accident 85 2%
Drugs, medicaments and biological substances causing adverse effects in therapeutic use
78 2%
Pedestrian injured in transport accident 77 2%
Overexertion, travel and privation 74 2%
Contact with heat and hot substances 62 2%
Assault 60 2%
Other land transport accidents 23 1%
Other accidental threats to breathing 23 1%
Intentional self-harm 21 1%
Event of undetermined intent 17 0.4%
Exposure to smoke, fire and flames 17 0.4%
Accidental drowning and submersion 14 0.4%
Motorcycle rider injured in transport accident 9 0.2%
Contact with venomous animals and plants 5 0.1%
Other Injuries 14 0.4%
Total Injury Admissions 3,921 100%
Source: NMDS

52
6.14 Oral Health Over the three years 2009-2011 there were 1,100 hospital admissions for West Auckland children with a dental caries or oral health issue primary diagnosis. This represented an age-standardised rate of 643 admissions per 100,000 children, a rate slightly higher than the Waitemata DHB rate.
Figure 48: Child Age Standardised Rate – Dental Caries and Oral Health Admissions, WDHB and West Auckland, 2009-2011
643
566
0
100
200
300
400
500
600
700
800
Waitemata DHB West Auckland
Area
Hos
pita
lisat
ion
Rat
e (p
er 1
00,0
00
child
ren)
Figure 49: West Auckland Dental Caries and Oral Health Admissions and West Auckland Population,
2009-2011, proportion by Age
0% 5% 10% 15% 20% 25% 30%
0 to 4
5 to 9
10 to 14
15 to 19
20 to 24
25 to 29
30 to 34
35 to 39
40 to 44
45 to 49
50 to 54
55 to 59
60 to 64
65 to 69
70 to 74
75 to 79
80 to 84
85+
Age
%
Population Dental Caries & Oral Health Admissions

53
6.15 Emergency Department Attendances For the one year 2010/11, there were 16,000 Emergency Department visits from West Auckland’s child (0-14) population. Expressed as an age-standardised rate, West Auckland had a rate of 26,900 ED attendances per 100,000 children. This was a rate higher than that for Waitemata DHB as a whole over this time period (22,400 ED visits per 100,000).
Figure 50: Age Standardised Emergency Department Visit Rate, WDHB and West Auckland, 2010/11, Children (0-14)
22,414
26,871
0
5,000
10,000
15,000
20,000
25,000
30,000
Waitemata DHB West Auckland
Area
ED
Vis
its (p
er 1
00,0
00 c
hild
ren)

54
Cluster Level Profile 7 Definition of Clusters For the purpose of this report three “Clusters” will be compared – Henderson, Massey, and New Lynn. These clusters are defined by the enrolled patient populations of the following Practices:
Table 39: Clusters by Practice
Cluster Practices
Henderson Family Practice + Medical Centre Swanson Medical Centre
Henderson Medical Centre T L Care Limited
Lincoln Rd Medical Centre Te Atatu South Medical Centre
Palomino Medical Centre Valley Medical Centre
Peninsula Medical Centre Waitakere Union Health Centre
Ranui Medical Centre West Fono Health Trust
Ratanui Medical Centre Whanau Centre (Wai Health)
Massey Hobsonville Medical Centre Upper Harbour Medical Centre
Luckens Road Medical Centre West Harbour Medical Centre
Massey Medical Centre Westgate Medical Centre
Royal Heights Medical Centre
New Lynn Avondale Family Doctor Kinross Medical Centre
Avondale Family Health Centre Lynnmall Medical Centre
Avondale Health Centre McLaren Park Med Centre
Avondale Medical Centre New Lynn Medical Centre
Blockhouse Bay Medical Centre New Windsor Road Surgery
Donovan Street Medical Centre Pacific Horizon Healthcare
Glenavon Doctors Surgery Rosebank Road Medical Services
Golf Road Medical Centre The Doctors Ltd. (New Lynn)
Green Bay Medical Centre Titirangi Family Healthcare
Integrated Medical - Dr Doering Titirangi Medical Centre
Kelston Medical Centre Westview Medical Centre
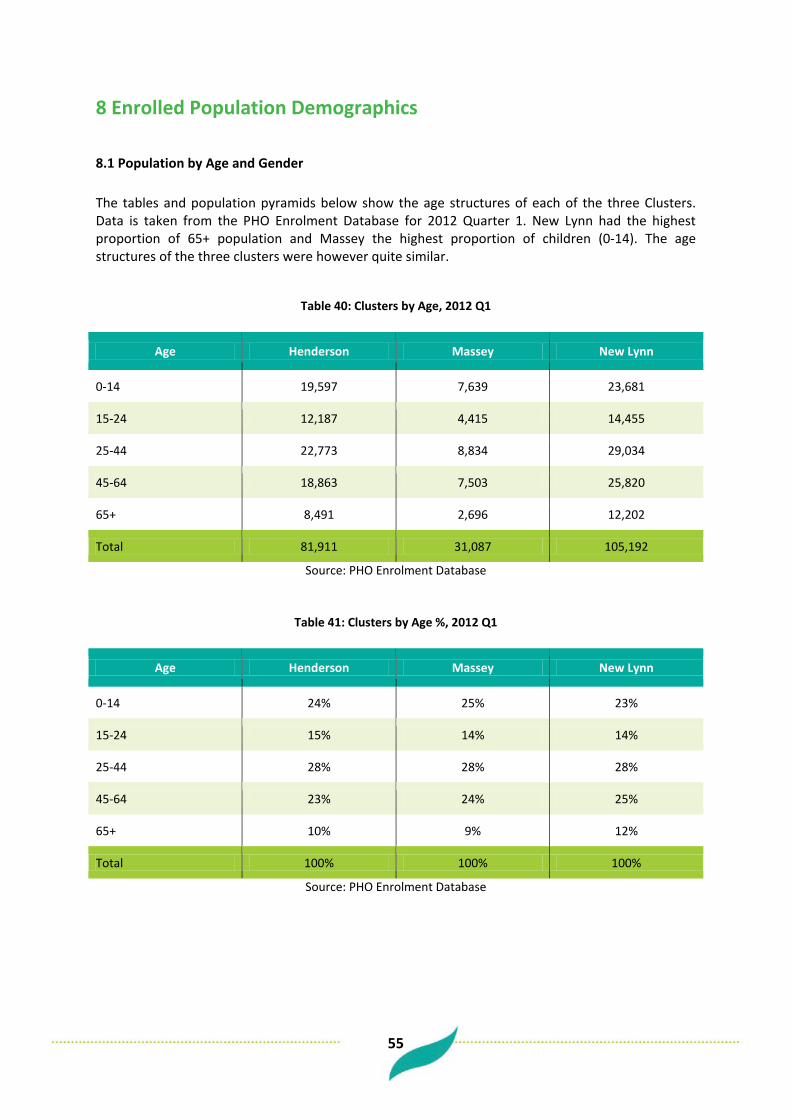
55
8 Enrolled Population Demographics
8.1 Population by Age and Gender The tables and population pyramids below show the age structures of each of the three Clusters. Data is taken from the PHO Enrolment Database for 2012 Quarter 1. New Lynn had the highest proportion of 65+ population and Massey the highest proportion of children (0-14). The age structures of the three clusters were however quite similar.
Table 40: Clusters by Age, 2012 Q1
Age Henderson Massey New Lynn
0-14 19,597 7,639 23,681
15-24 12,187 4,415 14,455
25-44 22,773 8,834 29,034
45-64 18,863 7,503 25,820
65+ 8,491 2,696 12,202
Total 81,911 31,087 105,192
Source: PHO Enrolment Database
Table 41: Clusters by Age %, 2012 Q1
Age Henderson Massey New Lynn
0-14 24% 25% 23%
15-24 15% 14% 14%
25-44 28% 28% 28%
45-64 23% 24% 25%
65+ 10% 9% 12%
Total 100% 100% 100%
Source: PHO Enrolment Database

56
Figure 51: Henderson Cluster Population Structure, 2012 Q1
5% 4% 3% 2% 1% - 1% 2% 3% 4% 5%
0 to 4
5 to 9
10 to 14
15 to 19
20 to 24
25 to 29
30 to 34
35 to 39
40 to 44
45 to 49
50 to 54
55 to 59
60 to 64
65 to 69
70 to 74
75 to 79
80 to 84
85+
Age
Gro
up
% Population
Male Female
Figure 52: Massey Cluster Population Structure, 2012 Q1
5% 4% 3% 2% 1% - 1% 2% 3% 4% 5%
0 to 4
5 to 9
10 to 14
15 to 19
20 to 24
25 to 29
30 to 34
35 to 39
40 to 44
45 to 49
50 to 54
55 to 59
60 to 64
65 to 69
70 to 74
75 to 79
80 to 84
85+
Age
Gro
up
% Population
Male Female
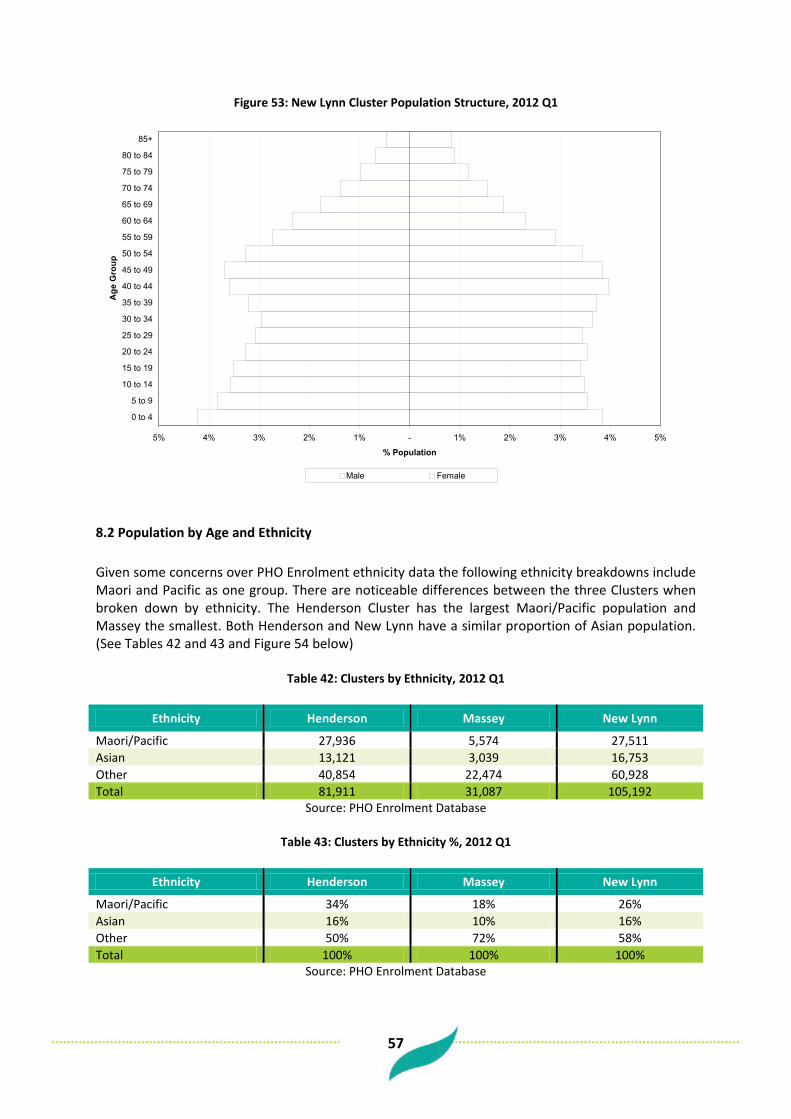
57
Figure 53: New Lynn Cluster Population Structure, 2012 Q1
5% 4% 3% 2% 1% - 1% 2% 3% 4% 5%
0 to 4
5 to 9
10 to 14
15 to 19
20 to 24
25 to 29
30 to 34
35 to 39
40 to 44
45 to 49
50 to 54
55 to 59
60 to 64
65 to 69
70 to 74
75 to 79
80 to 84
85+
Age
Gro
up
% Population
Male Female
8.2 Population by Age and Ethnicity Given some concerns over PHO Enrolment ethnicity data the following ethnicity breakdowns include Maori and Pacific as one group. There are noticeable differences between the three Clusters when broken down by ethnicity. The Henderson Cluster has the largest Maori/Pacific population and Massey the smallest. Both Henderson and New Lynn have a similar proportion of Asian population. (See Tables 42 and 43 and Figure 54 below)
Table 42: Clusters by Ethnicity, 2012 Q1
Ethnicity Henderson Massey New Lynn
Maori/Pacific 27,936 5,574 27,511 Asian 13,121 3,039 16,753 Other 40,854 22,474 60,928 Total 81,911 31,087 105,192
Source: PHO Enrolment Database
Table 43: Clusters by Ethnicity %, 2012 Q1
Ethnicity Henderson Massey New Lynn
Maori/Pacific 34% 18% 26% Asian 16% 10% 16% Other 50% 72% 58% Total 100% 100% 100%
Source: PHO Enrolment Database

58
Figure 54: Henderson, Massey, New Lynn, % Population by Ethnicity, 2012 Q1
34%
16%
50%
18%
10%
72%
26%
16%
58%
0%
10%
20%
30%
40%
50%
60%
70%
80%
Maori/Pacific Asian Other
Ethnicity
% E
nrol
led
Popu
latio
n
Henderson Massey New Lynn
Tables 44 to 49 show the age structures of each cluster by ethnic group. Across all three Clusters the Maori/Pacific population was proportionately younger than the Total. For all three Clusters the Maori/Pacific population was made up of close to one third children (0-14).
Table 44: Henderson Cluster by Ethnicity and Age, 2012 Q1
Age Maori/Pacific Asian Other Total
0-14 9,116 3,126 7,355 19,597 15-24 5,180 1,698 5,309 12,187 25-44 7,551 4,341 10,881 22,773 45-64 4,840 3,044 10,979 18,863 65+ 1,249 912 6,330 8,491
Total 27,936 13,121 40,854 81,911 Source: PHO Enrolment Database
Table 45: Massey Cluster by Ethnicity and Age, 2012 Q1
Age Maori/Pacific Asian Other Total
0-14 1,991 718 4,930 7,639 15-24 1,061 414 2,940 4,415 25-44 1,526 972 6,336 8,834 45-64 853 790 5,860 7,503 65+ 143 145 2,408 2,696
Total 5,574 3,039 22,474 31,087 Source: PHO Enrolment Database

59
Table 46: New Lynn Cluster by Ethnicity and Age, 2012 Q1
Age Maori/Pacific Asian Other Total
0-14 8,789 3,609 11,283 23,681 15-24 5,051 1,965 7,439 14,455 25-44 7,444 5,592 15,998 29,034 45-64 4,871 4,129 16,820 25,820 65+ 1,356 1,458 9,388 12,202
Total 27,511 16,753 60,928 105,192 Source: PHO Enrolment Database
Table 47: Henderson Cluster by Ethnicity and Age %, 2012 Q1
Age Maori/Pacific Asian Other Total
0-14 33% 24% 18% 24% 15-24 19% 13% 13% 15% 25-44 27% 33% 27% 28% 45-64 17% 23% 27% 23% 65+ 4% 7% 15% 10%
Total 100% 100% 100% 100% Source: PHO Enrolment Database
Table 48: Massey Cluster by Ethnicity and Age %, 2012 Q1
Age Maori/Pacific Asian Other Total
0-14 36% 24% 22% 25% 15-24 19% 14% 13% 14% 25-44 27% 32% 28% 28% 45-64 15% 26% 26% 24% 65+ 3% 5% 11% 9%
Total 100% 100% 100% 100% Source: PHO Enrolment Database
Table 49: New Lynn Cluster by Ethnicity and Age %, 2012 Q1
Age Maori/Pacific Asian Other Total
0-14 32% 22% 19% 23% 15-24 18% 12% 12% 14% 25-44 27% 33% 26% 28% 45-64 18% 25% 28% 25% 65+ 5% 9% 15% 12%
Total 100% 100% 100% 100% Source: PHO Enrolment Database

60
The population pyramids below (Figures 55 – 57) serve to highlight the difference between the population structure of Maori/Pacific compared with the rest of the enrolled population by Cluster.
Figure 55: Henderson Cluster Population Structure, 2012 Q1 Maori/Pacific compared with Other (incl. Asian)
8% 6% 4% 2% - 2% 4% 6% 8%
0-4
5-9
10-14
15-19
20-24
25-29
30-34
35-39
40-44
45-49
50-54
55-59
60-64
65-69
70-74
75-79
80-84
85+
Age
Gro
up
% Population
Maori/Pacific - Male Maori/Pacific - Female Other - Male Other - Female

61
Figure 56: Massey Cluster Population Structure, 2012 Q1 Maori/Pacific compared with Other (incl. Asian)
8% 6% 4% 2% - 2% 4% 6% 8%
0-4
5-9
10-14
15-19
20-24
25-29
30-34
35-39
40-44
45-49
50-54
55-59
60-64
65-69
70-74
75-79
80-84
85+
Age
Gro
up
% Population
Maori/Pacific - Male Maori/Pacific - Female Other - Male Other - Female
Figure 57: New Lynn Cluster Population Structure, 2012 Q1 Maori/Pacific compared with Other (incl. Asian)
8% 6% 4% 2% - 2% 4% 6% 8%
0-4
5-9
10-14
15-19
20-24
25-29
30-34
35-39
40-44
45-49
50-54
55-59
60-64
65-69
70-74
75-79
80-84
85+
Age
Gro
up
% Population
Maori/Pacific - Male Maori/Pacific - Female Other - Male Other - Female
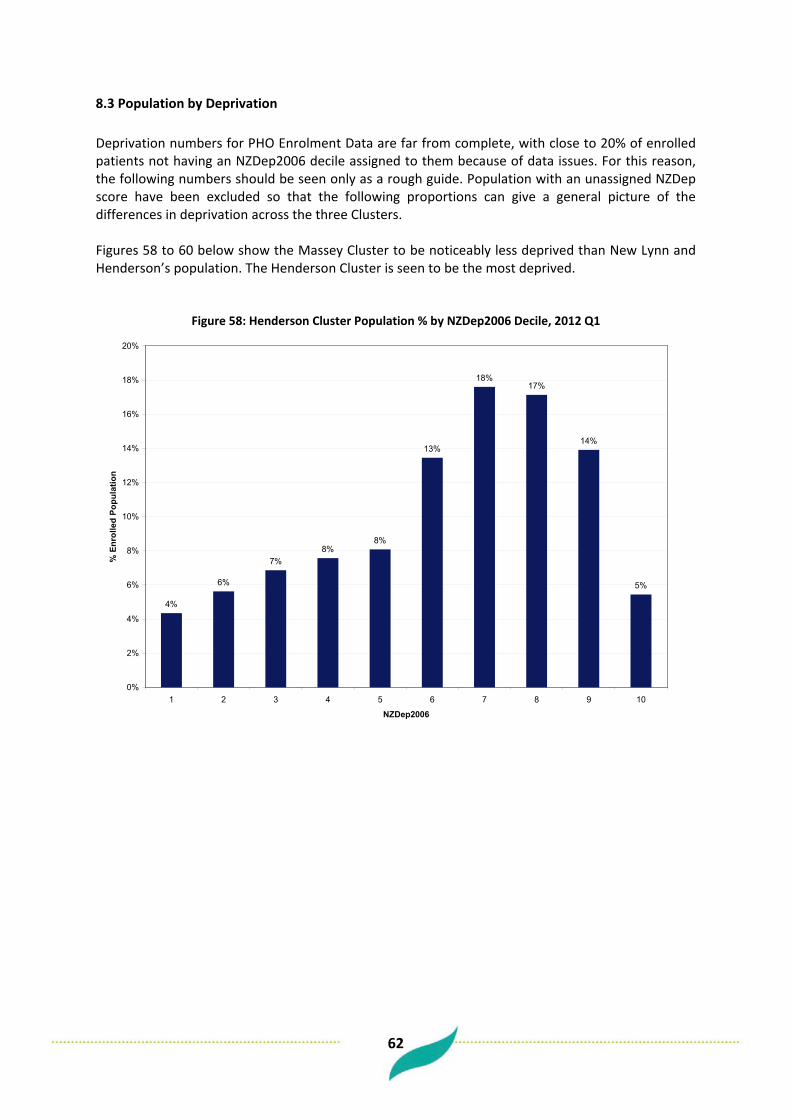
62
8.3 Population by Deprivation Deprivation numbers for PHO Enrolment Data are far from complete, with close to 20% of enrolled patients not having an NZDep2006 decile assigned to them because of data issues. For this reason, the following numbers should be seen only as a rough guide. Population with an unassigned NZDep score have been excluded so that the following proportions can give a general picture of the differences in deprivation across the three Clusters. Figures 58 to 60 below show the Massey Cluster to be noticeably less deprived than New Lynn and Henderson’s population. The Henderson Cluster is seen to be the most deprived.
Figure 58: Henderson Cluster Population % by NZDep2006 Decile, 2012 Q1
4%
6%
7%8%
8%
13%
18%17%
14%
5%
0%
2%
4%
6%
8%
10%
12%
14%
16%
18%
20%
1 2 3 4 5 6 7 8 9 10
NZDep2006
% E
nrol
led
Popu
latio
n

63
Figure 59: Massey Cluster Population % by NZDep2006 Decile, 2012 Q1
11%
17%
16%
7%
10%
11%
10%
9%
5%
4%
0%
2%
4%
6%
8%
10%
12%
14%
16%
18%
20%
1 2 3 4 5 6 7 8 9 10
NZDep2006
% E
nrol
led
Popu
latio
n
Figure 60: New Lynn Cluster Population % by NZDep2006 Decile, 2012 Q1
8%7% 7%
9%
10%
11%
12%
15%
14%
6%
0%
2%
4%
6%
8%
10%
12%
14%
16%
18%
20%
1 2 3 4 5 6 7 8 9 10
NZDep2006
% E
nrol
led
Popu
latio
n
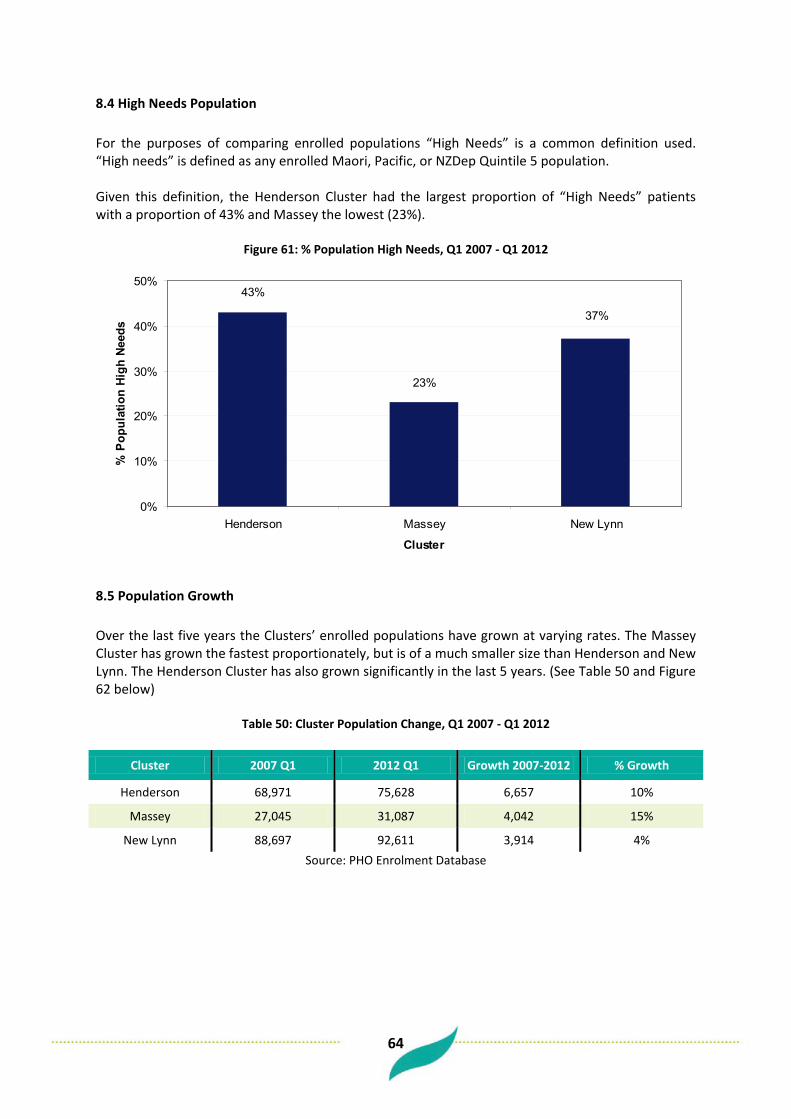
64
8.4 High Needs Population For the purposes of comparing enrolled populations “High Needs” is a common definition used. “High needs” is defined as any enrolled Maori, Pacific, or NZDep Quintile 5 population. Given this definition, the Henderson Cluster had the largest proportion of “High Needs” patients with a proportion of 43% and Massey the lowest (23%).
Figure 61: % Population High Needs, Q1 2007 - Q1 2012
43%
23%
37%
0%
10%
20%
30%
40%
50%
Henderson Massey New Lynn
Cluster
% P
opul
atio
n Hi
gh N
eeds
8.5 Population Growth Over the last five years the Clusters’ enrolled populations have grown at varying rates. The Massey Cluster has grown the fastest proportionately, but is of a much smaller size than Henderson and New Lynn. The Henderson Cluster has also grown significantly in the last 5 years. (See Table 50 and Figure 62 below)
Table 50: Cluster Population Change, Q1 2007 - Q1 2012
Cluster 2007 Q1 2012 Q1 Growth 2007-2012 % Growth
Henderson 68,971 75,628 6,657 10%
Massey 27,045 31,087 4,042 15%
New Lynn 88,697 92,611 3,914 4% Source: PHO Enrolment Database
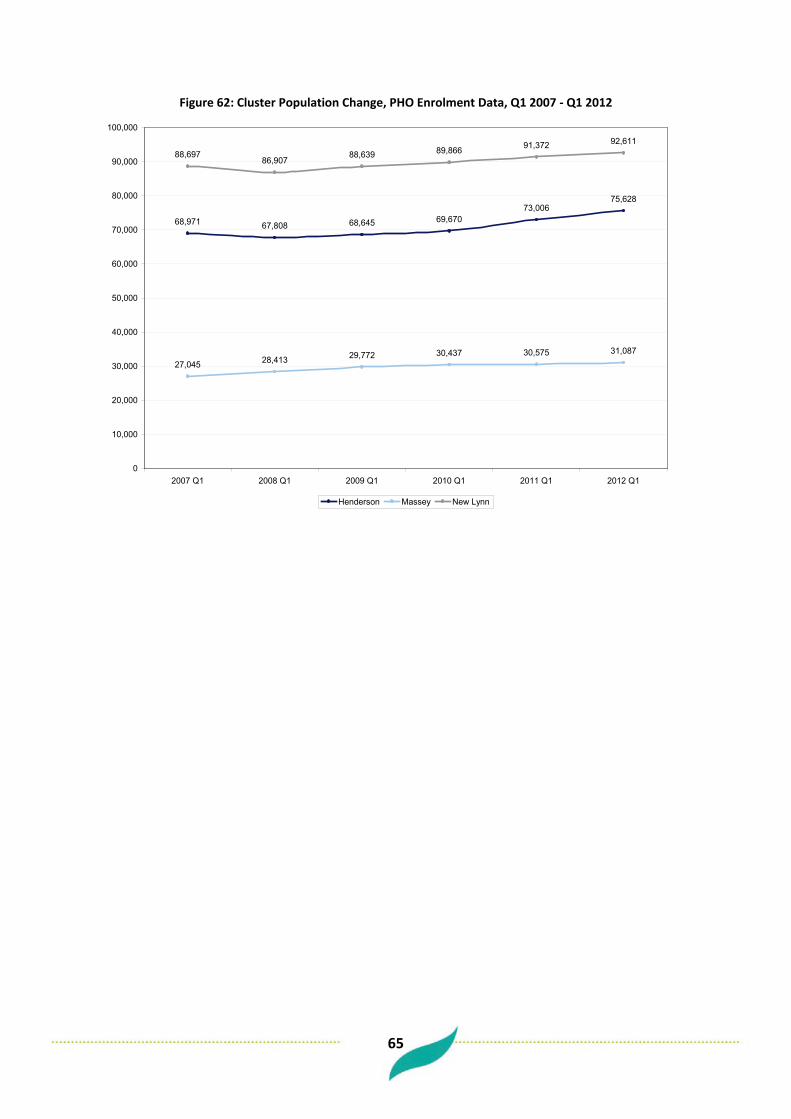
65
Figure 62: Cluster Population Change, PHO Enrolment Data, Q1 2007 - Q1 2012
68,971 67,808 68,645 69,67073,006
75,628
27,045 28,413 29,772 30,437 30,575 31,087
88,69786,907
88,639 89,866 91,372 92,611
0
10,000
20,000
30,000
40,000
50,000
60,000
70,000
80,000
90,000
100,000
2007 Q1 2008 Q1 2009 Q1 2010 Q1 2011 Q1 2012 Q1
Henderson Massey New Lynn

66
9 Secondary Care Services (Adults)
9.1 Avoidable Hospitalisations – PAH and ASH For explanations/definitions of PAH and ASH see the Avoidable Hospitalisation section in the Locality analysis.
9.2 Potentially Avoidable Hospitalisations Table 51 shows that of all acute adult hospital admissions (15-74) for the Henderson Cluster over the three years 2009 – 2011, 24% were potentially avoidable. For the Massey Cluster 21% were potentially avoidable and 23% for the New Lynn Cluster.
Table 51: PAH and Total Acute Admissions, 2009-2011, by Cluster (15-74)
Cluster PAH Total Acute Admissions %
Henderson 7,626 31,424 24% Massey 2,344 10,954 21% New Lynn 8,203 36,274 23% Total 17,435 78,652 23%
Source: NMDS
When looked at by ethnicity there were noticeable differences in the proportion of acute admissions that were deemed potentially avoidable. Maori and Pacific had a higher proportion of potentially avoidable hospitalisation (Ethnicity here is taken from NMDS rather than the PHO Enrolment Database).
Table 52: % Acute Admissions PAH, 2009-2011, by Ethnicity and Cluster (15-74)
Cluster Maori Pacific Asian Other
Henderson 25% 29% 19% 23% Massey 20% 27% 20% 21% New Lynn 25% 24% 20% 22% Total 25% 26% 20% 22%
Source: NMDS
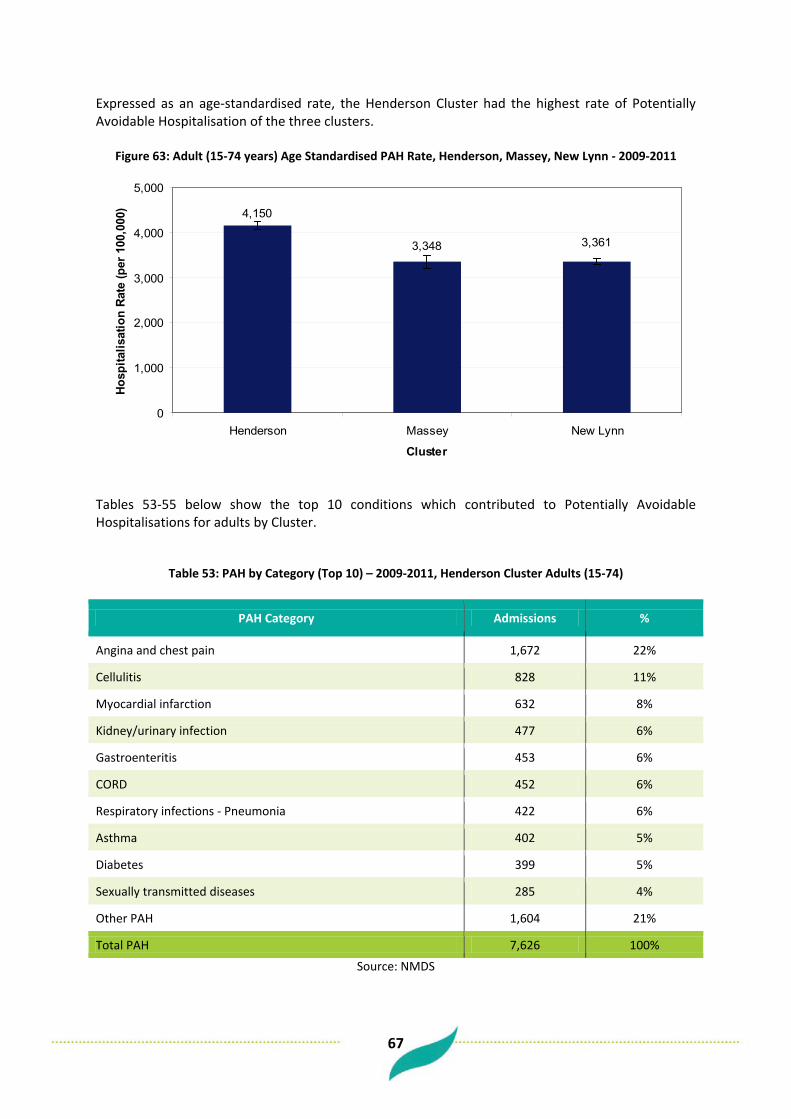
67
Expressed as an age-standardised rate, the Henderson Cluster had the highest rate of Potentially Avoidable Hospitalisation of the three clusters.
Figure 63: Adult (15-74 years) Age Standardised PAH Rate, Henderson, Massey, New Lynn - 2009-2011
4,150
3,3613,348
0
1,000
2,000
3,000
4,000
5,000
Henderson Massey New Lynn
Cluster
Hosp
italis
atio
n Ra
te (p
er 1
00,0
00)
Tables 53-55 below show the top 10 conditions which contributed to Potentially Avoidable Hospitalisations for adults by Cluster.
Table 53: PAH by Category (Top 10) – 2009-2011, Henderson Cluster Adults (15-74)
PAH Category Admissions %
Angina and chest pain 1,672 22%
Cellulitis 828 11%
Myocardial infarction 632 8%
Kidney/urinary infection 477 6%
Gastroenteritis 453 6%
CORD 452 6%
Respiratory infections - Pneumonia 422 6%
Asthma 402 5%
Diabetes 399 5%
Sexually transmitted diseases 285 4%
Other PAH 1,604 21%
Total PAH 7,626 100%
Source: NMDS

68
Table 54: PAH by Category (Top 10) – 2009-2011, Massey Cluster Adults (15-74)
PAH Category Admissions %
Angina and chest pain 557 24%
Cellulitis 199 8%
Myocardial infarction 184 8%
Gastroenteritis 150 6%
Respiratory infections - Pneumonia 142 6%
Kidney/urinary infection 137 6%
CORD 137 6%
Asthma 117 5%
Epilepsy 99 4%
Sexually transmitted diseases 90 4%
Other PAH 532 23%
Total PAH 2,344 100%
Source: NMDS
Table 55: PAH by Category (Top 10) – 2009-2011, New Lynn Cluster Adults (15-74)
PAH Category Admissions %
Angina and chest pain 1,636 20%
Cellulitis 824 10%
Myocardial infarction 624 8%
Gastroenteritis 565 7%
Kidney/urinary infection 509 6%
CORD 497 6%
Respiratory infections - Pneumonia 457 6%
Asthma 424 5%
Diabetes 383 5%
Sexually transmitted diseases 321 4%
Other PAH 1,963 24%
Total PAH 8,203 100%
Source: NMDS

69
9.3 Ambulatory Sensitive Hospitalisations Of all acute adult hospital admissions (15-74) for the Henderson Cluster over the three years 2009 – 2011, 18% were ambulatory sensitive. For the Massey Cluster 15% were ambulatory sensitive and 17% for the New Lynn Cluster.
Table 56: ASH and Total Acute Admissions, 2009-2011, by Cluster Adults (15-74)
Cluster ASH Total Acute Admissions %
Henderson 5,557 31,424 18% Massey 1,684 10,954 15%
New Lynn 5,988 36,274 17% Total 13,229 78,652 17%
Source: NMDS Table 57 below shows that by ethnicity there were noticeable differences in the proportion of acute admissions deemed as ambulatory sensitive. Maori and Pacific had a higher proportion of ambulatory sensitive admissions for all clusters (Ethnicity here is taken from NMDS rather than the PHO Enrolment Database).
Table 57: % Acute Admissions ASH, 2009-2011, by Ethnicity and Cluster (15-74)
Cluster Maori Pacific Asian Other
Henderson 20% 21% 14% 16% Massey 15% 20% 13% 15%
New Lynn 18% 19% 14% 16% Total 19% 20% 14% 16%
Source: NMDS
Figure 64 shows that as an age-standardised rate the Henderson Cluster had the highest rate of Ambulatory Sensitive Hospitalisation of the three clusters for adults.
Figure 64: Adult (15-74 years) Age Standardised ASH Rate, Henderson, Massey, New Lynn - 2009-2011
3,056
2,4802,434
0
1,000
2,000
3,000
Henderson Massey New Lynn
Cluster
Hosp
italis
atio
n Ra
te (p
er 1
00,0
00)

70
Tables 58 to 60 below show the top 10 conditions which contributed to Ambulatory Sensitive Hospitalisations for adults by Cluster.
Table 58: ASH by Category (Top 10) – 2009-2011, Henderson Cluster Adults (15-74)
ASH Category Admissions %
Angina and chest pain 836 15% Cellulitis 810 15% Gastroenteritis/dehydration 524 9% Kidney/urinary infection 480 9% Respiratory infections - Pneumonia 422 8% Asthma 402 7% Diabetes 399 7% Myocardial infarction 316 6% Epilepsy 252 5% Upper respiratory tract and ENT infections 217 4% Other ASH 899 16% Total ASH 5,557 100%
Source: NMDS Table 59: ASH by Category (Top 10) – 2009-2011, Massey Cluster Adults (15-74)
ASH Category Admissions %
Angina and chest pain 279 17% Cellulitis 198 12% Gastroenteritis/dehydration 179 11% Respiratory infections - Pneumonia 142 8% Kidney/urinary infection 138 8% Asthma 117 7% Epilepsy 99 6% Myocardial infarction 92 5% Diabetes 86 5% Upper respiratory tract and ENT infections 73 4% Other ASH 281 17% Total ASH 1,684 100%
Source: NMDS Table 60: ASH by Category (Top 10) – 2009-2011, New Lynn Cluster Adults (15-74)
ASH Category Admissions %
Angina and chest pain 818 14% Cellulitis 809 14% Gastroenteritis/dehydration 653 11% Kidney/urinary infection 517 9% Respiratory infections - Pneumonia 457 8% Asthma 424 7% Diabetes 383 6% Myocardial infarction 312 5% Upper respiratory tract and ENT infections 270 5% Epilepsy 265 4% Other ASH 1,080 18% Total ASH 5,988 100%
Source: NMDS

71
9.4 CVD Admissions Over the three years 2009 – 2011 there were 3,800 adult (15+) hospital admissions with a CVD primary diagnosis from the Henderson Cluster. From the Massey Cluster there were 1,100 and from the New Lynn Cluster there were 4,500. Expressed as an age-standardised rate, the Henderson Cluster had the highest rate of CVD admissions for adults of the three clusters. (See Figure 65 below)
Figure 65: Adult (15+) Age Standardised CVD Admission Rate, Henderson, Massey, New Lynn - 2009-2011
1,4741,508
1,739
0
500
1,000
1,500
2,000
Henderson Massey New Lynn
Cluster
Hosp
italis
atio
n Ra
te (p
er 1
00,0
00)

72
9.5 Diabetes Admissions
Over the three years 2009 – 2011 there were 800 adult (15+) hospital admissions with a diabetes primary diagnosis from the Henderson Cluster. From the Massey Cluster there were 150 and from the New Lynn Cluster there were 850. Expressed as an age-standardised rate, the Henderson Cluster had the highest rate of diabetes admissions for adults and the Massey Cluster the lowest.
Figure 66: Adult (15+) Age Standardised Diabetes Admission Rate,
Henderson, Massey, New Lynn - 2009-2011
294
204
379
0
100
200
300
400
500
Henderson Massey New Lynn
Cluster
Hosp
italis
atio
n Ra
te (p
er 1
00,0
00)

73
9.6 Mental Health Admissions Over the three years 2009 – 2011 there were 900 adult (15+) Mental Health hospital admissions from the Henderson Cluster. From the Massey Cluster there were 150 and from the New Lynn Cluster there were 800. Expressed as an age-standardised rate, the Henderson Cluster had the highest rate of Mental Health admissions for adults and the Massey Cluster the lowest.
Figure 67: Adult (15+) Age Standardised Mental Health Admission Rate, Henderson, Massey, New Lynn - 2009-2011
342
231
516
0
200
400
600
Henderson Massey New Lynn
Cluster
Hosp
italis
atio
n Ra
te (p
er 1
00,0
00)
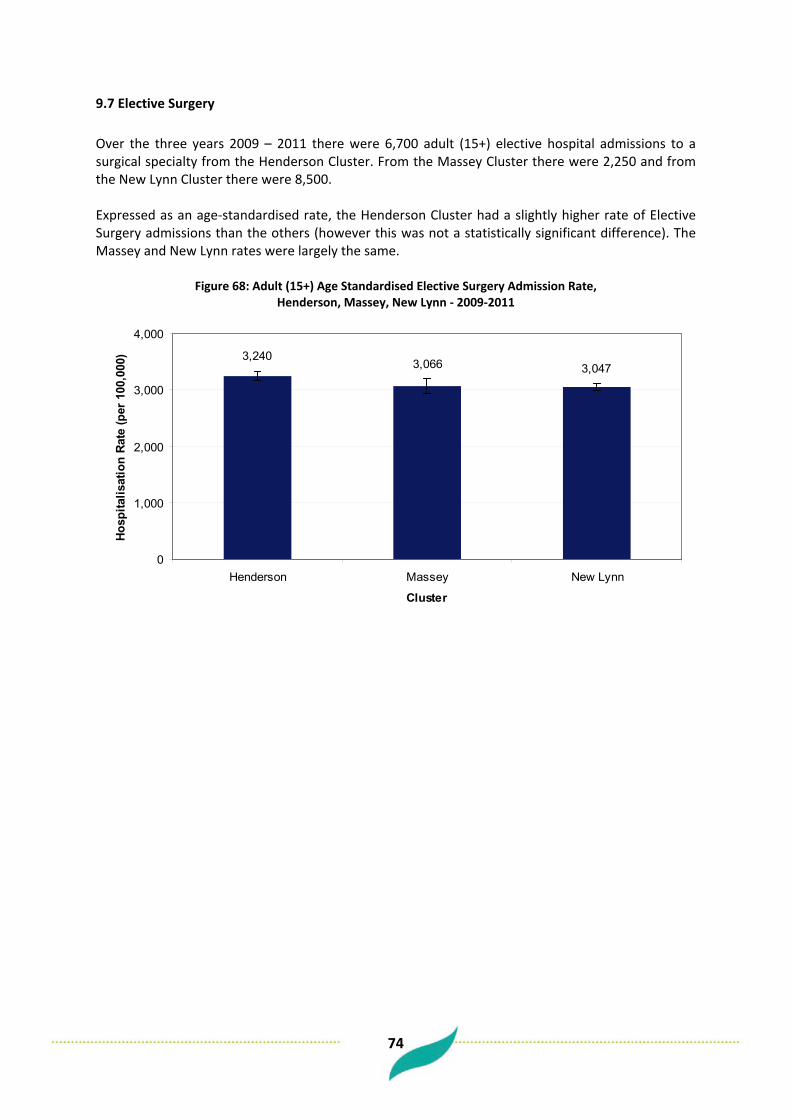
74
9.7 Elective Surgery Over the three years 2009 – 2011 there were 6,700 adult (15+) elective hospital admissions to a surgical specialty from the Henderson Cluster. From the Massey Cluster there were 2,250 and from the New Lynn Cluster there were 8,500. Expressed as an age-standardised rate, the Henderson Cluster had a slightly higher rate of Elective Surgery admissions than the others (however this was not a statistically significant difference). The Massey and New Lynn rates were largely the same.
Figure 68: Adult (15+) Age Standardised Elective Surgery Admission Rate, Henderson, Massey, New Lynn - 2009-2011
3,0473,0663,240
0
1,000
2,000
3,000
4,000
Henderson Massey New Lynn
Cluster
Hosp
italis
atio
n Ra
te (p
er 1
00,0
00)

75
9.8 Emergency Department Attendances For the financial year 2009/10 there were 13,700 adult (15+) Emergency Department attendances from the Henderson Cluster. From the Massey Cluster there were 4,000 and from the New Lynn Cluster there were 14,300. Expressed as an age-standardised rate, the Henderson Cluster had the highest rate of ED attendance.
Figure 69: Adult (15+) Age Standardised ED Attendance Rate, Henderson, Massey, New Lynn - 2009/10
21,675
17,461 17,133
0
5,000
10,000
15,000
20,000
25,000
Henderson Massey New Lynn
Cluster
ED A
ttend
ance
Rat
e (p
er 1
00,0
00)

76
10 Child Health
10.1 Avoidable Hospitalisations – PAH and ASH
10.2 Potentially Avoidable Hospitalisations Table 61 shows that of all acute child hospital admissions (0-14) for the Henderson Cluster over the three years 2009 – 2011, 25% were potentially avoidable. For the Massey Cluster 20% were potentially avoidable and 23% for the New Lynn Cluster.
Table 61: Child PAH and Total Acute Admissions, 2009-2011, by Cluster
Cluster PAH Total Acute Admissions % Acute Admissions PAH
Henderson 3,300 12,280 27% Massey 912 4,140 22%
New Lynn 3,393 13,317 25% Total 7,605 29,737 26%
Source: NMDS When looked at by ethnicity there were noticeable differences in the proportion of acute admissions that were deemed potentially avoidable for children. Maori and Pacific had a much higher proportion of potentially avoidable admissions (Ethnicity here is taken from NMDS rather than the PHO Enrolment Database).
Table 62: Child % Acute Admissions PAH, 2009-2011, by Ethnicity and Cluster
Cluster Maori Pacific Asian Other
Henderson 30% 35% 20% 19% Massey 26% 33% 21% 18%
New Lynn 30% 34% 22% 18% Total 30% 35% 21% 18%
Source: NMDS
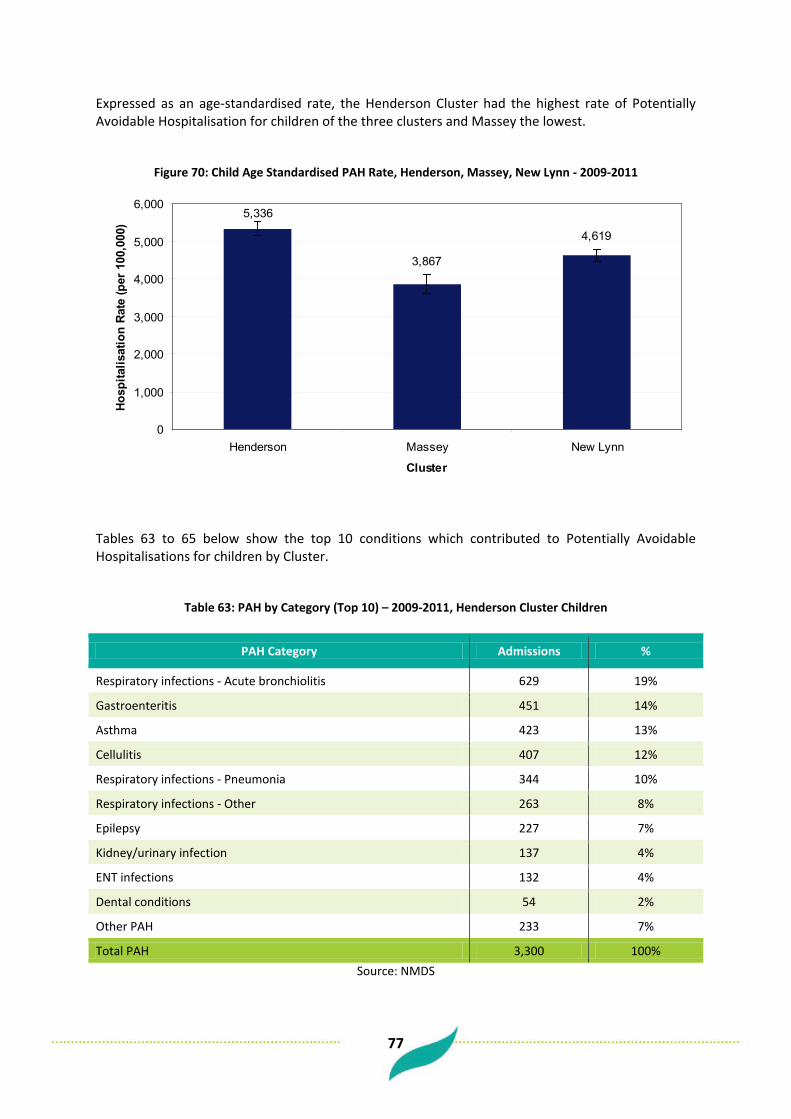
77
Expressed as an age-standardised rate, the Henderson Cluster had the highest rate of Potentially Avoidable Hospitalisation for children of the three clusters and Massey the lowest.
Figure 70: Child Age Standardised PAH Rate, Henderson, Massey, New Lynn - 2009-2011
5,336
3,867
4,619
0
1,000
2,000
3,000
4,000
5,000
6,000
Henderson Massey New Lynn
Cluster
Hosp
italis
atio
n Ra
te (p
er 1
00,0
00)
Tables 63 to 65 below show the top 10 conditions which contributed to Potentially Avoidable Hospitalisations for children by Cluster.
Table 63: PAH by Category (Top 10) – 2009-2011, Henderson Cluster Children
PAH Category Admissions %
Respiratory infections - Acute bronchiolitis 629 19%
Gastroenteritis 451 14%
Asthma 423 13%
Cellulitis 407 12%
Respiratory infections - Pneumonia 344 10%
Respiratory infections - Other 263 8%
Epilepsy 227 7%
Kidney/urinary infection 137 4%
ENT infections 132 4%
Dental conditions 54 2%
Other PAH 233 7%
Total PAH 3,300 100% Source: NMDS

78
Table 64: PAH by Category (Top 10) – 2009-2011, Massey Cluster Children
PAH Category Admissions %
Asthma 156 17%
Gastroenteritis 140 15%
Respiratory infections - Acute bronchiolitis 129 14%
Respiratory infections - Pneumonia 93 10%
Respiratory infections - Other 91 10%
Cellulitis 79 9%
Epilepsy 69 8%
Kidney/urinary infection 46 5%
ENT infections 36 4%
Diabetes 13 1%
Other PAH 60 7%
Total PAH 912 100% Source: NMDS
Table 65: PAH by Category (Top 10) – 2009-2011, New Lynn Cluster Children
PAH Category Admissions %
Asthma 533 16%
Respiratory infections - Acute bronchiolitis 528 16%
Gastroenteritis 503 15%
Cellulitis 404 12%
Respiratory infections - Pneumonia 376 11%
Respiratory infections - Other 271 8%
Epilepsy 226 7%
Kidney/urinary infection 156 5%
ENT infections 123 4%
Dental conditions 50 1%
Other PAH 223 7%
Total PAH 3,393 100% Source: NMDS
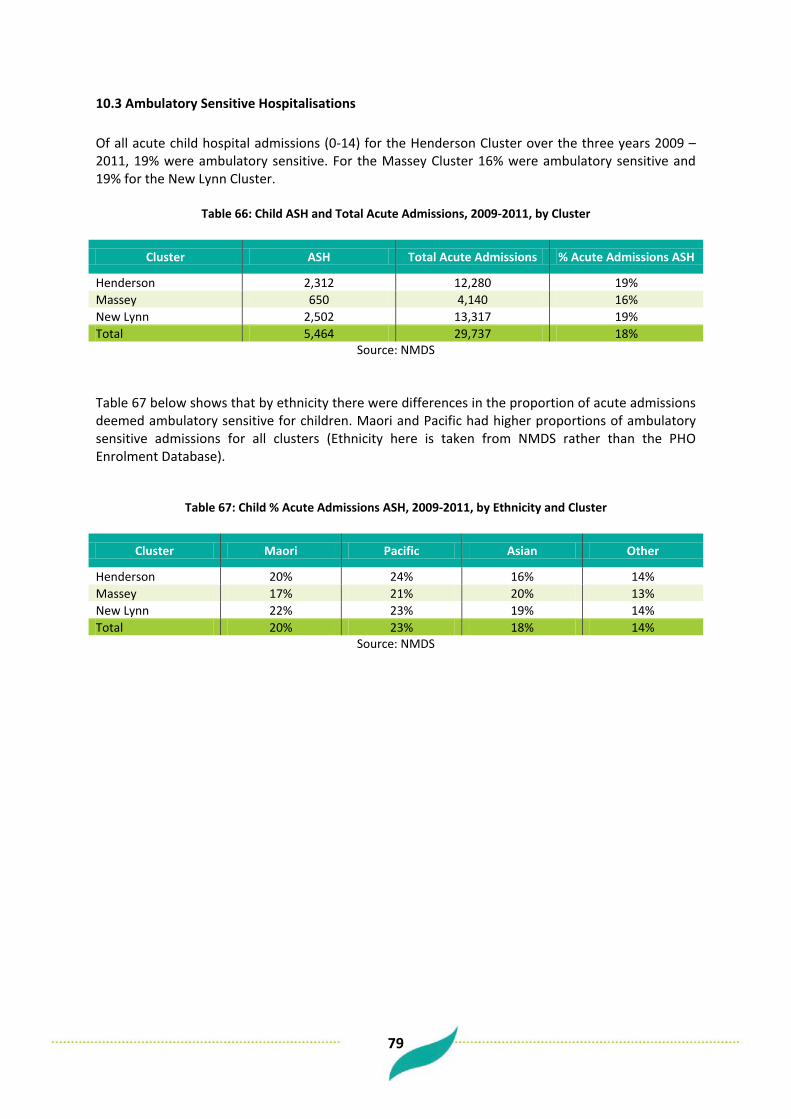
79
10.3 Ambulatory Sensitive Hospitalisations Of all acute child hospital admissions (0-14) for the Henderson Cluster over the three years 2009 – 2011, 19% were ambulatory sensitive. For the Massey Cluster 16% were ambulatory sensitive and 19% for the New Lynn Cluster.
Table 66: Child ASH and Total Acute Admissions, 2009-2011, by Cluster
Cluster ASH Total Acute Admissions % Acute Admissions ASH
Henderson 2,312 12,280 19% Massey 650 4,140 16% New Lynn 2,502 13,317 19% Total 5,464 29,737 18%
Source: NMDS Table 67 below shows that by ethnicity there were differences in the proportion of acute admissions deemed ambulatory sensitive for children. Maori and Pacific had higher proportions of ambulatory sensitive admissions for all clusters (Ethnicity here is taken from NMDS rather than the PHO Enrolment Database).
Table 67: Child % Acute Admissions ASH, 2009-2011, by Ethnicity and Cluster
Cluster Maori Pacific Asian Other
Henderson 20% 24% 16% 14% Massey 17% 21% 20% 13% New Lynn 22% 23% 19% 14% Total 20% 23% 18% 14%
Source: NMDS
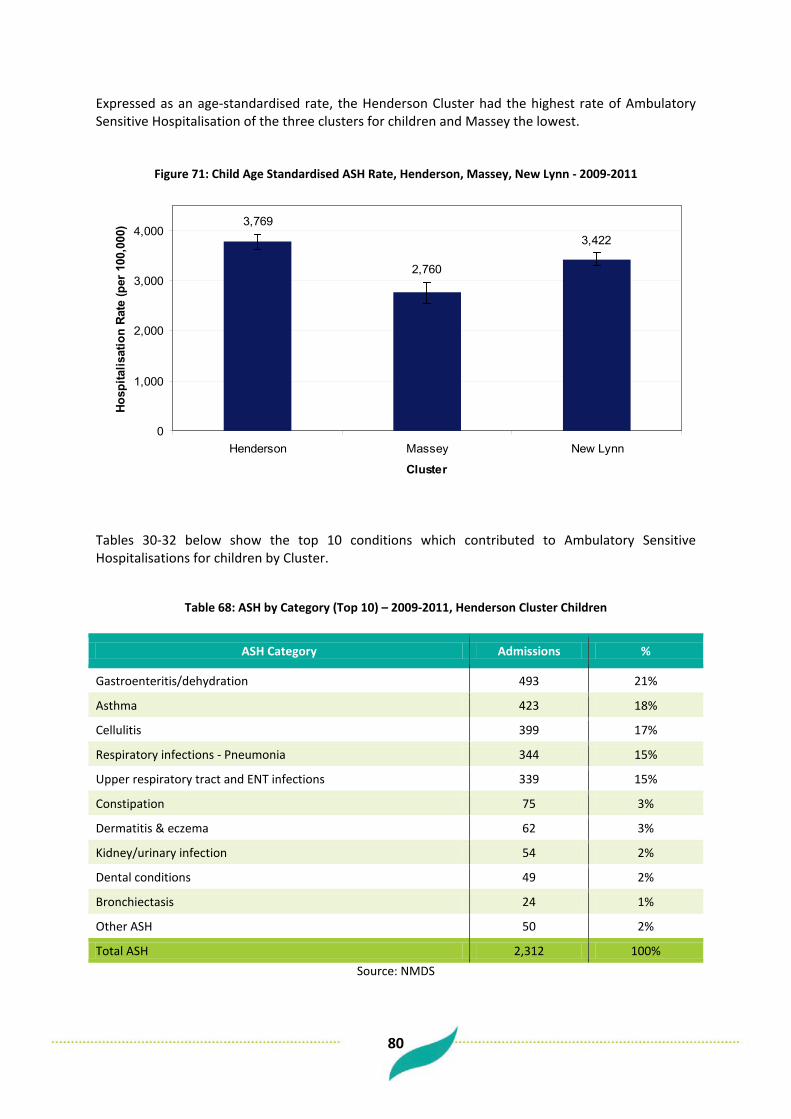
80
Expressed as an age-standardised rate, the Henderson Cluster had the highest rate of Ambulatory Sensitive Hospitalisation of the three clusters for children and Massey the lowest.
Figure 71: Child Age Standardised ASH Rate, Henderson, Massey, New Lynn - 2009-2011
3,769
2,760
3,422
0
1,000
2,000
3,000
4,000
Henderson Massey New Lynn
Cluster
Hosp
italis
atio
n Ra
te (p
er 1
00,0
00)
Tables 30-32 below show the top 10 conditions which contributed to Ambulatory Sensitive Hospitalisations for children by Cluster.
Table 68: ASH by Category (Top 10) – 2009-2011, Henderson Cluster Children
ASH Category Admissions %
Gastroenteritis/dehydration 493 21%
Asthma 423 18%
Cellulitis 399 17%
Respiratory infections - Pneumonia 344 15%
Upper respiratory tract and ENT infections 339 15%
Constipation 75 3%
Dermatitis & eczema 62 3%
Kidney/urinary infection 54 2%
Dental conditions 49 2%
Bronchiectasis 24 1%
Other ASH 50 2%
Total ASH 2,312 100% Source: NMDS

81
Table 69: ASH by Category (Top 10) – 2009-2011, Massey Cluster Children
ASH Category Admissions %
Gastroenteritis/dehydration 169 26%
Asthma 156 24%
Upper respiratory tract and ENT infections 108 17%
Respiratory infections - Pneumonia 93 14%
Cellulitis 72 11%
GORD (Gastro-oesophageal reflux disease) 13 2%
Dermatitis & eczema 13 2%
Constipation 9 1%
Kidney/urinary infection 7 1%
Dental conditions 7 1%
Other ASH 3 1%
Total ASH 650 100% Source: NMDS
Table 70: ASH by Category (Top 10) – 2009-2011, New Lynn Cluster Children
ASH Category Admissions %
Gastroenteritis/dehydration 559 22%
Asthma 533 21%
Cellulitis 396 16%
Respiratory infections - Pneumonia 376 15%
Upper respiratory tract and ENT infections 339 14%
Constipation 76 3%
Dermatitis & eczema 60 2%
Dental conditions 48 2%
Kidney/urinary infection 46 2%
GORD (Gastro-oesophageal reflux disease) 24 1%
Other ASH 45 2%
Total ASH 2,502 100% Source: NMDS

82
10.4 Asthma Admissions
Over the three years 2009 – 2011 there were 400 child (0-14) hospital admissions with a primary diagnosis of asthma from the Henderson Cluster. From the Massey Cluster there were 150 and from the New Lynn Cluster there were 500. Expressed as an age-standardised rate, the New Lynn Cluster had the highest rate of asthma admissions for children of the three clusters. However, the rate differences were not statistically significant.
Figure 72: Child Age Standardised Asthma Admission Rate, Henderson, Massey, New Lynn - 2009-2011
731670694
0
500
1,000
Henderson Massey New Lynn
Cluster
Hosp
italis
atio
n Ra
te (p
er 1
00,0
00)
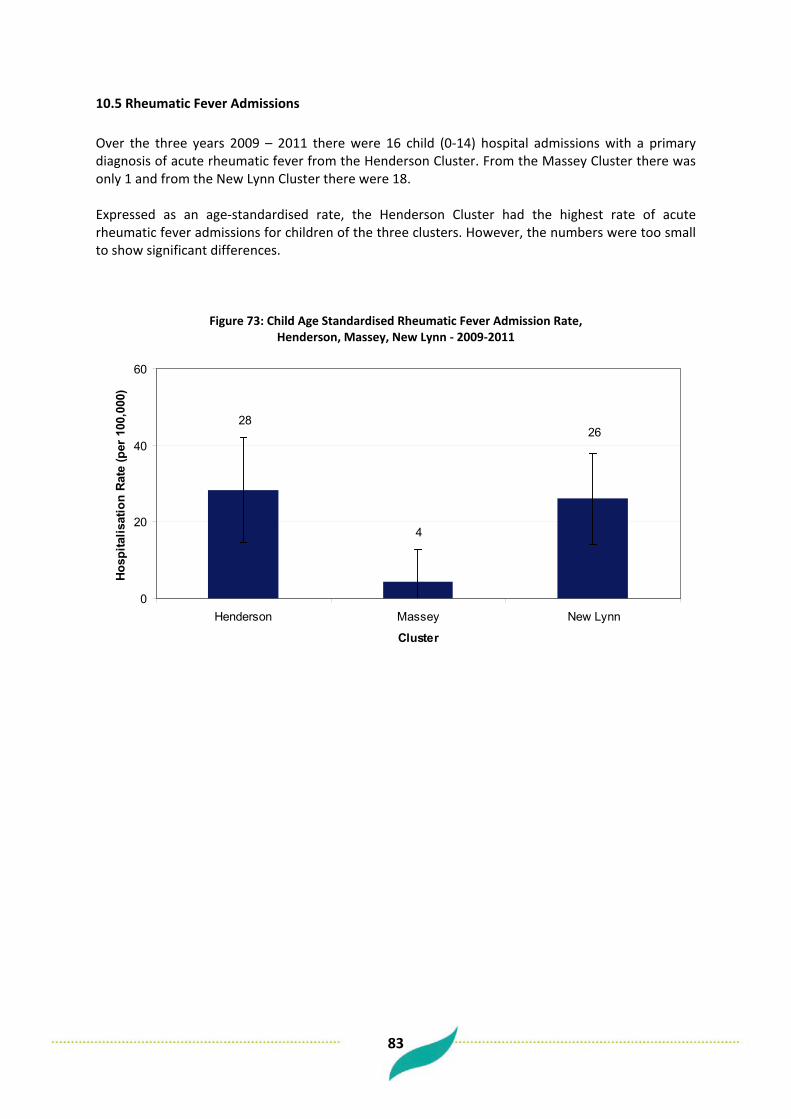
83
10.5 Rheumatic Fever Admissions
Over the three years 2009 – 2011 there were 16 child (0-14) hospital admissions with a primary diagnosis of acute rheumatic fever from the Henderson Cluster. From the Massey Cluster there was only 1 and from the New Lynn Cluster there were 18. Expressed as an age-standardised rate, the Henderson Cluster had the highest rate of acute rheumatic fever admissions for children of the three clusters. However, the numbers were too small to show significant differences.
Figure 73: Child Age Standardised Rheumatic Fever Admission Rate, Henderson, Massey, New Lynn - 2009-2011
26
4
28
0
20
40
60
Henderson Massey New Lynn
Cluster
Hosp
italis
atio
n Ra
te (p
er 1
00,0
00)
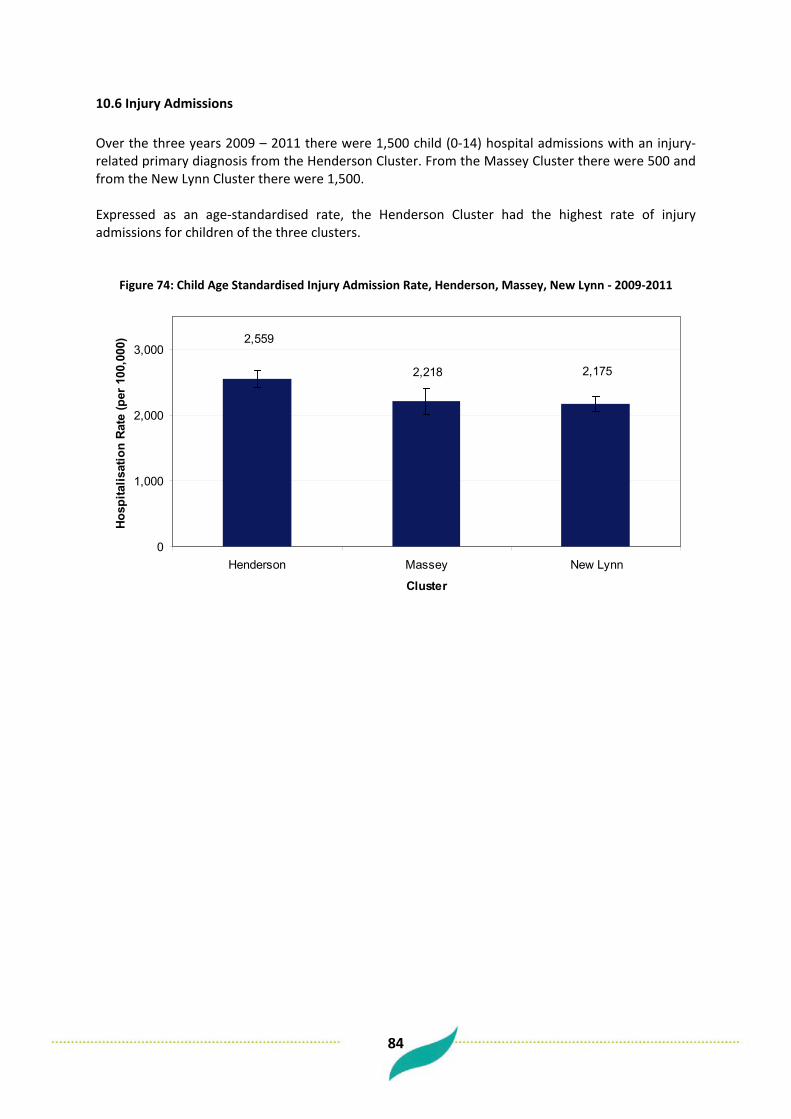
84
10.6 Injury Admissions Over the three years 2009 – 2011 there were 1,500 child (0-14) hospital admissions with an injury-related primary diagnosis from the Henderson Cluster. From the Massey Cluster there were 500 and from the New Lynn Cluster there were 1,500. Expressed as an age-standardised rate, the Henderson Cluster had the highest rate of injury admissions for children of the three clusters.
Figure 74: Child Age Standardised Injury Admission Rate, Henderson, Massey, New Lynn - 2009-2011
2,1752,218
2,559
0
1,000
2,000
3,000
Henderson Massey New Lynn
Cluster
Hosp
italis
atio
n Ra
te (p
er 1
00,0
00)
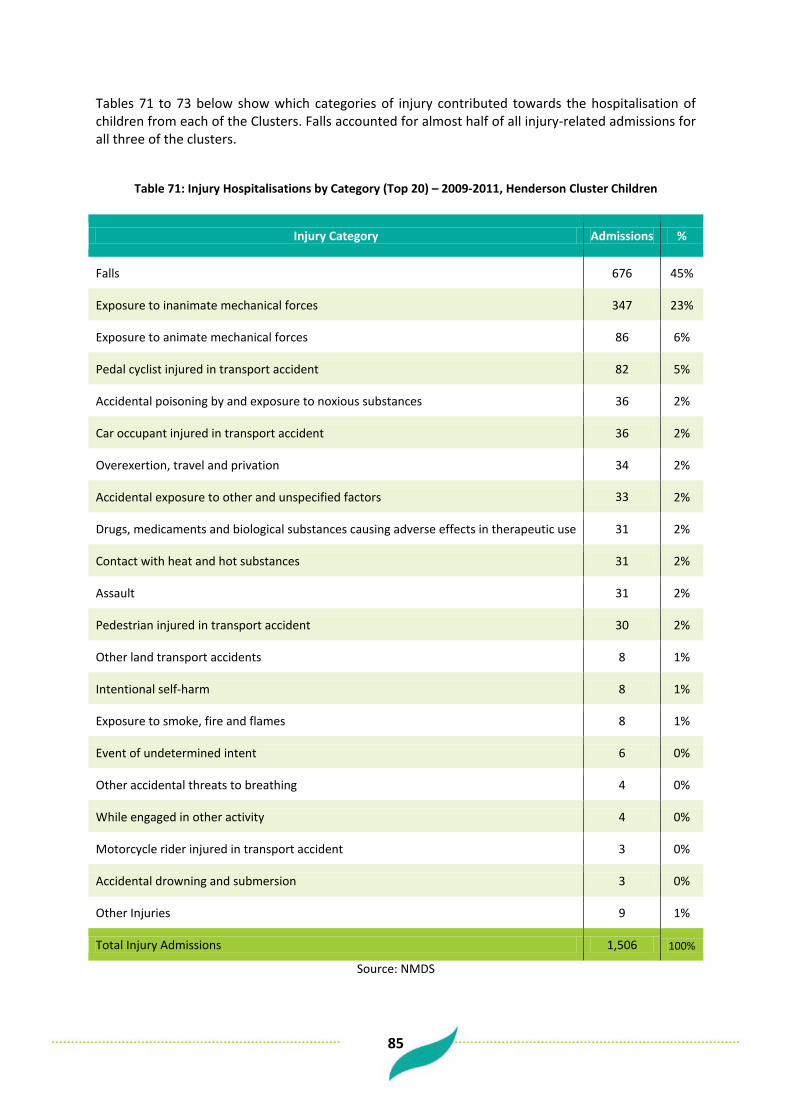
85
Tables 71 to 73 below show which categories of injury contributed towards the hospitalisation of children from each of the Clusters. Falls accounted for almost half of all injury-related admissions for all three of the clusters.
Table 71: Injury Hospitalisations by Category (Top 20) – 2009-2011, Henderson Cluster Children
Injury Category Admissions %
Falls 676 45%
Exposure to inanimate mechanical forces 347 23%
Exposure to animate mechanical forces 86 6%
Pedal cyclist injured in transport accident 82 5%
Accidental poisoning by and exposure to noxious substances 36 2%
Car occupant injured in transport accident 36 2%
Overexertion, travel and privation 34 2%
Accidental exposure to other and unspecified factors 33 2%
Drugs, medicaments and biological substances causing adverse effects in therapeutic use 31 2%
Contact with heat and hot substances 31 2%
Assault 31 2%
Pedestrian injured in transport accident 30 2%
Other land transport accidents 8 1%
Intentional self-harm 8 1%
Exposure to smoke, fire and flames 8 1%
Event of undetermined intent 6 0%
Other accidental threats to breathing 4 0%
While engaged in other activity 4 0%
Motorcycle rider injured in transport accident 3 0%
Accidental drowning and submersion 3 0%
Other Injuries 9 1%
Total Injury Admissions 1,506 100%
Source: NMDS
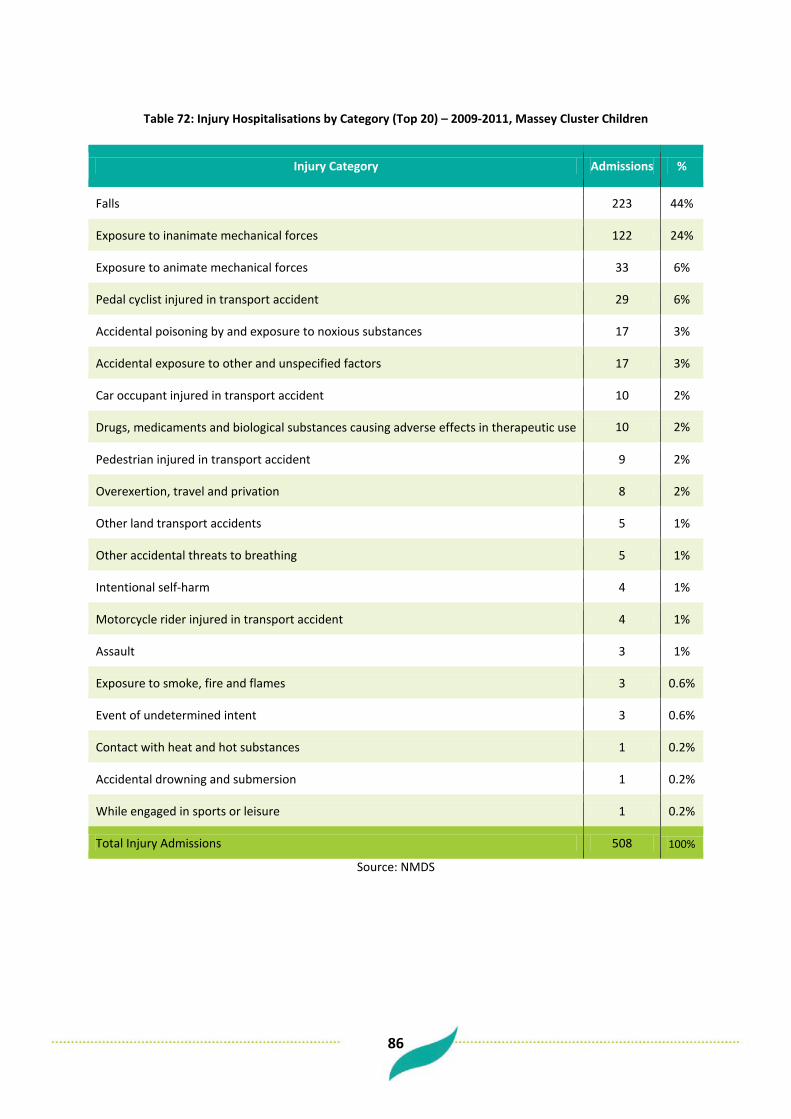
86
Table 72: Injury Hospitalisations by Category (Top 20) – 2009-2011, Massey Cluster Children
Injury Category Admissions %
Falls 223 44%
Exposure to inanimate mechanical forces 122 24%
Exposure to animate mechanical forces 33 6%
Pedal cyclist injured in transport accident 29 6%
Accidental poisoning by and exposure to noxious substances 17 3%
Accidental exposure to other and unspecified factors 17 3%
Car occupant injured in transport accident 10 2%
Drugs, medicaments and biological substances causing adverse effects in therapeutic use 10 2%
Pedestrian injured in transport accident 9 2%
Overexertion, travel and privation 8 2%
Other land transport accidents 5 1%
Other accidental threats to breathing 5 1%
Intentional self-harm 4 1%
Motorcycle rider injured in transport accident 4 1%
Assault 3 1%
Exposure to smoke, fire and flames 3 0.6%
Event of undetermined intent 3 0.6%
Contact with heat and hot substances 1 0.2%
Accidental drowning and submersion 1 0.2%
While engaged in sports or leisure 1 0.2%
Total Injury Admissions 508 100%
Source: NMDS

87
Table 73: Injury Hospitalisations by Category (Top 20) – 2009-2011, New Lynn Cluster Children
Injury Category Admissions %
Falls 715 47%
Exposure to inanimate mechanical forces 378 25%
Exposure to animate mechanical forces 84 6%
Pedal cyclist injured in transport accident 66 4%
Accidental poisoning by and exposure to noxious substances 64 4%
Accidental exposure to other and unspecified factors 39 3%
Drugs, medicaments and biological substances causing adverse effects in therapeutic use 34 2%
Overexertion, travel and privation 27 2%
Car occupant injured in transport accident 24 2%
Pedestrian injured in transport accident 24 2%
Contact with heat and hot substances 21 1%
Intentional self-harm 14 1%
Assault 14 1%
Other land transport accidents 13 1%
Other accidental threats to breathing 8 1%
Exposure to smoke, fire and flames 6 0.4%
Event of undetermined intent 6 0.4%
Accidental drowning and submersion 3 0.2%
Contact with venomous animals and plants 3 0.2%
Motorcycle rider injured in transport accident 2 0.1%
Other Injuries 6 0.4%
Total Injury Admissions 1,551 100%
Source: NMDS

88
10.7 Oral Health Admissions
Over the three years 2009 – 2011 there were 400 child (0-14) hospital admissions for West Auckland children with a dental caries or oral health issue primary diagnosis from the Henderson Cluster. From the Massey Cluster there were 150 and from the New Lynn Cluster there were 500. Expressed as an age-standardised rate, the Henderson Cluster had the highest rate of oral health admissions for children of the three clusters. However, the differences were not significantly different.
Figure 75: Child Age Standardised Dental Caries and Oral Health Admission Rate, Henderson, Massey, New Lynn - 2009-2011
669645701
0
500
1,000
Henderson Massey New Lynn
Cluster
Hosp
italis
atio
n Ra
te (p
er 1
00,0
00)

89
10.8 Emergency Department Attendances For the financial year 2009/10 there were 5,000 child (0-14) Emergency Department attendances from the Henderson Cluster. From the Massey Cluster there were 1,300 and from the New Lynn Cluster there were 5,300. (Note: more recent year data was not available due to data availability issues). Expressed as an age-standardised rate, the Henderson Cluster had the highest rate of ED attendance for children.
Figure 76: Child Age Standardised ED Attendance Rate, Henderson, Massey, New Lynn - 2009/10
24,883
21,831
17,192
0
5,000
10,000
15,000
20,000
25,000
30,000
Henderson Massey New Lynn
Cluster
ED A
ttend
ance
Rat
e (p
er 1
00,0
00)

90
Appendices These appendices contain information on data sources and definitions used throughout this report. Appendix 1 - WHO Standard Population WHO World Standard Population Distribution (%), based on world average population between 2000 and 2025.
Age Group % Per 100,000
0-4 8.86 8860
05-09 8.69 8690
10-14 8.6 8600
15-19 8.47 8470
20-24 8.22 8220
25-29 7.93 7930
30-34 7.61 7610
35-39 7.15 7150
40-44 6.59 6590
45-49 6.04 6040
50-54 5.37 5370
55-59 4.55 4550
60-64 3.72 3720
65-69 2.96 2960
70-74 2.21 2210
75-79 1.52 1520
80-84 0.91 910
85-89 0.44 440
90-94 0.15 150
95-99 0.04 40
100+ 0.005 5

91
Appendix 2 - Ethnicity Throughout this report prioritised ethnicity is used. In the ‘prioritised’ method, each respondent is allocated to a single ethnic group using the priority system. At level 1 the system places Maori first then Pacific peoples, then Asian peoples and finally other peoples. For example a person who selects (when asked their ethnicity) both Maori and European would only be included in the Maori grouping. Prioritisation for Level 2 ethnicity The table below shows priority order of each ethnic group.
Priority Order Ethnic group code (L2) Ethnic group code description
1 21 Maori
2 35 Tokelauan
3 36 Fijian
4 34 Niuean
5 33 Tongan
6 32 Cook Island Maori
7 31 Samoan
8 37 Other Pacific Island
9 30 Pacific Island NFD*
10 41 South East Asian
11 43 Indian
12 42 Chinese
13 44 Other Asian
14 40 Asian NFD
15 52 Latin American / Hispanic
16 53 African
17 51 Middle Eastern
18 54 Other
19 12 Other European
20 10 European NFD
21 11 NZ European
Note: NFD = Not Further Defined

92
Appendix 3 - Potentially Avoidable Mortality (PAM) indicators and their ICD 10 Codes
PAM Group categories Condition description ICD-10 Diagnosis Codes
Infections Pulmonary tuberculosis A15 Meningococcal disease A39 Pneumococcal disease J13, A40.3, G00.1 HIV/AIDS B20-B24 Cancers Stomach C16 Rectum C19-C21 Melanoma C43 Female breast C50 Cervix C53 Testis C62 Prostate C61 Thyroid C73 Bone & cartilage C40-C41 Hodgkin’s disease C81 Acute lymphocytic leukaemia C91.0 Maternal & newborn Complications of pregnancy O01-O99 Complications of the perinatal period P02-P94 Congenital heart disease (subset) Q21 Chronic disorders Diabetes E10-E14 Valvular heart disease I01, I05-I09, I33-I37 Hypertensive diseases I10-I15 Coronary disease I20-I25 Heart failure I50 Cerebrovascular diseases I60-I69 Renal failure N17-N18 Pulmonary embolism I26 COPD J42 Asthma J45-J46 Peptic ulcer disease K25-K26 Cholelithiasis K80 Injuries Suicide X60 –X84 Road traffic accidents V01-V79, V87, V89, V99 Falls (Fracture Neck of Femur) S72 Burns T20-T31 Adverse health care events (subset) T80-T88

93
Appendix 4 - Potentially Avoidable Hospitalisation (PAH) indicators and their ICD 10 Codes PAH Categories ICD-10 Diagnosis Codes Alcohol related conditions F10, I426, K290, K70 Angina and chest pain I20, R072-R074 Asthma J45-J46 Breast cancer C50 Cellulitis H000, H010, H050, J340, K122, L01-L04, L08, L980 Cervical cancer C53 Colo-rectal cancer C18-C21 Congestive heart failure I50, J81 CORD J40-J44, J47 Dehydration E86, E870 Dental conditions K00-K06, K08 Diabetes E10-E14, E162 ENT infections H65-H67, H70, J01-J03 Epilepsy G40-G41, O15, R560, R568 Failure to thrive R62, R633, P923 Gangrene R02 Gastroenteritis A01-A09 Hepatitis and liver cancer B15-B19, C220, C221, C229, P353 HIV /AIDS B20-B24 Hypertensive disease I10-I15, I674 Immunisation preventable - Hib A413, A492, B9631, B9639, G000 Immunisation preventable - MMR B05, B06,B26, M014, P350 Immunisation preventable - Other A33-A35, A36, A80 Immunisation preventable - Whooping cough A37 Kidney/urinary infection N10, N12, N136, N390 Legionnaires' disease A481, A482 Lung cancer C33-C34 Meningococcal infection A39,M010,M030 Myocardial infarction I21-I23;I241 Nutrition D50-D53, E40-E46, E50-E64, M833 Obstructed hernia K400, K401, K403, K404, K410, K411, K413, K414, K420,
K421, K430, K431, K440, K441, K450, K451, K460, K461 Oral cancers C01-C06, C09, C10 Other infections A23, A26, A28, A32, A38, A46, B50-B54, P23, P351, P352,
P358, P359, P36, P371-P379 Other ischaemic heart disease I240, I248,I249, I25 Peptic ulcer K25-K28 Respiratory infections - Acute bronchiolitis J21 Respiratory infections - Other J00, J06, J10-J11, J20 Respiratory infections - Pneumonia J13-J16, J18 Rheumatic fever/heart disease I00-I09 Ruptured appendix K350, K351 Sexually transmitted diseases A50-A59,A60, A63, A64, I980, M023, M031, M730, M731,
N290, N341, N70-N77, O00 Skin cancers C00, C43, C44 Stroke I61, I63-I66 Thyroid disease E00-E05, E890 Tuberculosis A150-A199,B900-B909, M011, P370
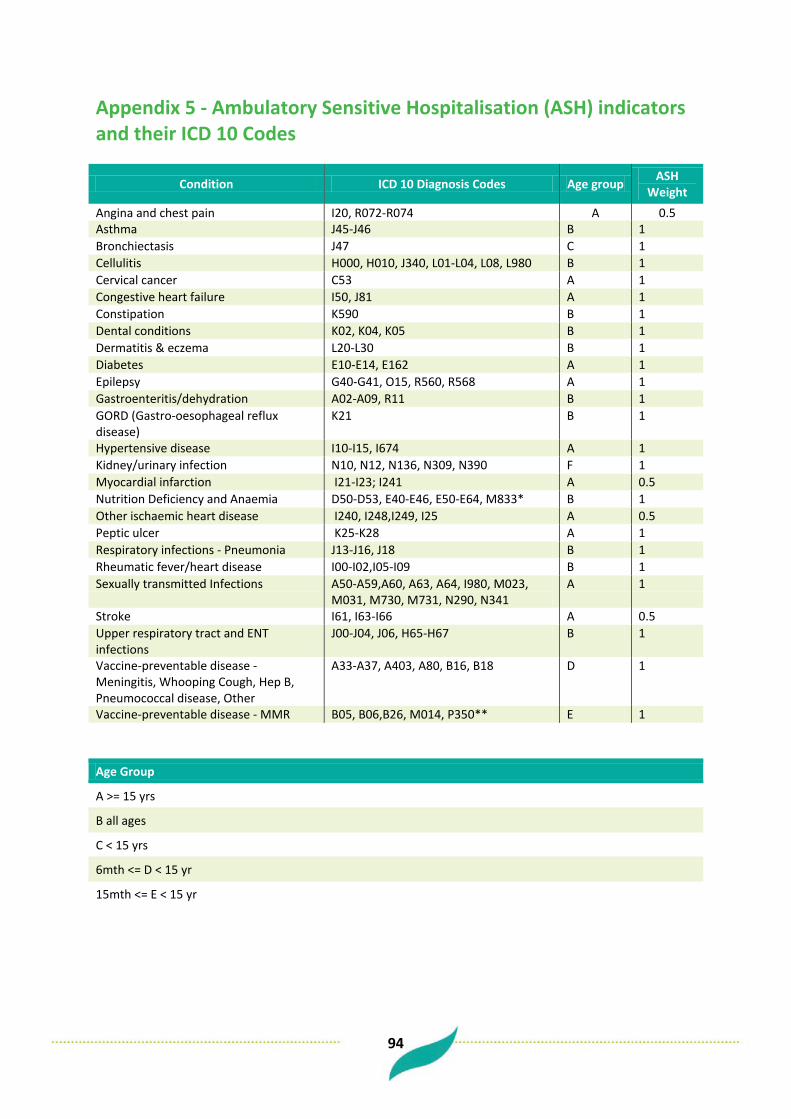
94
Appendix 5 - Ambulatory Sensitive Hospitalisation (ASH) indicators and their ICD 10 Codes
Condition ICD 10 Diagnosis Codes Age group ASH Weight
Angina and chest pain I20, R072-R074 A 0.5 Asthma J45-J46 B 1 Bronchiectasis J47 C 1 Cellulitis H000, H010, J340, L01-L04, L08, L980 B 1 Cervical cancer C53 A 1 Congestive heart failure I50, J81 A 1 Constipation K590 B 1 Dental conditions K02, K04, K05 B 1 Dermatitis & eczema L20-L30 B 1 Diabetes E10-E14, E162 A 1 Epilepsy G40-G41, O15, R560, R568 A 1 Gastroenteritis/dehydration A02-A09, R11 B 1 GORD (Gastro-oesophageal reflux disease)
K21 B 1
Hypertensive disease I10-I15, I674 A 1 Kidney/urinary infection N10, N12, N136, N309, N390 F 1 Myocardial infarction I21-I23; I241 A 0.5 Nutrition Deficiency and Anaemia D50-D53, E40-E46, E50-E64, M833* B 1 Other ischaemic heart disease I240, I248,I249, I25 A 0.5 Peptic ulcer K25-K28 A 1 Respiratory infections - Pneumonia J13-J16, J18 B 1 Rheumatic fever/heart disease I00-I02,I05-I09 B 1 Sexually transmitted Infections A50-A59,A60, A63, A64, I980, M023,
M031, M730, M731, N290, N341 A 1
Stroke I61, I63-I66 A 0.5 Upper respiratory tract and ENT infections
J00-J04, J06, H65-H67 B 1
Vaccine-preventable disease - Meningitis, Whooping Cough, Hep B, Pneumococcal disease, Other
A33-A37, A403, A80, B16, B18 D 1
Vaccine-preventable disease - MMR B05, B06,B26, M014, P350** E 1 Age Group
A >= 15 yrs
B all ages
C < 15 yrs
6mth <= D < 15 yr
15mth <= E < 15 yr
F >= 5 yrs
95
Appendix 6 - Data Sources Hospitalisation data Data on the morbidity of various diseases and conditions are primarily based on all discharges from public hospitals. This is known as the National Minimum Data Set (NMDS). Day cases are included in this data but attendances at outpatient clinics or emergency departments (which don’t lead to an admission) are not included. Analysis of hospitalisation data focuses on the number of episodes of care rather than the number of individual people. Hospital data include patients who die in hospital after formal admission. A general issue when using hospitalisation rates for outcome measures is that reductions in such rates can reflect either a real decrease in incidence, improved primary health care (thus reducing the need for hospital care), or a decrease in access to (or provision of) hospital services. The relative importance of these factors is hard to quantify. Outpatient and ED data The National Non-Admitted Patient Data Collection (NNPAC) was introduced in July 2006 and provides nationally consistent data on non-admitted patient activity. Information about use of outpatient clinics and emergency departments was drawn from this source. Mortality data The mortality statistics maintained by NZHIS are based on death certificates completed by medical practitioners, post-mortem reports, coroners’ certificates, and death registration forms completed by funeral directors. Supplementary data are obtained from a variety of other sources (such as public hospitals and the National Cancer Registry). Mortality data for 3 years was used in an attempt to ensure sufficient numbers for analysis. The 2006/07 New Zealand Health Survey This face-to-face survey was completed over a one year period between 2006 and 2007. It had a sample size of 12,488 adults (15 years and older) and 4,921 children (0-14 years). Approximately 1,200 adults were sampled in the Waitemata district. The response rate was 68% for adults and 71% for children. The survey provides information on: • Selected health risk behaviours (smoking, physical activity and alcohol use). • The health status of New Zealanders, including their self-reported physical and mental health
status, and the prevalence of selected conditions including diabetes. • The utilisation of health services. • A number of demographic characteristics such as age, gender, ethnicity, and income. Where estimates are provided for Waitemata populations they may be either direct survey estimates or synthetic estimates. Since the sample sizes for the overall Waitemata population were reasonably large direct estimates can be calculated using only the respondents from Waitemata
96
District. However, for ethnic specific estimates, sample sizes were too small so estimates were derived by the Health & Disability Intelligence Unit (HDIU), Ministry of Health from a statistical regression model. These estimates were only available for adults. Census and demographic data A New Zealand Census of Population and Dwellings is held every five years. Every person in the country on census night, including visitors to the country, must fill out an individual census form. The last Census was carried out in March 2006. The New Zealand Census collects limited health information but contains much social and economic information that is useful in describing the factors that determine health. In addition, the Census forms the basis for determining Waitemata’s and New Zealand’s denominator populations. Projections of population sizes for the years after 2006 and estimates of population sizes up to 2011 have been made. Projections are made on the basis of assumptions about a number of factors including migration, fertility, and mortality. However, it is worth noting that projections cannot be guaranteed to be completely accurate. Birth registrations This includes all live and still births registrations from Births, Deaths, and Marriages. PHO Enrolment data The PHO Enrolment database is a national collection of publicly funded primary health information for patients enrolled with a PHO. Unit record data is collected and stored. The collection was established in 2005.

97
Bibliography Huakau, J. (2009). Health Needs Assessment for Pacific people in Waitemata. February 2009. North Shore City: Waitemata District Health Board. Ministry of Health. (2004). Ethnicity data protocols for health and disability sector. Wellington: Ministry of Health. Ministry of Health. (2008). A Portrait of Health. Key Results of the 2006/07 New Zealand Health Survey. Wellington: Ministry of Health. Perumal L. (2010). Health Needs Assessment of Middle Eastern, Latin American and African people living in the Auckland region. Auckland: Auckland District Health Board. Wang, K. (2012). Area Unit Estimated Population by Age, Gender and Prioritised Ethnic Groups, 1996-2031. Auckland: Counties Manukau District Health Board. Zhou, L. (2009). Health Needs Assessment for Asian people in Waitemata. February 2009. North Shore City: Waitemata District Health Board. ISBN 978-0-473-22568-1 (paperback) ISBN 978-0-473-22569-8 (PDF)