Embed Size (px)
Citation preview
*
MA
RT
HA
'S
VN
E
YA R D L A N D
BAN
KC
OM
NS
SI
O
1 9 8 6.TS
E*
MI
I
Manaquayak Preserve West Tisbury,
Massachusetts
Management Plan
December 16, 2015
Approved by the West Tisbury Town Advisory Board () Approved by the Martha’s Vineyard Land Bank Commission () Approved by the Secretary of the Executive Office of Energy and Environmental Affairs () Julie Russell – Ecologist Matthew Dix – Property Foreman Maureen Hill – Administrative Assistant Matthew Miners and Nicholas Uline – Ecology Interns
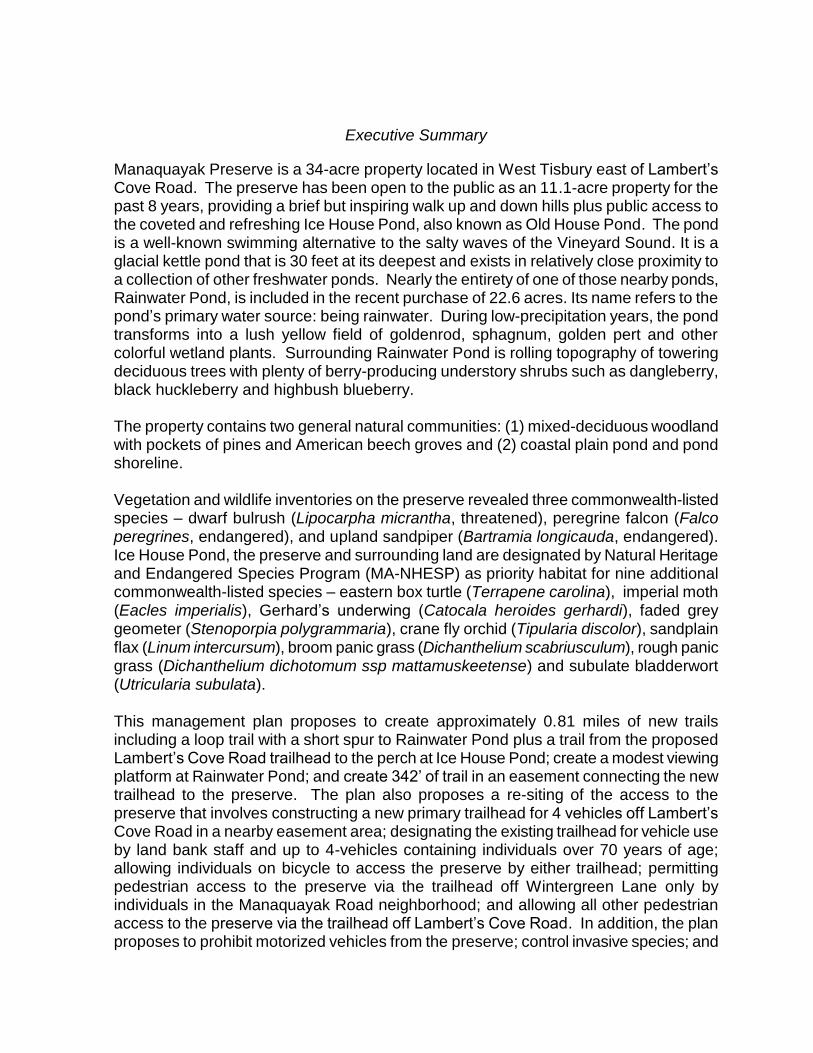
Executive Summary
Manaquayak Preserve is a 34-acre property located in West Tisbury east of Lambert’s Cove Road. The preserve has been open to the public as an 11.1-acre property for the past 8 years, providing a brief but inspiring walk up and down hills plus public access to the coveted and refreshing Ice House Pond, also known as Old House Pond. The pond is a well-known swimming alternative to the salty waves of the Vineyard Sound. It is a glacial kettle pond that is 30 feet at its deepest and exists in relatively close proximity to a collection of other freshwater ponds. Nearly the entirety of one of those nearby ponds, Rainwater Pond, is included in the recent purchase of 22.6 acres. Its name refers to the pond’s primary water source: being rainwater. During low-precipitation years, the pond transforms into a lush yellow field of goldenrod, sphagnum, golden pert and other colorful wetland plants. Surrounding Rainwater Pond is rolling topography of towering deciduous trees with plenty of berry-producing understory shrubs such as dangleberry, black huckleberry and highbush blueberry. The property contains two general natural communities: (1) mixed-deciduous woodland with pockets of pines and American beech groves and (2) coastal plain pond and pond shoreline. Vegetation and wildlife inventories on the preserve revealed three commonwealth-listed species – dwarf bulrush (Lipocarpha micrantha, threatened), peregrine falcon (Falco peregrines, endangered), and upland sandpiper (Bartramia longicauda, endangered). Ice House Pond, the preserve and surrounding land are designated by Natural Heritage and Endangered Species Program (MA-NHESP) as priority habitat for nine additional commonwealth-listed species – eastern box turtle (Terrapene carolina), imperial moth (Eacles imperialis), Gerhard’s underwing (Catocala heroides gerhardi), faded grey geometer (Stenoporpia polygrammaria), crane fly orchid (Tipularia discolor), sandplain flax (Linum intercursum), broom panic grass (Dichanthelium scabriusculum), rough panic grass (Dichanthelium dichotomum ssp mattamuskeetense) and subulate bladderwort (Utricularia subulata). This management plan proposes to create approximately 0.81 miles of new trails including a loop trail with a short spur to Rainwater Pond plus a trail from the proposed Lambert’s Cove Road trailhead to the perch at Ice House Pond; create a modest viewing platform at Rainwater Pond; and create 342’ of trail in an easement connecting the new trailhead to the preserve. The plan also proposes a re-siting of the access to the preserve that involves constructing a new primary trailhead for 4 vehicles off Lambert’s Cove Road in a nearby easement area; designating the existing trailhead for vehicle use by land bank staff and up to 4-vehicles containing individuals over 70 years of age; allowing individuals on bicycle to access the preserve by either trailhead; permitting pedestrian access to the preserve via the trailhead off Wintergreen Lane only by individuals in the Manaquayak Road neighborhood; and allowing all other pedestrian access to the preserve via the trailhead off Lambert’s Cove Road. In addition, the plan proposes to prohibit motorized vehicles from the preserve; control invasive species; and
allow hunting as recommended by the land bank hunting subcommittee on the southern 22.6 acres of the preserve. To protect the ponds and their shores, the plan proposes to continue: to provide one access to Ice House Pond via the swimming perch; to maintain a 20- person quota of preserve visitors in Ice House Pond at any one time; to manage woody growth in the coastal plain pond shoreline; to restrict access to the shoreline; to restrict dogs to a leash and restrict dogs and horses to the upland trail only; to provide a portable toilet at the Wintergreen Lane trailhead; and to prohibit access for boating and fishing (except ice fishing) in the ponds. The plan proposes to promote the tranquil essence of the pond and reduce the entrance of exotic invasive species into the pond by prohibiting the use of water accessories (e.g., paddle, kick and boogie boards and floats) except those that are worn on one’s person such as life preserver, goggles, swim cap, swimsuit/wetsuit and swim-fins. Additionally, all land bank literature and communication regarding the pond will encourage people to arrive via foot or bicycle, rather than motor vehicle, and will encourage people not to bring their dogs. One or more property attendants will care for the property, as needed. The final section of the management plan outlines in detail all planning goals, objectives and strategies. To be implemented, this plan must be presented at a public hearing and approved by the land bank’s West Tisbury town advisory board, the Martha’s Vineyard land bank commission and the secretary of the Massachusetts executive office of energy and environmental affairs (EOEEA). Additionally, a notice of intent and Massachusetts endangered species act (MESA) review will be filed with the West Tisbury conservation commission and MA-NHESP for activity proposed in estimated and priority habitat for rare species and activities proposed in and around wetland resource areas. About the authors Julie Russell is the primary author and has been the land bank ecologist since August 1999. She is certified as a Wildlife Biologist by the Wildlife Society and holds a Master of Science in zoology from the Cooperative Wildlife Research Lab at Southern Illinois University, Carbondale, and a Bachelor of Science in wildlife biology from the School of Natural Resources at the University of Vermont. Property Foreman Matthew Dix has worked on land bank properties since 1990. He attended the School of Natural Resources at the University of Vermont and has extensive knowledge of the region’s agriculture, natural history and local geography. Maureen McManus-Hill has been the administrative assistant since July of 2006; she has a Bachelor of Arts in economics from Lafayette College. Nicholas Uline was an ecology intern in 2015 summer field season; he graduated from Gettysburg College with a degree in Environmental Studies. Matthew Miners also was an ecology intern in 2015 summer field season; he attends SUNY- Cobleskill.

Aquinnah Headlands Preserve, Aquinnah, MA
North Head Site Management Map
MANAQUAYAK PRESERVE MANAGEMENT PLAN
5
Table of Contents I. Natural Resource Inventory ....................................................................................................................... 6
A. Physical Characteristics ....................................................................................................................... 6 1. Locus................................................................................................................................................. 6 2. Survey Maps, Deeds and Preliminary Management Plan Goals ...................................................... 6 3. Geology and Soils ............................................................................................................................. 6 4. Topography ....................................................................................................................................... 7 5. Hydrology, Bathymetry ...................................................................................................................... 8 6. Ecological Processes ......................................................................................................................... 9
B. Biological Characteristics ................................................................................................................... 15 1. Vegetation ........................................................................................................................................ 15 2. Water Quality of Ice House Pond ..................................................................................................... 16 3. Wildlife Habitat ................................................................................................................................. 18
C. Cultural Characteristics ...................................................................................................................... 20 1. Land History ..................................................................................................................................... 20 2. Planning Concerns ........................................................................................................................... 25 3. Abutters ........................................................................................................................................... 25 4. Existing Use and Infrastructure ........................................................................................................ 25
II. Inventory Analysis ................................................................................................................................... 26 A. Constraints & Issues .......................................................................................................................... 26
1. Ecological Context ........................................................................................................................... 26 2. Natural and Cultural Resource Concerns ........................................................................................ 27 3. Sociological Context ......................................................................................................................... 30 4. Neighborhood Concerns ................................................................................................................. 30
B. Addressing Problems and Opportunities ............................................................................................ 31 1. Land Bank Mandate ........................................................................................................................ 31 2. Goals at Purchase .......................................................................................................................... 31 3. Opportunities .................................................................................................................................... 31 4. Universal Access (UA) .................................................................................................................... 32
III. Land Management Planning .................................................................................................................. 33 A. Nature Conservation .......................................................................................................................... 33 B. Recreation and Aesthetics ................................................................................................................. 37 C. Natural Products ................................................................................................................................ 41 D. Community Interaction ........................................................................................................................ 42 E. Land Administration ............................................................................................................................ 43
IV. Literature Cited ...................................................................................................................................... 45 Appendix A. Locus, Topography and Site Management Maps ................................................................... 50 Appendix B. Surveys, Deeds and Preliminary Management Plan Goals .................................................... 54 Appendix C. Soils Maps and Descriptions .................................................................................................. 87 Appendix D: Historical Maps ....................................................................................................................... 90 Appendix E: Vegetation ............................................................................................................................... 95 Appendix F. Wildlife .................................................................................................................................. 103 Appendix G. Avian Checklist and Seasonal Tables ................................................................................. 108 Appendix H. Endangered Species ............................................................................................................ 111 Appendix I. Abutters .................................................................................................................................. 114 Appendix J. Existing Use Map ................................................................................................................... 117 Appendix K. Universal Access .................................................................................................................. 117 Appendix L. Water Quality Reports for Ice House Pond ........................................................................... 119
MANAQUAYAK PRESERVE MANAGEMENT PLAN
6
I. Natural Resource Inventory
A. Physical Characteristics
1. Locus
Manaquayak Preserve is located at roughly 4125' 45.3'' N latitude and 7039' 39.1'' W longitude. The property consists of 33.7 acres located off Lambert’s Cove Road in West Tisbury. The preserve is shown on West Tisbury tax maps 7, parcels 61 and 60.1, and map 11, parcels 39 and a portion of 109. A Locus Map (USGS Topo 1973 1:24,000) follows in Appendix A.
2. Survey Maps, Deeds and Preliminary Management Plan Goals
Larger copies of all surveys are on file at the land bank office and are available for inspection by appointment. Deeds, preliminary management plan goals, covenants, restrictions, easements and reduced copies of surveys are included in Appendix B.
3. Geology and Soils
The General Soils Map (Appendix C) depicts soils classes across Martha’s Vineyard. Manaquayak Preserve occurs in “excessively drained sandy and loamy soils formed in reworked glacial outwash, ice-thrusted coastal plain sediments, or glacial till on moraines” (Soil Conservation Service (SCS) 1986). Outwash is material, primarily sand, that dropped out of suspension in glacial, meltwater streams as these streams slowed and spread on their advance to the Atlantic Ocean. Rocks and coarser stones compose the moraine that marks the furthest advance of the glaciers (Hale 1988). The reason for the layered deposits is that the moraine of the late Wisconsinan period was formed first as the Buzzards Bay lobe advanced and the outwash plain was formed later by meltwater from the Cape Cod Bay lobe as the glacier began to retreat (Oldale 1992). The Ice House Pond is a kettle pond formed many of thousands of years ago, after the retreat of the Laurentide ice sheet. As the glacier retreated large blocks of ice were left behind (Oldale 1992). This particular block of ice was approximately 100 feet thick or ten stories tall. The meltwater streams flowed around these staggering blocks of ice that were sometimes a mile wide and deposited more and more sand around the ice blocks. In time the smaller blocks of ice were completely hidden under outwash sand. Evidence suggests that kettle pond ice blocks were well insulated in their castles of sand and did not begin to melt for many years after the meltwater streams
MANAQUAYAK PRESERVE MANAGEMENT PLAN
7
stopped flowing (Strahler 1996). As the blocks of ice melted cavities of sand were formed typically with steep slopes and lacking an inlet or outlet. These cavities are referred to as kettles. A kettle pond will form in the crater after the ice melts if the bottom of a pond is below the ground water-table (Oldale 1992). Kettle ponds adopt a round smooth shape through erosion of sediment from surrounding ridges that is redeposited through wind currents to form beaches across small coves and nearshore sandy bottoms (Oldale 1992). Kettle ponds are not stagnant and recharge slowly by the moving groundwater that flows beneath the ponds through glacial deposits towards the ocean (Oldale 1992). Surface water historically flowed from the pond at Manaquayak Preserve to Uncle Seth’s Pond and then to James Pond (MacKenzie and Andrews 1997). However, the direction of groundwater flow is not yet determined and cannot be predicted from the direction of surface water flow. Rainwater Pond is peanut-shaped, shallow, does not appear to recharge through groundwater and has a man-made dam of earth and large stones. It does not appear to be a kettle pond. However, Rainwater Pond does not have an inflow or outflow of water and its water levels fluctuate based on precipitation levels resulting in the formation of a coastal plain pond shore habitat in and around the pond edges. Manaquayak Preserve contains two soil series: Eastchop loamy sand, very stony with 3 to 8 percent slopes (EdB), 8 to 15 percent slopes (EdC), and 15 to 25 percent slopes (EdD) and Eastchop loamy sand with 3 to 8 percent slopes (EcB), 8 to 15 percent slopes (EcC) and 15 to 35 percent (EcD). The majority of the preserve has a 3 to 15% slope with Eastchop loamy sand and is located primarily on the 22.6 acres of land added to the preserve in 2015. The stony soils and those soils on greater than 15% slope occur primarily on the northern portion on the preserve off Wintergreen Lane.
4. Topography
The elevation at Manaquayak Preserve ranges up to a maximum of 170 feet above sea level and has a slope differential of 0 - 35 %, with the steeper elevational changes occurring on the northern portion of the preserve and the highest hill occurring on the southern portion of the preserve. The contours of the property are illustrated in a portion of the USGS map (Topography Map,
MANAQUAYAK PRESERVE MANAGEMENT PLAN
8
Appendix A).
5. Hydrology, Bathymetry
Scientists delineate watersheds based on groundwater table elevations. The preserve is located in an area of the island where the U.S. Geological Survey has not yet defined groundwater elevations. The Marine Biological Laboratory delineated the watershed for Ice House Pond using surface elevation as an approximate alternative (Kinney and Valiela 2006 a). The report by Kinney and Valiela (2006 a) is attached in Appendix L.
Ice House Pond is a seepage pond of approximately 11.6 acres with an estimated volume of 43 million gallons of water. Pond size and volume fluctuate with seasonal and annual water levels and, based on high-water marks on surrounding trees, may change by an acre or 8 million gallons. Pond volume is derived from surface area in acres multiplied by average depth in feet from 48 random locations along seven transects where one acre-foot equals 325,850 gallons (Norland and Stockdale 1999). At the surface Ice House Pond is 83 feet above sea level. A preliminary bathymetry map created by William Wilcox of the Martha’s Vineyard Commission (MVC), indicates the pond has a moderately steep drop-off along much of its perimeter and has a gradual drop-off along the southeastern end and a somewhat gradual drop-off on the northwestern end of the pond. The depth of Ice House Pond is the feature that causes it to stand out amidst the other kettle ponds in the area. The pond is approximately 30 feet (9 meters) at its deepest in the southern portion of the pond. Rainwater Pond comprises 1.3 acres. A total of 0.61 acres of the pond is located within the preserve. Rainwater Pond is shallow with an average depth of approximately 2.5 feet and an estimated water capacity of 1 million gallons of water. During 2015, Rainwater Pond was without water in August. Aerial photographs indicate it contained water in 2014. The pond in one year transformed from open water to a lush wet meadow. As mentioned early in the Geology section, Ice House Pond is a kettle pond with a characteristic “coastal plain pond shoreline”. Kettle ponds are often dependent on groundwater that is influenced by rainfall/evaporation cycles. They have no inlets or outlets and are often acidic and nutrient poor (Sorrie
MANAQUAYAK PRESERVE MANAGEMENT PLAN
9
1994). However, due to slow rates of groundwater flushing, kettle ponds are more susceptible to anthropogenic nutrient inputs than ponds that are flushed through inlet and outlet streams. Ice House Pond has many of these characteristics with its sandy substrate, groundwater inputs, vegetated pond shoreline, rather steep slopes and lack of an inlet or outlet.
New England “coastal plain pond shorelines” are often but not exclusively created in kettle ponds. The rise and fall of water levels in the pond dictated by annual and seasonal fluctuations in groundwater creates the ever-changing pond shore that is characterized as a “coastal plain pond shoreline”. The temporary nature of the pond shore creates restrictive environments that only species adapted to the unique habitat characteristics of the various forms can survive. These unique plants have developed several adaptations in order to survive in such an unstable environment. Being submerged for part of a plant’s life and establishing a seed bank to ensure survival during a bad year are two major ways that these plants adapt to the pond shoreline. It may take up to five years or more for conditions to be dry enough for the pond shore community to grow and reach peak flower (Barbour et al. 1998). This habitat is present at Ice House and Rainwater Pond
Massachusetts Natural Heritage Program ranks coastal plain pond shores as vulnerable in Massachusetts “due to a restricted range, relatively few occurrences (often 80 or fewer), limited acreage, or miles of stream, recent and widespread declines, or other factors making it vulnerable to extirpation” (http://www.mass.gov/eea/docs/ dfg/nhesp/natural-communities-facts/priority-natural-commun.pdf). The unique nature of the coastal plain ponds’ glacial origin and the impermanent nature of the shoreline create a habitat that is home to a number of locally and globally rare species. More than twenty of the Massachusetts-listed rare species are specific to coastal plain pond shores. They occur predominantly along the sandy shorelines and less frequently along the peaty shores (Swain 1996). Not only are the plants uncommon in the coastal plain pond but also the habitat itself is limited to the Cape and Islands of Massachusetts (Swain and Kearsley 2000).
6. Ecological Processes
Ecological processes are the “dynamic biogeochemical interactions that occur among and between biotic and abiotic components of the biosphere” as described by the USGS (2012). There are six major ecological processes – disturbance, structural complexity, hydrological patterns, nutrient cycling, biotic interactions and population dynamics – occurring on the preserve.
MANAQUAYAK PRESERVE MANAGEMENT PLAN
10
- Disturbance –
The natural disturbance regime for northeastern deciduous woodlands typically includes fire, wind and insect damage. Fire is a less frequent means of natural disturbance, as fire suppression is an active part of forest management. Wind remains an active force of nature, although not as strongly on a woodland located further from the coast. Recent insect damage in various forms has initiated an alteration in the woodlands of various areas of Martha’s Vineyard. However, the woodland on the preserve has minimal damage as a result of this occurrence. How often, long and intense an ecosystem is disturbed are factors that are considered in management actions in order to best protect the dynamic nature of natural communities (EPA 1999). Kettle ponds are fragile wetland systems that are highly susceptible to natural and anthropogenic disturbances. The primary threats to kettle ponds and their shorelines are excessive drawdown from wells; repeated trampling over the same area; off-road vehicles; the addition of sand for beach construction; and heavy boat use and nutrient loading from improperly maintained septic systems and from fertilizer runoff (Department of Environmental Management, Rhode Island Natural Heritage Program, date unknown). Wind and changes in temperature have an impact on dimictic ponds that experience a change in temperature zonation annually. Dimictic ponds mix once in the fall and once in the spring and the surface freezes during the winter. During the summer the pond exhibits thermal stratification with an epilimnion of warmer water of 3 meters; an extensive metalimnion of 4 meters where the thermocline is greatest; and a hypolimnion of 2 meters where the water is coolest. By early September the effects of reduced solar radiation and increased heat loss at night begin to cause the surface water temperature to cool and fall thus extending the epilimnion to 5 meters. The epilimnion extends even further to 6 meters towards the end of September. By mid October the effects of wind cause the cooled pond water to undergo fall overturn and mixed from top to bottom to become homothermous. The fall turnover can release phosphorus bound
MANAQUAYAK PRESERVE MANAGEMENT PLAN
11
to soil particles on the bottom of the pond as oxygen-rich water from the surface releases the phosphorus from the soil at the bottom. Once the surface water reaches 0°C and freezes, the pond stalls until spring when surface waters melt and uniform density allows wind to mix the cold water until thermal stratification resumes (Horne and Goldman 1994). The phosphorus in the water column from a fall turnover can lead to an algae bloom in the spring.
- Structural complexity – The preserve has a complex structure of plant species ranging from low-growing shoreline plants to taller woodland trees that allows the preserve to accommodate more species by providing a more diverse array of habitats for species to survive in. The woodland has the greatest structural complexity on the preserve and includes ground-cover vegetation such as dewberry and mosses; low growing shrubs and herbs such as low-bush blueberry and goldenrods; taller shrubs such as highbush blueberry, hazelnut and arrowwood; and various oak tree species including snags that, when leaning or fallen, add to the structural complexity of the woodland. The coastal plain pond shore has modest spatial heterogeneity and structural diversity due to the presence of grasses, rushes and sedges, flowering herbs and carnivorous plants with variable seasonal flowering patterns. Removing invasive plants; allowing dead trees to exist; creating uneven patterns of mowing; and cutting of vegetation all contribute to spatial complexity (EPA 1999).
- Hydrological patterns – It is important to consider the impact of the vegetation communities on the water cycle in an ecosystem. Vegetation layers help catch water and aid in soil infiltration whereas larger- scale cleared woodlands and various heterogeneous agricultural practices can result in increased overland flow, groundwater contamination, channel incision and fragmentation of wetland habitats (EPA 1999). Maintaining wooded and dense shrublands around wetlands, especially kettle ponds, helps buffer and filter water before it reaches a wetland. Vegetation slows down water allowing sediments to drop out prior to entering a pond. This helps maintain pond depth which in turn results in cooler water
MANAQUAYAK PRESERVE MANAGEMENT PLAN
12
temperatures that slow the growth of organisms. Phosphorus is most often bound to soil particles and when those phosphorus- laden soil particles drop out of water as it slowly moves vegetation before reaching a pond or stream the phosphorus is essentially filtered out of the water.
- Nutrient cycling – Important elements such as nitrogen, phosphorous and carbon naturally travel through ecosystems and when combined with water and sunlight determine the productivity of an ecosystem (EPA 1999). Activities that increase (use of fertilizers) or decrease (erosion) nutrients can alter the nutrient cycle and change the ecological integrity of the ecosystem. Protecting soils from erosion and keeping snags and downed logs helps maintain the nutrient richness in the ecosystem. Additionally, human-enhancing and -depleting nutrient practices each lead to increased colonization by opportunistic non-native plants that have different nutrient cycling characteristics which in tern alters the nutrient cycling of the invaded ecosystem (EPA 1999). According to chemical analyses of the pond conducted from 2005-2015 by land bank staff the pond is nutrient-poor and has begun only the preliminary stage of eutrophication. All ponds begin as pure, unproductive, water bodies. Over time organic matter accumulates on the pond bottom, bottom dwellers increase respiration, water turbidity increases and oxygen levels decrease. The rate at which ponds undergo eutrophication depends on many variables such as underlying soils, surrounding land use and human activities. Nutrients such as nitrate, phosphorus and ammonium play a major role in eutrophication by increasing productivity. Nitrogen is primarily added to ponds via rain and groundwater and phosphorus travels to ponds attached to soil particles and primarily enters via shoreline soil erosion (Horne and Goldman 1994). Phosphorus is a primary limiting factor of algae growth and a reduction of phosphorus in freshwater ponds can reduce eutrophication. A natural buffering system exists for phosphorus
MANAQUAYAK PRESERVE MANAGEMENT PLAN
13
and other nutrients in ponds. If a nutrient is limited in the water column of a pond then it is released by soil particles; when in high concentration the nutrient may be removed by absorption. An increase in the amount of sediment in a pond can have a negative effect on this balance. Increase in sediment results in an increase in soil-bound nutrients. These soil-bound nutrients are released at a much greater concentration than can be removed from the water column (Horne and Goldman 1994). Ponds surrounded by vegetation are less susceptible to erosion and are rich in nitrogen but limited in phosphorus (Horne and Goldman 1994). The increase of nutrient concentrations from human activities can speed up the process of eutrophication by altering the natural balance between nitrogen and phosphorus in the pond. This often bears the name “cultural eutrophication” (Stiling 1996).
- Biotic interactions – The distribution and abundance of species is heavily dependent on the interactions among organisms such as competition for resources, predation, parasitism and mutualism (EPA 1999). Disturbances such as introduction of exotic species; over-collection of a species; and disease not only affect the “target species” but have a trickle-down effect that depends on the nature and strength of interactions that the “target species” had within its community (EPA 1999). Ice House Pond, over a decade, has transformed from a high-density bullfrog pond to a low-density native green frog pond with increased species of fish. The bullfrog is native across northern United States and southern Canada but was widely introduced into most states in the United States. In some areas it was introduced accidentally with the stocking of fish or was intentionally introduced (Bury 1984). By 1989 the bullfrog managed to find a way to the Vineyard and has since moved about the island establishing itself in many ponds (Ben David 2005). Aquatic vegetation is the dominant food of the bullfrog tadpole; they also graze on algae-covered detritus (Bury 1984 and Malcolm et al. 1999). The adult bullfrog eats anything smaller
MANAQUAYAK PRESERVE MANAGEMENT PLAN
14
than itself including its own species (Conant and Collins 1998). However, the adults mainly feed on crustaceans and insects (Jorgensen 1978). Bullfrogs breed in mid-summer and females may lay between 12,000 and 20,000 eggs (Hunter et al. 1999). Bullfrogs can dominate and out-compete native amphibians (Stumpel 1992). Bullfrog tadpoles affect the quantity and quality of algal foods, thereby altering the aquatic community structure and changing the array of invertebrate grazers in areas (Kupferberg 1994). Many animals such as herons, snakes, bass and pickerel prey upon bullfrogs (Malcolm et al. 1999). Increased hunting pressure, short-term drought, lowered water levels and loss of aquatic vegetation habitat may influence survival rates and reduce bullfrog population size (Bury 1984). The above factors led to the decline of the bullfrog in Ice House Pond. The fish population in Ice House Pond also underwent a change over the last decade. Chain pickerel (Esox niger), yellow perch, banded killifish (Fundulus diaphanus) and swamp darters were known to occur in the pond at one time (MacKenzie and Andrews 1997). Surveys in 2005 suggest only swamp darters, yellow perch and brown bullhead were observed in numbers large enough to be surveyed. Changes to aquatic vegetation and the foodweb such as the loss of bullfrogs, as well as individual species’ ability to adapt, may be influencing the fish populations. In recent years chain pickerel, largemouth bass, bluegill sunfish and swamp darters have been observed by land bank staff by the swimming perch. Pollinators and exotic plants play both positive and negative roles, respectively, in biotic interactions of an ecosystem. Spraying pesticides and introducing exotic pollinators can impact other non-target pollinators sometimes resulting in a major decrease in species diversity of plants that are reproductively dependent on native pollinators. Protecting species with high community importance values such as the oaks; removing exotic species such as wisteria before they have aggressively invaded; protecting the pond from introduction of exotic invasive plants or wildlife; and implementing elastic management strategies that are modified in response to monitoring are all strategies that can reduce effects on biotic interactions.
MANAQUAYAK PRESERVE MANAGEMENT PLAN
15
- Population dynamics –
The loss of a species can have many unseen effects on a community, depending on the interactions that the species had in its environment. Species dispersion, recruitment, fertility and mortality compose a species’ population dynamics and, along with genetic diversity, play an important role in the success of a species (EPA 1999). Small populations isolated by reduced habitat or habitat fragmentation are vulnerable to extinction, locally and globally. Other species are more widespread but occur in few numbers and are vulnerable due to low genetic diversity. Ecosystems are not static and species require genetic diversity in order to adapt to their ever-changing world or risk extinction. Prohibiting use of the pond shore will protect the seed bank of future plants to grow during low water years.
B. Biological Characteristics
1. Vegetation
Manaquayak Preserve comprises two general habitat communities: coastal plain pond/shore and mixed-deciduous woodland with an American beech grove and
small patches of pine. They are described in detail and shown on the Ecological
Communities Maps in Appendix E. The preserve is dominated by woodlands. A total of 160 plant species is known to occur on Manaquayak Preserve and these plants account for 16% of all known plants occurring on Martha’s Vineyard. The coastal plain pond shore accounts for 45% of plants known to occur on the preserve and appears to contribute the greatest to floristic richness of the preserve. The mixed-deciduous woodland contributes 37% of plants to the preserve. The old road and paths that run through the woodland combined with the woodland itself represent 52% of plants on the preserve and have a greater floristic diversity than the pond shoreline. These openings allow additional light to penetrate through the canopy, and they account for the majority of the woodland’s herbaceous and grassy groundcover. Species richness is the number of species present in a community (Begon et al. 1990). The species-per-acre value for the pond shore is, however, far greater (84 species/acre) than the woodland (2.5 species per acre).
MANAQUAYAK PRESERVE MANAGEMENT PLAN
16
The coastal plain pond and shore is habitat to the commonwealth-listed sandplain flax, broom panic grass, subulate bladder wort, rough panic grass and dwarf bulrush all species known to occur on the preserve at one time or at present. The woodland is habitat for the commonwealth-listed imperial moth, Gerhard’s underwing, Faded grey geometer, eastern box turtle and crane fly orchid. Moth surveys were not conducted on the preserve and the crane fly orchid was not observed during summer surveys of the preserve. The crane fly orchid is more likely to be observed during the winter when its green variegated leaves and purple abaxial surfaces aid in detection of the orchid. Six regionally rare plants – rose coreopsis, small white aster, pipewort, bayonet rush, pondshore rush and yellow-eyed grass – and two regionally historic plants –Tuckermanii quillwort and sessile-leaved water horehound – also are known to occur primarily in the pond bottom and in the adjoining pond shore. Regionally rare plants are known to occur in ten or fewer sites on the Vineyard according to Swanson and Knapp and historic plants are recorded for the Vineyard but have not had a confirmed sighting within the past 45 years (1999). The regionally rare plants are associated with coastal plain pond shores and are known to occur on only a handful of locations on the island. Tuckermanii quillwort and sessile-leaved water horehound also are native kettle pond species. Tuckermanii quillwort occurs in the pond at Manaquayak Preserve in the shallower water where there is adequate light penetration and sessile-leaved water horehound occurs in the adjoining pond shore. The quillwort was historically known to occur in West Tisbury and the horehound’s historic location is unknown (Swanson and Knapp 1999). Manaquayak Preserve supports a diverse population of native and introduced plants. Two plants are known to be introduced to the island, the white pine and the scotch pine. Five terrestrial species of exotic plants – Wisteria, Japanese barberry, Japanese honeysuckle, reed canary grass, oriental bittersweet and grey willow – are known to occur on the preserve.
2. Water Quality of Ice House Pond
Baseline water quality data for Ice House Pond were collected during 2006 and compared with sampling results from the pond taken in 2015. In general, the predicted retention time for the pond is between 297 and 353 days. It is acidic with a poor buffering capacity. The pond is temperature-stratified and is classified as dimictic. It has an anoxic hypolimnion during summer stratification. Baseline data indicate that the pond is between an oligotrophic and mesotrophic pond with relatively low nutrient concentrations. The same holds true ten years
MANAQUAYAK PRESERVE MANAGEMENT PLAN
17
later. Ice House Pond is a complicated system due in part to the fact that it is supplied with water through ground and atmospheric water sources only and there is no knowledge of the exact flow of groundwater in the area. Ice House Pond is sensitive to nutrient sources and changes in the water chemistry of the pond have occurred over the past decade. Total nitrogen and Chlorophyl-A values in the pond have experienced the greatest shifts over the past decade. Total nitrogen has increased 51% from 2006 to 2015 and Chlorophyl-A values have decrease 54% from 2006 compared to 2015. Average dissolved oxygen, temperature and pH have all increased moderate amounts in 10 years (28% increase in %DO, 9% increase in temperature, 17% increase in pH). Average summer secchi depths range from 3.5 to 6.6 meters and experienced an 18% increase in 2015 compared to 2006. Total phosphorus has experience little change and is 1.5% greater in 2015 than 2006. Total suspended solids experienced a large shift in 2015 compared to 2006 (98%) likely a result of a single spike in total phosphorus observed in 2014. When total suspended solids from 2014 were compared to 2006 only an 8% increase was observed. More detailed results of the past decade of water quality analysis of Ice House Pond are located in Appendix L.
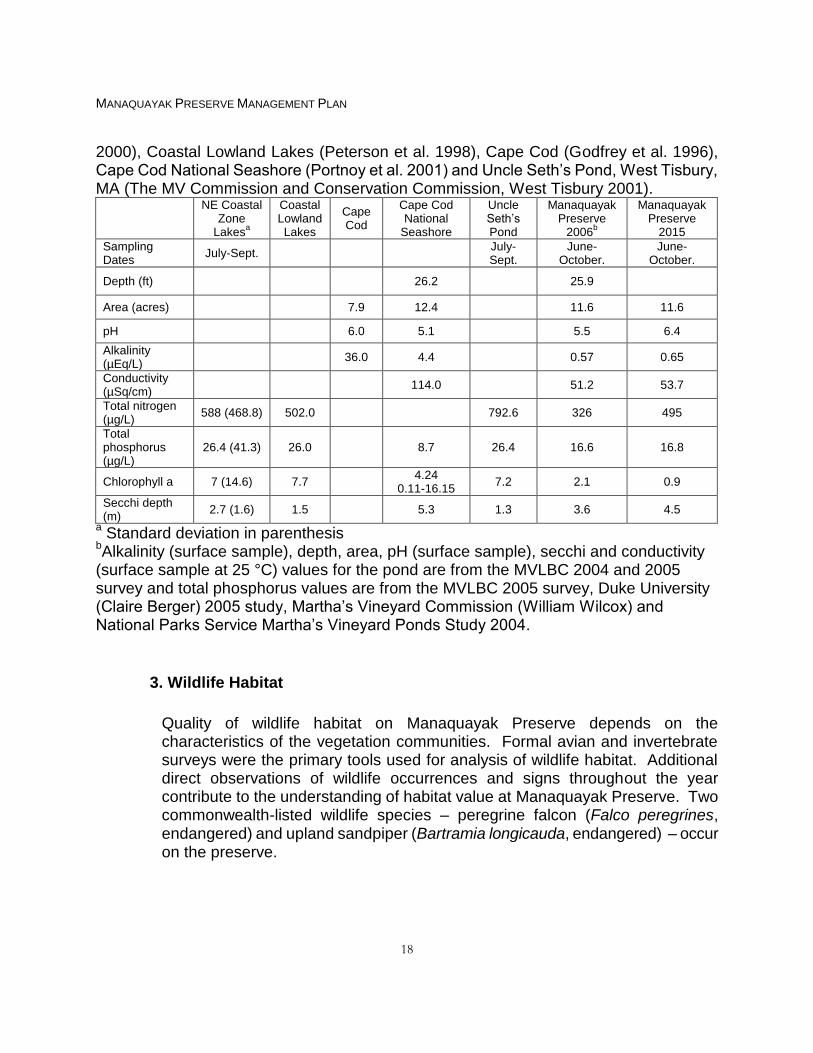
The pond at Manaquayak Preserve is not very different in terms of physical and chemical parameters than similar kettle ponds in the Cape Cod National Seashore (Table 1). Total nitrogen, total phosphorus and chlorophyll-A concentrations are less for the pond at Manaquayak Preserve compared to ponds on Cape Cod, New England coastal zone lakes and Uncle Seth’s Pond on Martha’s Vineyard (Table 1). Conductivity for the pond at Manaquayak Preserve is less than that observed for Cape Cod National Seashore ponds and is in greater agreement with conductivity observed in ponds in northeastern United States. The pond at Manaquayak Preserve has a similar pH and alkalinity as Cape Cod ponds in general but is slightly less acidic with a greater buffering capacity than Cape Cod National Seashore ponds. In terms of transparency, the Cape Cod National Seashore ponds have on average a greater secchi depth than the pond at Manaquayak Preserve suggesting that the Cape Cod National Seashore ponds may be slightly less productive on average than the pond at Manaquayak Preserve. However, the secchi depth for the pond at Manaquayak Preserve was greater than that typically observed for New England coastal zone lakes and coastal lowland lakes.
Table 1. Mean physical and chemical variables of Ice House Pond at Manaquayak Preserve in 2006 and 20015 compared to ponds in Northeast Coastal Zone Lakes (ENSR
MANAQUAYAK PRESERVE MANAGEMENT PLAN
18
2000), Coastal Lowland Lakes (Peterson et al. 1998), Cape Cod (Godfrey et al. 1996), Cape Cod National Seashore (Portnoy et al. 2001) and Uncle Seth’s Pond, West Tisbury, MA (The MV Commission and Conservation Commission, West Tisbury 2001).
NE Coastal
Zone Lakes
a
Coastal Lowland Lakes
Cape Cod
Cape Cod National
Seashore
Uncle Seth’s Pond
Manaquayak Preserve
2006b
Manaquayak Preserve
2015
Sampling Dates
July-Sept.
July-Sept.
June-October.
June-October.
Depth (ft)
26.2
25.9
Area (acres) 7.9 12.4 11.6 11.6
pH 6.0 5.1 5.5 6.4
Alkalinity (µEq/L)
36.0 4.4
0.57 0.65
Conductivity (µSq/cm)
114.0
51.2 53.7
Total nitrogen (µg/L)
588 (468.8) 502.0 792.6 326 495
Total phosphorus (µg/L)
26.4 (41.3)
26.0 8.7
26.4 16.6 16.8
Chlorophyll a 7 (14.6) 7.7 4.24
0.11-16.15 7.2 2.1 0.9
Secchi depth (m)
2.7 (1.6) 1.5 5.3 1.3 3.6 4.5
a Standard deviation in parenthesis
bAlkalinity (surface sample), depth, area, pH (surface sample), secchi and conductivity
(surface sample at 25 °C) values for the pond are from the MVLBC 2004 and 2005 survey and total phosphorus values are from the MVLBC 2005 survey, Duke University (Claire Berger) 2005 study, Martha’s Vineyard Commission (William Wilcox) and National Parks Service Martha’s Vineyard Ponds Study 2004.
3. Wildlife Habitat
Quality of wildlife habitat on Manaquayak Preserve depends on the characteristics of the vegetation communities. Formal avian and invertebrate surveys were the primary tools used for analysis of wildlife habitat. Additional direct observations of wildlife occurrences and signs throughout the year contribute to the understanding of habitat value at Manaquayak Preserve. Two commonwealth-listed wildlife species – peregrine falcon (Falco peregrines, endangered) and upland sandpiper (Bartramia longicauda, endangered) – occur on the preserve.
MANAQUAYAK PRESERVE MANAGEMENT PLAN
19
(a) Invertebrates
Thirty-one invertebrate species, the majority being Odonates, are known to occur on the preserve (Appendix F). Direct observation for Odonates in Ice House Pond and on the shore by a local naturalist, Allan Keith, revealed a reasonably diverse array of dragonflies and damselflies. Mr. Keith observed a total of 20 odonata species on Ice House Pond between 2005 and 2009. Land bank staff observed two of these same 20 species – calico pennant and ruby meadowhawk –at Rainwater Pond during 2015 surveys. Water level, abundance of emergent vegetation and water clarity are all factors that influence Odonata species populations and diversity in the ponds.
Aside from dragonflies, damselflies and butterflies, a total of 8 additional species of invertebrates are known to occur on the preserve. These species include bees, ticks, flies and mosquitoes.
(b) Amphibians, Reptiles and Fish
There are three known frog species that occur on the preserve (Appendix F.). Choruses of spring peppers, the banjo string call of the green frog and the bellow of the bull frog were heard on the preserve during initial amphibian surveys. A few years later the bullfrog had all but disappeared. Snapping turtles were observed in Ice House Pond but not on the pond shore. Fish such as largemouth bass, bluegill sunfish and chain pickerel are observed frequently throughout the summer in Ice House Pond. Brown bullhead, yellow perch and swamp darters also have been observed in Ice House Pond. Rainwater Pond was dry in August and no amphibians, reptiles and fish were observed during 2015 surveys.
(c) Birds
A total of 56 bird species was observed at Manaquayak Preserve during the fall, winter, spring and breeding seasons (Appendix G). The abundance of berry-producing shrubs in the understory of the mixed-oak woodland, the presence of common greenbrier, the dense shrubs along the pond edge and the mixture of conifer and deciduous trees are features that draw birds to Manaquayak Preserve. For example, some woodpeckers eat poison ivy berries in the winter; thrushes, robins,
MANAQUAYAK PRESERVE MANAGEMENT PLAN
20
tanagers and catbirds eat blueberries, holly berries and shadbush berries; and cedar waxwings eat cedar fruit (Martin et al. 1951). The pond habitat is a good breeding ground for invertebrates and fish that some birds feed on.
(d) Mammals
Five mammal species were observed at the Manaquayak Preserve: eastern chipmunk, grey squirrel, striped skunk, river otter and white-tailed deer (Appendix F). The woodlands provide good forage and breeding habitat for eastern chipmunks. The chipmunk is a nut-eater and a burrower, not a tree-nester (Jorgensen 1978). There are distinct otter runs from the woodland into Rainwater Pond and visible scat along the shore of the pond. River otters are habitual, especially when it comes to their travel ways. Wildlife species were identified either by sight, tracks, scat, or scent.
(d) Rare and Endangered Species
Massachusetts NHESP designates the entirety of Manaquayak Preserve to be located within Priority and Estimated Habitats of Rare Wildlife. Details about the various species identified since the creation of the MA-NHESP Habitat maps of 2008 and a copy of the Endangered Species Map are located in Appendix H.
C. Cultural Characteristics
1. Land History
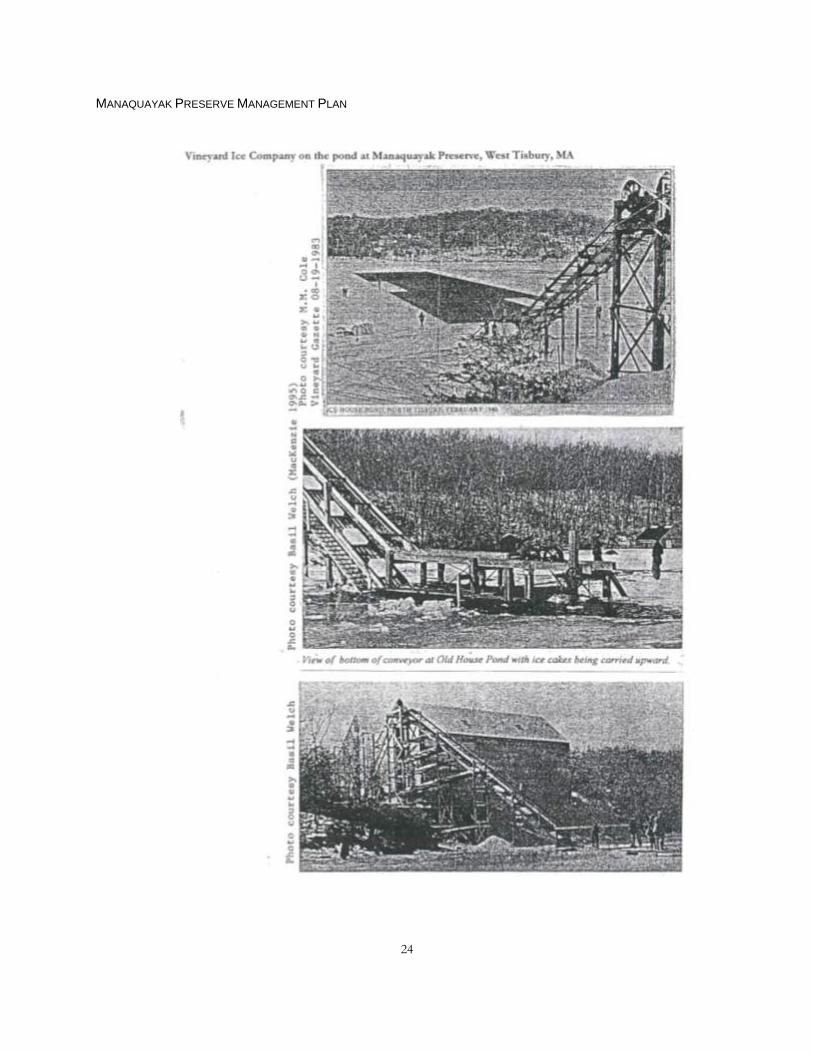
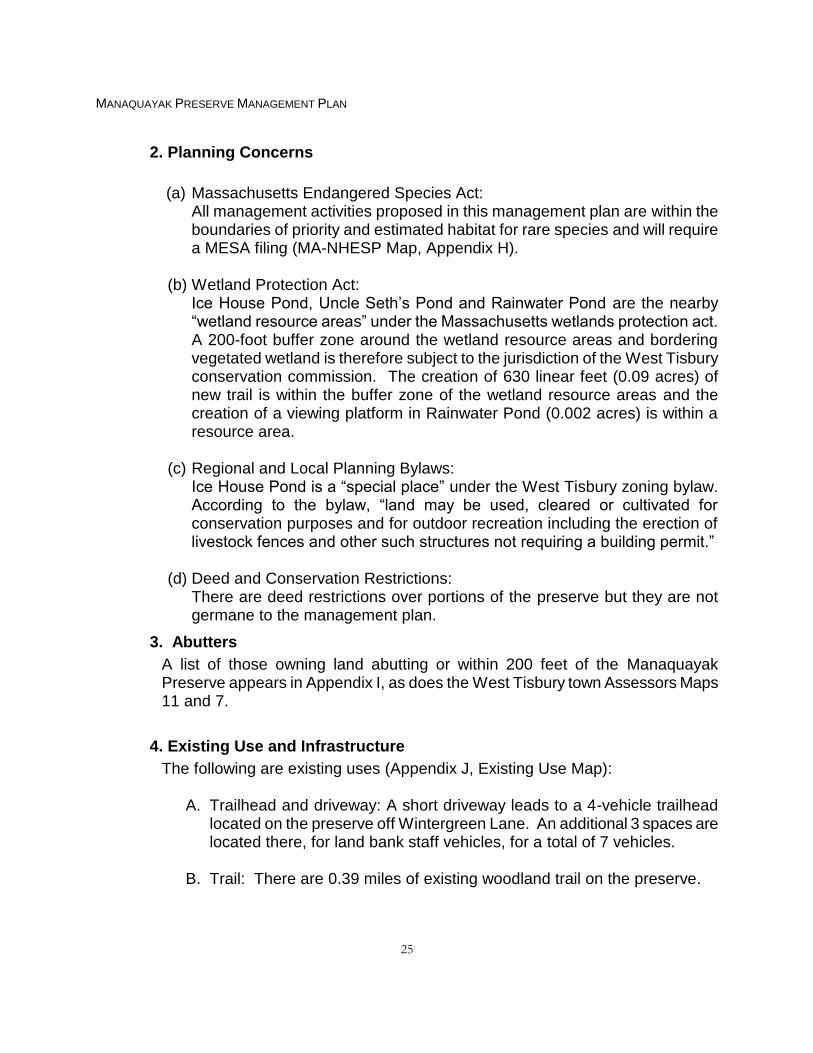
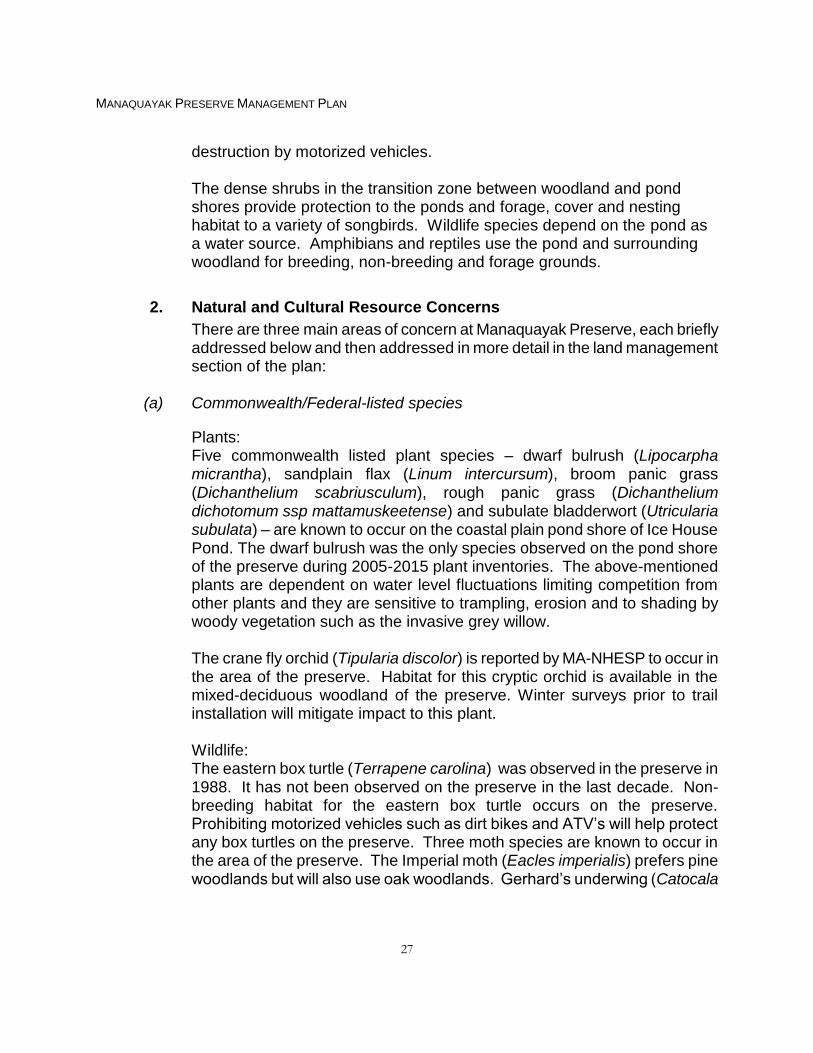
The 11-acre pond at Manaquayak Preserve, known to many as Ice House Pond, derives its name from the refrigeration industry surrounding the pond during the early to mid-1900s. The pond was historically referred to as Old House Pond. At some unknown time after the mid-1900s the pond name changed to Ice House Pond, a generic name given to ponds where ice is harvested. The name references the shed on the pond shore where blocks of ice were stored (Green and Sachse 1983). There are “Ice House Ponds” in Oak Bluffs, Tonset and Barnstable (Green and Sachse 1983). Historic maps from 1858 through 1887 clearly depict Ice House Pond in West Tisbury (Appendix D). The land surrounding the pond passed from the hands of Francis A. Foster to
MANAQUAYAK PRESERVE MANAGEMENT PLAN
21
various individuals. He sold a portion of the land to Harry L. Peakes of Vineyard Haven who at age 25, joined with Captain Benjamin C. Cromwell to establish three ice houses and harvest ice from the pond (Lovewell 1983). They formed the Vineyard Ice Company. Thus began the industrialization of the pond. The use of natural ice for refrigeration of fruits, vegetables, dairy and meat came to the Vineyard in the mid-1800s and replaced the simpler bucket at the bottom of the well method (MacKenzie 1995). The ice harvest depended greatly on the severity of the winter. The ice needed to be thick enough to harvest. Ice was typically 8 or 9 inches thick at harvest. The mild winters of Martha’s Vineyard created an intermittent supply of natural ice. During those times ice was shipped from Maine and stored in the ice houses on the island (MacKenzie 1995). The weather column in the Vineyard Gazette from February 16, 1934 reported ice being cut at Sheriff’s Meadow Pond for the first time since 1929. During a good winter with quick freezes and sharp drops in temperature below zero more than one harvest was made in a year. The timing of the harvest was crucial, the thicker the ice the better. Unfortunately there was always the risk of waiting for thicker ice only to wake to a warm sunny day or rain and higher temperatures to spoiling the harvest (Welch 2004). The Vineyard Gazette reported on January 31, 1936 that Mr. Peakes worked the pond with 30 men and harvested 700 tons of ice from the pond. A few years later the same weather column reported on January 26, 1940, that Mr. Peakes harvested 2800 tons of ice from the pond. The ice was 10 inches thick and work persisted into the night until 9PM to complete the harvest. An account from the Vineyard Gazette, two years later, described another of Mr. Peakes’ successful harvests; on February 20, 1942, Mr Peakes filled his ice houses with 2000 tons of ice that was 8-9 inches thick. The ice cut from the pond was considered some of the best ice due to its clarity and lack of debris. The depth of the pond allowed ice to form well above the vegetation and sediment in the pond (MacKenzie 1995). Harvesting ice was no simple matter. First the ice was measured. Snow and debris needed to be cleared from the ice. A grid was laid out on the ice using a marker drawn with a rope by horses across the ice. The marker made a light cut in the ice and cleared the ice of snow in the process. Each square section marked was approximately 20 by 40 feet (MacKenzie 1995 and Lovewell 1983). A cutter was employed to saw through the ice. The cutter consisted of a circular saw blade on a sled powered by a Model T engine. Horses were used to pull the sled (Welch 2004 and Lovewell 1983). Men with large sticks
MANAQUAYAK PRESERVE MANAGEMENT PLAN
22
with hooks on the end called “pikes” moved the ice through the water to the ice house where the ice was further cut into 2 by 4 foot blocks. The smaller blocks were loaded onto a conveyer belt and brought into the ice house. Ice blocks were placed first on the bottom of the ice house on top of an insulating layer of hay and sawdust (MacKenzie 1995). The blocks were held back about a foot from the wall. This area was later packed with hay and sawdust to further insulate the ice house (Allen 2003, Welch 2004). The ice blocks were stacked with a layer of sawdust in between to keep them insulated and from joining and forming larger blocks. As the stacks grew the slope of the conveyer belt increased to access the next layer (Lovewell 1983). Ice was delivered from the ice houses to people’s homes and into their ice boxes. A block of ice, depending on size, could last up to 3 days during a normal summer (MacKenzie 1995). Henry Konrad Burgess and Joe Rogers delivered ice to Vineyard Haven for Mr. Peakes and Peter Hansen and Peter Regan delivered to Oak Bluffs (MacKenzie 1995 and Welch 2004). They drove a Reo to deliver the ice. The Reo had a platform at the back with solid sideboards, a canvas cover, open cab and rubber tires (MacKenzie 1995). The Reo truck was loud and the scale clanging on the back could be heard from a good distance. Children listened for the noise of the ice truck and followed it looking to get a few chips of ice (Welch 2004). Ice in the 1940s cost one cent a pound (MacKenzie 1995). Mr. Peakes operated the ice house until World War II (MacKenzie 1995). During the 1930s he produced “artificial” ice in a modest plant. John E. Sisson and Wallace E. Tobin purchased the Vineyard Ice Company and in June 15, 1945 they began producing the first artificial ice to be made on the Vineyard in some time (Vineyard Gazette-1 1945). Mr. Sisson and Mr. Tobin remodeled two of the three former buildings built in 1925 on the pond. One building was torn down and used in the remodeling. Water was pumped directly from the pond into tanks where the ice was made. Cold storage lockers ranging from family to store size were located in the plant as well as a “day” storage building with the capacity to hold 30 tons of ice to be delivered and two storage rooms, one capable of holding 1000 tons and the other holding 600 tons (Vineyard Gazette-2 1945). In January 16, 1953 the Vineyard Gazette reported the end of the ice industry at the pond. The cold storage lockers at the ice plant were scheduled to close as of April 1953 due to use of home freezers as the electricity was extended through Martha’s Vineyard. Most down-island towns had electricity in the 1920’s and 1930’s; however it was not until the 1950’s that electricity filtered into the corners of the up-island towns (MacKenzie
MANAQUAYAK PRESERVE MANAGEMENT PLAN
23
1995). Now the only remains of the ice industry are pilings in the water used to support the conveyer belt and a cement retaining structure on the pond shore on land abutting the preserve. Photos of the ice operation are on page 24. The pond at Manaquayak Preserve was not always used exclusively as a source of ice but also was used as a skating, fishing and swimming pond. Basil Welch, a Vineyard historian, used to live at the corner of Manaquayak and Lambert’s Cove Roads. He remembers skating on and fishing for pickerel in the pond. He said, however, that Uncle Seth’s Pond was more popular for these activities because it was directly on Lambert’s Cove Road. The history of the pond goes much deeper than the age of European settlement. According to Banks (1911 (1966)) the pond at the Preserve was referred to by the Wampanoags as Manaquayak, derived from the word Nan-nau-wiy-ack that translates to “safe or secure place”. Banks (1911 (1966)) speculates that the pond or area around the pond was considered a secure place for canoes or a Wampanoag stockade was located close to the shore.
MANAQUAYAK PRESERVE MANAGEMENT PLAN
24
MANAQUAYAK PRESERVE MANAGEMENT PLAN
25
2. Planning Concerns
(a) Massachusetts Endangered Species Act:
All management activities proposed in this management plan are within the boundaries of priority and estimated habitat for rare species and will require a MESA filing (MA-NHESP Map, Appendix H).
(b) Wetland Protection Act: Ice House Pond, Uncle Seth’s Pond and Rainwater Pond are the nearby “wetland resource areas” under the Massachusetts wetlands protection act. A 200-foot buffer zone around the wetland resource areas and bordering vegetated wetland is therefore subject to the jurisdiction of the West Tisbury conservation commission. The creation of 630 linear feet (0.09 acres) of new trail is within the buffer zone of the wetland resource areas and the creation of a viewing platform in Rainwater Pond (0.002 acres) is within a resource area.
(c) Regional and Local Planning Bylaws: Ice House Pond is a “special place” under the West Tisbury zoning bylaw. According to the bylaw, “land may be used, cleared or cultivated for conservation purposes and for outdoor recreation including the erection of livestock fences and other such structures not requiring a building permit.”
(d) Deed and Conservation Restrictions: There are deed restrictions over portions of the preserve but they are not germane to the management plan.
3. Abutters
A list of those owning land abutting or within 200 feet of the Manaquayak Preserve appears in Appendix I, as does the West Tisbury town Assessors Maps 11 and 7.
4. Existing Use and Infrastructure
The following are existing uses (Appendix J, Existing Use Map):
A. Trailhead and driveway: A short driveway leads to a 4-vehicle trailhead located on the preserve off Wintergreen Lane. An additional 3 spaces are located there, for land bank staff vehicles, for a total of 7 vehicles.
B. Trail: There are 0.39 miles of existing woodland trail on the preserve.

MANAQUAYAK PRESERVE MANAGEMENT PLAN
26
C. Perch and stairs: A short set of stairs leads to a seasonal (April-
September) fibergrate perch that is located from the pond shore into the pond to a maximum distance that maintains a non-wading depth at the end of the access perch (typically 76’). The perch provides access into the pond only and the areas to either side of the perch are roped off to prohibit access to the shoreline. The perch is for swimming access only.
D. Pepperbush Way: A portion of Pepperbush Way traverses through the
preserve.
E. Wintergreen Way: A portion of Wintergreen Way is located along the northern boundary of the preserve.
F. Bench: A bench is located at the top of the stairs leading down to the perch.
II. Inventory Analysis
In this section, problems and opportunities that may arise in the management of
Manaquayak Preserve are analyzed.
A. Constraints & Issues
1. Ecological Context
Manaquayak Preserve is located between Ice House Pond and Rainwater Pond in West Tisbury. The property flows from high ridge-land of oak, beech and conifer species to a shrub ecotone of highbush blueberry, swamp azalea and winterberry to the pond shores and finally into the ponds. The transition from woodland to Ice House Pond is steep around much of the preserve’s shoreline. The land between Lambert’s Cove Road and Rainwater Pond undulates over two main ridges and valleys. The topographic transition are dramatic and plentiful on the preserve. The gradually sloped, sandy pond shores are the major ecological nexus at Manaquayak Preserve. It is habitat for many rare plant and animal species and especially desirable to dragonflies and damselflies (Swain and Kearsley 2000). It is highly susceptible to water drawdowns from wells, multiple access points that may contribute to erosion problems and trampling and
MANAQUAYAK PRESERVE MANAGEMENT PLAN
27
destruction by motorized vehicles. The dense shrubs in the transition zone between woodland and pond shores provide protection to the ponds and forage, cover and nesting habitat to a variety of songbirds. Wildlife species depend on the pond as a water source. Amphibians and reptiles use the pond and surrounding woodland for breeding, non-breeding and forage grounds.
2. Natural and Cultural Resource Concerns
There are three main areas of concern at Manaquayak Preserve, each briefly addressed below and then addressed in more detail in the land management section of the plan:
(a) Commonwealth/Federal-listed species
Plants: Five commonwealth listed plant species – dwarf bulrush (Lipocarpha micrantha), sandplain flax (Linum intercursum), broom panic grass (Dichanthelium scabriusculum), rough panic grass (Dichanthelium dichotomum ssp mattamuskeetense) and subulate bladderwort (Utricularia subulata) – are known to occur on the coastal plain pond shore of Ice House Pond. The dwarf bulrush was the only species observed on the pond shore of the preserve during 2005-2015 plant inventories. The above-mentioned plants are dependent on water level fluctuations limiting competition from other plants and they are sensitive to trampling, erosion and to shading by woody vegetation such as the invasive grey willow. The crane fly orchid (Tipularia discolor) is reported by MA-NHESP to occur in the area of the preserve. Habitat for this cryptic orchid is available in the mixed-deciduous woodland of the preserve. Winter surveys prior to trail installation will mitigate impact to this plant. Wildlife: The eastern box turtle (Terrapene carolina) was observed in the preserve in 1988. It has not been observed on the preserve in the last decade. Non-breeding habitat for the eastern box turtle occurs on the preserve. Prohibiting motorized vehicles such as dirt bikes and ATV’s will help protect any box turtles on the preserve. Three moth species are known to occur in the area of the preserve. The Imperial moth (Eacles imperialis) prefers pine woodlands but will also use oak woodlands. Gerhard’s underwing (Catocala
MANAQUAYAK PRESERVE MANAGEMENT PLAN
28
heroides gerhardi) prefers pitch pine scrub barrens, heathlands and shrublands. These habitats do not occur on the preserve but there are patches of pitch pine that the moth may utilize. The faded grey geometer (Stenoporpia polygrammaria) is an oak woodland and scrub oak barrens moth. Using existing trails and minimizing tree cutting in the woodland will promote the habitats of the above-mentioned wildlife species.
(b) Erosion and trampling
The coastal plain pond shore is very sensitive to erosion and trampling. Walking or driving over plants that are rooted in sandy soils can damage the plants by either uprooting them or grinding them against the sharp sand particles (Swain 1996, Wisheu and Keddy 1989). Motor vehicles such as all-terrain vehicles (ATV) compact the sediment, accelerate oxidation of organics in the soil and reduce reserves of seeds and rhizomes in the soil (Sorrie 1994, Wisheu and Keddy1991). Repeated tramping in the shallow water of the pond and in the shoreline itself would impact the delicate plants’ ability to germinate and grow. Prohibiting access to the pond shore and shallow water, plus providing the perch for access to the water, helps protect this fragile habitat. The repetitive use of motorized vehicles, horses and bicycles in excess on wooded paths or on pond shores can cause erosion and compaction of soils. The erosion may lead to nutrient loading in the pond; in particular phosphorus loading as it bonds tightly to soil and primarily enters water systems through erosion and runoff (Addy and Green 1996). The activities that cause erosion may also damage vegetative plants by grinding them against the sand, uprooting or burying the plants and, in the case of the pond shore, eliminating the seed bank through compaction or soil displacement.
(c) Eutrophication
Eutrophication is the natural progression of a pond from nutrient-poor to nutrient-rich. The primary cause of eutrophication is the addition of nutrients to a water system. Nutrient sources to water systems include anthropogenic sources, erosion of soil, precipitation, groundwater and internal loading from sediments. The type of soils in the watershed also can contribute to nutrient loading of a water system. The Eastchop loamy sandy soils surrounding the pond are not ideal as sites for septic tank absorption fields. They are extremely porous and allow for nutrients to enter the groundwater due to the
MANAQUAYAK PRESERVE MANAGEMENT PLAN
29
poor filtering capacity of the soil (SCS 1986). Eutrophication occurs in stages from oligotrophic to eutrophic. Currently water chemistry of the pond indicates it is on the oligotrophic end of mesotrophic with a moderate concentration of chlorophyll-A for the trophic stage. Nutrient loading is a concern as the addition of nutrients gives competing plants an edge to dominate the shoreline and outcompete less common species (Swain 1996). The increase in nutrients also results in increased algae and decreased dissolved oxygen which leads to an overall decline in pond health (Portnoy et al. 2001). Algae growth is limited by either nitrogen or phosphorus. Phosphorus is typically the limiting nutrient in freshwater systems. A little bit goes a long way and a nominal increase in phosphorus can lead to very dramatic affects on the system. The pond at Manaquayak Preserve appears to be limited by nitrogen and may respond with an increase in productivity from an increase in either nitrogen and phosphorus. To prevent the onset of eutrophication there are several ways nutrient loading in the pond can be minimized: - Nutrients from septic systems can be reduced through frequent pumping
of tanks - Use of organic fertilizers and lessening the use of chemicals on
residential and agricultural land in close proximity to ponds also helps reduce the impact of nutrient loading on the pond.
- Erosion can be reduced by use of vegetative buffers, winding trails and directing runoff towards wooded areas away from the pond (Robinson 2004)
- Providing a toilet and limiting the number of swimmers per acre of pond water would reduce the impact that access has on the pond’s nutrient loading.
- Changing the composition of fish in the pond may reduce phosphorus levels in the pond; having predatory fish such as pickerel in a pond would decrease the zoo plankton-eating fish such as blue gill and perch, increase the crustacean numbers and ultimately reduce algae and improve water quality (Primack 1993).
(d) Invasive Species
Several invasive plant species occur on the preserve including Japanese wisteria , Japanese barberry, Japanese honeysuckle, reed canary grass, oriental bittersweet and grey willow. The reed canary grass occurs in a 300 ft
2 area along the southern edge of Rainwater Pond. The Japanese barberry
MANAQUAYAK PRESERVE MANAGEMENT PLAN
30
oriental bittersweet, Japanese honeysuckle occur primarily along the old roads on the preserve. The grey willow occurs along the pond shore of Ice House Pond. These species can be controlled through manual uprooting and, if necessary, herbicide treatment. Annual monitoring and quick control and removal of invasive species are important to maintain an ecological balance and the integrity of habitats on the preserve. Prohibiting boat access and use of water accessories such as floats and boogie boards help stop the introduction of exotic invasive aquatic plants and wildlife into Ice House Pond.
(e) Archaeological The general area around Ice House Pond is referenced in Banks (1911
(1966)) as possible location for canoe holding or a stockade. To minimize impacts to possible archaeological artifacts trails are proposed to be topped with wood chips to minimize erosion and exposure of artifacts.
3. Sociological Context
Manaquayak Preserve is located in West Tisbury off Wintergreen Lane and Lambert’s Cove Road. It is located in close proximity to a youth camp, a popular inn and a large residential development. It is also in close proximity to Uncle Seth’s Pond and Lambert’s Cove Beach, two popular swimming locations in West Tisbury.
4. Neighborhood Concerns
The land bank considers the concerns of neighbors as part of the planning process. All abutting property owners and the local conservation commission are sent written notice of a public hearing on the draft plan. All neighbors -- and all members of the public -- are invited to review the draft plan, attend the public hearing and make written or oral comments. The land bank's West Tisbury town advisory board and the Martha’s Vineyard land bank commission review all comments and can change the draft plan if desired. Anyone may also express concerns at any public meeting of the Martha’s Vineyard land bank commission and West Tisbury town advisory board, or may simply contact land bank staff. Planning concerns that already have been brought to the attention of the land
MANAQUAYAK PRESERVE MANAGEMENT PLAN
31
bank by neighbors include:
pond health
trampling of pond shore vegetation
noise
impact of vehicles on Wintergreen Lane
night-time use
invasive species
trespassing
loitering
dogs
traffic and illegal parking on Manaquayak Road and Wintergreen Lane
B. Addressing Problems and Opportunities
1. Land Bank Mandate
In 1986, the voters of Martha’s Vineyard created the land bank to acquire, hold, and manage land in a predominantly natural, scenic, or open condition. The land bank keeps open space open and allows modest public use. Its “shared-use” policy strives to provide a range of public benefits, from low-impact recreation and aesthetics to wildlife conservation and watershed protection. Protection of natural resources is the land bank’s highest priority, yet “shared-use” demands balancing the public use of natural resources with protection of the same.
2. Goals at Purchase
Manaquayak Preserve contains seven of the nine types of land eligible, under the land bank law, for protection: forest land; fresh and salt water marshes and other wetlands; wildlife habitats; easements for trails and for publically owned lands; scenic vistas; ocean and pond frontage; and sites for passive recreation. Preliminary management plans were adopted by the land bank commission and West Tisbury advisory board and are attached as Appendix B.
3. Opportunities
a.) Access: The proposed vehicular access to Manaquayak Preserve is through two trailheads. The 4-vehicle trailhead off Lambert’s Cove Road will serve as the primary access for Manaquayak Preserve. It
MANAQUAYAK PRESERVE MANAGEMENT PLAN
32
will accommodate bicycle, vehicle and walk-on access. The second trailhead is the 4-vehicle trailhead off Wintergreen Lane. It will provide access to those individuals over the age of 70 who arrive in vehicles; walk-ons from the nearby Manaquayak Road neighborhood; and bicycles.
b.) Trails: Approximately 0.39 miles of existing and 0.81 miles of
proposed trails will provide a loop trail with access to Rainwater Pond via a viewing platform; a loop trail and access to Ice House Pond from the Wintergreen Lane trailhead; and a connector trail between the Lambert’s Cove Road trailhead and Ice House Pond.
c.) Views: The preserve offers views of Ice House Pond from the ridge
and the perch, while the plan proposes to offer views of Rainwater Pond from a viewing platform.
d.) Recreation Use: The preserve offers passive recreational use in the
form of hiking, bird watching, bicycling, picnicking, cross country skiing, horseback riding, skating and swimming. A 20-person quota of preserve visitors in Ice House Pond is allowed at any one time. As with other land bank water-access properties, no lifeguards are posted on the preserve. However, land bank staff is posted on the preserve to ensure that the rules of the preserve are followed.
e.) Archaeology: The preserve is located in an area with close proximity to fresh water with evidence for historic native American occupation or use. Educating the public through signs that create awareness regarding the importance of leaving artifacts where they are found; covering trails with woodchips; and reporting any illegal digging will help protect the archaeological artifacts that may exist on the preserve.
f.) Hunting: The preserve is proposed to be open to hunting on the 22.6 acres of land of Lambert’s Cove Road per the land bank’s hunting subcommittee’s guidelines.
4. Universal Access (UA)
Manaquayak Preserve is not suited for universal accessibility due to distance from the amenity to the trailhead and difficulty of terrain. The preserve’s ROS
MANAQUAYAK PRESERVE MANAGEMENT PLAN
33
(‘Recreation Opportunities Spectrum’) classification is “less-developed.” Further details are included in Appendix K.
III. Land Management Planning
This final section of the management plan states goals for Manaquayak Preserve and outlines strategies for achieving them. These goals and strategies are designed to fit within the social and ecological constraints defined previously. The plan addresses five areas of planning concern: nature conservation; recreation and aesthetics; natural products; community interaction; and land administration.
A. Nature Conservation
Provide long-term protection for plants, animals and natural processes
occurring on Manaquayak Preserve. Objective 1: Protect and encourage rare and endangered species and habitats on the preserve. Strategies:
a. Monitor the property for rare plants and animals during regular property checks and survey existing populations on a regular schedule.
b. Develop and implement a strategy to protect any additional rare species observed on the property.
c. Report new observations of rare and endangered species to the proper commonwealth authority.
d. Protect the coastal plain pond shore and the rare species that depend on it by:
e. Protect the coastal plain pond shore and the rare species that depend on it by:
MANAQUAYAK PRESERVE MANAGEMENT PLAN
34
i. limiting access to the pond from the preserve to one location, the perch;
ii. prohibiting access to the shore to prevent trampling and compaction of plants by using signs, ropes and buoys;
iii. prohibiting access to the pond for boating and fishing, except ice fishing;
iv. extending the perch into water over 5’ to discourage standing on the pond bottom;
v. prohibiting use of motorized vehicles by visitors on the preserve; vi. prohibiting dogs from the spur trail that leads to Ice House Pond; vii. monitoring for and removing exotic invasive species; and viii. removing woody vegetation and pruning overhanging branches if
they pose a threat by competing with smaller pond shore plants.
f. Protect rare moth habitat on the preserve by i. siting proposed trail in a way that minimizing tree cutting and ii. using existing trails where possible
g. Reroute or close trails in the event that the recreational use interferes
with a rare species’ ability to forage and reproduce.
h. Inventory vegetation and breeding birds on the preserve annually.
Objective 2: Reduce and control erosion on the preserve. Strategies:
a. Reroute or temporarily close any trail where necessary.
b. Cover trails with woodchips as needed to prevent surface soil erosion.
c. Prohibit use of motorized vehicles such as dirt bikes and all-terrain vehicles on the trail system.
d. Maintain a vegetated buffer around the ponds.
e. Limit horses and bicycles to upland trails only.
f. Re-vegetate closed trails to reduce erosion of soil.
g. Install water bars or other erosion control methods as necessary
MANAQUAYAK PRESERVE MANAGEMENT PLAN
35
Objective 3: Protect the value of the preserve as migratory and breeding habitat for avian and other wildlife species Strategies:
a. Retain snags in woodland where these trees do not pose unacceptable safety or fire hazards.
b. Monitor changes in vegetation cover during regular property checks and by updating ecological inventory in 2025. c. Require dogs be leashed on the preserve. Objective 4: Monitor Ice House Pond. Strategies:
a. Continue monitoring water chemistry in the pond during the summer and shoulder seasons to compare with baseline conditions that measured nutrient loading, total suspended solids, pond water fluctuations and other necessary parameters;
i. measure dissolved oxygen, pH, conductivity, water level and temperature at 0.5 and 1 meter intervals bimonthly or monthly, May-October (through fall overturn);
ii. measure secchi depth bimonthly or monthly, May-October; iii. measure alkalinity in April, July and October; iv. measure total and dissolved nutrients and total suspended solids
in April, July, August and September.
b. Provide an annual summary of water quality monitoring data to the West Tisbury Board of Health for comments and recommendations for the pond; and/or to stimulate new local or regional planning and regulatory efforts in the watershed, as necessary.
c. Provide annual summary of water quality monitoring data to the Executive Office of Energy and Environmental Affairs as part of the land bank’s annual report.
. Objective 5: Monitor for and control the spread of invasive species.
Strategies: a. Cut or uproot invasive species as they are observed. b. Monitor for re-growth and continue to manage invasive plants.
MANAQUAYAK PRESERVE MANAGEMENT PLAN
36
c. Explore other control methods and implement with permission of the MVLBC, MA-NHESP and West Tisbury conservation commission if physical control methods fail.
d. Work with neighbors to control invasive species along shared boundaries.
e. Prohibit the use of water accessories such as floats, paddleboards, kickboards and boogieboards, in order to reduce the chances of introducing aquatic exotic invasive plants and wildlife into Ice House Pond.
Objective 6: Reduce forest fire danger on the preserve. Strategies:
a. Prohibit open flame fires on the preserve.
b. Monitor and reduce “ladder” fuels in the woodland understory.
c. Prohibit storage of brush piles on the preserve.
Objective 7: Protect river otter habitat on the preserve Strategies:
a. Require dogs be leashed by owners on the preserve.
b. Monitor otter activity on the preserve.
c. Minimize negative human-otter interactions if necessary by relocating trails, temporarily limiting recreational uses and temporarily closing trails.
Objective 8: Protect the ponds from nutrient loading from the preserve. Strategies:
a. Control erosion from trails and re-vegetate discontinued trails.
b. Prohibit feeding of waterfowl from the preserve.
c. Provide a self-contained portable toilet during the summer season in the Wintergreen Lane trailhead where it currently is situated.
d. Post signage at the top of the access stairs to the pond recommending that visitors use the portable toilet prior to entering the pond.
MANAQUAYAK PRESERVE MANAGEMENT PLAN
37
e. Prohibit use of disposable swim diapers for children and adults in the pond; recommend the use of reusable swim diapers if incontinence is an issue.
f. Prohibit the use of soap in the pond, encourage bathing or rinsing off by
visitors at home prior to coming to the preserve to swim.
B. Recreation and Aesthetics
Allow limited, low-impact recreational use of the area for hiking, Nordic skiing,
bicycling, horseback-riding, swimming and picnicking; and maintain attractive views
and landscapes provided that these uses do not preclude attainment of nature
conservation objectives. Objective 1: Open the property for low-impact recreation Strategies:
a. Open the property for swimming, hiking, Nordic skiing, non-motorized biking, horseback-riding and other passive uses.
b. Utilize existing trails and install new trail(s) where appropriate (see Site
Management Map)
c. Monitor impact of passive recreational use on the preserve annually and manage accordingly.
d. Prohibit launching of boats from the preserve with the exception of designated individuals with approval from the land bank for ecological study
e. Tag and remove abandoned boats that wash up on the pond shore and remain more than 48 hours.
Objective 2: Create a new 4-vehicle trailhead off Lambert’s Cove Road in an easement
area located adjacent to the road in order to relieve the Manaquayak Road of such use and to stop illegal parking along Manaquayak Road, at the Lambert’s Cove Inn and in private driveways.
Strategies:
a. Designate the existing 4-vehicle trailhead off Wintergreen Lane for vehicle access by individuals 70 years and older and for land bank staff.
MANAQUAYAK PRESERVE MANAGEMENT PLAN
38
b. Allow walk-on visitors only from the nearby Manaquayak Road neighborhood to access the preserve through the Wintergreen Lane trailhead; and direct all other walk-on visitors to use the Lambert’s Cove Road trailhead.
c. Maintain bike racks and allow bicycle access to the preserve from both trailheads.
d. Direct visitors on how to access the preserve in the land bank map and website.
e. Per relevant deed restrictions, maintain the pull-off space along the Wintergreen Lane trailhead per the relevant deed restriction and reserve the space for the “Right Holders” use only.
f. Install a gate on the Lambert’s Cove Road driveway beyond the entrance to the new trailhead in order to keep visitor vehicle access to the confines of the trailhead.
g. Allow the gate to be locked on Pepperbush Way if requested by the Pepperbush Way neighborhood.
Objective 4: Create trail system as shown on the Site Management Map. Strategies:
a. Create trail network as shown on the Site Management Map: i. create 0.81 miles of new trail; ii. make trail corridors six to eight feet wide and eight feet tall
when possible, with the exception of existing old roads which may be maintained at their present width;
iii. free trails of rocks, roots and other obstacles where practical;
iv. install erosion control measures where needed; v. mark trails with markers or directional signs if needed; vi. site trails so that they are as unobtrusive as possible to
nearby homes and sensitive wildlife habitat; vii. site trails so that they connect, as well as possible, to other
conservation lands, ancient ways and trail easements.
b. Install a raised boardwalk with light penetration at Rainwater Pond in order to create a viewing platform.
c. Direct visitors to use the perch as the single access to Ice House Pond.
MANAQUAYAK PRESERVE MANAGEMENT PLAN
39
d. Screen views of houses as necessary from trails and view points using native vegetation.
e. Minimize need for signs by siting trails appropriately.
f. Allow land bank staff discretion to close or relocate trails or add new trails, such as spur trails for off-property trail connections.
g. Allow multiple uses of trails where appropriate by hikers and Nordic skiers
h. Restrict horseback-riders and bicyclists to the upland trails of the preserve only.
i. Prohibit visitors’ use of motorized vehicles, such as but not limited to dirt bikes and all-terrain vehicles.
j. Check and maintain trails monthly. Objective 5: Maintain limited views of Ice House Pond from the bench and trail system where possible. Strategies:
a. Trim vegetation by hand in order to maintain intimate views of the pond from the bench and trail.
Objective 6: Protect the natural essence and tranquility of the preserve and Ice House Pond.
Strategies: b. Maintain as much screening as possible along the land bank’s border
with FOCUS.
c. Prohibit amplified music or reveling on the preserve.
d. Prohibit alcohol on the preserve.
e. Prohibit campfires and all forms of cook stoves from the preserve.
f. Prohibit glass containers from the entire property.
g. Require a carry-in-carry-out policy for trash on the preserve.
h. Prohibit nudity on the preserve.
i. Prohibit diving, jumping and splashing from the perch.
MANAQUAYAK PRESERVE MANAGEMENT PLAN
40
j. Encourage the use of quiet voices while on the perch and in the water.
k. Prohibit the use of water accessories such as floats, paddleboards,
boogieboards and kickboards, in order to reduce noise in the pond.
l. Prohibit dogs from being left in vehicles or tied up on the preserve while visitors swim.
Objective 7: Entertain possibilities for other trail links
Strategies: a. Use existing trails on the preserve where possible and create new trails
as necessary to connect the preserve to future conservation land and trail easements.
b. Create links to other conserved land and easements.
Objective 8: Require that dog owners leash their dogs while on the preserve. Strategies:
a. Encourage visitors to clean up after their pets.
b. Require dogs be leashed on the preserve year-round.
c. Prohibit dogs from the spur trails to Ice House Pond and Rainwater Pond.
d. Post the dog policy that states that “all dogs shall be leashed” on the sign stations as visitors enter the preserve.
Objective 9: Allow access to the pond by visitors for swimming and ice-skating via the spur trail. Strategies:
a. Prohibit use of water accessories in the pond, as stated above in Objective 6. j. except those that are worn on one’s person such as life preserver, swim goggles, swim cap, swimsuit/wetsuit and swim-fins.
b. Do not post a lifeguard on the preserve.
c. Keep a life ring on-premises.
d. Post the preserve “No Lifeguard, Swim at Your Own Risk”

MANAQUAYAK PRESERVE MANAGEMENT PLAN
41
e. Post the preserve “Deep water, Skate at Your Own Risk”.
f. Limit the number of people accessing the pond from the preserve to no
more than 20 visitors at one time with the following considerations: i. that the number of people may be increased or decreased at the
land bank staff’s recommendation to the land bank commission and West Tisbury town advisory board, providing neither the pond nor the preserve would be unduly impacted.
ii. that a public hearing would be conducted prior to any decision to change this ceiling.
C. Natural Products
Allow hunting and gathering, ice-fishing and prohibit camping on the preserve,
provided that natural conservation goals are not precluded. Objective 1: Allow hunting on the 22.6 acres of the preserve off Lambert’s Cove Road per the recommendations of the land bank’s hunting subcommittee. Strategies:
a. Notify the public of the hunting policy on the preserve, in the land bank hunting policy and on the land bank website.
b. Post the property accordingly. Objective 2: Prohibit camping. Strategies:
a. Prohibit camping on the preserve unless special permission is granted by the land bank commission for scouting and like groups and if it is in compliance with appropriate West Tisbury town bylaws and any relevant deed restrictions.
b. Monitor the preserve for squatters and remove unauthorized campers promptly.
Objective 3: Allow gathering of natural products according to the land bank’s Harvesting and Gathering of Natural Products Policy. Strategies:
a. Prohibit gathering of commonwealth- and federally-listed rare plant and wildlife species as well as locally rare plant and wildlife species on the preserve.
MANAQUAYAK PRESERVE MANAGEMENT PLAN
42
b. Prohibit gathering of plants in the coastal plain pond shore unless prior
permission is granted from the land bank ecologist.
c. Prohibit gathering of invasive plants for personal use in order to minimize the spread of seeds elsewhere.
Objective 4: Permit access to Ice House Pond for ice-fishing and prohibit all other fishing access to the pond from the preserve. Strategies:
a. Require all ice-fishing holes be clearly marked for ice-skater safety.
b. work with the commonwealth Division of Fisheries Management and the pond association (if any) regarding stocking the pond with pickerel or another fish species upon the Division of Fisheries and Wildlife’s determination that stocking fish is necessary and will not knowingly have negative impacts on the pond.
D. Community Interaction
Provide helpful and interesting information about the property for visitors; promote
cultural resource conservation; and allow educational use of the property. Objective 1: Help people find the property and avoid trespassing. Strategies
a. Mark the property on land bank website (www.mvlandbank.com) and map and provide directions.
b. Install “end of land bank property” signs where appropriate.
c. Install land bank logo markers on property.
d. Limit trespassing by closing existing trails.
e. Install gates or fencing as needed.
f. Inform visitors, in the land bank map, how to access the preserve’s trailhead and its intended use.
g. Post map of property and trails as well as an aerial overview of the connecting conservation land and trails on sign station and website as they are updated.

MANAQUAYAK PRESERVE MANAGEMENT PLAN
43
h. Plant vegetation where residential dwellings are visible from the trail, as necessary and if allowed, that blends in with the natural context of its environs in order to define and screen the boundaries.
Objective 2: Present useful and interesting information about Manaquayak Preserve to
the public. Strategies:
a. Provide the West Tisbury public library and conservation commission with copies of this management plan if so desired.
b. Make a copy of this plan available at the land bank office and, when file size is not restrictive, on the land bank website.
c. Post information about the cultural and natural history of the preserve at the trailheads.
E. Land Administration
Oversee and police Manaquayak Preserve on a regular basis and develop good
neighborhood relations Objective 1: Maintain good relations with abutters and neighbors. Strategies:
a. Establish contact and working relations with neighbors.
b. Maintain contact and working relations with the West Tisbury conservation commission; send a draft copy of the plan to the West Tisbury conservation commission prior to the public hearing.
c. Post the activities allowed and prohibited on the preserve.
d. Post adequate land bank staff on the preserve from Memorial Day to Labor Day in order to explain and enforce the rules of the preserve.
Objective 2: Keep property well-maintained.
Strategies: a. Inspect property at least monthly.
b. Clean up any litter and junk which may occur.
c. Promptly respond to problems.
d. Employ adequate staff to effectively implement land management goals.
MANAQUAYAK PRESERVE MANAGEMENT PLAN
44
Objective 3: Maintain set hours for use. Strategies:
a. Open property every day of the year from sunrise to sunset
b. Prohibit nighttime use unless special permission is granted by the land bank commission for ecological study.
c. Post “closed at dark” signs on the sign station.
d. Use gates at both trailheads to close trailhead and property at dusk or 8pm, whichever is earlier.
Objective 4: Keep well-maintained boundaries. Strategies:
a. Locate and GPS corners.
b. Walk boundaries annually.
c. Post boundary flags where appropriate.
d. Correct encroachments as they occur.
Objective 5: Keep good records of all land management activities and natural events. Strategies:
a. Record all significant events, natural or otherwise. b. Continue to update plant and wildlife inventories.
c. Maintain photographic record of landscape appearance.
Objective 6: Comply with all applicable regulations and agreements. Strategies:
a. Comply with Massachusetts endangered species act.
b. Comply with wetlands protection act and West Tisbury town wetland by-laws and planning by-laws.
c. Comply with all conservation restrictions, deed restrictions and deeded easements that pertain to the preserve.
d. Request recommendations from the Massachusetts historical commission regarding the proposed activities in the plan.
Objective 7: Monitor recreational use of the preserve and amend management plan
MANAQUAYAK PRESERVE MANAGEMENT PLAN
45
accordingly. Strategies:
a. Record recreational use data as necessary.
b. Include recreation use data in the annual water quality report for Ice House Pond.
IV. Literature Cited
Allen, Ann. 2003. Personal communication with land bank staff. Addy K. and L. Green. 1996. Phosphorus and Lake Aging. Natural Resource Facts. University of Rhode Island Department of Natural Resource Science Cooperative Extension. Factsheet No. 96-2. Avery, T. E., and H. E. Burkhart. 1994. Forest Measurements. McGraw-Hill, Inc., New York, NY. 408 pp. Banks, Charles E. 1911 (1966). The History of Martha’s Vineyard Dukes County Massachusetts: Volume II Town Annals. Dukes County Historical Society. Edgartown, Massachusetts. Barbour, H., T. Simmons, P. Swain and H. Woolsey. 1998. Our Natural Irreplaceable Heritage: Protecting Biodiversity on Massachusetts. Natural Heritage ad Endangered Species Program, MA. Division of Fisheries and Wildlife and the Massachusetts Chapter of the Nature Conservancy. 83pp. Begon, M., J. L. Harper and C. R. Townsend. 1990. Ecology: Individuals, Populations and Communities. Blackwell Scientific Publications. Boston, MA. 945 pp. Ben David, G. 2005. Conversation with J. Scherlis reported in 4-11-05 draft critique. Bury, B. 1984. Ecology and Management of the Bullfrog. United Stated Department of the Interior, Fish and Wildlife Service Resource Publication 155. Washington D.C. 25pp. Conant, R. and J.T. Collins. 1998. Reptiles and Amphibians. 3
rd edition. Houghton Mifflin
Company, Boston, Massachusetts. 616pp.
MANAQUAYAK PRESERVE MANAGEMENT PLAN
46
Cornell Ornithology Laboratory. 2009. All About Birds. http://www.allaboutbirds.org. Dunkle, S.W. 2000. Dragonflies through Binoculars: A Field Guide to Dragonflies of North America. Oxford University Press, New York, NY. 266 pp. ENSR. 2000. Collection and Evaluation of Ambient Nutrient Data for Lakes and Ponds and Reservoirs in New England. Draft New England Interstate Water Pollution Control Commission. Doc# 8726-780-600. Environmental Protection Agency. 1999. Considering Ecological Processes in Environmental Impact Assessments. http://www.epa.gov/compliance/resources/ policies/nepa/ecological-processes-eia-pg.pdf Felix Neck. 1992. Checklist of Martha’s Vineyard Birds. Felix Neck Wildlife Trust, Vineyard Haven, MA.3pp. Green, E. and W. Sachse. 1983. Names of the Land: Cape Cod, Nantucket, Martha’s Vineyard, and the Elizabeth Islands. The Globe Pequot Press, Chester, Connecticut. Haines, A. 2011. Flora Novae Angliae. Yale University Press. New Haven, CT. 973pp.
Hale, A. 1988. Moraine to Marsh: A Field Guide to Martha’s Vineyard. Watership Gardens, Vineyard Haven, Massachusetts. 196pp. Horne A.J. and C.R. Goldman. 1994. Limnology. 2
nd edition. McGraw-Hill, Inc. New
York, New York. 576pp Hotchkiss N. 1972. Common Marsh, Underwater and Floating-leaved Plants of the United States and Canada. Dover Publications, Inc. New York, New York. 124pp. Hunter, M., A. Calhoun and M. McCollough, eds. 1999. Maine Amphibians and Reptiles. The University of Maine Press. Orono, Maine. 252pp. Jorgensen, N. 1978. A Sierra Club Naturalist’s Guide. Sierra Club Books, San Francisco. 417 pp. Kinney, E. and I. Valiela. 2006 a. Nutrient Inputs and Water Quality of Old (Ice) House Pond, West Tisbury, Martha’s Vineyard. Draft report. Boston University Marine Program and Marine Biological Laboratory. 24pp.
MANAQUAYAK PRESERVE MANAGEMENT PLAN
47
Kupferberg, S. 1994. Bullfrogs (Rana catesbeiana) Invade a Northern California Watershed: Impact on Native Frogs and Hydrologic Factors Affecting Establishment. American Zoologist 34:8A. Lovewell, M.A. 1983. Few Traces Remain in our Electric Age of Ice Houses and a Lost Island Industry. The Vineyard Gazette, August 05, 1983. MacKenzie, C.L. 1995. The Natural Ice Industry on Martha’s Vineyard. The Dukes County Intelligencer, August 37(1):37-55. MacKenzie, C.L. and T.J. Andrews. 1997. Origin of Fresh and Brackish-Water Ponds and Fishes on the Vineyard. The Dukes County Intelligencer. Vol. 39, No. 2. November: 59-76. Malcolm, H.L., Jr., A.J.K. Calhoun and M. McCollough, eds. 1999. Main Amphibians and Reptiles. The University of Maine Press. Orono, Maine. 252pp. MA-NHESP. 2005. Correspondence with Tim Simmons, Restoration Ecologist, MA Natural Heritage and Endangered Species Program. 1p. Massachusetts Geographic Information System. 2003. Executive Office of Environmental
Affairs. www.state.ma.us/mgis/massgis.htm. MVC-WTCC. 2001. Seth’s Pond: Present Water Quality and Proposed Management Plan. The Town of West Tisbury Conservation Commission and The Martha’s Vineyard Commission. 84pp. Newcomb, L. 1977. Newcomb’s Wildflower Guide. Little Brown and Company, Boston,
MA. 490 pp. Norland E.R. and T.M. Stockdale 1999. Ohio Pond Management. Bulletin 374-99.
http://ohioline.osu.edu/b374/index.html. Oldale R. N. 1992. Cape Cod and the Islands: The Geologic Story. Parnassus Imprints, Orleans, Massachusetts. 208pp. Peterson, S.A., D.P. Larsen, S.G. Paulsen and N.S. Urquhart. 1998. Regional Lake Trophic Patterns in the Northeastern United States: Three Aproaches. Environmental Management 22:789-901.
MANAQUAYAK PRESERVE MANAGEMENT PLAN
48
Portnoy, J.W., M.G. Winkler, P.R. Sanford and C.N. Farris. 2001. Kettle Pond Data Atlas
for Cape Cod National Seashore: Paleoecology and Modern Water Chemistry. Cape Cod National Seashore, National Park Service, U.S. Department of Interior. 119p.
Primack, R. B. 1993. Essential of Conservation Biology. Sinauer Associates Inc.
Sunderland, Massachusetts. 564pp. Scott, N. and B. Woodward. 1994. Survey at Breeding Sites. Measuring and Monitoring Biological Diversity: Standard Methods for Amphibians. R. Heyer, M. Donnelly, R. McDiarmid, L. Hayek and M Foster eds. Smithsonian Institution Press, Washington D.C. 364pp. Soil Conservation Service. 1986. Soil Survey of Dukes County, Massachusetts. United States Department of Agriculture. 144 pp. Sorrie, B.A. 1994. Coastal Plain Ponds in New England. Biological Conservation 68:225- 233. Stiling, P.D. 1996. Ecology: Theories and Applications. 2
nd ed. Prentice Hall, Upper
Saddle River, New Jersey. 539pp. Stumpel, A.H. 1992. Successful Rreproduction of Introduced Bullfrogs Rana catesbeiana in Northwestern Europe: a Potential Threat to Indigenous Amphibians. Biological Conservation 60:61-62. Swain, P. and J. Kearsley. 2000. Classification of the Natural Communities of Massachusetts. Natural Heritage and Endangered Species Program. Westborough, Massachusetts. Swain, P. 1996. Coastal Plain Pondshore Communities. Massachusetts Wildlife XLVI(3): 2-11. Swanson, D.L. and C. Knapp. 1999. The Flora of Martha’s Vineyard. Martha’s Vineyard Sandplain Restoration Project. 129 pp. USGS. 2012. Science Topics: Biological and Physical Processes. http://www.usgs.gov/science/science.php?term=310
MANAQUAYAK PRESERVE MANAGEMENT PLAN
49
Vineyard Gazette-1. 1945. Production of Artificial Ice is Started. June 15, 1945. Vineyard Gazette-2. 1945. Natural Ice Supply is Backlog at New Plant. January 23, 1945. Welch, Basil. 2004. Personal communication with land bank staff. Wisheu, I.C. and P.A. Keddy. 1989. The Conservation and Management of a Threatened Coastal Plain Plant Community in Eastern North America (Nova Scotia, Canada). Biological Conservation 48:229-238. Cornell Ornithology Laboratory. 2009. All About Birds. http://www.allaboutbirds.org. Environmental Protection Agency. 1999. Considering Ecological Processes in Environmental Impact Assessments. http://www.epa.gov/compliance/resources/ policies/nepa/ecological-processes-eia-pg.pdf Felix Neck. 1992. Checklist of Martha’s Vineyard Birds. Felix Neck Wildlife Trust, Vineyard Haven, MA.3pp. Haines, A. 2011. Flora Novae Angliae. Yale University Press. New Haven, CT. 973pp.
USGS. 2012. Science Topics: Biological and Physical Processes. http://www.usgs.gov/science/science.php?term=310
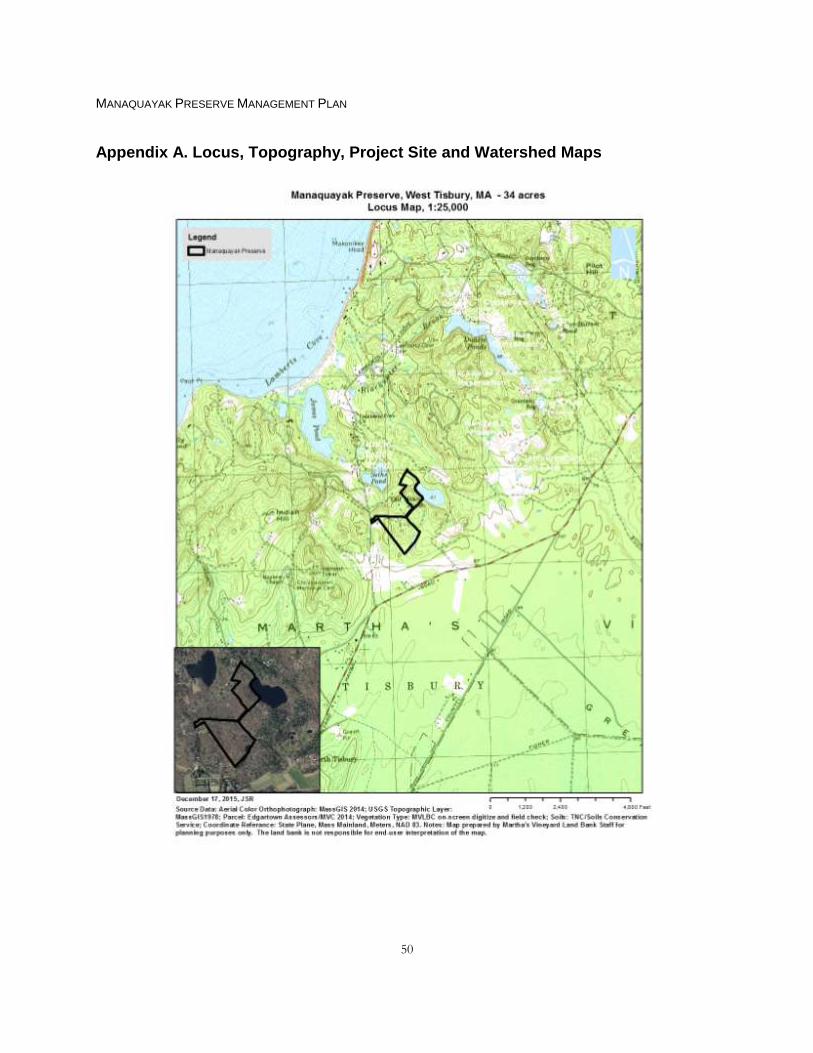
MANAQUAYAK PRESERVE MANAGEMENT PLAN
50
Appendix A. Locus, Topography, Project Site and Watershed Maps
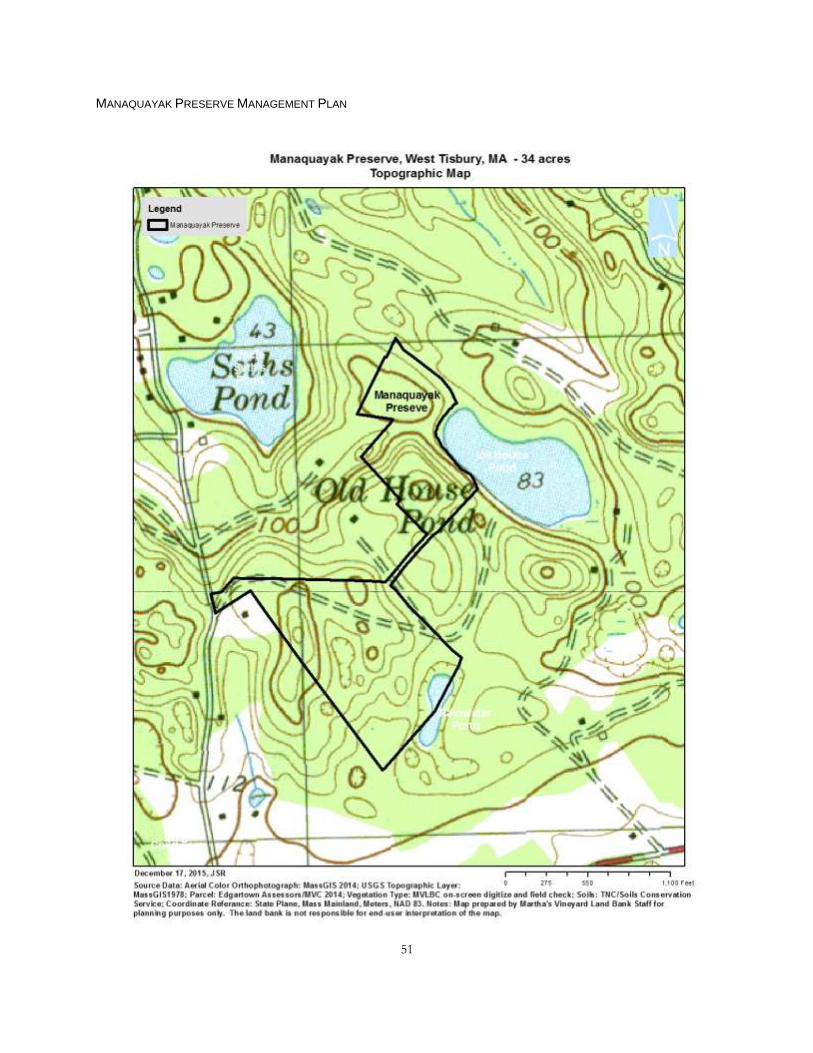
MANAQUAYAK PRESERVE MANAGEMENT PLAN
51
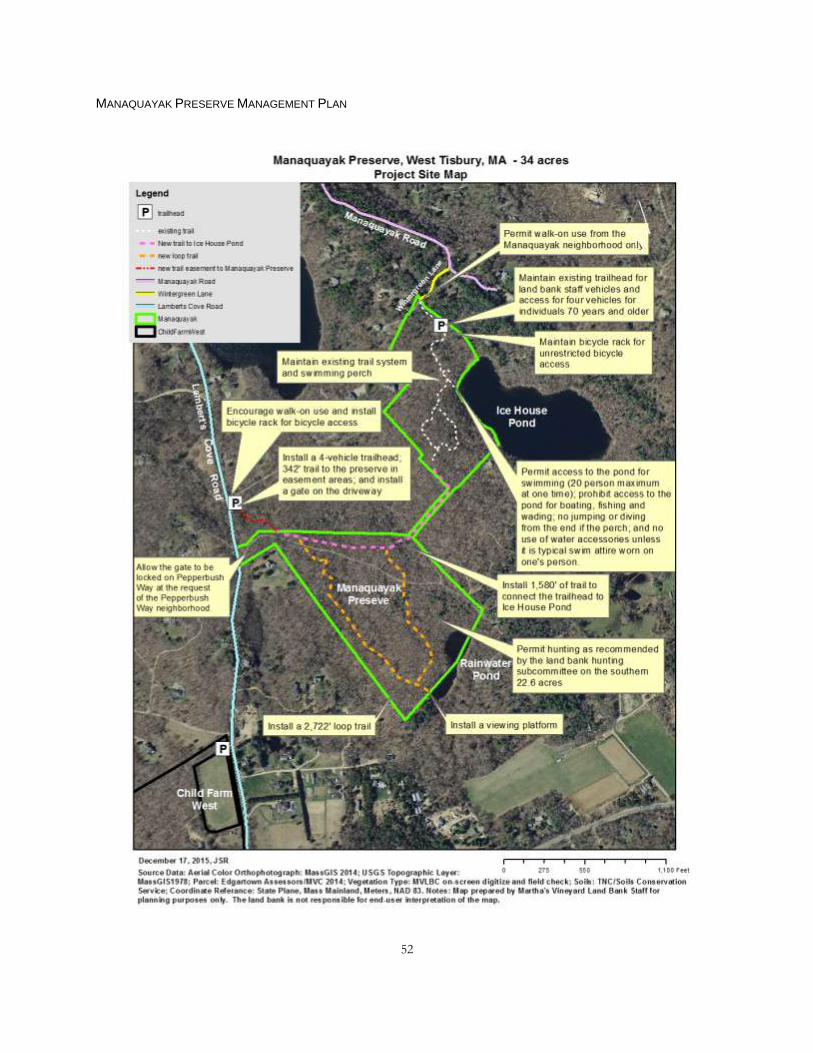
MANAQUAYAK PRESERVE MANAGEMENT PLAN
52
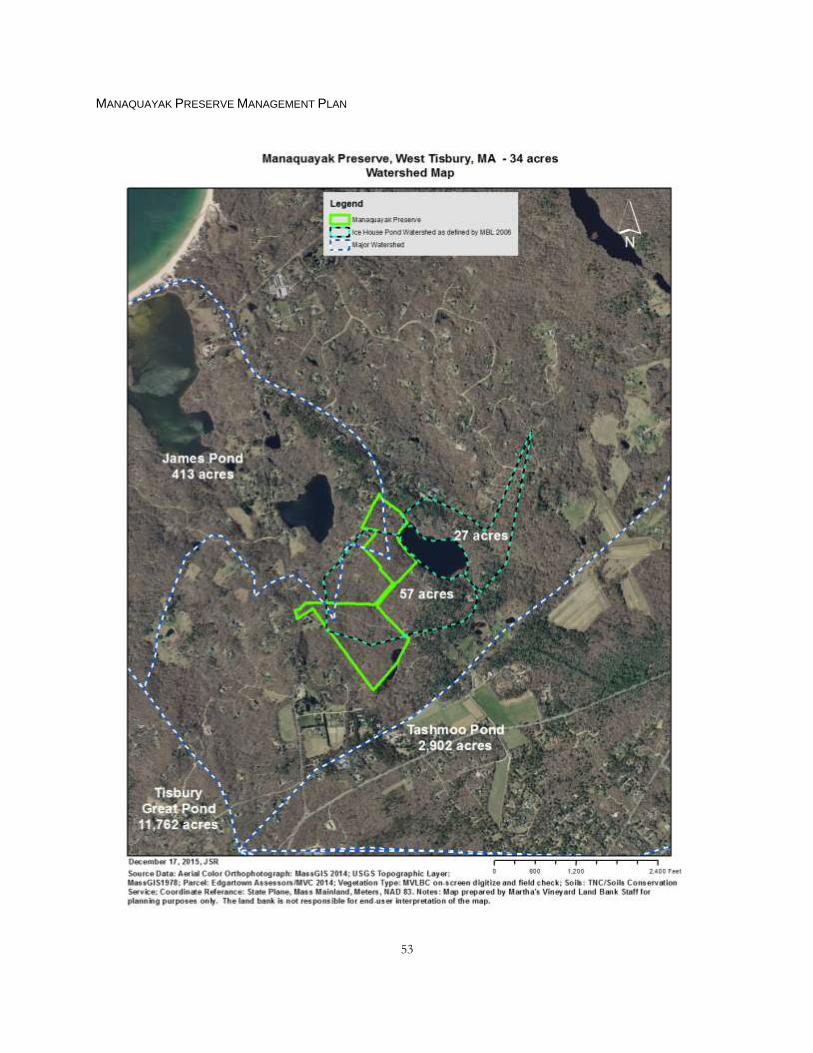
MANAQUAYAK PRESERVE MANAGEMENT PLAN
53
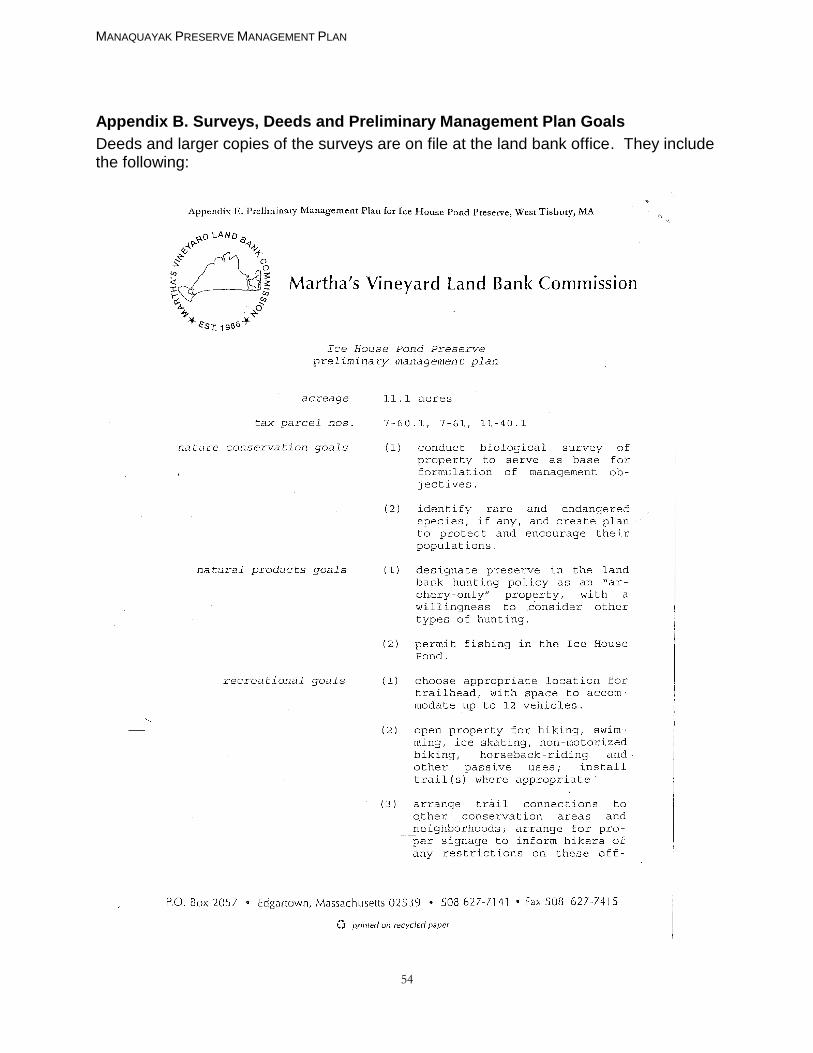
MANAQUAYAK PRESERVE MANAGEMENT PLAN
54
Appendix B. Surveys, Deeds and Preliminary Management Plan Goals
Deeds and larger copies of the surveys are on file at the land bank office. They include the following:
MANAQUAYAK PRESERVE MANAGEMENT PLAN
55
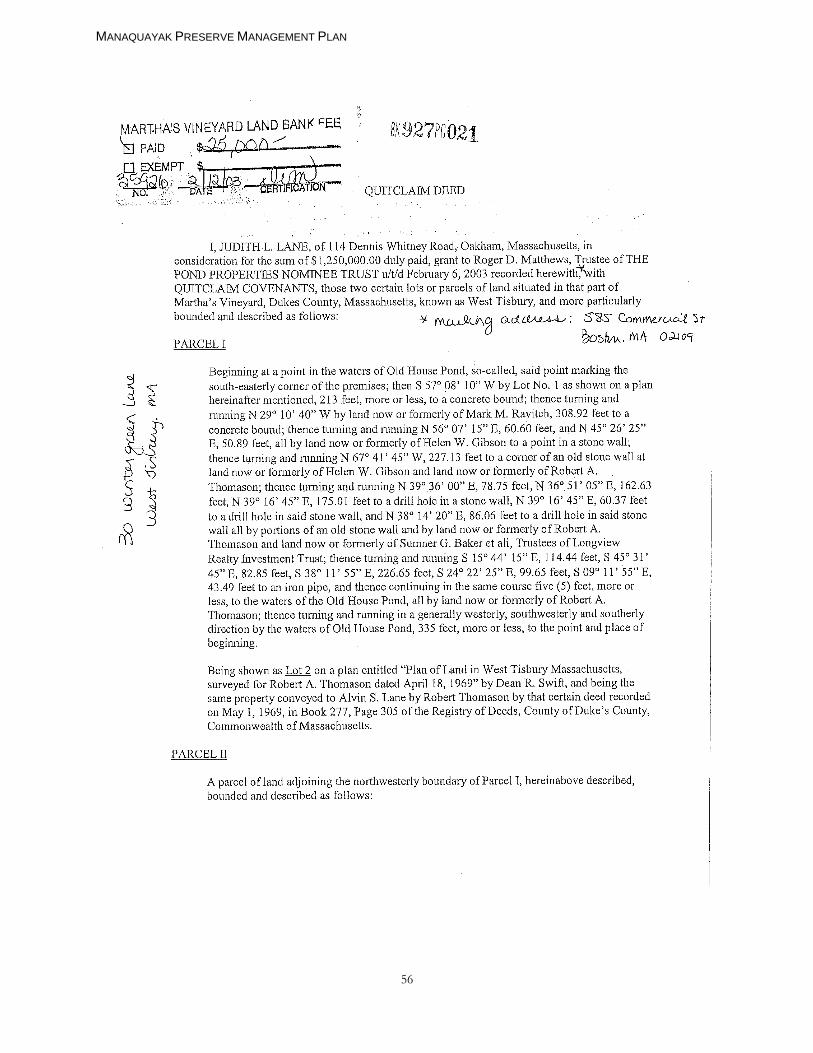
MANAQUAYAK PRESERVE MANAGEMENT PLAN
56
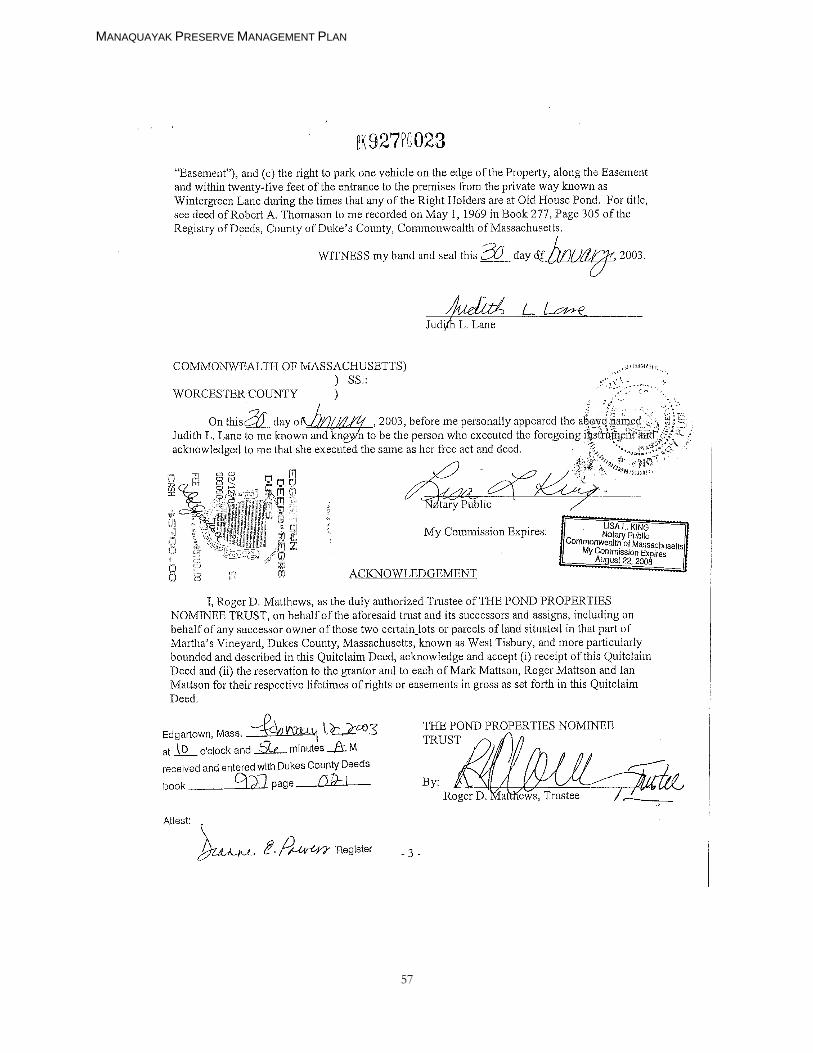
MANAQUAYAK PRESERVE MANAGEMENT PLAN
57
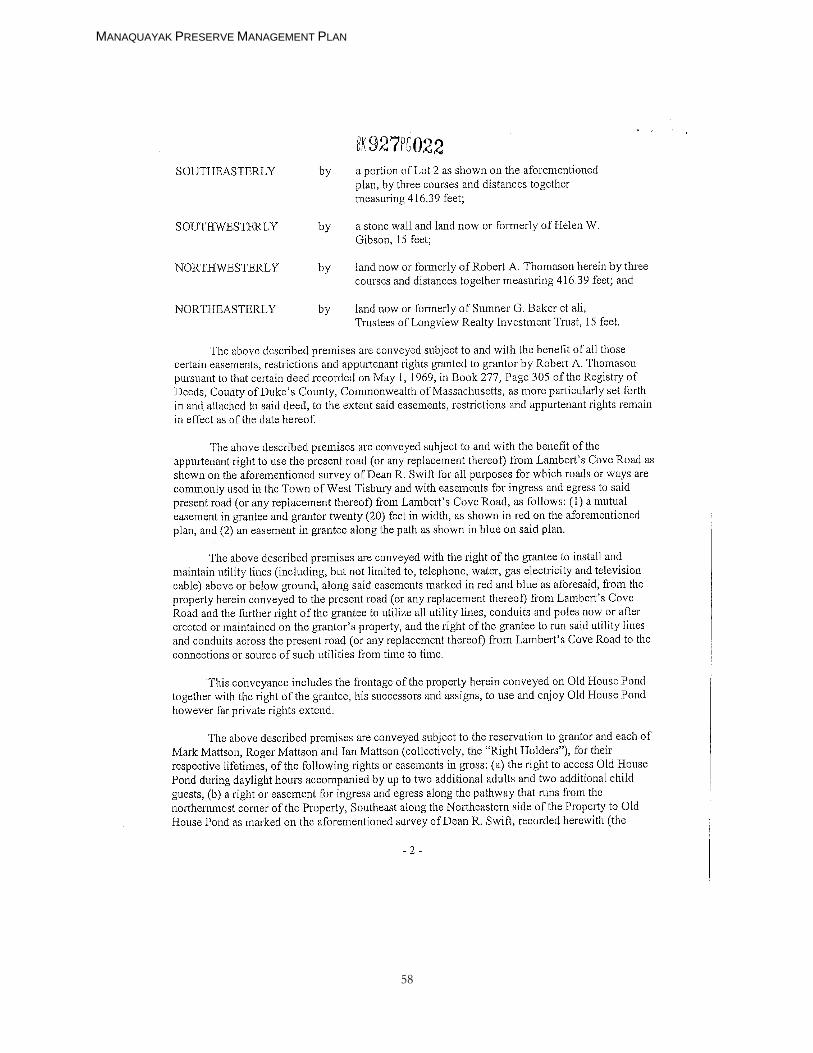
MANAQUAYAK PRESERVE MANAGEMENT PLAN
58
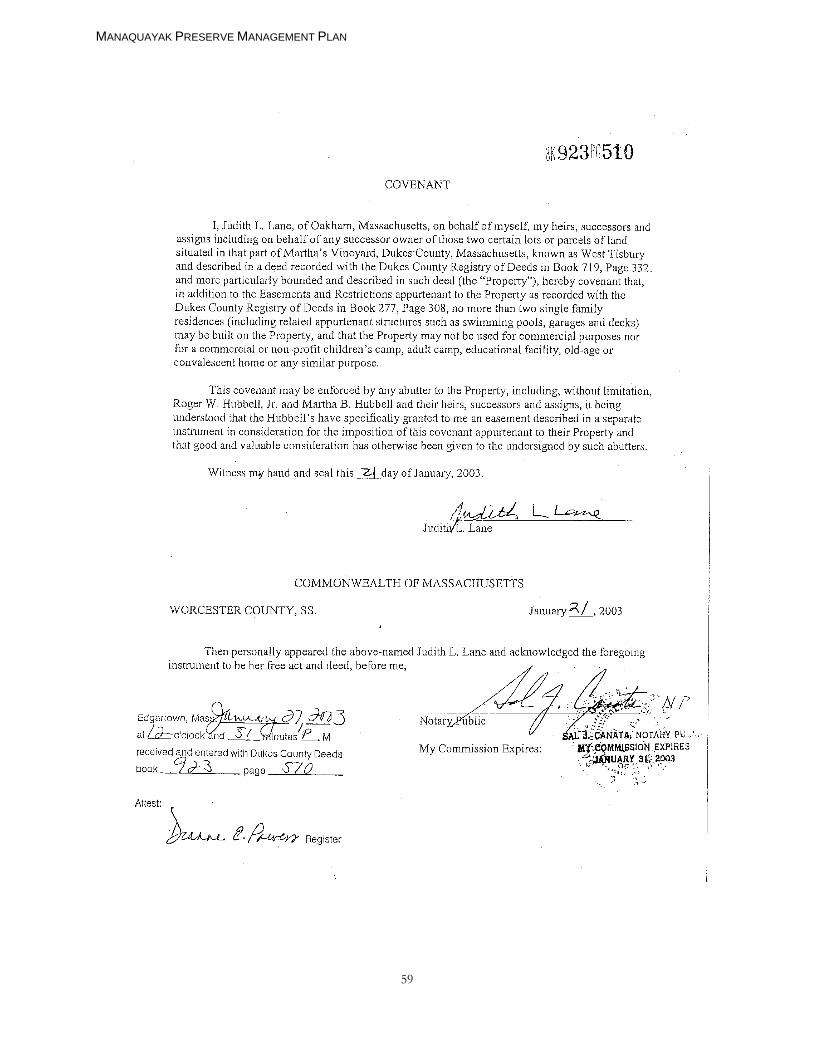
MANAQUAYAK PRESERVE MANAGEMENT PLAN
59
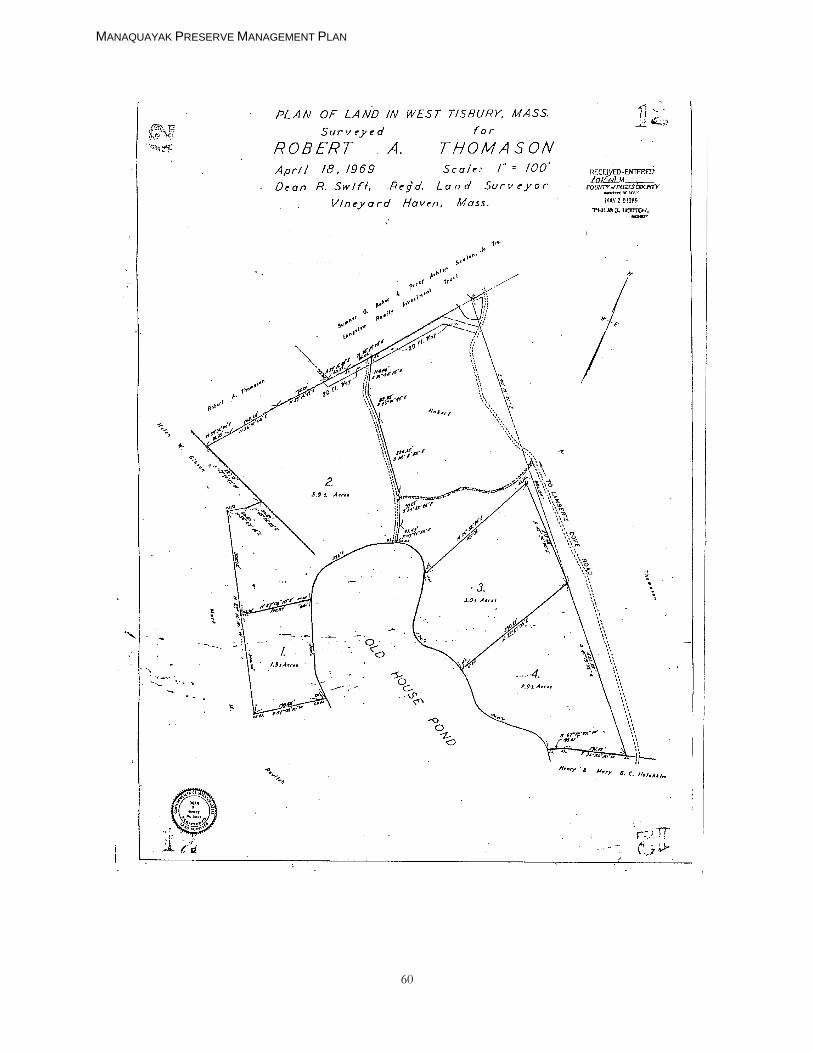
MANAQUAYAK PRESERVE MANAGEMENT PLAN
60
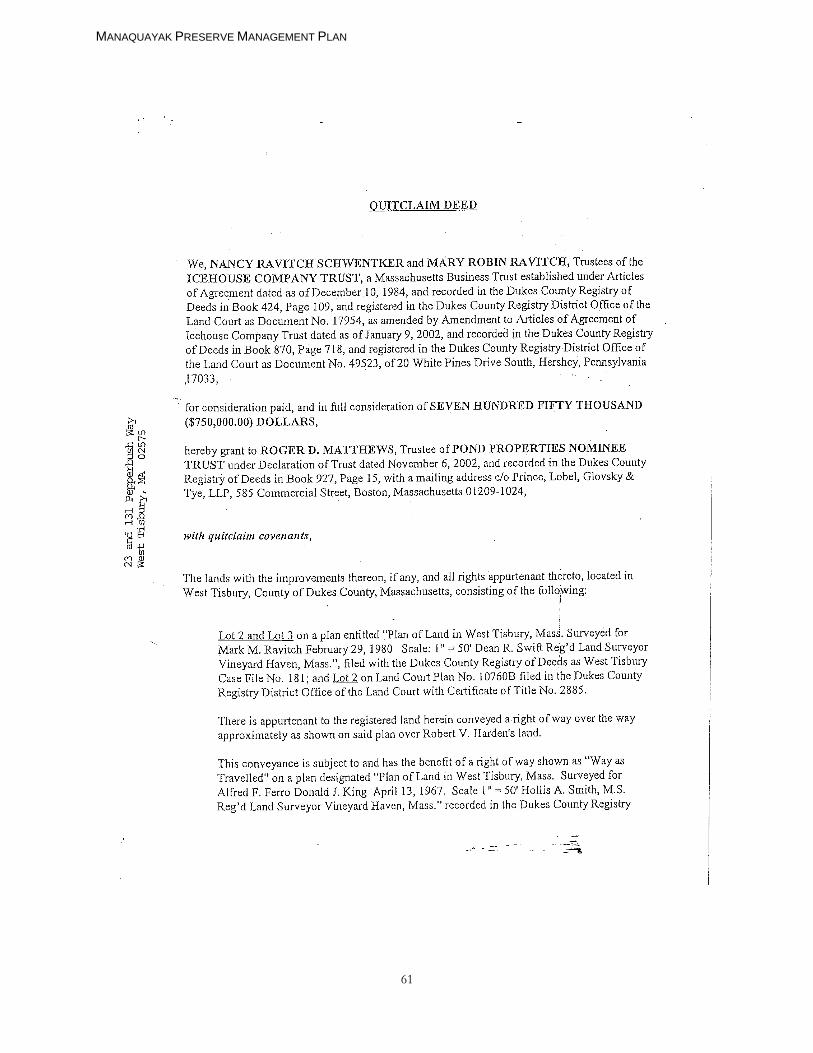
MANAQUAYAK PRESERVE MANAGEMENT PLAN
61
MANAQUAYAK PRESERVE MANAGEMENT PLAN
62
MANAQUAYAK PRESERVE MANAGEMENT PLAN
63
MANAQUAYAK PRESERVE MANAGEMENT PLAN
64
MANAQUAYAK PRESERVE MANAGEMENT PLAN
65
MANAQUAYAK PRESERVE MANAGEMENT PLAN
66
MANAQUAYAK PRESERVE MANAGEMENT PLAN
67
MANAQUAYAK PRESERVE MANAGEMENT PLAN
68

MANAQUAYAK PRESERVE MANAGEMENT PLAN
69

MANAQUAYAK PRESERVE MANAGEMENT PLAN
70

MANAQUAYAK PRESERVE MANAGEMENT PLAN
71
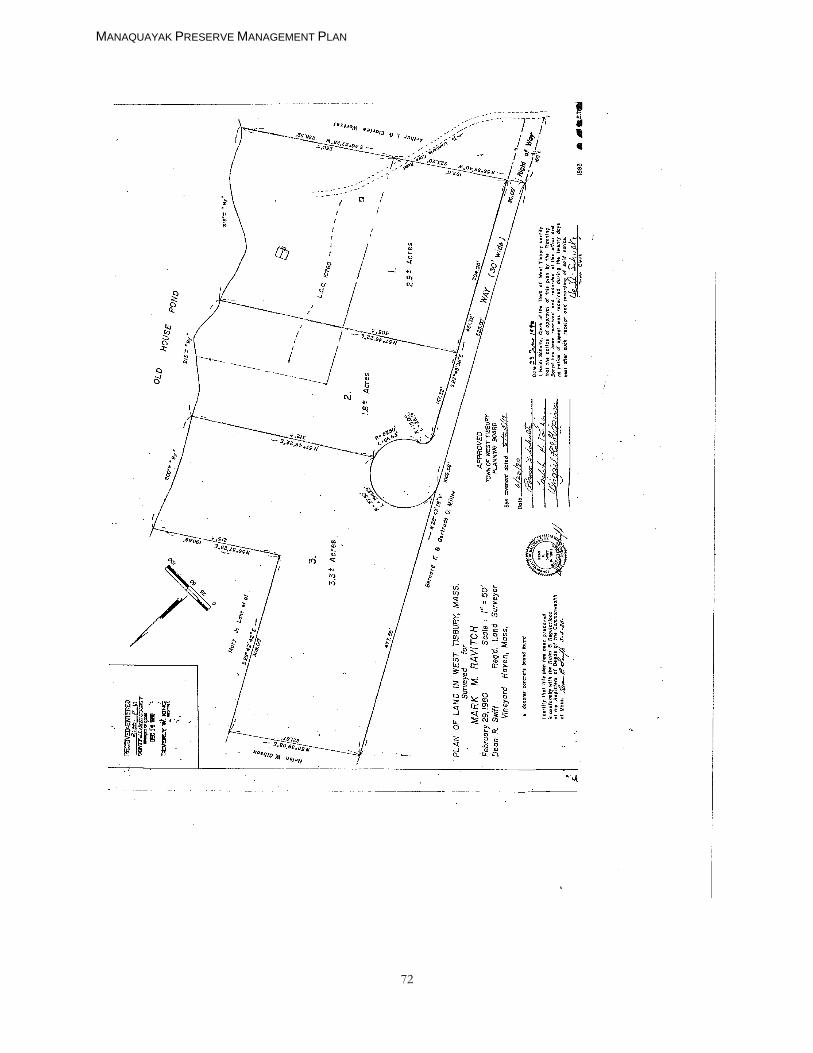
MANAQUAYAK PRESERVE MANAGEMENT PLAN
72
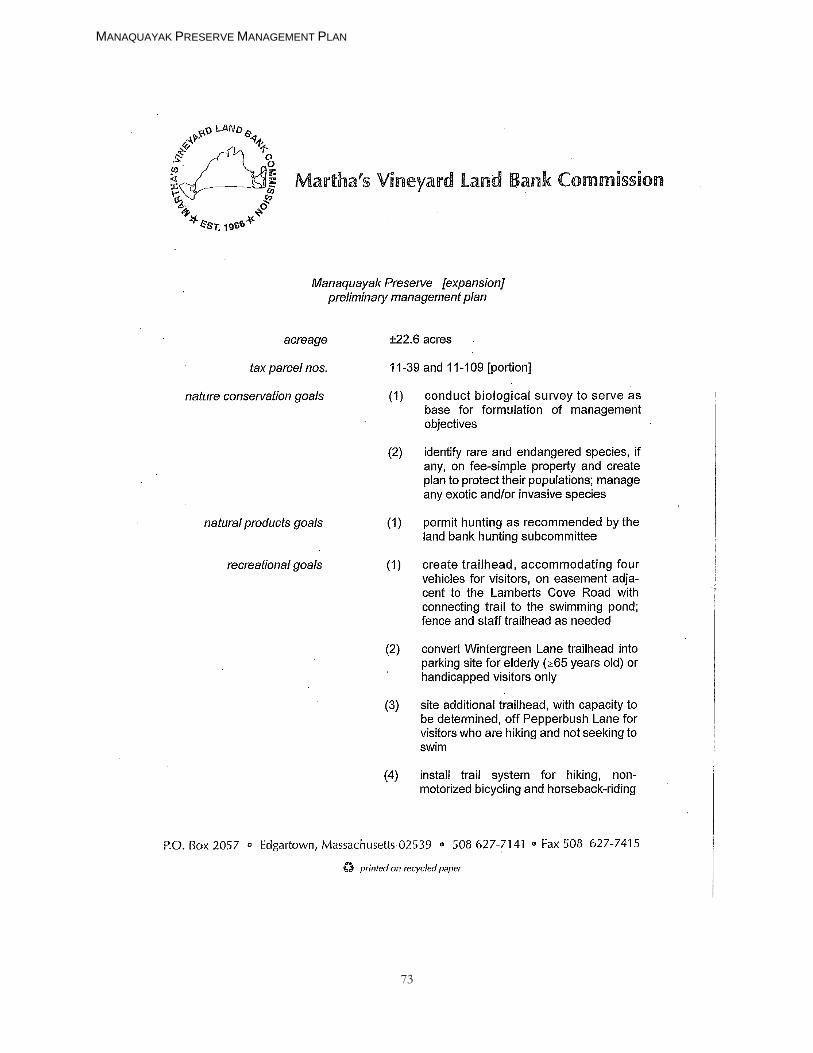
MANAQUAYAK PRESERVE MANAGEMENT PLAN
73

MANAQUAYAK PRESERVE MANAGEMENT PLAN
74
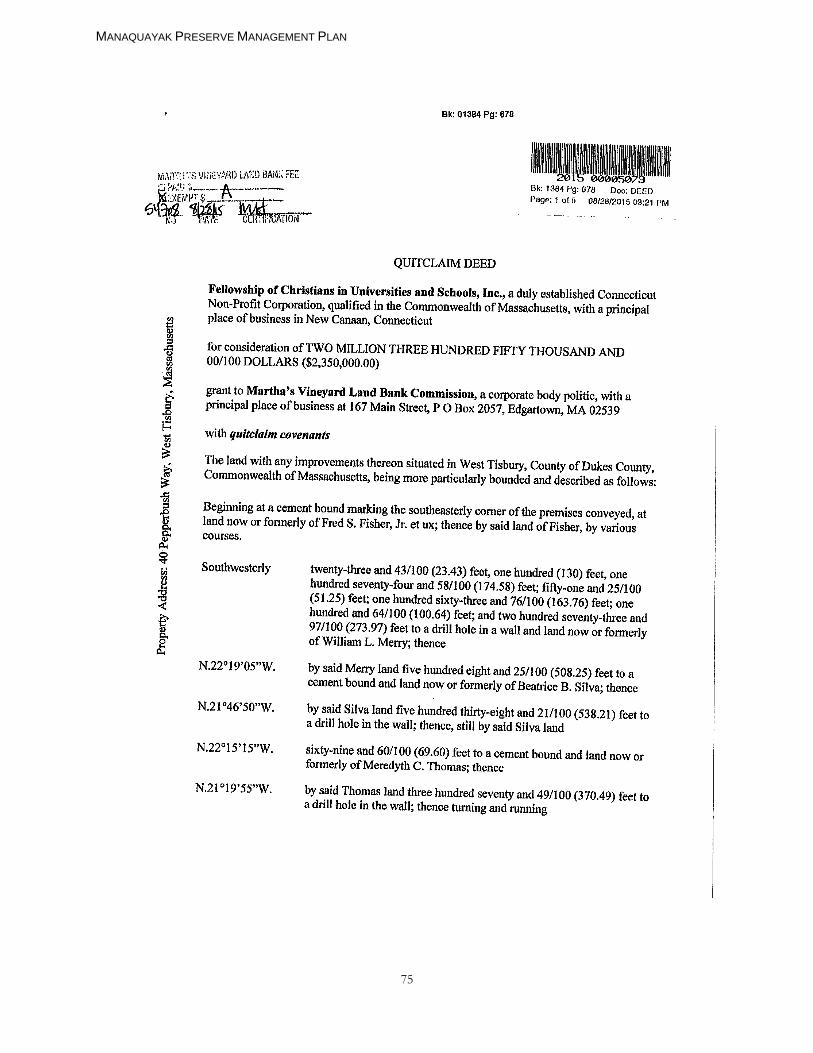
MANAQUAYAK PRESERVE MANAGEMENT PLAN
75
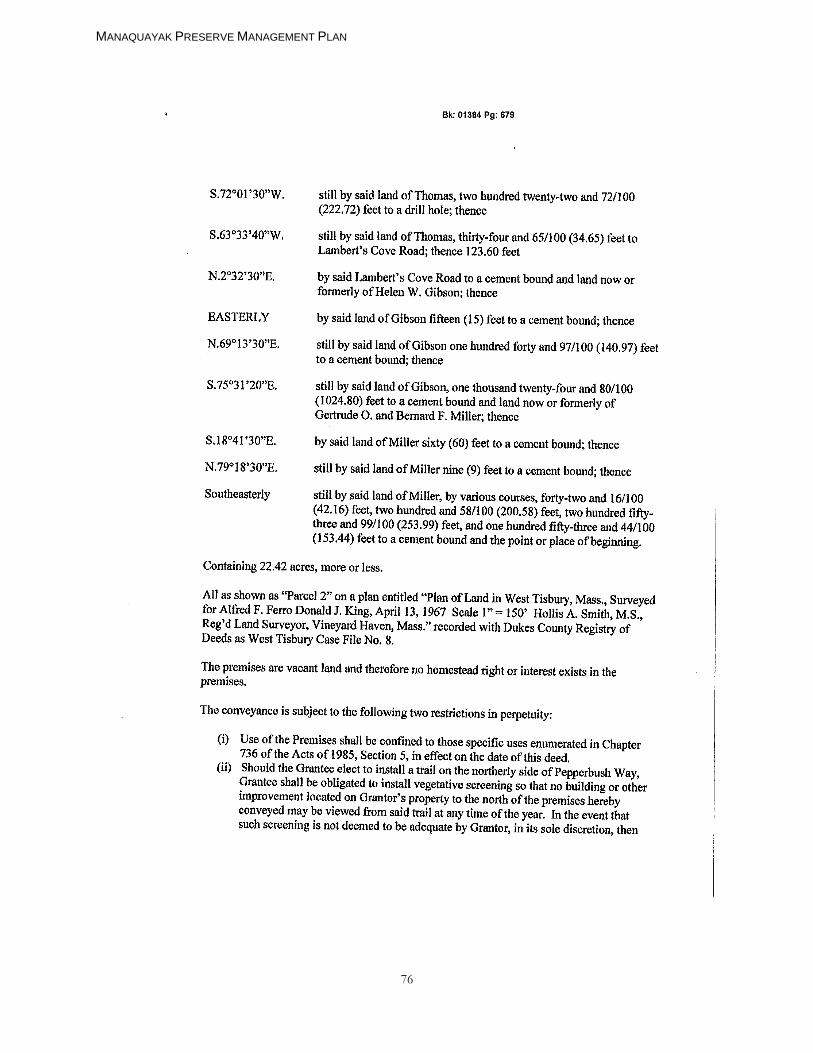
MANAQUAYAK PRESERVE MANAGEMENT PLAN
76
MANAQUAYAK PRESERVE MANAGEMENT PLAN
77
MANAQUAYAK PRESERVE MANAGEMENT PLAN
78
MANAQUAYAK PRESERVE MANAGEMENT PLAN
79

MANAQUAYAK PRESERVE MANAGEMENT PLAN
80
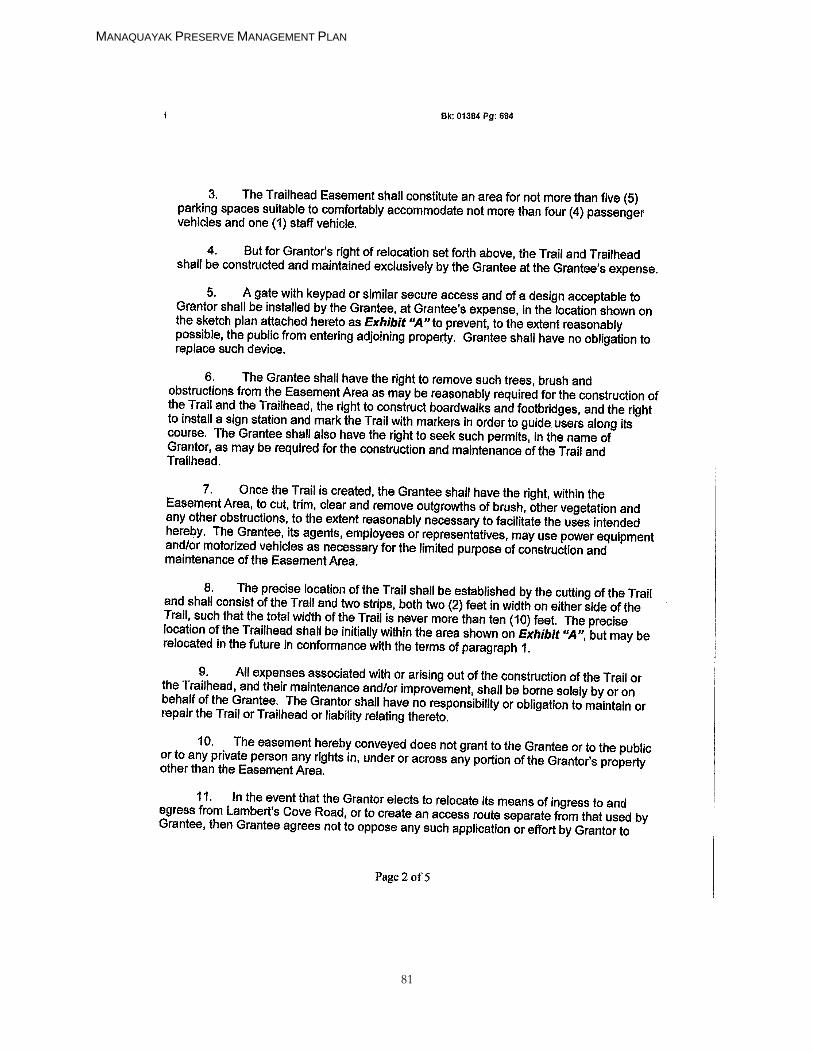
MANAQUAYAK PRESERVE MANAGEMENT PLAN
81
MANAQUAYAK PRESERVE MANAGEMENT PLAN
82
MANAQUAYAK PRESERVE MANAGEMENT PLAN
83
MANAQUAYAK PRESERVE MANAGEMENT PLAN
84
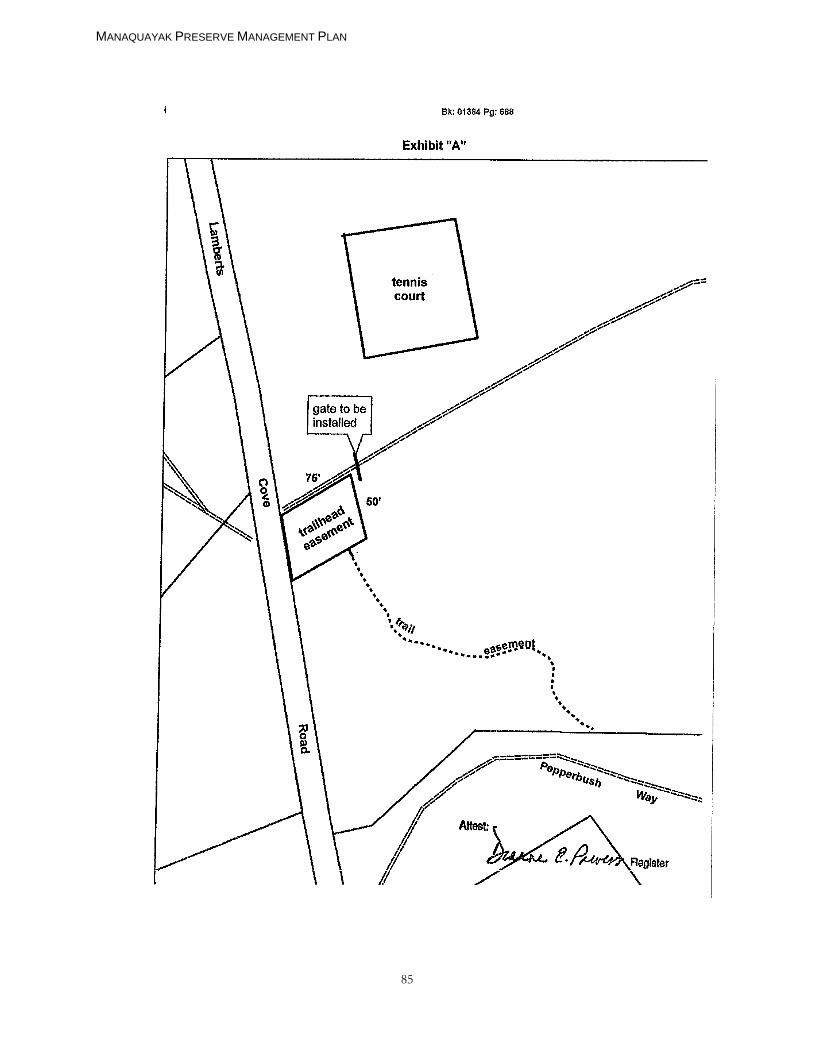
MANAQUAYAK PRESERVE MANAGEMENT PLAN
85
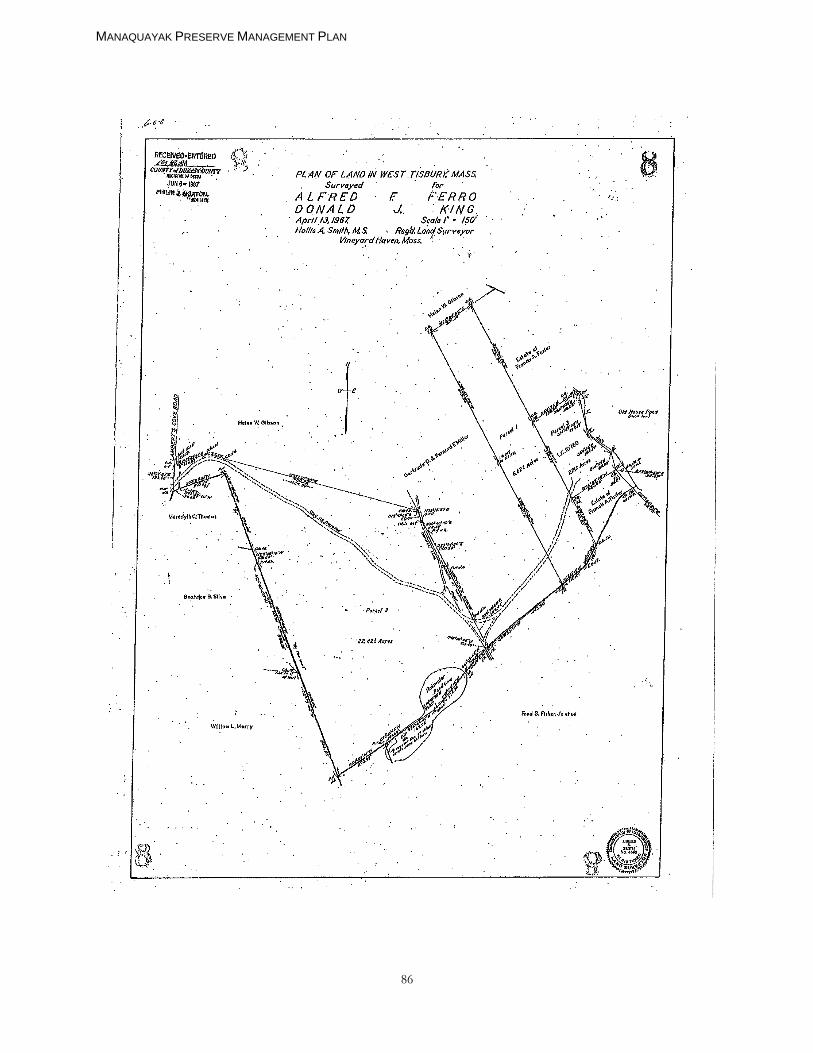
MANAQUAYAK PRESERVE MANAGEMENT PLAN
86
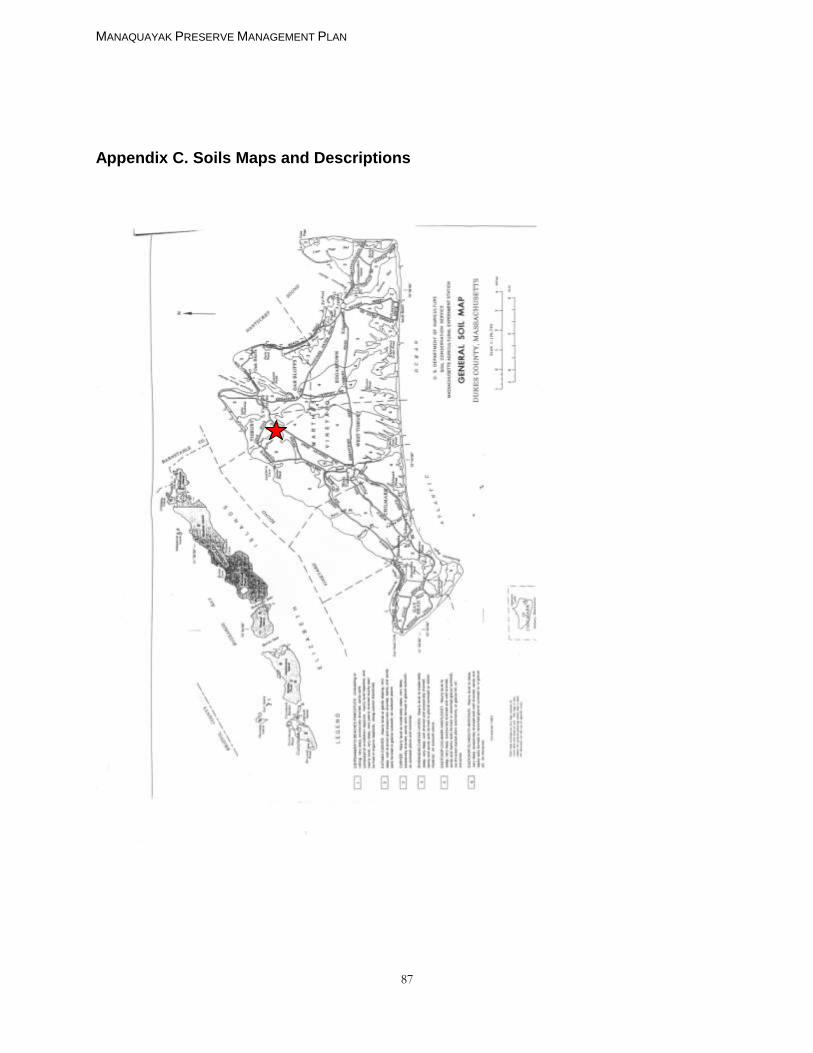
MANAQUAYAK PRESERVE MANAGEMENT PLAN
87
Appendix C. Soils Maps and Descriptions
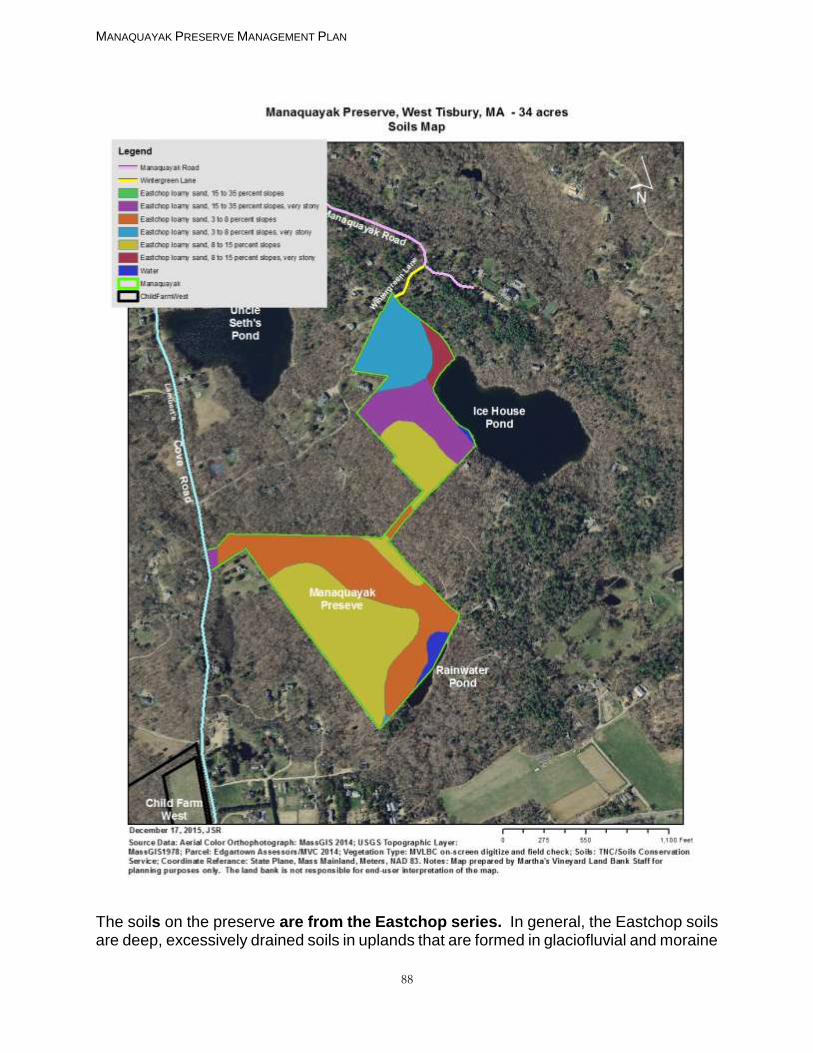
MANAQUAYAK PRESERVE MANAGEMENT PLAN
88
The soils on the preserve are from the Eastchop series. In general, the Eastchop soils are deep, excessively drained soils in uplands that are formed in glaciofluvial and moraine
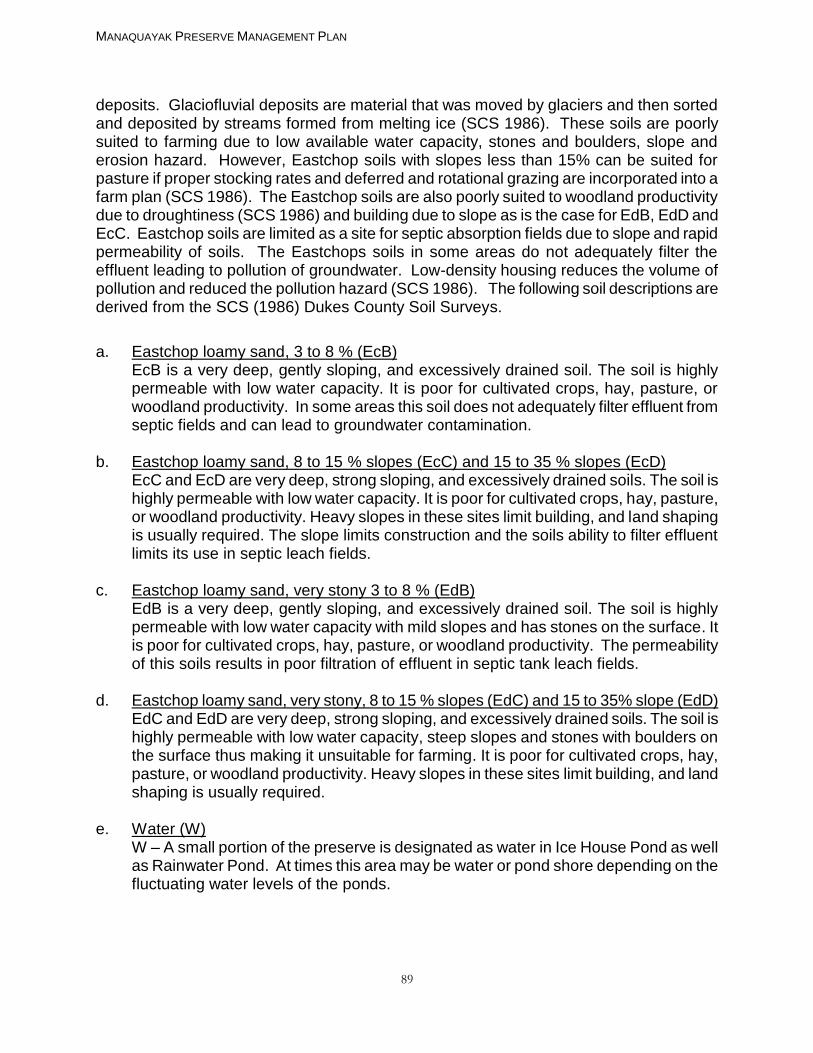
MANAQUAYAK PRESERVE MANAGEMENT PLAN
89
deposits. Glaciofluvial deposits are material that was moved by glaciers and then sorted and deposited by streams formed from melting ice (SCS 1986). These soils are poorly suited to farming due to low available water capacity, stones and boulders, slope and erosion hazard. However, Eastchop soils with slopes less than 15% can be suited for pasture if proper stocking rates and deferred and rotational grazing are incorporated into a farm plan (SCS 1986). The Eastchop soils are also poorly suited to woodland productivity due to droughtiness (SCS 1986) and building due to slope as is the case for EdB, EdD and EcC. Eastchop soils are limited as a site for septic absorption fields due to slope and rapid permeability of soils. The Eastchops soils in some areas do not adequately filter the effluent leading to pollution of groundwater. Low-density housing reduces the volume of pollution and reduced the pollution hazard (SCS 1986). The following soil descriptions are derived from the SCS (1986) Dukes County Soil Surveys.
a. Eastchop loamy sand, 3 to 8 % (EcB) EcB is a very deep, gently sloping, and excessively drained soil. The soil is highly permeable with low water capacity. It is poor for cultivated crops, hay, pasture, or woodland productivity. In some areas this soil does not adequately filter effluent from septic fields and can lead to groundwater contamination.
b. Eastchop loamy sand, 8 to 15 % slopes (EcC) and 15 to 35 % slopes (EcD) EcC and EcD are very deep, strong sloping, and excessively drained soils. The soil is highly permeable with low water capacity. It is poor for cultivated crops, hay, pasture, or woodland productivity. Heavy slopes in these sites limit building, and land shaping is usually required. The slope limits construction and the soils ability to filter effluent limits its use in septic leach fields.
c. Eastchop loamy sand, very stony 3 to 8 % (EdB)
EdB is a very deep, gently sloping, and excessively drained soil. The soil is highly permeable with low water capacity with mild slopes and has stones on the surface. It is poor for cultivated crops, hay, pasture, or woodland productivity. The permeability of this soils results in poor filtration of effluent in septic tank leach fields.
d. Eastchop loamy sand, very stony, 8 to 15 % slopes (EdC) and 15 to 35% slope (EdD) EdC and EdD are very deep, strong sloping, and excessively drained soils. The soil is highly permeable with low water capacity, steep slopes and stones with boulders on the surface thus making it unsuitable for farming. It is poor for cultivated crops, hay, pasture, or woodland productivity. Heavy slopes in these sites limit building, and land shaping is usually required.
e. Water (W)
W – A small portion of the preserve is designated as water in Ice House Pond as well as Rainwater Pond. At times this area may be water or pond shore depending on the fluctuating water levels of the ponds.
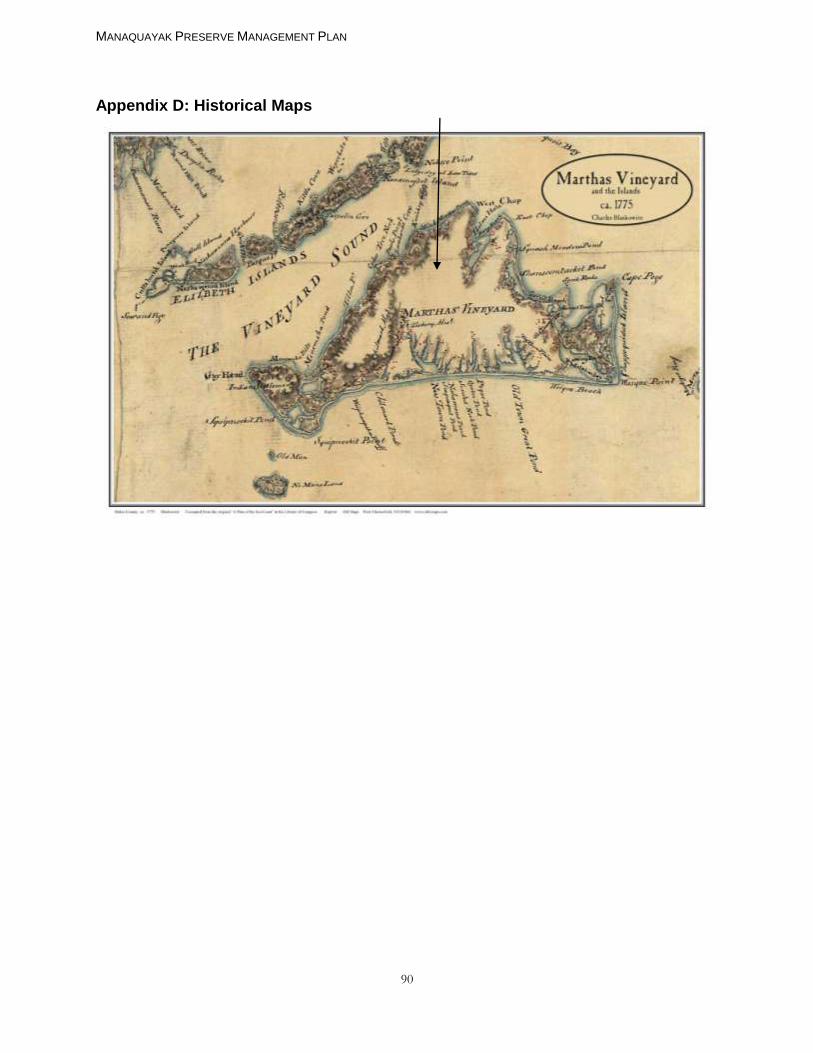
MANAQUAYAK PRESERVE MANAGEMENT PLAN
90
Appendix D: Historical Maps
MANAQUAYAK PRESERVE MANAGEMENT PLAN
91
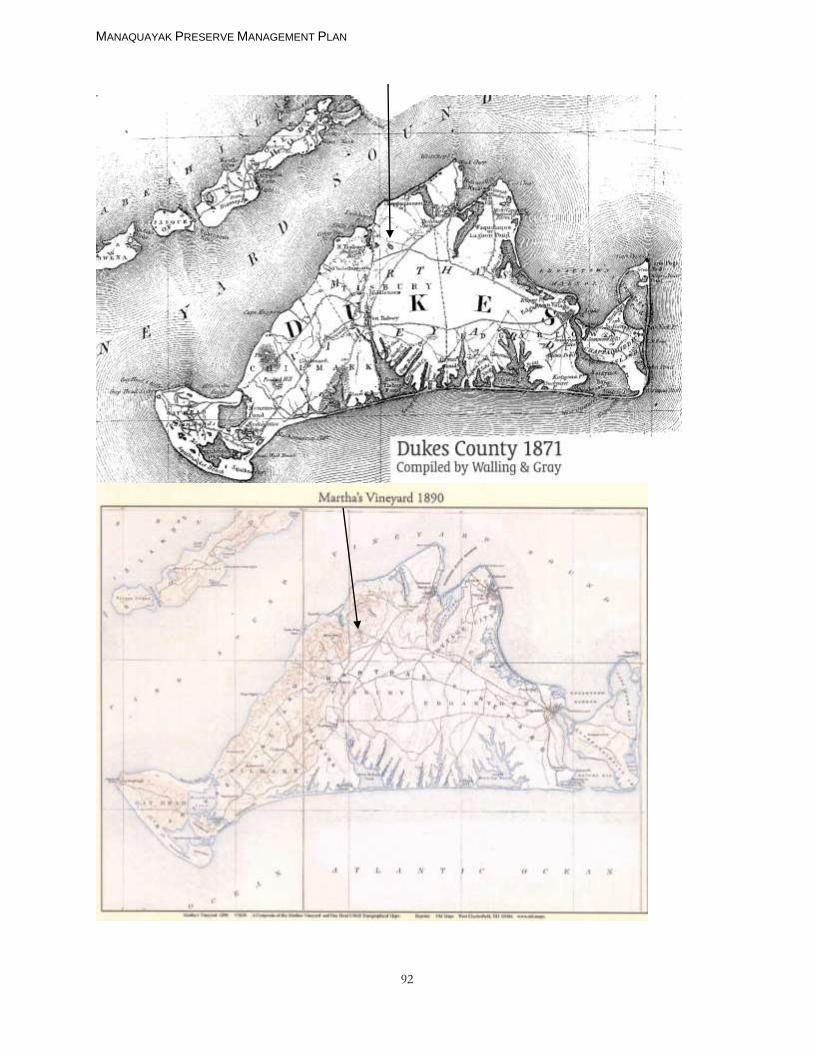
MANAQUAYAK PRESERVE MANAGEMENT PLAN
92
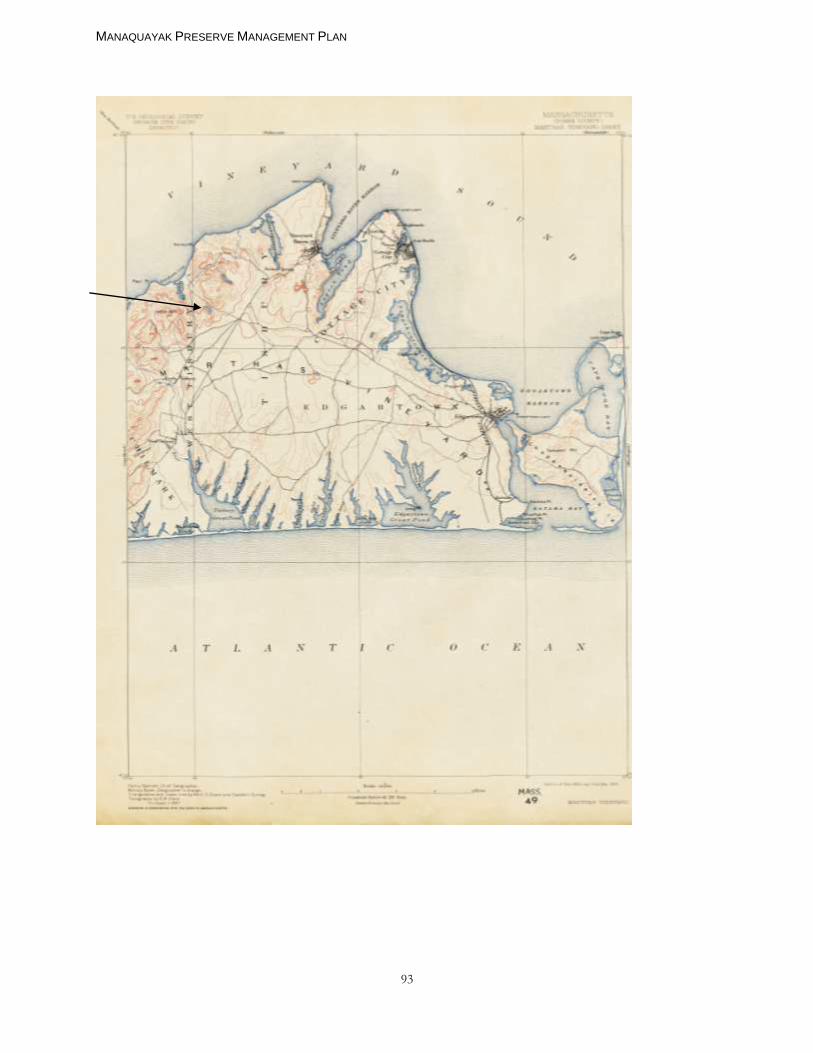
MANAQUAYAK PRESERVE MANAGEMENT PLAN
93
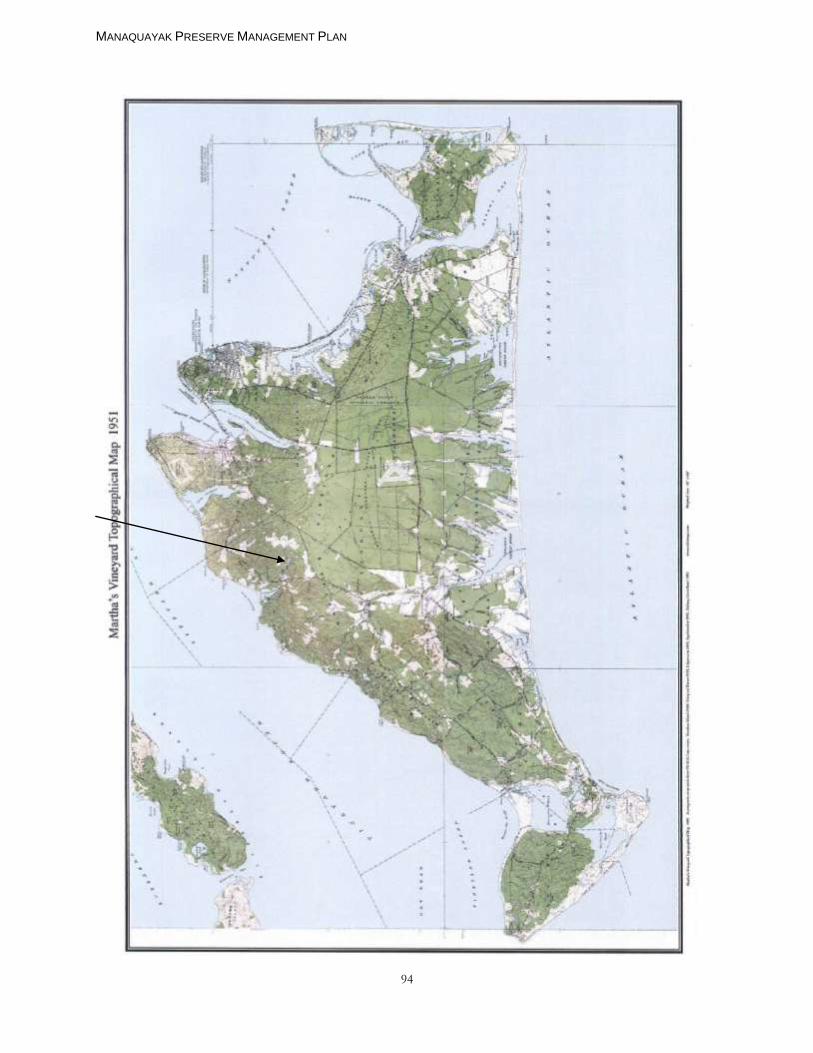
MANAQUAYAK PRESERVE MANAGEMENT PLAN
94
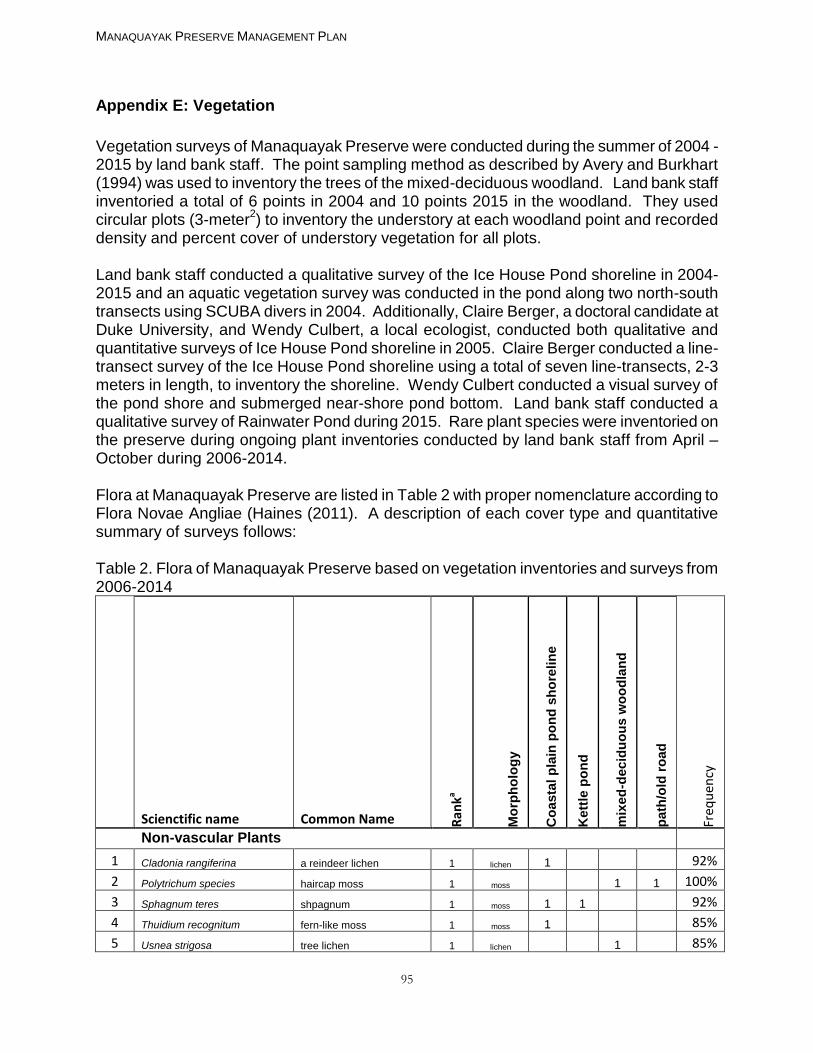
MANAQUAYAK PRESERVE MANAGEMENT PLAN
95
Appendix E: Vegetation
Vegetation surveys of Manaquayak Preserve were conducted during the summer of 2004 -2015 by land bank staff. The point sampling method as described by Avery and Burkhart (1994) was used to inventory the trees of the mixed-deciduous woodland. Land bank staff inventoried a total of 6 points in 2004 and 10 points 2015 in the woodland. They used circular plots (3-meter
2) to inventory the understory at each woodland point and recorded
density and percent cover of understory vegetation for all plots. Land bank staff conducted a qualitative survey of the Ice House Pond shoreline in 2004-2015 and an aquatic vegetation survey was conducted in the pond along two north-south transects using SCUBA divers in 2004. Additionally, Claire Berger, a doctoral candidate at Duke University, and Wendy Culbert, a local ecologist, conducted both qualitative and quantitative surveys of Ice House Pond shoreline in 2005. Claire Berger conducted a line-transect survey of the Ice House Pond shoreline using a total of seven line-transects, 2-3 meters in length, to inventory the shoreline. Wendy Culbert conducted a visual survey of the pond shore and submerged near-shore pond bottom. Land bank staff conducted a qualitative survey of Rainwater Pond during 2015. Rare plant species were inventoried on the preserve during ongoing plant inventories conducted by land bank staff from April – October during 2006-2014. Flora at Manaquayak Preserve are listed in Table 2 with proper nomenclature according to Flora Novae Angliae (Haines (2011). A description of each cover type and quantitative summary of surveys follows: Table 2. Flora of Manaquayak Preserve based on vegetation inventories and surveys from 2006-2014
Scienctific name Common Name R
anka
Mo
rph
olo
gy
Co
asta
l p
lain
po
nd
sh
ore
lin
e
Kett
le p
on
d
mix
ed
-decid
uo
us
wo
od
lan
d
path
/old
ro
ad
Freq
uen
cy
Non-vascular Plants
1 Cladonia rangiferina a reindeer lichen 1 lichen 1 92%
2 Polytrichum species haircap moss 1 moss 1 1 100%
3 Sphagnum teres shpagnum 1 moss 1 1 92%
4 Thuidium recognitum fern-like moss 1 moss 1 85%
5 Usnea strigosa tree lichen 1 lichen 1 85%
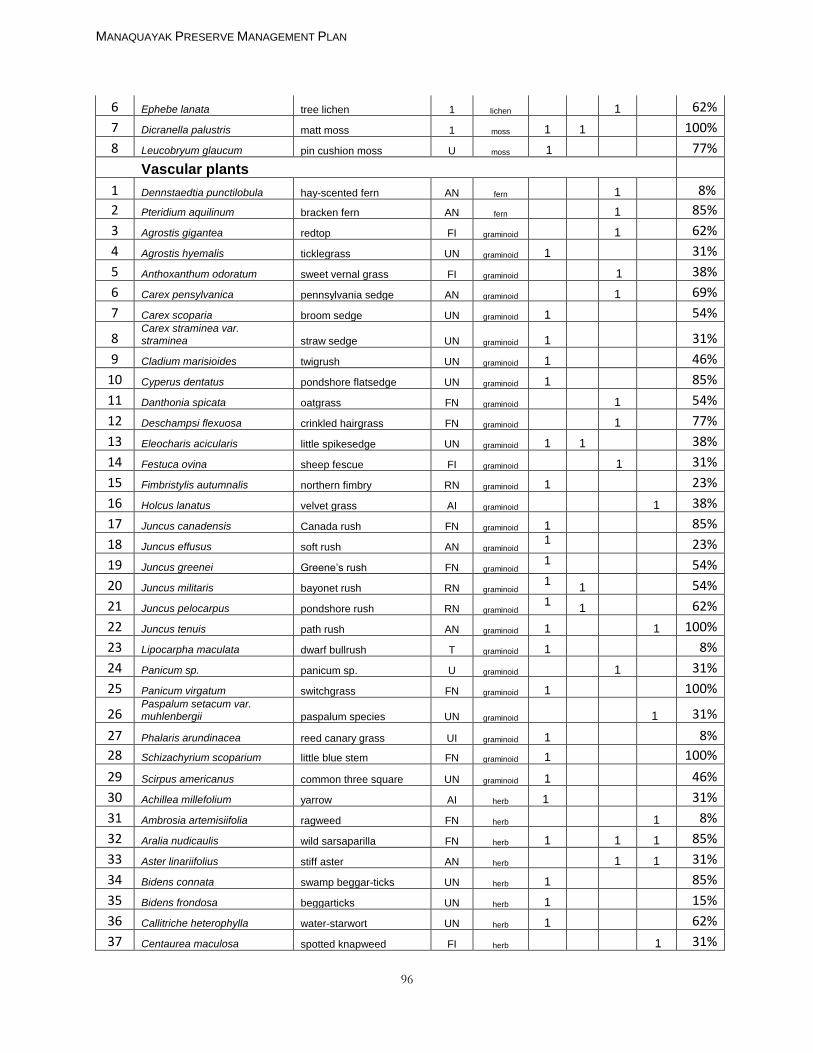
MANAQUAYAK PRESERVE MANAGEMENT PLAN
96
6 Ephebe lanata tree lichen 1 lichen 1 62%
7 Dicranella palustris matt moss 1 moss 1 1 100%
8 Leucobryum glaucum pin cushion moss U moss 1 77%
Vascular plants
1 Dennstaedtia punctilobula hay-scented fern AN fern
1
8%
2 Pteridium aquilinum bracken fern AN fern 1 85%
3 Agrostis gigantea redtop FI graminoid 1 62%
4 Agrostis hyemalis ticklegrass UN graminoid 1 31%
5 Anthoxanthum odoratum sweet vernal grass FI graminoid
1 38%
6 Carex pensylvanica pennsylvania sedge AN graminoid 1 69%
7 Carex scoparia broom sedge UN graminoid 1 54%
8 Carex straminea var.
straminea straw sedge UN graminoid 1 31%
9 Cladium marisioides twigrush UN graminoid 1 46%
10 Cyperus dentatus pondshore flatsedge UN graminoid 1 85%
11 Danthonia spicata oatgrass FN graminoid 1 54%
12 Deschampsi flexuosa crinkled hairgrass FN graminoid 1 77%
13 Eleocharis acicularis little spikesedge UN graminoid 1 1 38%
14 Festuca ovina sheep fescue FI graminoid 1 31%
15 Fimbristylis autumnalis northern fimbry RN graminoid 1 23%
16 Holcus lanatus velvet grass AI graminoid 1 38%
17 Juncus canadensis Canada rush FN graminoid 1 85%
18 Juncus effusus soft rush AN graminoid 1
23%
19 Juncus greenei Greene’s rush FN graminoid 1
54%
20 Juncus militaris bayonet rush RN graminoid 1
1 54%
21 Juncus pelocarpus pondshore rush RN graminoid 1
1 62%
22 Juncus tenuis path rush AN graminoid 1 1 100%
23 Lipocarpha maculata dwarf bullrush T graminoid 1 8%
24 Panicum sp. panicum sp. U graminoid 1 31%
25 Panicum virgatum switchgrass FN graminoid 1 100%
26 Paspalum setacum var.
muhlenbergii paspalum species UN graminoid 1 31%
27 Phalaris arundinacea reed canary grass UI graminoid 1
8%
28 Schizachyrium scoparium little blue stem FN graminoid 1 100%
29 Scirpus americanus common three square UN graminoid 1 46%
30 Achillea millefolium yarrow AI herb 1 31%
31 Ambrosia artemisiifolia ragweed FN herb 1 8%
32 Aralia nudicaulis wild sarsaparilla FN herb 1 1 1 85%
33 Aster linariifolius stiff aster AN herb 1 1 31%
34 Bidens connata swamp beggar-ticks UN herb 1 85%
35 Bidens frondosa beggarticks UN herb 1 15%
36 Callitriche heterophylla water-starwort UN herb 1 62%
37 Centaurea maculosa spotted knapweed FI herb 1 31%
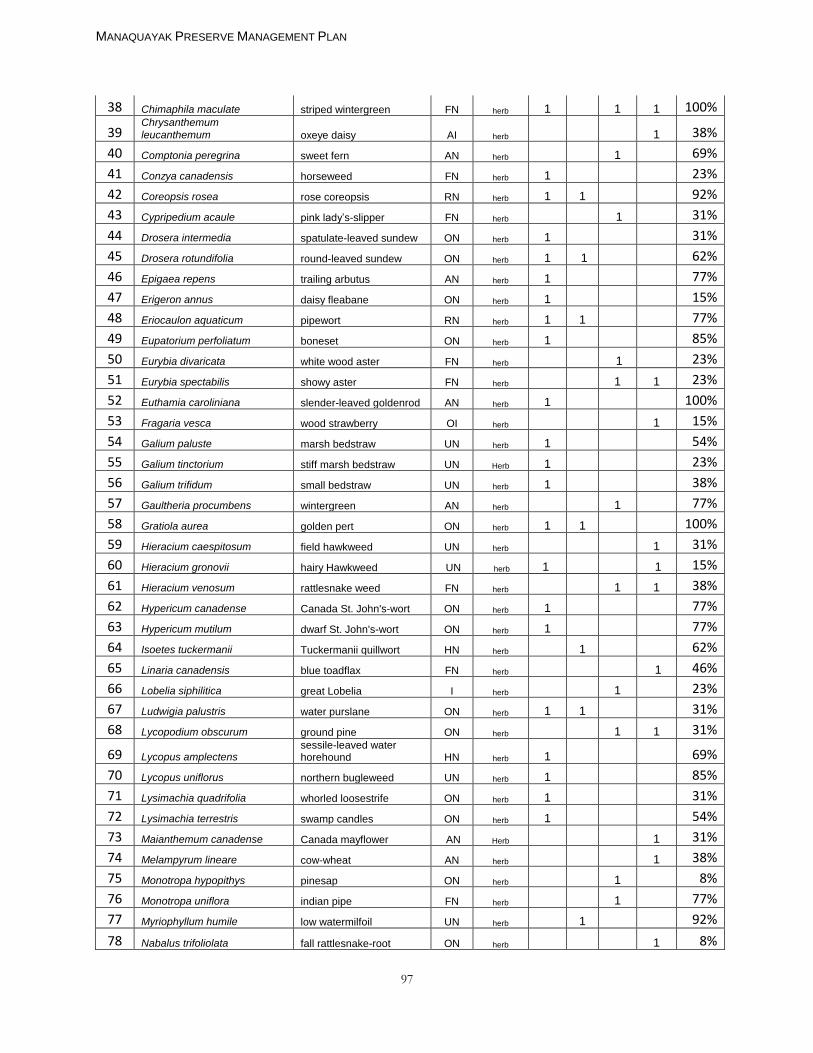
MANAQUAYAK PRESERVE MANAGEMENT PLAN
97
38 Chimaphila maculate striped wintergreen FN herb 1 1 1 100%
39 Chrysanthemum
leucanthemum oxeye daisy AI herb 1 38%
40 Comptonia peregrina sweet fern AN herb 1 69%
41 Conzya canadensis horseweed FN herb 1 23%
42 Coreopsis rosea rose coreopsis RN herb 1 1 92%
43 Cypripedium acaule pink lady’s-slipper FN herb 1 31%
44 Drosera intermedia spatulate-leaved sundew ON herb 1 31%
45 Drosera rotundifolia round-leaved sundew ON herb 1 1 62%
46 Epigaea repens trailing arbutus AN herb 1 77%
47 Erigeron annus daisy fleabane ON herb 1 15%
48 Eriocaulon aquaticum pipewort RN herb 1 1 77%
49 Eupatorium perfoliatum boneset ON herb 1 85%
50 Eurybia divaricata white wood aster FN herb 1 23%
51 Eurybia spectabilis showy aster FN herb 1 1 23%
52 Euthamia caroliniana slender-leaved goldenrod AN herb 1 100%
53 Fragaria vesca wood strawberry OI herb 1 15%
54 Galium paluste marsh bedstraw UN herb 1 54%
55 Galium tinctorium stiff marsh bedstraw UN Herb 1 23%
56 Galium trifidum small bedstraw UN herb 1 38%
57 Gaultheria procumbens wintergreen AN herb 1 77%
58 Gratiola aurea golden pert ON herb 1 1 100%
59 Hieracium caespitosum field hawkweed UN herb 1 31%
60 Hieracium gronovii hairy Hawkweed UN herb 1 1 15%
61 Hieracium venosum rattlesnake weed FN herb 1 1 38%
62 Hypericum canadense Canada St. John's-wort ON herb 1 77%
63 Hypericum mutilum dwarf St. John's-wort ON herb 1 77%
64 Isoetes tuckermanii Tuckermanii quillwort HN herb 1 62%
65 Linaria canadensis blue toadflax FN herb 1 46%
66 Lobelia siphilitica great Lobelia I herb 1 23%
67 Ludwigia palustris water purslane ON herb 1 1 31%
68 Lycopodium obscurum ground pine ON herb 1 1 31%
69 Lycopus amplectens sessile-leaved water horehound HN herb 1 69%
70 Lycopus uniflorus northern bugleweed UN herb 1 85%
71 Lysimachia quadrifolia whorled loosestrife ON herb 1 31%
72 Lysimachia terrestris swamp candles ON herb 1 54%
73 Maianthemum canadense Canada mayflower AN Herb 1 31%
74 Melampyrum lineare cow-wheat AN herb 1 38%
75 Monotropa hypopithys pinesap ON herb 1 8%
76 Monotropa uniflora indian pipe FN herb 1 77%
77 Myriophyllum humile low watermilfoil UN herb 1 92%
78 Nabalus trifoliolata fall rattlesnake-root ON herb
1 8%
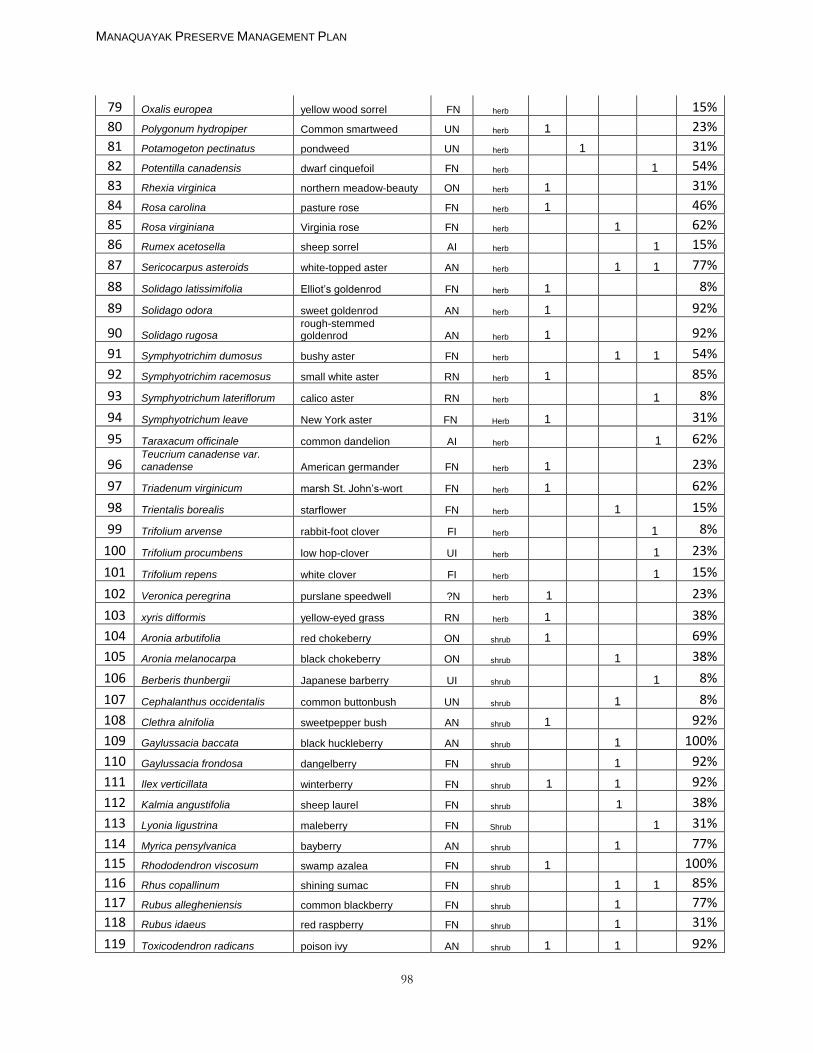
MANAQUAYAK PRESERVE MANAGEMENT PLAN
98
79 Oxalis europea yellow wood sorrel FN herb 15%
80 Polygonum hydropiper Common smartweed UN herb 1 23%
81 Potamogeton pectinatus pondweed UN herb 1 31%
82 Potentilla canadensis dwarf cinquefoil FN herb 1 54%
83 Rhexia virginica northern meadow-beauty ON herb 1 31%
84 Rosa carolina pasture rose FN herb 1 46%
85 Rosa virginiana Virginia rose FN herb 1 62%
86 Rumex acetosella sheep sorrel AI herb 1 15%
87 Sericocarpus asteroids white-topped aster AN herb 1 1 77%
88 Solidago latissimifolia Elliot’s goldenrod FN herb 1
8%
89 Solidago odora sweet goldenrod AN herb 1 92%
90 Solidago rugosa rough-stemmed goldenrod AN herb 1 92%
91 Symphyotrichim dumosus bushy aster FN herb 1 1 54%
92 Symphyotrichim racemosus small white aster RN herb 1 85%
93 Symphyotrichum lateriflorum calico aster RN herb
1 8%
94 Symphyotrichum leave New York aster FN Herb 1 31%
95 Taraxacum officinale common dandelion AI herb 1 62%
96 Teucrium canadense var.
canadense American germander FN herb 1 23%
97 Triadenum virginicum marsh St. John’s-wort FN herb 1 62%
98 Trientalis borealis starflower FN herb 1 15%
99 Trifolium arvense rabbit-foot clover FI herb 1 8%
100 Trifolium procumbens low hop-clover UI herb 1 23%
101 Trifolium repens white clover FI herb 1 15%
102 Veronica peregrina purslane speedwell ?N herb 1 23%
103 xyris difformis yellow-eyed grass RN herb 1 38%
104 Aronia arbutifolia red chokeberry ON shrub 1 69%
105 Aronia melanocarpa black chokeberry ON shrub 1 38%
106 Berberis thunbergii Japanese barberry UI shrub
1 8%
107 Cephalanthus occidentalis common buttonbush UN shrub
1
8%
108 Clethra alnifolia sweetpepper bush AN shrub 1 92%
109 Gaylussacia baccata black huckleberry AN shrub 1 100%
110 Gaylussacia frondosa dangelberry FN shrub 1 92%
111 Ilex verticillata winterberry FN shrub 1 1 92%
112 Kalmia angustifolia sheep laurel FN shrub 1 38%
113 Lyonia ligustrina maleberry FN Shrub 1 31%
114 Myrica pensylvanica bayberry AN shrub 1 77%
115 Rhododendron viscosum swamp azalea FN shrub 1 100%
116 Rhus copallinum shining sumac FN shrub 1 1 85%
117 Rubus allegheniensis common blackberry FN shrub 1 77%
118 Rubus idaeus red raspberry FN shrub 1 31%
119 Toxicodendron radicans poison ivy AN shrub 1 1 92%
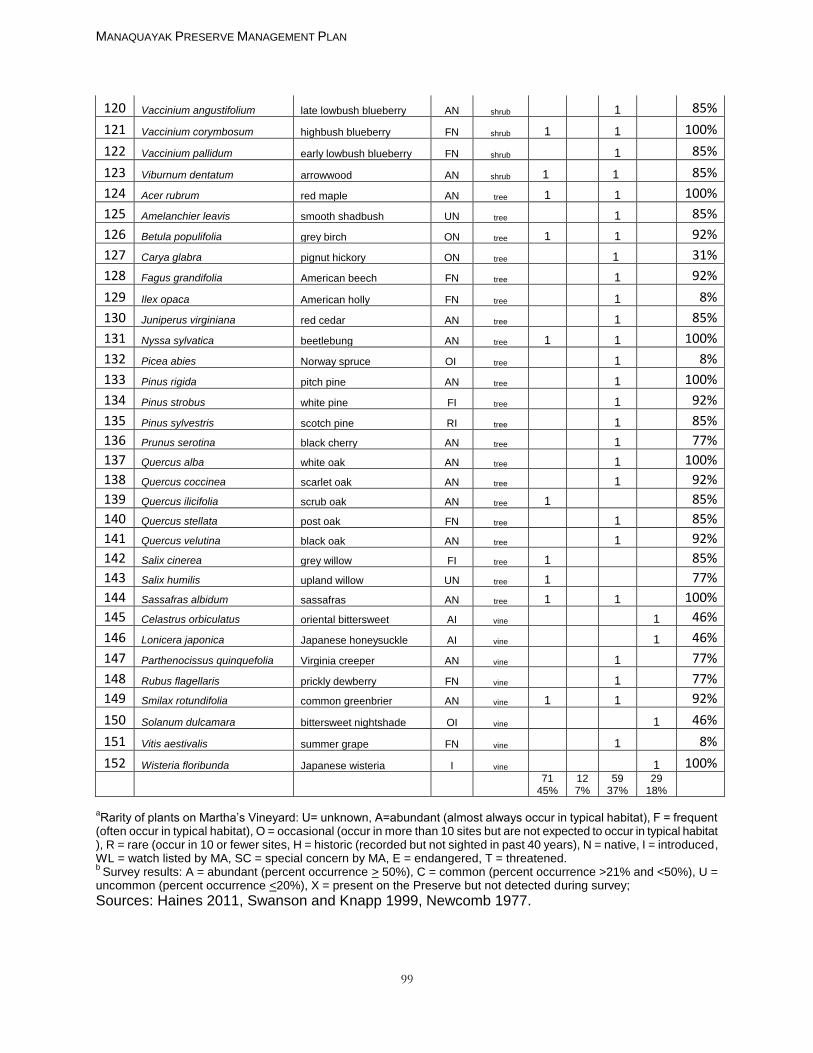
MANAQUAYAK PRESERVE MANAGEMENT PLAN
99
120 Vaccinium angustifolium late lowbush blueberry AN shrub 1 85%
121 Vaccinium corymbosum highbush blueberry FN shrub 1 1 100%
122 Vaccinium pallidum early lowbush blueberry FN shrub 1 85%
123 Viburnum dentatum arrowwood AN shrub 1 1 85%
124 Acer rubrum red maple AN tree 1 1 100%
125 Amelanchier leavis smooth shadbush UN tree 1 85%
126 Betula populifolia grey birch ON tree 1 1 92%
127 Carya glabra pignut hickory ON tree 1 31%
128 Fagus grandifolia American beech FN tree 1 92%
129 Ilex opaca American holly FN tree
1
8%
130 Juniperus virginiana red cedar AN tree 1 85%
131 Nyssa sylvatica beetlebung AN tree 1 1 100%
132 Picea abies Norway spruce OI tree 1 8%
133 Pinus rigida pitch pine AN tree 1 100%
134 Pinus strobus white pine FI tree 1 92%
135 Pinus sylvestris scotch pine RI tree 1 85%
136 Prunus serotina black cherry AN tree 1 77%
137 Quercus alba white oak AN tree 1 100%
138 Quercus coccinea scarlet oak AN tree 1 92%
139 Quercus ilicifolia scrub oak AN tree 1 85%
140 Quercus stellata post oak FN tree 1 85%
141 Quercus velutina black oak AN tree 1 92%
142 Salix cinerea grey willow FI tree 1 85%
143 Salix humilis upland willow UN tree 1 77%
144 Sassafras albidum sassafras AN tree 1 1 100%
145 Celastrus orbiculatus oriental bittersweet AI vine 1 46%
146 Lonicera japonica Japanese honeysuckle AI vine 1 46%
147 Parthenocissus quinquefolia Virginia creeper AN vine 1 77%
148 Rubus flagellaris prickly dewberry FN vine 1 77%
149 Smilax rotundifolia common greenbrier AN vine 1 1 92%
150 Solanum dulcamara bittersweet nightshade OI vine 1 46%
151 Vitis aestivalis summer grape FN vine
1
8%
152 Wisteria floribunda Japanese wisteria I vine 1 100%
71
45% 12 7%
59 37%
29 18%
aRarity of plants on Martha’s Vineyard: U= unknown, A=abundant (almost always occur in typical habitat), F = frequent
(often occur in typical habitat), O = occasional (occur in more than 10 sites but are not expected to occur in typical habitat ), R = rare (occur in 10 or fewer sites, H = historic (recorded but not sighted in past 40 years), N = native, I = introduced, WL = watch listed by MA, SC = special concern by MA, E = endangered, T = threatened. b
Survey results: A = abundant (percent occurrence > 50%), C = common (percent occurrence >21% and <50%), U = uncommon (percent occurrence <20%), X = present on the Preserve but not detected during survey;
Sources: Haines 2011, Swanson and Knapp 1999, Newcomb 1977.
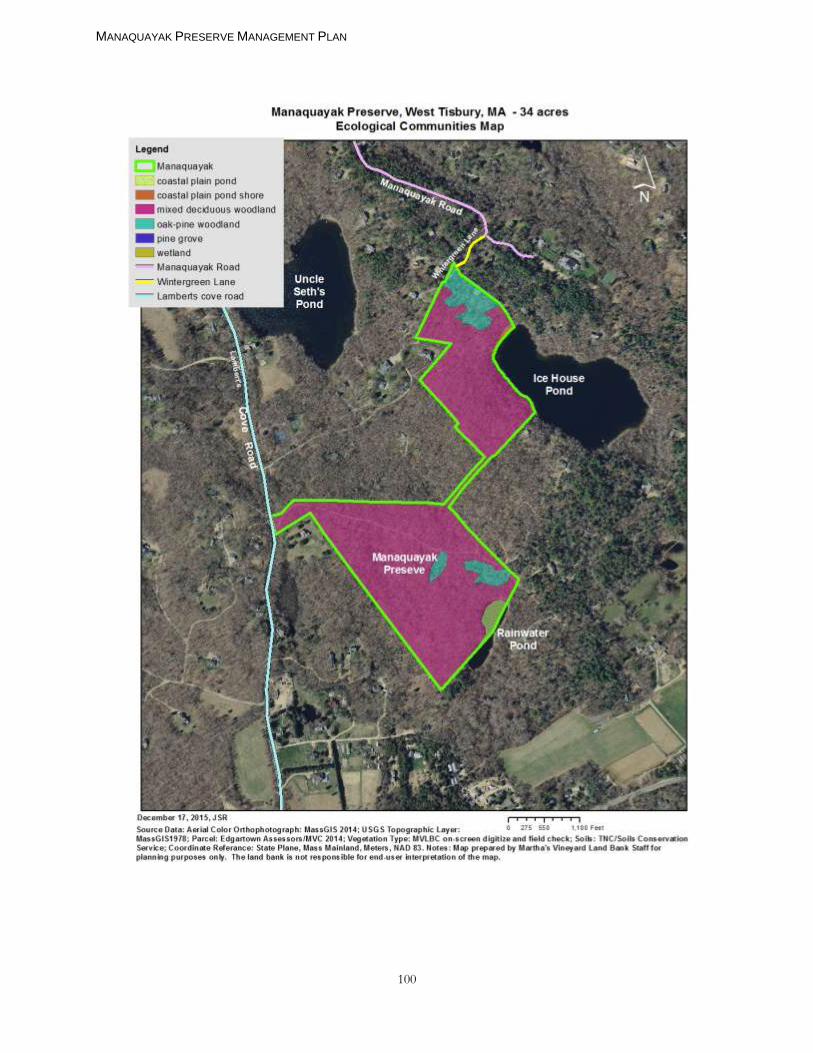
MANAQUAYAK PRESERVE MANAGEMENT PLAN
100
MANAQUAYAK PRESERVE MANAGEMENT PLAN
101
Habitat Description
a. Mixed-deciduous woodland (31.9 acres) The mixed-deciduous woodland contains the entirety of the upland vegetation and comprises 94% of the total acreage of Manaquayak Preserve and supports habitat for 59% of plants known to occur on the preserve. Trees in the woodland are, on average, 49 feet high and 11 inches in diameter at breast height. The estimated basal area per acre is 120 square feet for the entire woodland. There are an estimated 243 trees per acre in the dbh class of 10 inches and greater. The canopy of the woodland is dominated by black and white oak with a mix of white pine, post oak, scarlet oak and pignut hickory throughout. Red maple, beetlebung and sassafras trees occur in bottomlands and closer to the ponds. Small stands of evergreens dominated by white and pitch pines occur in three areas on the preserve as well as two small American Beech stands. The canopy is relatively closed and has an average percent canopy cover of 79%.
Diversity in the woodland understory is low with the exception of areas along the old road and trails that provide disturbed openings and light. These areas account for an additional 16% of species known to occur on the preserve. Ericaceous shrubs create a dense carpet in the understory of the mixed-deciduous woodland. The shrubs range from one to three feet tall. Black huckleberry, dangleberry, early lowbush blueberry, late lowbush blueberry and highbush blueberry compose the shrubs in the understory with importance values of 112, 31, 27, 20 and 7, respectively. Relative dominance, relative density and relative frequency are combined to achieve the importance values. Black huckleberry is the most widespread shrub and occurred in 73% of plots sampled. Common greenbrier is the most dominant vine observed in the understory and occurred in pockets where overstory let more light through.
Groundcover in the woodland is very sparse and contains a number of herbs and grasses that are widely scattered over the preserve. The most abundant herbaceous plant less than one foot in height was poison ivy. Species such as indian pipe occur under the conifer trees where light is limited and competition from shrub species is minimal.
d. Coastal Plain Pond and Shore (0.75 acres)
The ponds at Manaquayak Preserve have fluctuating water levels that result in an expanding and shrinking shoreline. Water levels rise and fall due to seasonal changes and due to the effects that rainfall and evaporation have on the underlying
MANAQUAYAK PRESERVE MANAGEMENT PLAN
102
groundwater table. During warmer summer months such ponds typically experience lower water levels and a shoreline of unpredictable width appears. The amount of water that is lost and the slope of the pond basin determine the width of the shoreline. Plants adapted to this erratic environment colonize the uncovered ground (Sorrie 1994). The basin along the northern shore of Ice House Pond has a gradual slope and has the most prominent coastal plain pond shoreline on the pond compared to the balance of the pond shore with steeper slopes and less exposed shoreline. The shallow basin of Rainwater Pond results in an entire pond floor of coastal plain pond shore habitat. Several bands of different vegetation communities occur around kettle ponds with seasonally fluctuating water levels. The bands of vegetation communities correlate with the flooding regime. The zonation of the ponds at Manaquayak Preserve is as follows (with the exception of the last zone for Rainwater Pond during low precipitation years such as was experienced in 2015):
upland mixed-deciduous woodland;
shrub band dominated by highbush blueberry, sweet pepperbush, willow, red chokeberry, and swamp azalea;
emergent exposed pond shore dominated by sweet goldenrod, slender-leaved goldenrod, little bluestem, switch grass, northern bugleweed, Canada rush, St. John’s-wort, golden pert, rose coreopsis, round-leaved sundew, and pondshore flat sedge;
semipermanently flooded zone;
and a hydromorphic rooted vegetation ring in deeper water that contains a forest of watermilfoil, a moderate amount of pond weed and infrequent occurrences of quillwort. The above zonation of the pond shore is characteristic of coastal plain pond shore habitat. In areas of the pond that are deeper than twenty feet vegetation is sparse to non-existent and a clear sandy bottom is evident. A total of 71 plant species is known to occur in the emergent exposed pond shore (Table 2). Sweet pepperbush and highbush blueberry are the dominant shrubs in the shoreline; swamp beggar-ticks, boneset, slender-leaved goldenrod, marsh bedstraw, Canada rush, northern bugleweed, swamp candeles, common greenbrier, and poison ivy dominate the upper shoreline; and marsh St. John’s wort, rose coreopsis, meadow beauty, pipewort, dwarf bulrush, little spikesedge and golden pert dominate the emergent exposed shore that remained under shallow water during high precipitation years. The watermilfoil in the pond at Manaquayak Preserve is low watermilfoil (Myriophyllum humile). It has alternate, subopposite or irregularly scattered leaves and can easily be confused with other watermilfoil species. However, low watermilfoil may be identified by its smooth-backed seeds that are 1/32 inches long and out-of-water spikes. This watermilfoil species is not to be confused with the
MANAQUAYAK PRESERVE MANAGEMENT PLAN
103
exotic invasive Eurasian watermilfoil (M. spicatum) that has featherlike leaves that are whorled (Hotchkiss 1972). A positive identification of a Myriophyllum humile was made from a sample collected by Mark Mattson in the early 90s from the pond and identified by Massachusetts Department of Environmental Protection. An additional aquatic plant survey was completed during the summer of 2005 by Wendy Culbert. Mrs. Culbert identified the watermilfoil in the pond also as low watermilfoil. Land bank staff has monitored the milfoil in the pond each summer and have not observed the invasive milfoil species in the pond. Annual vegetation inventories of the preserve in the summer revealed 13 additional plants on the pond shore during the last decade. They are highlighted in the vegetation table. As water levels continue to fluctuate, more species may appear in the shoreline in the future.
Appendix F. Wildlife
Wildlife species were observed on the preserve through general property surveys, amphibian call surveys, fish and Odonata surveys. Additionally, wildlife species seen or heard and evidence of wildlife species such as tracks and scat were recorded during general observations, vegetation surveys and avian bird counts in 2006-2014. The upland vegetation community of Manaquayak Preserve has a closed canopy in the mixed-deciduous woodland and the wetland community has an open canopy in the coastal plain pond and shore. Berry-producing shrubs in the understory of the woodland and provide forage for wildlife. Dense understory vegetation near the ponds provides cover and nesting material for birds and small mammals. In the woodland there are tall trees for nesting, roosting, and foraging wildlife species; mast-bearing trees (i.e. oak and beech) for fall foraging; fruiting shrubs and vines (i.e. huckleberry, shadbush, blueberry, greenbrier, and bayberry) for summer and fall foraging; and understory cover for foraging and ground nesting insects (i.e. beetles, ants and spiders), amphibians (i.e. red-backed salamander), reptiles (i.e. snakes and turtles), birds (i.e. towhee) and mammals (i.e. mice, shrews, raccoons and skunks). The nectar-producing flowing plants and taller grasses, sedges and rushes growing in and around the pond are a superb food source and resting spot for invertebrates. Predatory birds hunt the pond for fish and amphibians and fish and reptiles hunt the invertebrates and amphibians and fish in the pond. a) Amphibians: Land bank staff conducted one amphibian calling survey following
methods described by Scott and Woodward (1994) to survey breeding frog species in the pond and the shore of the Preserve in 2004. Spring peepers were audible. Numerous bullfrog and green frog adults and tabpoles were observed in the pond in 2004. The following year the numbers of adult bullfrogs experienced a significant decline and were nearly absent from the pond. Over the past decade, the number of green frogs have visibly decreased as well but are relatively more common than bullfrogs. Tabpoles are still present but in visibly low numbers. Some fish, great blue herons, and turtles are some of the wildlife species that eat bullfrogs and green frogs and their tadpoles.
MANAQUAYAK PRESERVE MANAGEMENT PLAN
104
Thirty-one invertebrate species are known to occur on the Preserve (Table 2)). Direct observation for invertebrates in the pond and on the shore by a local naturalist, Allan Keith, revealed a reasonably diverse array of dragonflies and damselflies. Of the 20 Odonata species observed by Mr. Keith, none is unique to Ice House Pond at Manaquayak Preserve. Surveys by land bank staff in 2015 of Rainwater Pond revealed to of the 20 species known to occur at Ice House pond – calico pennant and ruby meadowhawk. Odonata species reproduce and feed in wetlands (Dunkle 2000). They tend not to migrate but they do have flight seasons, such as spring and summer, when they are most active (Dunkle 2000). Some Odonata species that are common to freshwater wetlands on the Vineyard were not observed on the pond, such as skimming bluet and some darner and spreadwing species. They and others may not occur on the preserve as a result of incompatible water levels and increased water clarity resulting in greater nymph predation by fish. Mr. Keith visited the pond on numerous occasions (2005-8 visits, 2007-4 visits, 2008-8 visits and 2009-2 visits) between June and October from 2005-2009. Additionally, three Lepidoptera species were observed along the old roads in the mixed-deciduous woodland (Table 3). Lepidoptera larvae and adults will find cover and forage in the abundance of cedars and nectar-producing plants shrubs such as asters, sumac and azalea. Common biting insects such as mosquitoes, deer flies and ticks are common to the preserve during the spring and summer months.
b) Fish: Three fish surveys were conducted in the pond by Gregory Skomal and land
bank staff using a gill net and a beach seine. One was conducted on December 02, 2004, one was conducted on May 11, 2005 and the third was conducted on August 25, 2005. For the first survey in December 2004, the 2-inch gill net was set north-south for 53 minutes and east-west for 63 minutes. Three shoreline locations were chosen for the beach seine. Two fish species were samples during the survey (Appendix E). One yellow perch was observed in the gill net. Swamp darters were plentiful in beach seines. On May 11, 2005, a 2-inch gill net was set north-south for 71 minutes and a 1.5-inch gill net was set east-west for 56 minutes. One adult yellow perch was sampled in the 1.5-inch gill net and bluegill and yellow perch fry were visible in the shallows. A beach seine was used on August 25, 2005 to sample the fish in the shallow water of the pond. Bluegill were sampled and digital photos were sent to Joseph Hennessy, a fisheries biologist for the Wisconsin Department of Natural Resources who studied hybridized bluegill at Southern Illinois University, Carbondale. Mr. Hennessy reported that the bluegills in the photos were pure bluegill and had no characteristics indicative of hybridization with other Lepomis species. During the aquatic vegetation survey a brown bullhead was observed. Historically the pond at Manaquayak Preserve contained chain pickerel, yellow perch, banded killifish and swamp darters (MacKenzie and Andrews 1997). Chain pickerel and large mouth bass have been observed in recent years in the pond by land bank staff. The fish surveys suggest that the fish population in the pond is limited and not very diverse.
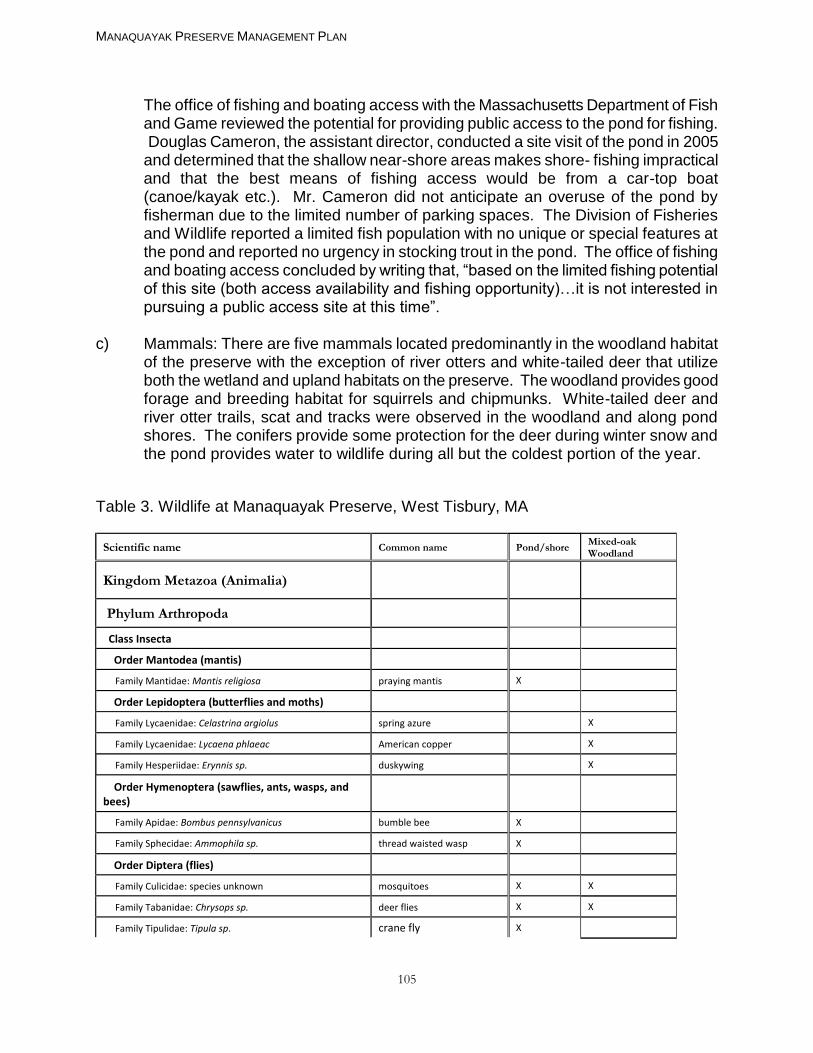
MANAQUAYAK PRESERVE MANAGEMENT PLAN
105
The office of fishing and boating access with the Massachusetts Department of Fish and Game reviewed the potential for providing public access to the pond for fishing. Douglas Cameron, the assistant director, conducted a site visit of the pond in 2005 and determined that the shallow near-shore areas makes shore- fishing impractical and that the best means of fishing access would be from a car-top boat (canoe/kayak etc.). Mr. Cameron did not anticipate an overuse of the pond by fisherman due to the limited number of parking spaces. The Division of Fisheries and Wildlife reported a limited fish population with no unique or special features at the pond and reported no urgency in stocking trout in the pond. The office of fishing and boating access concluded by writing that, “based on the limited fishing potential of this site (both access availability and fishing opportunity)…it is not interested in pursuing a public access site at this time”.
c) Mammals: There are five mammals located predominantly in the woodland habitat of the preserve with the exception of river otters and white-tailed deer that utilize both the wetland and upland habitats on the preserve. The woodland provides good forage and breeding habitat for squirrels and chipmunks. White-tailed deer and river otter trails, scat and tracks were observed in the woodland and along pond shores. The conifers provide some protection for the deer during winter snow and the pond provides water to wildlife during all but the coldest portion of the year.
Table 3. Wildlife at Manaquayak Preserve, West Tisbury, MA
Scientific name
Common name
Pond/shore
Mixed-oak Woodland
Kingdom Metazoa (Animalia)
Phylum Arthropoda
Class Insecta
Order Mantodea (mantis)
Family Mantidae: Mantis religiosa
praying mantis X
Order Lepidoptera (butterflies and moths)
Family Lycaenidae: Celastrina argiolus
spring azure X
Family Lycaenidae: Lycaena phlaeac
American copper X
Family Hesperiidae: Erynnis sp.
duskywing X
Order Hymenoptera (sawflies, ants, wasps, and bees)
Family Apidae: Bombus pennsylvanicus bumble bee X
Family Sphecidae: Ammophila sp. thread waisted wasp X Order Diptera (flies)
Family Culicidae: species unknown
mosquitoes X X
Family Tabanidae: Chrysops sp.
deer flies X X
Family Tipulidae: Tipula sp. crane fly X
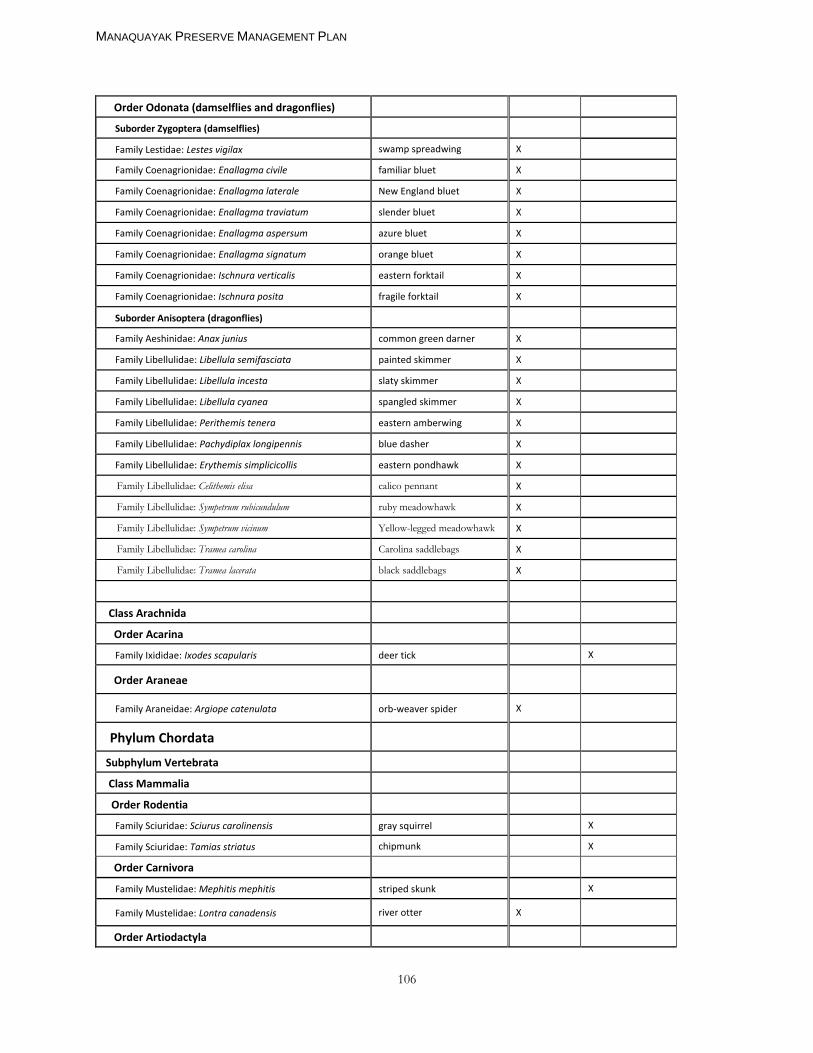
MANAQUAYAK PRESERVE MANAGEMENT PLAN
106
Order Odonata (damselflies and dragonflies)
Suborder Zygoptera (damselflies) Family Lestidae: Lestes vigilax swamp spreadwing X
Family Coenagrionidae: Enallagma civile familiar bluet X
Family Coenagrionidae: Enallagma laterale New England bluet X
Family Coenagrionidae: Enallagma traviatum slender bluet X
Family Coenagrionidae: Enallagma aspersum azure bluet X
Family Coenagrionidae: Enallagma signatum orange bluet X
Family Coenagrionidae: Ischnura verticalis eastern forktail X
Family Coenagrionidae: Ischnura posita fragile forktail X Suborder Anisoptera (dragonflies)
Family Aeshinidae: Anax junius common green darner X
Family Libellulidae: Libellula semifasciata painted skimmer X
Family Libellulidae: Libellula incesta slaty skimmer X
Family Libellulidae: Libellula cyanea spangled skimmer X
Family Libellulidae: Perithemis tenera eastern amberwing X
Family Libellulidae: Pachydiplax longipennis blue dasher X
Family Libellulidae: Erythemis simplicicollis eastern pondhawk X
Family Libellulidae: Celithemis elisa calico pennant X
Family Libellulidae: Sympetrum rubicundulum ruby meadowhawk X
Family Libellulidae: Sympetrum vicinum Yellow-legged meadowhawk X
Family Libellulidae: Tramea carolina Carolina saddlebags X
Family Libellulidae: Tramea lacerata black saddlebags X Class Arachnida Order Acarina
Family Ixididae: Ixodes scapularis
deer tick X
Order Araneae
Family Araneidae: Argiope catenulata
orb-weaver spider X
Phylum Chordata
Subphylum Vertebrata
Class Mammalia
Order Rodentia Family Sciuridae: Sciurus carolinensis
gray squirrel X
Family Sciuridae: Tamias striatus chipmunk X Order Carnivora
Family Mustelidae: Mephitis mephitis
striped skunk X
Family Mustelidae: Lontra canadensis river otter X
Order Artiodactyla
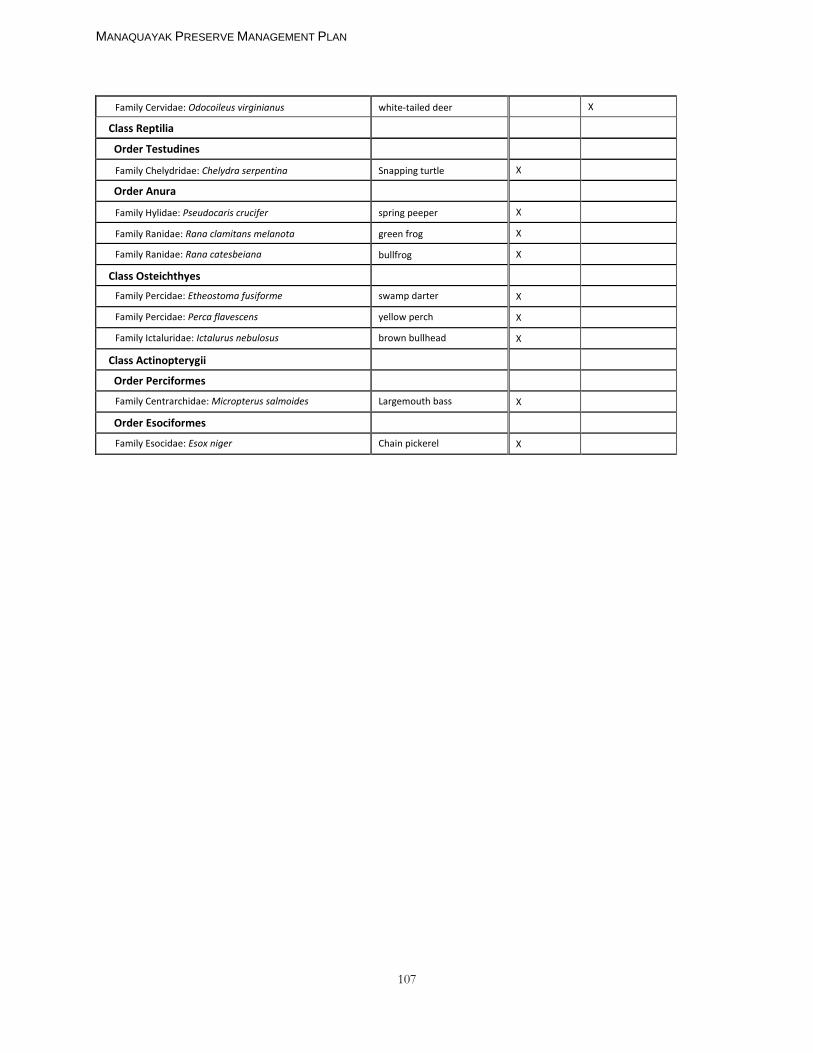
MANAQUAYAK PRESERVE MANAGEMENT PLAN
107
Family Cervidae: Odocoileus virginianus
white-tailed deer X
Class Reptilia
Order Testudines Family Chelydridae: Chelydra serpentina
Snapping turtle X
Order Anura Family Hylidae: Pseudocaris crucifer
spring peeper X
Family Ranidae: Rana clamitans melanota
green frog X
Family Ranidae: Rana catesbeiana bullfrog X
Class Osteichthyes
Family Percidae: Etheostoma fusiforme swamp darter X
Family Percidae: Perca flavescens yellow perch X
Family Ictaluridae: Ictalurus nebulosus brown bullhead X Class Actinopterygii
Order Perciformes
Family Centrarchidae: Micropterus salmoides Largemouth bass X
Order Esociformes
Family Esocidae: Esox niger Chain pickerel X
Manaquayak Preserve Management Plan
108
Appendix G. Avian Checklist and Seasonal Tables
Land bank staff conducted 5-minute point count surveys of birds in Manaquayak Preserve for February to October of 2004 and during the summer breeding seasons of 2006-2015 and the spring of 2015. Staff also conducted breeding owl surveys during late winter in 2010. The presence of occasional migrant and resident birds throughout the fall migration, winter, spring migration and summer breeding was recorded during an average of 4 visits per year. Birds were sampled from one location in the mixed–deciduous woodland with a vantage point of Ice House Pond from 2004-2014 and an additional survey point was added in the mixed-deciduous woodland off Pepperbush Way. The results from the two survey points for 2015 were averaged. All birds seen or heard during a five-minute period were recorded. Birds seen or heard by land bank staff outside of the count period were noted as present on the property but were not included in quantitative analyses. Bird species in the various habitats are seasonally-dependent. Some bird species occur in more than one habitat type and during more than one season. Total species counts do not include multiple sightings of an individual species. During the breeding season diversity of birds on the preserve ranged from 14-27 with an average diversity of 20 species. Compared to diversity of birds observed during the fall (13 species), winter (5 species), and spring (22 species) the spring season yielded the greatest diversity of birds observed. Most of the birds that occur on the preserve during the breeding season are tree/shrub nesters compared to ground and cavity nesters (Table 5). The variety of habitats on this property provides habitat for all 3 types of nesters. The most common birds observed throughout much of the year on the preserve are consistently the black-capped chickadee, American crow, eastern towhee, grey catbird and osprey (Tables 4-5). The osprey, towhees and catbirds, which were common during warmer seasons, were not observed during the winter months as they migrate to warmer places for the winter (Table 4-5). Observations of behaviors associated with nesting or rearing of young such as adults carrying nesting material or food to a nest, carrying fecal sacs from a nest or attending hatch-year birds can confirm that a species is breeding on the property, as can locating an active nest. A species is probably breeding if singing territorial males are present on the property on two occasions at least a week apart. A species is possibly breeding if it is detected in suitable breeding habitat during the breeding season. Of the 53 total bird species known to occur on the preserve during the summer, one was a confirmed breeder on nearby property on the pond off-premises; five bird species are probable breeders on the preserve; and 32 are possible breeders on the preserve (Table 5).
Table 4. Seasonal abundance of birds observed in the mixed-oak woodland and pond habitat of Manaquayak Preserve, West Tisbury, MA during the fall, winter and spring migrations.
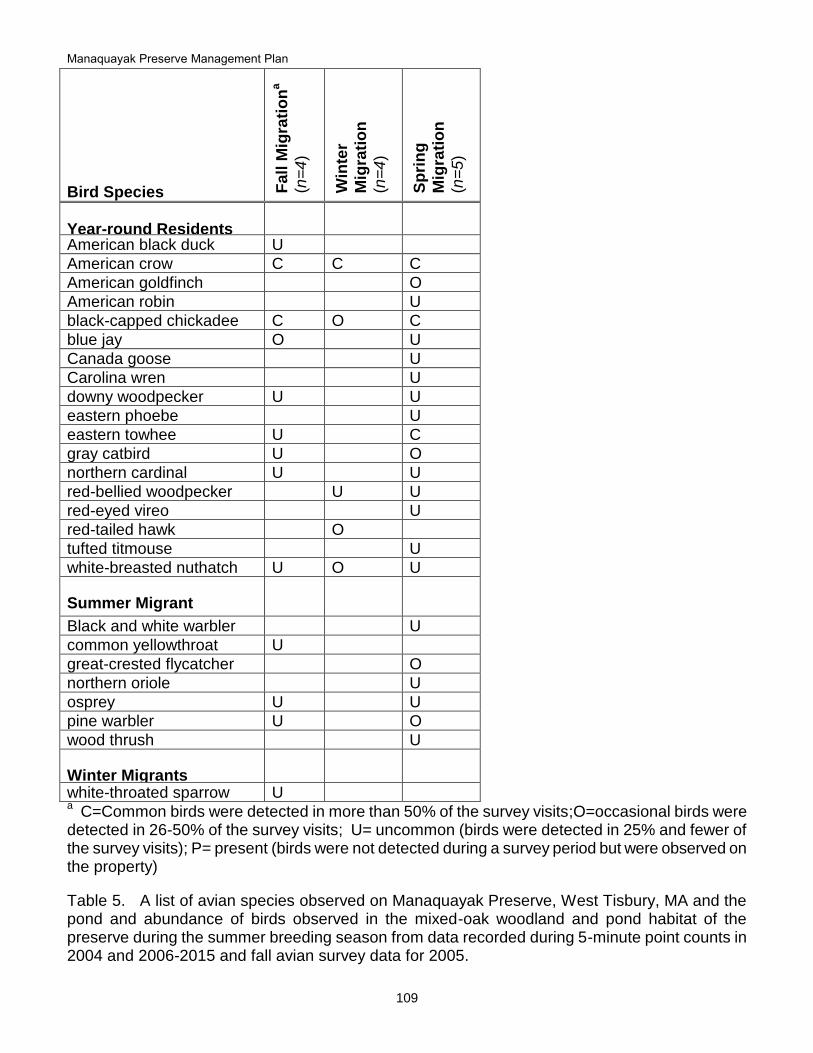
Manaquayak Preserve Management Plan
109
Bird Species Fall
Mig
rati
on
a
(n=
4)
Win
ter
Mig
rati
on
(n=
4)
Sp
rin
g
Mig
rati
on
(n=
5)
Year-round Residents
American black duck U
American crow C C C
American goldfinch O
American robin U
black-capped chickadee C O C
blue jay O U
Canada goose U
Carolina wren U
downy woodpecker U U
eastern phoebe U
eastern towhee U C
gray catbird U O
northern cardinal U U
red-bellied woodpecker U U
red-eyed vireo U
red-tailed hawk O
tufted titmouse U
white-breasted nuthatch U O U
Summer Migrant
Black and white warbler U
common yellowthroat U
great-crested flycatcher O
northern oriole U
osprey U U
pine warbler U O
wood thrush U
Winter Migrants
white-throated sparrow U a C=Common birds were detected in more than 50% of the survey visits;O=occasional birds were
detected in 26-50% of the survey visits; U= uncommon (birds were detected in 25% and fewer of the survey visits); P= present (birds were not detected during a survey period but were observed on the property)
Table 5. A list of avian species observed on Manaquayak Preserve, West Tisbury, MA and the pond and abundance of birds observed in the mixed-oak woodland and pond habitat of the preserve during the summer breeding season from data recorded during 5-minute point counts in 2004 and 2006-2015 and fall avian survey data for 2005.
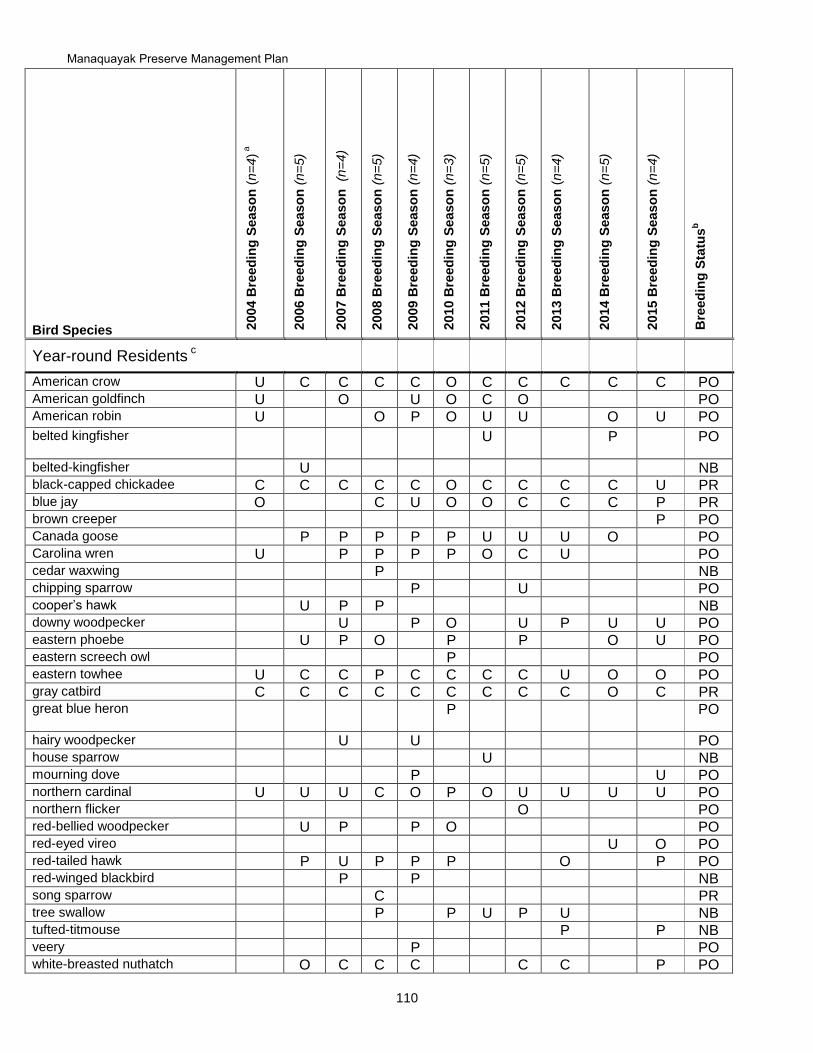
Manaquayak Preserve Management Plan
110
Bird Species 2004 B
reed
ing
Seaso
n (
n=
4) a
2006 B
reed
ing
Seaso
n (
n=
5)
2007 B
reed
ing
Seaso
n
(n=
4)
2008 B
reed
ing
Seaso
n (
n=
5)
2009 B
reed
ing
Seaso
n (
n=
4)
2010 B
reed
ing
Seaso
n (
n=
3)
2011 B
reed
ing
Seaso
n (
n=
5)
2012 B
reed
ing
Seaso
n (
n=
5)
2013 B
reed
ing
Seaso
n (
n=
4)
2014 B
reed
ing
Seaso
n (
n=
5)
2015 B
reed
ing
Seaso
n (
n=
4)
Bre
ed
ing
Sta
tus
b
Year-round Residents c
American crow U C C C C O C C C C C PO American goldfinch U O U O C O PO American robin U O P O U U O U PO
belted kingfisher P
U P PO
belted-kingfisher U NB black-capped chickadee C C C C C O C C C C U PR blue jay O C U O O C C C P PR brown creeper P PO Canada goose P P P P P U U U O PO Carolina wren U P P P P O C U PO cedar waxwing P NB chipping sparrow P U PO cooper’s hawk U P P NB downy woodpecker U P O U P U U PO eastern phoebe
U P O P P O U PO
eastern screech owl P PO eastern towhee U C C P C C C C U O O PO gray catbird C C C C C C C C C O C PR great blue heron
P PO
hairy woodpecker U U PO house sparrow U NB mourning dove P U PO northern cardinal U U U C O P O U U U U PO northern flicker O PO red-bellied woodpecker U P P O PO red-eyed vireo U O PO red-tailed hawk P U P P P O P PO red-winged blackbird P P NB song sparrow C PR tree swallow P P U P U NB tufted-titmouse P P NB veery P PO white-breasted nuthatch O C C C C C P PO
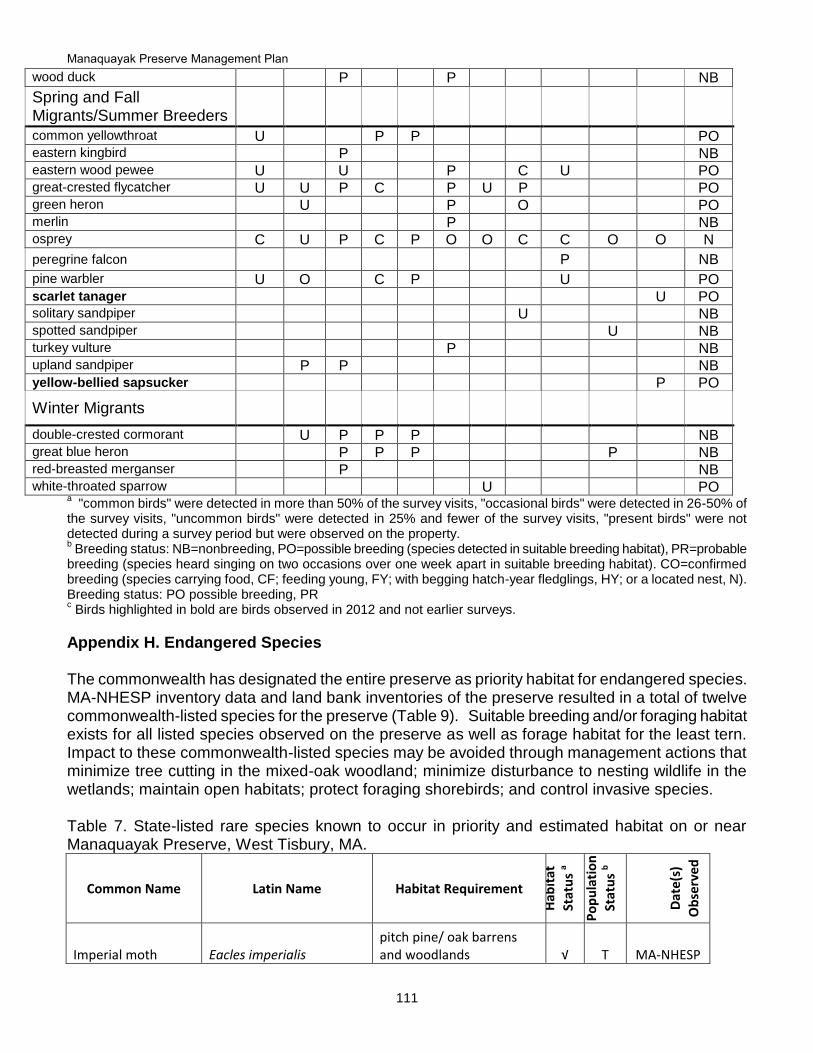
Manaquayak Preserve Management Plan
111
wood duck P P NB
Spring and Fall Migrants/Summer Breeders
common yellowthroat U P P PO eastern kingbird P NB eastern wood pewee U U P C U PO great-crested flycatcher U U P C P U P PO green heron U P O PO merlin P NB osprey C U P C P O O C C O O N
peregrine falcon P NB
pine warbler U O C P U PO scarlet tanager U PO solitary sandpiper U NB spotted sandpiper U NB turkey vulture P NB upland sandpiper P P NB yellow-bellied sapsucker P PO
Winter Migrants
double-crested cormorant U P P P NB great blue heron P P P P NB red-breasted merganser P NB white-throated sparrow U PO
a "common birds" were detected in more than 50% of the survey visits, "occasional birds" were detected in 26-50% of
the survey visits, "uncommon birds" were detected in 25% and fewer of the survey visits, "present birds" were not detected during a survey period but were observed on the property. b Breeding status: NB=nonbreeding, PO=possible breeding (species detected in suitable breeding habitat), PR=probable
breeding (species heard singing on two occasions over one week apart in suitable breeding habitat). CO=confirmed breeding (species carrying food, CF; feeding young, FY; with begging hatch-year fledglings, HY; or a located nest, N). Breeding status: PO possible breeding, PR c Birds highlighted in bold are birds observed in 2012 and not earlier surveys.
Appendix H. Endangered Species The commonwealth has designated the entire preserve as priority habitat for endangered species. MA-NHESP inventory data and land bank inventories of the preserve resulted in a total of twelve commonwealth-listed species for the preserve (Table 9). Suitable breeding and/or foraging habitat exists for all listed species observed on the preserve as well as forage habitat for the least tern. Impact to these commonwealth-listed species may be avoided through management actions that minimize tree cutting in the mixed-oak woodland; minimize disturbance to nesting wildlife in the wetlands; maintain open habitats; protect foraging shorebirds; and control invasive species. Table 7. State-listed rare species known to occur in priority and estimated habitat on or near Manaquayak Preserve, West Tisbury, MA.
Common Name Latin Name Habitat Requirement
Hab
itat
Stat
us
a
Po
pu
lati
on
Stat
us
b
Dat
e(s
)
Ob
serv
ed
Imperial moth Eacles imperialis pitch pine/ oak barrens and woodlands √ T MA-NHESP
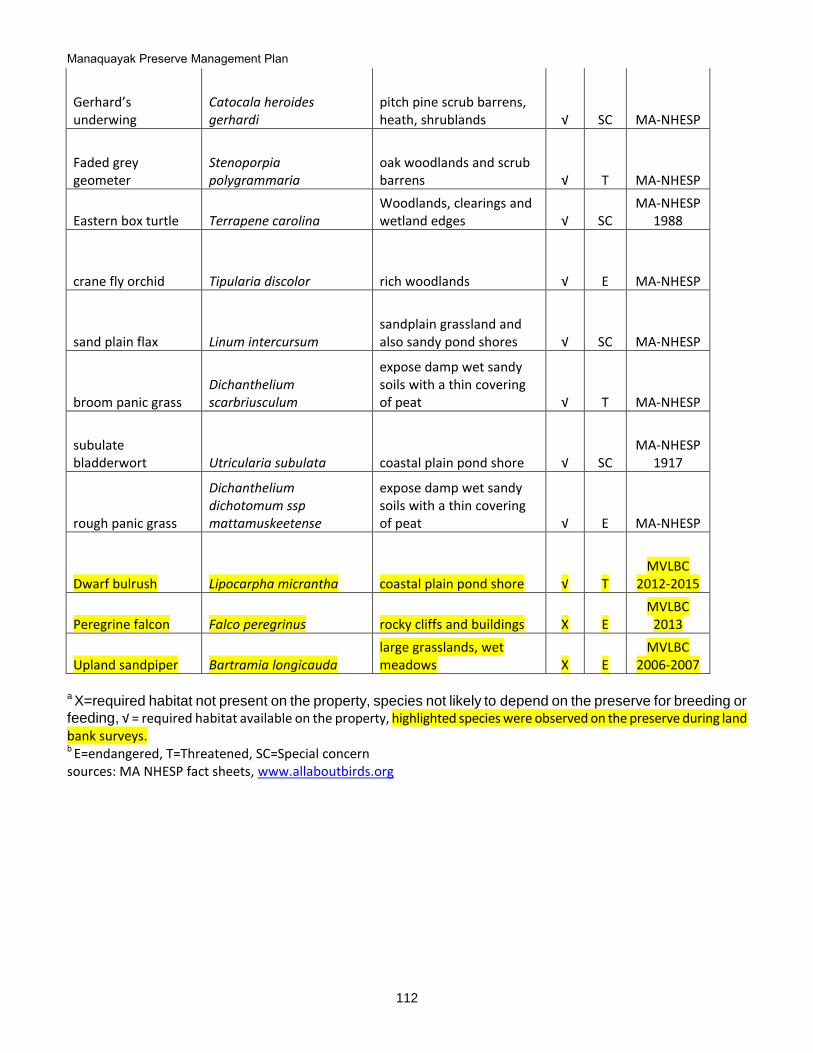
Manaquayak Preserve Management Plan
112
Gerhard’s underwing
Catocala heroides gerhardi
pitch pine scrub barrens, heath, shrublands √ SC MA-NHESP
Faded grey geometer
Stenoporpia polygrammaria
oak woodlands and scrub barrens √ T MA-NHESP
Eastern box turtle Terrapene carolina Woodlands, clearings and wetland edges √ SC
MA-NHESP 1988
crane fly orchid Tipularia discolor rich woodlands √ E MA-NHESP
sand plain flax Linum intercursum sandplain grassland and also sandy pond shores √ SC MA-NHESP
broom panic grass Dichanthelium scarbriusculum
expose damp wet sandy soils with a thin covering of peat √ T MA-NHESP
subulate bladderwort Utricularia subulata coastal plain pond shore √ SC
MA-NHESP 1917
rough panic grass
Dichanthelium dichotomum ssp mattamuskeetense
expose damp wet sandy soils with a thin covering of peat √ E MA-NHESP
Dwarf bulrush Lipocarpha micrantha coastal plain pond shore √ T MVLBC
2012-2015
Peregrine falcon Falco peregrinus rocky cliffs and buildings X E MVLBC
2013
Upland sandpiper Bartramia longicauda large grasslands, wet meadows X E
MVLBC 2006-2007
a X=required habitat not present on the property, species not likely to depend on the preserve for breeding or
feeding, √ = required habitat available on the property, highlighted species were observed on the preserve during land bank surveys. b E=endangered, T=Threatened, SC=Special concern sources: MA NHESP fact sheets, www.allaboutbirds.org

Manaquayak Preserve Management Plan
113
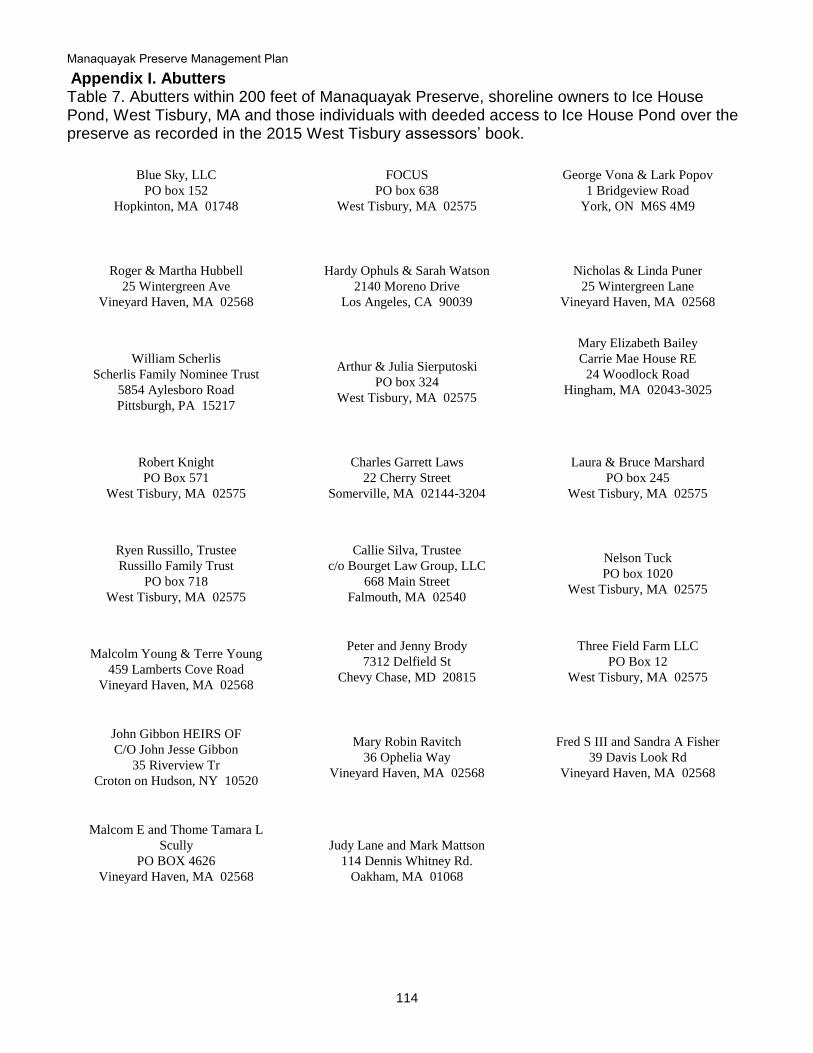
Manaquayak Preserve Management Plan
114
Appendix I. Abutters Table 7. Abutters within 200 feet of Manaquayak Preserve, shoreline owners to Ice House Pond, West Tisbury, MA and those individuals with deeded access to Ice House Pond over the preserve as recorded in the 2015 West Tisbury assessors’ book.
Blue Sky, LLC
PO box 152
Hopkinton, MA 01748
FOCUS
PO box 638
West Tisbury, MA 02575
George Vona & Lark Popov
1 Bridgeview Road
York, ON M6S 4M9
Roger & Martha Hubbell
25 Wintergreen Ave
Vineyard Haven, MA 02568
Hardy Ophuls & Sarah Watson
2140 Moreno Drive
Los Angeles, CA 90039
Nicholas & Linda Puner
25 Wintergreen Lane
Vineyard Haven, MA 02568
William Scherlis
Scherlis Family Nominee Trust
5854 Aylesboro Road
Pittsburgh, PA 15217
Arthur & Julia Sierputoski
PO box 324
West Tisbury, MA 02575
Mary Elizabeth Bailey
Carrie Mae House RE
24 Woodlock Road
Hingham, MA 02043-3025
Robert Knight
PO Box 571
West Tisbury, MA 02575
Charles Garrett Laws
22 Cherry Street
Somerville, MA 02144-3204
Laura & Bruce Marshard
PO box 245
West Tisbury, MA 02575
Ryen Russillo, Trustee
Russillo Family Trust
PO box 718
West Tisbury, MA 02575
Callie Silva, Trustee
c/o Bourget Law Group, LLC
668 Main Street
Falmouth, MA 02540
Nelson Tuck
PO box 1020
West Tisbury, MA 02575
Malcolm Young & Terre Young
459 Lamberts Cove Road
Vineyard Haven, MA 02568
Peter and Jenny Brody
7312 Delfield St
Chevy Chase, MD 20815
Three Field Farm LLC
PO Box 12
West Tisbury, MA 02575
John Gibbon HEIRS OF
C/O John Jesse Gibbon
35 Riverview Tr
Croton on Hudson, NY 10520
Mary Robin Ravitch
36 Ophelia Way
Vineyard Haven, MA 02568
Fred S III and Sandra A Fisher
39 Davis Look Rd
Vineyard Haven, MA 02568
Malcom E and Thome Tamara L
Scully
PO BOX 4626
Vineyard Haven, MA 02568
Judy Lane and Mark Mattson
114 Dennis Whitney Rd.
Oakham, MA 01068
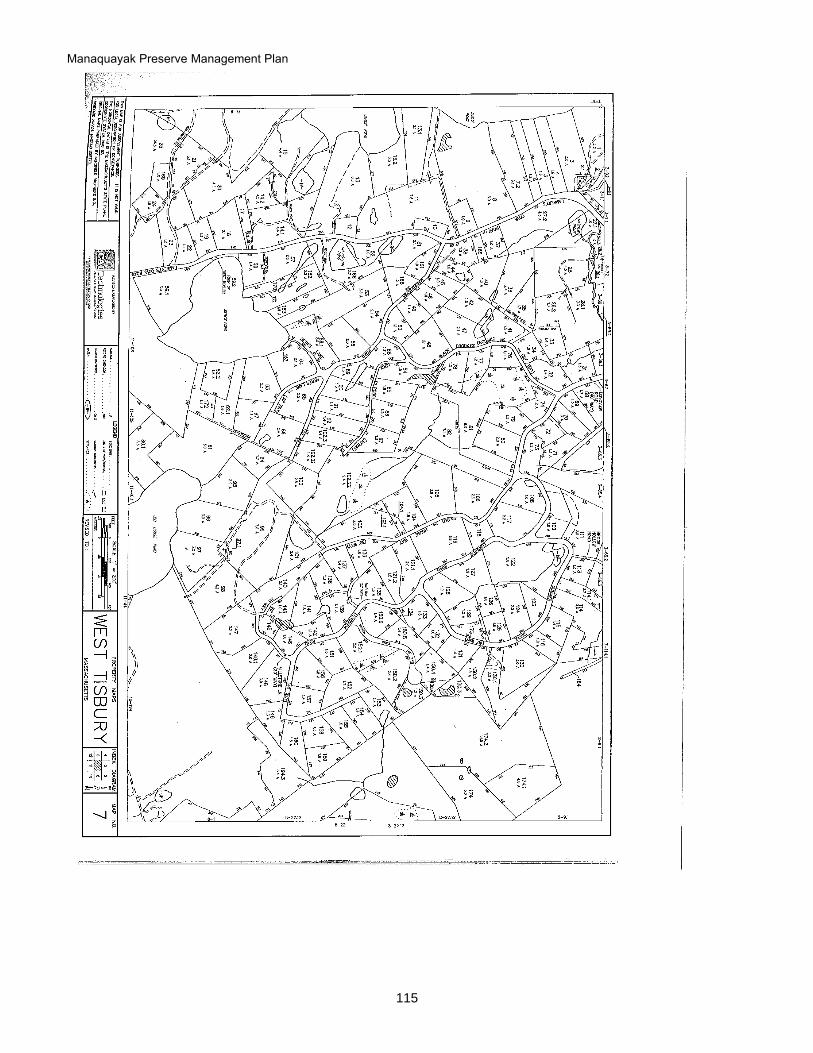
Manaquayak Preserve Management Plan
115
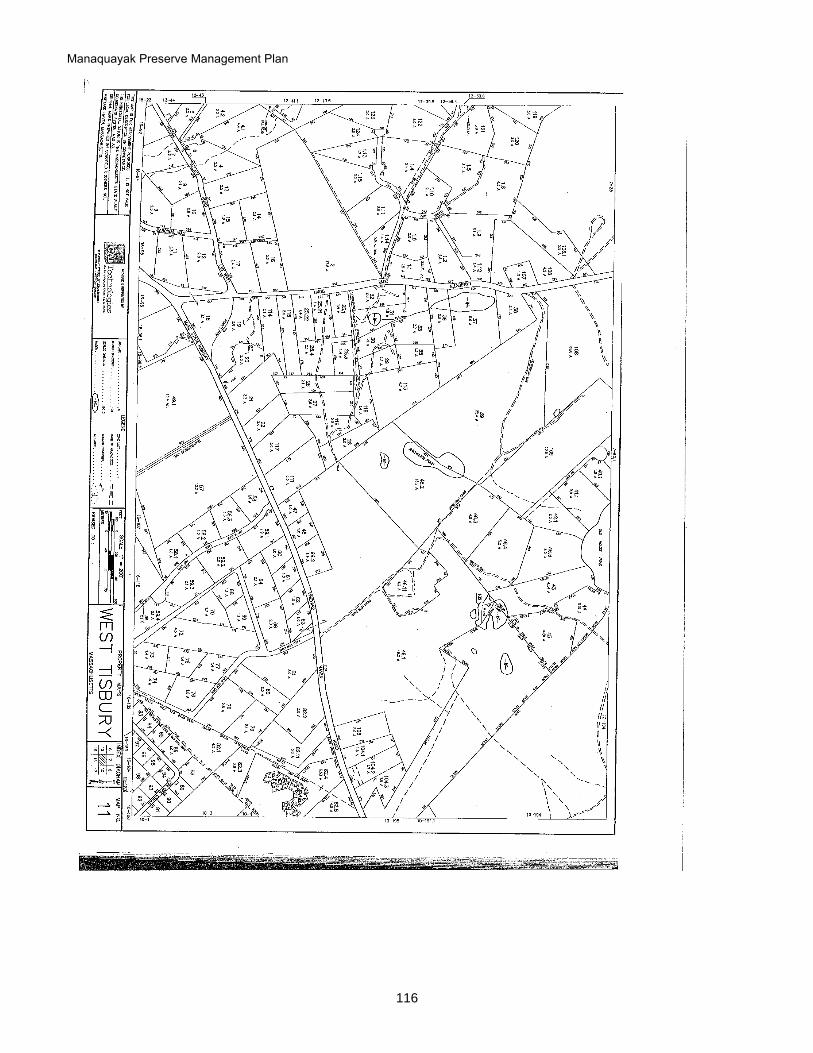
Manaquayak Preserve Management Plan
116
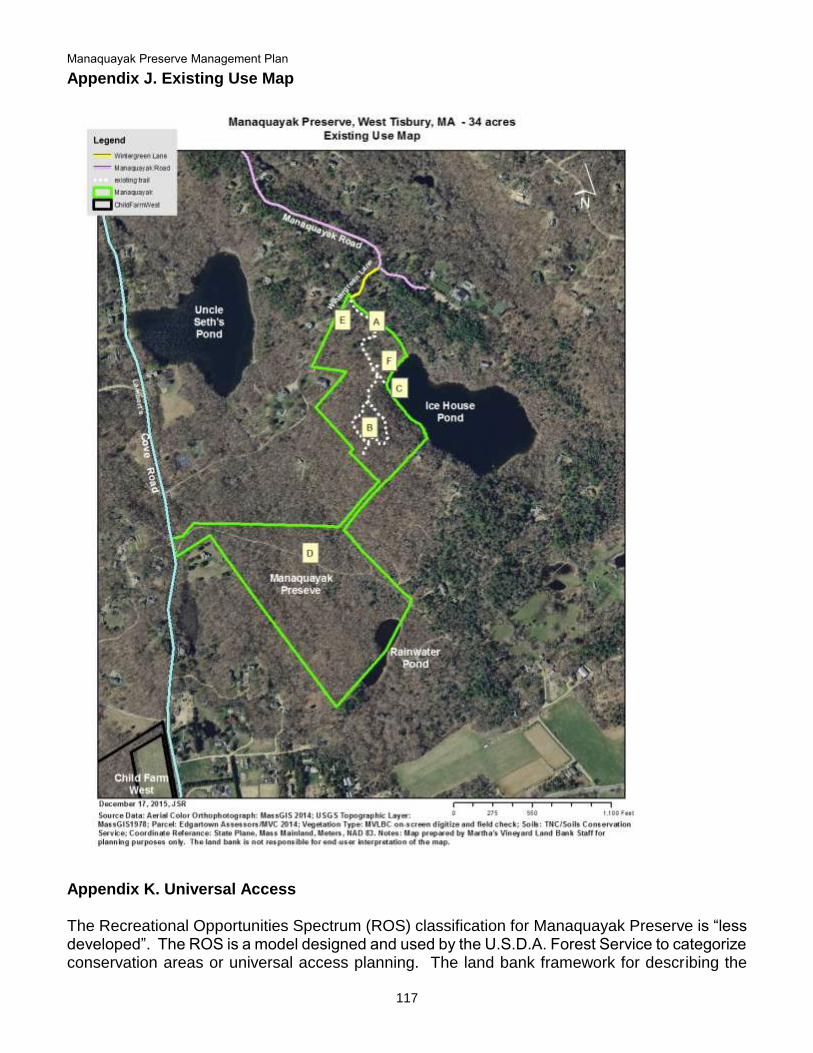
Manaquayak Preserve Management Plan
117
Appendix J. Existing Use Map
Appendix K. Universal Access The Recreational Opportunities Spectrum (ROS) classification for Manaquayak Preserve is “less developed”. The ROS is a model designed and used by the U.S.D.A. Forest Service to categorize conservation areas or universal access planning. The land bank framework for describing the

Manaquayak Preserve Management Plan
118
accessibility of its properties is applied to Manaquayak Preserve as follows.
Property Name: Manaquayak Preserve
Size: 34 acres
Primary Activities: birding, hiking, swimming and picnicking
Primary Elements: two sign stations, one bench, viewing platform
Primary Spaces: Views and access to Ice House Pond and views of Rainwater Pond
Obstacles that Limit Accessibility: distance, slope, sensitive nature of the pond shore
Existing or Potential Alternatives: Uncle Seths Pond, Blackwater Reservation
Proposed ROS Classification: less-developed
Proposed Expectation of Accessibility: not possible For all less-developed land bank conservation areas, the Universal Access Plan states the following (Potter 1997):
Use outdoor recreation access routes to link primary elements and primary spaces within one-quarter mile of a trailhead or drop-off and use accessible recreation trails to connect other primary elements and primary spaces on all less-developed land bank conservation areas.
Universal access is not possible on the preserve due to the distance to the major amenities from the trailhead off Lambert’s Cove Road; the slope of the terrain from either trailhead to the major amenities; and due to the sensitive nature of the shoreline in sitting public aces to the pond.
Manaquayak Preserve Management Plan
119
Appendix L. Water Quality Reports for Ice House Pond
Manaquayak Preserve Management Plan
120

Manaquayak Preserve Management Plan
121
Manaquayak Preserve Management Plan
122

Manaquayak Preserve Management Plan
123
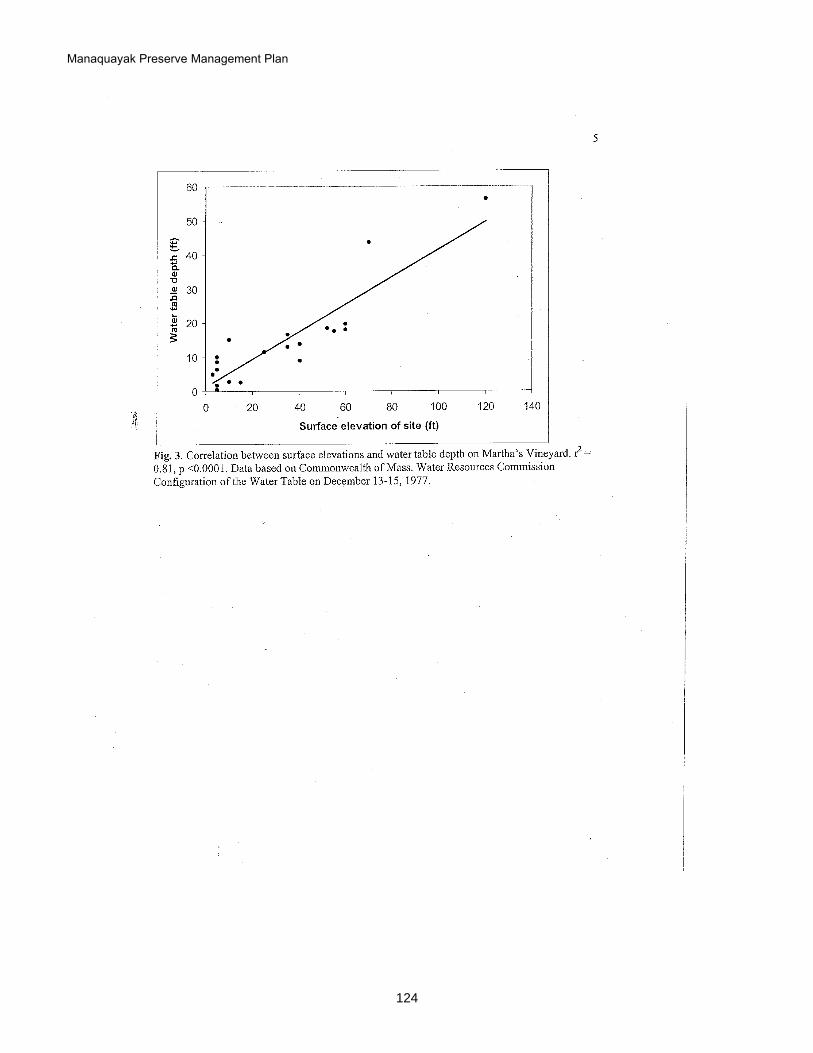
Manaquayak Preserve Management Plan
124
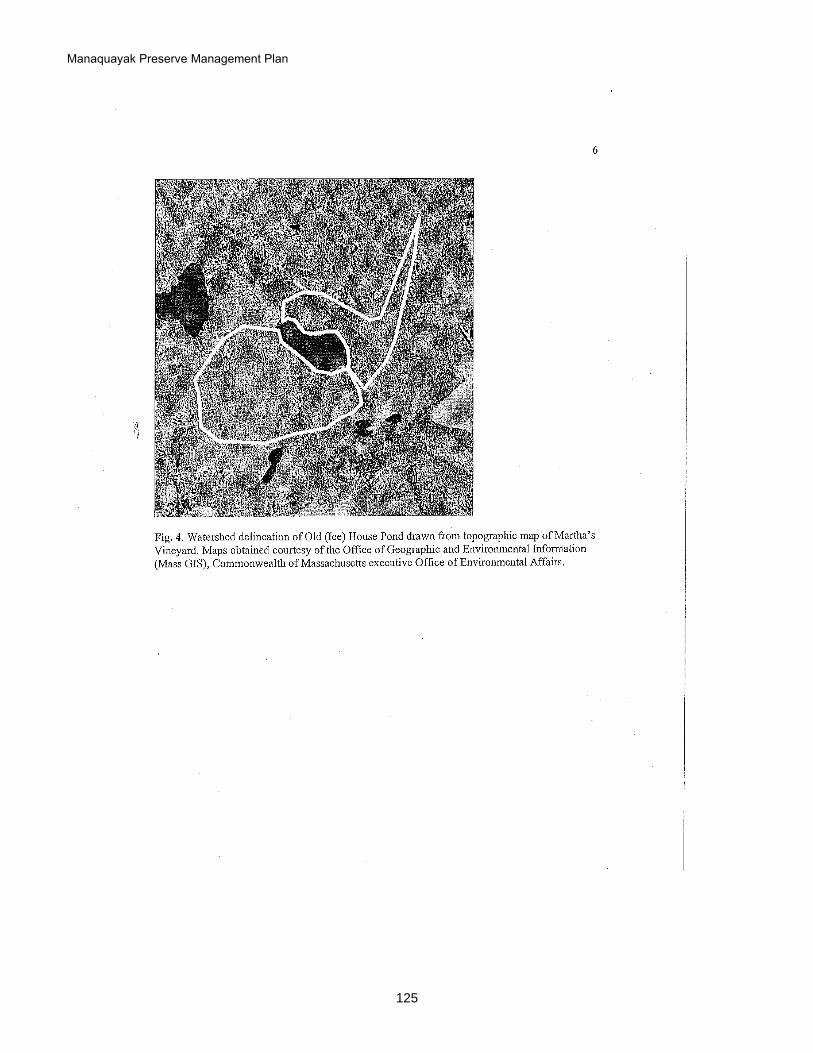
Manaquayak Preserve Management Plan
125
Manaquayak Preserve Management Plan
126
Manaquayak Preserve Management Plan
127
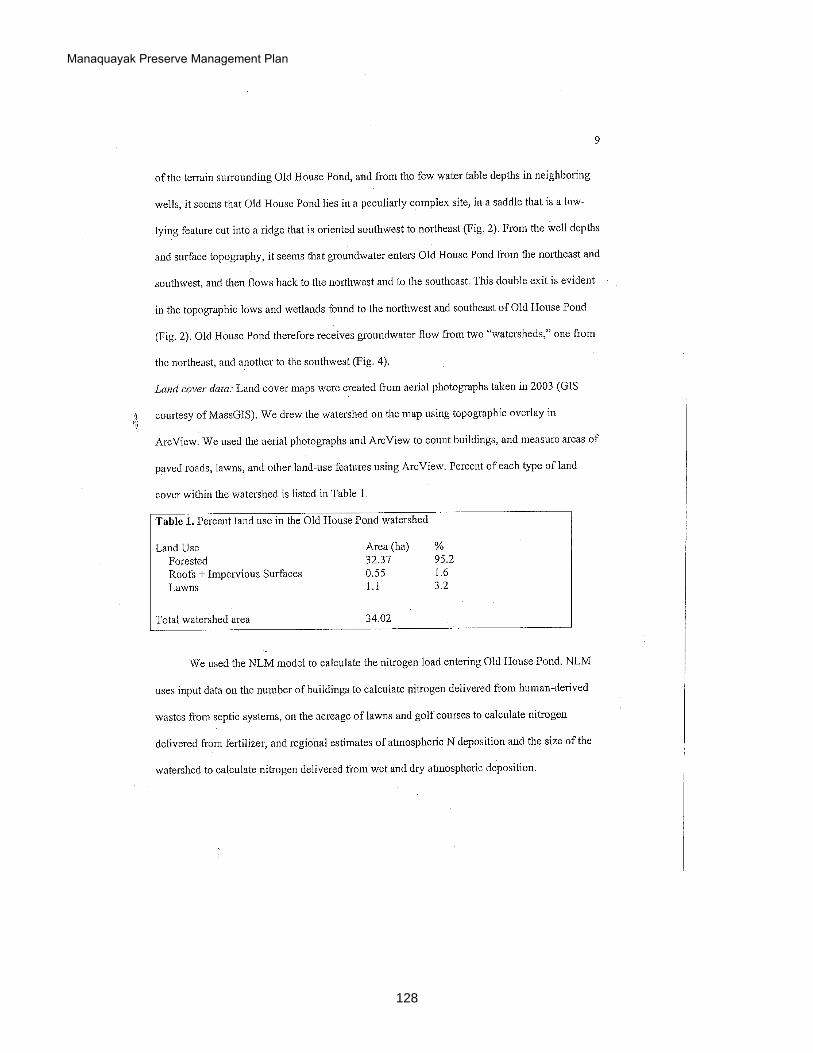
Manaquayak Preserve Management Plan
128
Manaquayak Preserve Management Plan
129
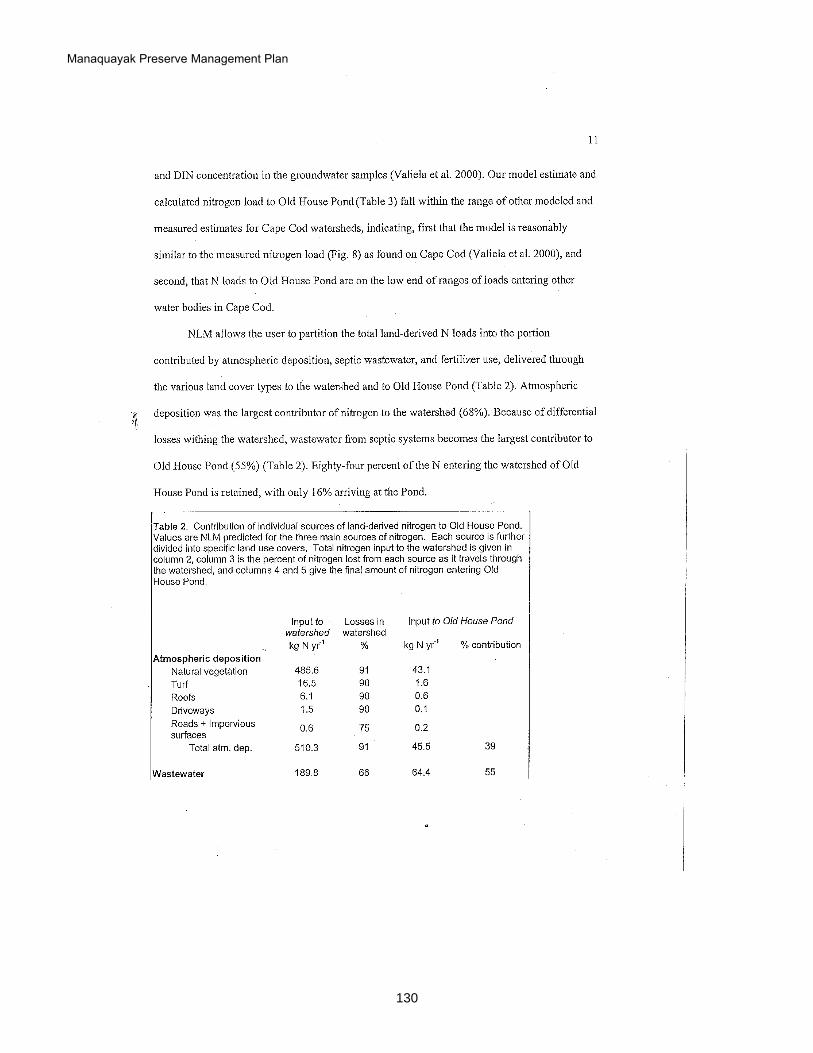
Manaquayak Preserve Management Plan
130
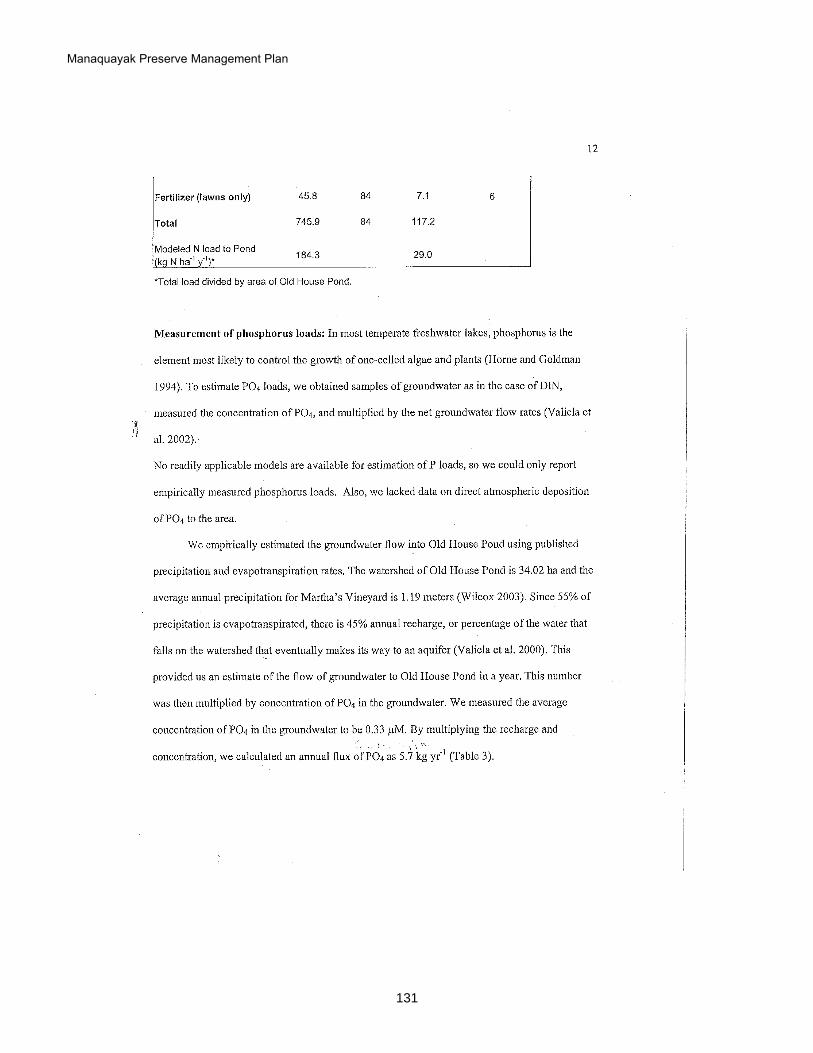
Manaquayak Preserve Management Plan
131
Manaquayak Preserve Management Plan
132
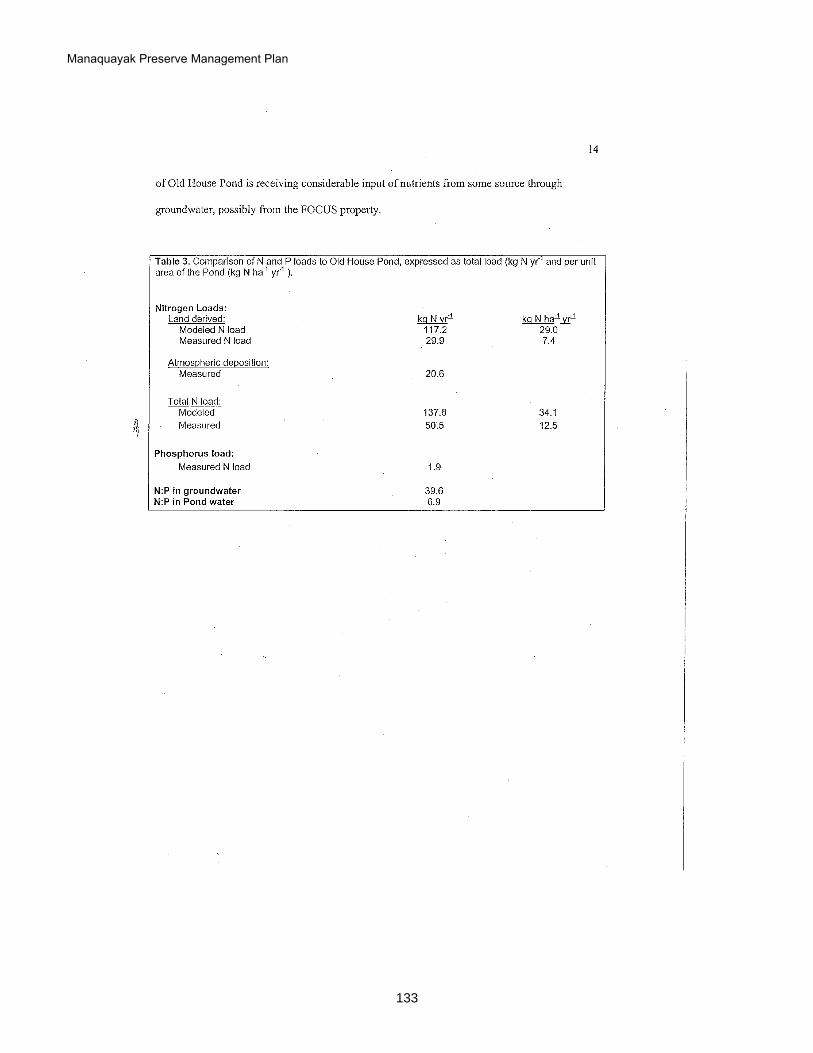
Manaquayak Preserve Management Plan
133
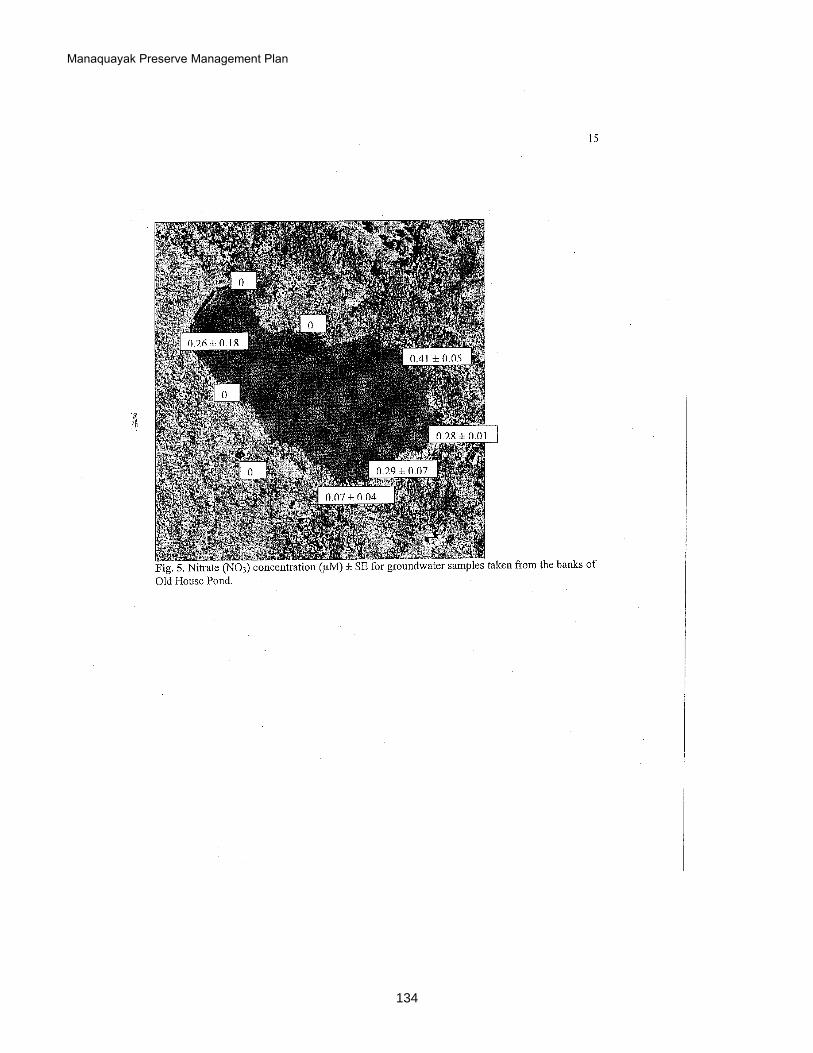
Manaquayak Preserve Management Plan
134

Manaquayak Preserve Management Plan
135
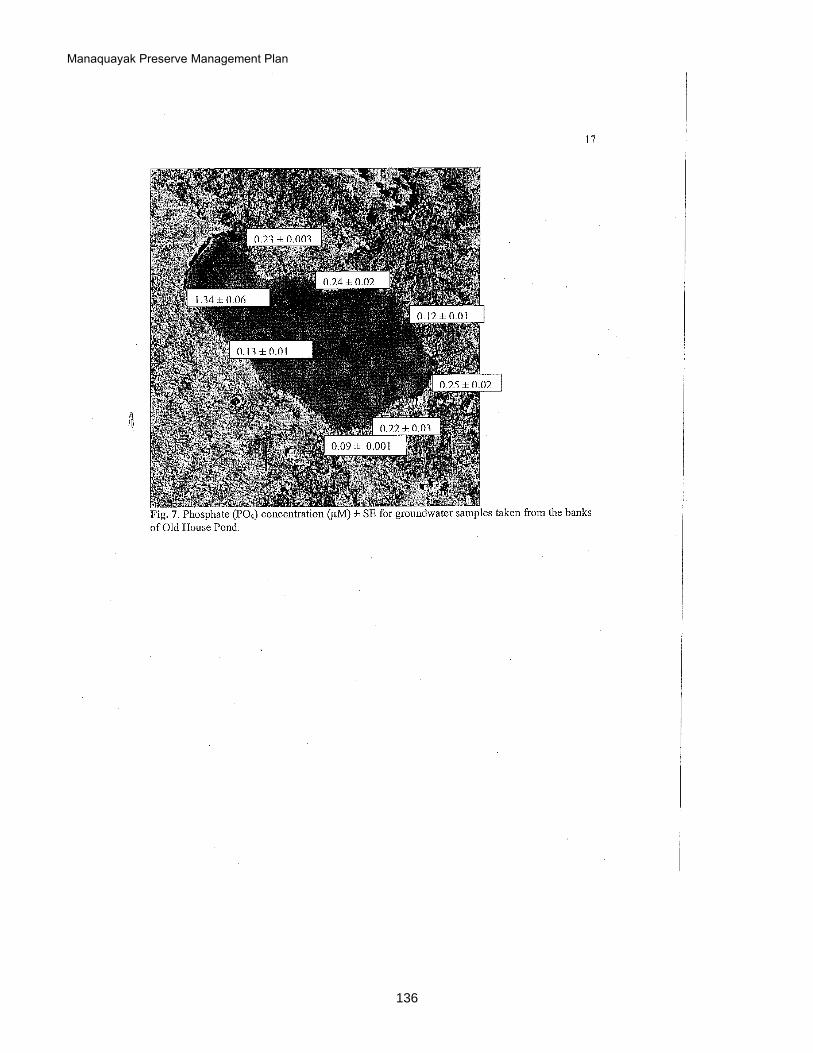
Manaquayak Preserve Management Plan
136
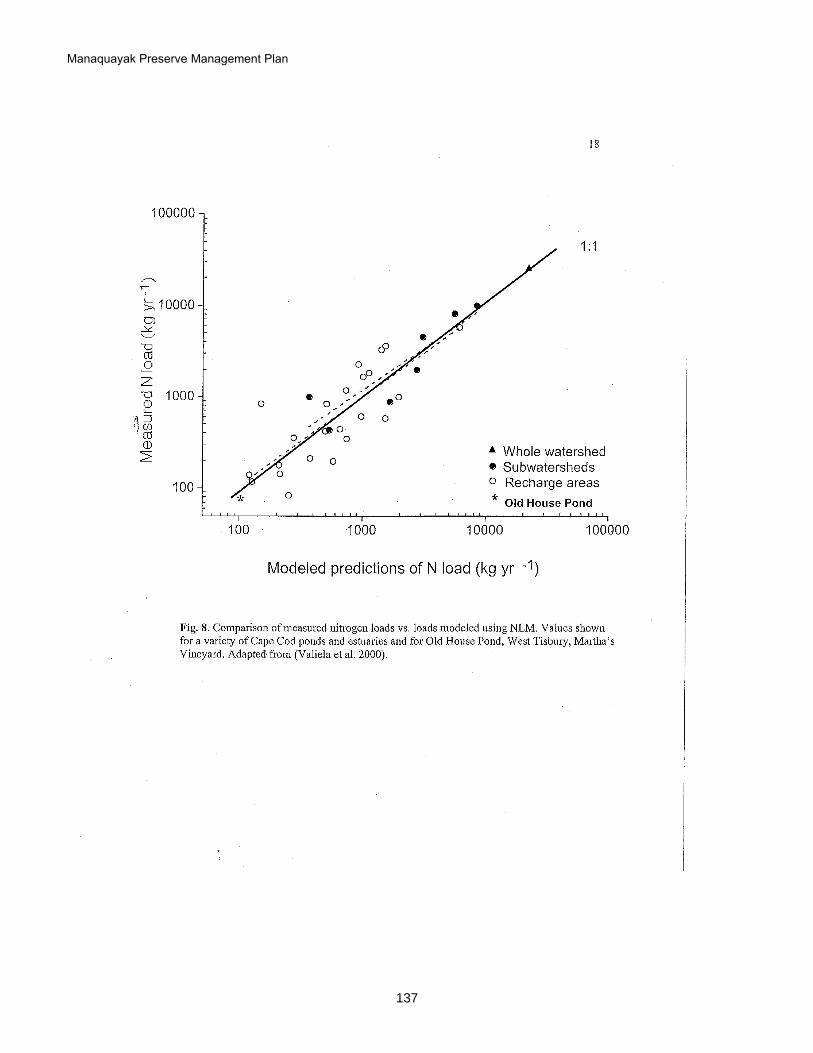
Manaquayak Preserve Management Plan
137
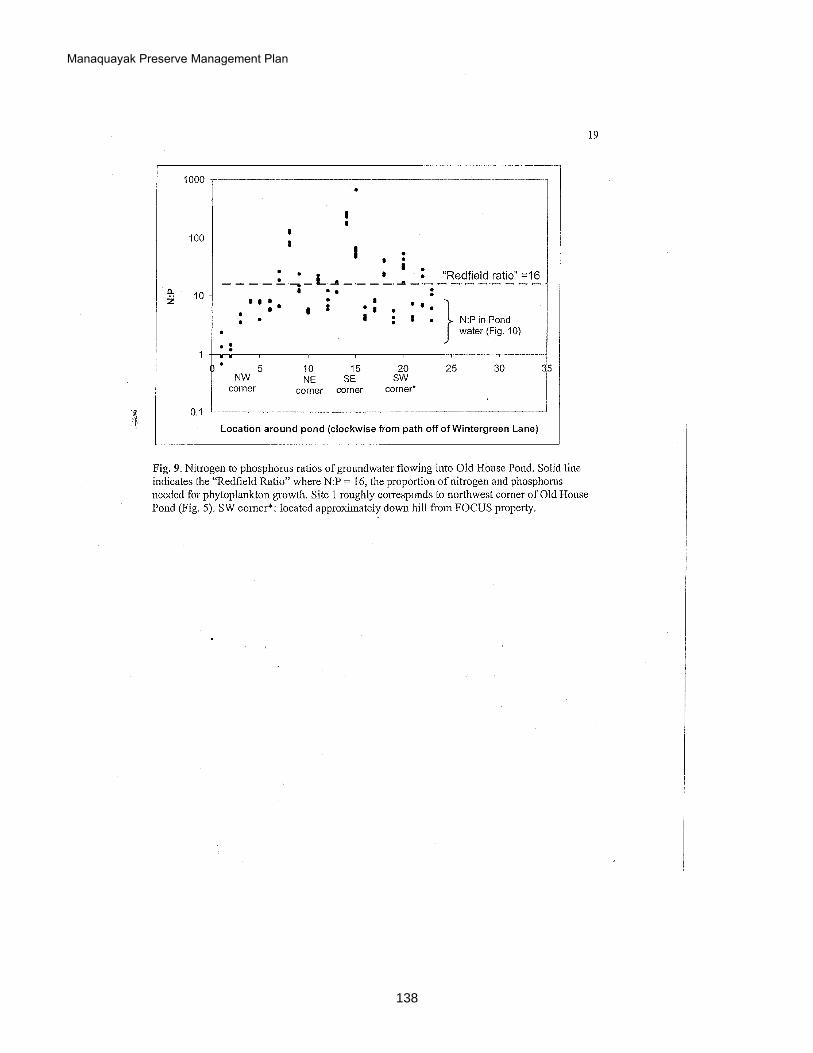
Manaquayak Preserve Management Plan
138
Manaquayak Preserve Management Plan
139
Manaquayak Preserve Management Plan
140
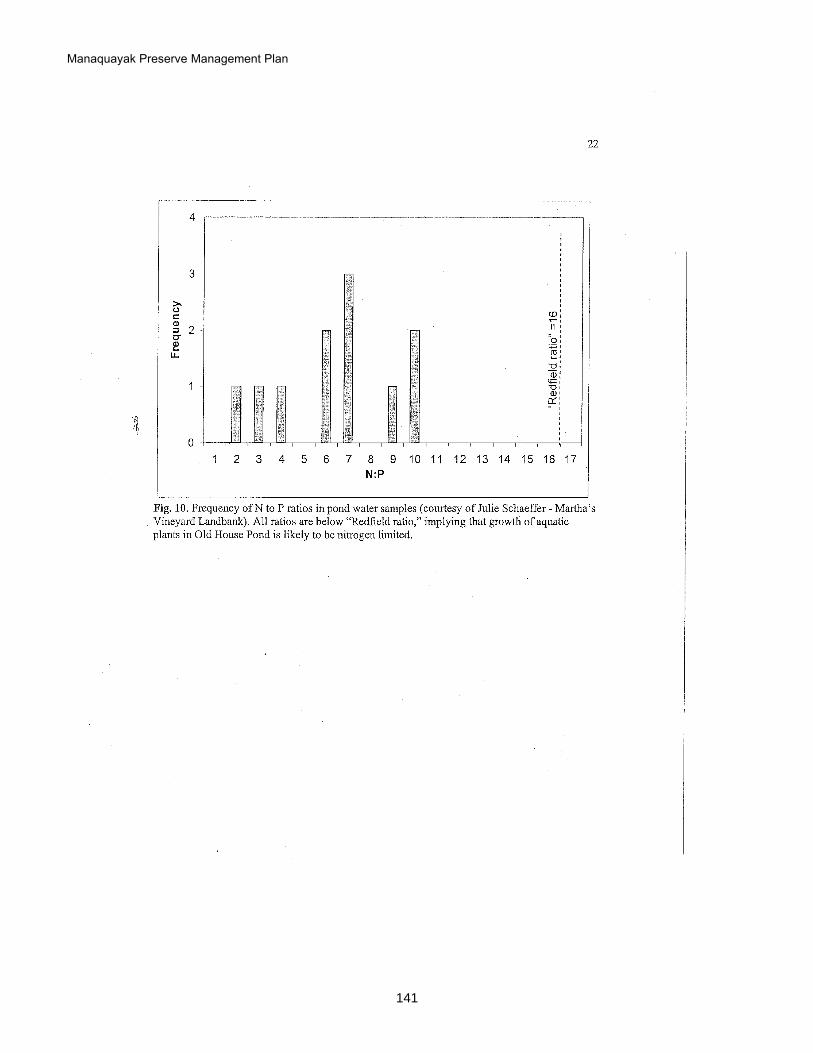
Manaquayak Preserve Management Plan
141
Manaquayak Preserve Management Plan
142
Manaquayak Preserve Management Plan
143
Manaquayak Preserve Management Plan
144
Manaquayak Preserve, West Tisbury Annual Report
2015 Julie Russell
Martha’s Vineyard Land Bank Commission
I. Water quality Results of water quality testing including tables, graphs and methods used are included in Appendix A.
A. Trophic State Index values– The 2015 trophic state indices (TSI) for surface total phosphorus, chlorophyll-A,
secchi depth and total nitrogen as described by Carlson (1977) suggest the pond at Manaquayak Preserve continues to range from an oligotrophic pond (TSI values<30) to a mesotrophic pond (TSI values 30-50) (Table 4, page 18). Average surface index values for 2015 ranged from a low of 26 for Chlorophyll-A to a high of 42 for each total phosphorus and total nitrogen. Overall, TSI values are consistent among the 10 years of study with the exception of total phosphorus (TP) TSI values in 2014 that spiked during April, July and August and were approximately 33% greater than most prior years and nearly double compared to 2010 and 2013 values. Total phosphorus TSI values in 2015 decreased compared to 2014 and are similar to prior years (Kruskal-Wallis=26.395, p=0.002 Χ
2 with 9df, z
value=3.261/26.955). TSI values for Chloraphyll-A and TN in 2015 are similar to values calculated for all previous years from 2005-2015 (TSI Chlorophyll-A: F10,32=2.106, p=0.054; TN: Kruskal-Wallis=18.155, p=0.052 Χ
2 with 10df, z value=3.317/29.45-31.81).
B. Pond depth – The water level in the pond at Manaquayak Preserve in April of 2015 was similar to the prior
years in 2014, 2013, 2011, 2010, 2006 and 2005. Water levels for April during the time period of 2005-2015 were highest in 2010. Lowest water levels were observed in the middle of October for 2013, 2012, 2011, 2010, 2009, 2007, 2006 and 2005 versus September for 2008, 2014 and 2015. Overall change in water level between April 22 and October 18 was 1.28’ in 2015 and was similar to overall water level changes observed in 2005-2008 and 2010, 2011 and 2014 where overall water level changes for that period of time were greater than 1’ (Graph 1, page 26). The data from the Global Water Meter model WL16 indicates average monthly water levels decreased from March to May then water levels spiked in June (similar to 2014 water levels), dropped in July and decreased again in August, September and October (Graph 2, page 27). Typically water levels either are erratic throughout the season as was the case in 2009-2005 or increase from April to July, level off for the month of July and then consistently decline from August to October as was observed in 2013-2010. Net precipitation in 2015 was 41.38 inches compared to a net precipitation of 43.37 in 2014, 45.96 inches in 2013, 42.80 inches in 2012, 48.14 inches in 2011, 56 inches in 2010, 54 inches in 2009, 40 inches for 2008, 30 inches for 2007 and 36 inches for both 2006 and 2005 (Graph 3, page 28). Consistent precipitation since 2008 resulted in overall higher water levels throughout the 2009-2015 winter seasons. As a result, very little coastal plain pond shoreline was exposed during the beginning of the growing season during these years with the exception of a few seasons that followed a low precipitation winter season. The drop in precipitation in July of 2015 resulted in exposure of a moderate amount of shoreline allowing plants with a quick response to sun exposure to germinate. The pond shore exposure during the growing season of 2015 was similar to that observed in 2014 and 2012 (Appendix C, shoreline photographs, page 44-48)
C. Temperature – The pond at Manaquayak Preserve remains stratified in the summer and is classified as a dimictic pond (Graph 4, page 29): mixing once in the fall and once in the spring and freezing of the surface in the winter. The thermocline, although not persistent, was observed between 3 and 4 meters in June and July.
D. Dissolved Oxygen – The percent dissolved oxygen in the pond typically exhibits a steep clinograde reduction with depth at 5 meters. However, during 2015 an increase in dissolved oxygen was observed at 5 meters starting in May ending in August (Graph 5 and 6, pages 30 and 31). Anoxic conditions did not occur in water at 7 meters during 2015. Such conditions have only been observed during August of 2008 and 2006 and September of 2007. Overall the average percent dissolved oxygen for the pond remains steady and has changed little over the past decade (Kruskal-Wallis=16.087, p=0.0651 Χ2 with 9df).
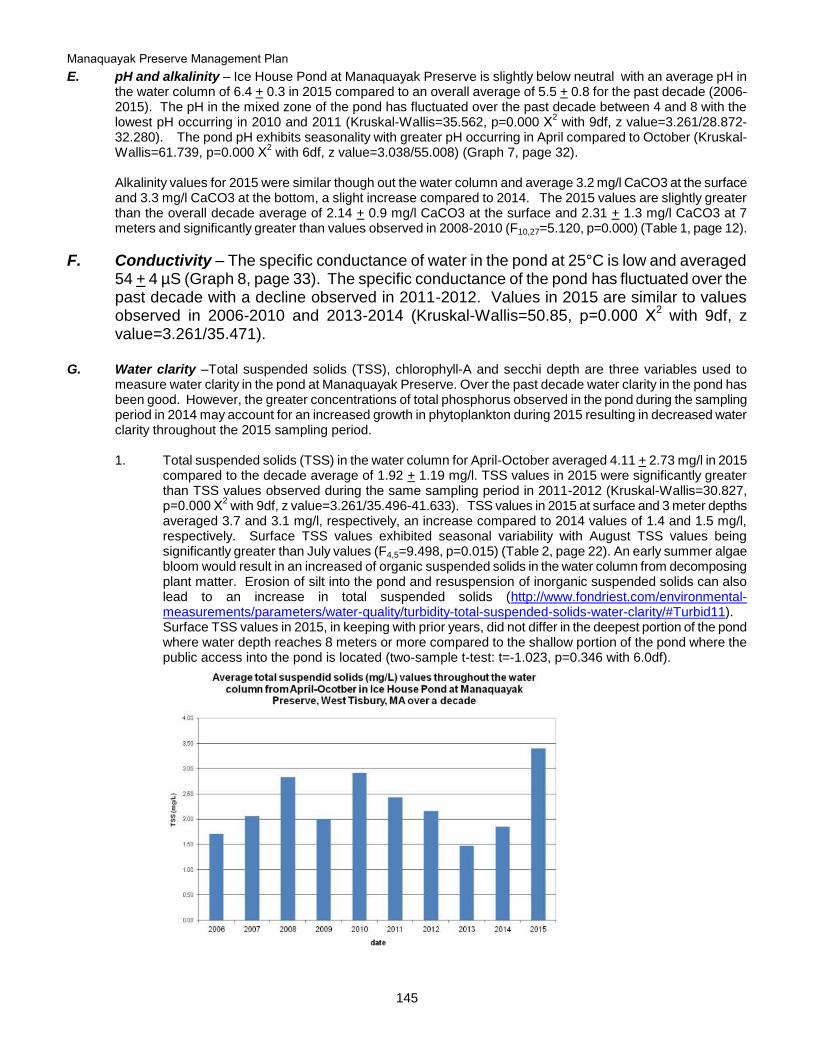
Manaquayak Preserve Management Plan
145
E. pH and alkalinity – Ice House Pond at Manaquayak Preserve is slightly below neutral with an average pH in the water column of 6.4 + 0.3 in 2015 compared to an overall average of 5.5 + 0.8 for the past decade (2006-2015). The pH in the mixed zone of the pond has fluctuated over the past decade between 4 and 8 with the lowest pH occurring in 2010 and 2011 (Kruskal-Wallis=35.562, p=0.000 Χ
2 with 9df, z value=3.261/28.872-
32.280). The pond pH exhibits seasonality with greater pH occurring in April compared to October (Kruskal-Wallis=61.739, p=0.000 Χ
2 with 6df, z value=3.038/55.008) (Graph 7, page 32).
Alkalinity values for 2015 were similar though out the water column and average 3.2 mg/l CaCO3 at the surface
and 3.3 mg/l CaCO3 at the bottom, a slight increase compared to 2014. The 2015 values are slightly greater than the overall decade average of 2.14 + 0.9 mg/l CaCO3 at the surface and 2.31 + 1.3 mg/l CaCO3 at 7 meters and significantly greater than values observed in 2008-2010 (F10,27=5.120, p=0.000) (Table 1, page 12).
F. Conductivity – The specific conductance of water in the pond at 25°C is low and averaged 54 + 4 µS (Graph 8, page 33). The specific conductance of the pond has fluctuated over the past decade with a decline observed in 2011-2012. Values in 2015 are similar to values observed in 2006-2010 and 2013-2014 (Kruskal-Wallis=50.85, p=0.000 Χ
2 with 9df, z
value=3.261/35.471). G. Water clarity –Total suspended solids (TSS), chlorophyll-A and secchi depth are three variables used to
measure water clarity in the pond at Manaquayak Preserve. Over the past decade water clarity in the pond has been good. However, the greater concentrations of total phosphorus observed in the pond during the sampling period in 2014 may account for an increased growth in phytoplankton during 2015 resulting in decreased water clarity throughout the 2015 sampling period. 1. Total suspended solids (TSS) in the water column for April-October averaged 4.11 + 2.73 mg/l in 2015
compared to the decade average of 1.92 + 1.19 mg/l. TSS values in 2015 were significantly greater than TSS values observed during the same sampling period in 2011-2012 (Kruskal-Wallis=30.827, p=0.000 Χ
2 with 9df, z value=3.261/35.496-41.633). TSS values in 2015 at surface and 3 meter depths
averaged 3.7 and 3.1 mg/l, respectively, an increase compared to 2014 values of 1.4 and 1.5 mg/l, respectively. Surface TSS values exhibited seasonal variability with August TSS values being significantly greater than July values (F4,5=9.498, p=0.015) (Table 2, page 22). An early summer algae bloom would result in an increased of organic suspended solids in the water column from decomposing plant matter. Erosion of silt into the pond and resuspension of inorganic suspended solids can also lead to an increase in total suspended solids (http://www.fondriest.com/environmental-measurements/parameters/water-quality/turbidity-total-suspended-solids-water-clarity/#Turbid11). Surface TSS values in 2015, in keeping with prior years, did not differ in the deepest portion of the pond where water depth reaches 8 meters or more compared to the shallow portion of the pond where the public access into the pond is located (two-sample t-test: t=-1.023, p=0.346 with 6.0df).
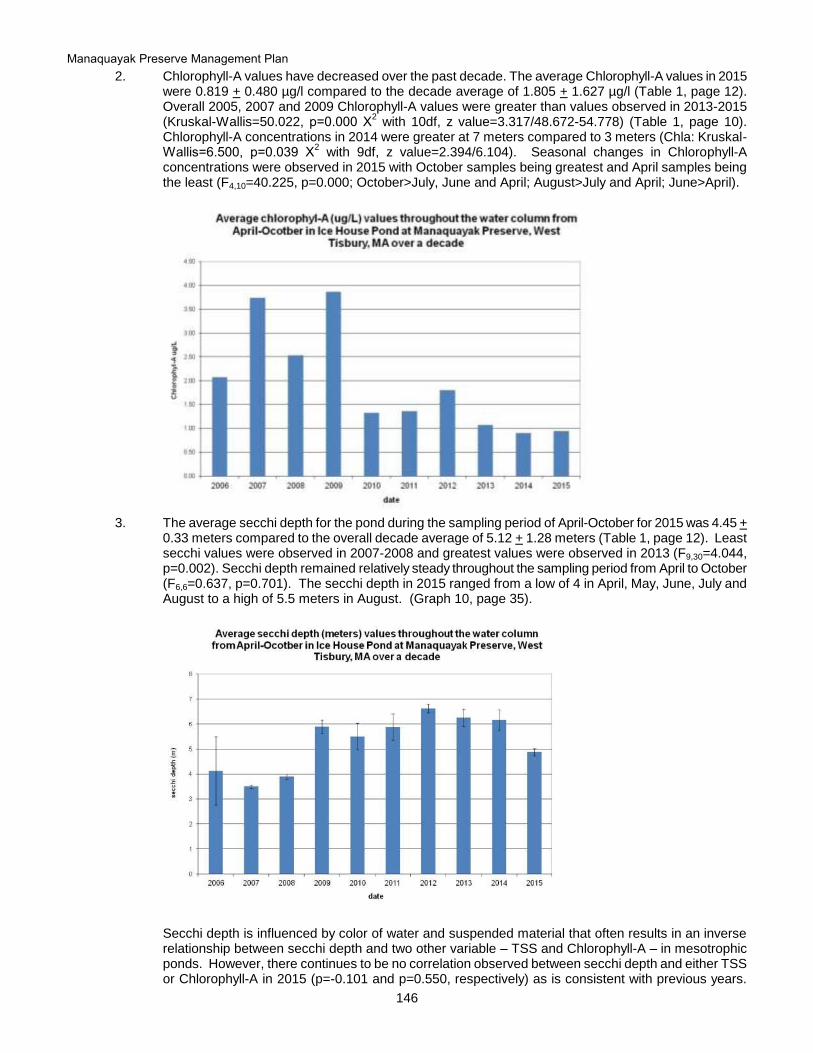
Manaquayak Preserve Management Plan
146
2. Chlorophyll-A values have decreased over the past decade. The average Chlorophyll-A values in 2015 were 0.819 + 0.480 µg/l compared to the decade average of 1.805 + 1.627 µg/l (Table 1, page 12). Overall 2005, 2007 and 2009 Chlorophyll-A values were greater than values observed in 2013-2015 (Kruskal-Wallis=50.022, p=0.000 Χ
2 with 10df, z value=3.317/48.672-54.778) (Table 1, page 10).
Chlorophyll-A concentrations in 2014 were greater at 7 meters compared to 3 meters (Chla: Kruskal-Wallis=6.500, p=0.039 Χ
2 with 9df, z value=2.394/6.104). Seasonal changes in Chlorophyll-A
concentrations were observed in 2015 with October samples being greatest and April samples being the least (F4,10=40.225, p=0.000; October>July, June and April; August>July and April; June>April).
3. The average secchi depth for the pond during the sampling period of April-October for 2015 was 4.45 +
0.33 meters compared to the overall decade average of 5.12 + 1.28 meters (Table 1, page 12). Least secchi values were observed in 2007-2008 and greatest values were observed in 2013 (F9,30=4.044, p=0.002). Secchi depth remained relatively steady throughout the sampling period from April to October (F6,6=0.637, p=0.701). The secchi depth in 2015 ranged from a low of 4 in April, May, June, July and August to a high of 5.5 meters in August. (Graph 10, page 35).
Secchi depth is influenced by color of water and suspended material that often results in an inverse relationship between secchi depth and two other variable – TSS and Chlorophyll-A – in mesotrophic ponds. However, there continues to be no correlation observed between secchi depth and either TSS or Chlorophyll-A in 2015 (p=-0.101 and p=0.550, respectively) as is consistent with previous years.
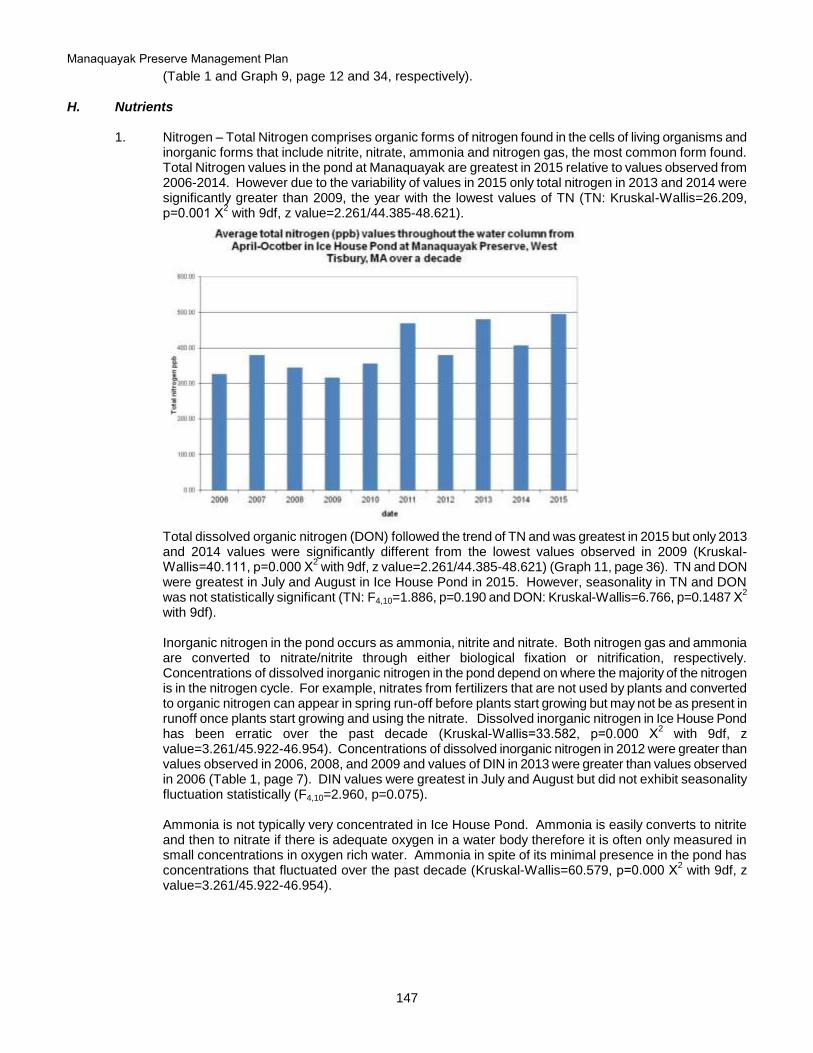
Manaquayak Preserve Management Plan
147
(Table 1 and Graph 9, page 12 and 34, respectively).
H. Nutrients
1. Nitrogen – Total Nitrogen comprises organic forms of nitrogen found in the cells of living organisms and inorganic forms that include nitrite, nitrate, ammonia and nitrogen gas, the most common form found. Total Nitrogen values in the pond at Manaquayak are greatest in 2015 relative to values observed from 2006-2014. However due to the variability of values in 2015 only total nitrogen in 2013 and 2014 were significantly greater than 2009, the year with the lowest values of TN (TN: Kruskal-Wallis=26.209, p=0.001 Χ
2 with 9df, z value=2.261/44.385-48.621).
Total dissolved organic nitrogen (DON) followed the trend of TN and was greatest in 2015 but only 2013 and 2014 values were significantly different from the lowest values observed in 2009 (Kruskal-Wallis=40.111, p=0.000 Χ
2 with 9df, z value=2.261/44.385-48.621) (Graph 11, page 36). TN and DON
were greatest in July and August in Ice House Pond in 2015. However, seasonality in TN and DON was not statistically significant (TN: F4,10=1.886, p=0.190 and DON: Kruskal-Wallis=6.766, p=0.1487 Χ
2
with 9df). Inorganic nitrogen in the pond occurs as ammonia, nitrite and nitrate. Both nitrogen gas and ammonia are converted to nitrate/nitrite through either biological fixation or nitrification, respectively. Concentrations of dissolved inorganic nitrogen in the pond depend on where the majority of the nitrogen is in the nitrogen cycle. For example, nitrates from fertilizers that are not used by plants and converted to organic nitrogen can appear in spring run-off before plants start growing but may not be as present in runoff once plants start growing and using the nitrate. Dissolved inorganic nitrogen in Ice House Pond has been erratic over the past decade (Kruskal-Wallis=33.582, p=0.000 Χ
2 with 9df, z
value=3.261/45.922-46.954). Concentrations of dissolved inorganic nitrogen in 2012 were greater than values observed in 2006, 2008, and 2009 and values of DIN in 2013 were greater than values observed in 2006 (Table 1, page 7). DIN values were greatest in July and August but did not exhibit seasonality fluctuation statistically (F4,10=2.960, p=0.075). Ammonia is not typically very concentrated in Ice House Pond. Ammonia is easily converts to nitrite and then to nitrate if there is adequate oxygen in a water body therefore it is often only measured in small concentrations in oxygen rich water. Ammonia in spite of its minimal presence in the pond has concentrations that fluctuated over the past decade (Kruskal-Wallis=60.579, p=0.000 Χ
2 with 9df, z
value=3.261/45.922-46.954).
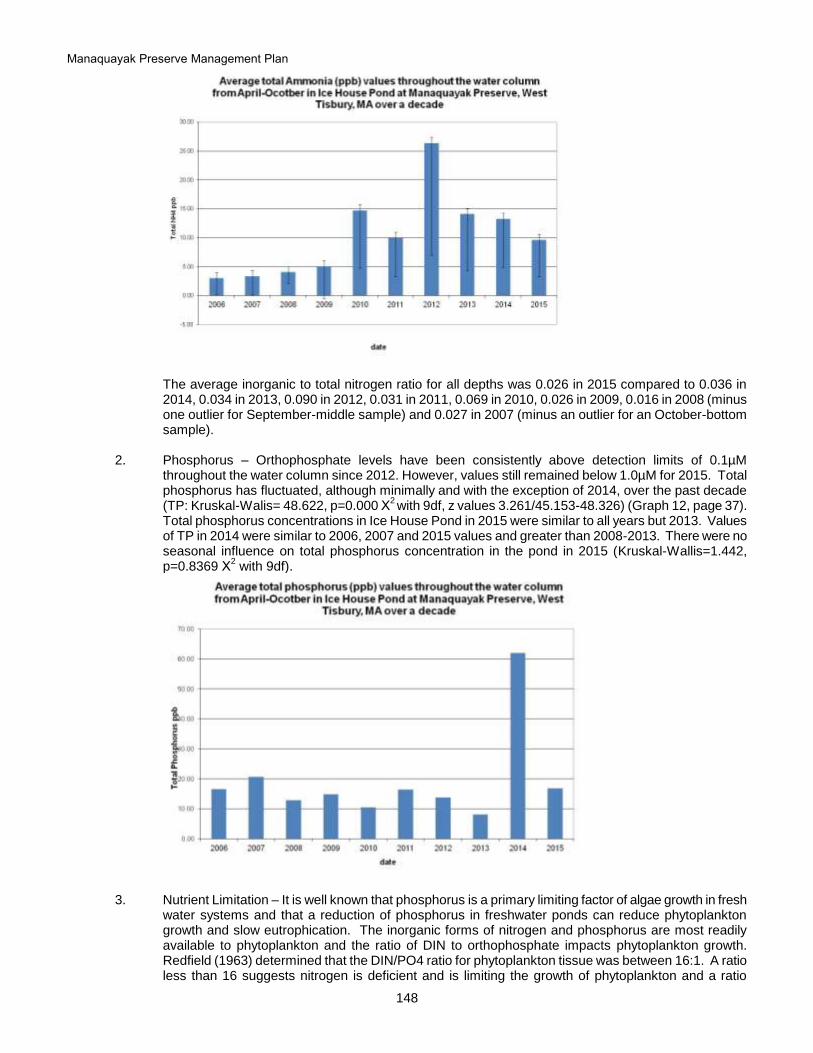
Manaquayak Preserve Management Plan
148
The average inorganic to total nitrogen ratio for all depths was 0.026 in 2015 compared to 0.036 in
2014, 0.034 in 2013, 0.090 in 2012, 0.031 in 2011, 0.069 in 2010, 0.026 in 2009, 0.016 in 2008 (minus one outlier for September-middle sample) and 0.027 in 2007 (minus an outlier for an October-bottom sample).
2. Phosphorus – Orthophosphate levels have been consistently above detection limits of 0.1µM
throughout the water column since 2012. However, values still remained below 1.0µM for 2015. Total phosphorus has fluctuated, although minimally and with the exception of 2014, over the past decade (TP: Kruskal-Walis= 48.622, p=0.000 Χ
2 with 9df, z values 3.261/45.153-48.326) (Graph 12, page 37).
Total phosphorus concentrations in Ice House Pond in 2015 were similar to all years but 2013. Values of TP in 2014 were similar to 2006, 2007 and 2015 values and greater than 2008-2013. There were no seasonal influence on total phosphorus concentration in the pond in 2015 (Kruskal-Wallis=1.442, p=0.8369 Χ
2 with 9df).
3. Nutrient Limitation – It is well known that phosphorus is a primary limiting factor of algae growth in fresh
water systems and that a reduction of phosphorus in freshwater ponds can reduce phytoplankton growth and slow eutrophication. The inorganic forms of nitrogen and phosphorus are most readily available to phytoplankton and the ratio of DIN to orthophosphate impacts phytoplankton growth. Redfield (1963) determined that the DIN/PO4 ratio for phytoplankton tissue was between 16:1. A ratio less than 16 suggests nitrogen is deficient and is limiting the growth of phytoplankton and a ratio

Manaquayak Preserve Management Plan
149
greater than 16 suggests phosphorus is deficient and limiting phytoplankton growth. In addition, a total nitrogen to total phosphorus ratio (TN:TP) of 10:1 or greater indicates that phosphorus is deficient and limiting phytoplankton growth (Carlson and Simpson 1996). Inorganic nitrogen and phosphorus ratios from 2006-2015 indicate Ice House Pond is nitrogen-limited most of the time during the sampling period with the average value being 8.4 in the water column and a range of 0.4 to 38. Quite often, in July and August, the ratio of DIN/PO4 is greater in the deeper bottom waters than the surface water. The average surface DIN/PO4 ratio for 2015 was 13 suggesting nitrogen limitation with the exception of July when the ratio reached 26. TN:TP ratios are, in additional to being indicators of limiting nutrients, closely and inversely related to trophic status in water bodies. A low TN:TP ratio is often associated with ponds where the eutrophication process is well underway. The TN:TP ratio also changes in the water column during seasonal pond cycling. A mesotrophic stratisfied pond experiences a decrease in TN:TP ratios from the mixed layer (0-3 meters in Ice House Pond) to the hypolimnia (7 meters in Ice House Pond) and is lowest at the water-sediment interface (Quiros, 2002). TN:TP displayed an overall average of 27 throughout the water column for 2006-2015, with the exclusion of 2013 data where TP values were excessively low compared to other years. Average surface TN:TP was 34 for the decade and dropped to an average of 24 in the hypolimnia. TN:TP for 2015 was 30 for the season with 36 in the mixed layer of the pond and 31 in the hypolimnia. The TN:TP ratio for Ice House Pond in 2015 and prior years indicates that phosphorus is limiting growth of phytoplankton in the pond with the exception of 2014 when the ratio was below 10 for April and August. Results from 2015 analysis indicate the pond at Manaquayak is not over the phosphorus threashold of 100 ppb as was observed in 2014 (Bachmann 2013). Total phosphorus concentration in 2015 in Ice House Pond was between 26 and 11 ppb with an average of 15 + 4 ppb. This is a decrease from 2014 (average TP: 54 + 29 ppb) but comparable to prior years 2006-2013 values (average TP: 13 + 7 ppb). The primary source of phosphorus in a water body is from soil minerals and accumulation in pond sediments is probable. A greater TP was observed in bottom samples over the past decade (excluding 2014 data) (16 + 8 ppb) compared to surface samples (11 + 5 ppb). The inorganic nitrogen from spring rainfall that occurs on the surface is likely used quickly by phytoplankton. That plankton then falls to the bottom and is a conduit for nitrogen movement from the surface to the bottom of the pond later in the sampling season. This explains why the DIN to PO4 ratio is often greater at the bottom of the pond than the surface in July and August. The greater ratios of total nitrogen to total phosphorus suggest a movement of inorganic nitrogen into dissolved and particulate nitrogen that has not changed back to inorganic forms during the sampling period. A similar scenario was observed at Seth’s Pond during a 2001 study and described by William Wilcox in the report (Seth’s Pond: Present Water Quality and Proposed Management Plan, MVC 2001, revised 2004).
4. Pond Health – Nutrient and chlorophyll A concentrations are established indicators of pond health. A
study by Eichner and other (2003) of Cape Cod lakes and ponds identifies nutrient and chlorophyll A concentrations that define what is a “healthy” unimpacted pond on Cape Cod. According to the US Environmental Protection Agency (2000) method for determining a nutrient threashold criteria and the 2001 Pond and Lake Stewards (PALS) Snapshot a “healthy” unimpacted pond on cape cod has Chlorophyll A threashold values of 1.7 ppb, surface TP values of less then 7.5 ppb and surface TN values of less than 310 ppb. Using these criteria the pond at Manaquayak Preserve was a “healthy” unimpacted pond in 2013 according to average surface Chlorophyll A values of 0.95 ppb and average TP surface values of 5.45 ppb but average surface TN values were 383 ppb, approximately 70 ppb over the threashold for a “healthy” unimpacted pond. In 2014 two of the three criteria used to measure the healthy state of the pond suggest it is undergoing impact. The average TP surface values were 63 ppb in 2014, approximately 55.5 ppb over the limit for a “healthy” unimpacted pond and average surface TN values were 434 ppb, approximately 124 ppb over the threashold for a “healthy” unimpacted pond. Similarly, in 2015, two of the three criteria used to measure the healthy state of the pond continue to suggest it is undergoing impact. The average TP surface values were 16 ppb in 2015, although not as great as values observed in 2014, TP values are approximately 8.5 ppb over the limit for a “healthy” unimpacted pond and average surface TN values were 424 ppb, approximately 114 ppb over the threashold for a “healthy” unimpacted pond. This is not uncommon in areas where septic systems are

Manaquayak Preserve Management Plan
150
the primary means of residential wastewater treatment and in areas where people have access to the water body for recreational use. Providing public restroom facilities mitigates the impact of recreational use on a pond (National Park Service Contract No. CX-1600-5-0006, Limnology and the Management of the Freshwater Ponds of Cape Cod National Seashore)
I. Bacteria - Enterococcus bacteria was measured weekly from June through August in the pond at Manaquayak
Preserve (Table 3, page 23). One of the water samples had Enterococcus bacteria levels above the limit for the single test fresh water safety standard of 61 colonies per 100 ml but tested at 5.1 colony per 100ml the following day on August 18, 2015. The minimum 5-sample geometric mean fresh water safety standard is 33 colonies/100ml. The geometric mean for June was 1.0 colonies/100ml, for July was 6.2 colonies/100ml and for August was 7.1 colonies/100ml.
II. Recreation use The 2015 summer season was the eighth year that Manaquayak Preserve was open to the public. The property was attended as follows: # attendants Time In Time Out gate open Dates 3 9:00 am 2:00 am 9:00 am June-August 30 The preserve was used primarily by the public for access to the pond for recreational swimming. The following is a summary of summer use based on attendant notes and records from the logbook. Graphs of summer use data are included in Appendix B, pages 38-43.
A total of 9150 people in 3163 vehicles visited the preserve from May 30 – September 7, 2015 during 101 days and 984 attended hours of usage data. The 2015 summer use as portrayed in total visitors per attended hour per day during the period of July and August has increased 6% compared to 2014 but is still 8% less than number of visitors observed per attended hour in 2013 (Graphs 13, pages 38). The trend of visitors coming to the property to enjoy the pond continues with 81% of visitors coming to the preserve for swimming in 2015 and 2014 compared to 79% in 2013, 71% in 2012, 86% in 2011, 98% in 2010 and 90% in 2009. The most popular time visitors came to the preserve to swim remains between 2 pm and 5 pm (graphs 14, 16, 17 and 18 pages 39 and 41-43). The trailhead closed due to its having reached capacity an average of 8.7 times per day; resulting in at least 9.2 vehicles on average being turned away per day. This is comparable to what was observed in 2014 and 2013 (graph 15, page 40). The maximum number of visitors allowed on the preserve at one time (20 visitors) was met in 25 times in 2015 compared to 18 times in 2014, 38 times in 2013, 17 times in 2012, 6 times in 2011, 26 times in 2010, and 15 times in 2009. In 2008 the maximum capacity of visitors on the preserve was never met. The proportion of non-vehicle visitors has shifted somewhat from prior years in 2012-2010 and 2014 when 1/3 of visitors arrived by foot or two wheels. In 2015, a quarter of visitors arrived by vehicle. This is still greater than the 20% that arrived by non-vehicle means in 2013 and the 9% that arrived by non vehicle means in 2009. An increase in drop-offs during times when the lot was full occurred in 2015. The portalet at Manaquayak Preserve was used regularly by the public, according to the attendants who serviced it. To maintain a non-wading depth at the end of the access perch, 32 feet of the pond access perch were installed on May 21 and extended to the full length of 76 feet on July 7, 2015. The entire swimming perch was removed on November 17, 2015. The public was instructed to enter the pond from the end of the perch where the water level was greater than 5.5 feet deep. The areas on either side of the perch were roped-off as non-access areas; appropriate signage was put in place at the beginning of the season. The perch was in sufficient deep water as not to cause visual sedimentation of the water column. The sandy bottom of the pond was always clear. The primary violations that occurred on the preserve in 2015 were the same in previous years and included noise from visitors swimming in the pond and the occasional unauthorized parking of vehicles during the times that the trailhead was closed. There was a steady request to allow the use of swimming assisting devices such as goggles, flippers and snorkels and kickboards.
Manaquayak Preserve Management Plan
151
III. Rare plants and animals
A. Plants The fluctuating water levels of the kettle pond at the preserve dictate which plants may occur in the coastal plain pond shoreline each year. The waterlevel of the pond in 2015 was low again and as a result the rare plant species, Lipocarpha micrantha, was observed on the pond shore in 2015. The survey resulted in 197 individual L. micrantha plants observed on the shoreline Visual surveys were conducted in June, July and September of 2015 resulting in a total of 103 out of the known 153 plant species known to occur on the preserve. The visual surveys are designed to assemble the most complete listing of plant and wildlife species on the preserve and involve walking all trails and several transects through the woodland while recording all plants in sight. More detailed information regarding the 2015 vegetation survey of the preserve is listed in Appendix D, page 30.
B. Animals
1. Birds – No rare bird species were observed on the preserve during the 2014 avian point count survey.
For more detailed information regarding the bird survey in 2014 see Appendix E, page 35.
2. Odonates – No additional Odonates were observed during the 2015 surveys of the pondshore. Lack of emergent vegetation due to lower water levels may result in fewer species of Odonates observed
3. Other Wildlife – No other rare wildlife species were observed in 2015 by land bank
staff during visual surveys of the preserve. River otter and snapping turtle continue to use the pond. Fish such as largemouth bass and chain pickerel were observed frequently in 2015. Bluegill sunfish are consistently present in good numbers. Green frogs and bullfrogs were present along the pond shore in sparse numbers.
IV. Management plan amendments The management plan for Manaquayak Preserve is in the process of being amended to include additional acreage to the southwest. The land bank foreman will continue to enforce the no-trespassing rule, either by foot or vehicle, on all private land, including the shoulders of private roads. Day and nighttime attending of the preserve will continue during the summer season of 2016.
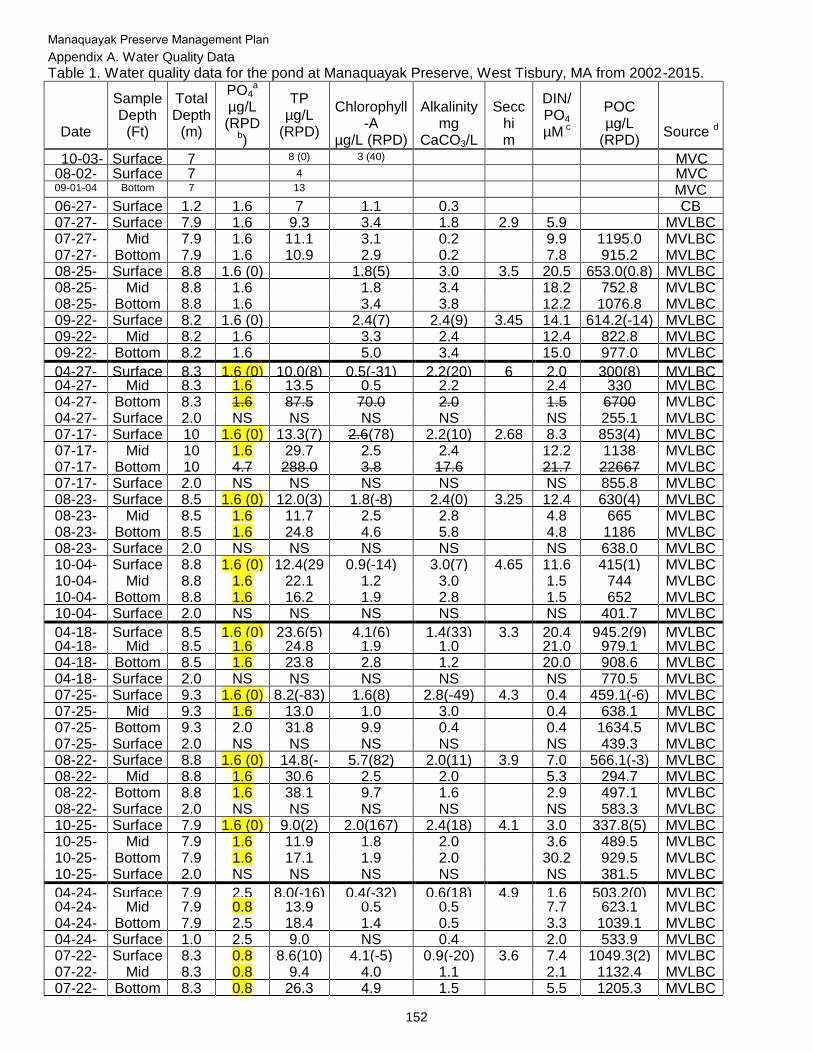
Manaquayak Preserve Management Plan
152
Appendix A. Water Quality Data
Table 1. Water quality data for the pond at Manaquayak Preserve, West Tisbury, MA from 2002-2015.
Date
Sample Depth
(Ft)
Total Depth
(m)
PO4a
µg/L (RPD
b)
TP µg/L
(RPD)
Chlorophyll
-A µg/L (RPD)
Alkalinity
mg CaCO3/L
Secc
hi m
DIN/ PO4
µM c
POC µg/L
(RPD)
Source d
10-03-02
Surface 7 8 (0) 3 (40) MVC 08-02-
04 Surface 7 4 MVC
09-01-04 Bottom 7 13 MVC 06-27-
05 Surface 1.2 1.6 7 1.1 0.3 CB
07-27-05
Surface 7.9 1.6 9.3 3.4 1.8 2.9 5.9 MVLBC 07-27-
05 Mid 7.9 1.6 11.1 3.1 0.2 9.9 1195.0 MVLBC
07-27-05
Bottom 7.9 1.6 10.9 2.9 0.2 7.8 915.2 MVLBC 08-25-
05 Surface 8.8 1.6 (0) 1.8(5) 3.0 3.5 20.5 653.0(0.8) MVLBC
08-25-05
Mid 8.8 1.6 1.8 3.4 18.2 752.8 MVLBC 08-25-
05 Bottom 8.8 1.6 3.4 3.8 12.2 1076.8 MVLBC
09-22-05
Surface 8.2 1.6 (0) 2.4(7) 2.4(9) 3.45 14.1 614.2(-14) MVLBC 09-22-
05 Mid 8.2 1.6 3.3 2.4 12.4 822.8 MVLBC
09-22-05
Bottom 8.2 1.6 5.0 3.4 15.0 977.0 MVLBC
04-27-06
Surface 8.3 1.6 (0) 10.0(8) 0.5(-31) 2.2(20) 6 2.0 300(8) MVLBC 04-27-
06 Mid 8.3 1.6 13.5 0.5 2.2 2.4 330 MVLBC
04-27-06
Bottom 8.3 1.6 87.5 70.0 2.0 1.5 6700 MVLBC 04-27-
06 Surface 2.0 NS NS NS NS NS 255.1 MVLBC
07-17-06
Surface 10 1.6 (0) 13.3(7) 2.6(78) 2.2(10) 2.68 8.3 853(4) MVLBC 07-17-
06 Mid 10 1.6 29.7 2.5 2.4 12.2 1138 MVLBC
07-17-06
Bottom 10 4.7 288.0 3.8 17.6 21.7 22667 MVLBC 07-17-
06 Surface 2.0 NS NS NS NS NS 855.8 MVLBC
08-23-06
Surface 8.5 1.6 (0) 12.0(3) 1.8(-8) 2.4(0) 3.25 12.4 630(4) MVLBC 08-23-
06 Mid 8.5 1.6 11.7 2.5 2.8 4.8 665 MVLBC
08-23-06
Bottom 8.5 1.6 24.8 4.6 5.8 4.8 1186 MVLBC 08-23-
06 Surface 2.0 NS NS NS NS NS 638.0 MVLBC
10-04-06
Surface 8.8 1.6 (0) 12.4(29)
0.9(-14) 3.0(7) 4.65 11.6 415(1) MVLBC 10-04-
06 Mid 8.8 1.6 22.1 1.2 3.0 1.5 744 MVLBC
10-04-06
Bottom 8.8 1.6 16.2 1.9 2.8 1.5 652 MVLBC 10-04-
06 Surface 2.0 NS NS NS NS NS 401.7 MVLBC
04-18-07
Surface 8.5 1.6 (0) 23.6(5) 4.1(6) 1.4(33) 3.3 20.4 945.2(9) MVLBC 04-18-
07 Mid 8.5 1.6 24.8 1.9 1.0 21.0 979.1 MVLBC
04-18-07
Bottom 8.5 1.6 23.8 2.8 1.2 20.0 908.6 MVLBC 04-18-
07 Surface 2.0 NS NS NS NS NS 770.5 MVLBC
07-25-07
Surface 9.3 1.6 (0) 8.2(-83) 1.6(8) 2.8(-49) 4.3 0.4 459.1(-6) MVLBC 07-25-
07 Mid 9.3 1.6 13.0 1.0 3.0 0.4 638.1 MVLBC
07-25-07
Bottom 9.3 2.0 31.8 9.9 0.4 0.4 1634.5 MVLBC 07-25-
07 Surface 2.0 NS NS NS NS NS 439.3 MVLBC
08-22-07
Surface 8.8 1.6 (0) 14.8(-29)
5.7(82) 2.0(11) 3.9 7.0 566.1(-3) MVLBC 08-22-
07 Mid 8.8 1.6 30.6 2.5 2.0 5.3 294.7 MVLBC
08-22-07
Bottom 8.8 1.6 38.1 9.7 1.6 2.9 497.1 MVLBC 08-22-
07 Surface 2.0 NS NS NS NS NS 583.3 MVLBC
10-25-07
Surface 7.9 1.6 (0) 9.0(2) 2.0(167) 2.4(18) 4.1 3.0 337.8(5) MVLBC 10-25-
07 Mid 7.9 1.6 11.9 1.8 2.0 3.6 489.5 MVLBC
10-25-07
Bottom 7.9 1.6 17.1 1.9 2.0 30.2 929.5 MVLBC 10-25-
07 Surface 2.0 NS NS NS NS NS 381.5 MVLBC
04-24-08
Surface 7.9 2.5 8.0(-16) 0.4(-32) 0.6(18) 4.9 1.6 503.2(0) MVLBC 04-24-
08 Mid 7.9 0.8 13.9 0.5 0.5 7.7 623.1 MVLBC
04-24-08
Bottom 7.9 2.5 18.4 1.4 0.5 3.3 1039.1 MVLBC 04-24-
08 Surface 1.0 2.5 9.0 NS 0.4 2.0 533.9 MVLBC
07-22-08
Surface 8.3 0.8 8.6(10) 4.1(-5) 0.9(-20) 3.6 7.4 1049.3(2) MVLBC 07-22-
08 Mid 8.3 0.8 9.4 4.0 1.1 2.1 1132.4 MVLBC
07-22-08
Bottom 8.3 0.8 26.3 4.9 1.5 5.5 1205.3 MVLBC
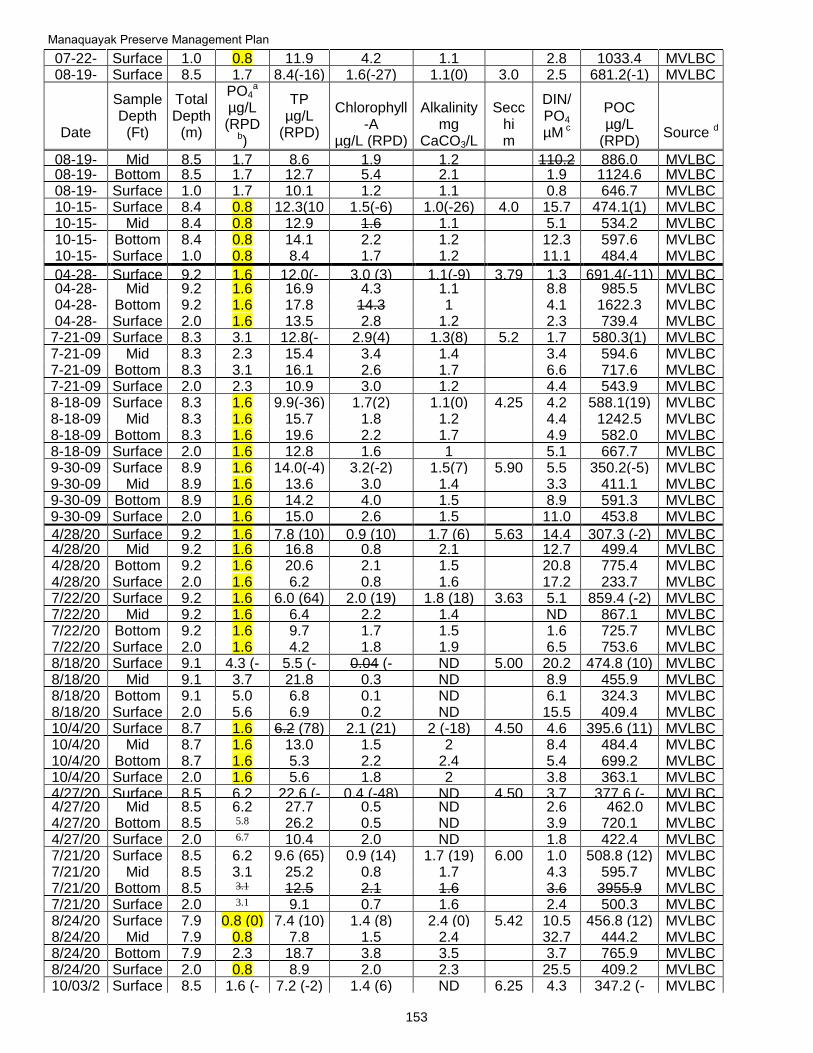
Manaquayak Preserve Management Plan
153
07-22-08
Surface 1.0 0.8 11.9 4.2 1.1 2.8 1033.4 MVLBC 08-19-
08 Surface 8.5 1.7 8.4(-16) 1.6(-27) 1.1(0) 3.0 2.5 681.2(-1) MVLBC
Date
Sample Depth
(Ft)
Total Depth
(m)
PO4a
µg/L (RPD
b)
TP µg/L
(RPD)
Chlorophyll
-A µg/L (RPD)
Alkalinity
mg CaCO3/L
Secc
hi m
DIN/ PO4
µM c
POC µg/L
(RPD)
Source d
08-19-08
Mid 8.5 1.7 8.6 1.9 1.2 110.2 886.0 MVLBC 08-19-
08 Bottom 8.5 1.7 12.7 5.4 2.1 1.9 1124.6 MVLBC
08-19-08
Surface 1.0 1.7 10.1 1.2 1.1 0.8 646.7 MVLBC 10-15-
08 Surface 8.4 0.8 12.3(10
) 1.5(-6) 1.0(-26) 4.0 15.7 474.1(1) MVLBC
10-15-08
Mid 8.4 0.8 12.9 1.6 1.1 5.1 534.2 MVLBC 10-15-
08 Bottom 8.4 0.8 14.1 2.2 1.2 12.3 597.6 MVLBC
10-15-08
Surface 1.0 0.8 8.4 1.7 1.2 11.1 484.4 MVLBC
04-28-09
Surface 9.2 1.6 12.0(-12)
3.0 (3) 1.1(-9) 3.79 1.3 691.4(-11) MVLBC 04-28-
09 Mid 9.2 1.6 16.9 4.3 1.1 8.8 985.5 MVLBC
04-28-09
Bottom 9.2 1.6 17.8 14.3 1 4.1 1622.3 MVLBC 04-28-
09 Surface 2.0 1.6 13.5 2.8 1.2 2.3 739.4 MVLBC
7-21-09 Surface 8.3 3.1 (67)
12.8(-19)
2.9(4) 1.3(8) 5.2 1.7 580.3(1) MVLBC 7-21-09 Mid 8.3 2.3 15.4 3.4 1.4 3.4 594.6 MVLBC 7-21-09 Bottom 8.3 3.1 16.1 2.6 1.7 6.6 717.6 MVLBC 7-21-09 Surface 2.0 2.3 10.9 3.0 1.2 4.4 543.9 MVLBC 8-18-09 Surface 8.3 1.6 9.9(-36) 1.7(2) 1.1(0) 4.25 4.2 588.1(19)
MVLBC
8-18-09 Mid 8.3 1.6 15.7 1.8 1.2 4.4 1242.5 MVLBC 8-18-09 Bottom 8.3 1.6 19.6 2.2 1.7 4.9 582.0 MVLBC 8-18-09 Surface 2.0 1.6 12.8 1.6 1 5.1 667.7 MVLBC 9-30-09 Surface 8.9 1.6 14.0(-4) 3.2(-2) 1.5(7) 5.90 5.5 350.2(-5) MVLBC 9-30-09 Mid 8.9 1.6 13.6 3.0 1.4 3.3 411.1 MVLBC 9-30-09 Bottom 8.9 1.6 14.2 4.0 1.5 8.9 591.3 MVLBC 9-30-09 Surface 2.0 1.6 15.0 2.6 1.5 11.0 453.8 MVLBC
4/28/2010
Surface 9.2 1.6 7.8 (10) 0.9 (10) 1.7 (6) 5.63 14.4 307.3 (-2) MVLBC 4/28/20
10 Mid 9.2 1.6 16.8 0.8 2.1 12.7 499.4 MVLBC
4/28/2010
Bottom 9.2 1.6 20.6 2.1 1.5 20.8 775.4 MVLBC 4/28/20
10 Surface 2.0 1.6 6.2 0.8 1.6 17.2 233.7 MVLBC
7/22/2010
Surface 9.2 1.6 6.0 (64) 2.0 (19) 1.8 (18) 3.63 5.1 859.4 (-2) MVLBC 7/22/20
10 Mid 9.2 1.6 6.4 2.2 1.4 ND 867.1 MVLBC
7/22/2010
Bottom 9.2 1.6 9.7 1.7 1.5 1.6 725.7 MVLBC 7/22/20
10 Surface 2.0 1.6 4.2 1.8 1.9 6.5 753.6 MVLBC
8/18/2010
Surface 9.1 4.3 (-40)
5.5 (-21)
0.04 (-128)0.2
ND 5.00 20.2 474.8 (10) MVLBC 8/18/20
10 Mid 9.1 3.7 21.8 0.3 ND 8.9 455.9 MVLBC
8/18/2010
Bottom 9.1 5.0 6.8 0.1 ND 6.1 324.3 MVLBC 8/18/20
10 Surface 2.0 5.6 6.9 0.2 ND 15.5 409.4 MVLBC
10/4/2010
Surface 8.7 1.6 6.2 (78) 2.1 (21) 2 (-18) 4.50 4.6 395.6 (11) MVLBC 10/4/20
10 Mid 8.7 1.6 13.0 1.5 2 8.4 484.4 MVLBC
10/4/2010
Bottom 8.7 1.6 5.3 2.2 2.4 5.4 699.2 MVLBC 10/4/20
10 Surface 2.0 1.6 5.6 1.8 2 3.8 363.1 MVLBC
4/27/2011
Surface 8.5 6.2 (13)
22.6 (-2)
0.4 (-48) ND 4.50 3.7 377.6 (-11)
MVLBC 4/27/20
11 Mid 8.5 6.2 27.7 0.5 ND 2.6 462.0 MVLBC
4/27/2011
Bottom 8.5 5.8 26.2 0.5 ND 3.9 720.1 MVLBC 4/27/20
11 Surface 2.0 6.7 10.4 2.0 ND 1.8 422.4 MVLBC
7/21/2011
Surface 8.5 6.2 (120)
9.6 (65) 0.9 (14) 1.7 (19) 6.00 1.0 508.8 (12) MVLBC 7/21/20
11 Mid 8.5 3.1 25.2 0.8 1.7 4.3 595.7 MVLBC
7/21/2011
Bottom 8.5 3.1 12.5 2.1 1.6 3.6 3955.9 MVLBC 7/21/20
11 Surface 2.0 3.1 9.1 0.7 1.6 2.4 500.3 MVLBC
8/24/2011
Surface 7.9 0.8 (0) 7.4 (10) 1.4 (8) 2.4 (0) 5.42 10.5 456.8 (12) MVLBC 8/24/20
11 Mid 7.9 0.8 7.8 1.5 2.4 32.7 444.2 MVLBC
8/24/2011
Bottom 7.9 2.3 18.7 3.8 3.5 3.7 765.9 MVLBC 8/24/20
11 Surface 2.0 0.8 8.9 2.0 2.3 25.5 409.2 MVLBC
10/03/2011
Surface 8.5 1.6 (-100)
7.2 (-2) 1.4 (6) ND 6.25 4.3 347.2 (-11)
MVLBC
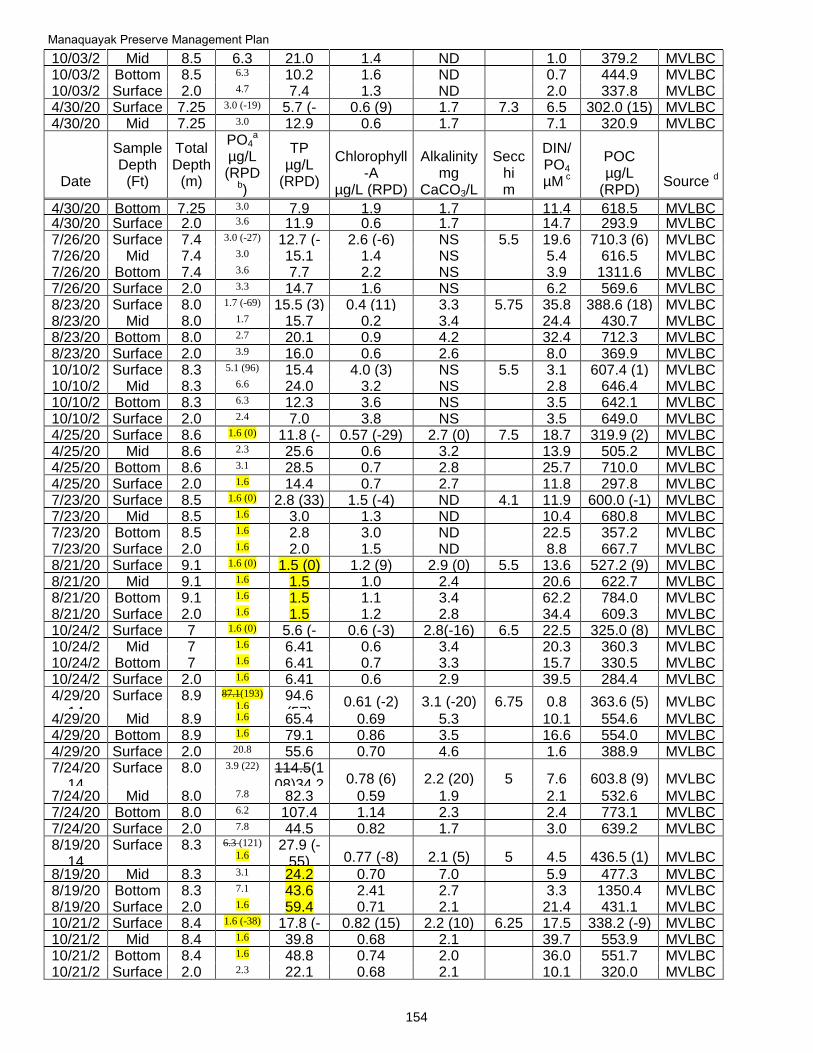
Manaquayak Preserve Management Plan
154
10/03/2011
Mid 8.5 6.3 21.0 1.4 ND 1.0 379.2 MVLBC 10/03/2
011 Bottom 8.5 6.3 10.2 1.6 ND 0.7 444.9 MVLBC
10/03/2011
Surface 2.0 4.7 7.4 1.3 ND 2.0 337.8 MVLBC 4/30/20
12 Surface 7.25 3.0 (-19) 5.7 (-
73) 0.6 (9) 1.7 7.3 6.5 302.0 (15) MVLBC
4/30/2012
Mid 7.25 3.0 12.9 0.6 1.7 7.1 320.9 MVLBC
Date
Sample Depth
(Ft)
Total Depth
(m)
PO4a
µg/L (RPD
b)
TP µg/L
(RPD)
Chlorophyll
-A µg/L (RPD)
Alkalinity
mg CaCO3/L
Secc
hi m
DIN/ PO4
µM c
POC µg/L
(RPD)
Source d
4/30/2012
Bottom 7.25 3.0 7.9 1.9 1.7 11.4 618.5 MVLBC 4/30/20
12 Surface 2.0 3.6 11.9 0.6 1.7 14.7 293.9 MVLBC
7/26/2012
Surface 7.4 3.0 (-27) 12.7 (-17)
2.6 (-6) NS 5.5 19.6 710.3 (6) MVLBC 7/26/20
12 Mid 7.4 3.0 15.1 1.4 NS 5.4 616.5 MVLBC
7/26/2012
Bottom 7.4 3.6 7.7 2.2 NS 3.9 1311.6 MVLBC 7/26/20
12 Surface 2.0 3.3 14.7 1.6 NS 6.2 569.6 MVLBC
8/23/2012
Surface 8.0 1.7 (-69) 15.5 (3) 0.4 (11) 3.3 5.75 35.8 388.6 (18) MVLBC 8/23/20
12 Mid 8.0 1.7 15.7 0.2 3.4 24.4 430.7 MVLBC
8/23/2012
Bottom 8.0 2.7 20.1 0.9 4.2 32.4 712.3 MVLBC 8/23/20
12 Surface 2.0 3.9 16.0 0.6 2.6 8.0 369.9 MVLBC
10/10/2012
Surface 8.3 5.1 (96) 15.4 (70)
4.0 (3) NS 5.5 3.1 607.4 (1) 64
MVLBC 10/10/2
012 Mid 8.3 6.6 24.0 3.2 NS 2.8 646.4 MVLBC
10/10/2012
Bottom 8.3 6.3 12.3 3.6 NS 3.5 642.1 MVLBC 10/10/2
012 Surface 2.0 2.4 7.0 3.8 NS 3.5 649.0 MVLBC
4/25/2013
Surface 8.6 1.6 (0) 11.8 (-13)
0.57 (-29) 2.7 (0) 7.5 18.7 319.9 (2) MVLBC 4/25/20
13 Mid 8.6 2.3 25.6 0.6 3.2 13.9 505.2 MVLBC
4/25/2013
Bottom 8.6 3.1 28.5 0.7 2.8 25.7 710.0 MVLBC 4/25/20
13 Surface 2.0 1.6 14.4 0.7 2.7 11.8 297.8 MVLBC
7/23/2013
Surface 8.5 1.6 (0) 2.8 (33) 1.5 (-4) ND 4.1 11.9 600.0 (-1) MVLBC 7/23/20
13 Mid 8.5 1.6 3.0 1.3 ND 10.4 680.8 MVLBC
7/23/2013
Bottom 8.5 1.6 2.8 3.0 ND 22.5 357.2 MVLBC 7/23/20
13 Surface 2.0 1.6 2.0 1.5 ND 8.8 667.7 MVLBC
8/21/2013
Surface 9.1 1.6 (0) 1.5 (0) 1.2 (9) 2.9 (0) 5.5 13.6 527.2 (9) MVLBC 8/21/20
13 Mid 9.1 1.6 1.5 1.0 2.4 20.6 622.7 MVLBC
8/21/2013
Bottom 9.1 1.6 1.5 1.1 3.4 62.2 784.0 MVLBC 8/21/20
13 Surface 2.0 1.6 1.5 1.2 2.8 34.4 609.3 MVLBC
10/24/2013
Surface 7 1.6 (0) 5.6 (-13)
0.6 (-3) 2.8(-16) 6.5 22.5 325.0 (8) MVLBC 10/24/2
013 Mid 7 1.6 6.41 0.6 3.4 20.3 360.3 MVLBC
10/24/2013
Bottom 7 1.6 6.41 0.7 3.3 15.7 330.5 MVLBC 10/24/2
013 Surface 2.0 1.6 6.41 0.6 2.9 39.5 284.4 MVLBC
4/29/2014
Surface 8.9 87.1(193)
1.6 94.6 (57)
0.61 (-2) 3.1 (-20) 6.75 0.8 363.6 (5) MVLBC
4/29/2014
Mid 8.9 1.6 65.4 0.69 5.3 10.1 554.6 MVLBC 4/29/20
14 Bottom 8.9 1.6 79.1 0.86 3.5 16.6 554.0 MVLBC
4/29/2014
Surface 2.0 20.8 55.6 0.70 4.6 1.6 388.9 MVLBC 7/24/20
14 Surface 8.0 3.9 (22) 114.5(1
08)34.22
0.78 (6) 2.2 (20) 5 7.6 603.8 (9) MVLBC
7/24/2014
Mid 8.0 7.8 82.3 0.59 1.9 2.1 532.6 MVLBC 7/24/20
14 Bottom 8.0 6.2 107.4 1.14 2.3 2.4 773.1 MVLBC
7/24/2014
Surface 2.0 7.8 44.5 0.82 1.7 3.0 639.2 MVLBC 8/19/20
14 Surface 8.3 6.3 (121)
1.6 27.9 (-
55) 0.77 (-8) 2.1 (5) 5 4.5 436.5 (1) MVLBC
8/19/2014
Mid 8.3 3.1 24.2 0.70 7.0 5.9 477.3 MVLBC 8/19/20
14 Bottom 8.3 7.1 43.6 2.41 2.7 3.3 1350.4 MVLBC
8/19/2014
Surface 2.0 1.6 59.4 0.71 2.1 21.4 431.1 MVLBC 10/21/2
014 Surface 8.4 1.6 (-38) 17.8 (-
7) 0.82 (15) 2.2 (10) 6.25 17.5 338.2 (-9) MVLBC
10/21/2014
Mid 8.4 1.6 39.8 0.68 2.1 39.7 553.9 MVLBC 10/21/2
014 Bottom 8.4 1.6 48.8 0.74 2.0 36.0 551.7 MVLBC
10/21/2014
Surface 2.0 2.3 22.1 0.68 2.1 10.1 320.0 MVLBC
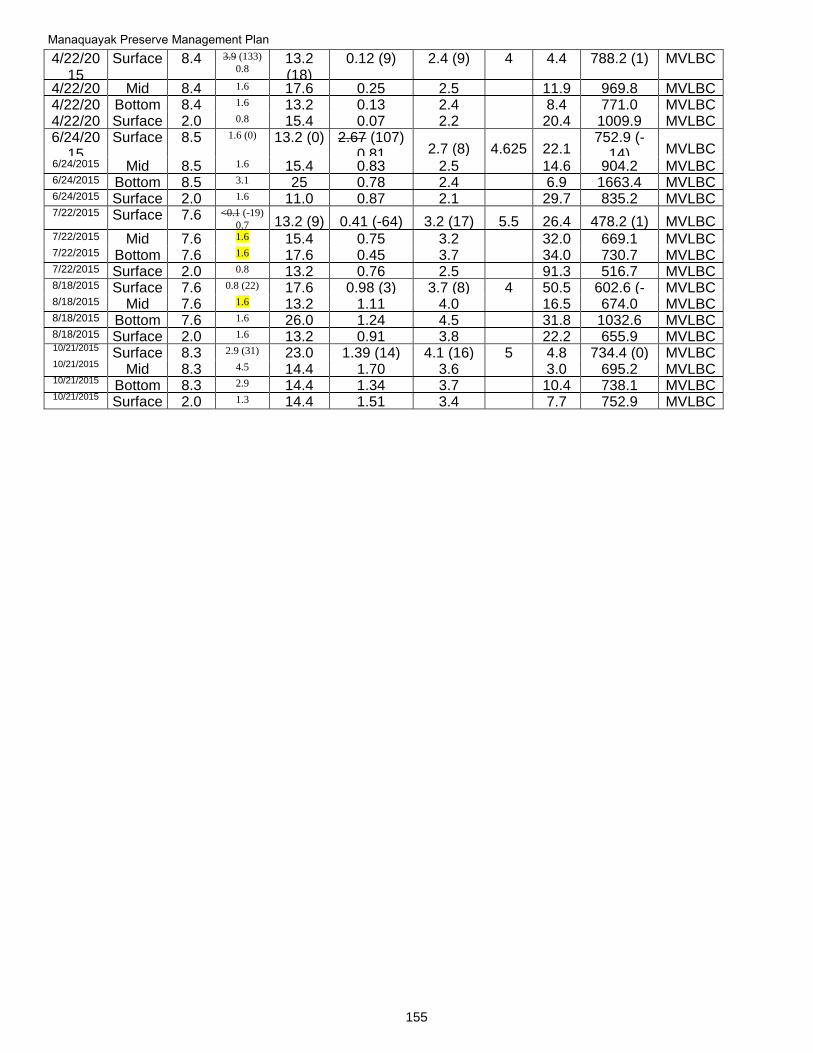
Manaquayak Preserve Management Plan
155
4/22/2015
Surface 8.4 3.9 (133)
0.8 13.2 (18)
0.12 (9) 2.4 (9) 4 4.4 788.2 (1) MVLBC
4/22/2015
Mid 8.4 1.6 17.6 0.25 2.5 11.9 969.8 MVLBC 4/22/20
15 Bottom 8.4 1.6 13.2 0.13 2.4 8.4 771.0 MVLBC
4/22/2015
Surface 2.0 0.8 15.4 0.07 2.2 20.4 1009.9 MVLBC 6/24/20
15 Surface 8.5 1.6 (0) 13.2 (0) 2.67 (107)
0.81
2.7 (8) 4.625 22.1 752.9 (-
14) MVLBC 6/24/2015 Mid 8.5 1.6 15.4 0.83 2.5 14.6 904.2 MVLBC 6/24/2015 Bottom 8.5 3.1 25 0.78 2.4 6.9 1663.4 MVLBC 6/24/2015 Surface 2.0 1.6 11.0 0.87 2.1 29.7 835.2 MVLBC 7/22/2015 Surface 7.6 <0.1 (-19)
0.7 13.2 (9) 0.41 (-64) 3.2 (17) 5.5 26.4 478.2 (1) MVLBC 7/22/2015 Mid 7.6 1.6 15.4 0.75 3.2 32.0 669.1 MVLBC 7/22/2015 Bottom 7.6 1.6 17.6 0.45 3.7 34.0 730.7 MVLBC 7/22/2015 Surface 2.0 0.8 13.2 0.76 2.5 91.3 516.7 MVLBC 8/18/2015 Surface 7.6 0.8 (22) 17.6
(46) 0.98 (3) 3.7 (8) 4 50.5 602.6 (-
12) MVLBC
8/18/2015 Mid 7.6 1.6 13.2 1.11 4.0 16.5 674.0 MVLBC 8/18/2015 Bottom 7.6 1.6 26.0 1.24 4.5 31.8 1032.6 MVLBC 8/18/2015 Surface 2.0 1.6 13.2 0.91 3.8 22.2 655.9 MVLBC 10/21/2015 Surface 8.3 2.9 (31) 23.0
(46) 1.39 (14) 4.1 (16) 5 4.8 734.4 (0) MVLBC
10/21/2015 Mid 8.3 4.5 14.4 1.70 3.6 3.0 695.2 MVLBC 10/21/2015 Bottom 8.3 2.9 14.4 1.34 3.7 10.4 738.1 MVLBC 10/21/2015 Surface 2.0 1.3 14.4 1.51 3.4 7.7 752.9 MVLBC
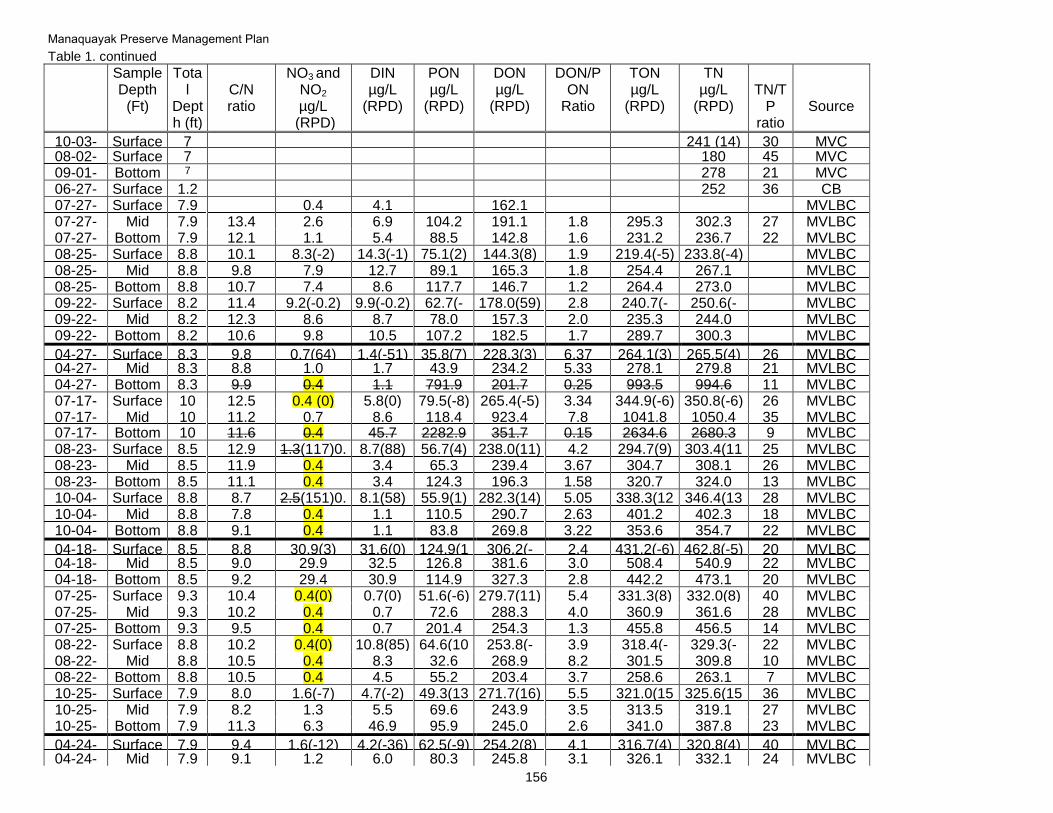
Manaquayak Preserve Management Plan
156
Table 1. continued
Sample Depth
(Ft)
Total
Depth (ft)
C/N ratio
NO3 and NO2
µg/L (RPD)
DIN µg/L
(RPD)
PON µg/L
(RPD)
DON µg/L
(RPD)
DON/PON
Ratio
TON µg/L
(RPD)
TN µg/L
(RPD)
TN/T
P ratio
Source
10-03-02
Surface 7 241 (14) 30 MVC 08-02-
04 Surface 7 180 45 MVC
09-01-04
Bottom 7 278 21 MVC 06-27-
05 Surface 1.2 252 36 CB
07-27-05
Surface 7.9 0.4 4.1 162.1 MVLBC 07-27-
05 Mid 7.9 13.4 2.6 6.9 104.2 191.1 1.8 295.3 302.3 27 MVLBC
07-27-05
Bottom 7.9 12.1 1.1 5.4 88.5 142.8 1.6 231.2 236.7 22 MVLBC 08-25-
05 Surface 8.8 10.1 8.3(-2) 14.3(-1) 75.1(2) 144.3(8) 1.9 219.4(-5) 233.8(-4) MVLBC
08-25-05
Mid 8.8 9.8 7.9 12.7 89.1 165.3 1.8 254.4 267.1 MVLBC 08-25-
05 Bottom 8.8 10.7 7.4 8.6 117.7 146.7 1.2 264.4 273.0 MVLBC
09-22-05
Surface 8.2 11.4 9.2(-0.2) 9.9(-0.2) 62.7(-11)
178.0(59) 2.8 240.7(-49)
250.6(-47)
MVLBC 09-22-
05 Mid 8.2 12.3 8.6 8.7 78.0 157.3 2.0 235.3 244.0 MVLBC
09-22-05
Bottom 8.2 10.6 9.8 10.5 107.2 182.5 1.7 289.7 300.3 MVLBC
04-27-06
Surface 8.3 9.8 0.7(64) 1.4(-51) 35.8(7) 228.3(3) 6.37 264.1(3) 265.5(4) 26 MVLBC 04-27-
06 Mid 8.3 8.8 1.0 1.7 43.9 234.2 5.33 278.1 279.8 21 MVLBC
04-27-06
Bottom 8.3 9.9 0.4 1.1 791.9 201.7 0.25 993.5 994.6 11 MVLBC 07-17-
06 Surface 10 12.5 0.4 (0) 5.8(0) 79.5(-8) 265.4(-5) 3.34 344.9(-6) 350.8(-6) 26 MVLBC
07-17-06
Mid 10 11.2 0.7 8.6 118.4 923.4 7.8 1041.8 1050.4 35 MVLBC 07-17-
06 Bottom 10 11.6 0.4 45.7 2282.9 351.7 0.15 2634.6 2680.3 9 MVLBC
08-23-06
Surface 8.5 12.9 1.3(117)0.35
8.7(88) 56.7(4) 238.0(11) 4.2 294.7(9) 303.4(11)
25 MVLBC 08-23-
06 Mid 8.5 11.9 0.4 3.4 65.3 239.4 3.67 304.7 308.1 26 MVLBC
08-23-06
Bottom 8.5 11.1 0.4 3.4 124.3 196.3 1.58 320.7 324.0 13 MVLBC 10-04-
06 Surface 8.8 8.7 2.5(151)0.
35 8.1(58) 55.9(1) 282.3(14) 5.05 338.3(12
) 346.4(13
) 28 MVLBC
10-04-06
Mid 8.8 7.8 0.4 1.1 110.5 290.7 2.63 401.2 402.3 18 MVLBC 10-04-
06 Bottom 8.8 9.1 0.4 1.1 83.8 269.8 3.22 353.6 354.7 22 MVLBC
04-18-07
Surface 8.5 8.8 30.9(3) 31.6(0) 124.9(15)
306.2(-13)
2.4 431.2(-6) 462.8(-5) 20 MVLBC 04-18-
07 Mid 8.5 9.0 29.9 32.5 126.8 381.6 3.0 508.4 540.9 22 MVLBC
04-18-07
Bottom 8.5 9.2 29.4 30.9 114.9 327.3 2.8 442.2 473.1 20 MVLBC 07-25-
07 Surface 9.3 10.4 0.4(0) 0.7(0) 51.6(-6) 279.7(11) 5.4 331.3(8) 332.0(8) 40 MVLBC
07-25-07
Mid 9.3 10.2 0.4 0.7 72.6 288.3 4.0 360.9 361.6 28 MVLBC 07-25-
07 Bottom 9.3 9.5 0.4 0.7 201.4 254.3 1.3 455.8 456.5 14 MVLBC
08-22-07
Surface 8.8 10.2 0.4(0) 10.8(85) 64.6(10)
253.8(-29)
3.9 318.4(-22)
329.3(-20)
22 MVLBC 08-22-
07 Mid 8.8 10.5 0.4 8.3 32.6 268.9 8.2 301.5 309.8 10 MVLBC
08-22-07
Bottom 8.8 10.5 0.4 4.5 55.2 203.4 3.7 258.6 263.1 7 MVLBC 10-25-
07 Surface 7.9 8.0 1.6(-7) 4.7(-2) 49.3(13
) 271.7(16) 5.5 321.0(15
) 325.6(15
) 36 MVLBC
10-25-07
Mid 7.9 8.2 1.3 5.5 69.6 243.9 3.5 313.5 319.1 27 MVLBC 10-25-
07 Bottom 7.9 11.3 6.3 46.9 95.9 245.0 2.6 341.0 387.8 23 MVLBC
04-24-08
Surface 7.9 9.4 1.6(-12) 4.2(-36) 62.5(-9) 254.2(8) 4.1 316.7(4) 320.8(4) 40 MVLBC 04-24-
08 Mid 7.9 9.1 1.2 6.0 80.3 245.8 3.1 326.1 332.1 24 MVLBC
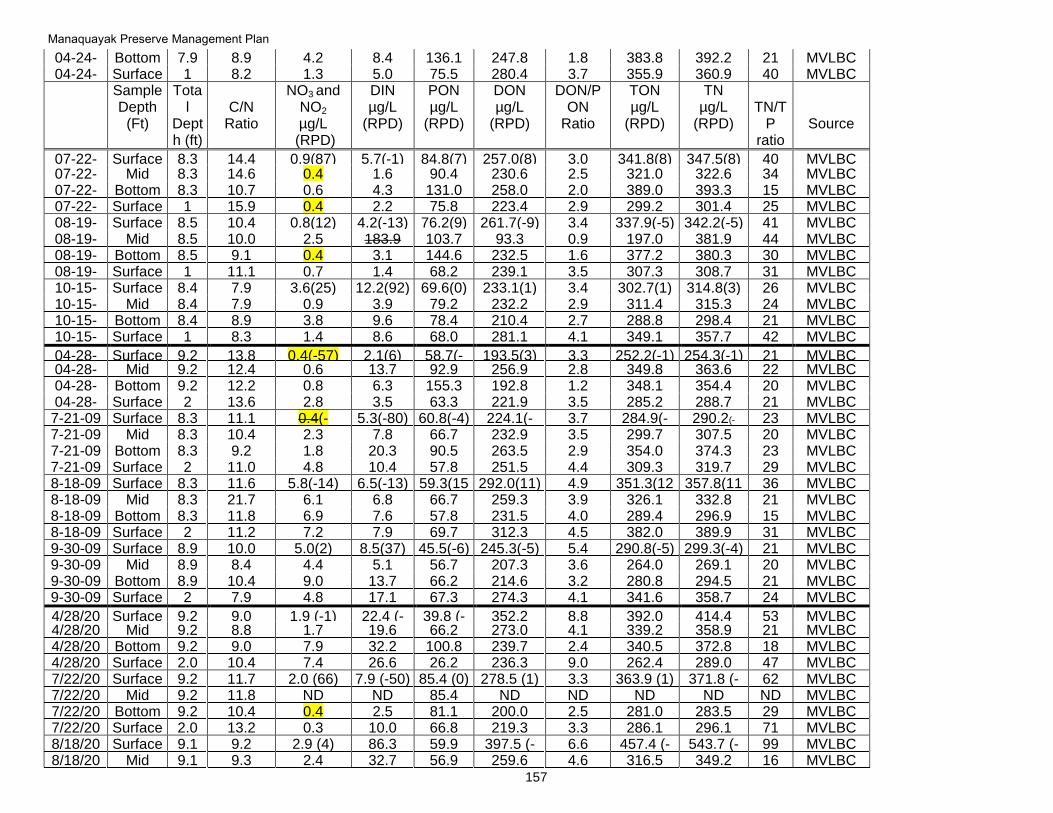
Manaquayak Preserve Management Plan
157
04-24-08
Bottom 7.9 8.9 4.2 8.4 136.1 247.8 1.8 383.8 392.2 21 MVLBC 04-24-
08 Surface 1 8.2 1.3 5.0 75.5 280.4 3.7 355.9 360.9 40 MVLBC
Sample Depth
(Ft)
Total
Depth (ft)
C/N
Ratio
NO3 and NO2
µg/L (RPD)
DIN µg/L
(RPD)
PON µg/L
(RPD)
DON µg/L
(RPD)
DON/PON
Ratio
TON µg/L
(RPD)
TN µg/L
(RPD)
TN/T
P ratio
Source
07-22-08
Surface 8.3 14.4 0.9(87) 5.7(-1) 84.8(7) 257.0(8) 3.0 341.8(8) 347.5(8) 40 MVLBC 07-22-
08 Mid 8.3 14.6 0.4 1.6 90.4 230.6 2.5 321.0 322.6 34 MVLBC
07-22-08
Bottom 8.3 10.7 0.6 4.3 131.0 258.0 2.0 389.0 393.3 15 MVLBC 07-22-
08 Surface 1 15.9 0.4 2.2 75.8 223.4 2.9 299.2 301.4 25 MVLBC
08-19-08
Surface 8.5 10.4 0.8(12) 4.2(-13) 76.2(9) 261.7(-9) 3.4 337.9(-5) 342.2(-5) 41 MVLBC 08-19-
08 Mid 8.5 10.0 2.5 183.9 103.7 93.3 0.9 197.0 381.9 44 MVLBC
08-19-08
Bottom 8.5 9.1 0.4 3.1 144.6 232.5 1.6 377.2 380.3 30 MVLBC 08-19-
08 Surface 1 11.1 0.7 1.4 68.2 239.1 3.5 307.3 308.7 31 MVLBC
10-15-08
Surface 8.4 7.9 3.6(25) 12.2(92) 69.6(0) 233.1(1) 3.4 302.7(1) 314.8(3) 26 MVLBC 10-15-
08 Mid 8.4 7.9 0.9 3.9 79.2 232.2 2.9 311.4 315.3 24 MVLBC
10-15-08
Bottom 8.4 8.9 3.8 9.6 78.4 210.4 2.7 288.8 298.4 21 MVLBC 10-15-
08 Surface 1 8.3 1.4 8.6 68.0 281.1 4.1 349.1 357.7 42 MVLBC
04-28-09
Surface 9.2 13.8 0.4(-57) 2.1(6) 58.7(-14)
193.5(3) 3.3 252.2(-1) 254.3(-1) 21 MVLBC 04-28-
09 Mid 9.2 12.4 0.6 13.7 92.9 256.9 2.8 349.8 363.6 22 MVLBC
04-28-09
Bottom 9.2 12.2 0.8 6.3 155.3 192.8 1.2 348.1 354.4 20 MVLBC 04-28-
09 Surface 2 13.6 2.8 3.5 63.3 221.9 3.5 285.2 288.7 21 MVLBC
7-21-09 Surface 8.3 11.1 0.4(-160)6.2
5.3(-80) 60.8(-4) 224.1(-46)
3.7 284.9(-39)
290.2(-
40) 23 MVLBC
7-21-09 Mid 8.3 10.4 2.3 7.8 66.7 232.9 3.5 299.7 307.5 20 MVLBC 7-21-09 Bottom 8.3 9.2 1.8 20.3 90.5 263.5 2.9 354.0 374.3 23 MVLBC 7-21-09 Surface 2 11.0 4.8 10.4 57.8 251.5 4.4 309.3 319.7 29 MVLBC 8-18-09 Surface 8.3 11.6 5.8(-14) 6.5(-13) 59.3(15
) 292.0(11) 4.9 351.3(12
) 357.8(11
) 36 MVLBC
8-18-09 Mid 8.3 21.7 6.1 6.8 66.7 259.3 3.9 326.1 332.8 21 MVLBC 8-18-09 Bottom 8.3 11.8 6.9 7.6 57.8 231.5 4.0 289.4 296.9 15 MVLBC 8-18-09 Surface 2 11.2 7.2 7.9 69.7 312.3 4.5 382.0 389.9 31 MVLBC 9-30-09 Surface 8.9 10.0 5.0(2) 8.5(37) 45.5(-6) 245.3(-5) 5.4 290.8(-5) 299.3(-4) 21 MVLBC 9-30-09 Mid 8.9 8.4 4.4 5.1 56.7 207.3 3.6 264.0 269.1 20 MVLBC 9-30-09 Bottom 8.9 10.4 9.0 13.7 66.2 214.6 3.2 280.8 294.5 21 MVLBC 9-30-09 Surface 2 7.9 4.8 17.1 67.3 274.3 4.1 341.6 358.7 24 MVLBC
4/28/2010
Surface 9.2 9.0 1.9 (-1) 22.4 (-11)
39.8 (-4)
352.2 (28)
8.8 392.0 (25)
414.4 (22)
53 MVLBC 4/28/20
10 Mid 9.2 8.8 1.7 19.6 66.2 273.0 4.1 339.2 358.9 21 MVLBC
4/28/2010
Bottom 9.2 9.0 7.9 32.2 100.8 239.7 2.4 340.5 372.8 18 MVLBC 4/28/20
10 Surface 2.0 10.4 7.4 26.6 26.2 236.3 9.0 262.4 289.0 47 MVLBC
7/22/2010
Surface 9.2 11.7 2.0 (66) 7.9 (-50) 85.4 (0) 278.5 (1) 3.3 363.9 (1) 371.8 (-1)
62 MVLBC 7/22/20
10 Mid 9.2 11.8 ND ND 85.4 ND ND ND ND ND MVLBC
7/22/2010
Bottom 9.2 10.4 0.4 2.5 81.1 200.0 2.5 281.0 283.5 29 MVLBC 7/22/20
10 Surface 2.0 13.2 0.3 10.0 66.8 219.3 3.3 286.1 296.1 71 MVLBC
8/18/2010
Surface 9.1 9.2 2.9 (4) 86.3 (94)
59.9 (10)
397.5 (-22)
6.6 457.4 (-19)
543.7 (-7)
99 MVLBC 8/18/20
10 Mid 9.1 9.3 2.4 32.7 56.9 259.6 4.6 316.5 349.2 16 MVLBC
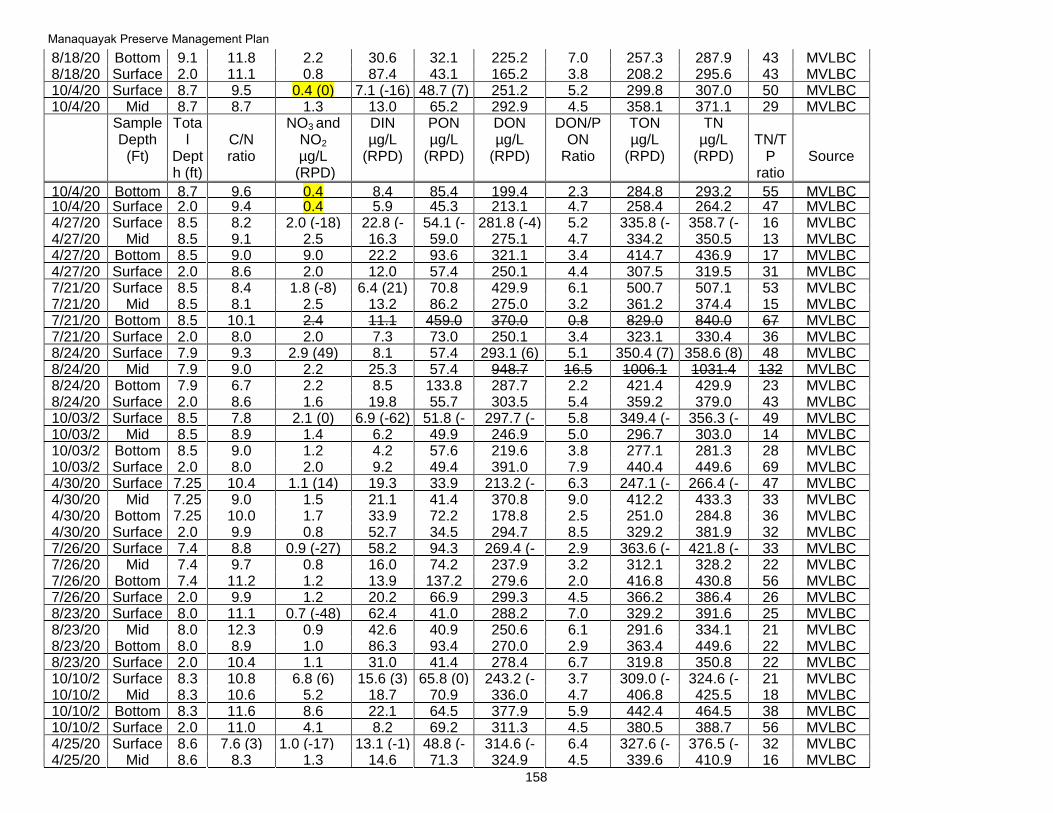
Manaquayak Preserve Management Plan
158
8/18/2010
Bottom 9.1 11.8 2.2 30.6 32.1 225.2 7.0 257.3 287.9 43 MVLBC 8/18/20
10 Surface 2.0 11.1 0.8 87.4 43.1 165.2 3.8 208.2 295.6 43 MVLBC
10/4/2010
Surface 8.7 9.5 0.4 (0) 7.1 (-16) 48.7 (7) 251.2 (12)
5.2 299.8 (11)
307.0 (11)
50 MVLBC 10/4/20
10 Mid 8.7 8.7 1.3 13.0 65.2 292.9 4.5 358.1 371.1 29 MVLBC
Sample Depth
(Ft)
Total
Depth (ft)
C/N ratio
NO3 and NO2
µg/L (RPD)
DIN µg/L
(RPD)
PON µg/L
(RPD)
DON µg/L
(RPD)
DON/PON
Ratio
TON µg/L
(RPD)
TN µg/L
(RPD)
TN/T
P ratio
Source
10/4/2010
Bottom 8.7 9.6 0.4 8.4 85.4 199.4 2.3 284.8 293.2 55 MVLBC 10/4/20
10 Surface 2.0 9.4 0.4 5.9 45.3 213.1 4.7 258.4 264.2 47 MVLBC
4/27/2011
Surface 8.5 8.2 2.0 (-18) 22.8 (-40)
54.1 (-3)
281.8 (-4) 5.2 335.8 (-4)
358.7 (-7)
16 MVLBC 4/27/20
11 Mid 8.5 9.1 2.5 16.3 59.0 275.1 4.7 334.2 350.5 13 MVLBC
4/27/2011
Bottom 8.5 9.0 9.0 22.2 93.6 321.1 3.4 414.7 436.9 17 MVLBC 4/27/20
11 Surface 2.0 8.6 2.0 12.0 57.4 250.1 4.4 307.5 319.5 31 MVLBC
7/21/2011
Surface 8.5 8.4 1.8 (-8) 6.4 (21) 70.8 (12)
429.9 (43)
6.1 500.7 (38)
507.1 (38)
53 MVLBC 7/21/20
11 Mid 8.5 8.1 2.5 13.2 86.2 275.0 3.2 361.2 374.4 15 MVLBC
7/21/2011
Bottom 8.5 10.1 2.4 11.1 459.0 370.0 0.8 829.0 840.0 67 MVLBC 7/21/20
11 Surface 2.0 8.0 2.0 7.3 73.0 250.1 3.4 323.1 330.4 36 MVLBC
8/24/2011
Surface 7.9 9.3 2.9 (49) 8.1 (107)
57.4 (10)
293.1 (6) 5.1 350.4 (7) 358.6 (8) 48 MVLBC 8/24/20
11 Mid 7.9 9.0 2.2 25.3
57.4 948.7 16.5 1006.1 1031.4 132 MVLBC
8/24/2011
Bottom 7.9 6.7 2.2 8.5 133.8 287.7 2.2 421.4 429.9 23 MVLBC 8/24/20
11 Surface 2.0 8.6 1.6 19.8 55.7 303.5 5.4 359.2 379.0 43 MVLBC
10/03/2011
Surface 8.5 7.8 2.1 (0) 6.9 (-62) 51.8 (-9)
297.7 (-41)
5.8 349.4 (-37)
356.3 (-38)
49 MVLBC 10/03/2
011 Mid 8.5 8.9 1.4 6.2 49.9 246.9 5.0 296.7 303.0 14 MVLBC
10/03/2011
Bottom 8.5 9.0 1.2 4.2 57.6 219.6 3.8 277.1 281.3 28 MVLBC 10/03/2
011 Surface 2.0 8.0 2.0 9.2 49.4 391.0 7.9 440.4 449.6 69 MVLBC
4/30/2012
Surface 7.25 10.4 1.1 (14) 19.3 (57)
33.9 (15)
213.2 (-11)
6.3 247.1 (-8)
266.4 (-5)
47 MVLBC 4/30/20
12 Mid 7.25 9.0 1.5 21.1 41.4 370.8 9.0 412.2 433.3 33 MVLBC
4/30/2012
Bottom 7.25 10.0 1.7 33.9 72.2 178.8 2.5 251.0 284.8 36 MVLBC 4/30/20
12 Surface 2.0 9.9 0.8 52.7 34.5 294.7 8.5 329.2 381.9 32 MVLBC
7/26/2012
Surface 7.4 8.8 0.9 (-27) 58.2 (97)
94.3 (10)
269.4 (-19)
2.9 363.6 (-12)
421.8 (-2)
33 MVLBC 7/26/20
12 Mid 7.4 9.7 0.8 16.0 74.2 237.9 3.2 312.1 328.2 22 MVLBC
7/26/2012
Bottom 7.4 11.2 1.2 13.9 137.2 279.6 2.0 416.8 430.8 56 MVLBC 7/26/20
12 Surface 2.0 9.9 1.2 20.2 66.9 299.3 4.5 366.2 386.4 26 MVLBC
8/23/2012
Surface 8.0 11.1 0.7 (-48) 62.4 (51)
41.0 (15)
288.2 (11)
7.0 329.2 (11)
391.6 (17)
25 MVLBC 8/23/20
12 Mid 8.0 12.3 0.9 42.6 40.9 250.6 6.1 291.6 334.1 21 MVLBC
8/23/2012
Bottom 8.0 8.9 1.0 86.3 93.4 270.0 2.9 363.4 449.6 22 MVLBC 8/23/20
12 Surface 2.0 10.4 1.1 31.0 41.4 278.4 6.7 319.8 350.8 22 MVLBC
10/10/2012
Surface 8.3 10.8 6.8 (6) 15.6 (3) 65.8 (0) 243.2 (-17)
3.7 309.0 (-13)
324.6 (-13)
21 MVLBC 10/10/2
012 Mid 8.3 10.6 5.2 18.7 70.9 336.0 4.7 406.8 425.5 18 MVLBC
10/10/2012
Bottom 8.3 11.6 8.6 22.1 64.5 377.9 5.9 442.4 464.5 38 MVLBC 10/10/2
012 Surface 2.0 11.0 4.1 8.2 69.2 311.3 4.5 380.5 388.7 56 MVLBC
4/25/2013
Surface 8.6 7.6 (3) 1.0 (-17) 13.1 (-1) 48.8 (-1)
314.6 (-17)
6.4 327.6 (-16)
376.5 (-14)
32 MVLBC 4/25/20
13 Mid 8.6 8.3 1.3 14.6 71.3 324.9 4.5 339.6 410.9 16 MVLBC
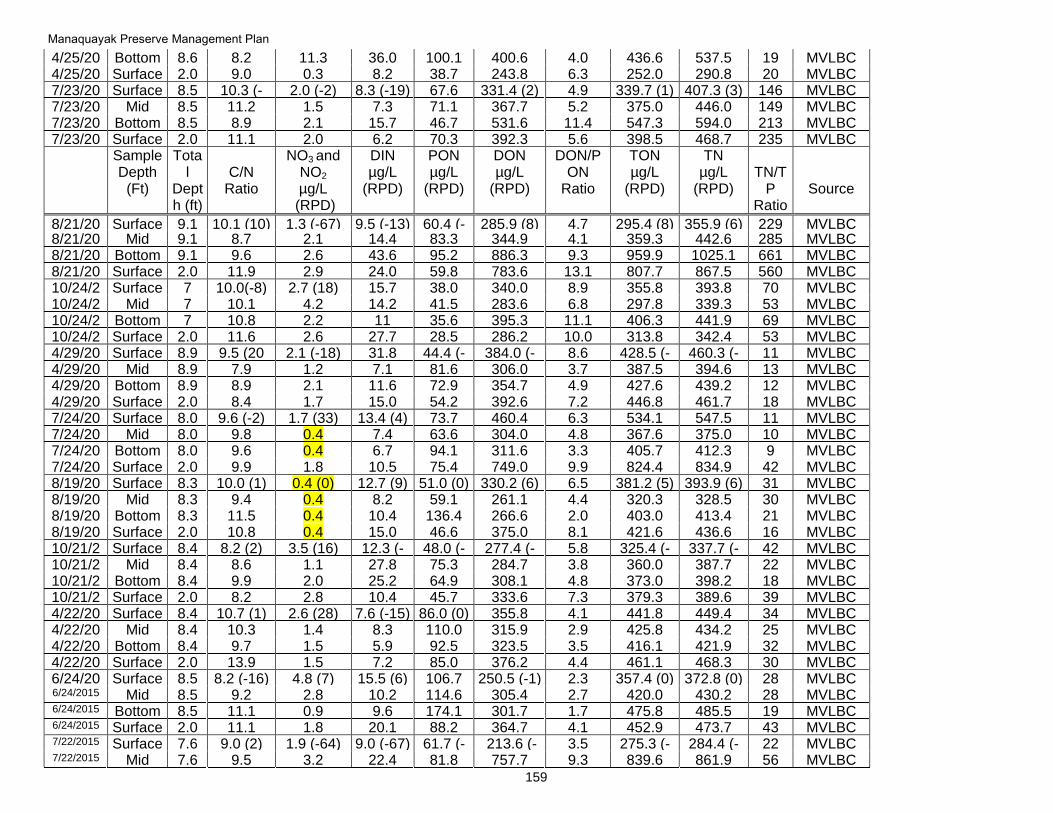
Manaquayak Preserve Management Plan
159
4/25/2013
Bottom 8.6 8.2 11.3 36.0 100.1 400.6 4.0 436.6 537.5 19 MVLBC 4/25/20
13 Surface 2.0 9.0 0.3 8.2 38.7 243.8 6.3 252.0 290.8 20 MVLBC
7/23/2013
Surface 8.5 10.3 (-14)
2.0 (-2) 8.3 (-19) 67.6 (13)
331.4 (2) 4.9 339.7 (1) 407.3 (3) 146 MVLBC 7/23/20
13 Mid 8.5 11.2 1.5 7.3 71.1 367.7 5.2 375.0 446.0 149 MVLBC
7/23/2013
Bottom 8.5 8.9 2.1 15.7 46.7 531.6 11.4 547.3 594.0 213 MVLBC 7/23/20
13 Surface 2.0 11.1 2.0 6.2 70.3 392.3 5.6 398.5 468.7 235 MVLBC
Sample Depth
(Ft)
Total
Depth (ft)
C/N
Ratio
NO3 and NO2
µg/L (RPD)
DIN µg/L
(RPD)
PON µg/L
(RPD)
DON µg/L
(RPD)
DON/PON
Ratio
TON µg/L
(RPD)
TN µg/L
(RPD)
TN/T
P Ratio
Source
8/21/2013
Surface 9.1 10.1 (10) 1.3 (-67) 9.5 (-13) 60.4 (-1)
285.9 (8) 4.7 295.4 (8) 355.9 (6) 229 MVLBC 8/21/20
13 Mid 9.1 8.7 2.1 14.4 83.3 344.9 4.1 359.3 442.6 285 MVLBC
8/21/2013
Bottom 9.1 9.6 2.6 43.6 95.2 886.3 9.3 959.9 1025.1 661 MVLBC 8/21/20
13 Surface 2.0 11.9 2.9 24.0 59.8 783.6 13.1 807.7 867.5 560 MVLBC
10/24/2013
Surface 7 10.0(-8) 2.7 (18) 15.7 (20)
38.0 (16)
340.0 (29)
8.9 355.8 (28)
393.8 (27)
70 MVLBC 10/24/2
013 Mid 7 10.1 4.2 14.2 41.5 283.6 6.8 297.8 339.3 53 MVLBC
10/24/2013
Bottom 7 10.8 2.2 11 35.6 395.3 11.1 406.3 441.9 69 MVLBC 10/24/2
013 Surface 2.0 11.6 2.6 27.7 28.5 286.2 10.0 313.8 342.4 53 MVLBC
4/29/2014
Surface 8.9 9.5 (20 )
2.1 (-18) 31.8 (90)
44.4 (-15)
384.0 (-15)
8.6 428.5 (-15)
460.3 (-10)
11 MVLBC 4/29/20
14 Mid 8.9 7.9 1.2 7.1 81.6 306.0 3.7 387.5 394.6 13 MVLBC
4/29/2014
Bottom 8.9 8.9 2.1 11.6 72.9 354.7 4.9 427.6 439.2 12 MVLBC 4/29/20
14 Surface 2.0 8.4 1.7 15.0 54.2 392.6 7.2 446.8 461.7 18 MVLBC
7/24/2014
Surface 8.0 9.6 (-2) 1.7 (33) 13.4 (4) 73.7 (11)
460.4 (11)
6.3 534.1 (11)
547.5 (11)
11 MVLBC 7/24/20
14 Mid 8.0 9.8 0.4 7.4 63.6 304.0 4.8 367.6 375.0 10 MVLBC
7/24/2014
Bottom 8.0 9.6 0.4 6.7 94.1 311.6 3.3 405.7 412.3 9 MVLBC 7/24/20
14 Surface 2.0 9.9 1.8 10.5 75.4 749.0 9.9 824.4 834.9 42 MVLBC
8/19/2014
Surface 8.3 10.0 (1) 0.4 (0) 12.7 (9) 51.0 (0) 330.2 (6) 6.5 381.2 (5) 393.9 (6) 31 MVLBC 8/19/20
14 Mid 8.3 9.4 0.4 8.2 59.1 261.1 4.4 320.3 328.5 30 MVLBC
8/19/2014
Bottom 8.3 11.5 0.4 10.4 136.4 266.6 2.0 403.0 413.4 21 MVLBC 8/19/20
14 Surface 2.0 10.8 0.4 15.0 46.6 375.0 8.1 421.6 436.6 16 MVLBC
10/21/2014
Surface 8.4 8.2 (2) 3.5 (16) 12.3 (-14)
48.0 (-11)
277.4 (-17)
5.8 325.4 (-16)
337.7 (-16)
42 MVLBC 10/21/2
014 Mid 8.4 8.6 1.1 27.8 75.3 284.7 3.8 360.0 387.7 22 MVLBC
10/21/2014
Bottom 8.4 9.9 2.0 25.2 64.9 308.1 4.8 373.0 398.2 18 MVLBC 10/21/2
014 Surface 2.0 8.2 2.8 10.4 45.7 333.6 7.3 379.3 389.6 39 MVLBC
4/22/2015
Surface 8.4 10.7 (1) 2.6 (28) 7.6 (-15) 86.0 (0) 355.8 (24)
4.1 441.8 (19)
449.4 (18)
34 MVLBC 4/22/20
15 Mid 8.4 10.3 1.4 8.3 110.0 315.9 2.9 425.8 434.2 25 MVLBC
4/22/2015
Bottom 8.4 9.7 1.5 5.9 92.5 323.5 3.5 416.1 421.9 32 MVLBC 4/22/20
15 Surface 2.0 13.9 1.5 7.2 85.0 376.2 4.4 461.1 468.3 30 MVLBC
6/24/2015
Surface 8.5 8.2 (-16) 4.8 (7) 15.5 (6) 106.7 (2)
250.5 (-1) 2.3 357.4 (0) 372.8 (0) 28 MVLBC 6/24/2015 Mid 8.5 9.2 2.8 10.2 114.6 305.4 2.7 420.0 430.2 28 MVLBC 6/24/2015 Bottom 8.5 11.1 0.9 9.6 174.1 301.7 1.7 475.8 485.5 19 MVLBC 6/24/2015 Surface 2.0 11.1 1.8 20.1 88.2 364.7 4.1 452.9 473.7 43 MVLBC 7/22/2015 Surface 7.6 9.0 (2) 1.9 (-64) 9.0 (-67) 61.7 (-
1) 213.6 (-
73) 3.5 275.3 (-
62) 284.4 (-
62) 22 MVLBC
7/22/2015 Mid 7.6 9.5 3.2 22.4 81.8 757.7 9.3 839.6 861.9 56 MVLBC

Manaquayak Preserve Management Plan
160
7/22/2015 Bottom 7.6 9.9 2.0 23.8 86.0 730.6 8.5 816.6 840.4 48 MVLBC 7/22/2015 Surface 2.0 8.4 7.2 31.0 71.8 742.7 10.4 814.5 845.4 64 MVLBC 8/18/2015 Surface 7.6 9.2 (4) 4.6 (41) 17.7
(41) 76.2 (-
16) 668.2 (2) 8.8 744.4 (0) 762.1 (1) 43 MVLBC
8/18/2015 Mid 7.6 9.3 1.6 11.5 84.9 258.2 3.0 343.2 354.7 27 MVLBC 8/18/2015 Bottom 7.6 10.8 3.1 22.3 111.0 693.6 6.2 804.6 826.9 32 MVLBC 8/18/2015 Surface 2.0 8.9 1.2 15.5 86.0 520.4 6.1 606.4 621.9 47 MVLBC 10/21/2015 Surface 8.3 9.8 (6) 5.1 (-13) 6.3 (-13) 87.1 (-
6) 160.8 (-
14) 1.8 247.9 (-
11) 254.2 (-
11) 11 MVLBC
10/21/2015 Mid 8.3 9.6 4.9 6.1 84.9 233.5 2.8 318.4 324.5 23 MVLBC 10/21/2015 Bottom 8.3 10.1 5.8 13.6 84.9 228.4 2.7 313.3 327.0 23 MVLBC 10/21/2015 Surface 2.0 10.0 4.5 4.6 88.2 165.8 1.9 254.0 258.6 18 MVLBC
a TSS = total suspended solids, TDP = total dissolved phosphorus, TP = total phosphorus, POC = particulate organic carbon, C/N = carbon to nitrogen ratio, DIN = dissolved inorganic nitrogen, PON = particulate organic nitrogen, DON = dissolved organic nitrogen, TON, total organic nitrogen, TN = total nitrogen b RPD = relative percent difference (Casella 2002)
cValues that were less than detection were divided by two for use in calculations (i.e., <0.1 uM = 0.05 uM); ND= not detectable; strike through indicates outlier value or RPD was >100%, non-outlier duplicate value was used. dMVLBC = Martha’s Vineyard Land Bank Commission, PA = existing pond association, MVC = William Wilcox and National Park Service Martha’s Vineyard Pond Study 2004 (MVC study: TP-PO4 detection limit = 3 µg/L, DIP- PO4 detection limit = 3 µg/L, TDN-NO3 detection limit = 10 µg/L) and CB = Claire Berger, Duke University
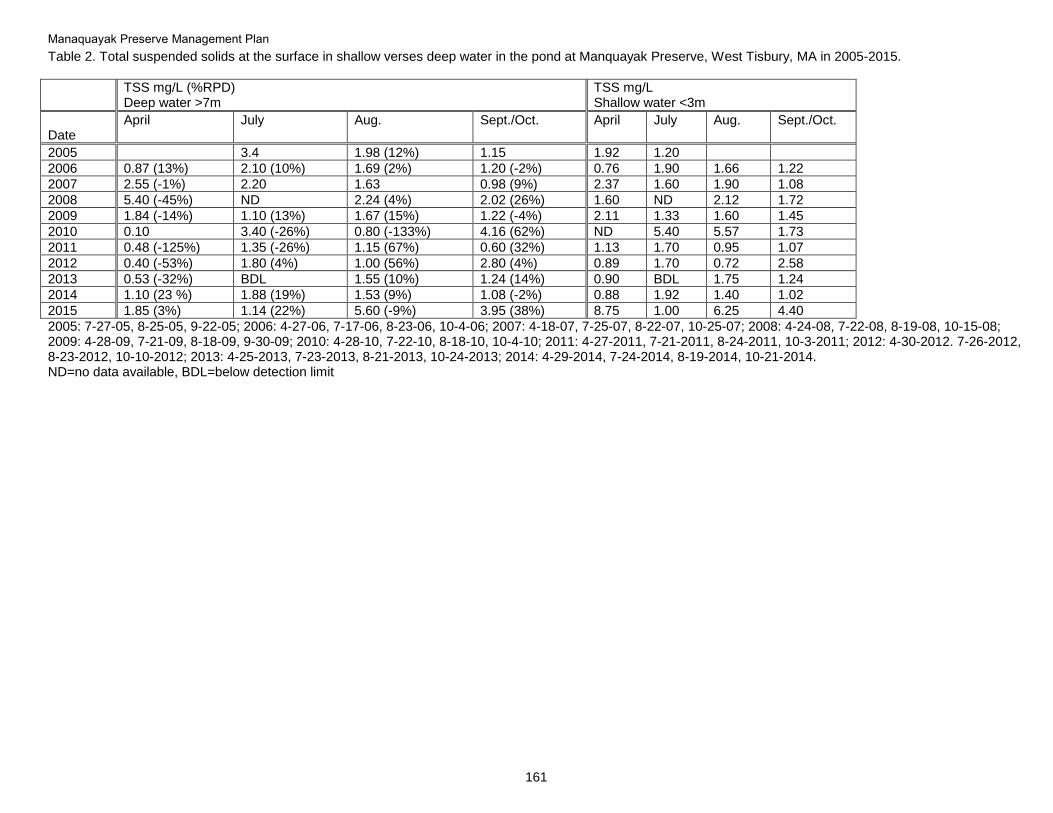
Manaquayak Preserve Management Plan
161
Table 2. Total suspended solids at the surface in shallow verses deep water in the pond at Manquayak Preserve, West Tisbury, MA in 2005-2015.
TSS mg/L (%RPD) Deep water >7m
TSS mg/L Shallow water <3m
Date
April July Aug. Sept./Oct. April July Aug. Sept./Oct.
2005 3.4 1.98 (12%) 1.15 1.92 1.20
2006 0.87 (13%) 2.10 (10%) 1.69 (2%) 1.20 (-2%) 0.76 1.90 1.66 1.22
2007 2.55 (-1%) 2.20 1.63 0.98 (9%) 2.37 1.60 1.90 1.08
2008 5.40 (-45%) ND 2.24 (4%) 2.02 (26%) 1.60 ND 2.12 1.72
2009 1.84 (-14%) 1.10 (13%) 1.67 (15%) 1.22 (-4%) 2.11 1.33 1.60 1.45
2010 0.10 3.40 (-26%) 0.80 (-133%) 4.16 (62%) ND 5.40 5.57 1.73
2011 0.48 (-125%) 1.35 (-26%) 1.15 (67%) 0.60 (32%) 1.13 1.70 0.95 1.07
2012 0.40 (-53%) 1.80 (4%) 1.00 (56%) 2.80 (4%) 0.89 1.70 0.72 2.58
2013 0.53 (-32%) BDL 1.55 (10%) 1.24 (14%) 0.90 BDL 1.75 1.24
2014 1.10 (23 %) 1.88 (19%) 1.53 (9%) 1.08 (-2%) 0.88 1.92 1.40 1.02
2015 1.85 (3%) 1.14 (22%) 5.60 (-9%) 3.95 (38%) 8.75 1.00 6.25 4.40
2005: 7-27-05, 8-25-05, 9-22-05; 2006: 4-27-06, 7-17-06, 8-23-06, 10-4-06; 2007: 4-18-07, 7-25-07, 8-22-07, 10-25-07; 2008: 4-24-08, 7-22-08, 8-19-08, 10-15-08; 2009: 4-28-09, 7-21-09, 8-18-09, 9-30-09; 2010: 4-28-10, 7-22-10, 8-18-10, 10-4-10; 2011: 4-27-2011, 7-21-2011, 8-24-2011, 10-3-2011; 2012: 4-30-2012. 7-26-2012, 8-23-2012, 10-10-2012; 2013: 4-25-2013, 7-23-2013, 8-21-2013, 10-24-2013; 2014: 4-29-2014, 7-24-2014, 8-19-2014, 10-21-2014. ND=no data available, BDL=below detection limit
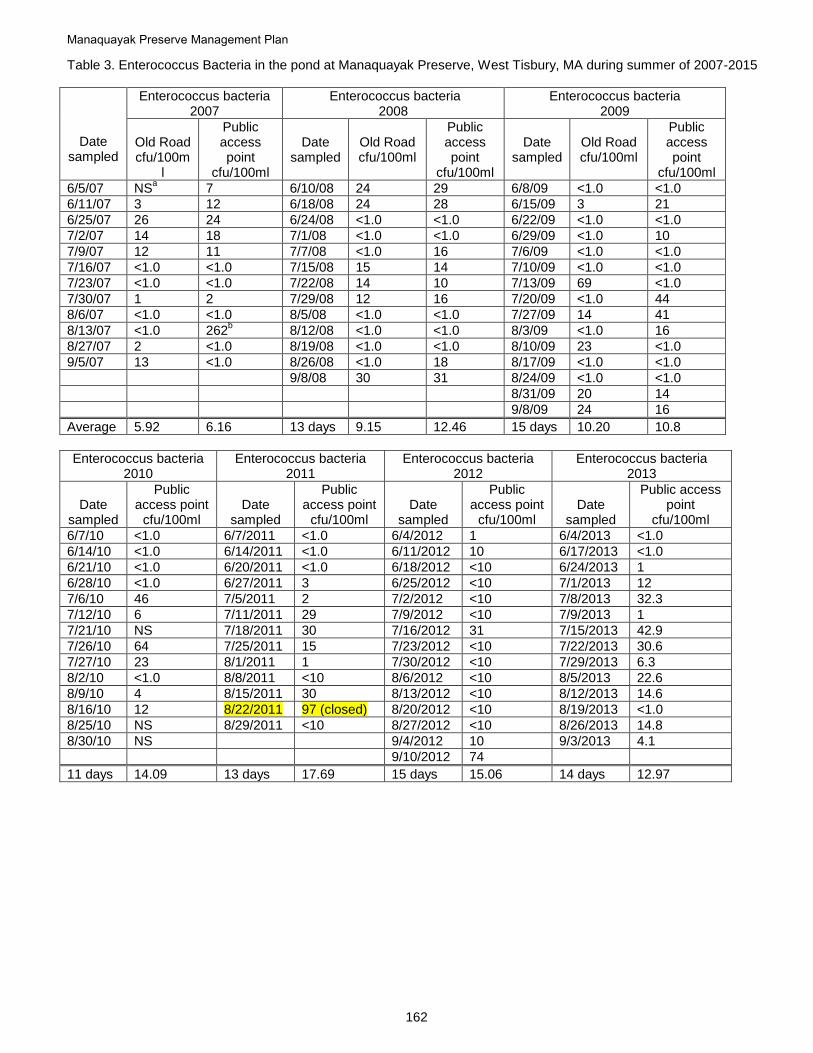
Manaquayak Preserve Management Plan
162
Table 3. Enterococcus Bacteria in the pond at Manaquayak Preserve, West Tisbury, MA during summer of 2007-2015
Date sampled
Enterococcus bacteria 2007
Enterococcus bacteria 2008
Enterococcus bacteria 2009
Old Road cfu/100m
l
Public access point
cfu/100ml
Date
sampled
Old Road cfu/100ml
Public access point
cfu/100ml
Date
sampled
Old Road cfu/100ml
Public access point
cfu/100ml
6/5/07 NSa
7 6/10/08 24 29 6/8/09 <1.0 <1.0
6/11/07 3 12 6/18/08 24 28 6/15/09 3 21
6/25/07 26 24 6/24/08 <1.0 <1.0 6/22/09 <1.0 <1.0
7/2/07 14 18 7/1/08 <1.0 <1.0 6/29/09 <1.0 10
7/9/07 12 11 7/7/08 <1.0 16 7/6/09 <1.0 <1.0
7/16/07 <1.0 <1.0 7/15/08 15 14 7/10/09 <1.0 <1.0
7/23/07 <1.0 <1.0 7/22/08 14 10 7/13/09 69 <1.0
7/30/07 1 2 7/29/08 12 16 7/20/09 <1.0 44
8/6/07 <1.0 <1.0 8/5/08 <1.0 <1.0 7/27/09 14 41
8/13/07 <1.0 262b
8/12/08 <1.0 <1.0 8/3/09 <1.0 16
8/27/07 2 <1.0 8/19/08 <1.0 <1.0 8/10/09 23 <1.0
9/5/07 13 <1.0 8/26/08 <1.0 18 8/17/09 <1.0 <1.0
9/8/08 30 31 8/24/09 <1.0 <1.0
8/31/09 20 14
9/8/09 24 16
Average 5.92 6.16 13 days 9.15 12.46 15 days 10.20 10.8
Enterococcus bacteria 2010
Enterococcus bacteria 2011
Enterococcus bacteria 2012
Enterococcus bacteria 2013
Date
sampled
Public access point
cfu/100ml
Date
sampled
Public access point
cfu/100ml
Date
sampled
Public access point
cfu/100ml
Date
sampled
Public access point
cfu/100ml
6/7/10 <1.0 6/7/2011 <1.0 6/4/2012 1 6/4/2013 <1.0
6/14/10 <1.0 6/14/2011 <1.0 6/11/2012 10 6/17/2013 <1.0
6/21/10 <1.0 6/20/2011 <1.0 6/18/2012 <10 6/24/2013 1
6/28/10 <1.0 6/27/2011 3 6/25/2012 <10 7/1/2013 12
7/6/10 46 7/5/2011 2 7/2/2012 <10 7/8/2013 32.3
7/12/10 6 7/11/2011 29 7/9/2012 <10 7/9/2013 1
7/21/10 NS 7/18/2011 30 7/16/2012 31 7/15/2013 42.9
7/26/10 64 7/25/2011 15 7/23/2012 <10 7/22/2013 30.6
7/27/10 23 8/1/2011 1 7/30/2012 <10 7/29/2013 6.3
8/2/10 <1.0 8/8/2011 <10
8/6/2012
<10
8/5/2013 22.6
8/9/10 4 8/15/2011 30 8/13/2012 <10 8/12/2013 14.6
8/16/10 12 8/22/2011 97 (closed) 8/20/2012 <10 8/19/2013 <1.0
8/25/10 NS 8/29/2011 <10 8/27/2012 <10 8/26/2013 14.8
8/30/10 NS 9/4/2012 10 9/3/2013 4.1
9/10/2012 74
11 days 14.09 13 days 17.69 15 days 15.06 14 days 12.97
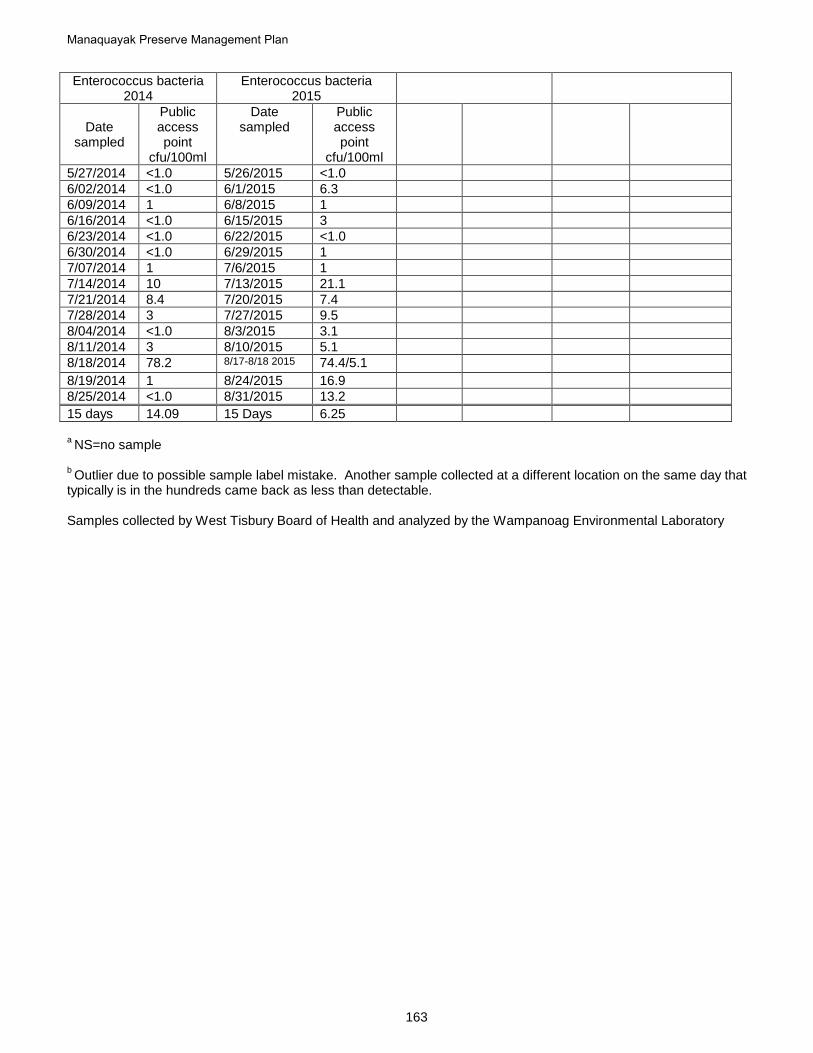
Manaquayak Preserve Management Plan
163
Enterococcus bacteria 2014
Enterococcus bacteria 2015
Date
sampled
Public access point
cfu/100ml
Date sampled
Public access point
cfu/100ml
5/27/2014 <1.0 5/26/2015 <1.0
6/02/2014 <1.0 6/1/2015 6.3
6/09/2014 1 6/8/2015 1
6/16/2014 <1.0 6/15/2015 3
6/23/2014 <1.0 6/22/2015 <1.0
6/30/2014 <1.0 6/29/2015 1
7/07/2014 1 7/6/2015 1
7/14/2014 10 7/13/2015 21.1
7/21/2014 8.4 7/20/2015 7.4
7/28/2014 3 7/27/2015 9.5
8/04/2014 <1.0 8/3/2015 3.1
8/11/2014 3 8/10/2015 5.1
8/18/2014 78.2 8/17-8/18 2015 74.4/5.1
8/19/2014 1 8/24/2015 16.9
8/25/2014 <1.0 8/31/2015 13.2
15 days 14.09 15 Days 6.25
a NS=no sample
b Outlier due to possible sample label mistake. Another sample collected at a different location on the same day that
typically is in the hundreds came back as less than detectable. Samples collected by West Tisbury Board of Health and analyzed by the Wampanoag Environmental Laboratory

Manaquayak Preserve Management Plan
164
Table 4. The 2005-2015 trophic state index (TSI) surface values for the pond at Manaquayak Preserve
Parameters
Trophic State Valuesa Trophic State Values
Trophic State Values
Trophic State Values
Trophic State Values
2005 2006 2007 2008 2009
Apr July Aug Sept. Apr July Aug Oct Apr July Aug Oct Apr July Aug Oct Apr July Aug Sept
Total phosphorus (µg/l) 36 ND ND 37 42 40 41 50 43 36 34 35 35 40 40 41 37 42
Total nitrogen (mg/l) ND 33 34 35 39 37 39 43 38 38 38 39 39 38 35 37 40 37
Chlorophyll-A (µg/l) 43 36 39 24 40 37 30 44 48 37 22 44 35 34 42 41 36 42
Secchi depth (m) 44 42 42 34 46 43 38 43 39 40 40 37 41 44 40 41 36 39 34
Parameters
Trophic State Values
Trophic State Values
Trophic State Values
Trophic State Values
Trophic State Values
2010 2011 2012 2013 2014
Apr July Aug Sept. Apr July Aug Oct Apr July Aug Oct Apr July Aug Oct Apr July Aug Sept
Total phosphorus (µg/l) 34 30 29 31 49 37 33 33 29 41 44 44 40 19 10 29 70 73 52 46
Total nitrogen (mg/l) 42 40 46 37 40 45 40 40 35 42 41 38 40 42 39 41 43 46 41 39
Chlorophyll-A (µg/l) 30 38 15 38 23 29 34 34 26 40 23 44 23 34 33 26 26 28 28 29
Secchi depth (m) 35 41 37 38 38 34 36 33 31 36 36 33 31 37 35 33 33 35 35 34
Parameters
Trophic State Values
Trophic State Values
Trophic State Values
Trophic State Values
Trophic State Values
2015 2016 2017 2018 2019
Apr July Aug Sept. Apr July Aug Oct Apr July Aug Oct Apr July Aug Oct Apr July Aug Sept
Total phosphorus (µg/l) 41 41 45 49
Total nitrogen (mg/l) 43 36 50 35
Chlorophyll-A (µg/l) 10 22 30 34
Secchi depth (m) 40 38 38 38
aTrophic state ranges for three trophic levels: Oligotrophic (30-40); Oligotrophic/mesotrophic (40-45); and mesotrophic (45-50) as described by Kratzer and
Brezonik (1981). Methods used: Water sampling methods follow those included in the Manaquayak Preserve management plan, Appendix I. Water quality samples were sent to the Coastal Systems Program Laboratory, School for Marine Science and Technology (SMAST), University of Massachusetts Dartmouth (SMAST) lab. The SMAST lab analysis and sample handling procedures are described in the SMAST Coastal Systems Analytical Facility Laboratory Quality Assurance Plan (2003) and are approved by the Massachusetts Department of Environmental Protection. The statistical program SYSTAT 11 and Statistix was used to analyze data. The Shapiro-Wilk’s test was used to test for normality. Non-normal data were log transformed or squared to achieve normality prior to analysis. The Levene’s test was used to test for equal variances. Parametric ANOVA tests were used to compare data that were normally distributed and had homogeneous variance. Bonferroni test was used to determine differences among means of parametric data, significant differences are defined with a p<0.05. Non-parametric Kruskal –Wallis and Mann-Whitney U tests were used to compare data that were non-normally distributed and did not have homogeneous variances. Spearman correlations were used to determine the relationship between data sets. Relative percent difference for field duplicate samples was reported. Data was not altered due to relative percent difference of field samples. If the original sample was deemed an outlier the duplicate was used as the alternative value. There were no additional outliers detected in the 2013 sampling set. There are a total of seven outlier samples observed in the eight years of data; two bottom samples in 2006, two middle samples in 2008, one bottom sample in 2009, one bottom sample in 2011 and one middle sample in 2011. Outliers were not included in analysis.
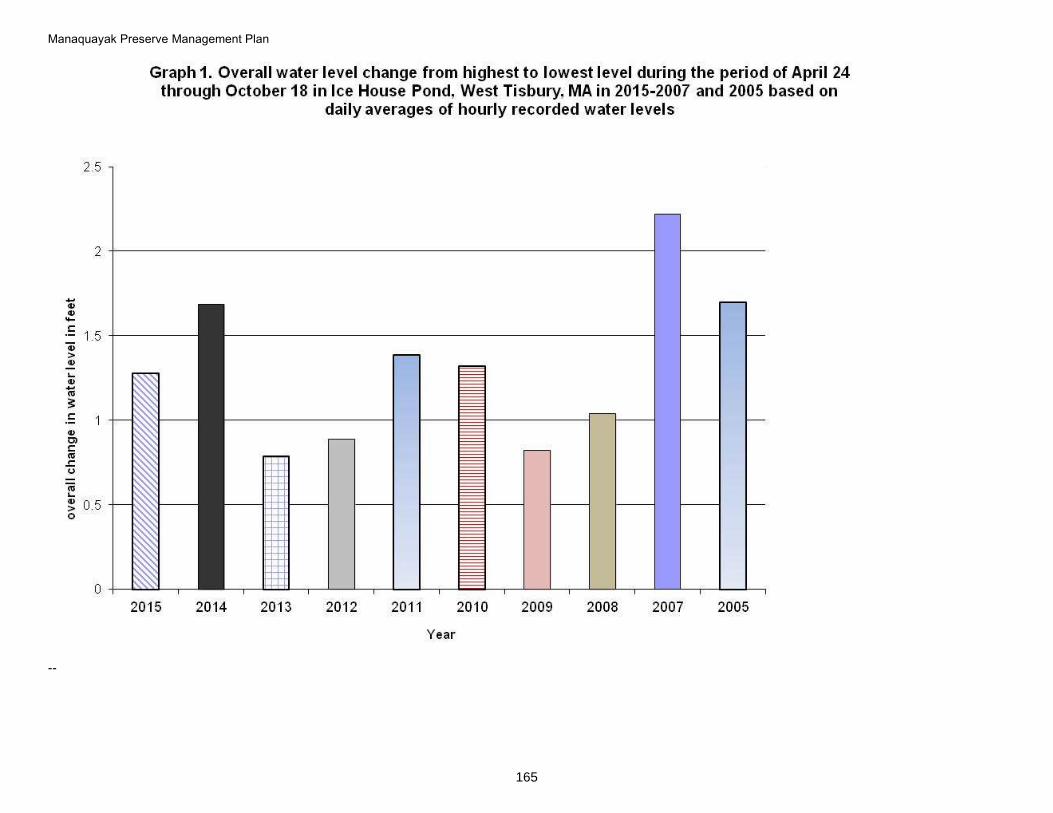
Manaquayak Preserve Management Plan
165
--
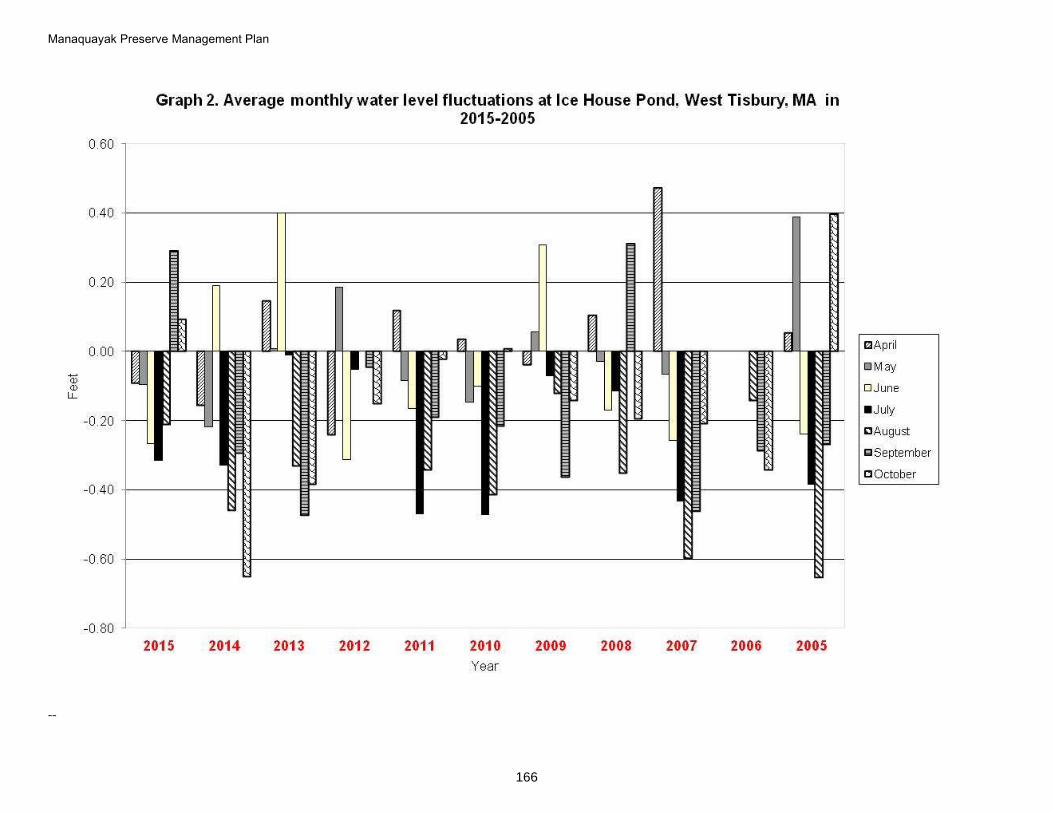
Manaquayak Preserve Management Plan
166
--
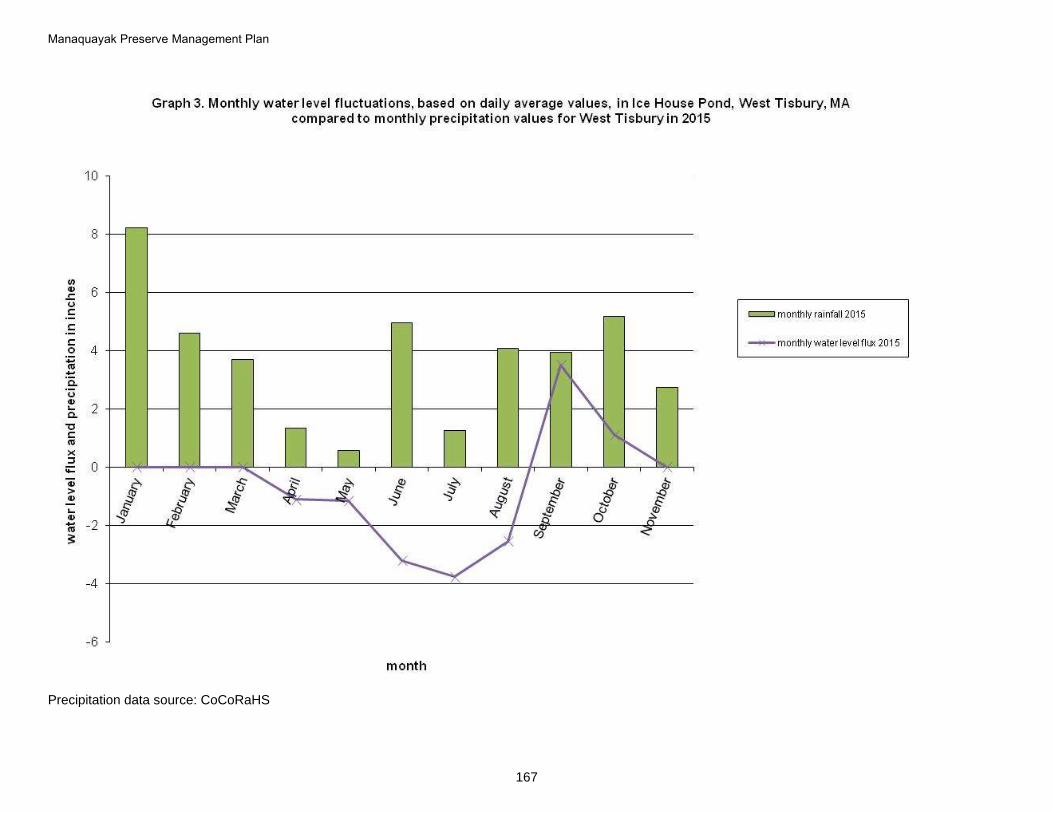
Manaquayak Preserve Management Plan
167
Precipitation data source: CoCoRaHS
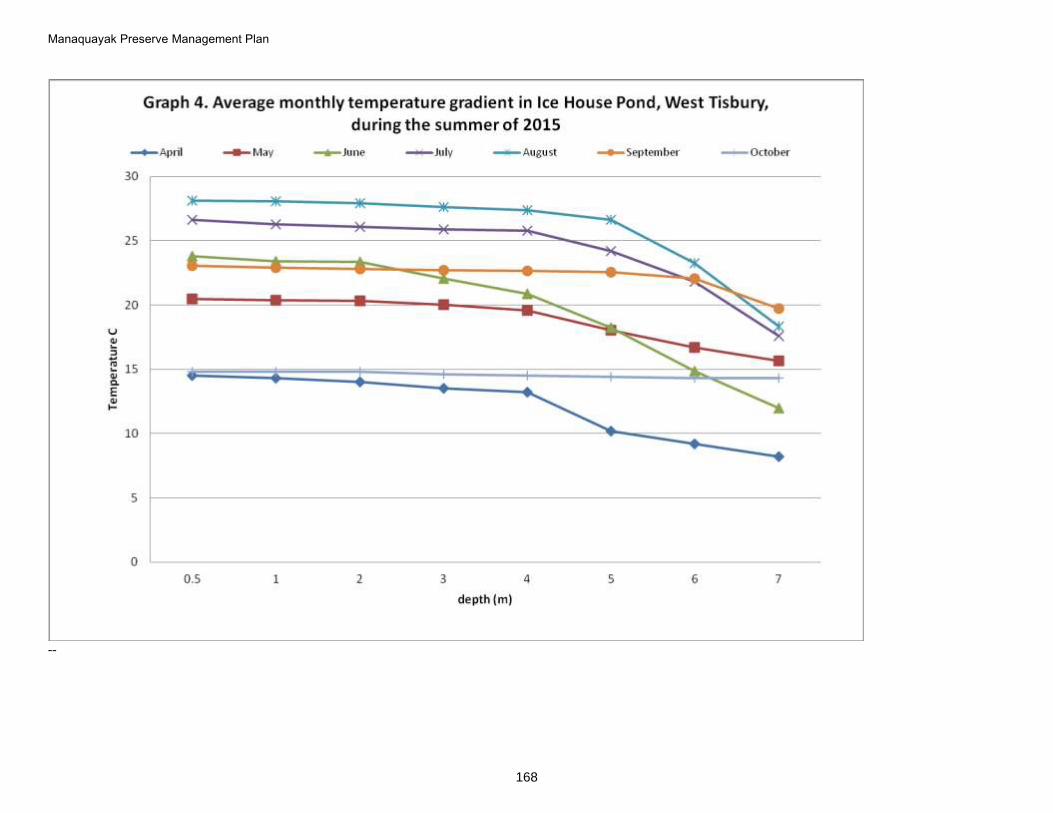
Manaquayak Preserve Management Plan
168
--
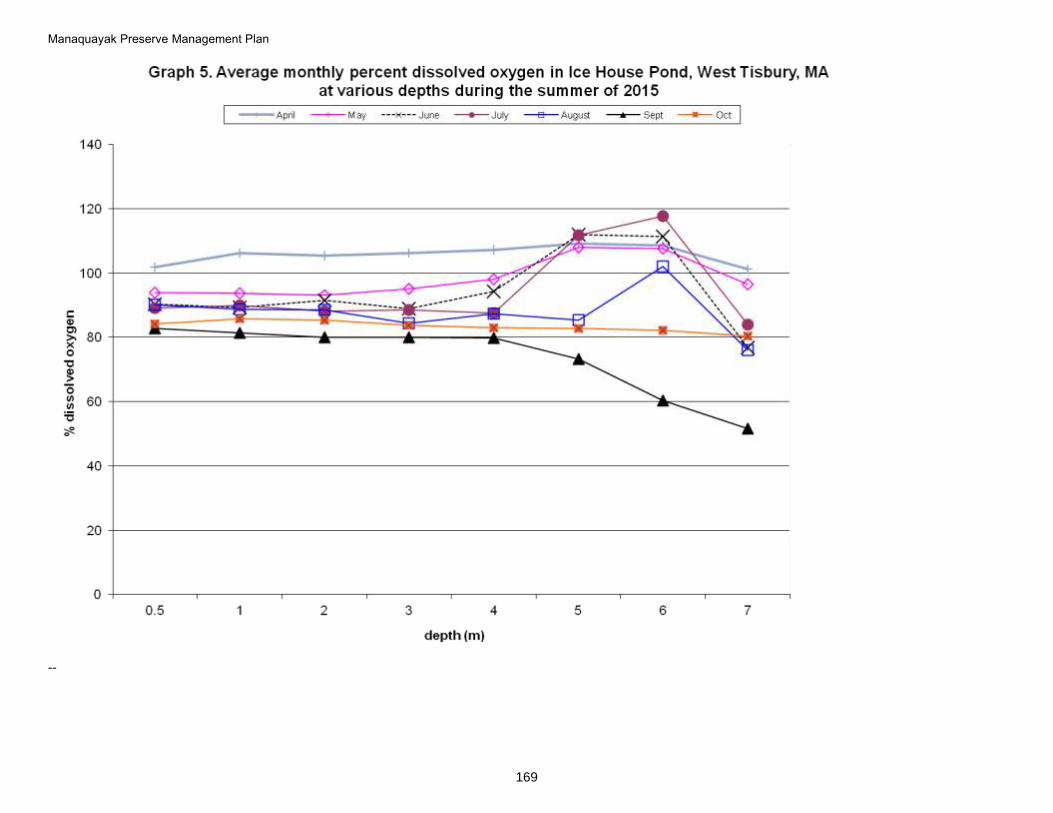
Manaquayak Preserve Management Plan
169
--
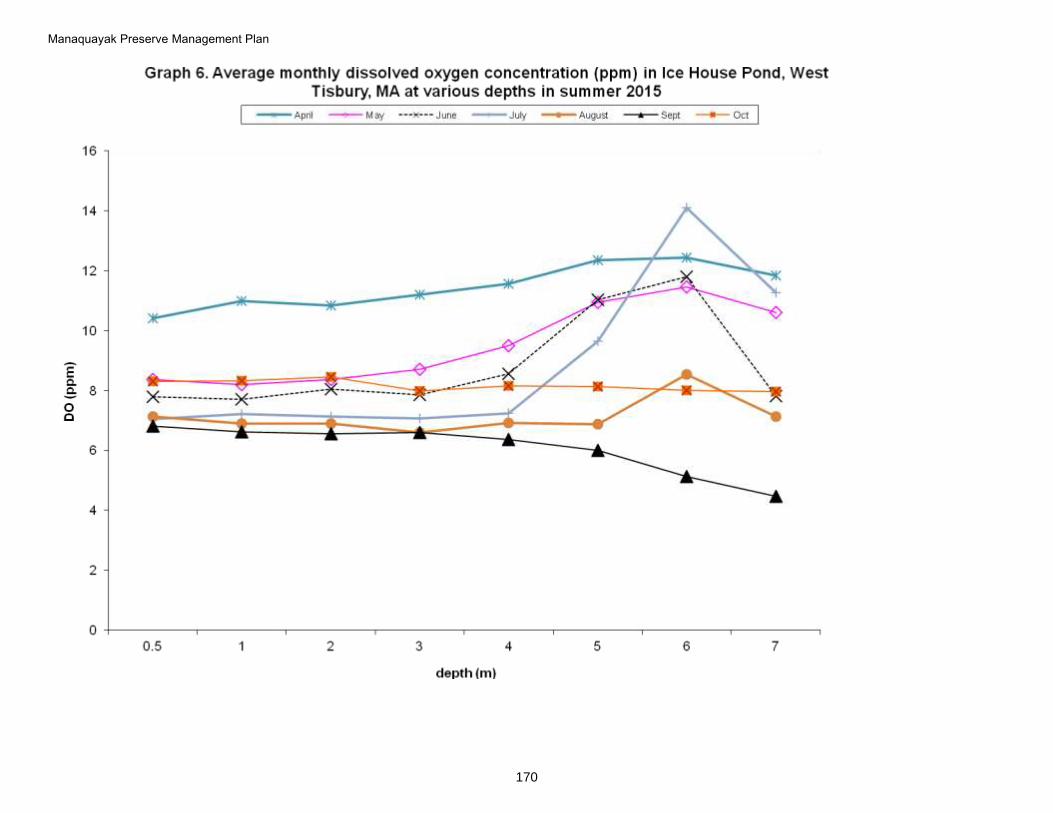
Manaquayak Preserve Management Plan
170
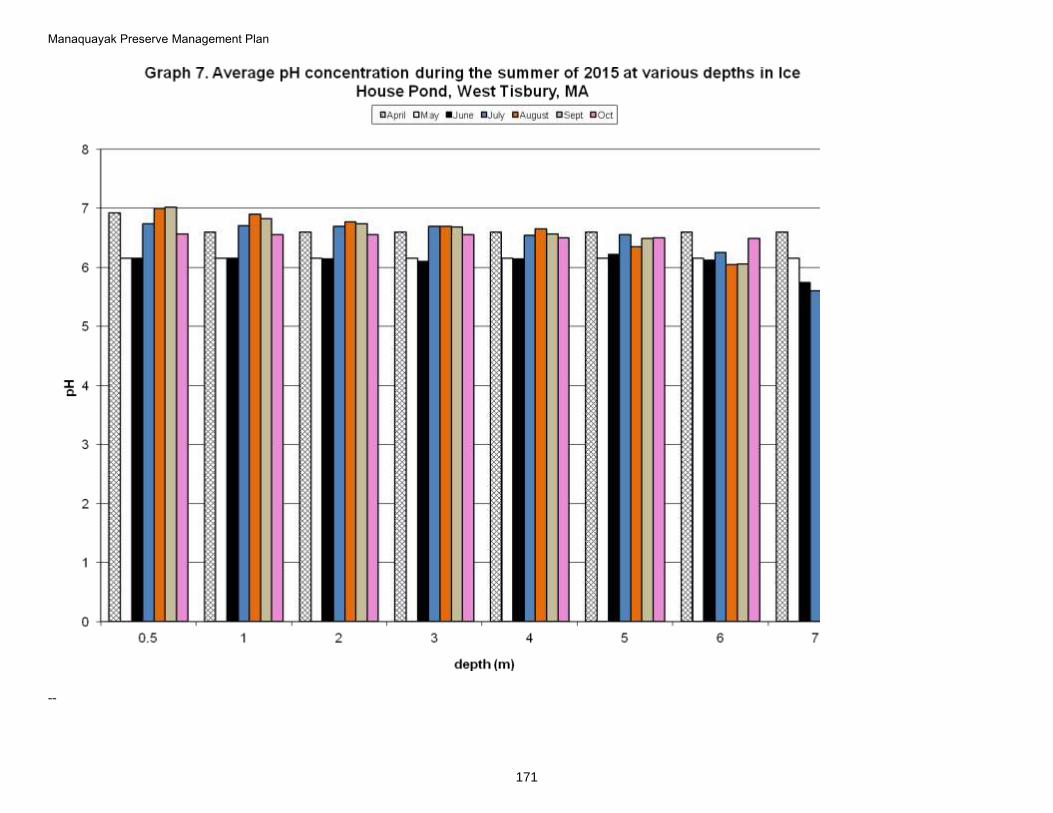
Manaquayak Preserve Management Plan
171
--
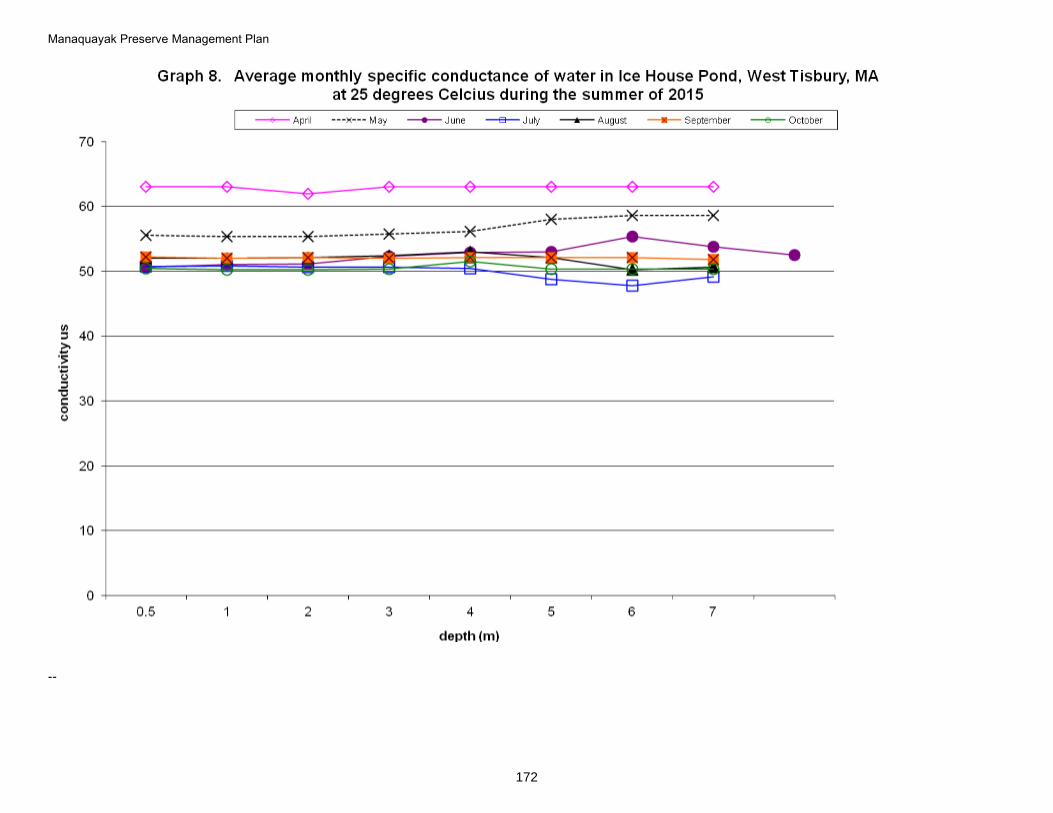
Manaquayak Preserve Management Plan
172
--
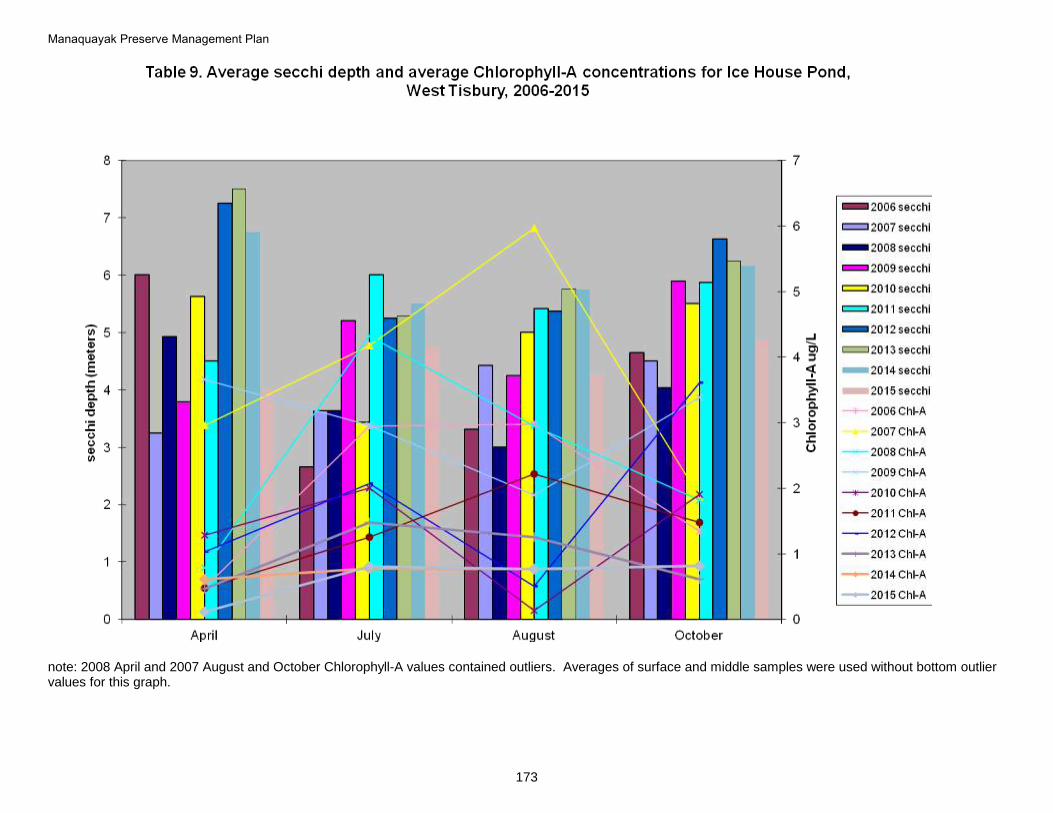
Manaquayak Preserve Management Plan
173
note: 2008 April and 2007 August and October Chlorophyll-A values contained outliers. Averages of surface and middle samples were used without bottom outlier values for this graph.
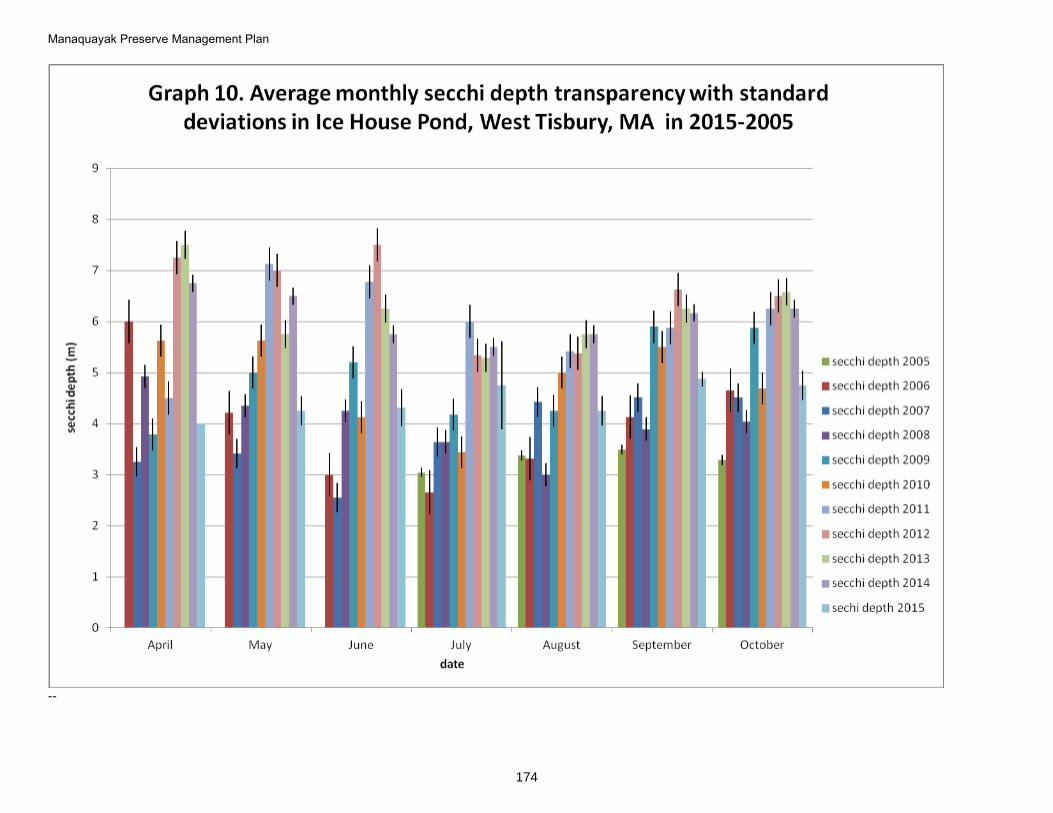
Manaquayak Preserve Management Plan
174
--
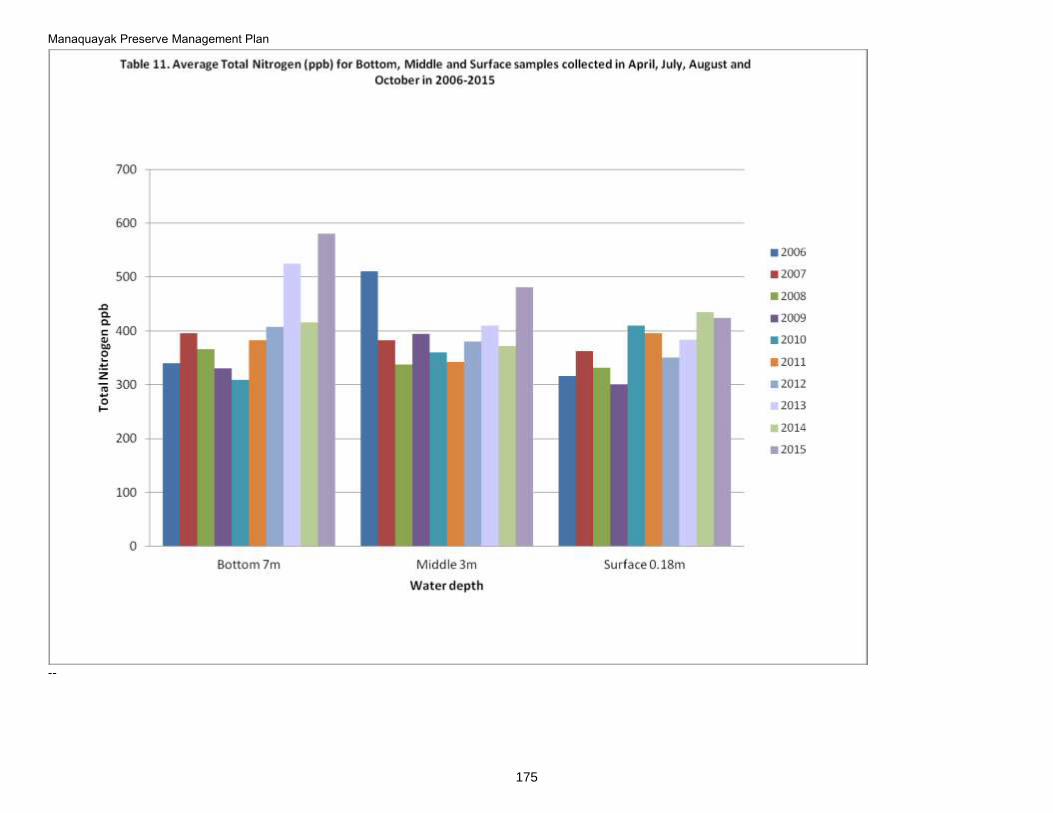
Manaquayak Preserve Management Plan
175
--
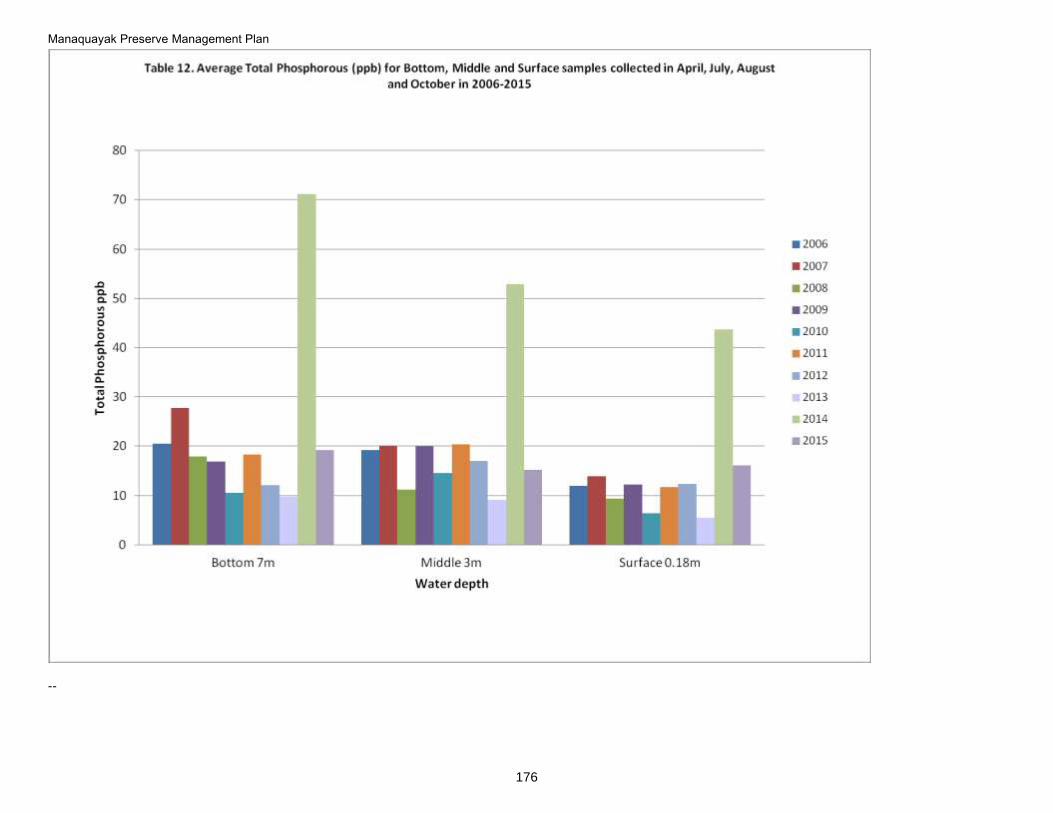
Manaquayak Preserve Management Plan
176
--
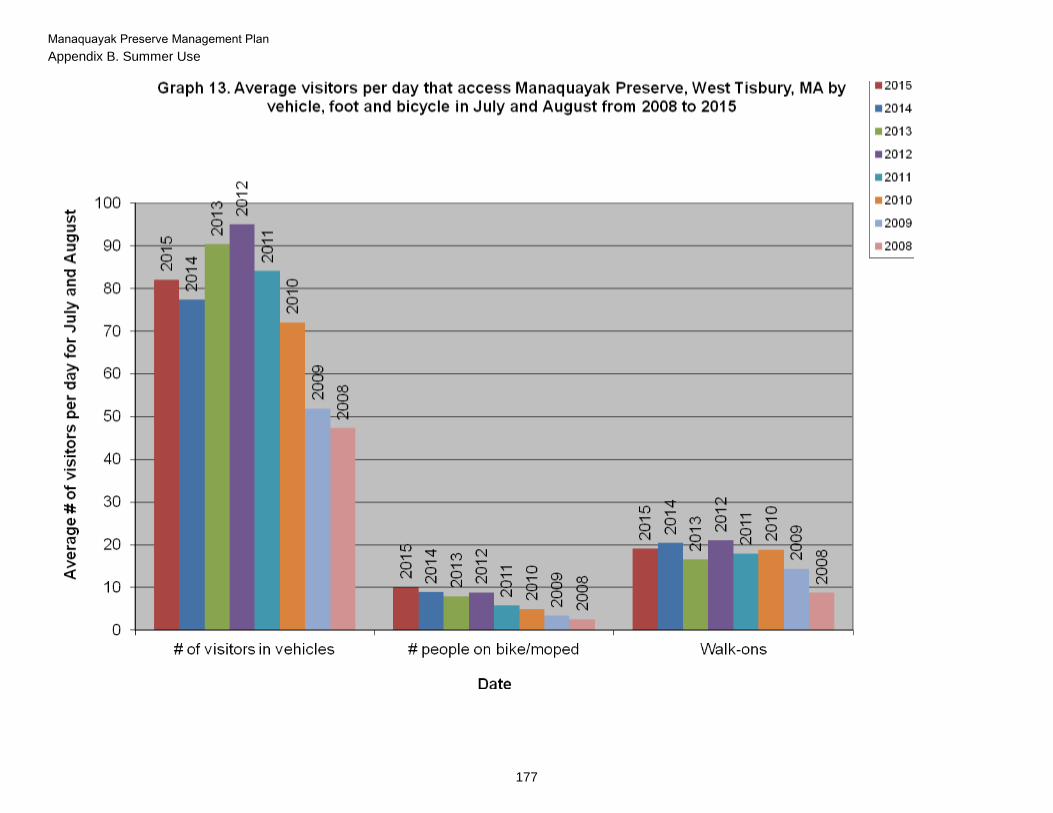
Manaquayak Preserve Management Plan
177
Appendix B. Summer Use
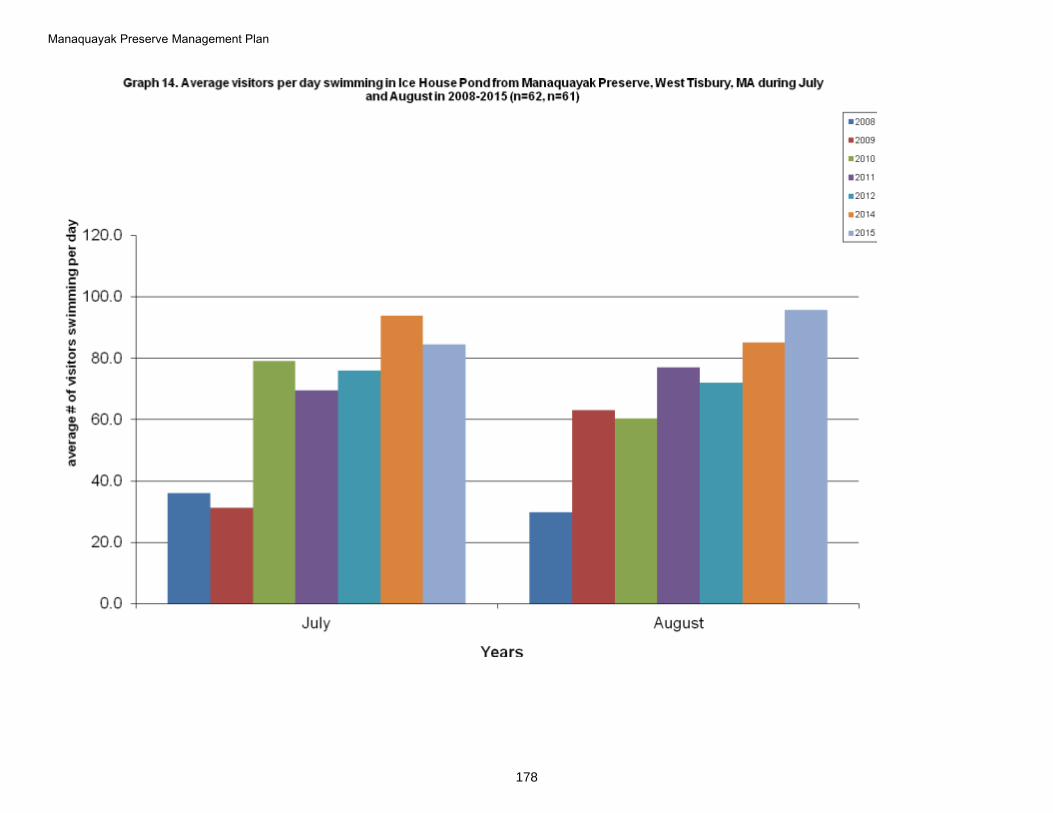
Manaquayak Preserve Management Plan
178
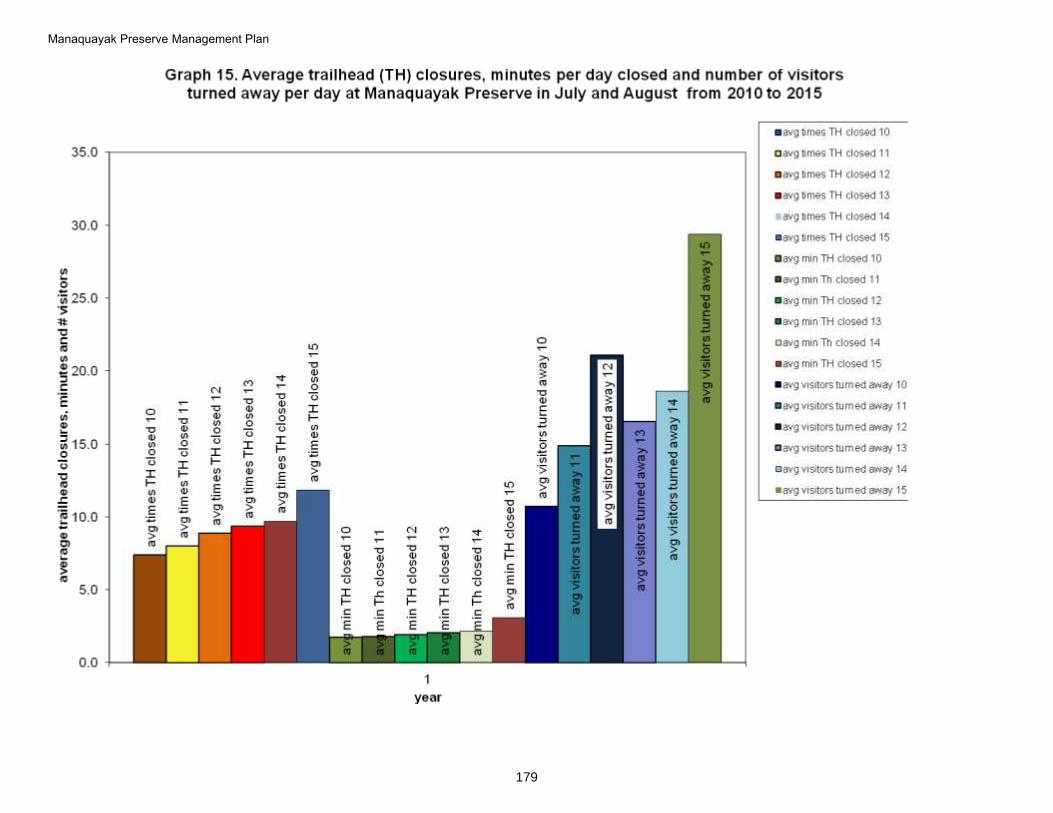
Manaquayak Preserve Management Plan
179
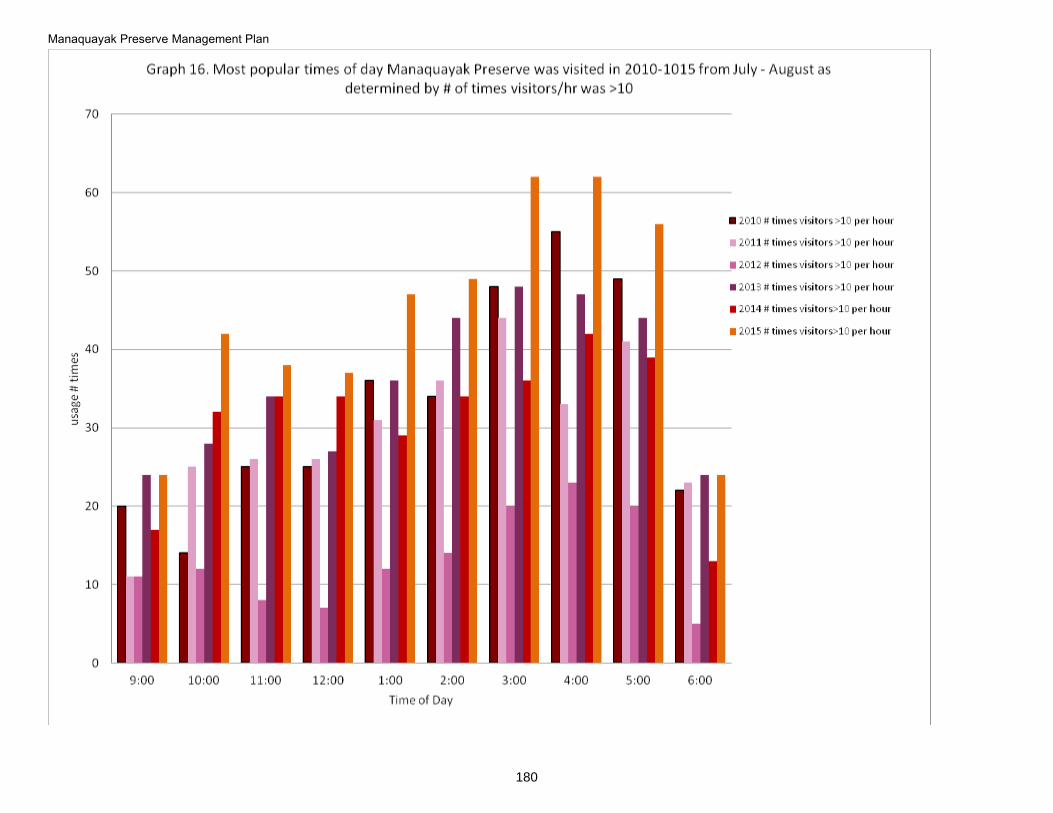
Manaquayak Preserve Management Plan
180
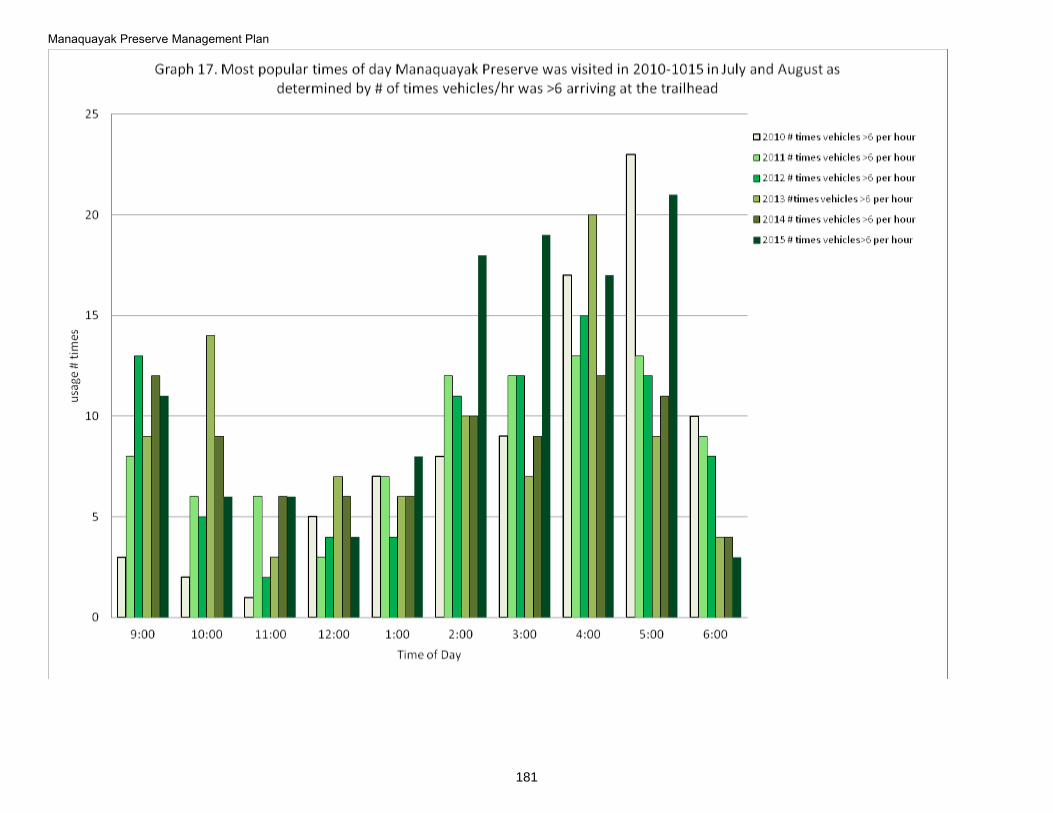
Manaquayak Preserve Management Plan
181
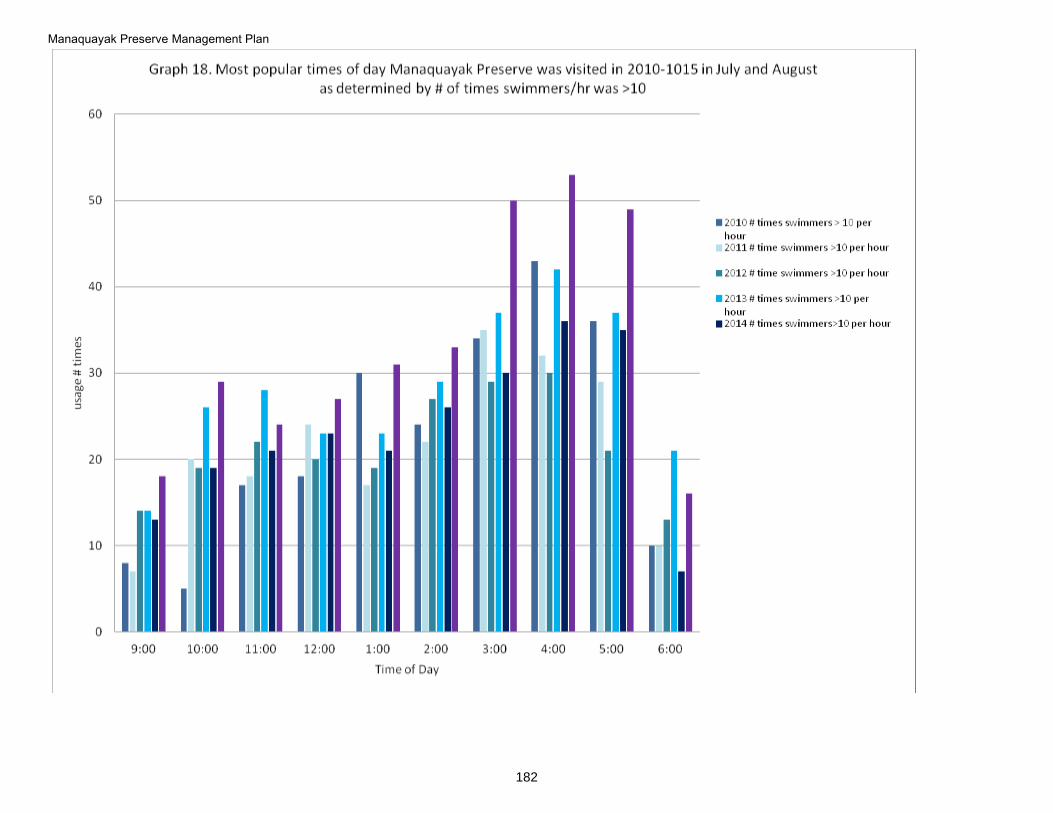
Manaquayak Preserve Management Plan
182
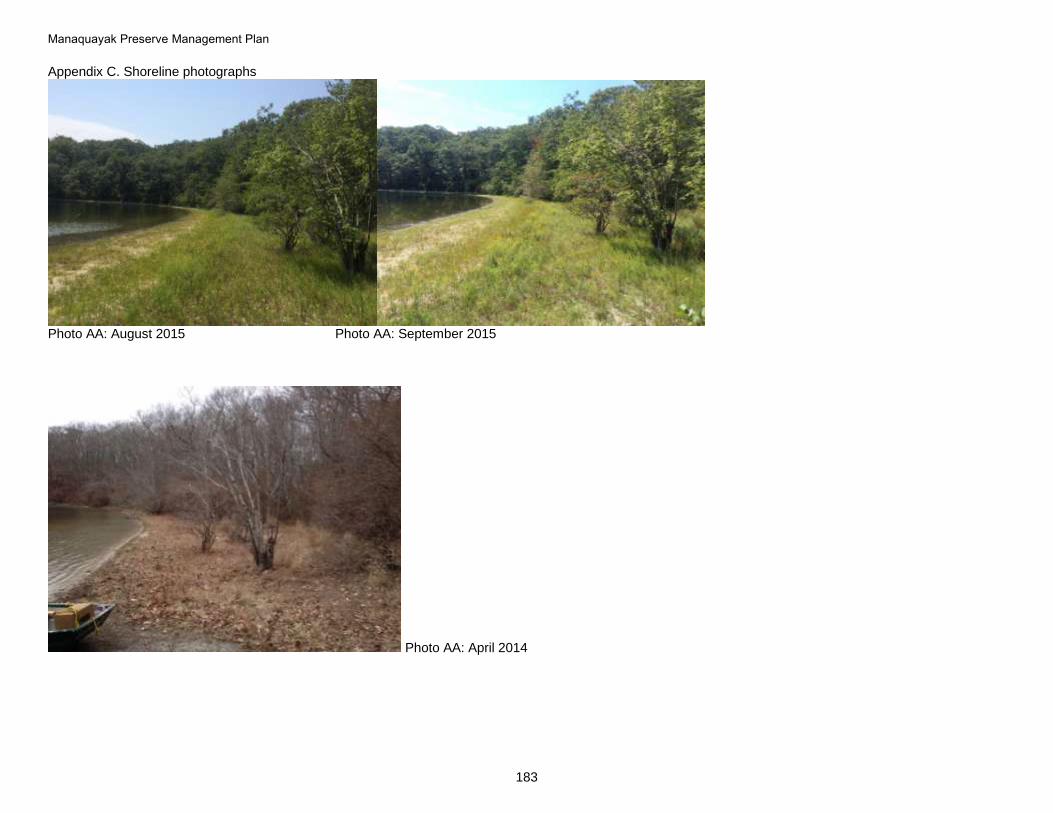
Manaquayak Preserve Management Plan
183
Appendix C. Shoreline photographs
Photo AA: August 2015 Photo AA: September 2015
Photo AA: April 2014
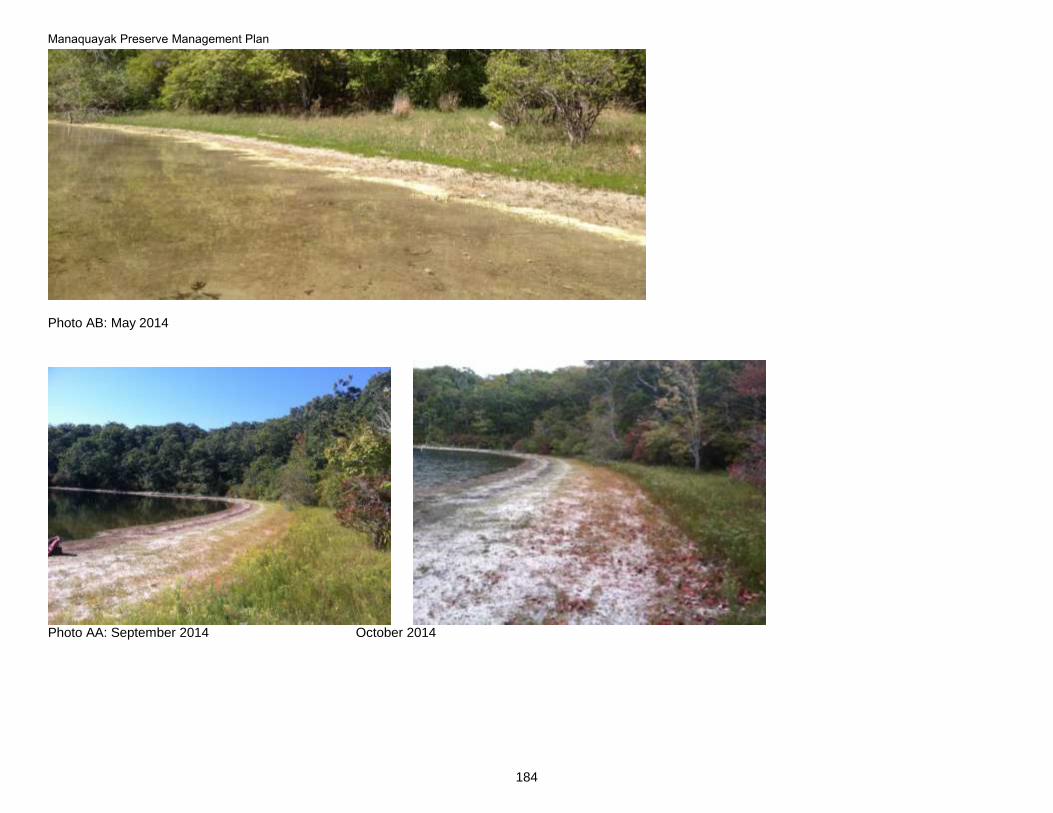
Manaquayak Preserve Management Plan
184
Photo AB: May 2014
Photo AA: September 2014 October 2014
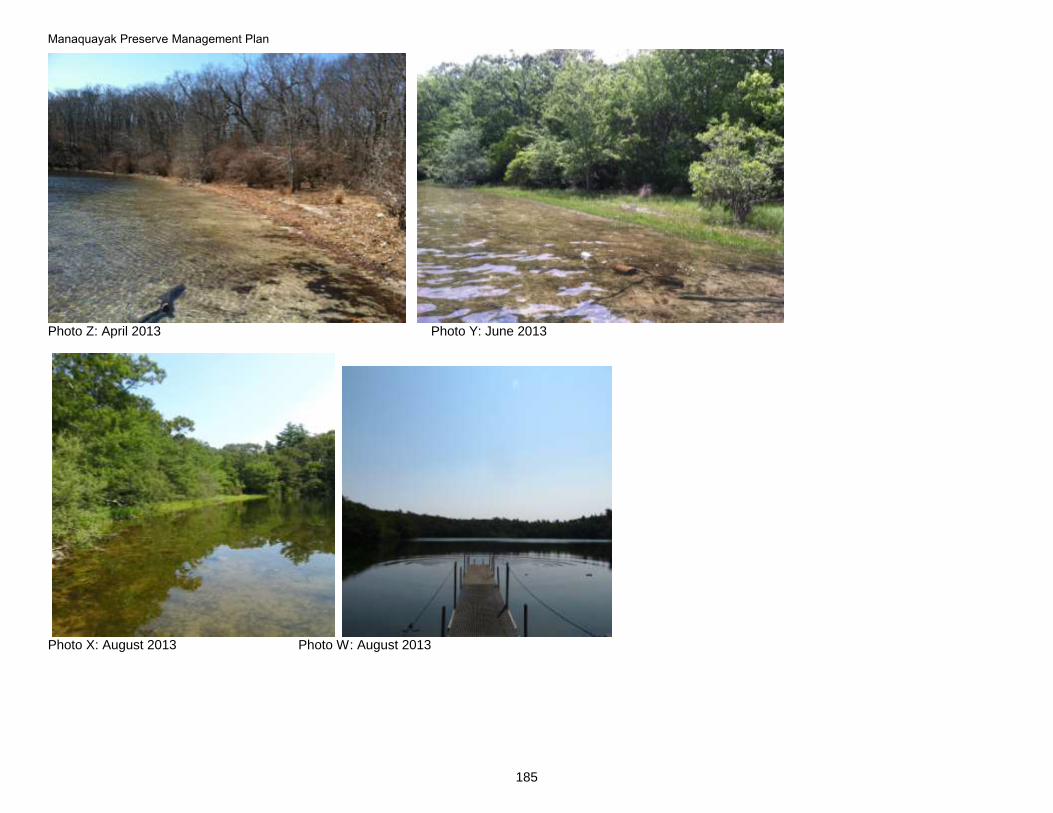
Manaquayak Preserve Management Plan
185
Photo Z: April 2013 Photo Y: June 2013
Photo X: August 2013 Photo W: August 2013
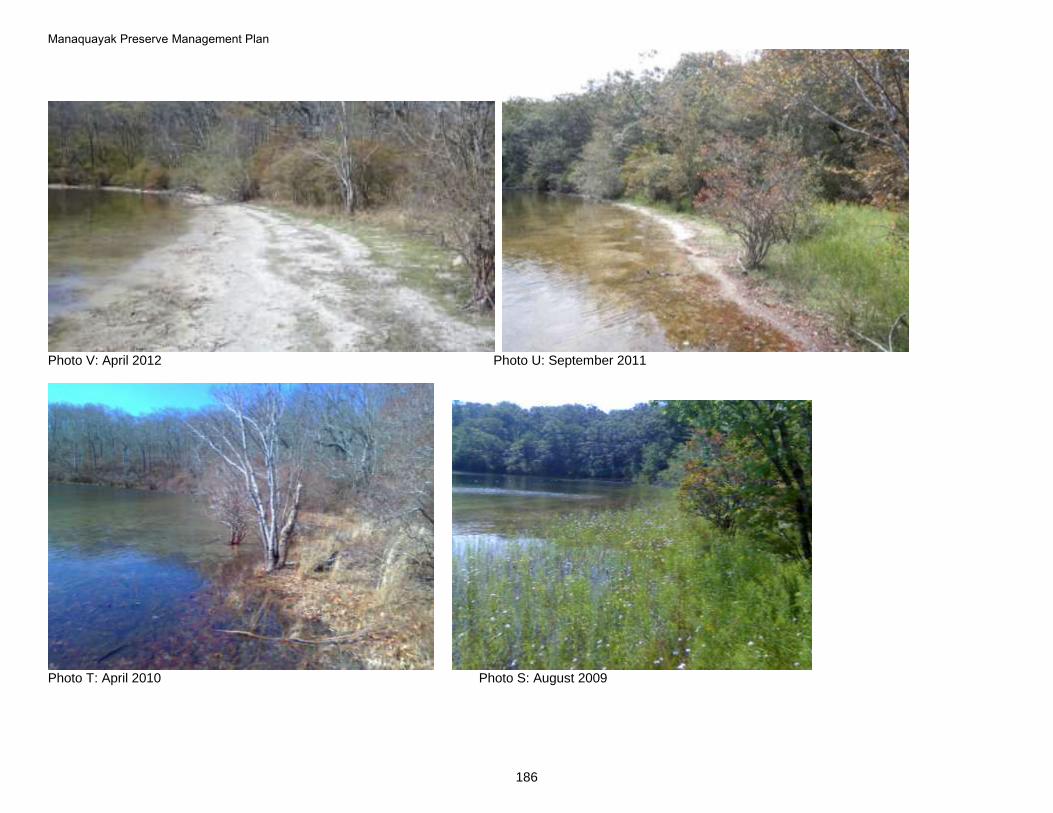
Manaquayak Preserve Management Plan
186
Photo V: April 2012 Photo U: September 2011
Photo T: April 2010 Photo S: August 2009

Manaquayak Preserve Management Plan
187
Photo Q: September 2007
Photo R: August 2008
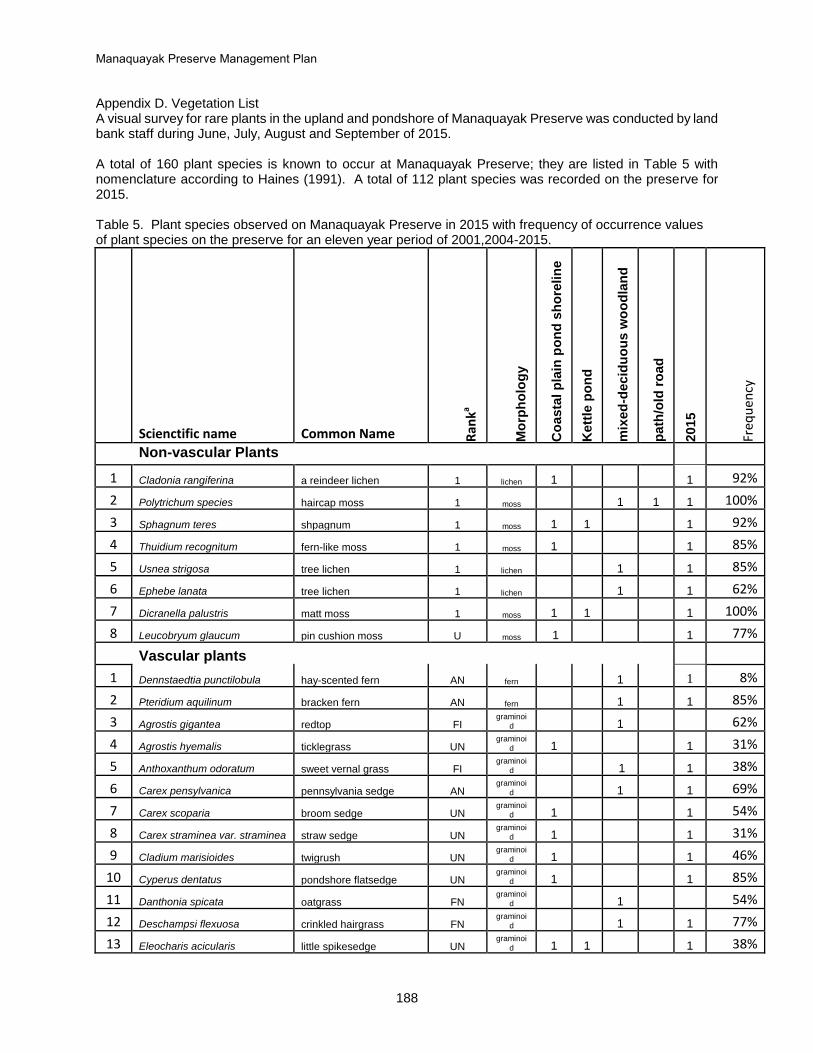
Manaquayak Preserve Management Plan
188
Appendix D. Vegetation List A visual survey for rare plants in the upland and pondshore of Manaquayak Preserve was conducted by land bank staff during June, July, August and September of 2015. A total of 160 plant species is known to occur at Manaquayak Preserve; they are listed in Table 5 with nomenclature according to Haines (1991). A total of 112 plant species was recorded on the preserve for 2015. Table 5. Plant species observed on Manaquayak Preserve in 2015 with frequency of occurrence values of plant species on the preserve for an eleven year period of 2001,2004-2015.
Scienctific name Common Name Ran
ka
Mo
rph
olo
gy
Co
asta
l p
lain
po
nd
sh
ore
lin
e
Kett
le p
on
d
mix
ed
-decid
uo
us w
oo
dla
nd
path
/old
ro
ad
2015
Freq
uen
cy
Non-vascular Plants
1 Cladonia rangiferina a reindeer lichen 1 lichen 1 1 92%
2 Polytrichum species haircap moss 1 moss 1 1 1 100%
3 Sphagnum teres shpagnum 1 moss 1 1 1 92%
4 Thuidium recognitum fern-like moss 1 moss 1 1 85%
5 Usnea strigosa tree lichen 1 lichen 1 1 85%
6 Ephebe lanata tree lichen 1 lichen 1 1 62%
7 Dicranella palustris matt moss 1 moss 1 1 1 100%
8 Leucobryum glaucum pin cushion moss U moss 1 1 77%
Vascular plants
1 Dennstaedtia punctilobula hay-scented fern AN fern 1 1 8%
2 Pteridium aquilinum bracken fern AN fern 1 1 85%
3 Agrostis gigantea redtop FI graminoi
d 1 62%
4 Agrostis hyemalis ticklegrass UN graminoi
d 1 1 31%
5 Anthoxanthum odoratum sweet vernal grass FI graminoi
d 1 1 38%
6 Carex pensylvanica pennsylvania sedge AN graminoi
d 1 1 69%
7 Carex scoparia broom sedge UN graminoi
d 1 1 54%
8 Carex straminea var. straminea straw sedge UN graminoi
d 1 1 31%
9 Cladium marisioides twigrush UN graminoi
d 1 1 46%
10 Cyperus dentatus pondshore flatsedge UN graminoi
d 1 1 85%
11 Danthonia spicata oatgrass FN graminoi
d 1 54%
12 Deschampsi flexuosa crinkled hairgrass FN graminoi
d 1 1 77%
13 Eleocharis acicularis little spikesedge UN graminoi
d 1 1 1 38%
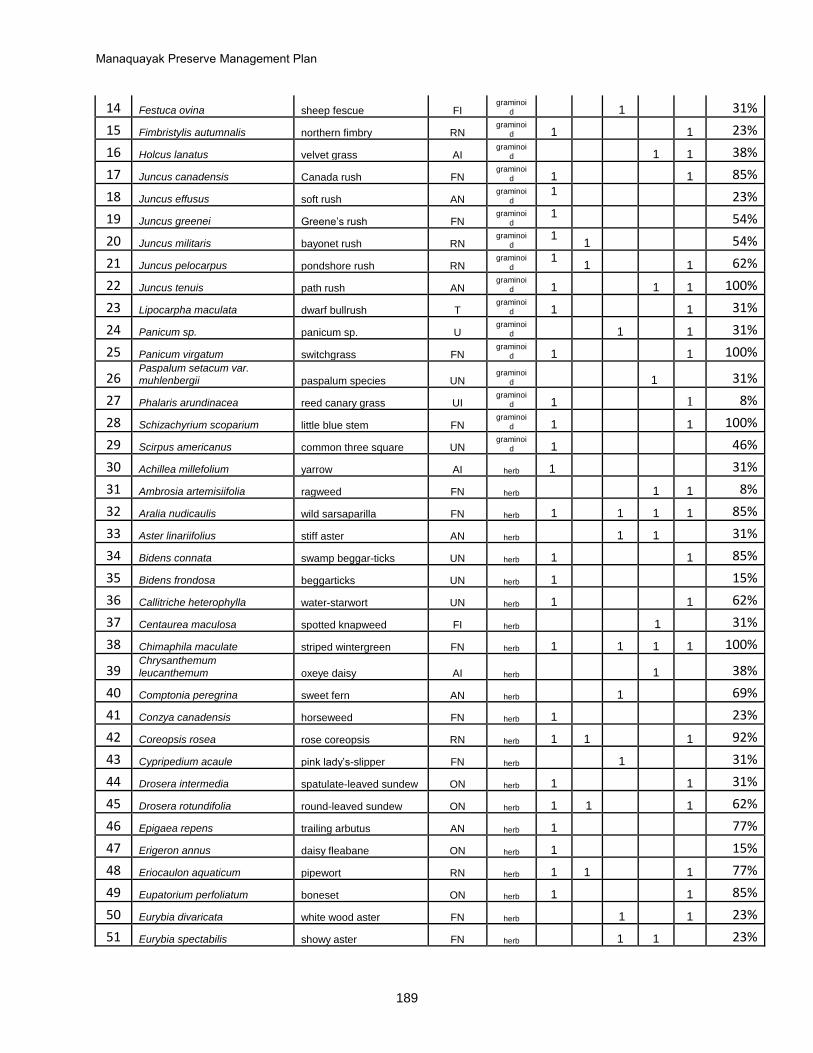
Manaquayak Preserve Management Plan
189
14 Festuca ovina sheep fescue FI graminoi
d 1 31%
15 Fimbristylis autumnalis northern fimbry RN graminoi
d 1 1 23%
16 Holcus lanatus velvet grass AI graminoi
d 1 1 38%
17 Juncus canadensis Canada rush FN graminoi
d 1 1 85%
18 Juncus effusus soft rush AN graminoi
d 1
23%
19 Juncus greenei Greene’s rush FN graminoi
d 1
54%
20 Juncus militaris bayonet rush RN graminoi
d 1
1 54%
21 Juncus pelocarpus pondshore rush RN graminoi
d 1
1 1 62%
22 Juncus tenuis path rush AN graminoi
d 1 1 1 100%
23 Lipocarpha maculata dwarf bullrush T graminoi
d 1 1 31%
24 Panicum sp. panicum sp. U graminoi
d 1 1 31%
25 Panicum virgatum switchgrass FN graminoi
d 1 1 100%
26 Paspalum setacum var.
muhlenbergii paspalum species UN graminoi
d 1 31%
27 Phalaris arundinacea reed canary grass UI graminoi
d 1 1 8%
28 Schizachyrium scoparium little blue stem FN graminoi
d 1 1 100%
29 Scirpus americanus common three square UN graminoi
d 1 46%
30 Achillea millefolium yarrow AI herb 1 31%
31 Ambrosia artemisiifolia ragweed FN herb 1 1 8%
32 Aralia nudicaulis wild sarsaparilla FN herb 1 1 1 1 85%
33 Aster linariifolius stiff aster AN herb 1 1 31%
34 Bidens connata swamp beggar-ticks UN herb 1 1 85%
35 Bidens frondosa beggarticks UN herb 1 15%
36 Callitriche heterophylla water-starwort UN herb 1 1 62%
37 Centaurea maculosa spotted knapweed FI herb 1 31%
38 Chimaphila maculate striped wintergreen FN herb 1 1 1 1 100%
39 Chrysanthemum
leucanthemum oxeye daisy AI herb 1 38%
40 Comptonia peregrina sweet fern AN herb 1 69%
41 Conzya canadensis horseweed FN herb 1 23%
42 Coreopsis rosea rose coreopsis RN herb 1 1 1 92%
43 Cypripedium acaule pink lady’s-slipper FN herb 1 31%
44 Drosera intermedia spatulate-leaved sundew ON herb 1 1 31%
45 Drosera rotundifolia round-leaved sundew ON herb 1 1 1 62%
46 Epigaea repens trailing arbutus AN herb 1 77%
47 Erigeron annus daisy fleabane ON herb 1 15%
48 Eriocaulon aquaticum pipewort RN herb 1 1 1 77%
49 Eupatorium perfoliatum boneset ON herb 1 1 85%
50 Eurybia divaricata white wood aster FN herb 1 1 23%
51 Eurybia spectabilis showy aster FN herb 1 1 23%
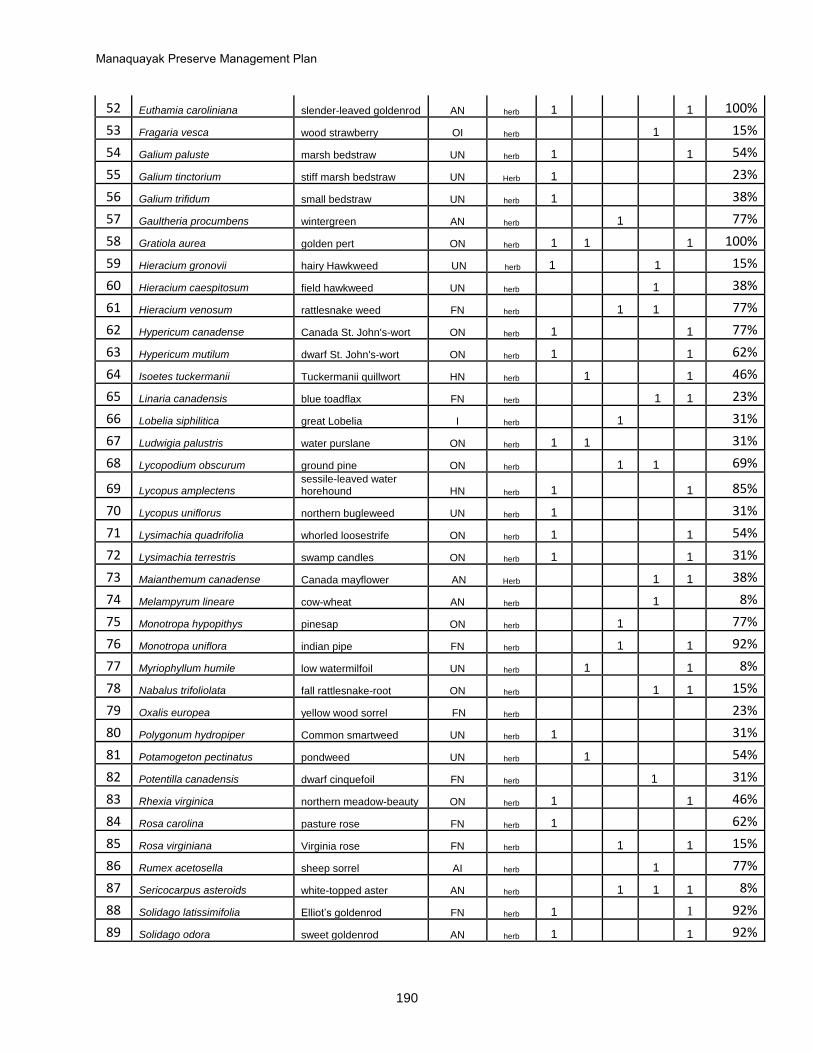
Manaquayak Preserve Management Plan
190
52 Euthamia caroliniana slender-leaved goldenrod AN herb 1 1 100%
53 Fragaria vesca wood strawberry OI herb 1 15%
54 Galium paluste marsh bedstraw UN herb 1 1 54%
55 Galium tinctorium stiff marsh bedstraw UN Herb 1 23%
56 Galium trifidum small bedstraw UN herb 1 38%
57 Gaultheria procumbens wintergreen AN herb 1 77%
58 Gratiola aurea golden pert ON herb 1 1 1 100%
59 Hieracium gronovii hairy Hawkweed UN herb 1 1 15%
60 Hieracium caespitosum field hawkweed UN herb 1 38%
61 Hieracium venosum rattlesnake weed FN herb 1 1 77%
62 Hypericum canadense Canada St. John's-wort ON herb 1 1 77%
63 Hypericum mutilum dwarf St. John's-wort ON herb 1 1 62%
64 Isoetes tuckermanii Tuckermanii quillwort HN herb 1 1 46%
65 Linaria canadensis blue toadflax FN herb 1 1 23%
66 Lobelia siphilitica great Lobelia I herb 1 31%
67 Ludwigia palustris water purslane ON herb 1 1 31%
68 Lycopodium obscurum ground pine ON herb 1 1 69%
69 Lycopus amplectens sessile-leaved water horehound HN herb 1 1 85%
70 Lycopus uniflorus northern bugleweed UN herb 1 31%
71 Lysimachia quadrifolia whorled loosestrife ON herb 1 1 54%
72 Lysimachia terrestris swamp candles ON herb 1 1 31%
73 Maianthemum canadense Canada mayflower AN Herb 1 1 38%
74 Melampyrum lineare cow-wheat AN herb 1 8%
75 Monotropa hypopithys pinesap ON herb 1 77%
76 Monotropa uniflora indian pipe FN herb 1 1 92%
77 Myriophyllum humile low watermilfoil UN herb 1 1 8%
78 Nabalus trifoliolata fall rattlesnake-root ON herb 1 1 15%
79 Oxalis europea yellow wood sorrel FN herb 23%
80 Polygonum hydropiper Common smartweed UN herb 1 31%
81 Potamogeton pectinatus pondweed UN herb 1 54%
82 Potentilla canadensis dwarf cinquefoil FN herb 1 31%
83 Rhexia virginica northern meadow-beauty ON herb 1 1 46%
84 Rosa carolina pasture rose FN herb 1 62%
85 Rosa virginiana Virginia rose FN herb 1 1 15%
86 Rumex acetosella sheep sorrel AI herb 1 77%
87 Sericocarpus asteroids white-topped aster AN herb 1 1 1 8%
88 Solidago latissimifolia Elliot’s goldenrod FN herb 1 1 92%
89 Solidago odora sweet goldenrod AN herb 1 1 92%
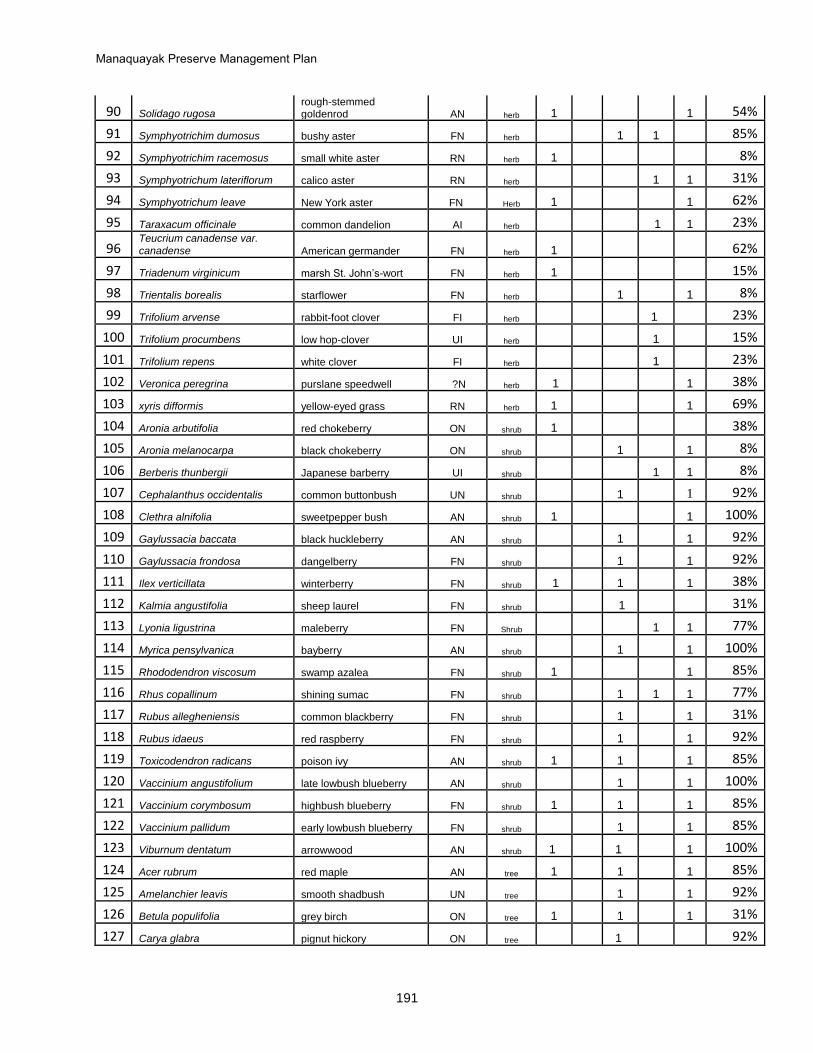
Manaquayak Preserve Management Plan
191
90 Solidago rugosa rough-stemmed goldenrod AN herb 1 1 54%
91 Symphyotrichim dumosus bushy aster FN herb 1 1 85%
92 Symphyotrichim racemosus small white aster RN herb 1 8%
93 Symphyotrichum lateriflorum calico aster RN herb 1 1 31%
94 Symphyotrichum leave New York aster FN Herb 1 1 62%
95 Taraxacum officinale common dandelion AI herb 1 1 23%
96 Teucrium canadense var.
canadense American germander FN herb 1 62%
97 Triadenum virginicum marsh St. John’s-wort FN herb 1 15%
98 Trientalis borealis starflower FN herb 1 1 8%
99 Trifolium arvense rabbit-foot clover FI herb 1 23%
100 Trifolium procumbens low hop-clover UI herb 1 15%
101 Trifolium repens white clover FI herb 1 23%
102 Veronica peregrina purslane speedwell ?N herb 1 1 38%
103 xyris difformis yellow-eyed grass RN herb 1 1 69%
104 Aronia arbutifolia red chokeberry ON shrub 1 38%
105 Aronia melanocarpa black chokeberry ON shrub 1 1 8%
106 Berberis thunbergii Japanese barberry UI shrub 1 1 8%
107 Cephalanthus occidentalis common buttonbush UN shrub 1 1 92%
108 Clethra alnifolia sweetpepper bush AN shrub 1 1 100%
109 Gaylussacia baccata black huckleberry AN shrub 1 1 92%
110 Gaylussacia frondosa dangelberry FN shrub 1 1 92%
111 Ilex verticillata winterberry FN shrub 1 1 1 38%
112 Kalmia angustifolia sheep laurel FN shrub 1 31%
113 Lyonia ligustrina maleberry FN Shrub 1 1 77%
114 Myrica pensylvanica bayberry AN shrub 1 1 100%
115 Rhododendron viscosum swamp azalea FN shrub 1 1 85%
116 Rhus copallinum shining sumac FN shrub 1 1 1 77%
117 Rubus allegheniensis common blackberry FN shrub 1 1 31%
118 Rubus idaeus red raspberry FN shrub 1 1 92%
119 Toxicodendron radicans poison ivy AN shrub 1 1 1 85%
120 Vaccinium angustifolium late lowbush blueberry AN shrub 1 1 100%
121 Vaccinium corymbosum highbush blueberry FN shrub 1 1 1 85%
122 Vaccinium pallidum early lowbush blueberry FN shrub 1 1 85%
123 Viburnum dentatum arrowwood AN shrub 1 1 1 100%
124 Acer rubrum red maple AN tree 1 1 1 85%
125 Amelanchier leavis smooth shadbush UN tree 1 1 92%
126 Betula populifolia grey birch ON tree 1 1 1 31%
127 Carya glabra pignut hickory ON tree 1 92%
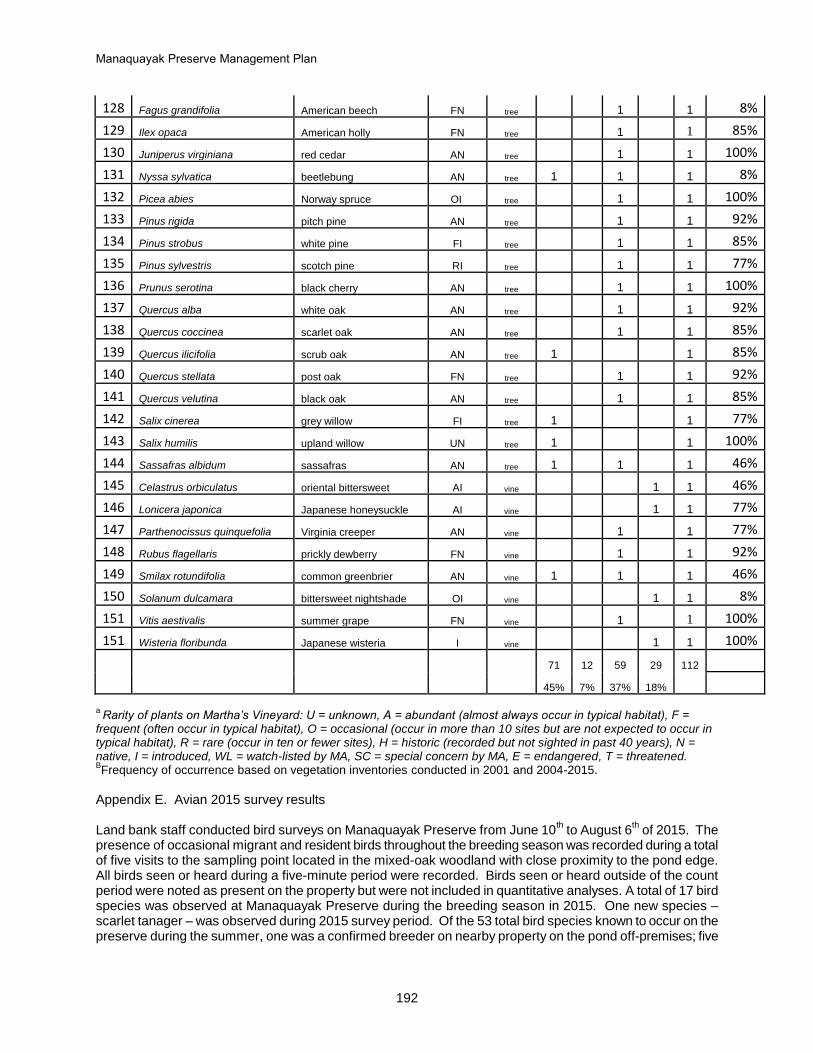
Manaquayak Preserve Management Plan
192
128 Fagus grandifolia American beech FN tree 1 1 8%
129 Ilex opaca American holly FN tree 1 1 85%
130 Juniperus virginiana red cedar AN tree 1 1 100%
131 Nyssa sylvatica beetlebung AN tree 1 1 1 8%
132 Picea abies Norway spruce OI tree 1 1 100%
133 Pinus rigida pitch pine AN tree 1 1 92%
134 Pinus strobus white pine FI tree 1 1 85%
135 Pinus sylvestris scotch pine RI tree 1 1 77%
136 Prunus serotina black cherry AN tree 1 1 100%
137 Quercus alba white oak AN tree 1 1 92%
138 Quercus coccinea scarlet oak AN tree 1 1 85%
139 Quercus ilicifolia scrub oak AN tree 1 1 85%
140 Quercus stellata post oak FN tree 1 1 92%
141 Quercus velutina black oak AN tree 1 1 85%
142 Salix cinerea grey willow FI tree 1 1 77%
143 Salix humilis upland willow UN tree 1 1 100%
144 Sassafras albidum sassafras AN tree 1 1 1 46%
145 Celastrus orbiculatus oriental bittersweet AI vine 1 1 46%
146 Lonicera japonica Japanese honeysuckle AI vine 1 1 77%
147 Parthenocissus quinquefolia Virginia creeper AN vine 1 1 77%
148 Rubus flagellaris prickly dewberry FN vine 1 1 92%
149 Smilax rotundifolia common greenbrier AN vine 1 1 1 46%
150 Solanum dulcamara bittersweet nightshade OI vine 1 1 8%
151 Vitis aestivalis summer grape FN vine 1 1 100%
151 Wisteria floribunda Japanese wisteria I vine 1 1 100%
71 12 59 29 112
45% 7% 37% 18%
a Rarity of plants on Martha’s Vineyard: U = unknown, A = abundant (almost always occur in typical habitat), F =
frequent (often occur in typical habitat), O = occasional (occur in more than 10 sites but are not expected to occur in typical habitat), R = rare (occur in ten or fewer sites), H = historic (recorded but not sighted in past 40 years), N = native, I = introduced, WL = watch-listed by MA, SC = special concern by MA, E = endangered, T = threatened. BFrequency of occurrence based on vegetation inventories conducted in 2001 and 2004-2015.
Appendix E. Avian 2015 survey results Land bank staff conducted bird surveys on Manaquayak Preserve from June 10
th to August 6
th of 2015. The
presence of occasional migrant and resident birds throughout the breeding season was recorded during a total of five visits to the sampling point located in the mixed-oak woodland with close proximity to the pond edge. All birds seen or heard during a five-minute period were recorded. Birds seen or heard outside of the count period were noted as present on the property but were not included in quantitative analyses. A total of 17 bird species was observed at Manaquayak Preserve during the breeding season in 2015. One new species – scarlet tanager – was observed during 2015 survey period. Of the 53 total bird species known to occur on the preserve during the summer, one was a confirmed breeder on nearby property on the pond off-premises; five
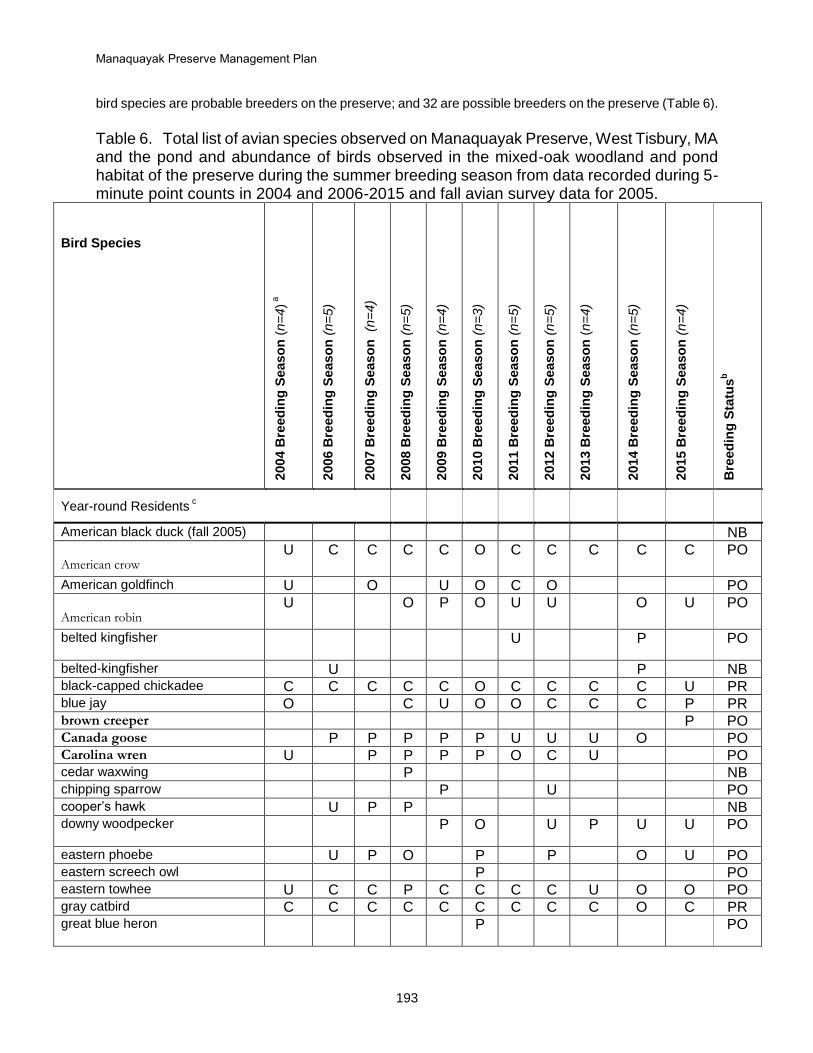
Manaquayak Preserve Management Plan
193
bird species are probable breeders on the preserve; and 32 are possible breeders on the preserve (Table 6).
Table 6. Total list of avian species observed on Manaquayak Preserve, West Tisbury, MA and the pond and abundance of birds observed in the mixed-oak woodland and pond habitat of the preserve during the summer breeding season from data recorded during 5-minute point counts in 2004 and 2006-2015 and fall avian survey data for 2005.
Bird Species
2004 B
reed
ing
Seaso
n (
n=
4) a
2006 B
reed
ing
Seaso
n (
n=
5)
2007 B
reed
ing
Seaso
n
(n=
4)
2008 B
reed
ing
Seaso
n (
n=
5)
2009 B
reed
ing
Seaso
n (
n=
4)
2010 B
reed
ing
Seaso
n (
n=
3)
2011 B
reed
ing
Seaso
n (
n=
5)
2012 B
reed
ing
Seaso
n (
n=
5)
2013 B
reed
ing
Seaso
n (
n=
4)
2014 B
reed
ing
Seaso
n (
n=
5)
2015 B
reed
ing
Seaso
n (
n=
4)
Bre
ed
ing
Sta
tus
b
Year-round Residents c
American black duck (fall 2005) NB
American crow U C C C C O C C C C C PO
American goldfinch U O U O C O PO
American robin U O P O U U O U PO
belted kingfisher P
U P PO
belted-kingfisher U P NB black-capped chickadee C C C C C O C C C C U PR blue jay O C U O O C C C P PR brown creeper P PO Canada goose P P P P P U U U O PO Carolina wren U P P P P O C U PO cedar waxwing P NB chipping sparrow P U PO cooper’s hawk U P P NB downy woodpecker
U P O U P U U PO
eastern phoebe U P O P P O U PO
eastern screech owl P PO eastern towhee U C C P C C C C U O O PO gray catbird C C C C C C C C C O C PR great blue heron
P PO
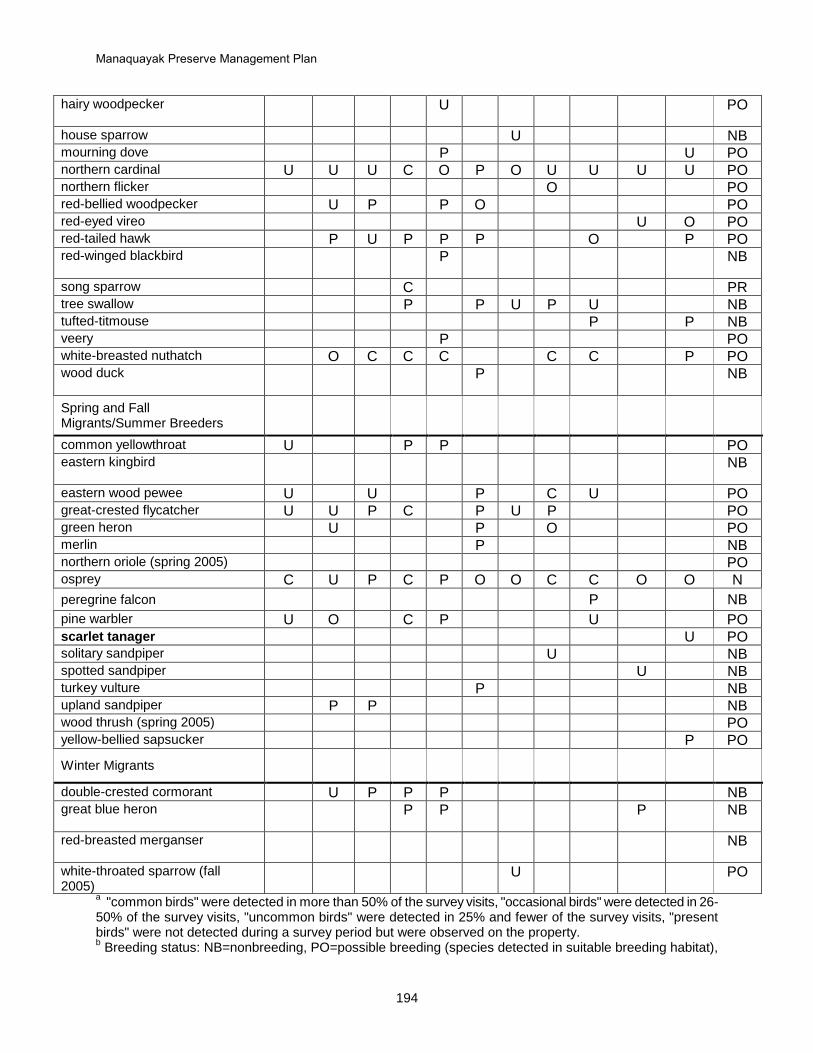
Manaquayak Preserve Management Plan
194
hairy woodpecker U
U PO
house sparrow U NB mourning dove P U PO northern cardinal U U U C O P O U U U U PO northern flicker O PO red-bellied woodpecker U P P O PO red-eyed vireo U O PO red-tailed hawk P U P P P O P PO red-winged blackbird
P P NB
song sparrow C PR tree swallow P P U P U NB tufted-titmouse P P NB veery P PO white-breasted nuthatch O C C C C C P PO wood duck
P P NB
Spring and Fall Migrants/Summer Breeders
common yellowthroat U P P PO eastern kingbird
P NB
eastern wood pewee U U P C U PO great-crested flycatcher U U P C P U P PO green heron U P O PO merlin P NB northern oriole (spring 2005) PO osprey C U P C P O O C C O O N
peregrine falcon P NB
pine warbler U O C P U PO scarlet tanager U PO solitary sandpiper U NB spotted sandpiper U NB turkey vulture P NB upland sandpiper P P NB wood thrush (spring 2005) PO yellow-bellied sapsucker P PO
Winter Migrants
double-crested cormorant U P P P NB great blue heron
P P P P NB
red-breasted merganser P
NB
white-throated sparrow (fall 2005)
U PO
a "common birds" were detected in more than 50% of the survey visits, "occasional birds" were detected in 26-
50% of the survey visits, "uncommon birds" were detected in 25% and fewer of the survey visits, "present birds" were not detected during a survey period but were observed on the property. b Breeding status: NB=nonbreeding, PO=possible breeding (species detected in suitable breeding habitat),

Manaquayak Preserve Management Plan
195
PR=probable breeding (species heard singing on two occasions over one week apart in suitable breeding habitat). CO=confirmed breeding (species carrying food, CF; feeding young, FY; with begging hatch-year fledglings, HY; or a located nest, N). Breeding status: PO possible breeding, PR c Birds highlighted in bold are birds observed in 2012 and not earlier surveys.
Manaquayak Preserve Management Plan
196
Literature Cited Bachmann. 2013. The Concept of Limiting Nutrients. lakewatch.ifas.ufl.edu/circpdffolder/nutrpt2.pdf Carlson, R.E. 1977. A trophic state index for lakes. Limnology and Oceanography 22: 361-369. Eichner, E.M., T.C. Cambareri, G. Belfit, D. McCaff ery, S. Michaud, and B. Smith. 2003. Cape Cod Pond and Lake Atlas. Cape Cod Commission. Barnstable, MA.
Haines, A. 2011. Flora Novae Angliae. Yale University Press. New Haven, CT. 973pp. Kratzer C.R. and P.L. Brezonik. 1981. A Carlson-type Trophic State Index for Nitrogen in Florida Lakes. Water Resource Bulletin 17:713-715. Quiros, R. 2002. The nitrogen to phosphorus ratio for lakes: A cause or a consequence of aquatic biology (p: 11-26). In A. Fernandez Cirelli and G. Chalar Marquisa (eds.) El Agua en Iberoamerica: De la Limnología a la Gestion en Sudamerica . CYTED XVII, Centro de Estudios ransdiciplinarios del Agua, Facultad de Veterinaria, Universidad de Buenos Aires. Buenos Aires, Argentina. 172p Redfield, A.C., B.H. Ketchum and F.A. Richards. 1963. The Influence of Organisms on the Composition of
Seawater. M.N. Hill, ed. In the Sea: New York, Wiley Interscience, v.2 p26-77. School of Marine Science and Technology, University of Massachusetts Dartmouth. 2003. Coastal Systems Program, Analytical Facility, Laboratory Quality Assurance Plan. New Bedford, MA.
United States Environmental Protection Agency. 2000. Nutrient Criteria Technical Guidance Manual: Lakes and Reservoirs. First Edition. EPA-822-B00-001. US Environmental Protection Agency, Office of Water, Office of Science and Technology. Washington, DC

Manaquayak Preserve Management Plan
197
Summary Ice House Pond at Manaquayak Preserve remains a stratified, dimictic pond with a distinct thermocline at 4 meters and is in an oligotrophic to oligo-/mesotrophic state. In comparison to recent years, 2015 was a moderately low water year for the pond similar to 2005, 2006, 2010, 2011, 2013 and 2014. Water clarity is relatively unchanged although a trend in greater secchi depths resulting in greater visibility continues to be observed. Nitrogen concentrations in the pond displayed an increase over past years while phosphorus declined compared to 2014. Bacteria levels in the pond have remained consistent with no pond closures in 2015. Use has been on the rise since the property opened but has declined slightly since the high during 2012. Trailhead closure rates are greater in 2015 than prior years.