Embed Size (px)
Citation preview

WEST POKOT COUNTY
2019 SHORT RAINS FOOD AND NUTRITION SECURITY ASSESSMENT REPORT
A Joint Report by the Kenya Food Security Steering Group (KFSSG) and
West Pokot County Steering Group (CSG)
February, 2020.

i
Executive Summary
The short rains food and nutrition security assessment exercise was conducted to establish the
County’s food and nutrition status following the short rains season through an objective, evidence-
based and transparent manner. The exercise involved a multi-sectoral team constituted by the
technical County Steering Group members led by National Drought Management Authority. Data
and information were obtained through a review of various existing secondary sources while
primary data was collected through sector checklists and community interview guides. The
assessment team visited the County in sampled areas for validation and triangulation of
information, using the livelihood zone as the unit of analysis. Findings of the report revealed that
the county experienced timely rainfall onset in the third dekad of September 2019, with 185
percent of normal rainfall amount that was evenly distributed in space with good temporal
distribution and what was considered normal cessation in the third dekad of December 2019. The
key drivers to food and nutrition security included above normal rainfall, enhanced livestock
production, infestation of crop/livestock pests and diseases such as desert locusts, Foot and Mouth
Disease (FMD) and Lumpy Skin Disease (LSD). Crop production was not significantly affected as
this was not the main cropping season for the County. Food availability and access were stable as
most households relied on market supply for maize while others held stocks. Maize price was Kshs
36 in February 2020, which was 14 percent below short term average (STA) and three percent
above the previous month. There were below normal stocks held by both households and traders,
implying that prices are likely to start increasing. Goat price was Kshs 3,780, which is 54 percent
above the long term average( L.T.A) price and one percent above the previous month. The terms of
trade improved to 106, representing 81 percent above LTA value while one percent below the
previous month. A total of 98 percent of households fell in the acceptable food consumption score,
with 0.7 percent being in borderline and 1.3 percent in a poor category in February 2020,
indicating an improvement compared to 78, 21.3 and 0.7 percent for acceptable, borderline and
poor categories respectively recorded in January 2020.Pasture and browse condition was good
across livelihood zones and projected to last longer than the normal as livestock birthrates
improved, increasing livestock numbers owned. The livestock body condition was also good in all
livelihood zones with milk production and consumption increased in all livelihoods as compared to
normal. There were no unusual livestock migrations reported especially those attributed to search
of pasture/water. Main water sources were boreholes, rivers, pans/dams, springs and shallow wells
constituting a normal situation. Water consumption was normal and stable. Markets were operating
normally without any disruptions in all livelihood zones with well-provisioned food commodities,
except for Lelan ward markets that had been closed due to foot and mouth disease(FMD) outbreak.
Vitamin A supplementation registered significant improvement; 75 compared to 69 percent in
2019 and 2018 respectively with Fully Immunized Children (FIC) increasing to 47 percent in
2019 compared to 42 percent in 2018, the increase which is attributed to the availability of Vitamin
A supplements and integrated health services during outreaches. The coping strategy index
decreased from 2 in November 2019 to 1.7 in December 2019 indicating that households were
employing fewer coping strategies as food security improved. Morbidity trends for Upper
respiratory tract Infections (URTIs), Diarrhoea and Malaria from June to December 2019 were
downward compared the same period in 2018 for the under-fives and the general population,
attributed to improved health services. Enrolment, attendance and retention rates in schools for all
levels (Early Child Development Education, primary and secondary) and both gender were stable
across livelihood zones in the county with regular school feeding programme working. Only a few
schools, however, have the homegrown school feeding programme. The County is generally
classified under the Minimal Phase (Phase 1) of the Integrated food security Phase Classification.

ii
Table of Contents
Executive Summary ....................................................................................................................... i
Table of Contents ...........................................................................................................................ii
1.0 INTRODUCTION .................................................................................................................. 1
1.1 County background ............................................................................................................. 1
1.2 Methodology and approach ................................................................................................ 1
2.1 Rainfall Performance ......................................................................................................... 2
2.2 Insecurity/Conflict ............................................................................................................. 2
2.3 Other shocks and hazards ................................................................................................. 2
3.1.1 Crops Production .......................................................................................................... 3
3.2 Access.................................................................................................................................. 7
3.2.1 Market – prices and functioning ................................................................................... 7
3.2.2 Terms of Trade.............................................................................................................. 9
3.2.3 Income sources ............................................................................................................. 9
3.2.4 Water access and availability ....................................................................................... 9
3.2.5 Food Consumption ..................................................................................................... 10
3.2.6 Coping strategy ........................................................................................................... 11
3.3 Utilization ...................................................................................................................... 11
3.3.2 Immunization and Vitamin A supplementation .................................................... 11
3.3.2 Nutritional status and dietary diversity ................................................................ 12
3.3.2 Sanitation and Hygiene ......................................................................................... 13
3.5.1 Enrolment ................................................................................................................... 14
3.5.2 Participation ............................................................................................................... 14
3.5.4 School meals programme ........................................................................................... 14
3.5.5 Inter-Sectoral links where available ........................................................................... 15
4.2 Food security Outlook for the next 6 months ................................................................... 16
5.0 CONCLUSION AND INTERVENTIONS ..................................................................................... 16
5.1 Conclusion ......................................................................................................................... 16
5.1.1 Phase classification ..................................................................................................... 16
5.1.3 Sub-county ranking ..................................................................................................... 17

iii
5.2 Ongoing Interventions ...................................................................................................... 17
5.2.1 Food interventions ..................................................................................................... 17
4. Livestock .......................................................................................................................... 20
5.3 Recommended Interventions ............................................................................................ 21

1
33%
37%
30% Pastoral- All species
Agropastoral
Mixed Farming
Figure 1: Population proportion by livelihood zone
1.0 Introduction
1.1 County background
West Pokot County is located in the North-
Western part of Kenya, bordering the Republic
of Uganda to the West and Turkana County to
the North. It borders Trans Nzoia and Elgeyo
Marakwet Counties to the South, while Baringo
County to the East. Its four administrative units
include Pokot North, Pokot South, Pokot
Central, and Pokot West sub-counties. The
County covers an area of 9,169.4 square
kilometers supporting a total population of
621,241 persons Kenya National Bureau of
Statistics (KNBS, 2019). The three main
livelihood zones in the County are pastoral,
agro-pastoral and mixed farming, composed of
33, 37 and 30 percent of the population
respectively. The population proportion by
livelihood zone (figure 1). Livestock production
is the economic mainstay of the County contributing to 60, 30 and 26 percent of cash income in the
pastoral, mixed farming and agro-pastoral livelihood zones respectively. Cash crop farming and
poultry production contribute to 15 percent each, of cash income in the mixed farming livelihood
zones and the agro-pastoral livelihood zones respectively. The main hazards experienced in the
County are livestock/crop pests and diseases, Malaria outbreaks as well as waterborne disease
epidemics such as Cholera, Typhoid and Dysentry
1.2 Methodology and approach
Data and information for assessment exercise were obtained through a review of various existing
secondary sources such as DHIS, NDMA early warning bulletins and floods/landslides assessment
report together with the County’s revised CIDP. Primary data was sourced from sector checklists
administered by respective departments’ subject matter specialists namely; livestock, agriculture,
water, health & nutrition, and education. After a review of secondary and primary data, the
assessment team made a transect drive across the county visiting various sample sites for
validation and ground-truthing. The unit of analysis was the livelihood zone and as such, the
selection of sites was done considering the main three livelihood zones across the four existing
Sub-Counties. During fieldwork, a number of techniques were used to collect information and
data. For instances, direct observation was used to acquire information on pasture/crop condition,
livestock body condition and water situation status. The team used focused group discussions
(FGDs), community interviews, key informants and market surveys in selected markets to gather
information. Among the places visited were facilities such as schools, health centres, livestock sale
yards and water points.
The team started the field work on February 11, 2020 for two days and visited the following areas:
Sebit, Sigor, Marich, Chepkono, Kabichbich, Cheptuya, Orolwo, Kacheliba and Kishaunet,
holding discussions with at least two communities, two key informants and two market centres in
each of the sampled sites for every livelihood zone. During report writing, the information and data

2
Figure 1: Rainfall performance as a
percent of normal in West Pokot
County
from the field was finally reviewed along with the secondary one and analyzed as per the
livelihood zones in the County. The subsequent draft report was presented to the County Steering
Group (CSG) meeting on February 14, 2020, for deliberation, amendment and adoption.
2.0 DRIVERS OF FOOD AND NUTRITION SECURITY IN THE COUNTY
2.1 Rainfall Performance
The County recorded a normal onset in the third
dekad of September 2019 with a seasonal
cumulative rainfall amount of 368 mm (185
percent) compared to 199 mm normally. Most parts
constituting Central and Northern areas received
above 200 percent of normal rainfall while the rest
received between 160-200 percent of normal. There
was even spatial distribution of rainfall across the
County. The temporal distribution was good, with
highest rainfall being received in the third and first
dekads of November and December 2019
respectively. Cessation was in the third dekad of
December 2019 and considered normal.
2.2 Insecurity/Conflict There were no conflicts experienced during the season. Traditional conflict areas are currently
calm as a result of recent peace building initiatives by peace actors in the County. Since the
pastoral resources are not limited, the communities co-existed harmoniously.
2.3 Other shocks and hazards
Hazards
There were incidences of landslides and flooding in parts of the County in November 2019. The
landslides occurred in Tapach and Batei wards in Pokot South Sub-county and in Wei Wei ward of
Pokot Central Sub-county. Flooding occurred at riverine areas along main rivers (Wei Wei,
Muruny, Kerelwa and Parua) which broke their banks. Flooding and landslides led to massive loss
of lives, destruction of bridges while crops, settlements and livestock were swept away. Cases of
livestock disease outbreak like Foot and Mouth Disease (FMD) and Lumpy Skin Disease (LSD)
were prevalent in various parts of the County. Desert locusts were reported in Pokot Central sub-
county along the border of West Pokot and Elgeyo Marakwet Counties. Pokot North sub-county is
also reported to have been affected by locust invasion.
Shocks
As a result of landslides and floods, the affected households have been left in dire need of food and
shelter, including medical attention, water treatment chemicals and other critical non-food items.
Four bridges, two along the Kitale-Lodwar road (Sebit and Ortum bridges) and the other two along

3
Sigor-Chesegon road (Marich and Chepera bridges) were cut-off. The destruction of bridges has
disrupted communication network in the area, affecting normal operations. Irrigation infrastructure
was destroyed by floods and landslides, where affected areas experienced post-harvest losses of
maize, potatoes and onions. The landslides and floods led to displacement of a significant number
of households in the areas affected. There are four categories of affected groups, which include, 42
percent displaced people living in collective centres (schools), five percent displaced people living
in spontaneous camps and 40 percent for those people living in host families. Other categories of
people affected indirectly were the resident population hosting the displaced persons that
constituted 13 percent. The above categories are comprised of both males and females including
pregnant and lactating mothers, children, the elderly as well as persons living with disability
(PLWDs). Most of these populations are settled along steepy valleys/slopes and reverine areas
practicing agro-pastoralism and mixed farming.
3.0 IMPACTS OF DRIVERS ON FOOD AND NUTRITION SECURITY
3.1 Availability
3.1.1 Crops Production
The main crops grown in the county are Maize, Beans, Irish potatoes and Sorghum. Beans, Irish
potatoes and Sorghum constitute the main crops in this season and mostly grown under irrigation,
whereby they contribute 40, 36 and 24 percent respectively to food and income. Other important
crops are bulb onions and green grams. The Short Rains season is not the main season of
production since the County depends majorly on the Long Rains season. Despite of above normal
rains received, the performance of the season was not good because of heavy rainfall that led to
water logging in mixed and agro-pastoral livelihood zones, reducing production for crops. Due to
heavy rains, most irrigation infrastructure was destroyed. There were high incidences of pests and
diseases reported, notably desert locusts. Stocks held for maize are higher because farmers had
good harvest during the previous Long rains season. There was no major market disruption except
impassable roads to Pokot Central that led to temporary inaccessibility to food stuffs.
Table 1: Rain-fed crop production
Crop Area planted
during 2019
Short rains
season
(Ha)
Short Term
Average (STA)
area planted during
the Short rains
season (Ha)
2019 Short rains
season
production
(90 kg bags)
Projected/Actual
Long Term
Average
production during
the Short rains
season
(90 kg bags)
Beans 690 605 3,490 3,568
Irish
potatoes
755 850 67,850 76,500
Green grams 85 100 1,020 1,000
Area under Beans cultivation increased by 14 percent as compared to the short term average (STA)
due to good rainfall performance as farmers expanded cultivation since rains were promising and
progressed well. Area under Irish potatoes decreased by 11 percent due to heavy rains that
discouraged farmers from planting as they feared the occurrence of pests and diseases coupled
with low availability of certified potato seeds. There was thirty one percent decrease in the area
under Sorghum compared to Short term average (STA) due to lack of support in terms of seeds,
considering that previously, farmers received seeds by the county government. Production for all
crops decreased compared to STA due to the heavy rainfall experienced that led to waterlogging,

4
high frequency of pests and diseases in addition to post-harvest losses, especially for Irish
potatoes.
Table 2: Irrigated crop production
Crop Area planted
during 2019
Short rains
season
(Ha)
(STA)
area planted during
the Short rains
season (Ha)
2018 Short rains
season
production
(90 kg bags)
Projected/Actual
Long Term
Average
production during
the Short rains
season
(90 kg bags)
Bulb
Onions
750 720 85500 100,080
Maize 325 320 8100 7500
Beans 85 80 1300 1600
Irrigation agriculture was highly supplemented by rainwater and this led to an increase in acreage
for all the three crops. Bulb onion is the main crop recorded increase of 4.2 percent as a result of
the provision of certified seeds by the county government. Maize which is mainly seed maize from
the Weiwei irrigation scheme had a minimal increase of two percent above LTA because farmers
have a constant size of land. Production/projected production of bulb onions decreased by 14.7
percent due to incidences of pests and diseases, the occurrence of landslides that destroyed
irrigation infrastructure in Sebit and Ortum growing areas. It did not, however, impact much on
food security since these are not main crops depended on by farmers and not the main season as
well.
3.1.2 Cereals stock
Table 3: Quantities held currently (90 kg bags)
Commodity Maize Sorghum Millet
Current STA Current STA Current STA
Farmers 590,009 530,000 6,750 7,350 2,000 8,000
Traders 49,991 52,000 3,000 2470 1250 950
Millers 0 0 0 0 0 0
Food Aid/NCPB 0 0 0 0 0 0
Households have maize stocks of 11 percent above STA occasioned by high long rains season
production, slow disposal since National Cereals and Produce Board (NCPB) has not started
buying produce. Traders held 4 percent below LTA because they have a continuous market for
their stocks which are mainly millers in Kitale offering competitive prices. In pastoral livelihood
zones, maize stocks will last for 2 months while in agro-pastoral zones, maize will last for 2-3
months. On the whole, stocks will last 3-4 months. Nevertheless, markets are functional and food
commodities available.
3.1.3 Livestock Production
The main livestock species reared in the County are cattle, goats, sheep, camels, donkeys, and
poultry which contribute approximately 69, 30 and 26 percent of the cash income in the pastoral,
mixed farming and agro-pastoral livelihood zones respectively. Cattle, goats, and sheep contribute
to 25, 40 and 30 percent of cash income in the pastoral livelihood zone respectively. In the agro-

5
pastoral livelihood zone, cattle, goats, and sheep contribute to 25, 30 and 28 percent of cash
income
respectively while in the mixed farming livelihood zone, cattle contribute significantly to cash
income at 55 percent and food at 49 percent. These animals are kept across all the three
livelihoods zones and are kept mainly for milk, meat, hides, and eggs. Donkeys are used for
transportation of water from water sources and goods from one place to another in remote areas
where there is poor road networks with rugged terrain. The prolonged rainfall resulted into
adequate pasture and water for livestock thus good body conditions and increased milk
productivity.
Pasture and browse situation
Pasture and browse condition was generally good and above normal in all livelihood zones.
Livestock had enough pasture which contributed to good health and high production compared to
normal at this period of the year. Pasture is expected to last for 3-4 months in all livelihood zones
compared to two months normally, while browse to last for up to four months in all zones from
the expected three months at normal. Hay harvesting and baling in mixed farming and agro-
pastoral zones were delayed because of the prolonged rainfall. There were minimal limiting
factors to access of pasture and browse except for areas in Pokot central and Pokot South sub-
counties where sections of roads and pathways had been cut-off by floods and landslides. Crop
residues contributed little to livestock since forage was in abundance.
Table 4: Pasture and Browse condition
Pasture Browse
Liveliho
od zone
Conditi
on
How long to last
(Months)
Factor
s
Limiti
ng
access
Condition How long to
last (Months)
Factor
s
Limiti
ng
Access
Current Norm
al
Curre
nt
Norm
al
Curre
nt
Norm
al
Curre
nt
Norm
al
Pastoral Good Fair 3 2 N/A Good Fair 4 3 N/A
Agro
pastoral
Good Fair 4 3 Road
cut-
offs
Good Good 4 3 Road
cut-
offs
Mixed
farming
Good Good 4 3 N/A Good Good 4 4 N/A
Livestock Productivity
Livestock body condition
The body condition for all livestock species is good across livelihood zones, as compared to
normal which would have been fair. The good condition is attributed to prolonged rainfall that has
made water and pasture sufficient for livestock. The body condition is likely to remain stable as
more rain is being received. Livestock have been fetching high prices and good returns due to
good body conditions and high demand especially during the festive season and urge for
restocking.
Table 5: Livestock body condition

6
Livelihood zone Cattle Sheep Goat Camel
Curren
t
Norma
l
Curre
nt
Norm
al
Curre
nt
Normal Curre
nt
Norm
al
Pastoral Good Fair Good Fair Good Fair Good Good
Agro-pastoral Good Fair Good Fair Good Fair N/A N/A
Mixed Farming Good Good Good Good Good Fair N/A N/A
Tropical livestock units (TLUs)
In all the livelihoods zones, the TLUs slightly increased due to the availability of water, pasture
and browse. The previous drought periods had led to decline in TLUs far much below normal, the
figures, which are now increasing. Birth rates and calving intervals increased compared to the
usual normal seasons.
Table 6: Tropical Livestock Units (TLUs) by household income groups
Livelihood zone Poor income households Medium income households
Current Normal Current Normal
Pastoral 2-3 3-4 4-6 7-8
Agro-pastoral 2-3 3-4 4-5 5-6
Mixed Farming 2-3 3-4 3-4 4-5
Birth rate
There were improved birth rates especially in small stocks attributed to good pasture and browse
as well as water availability.
Milk Production and consumption
Milk production is adequate at the household level across all the livelihood zones, mostly from
cattle and camel. Most livestock, particularly, lactating have not yet migrated due to the
availability of water, pasture and browse thus are providing milk to households. The average milk
production is currently about 3 litres per household per day across livelihoods compared to
normal of 2 litres. The price of milk is generally low in all livelihood zones because there is
limited demand.
Table 7: Milk production, consumption and prices
Livelihood zone Milk Production
(Litres)/Household
Milk consumption
(Litres) per Household
Prices (Ksh)/Litre
Current LTA Current LTA Current LTA
Pastoral 2 1.5 2 1.5 50 60
Agro-pastoral 3 2 2 2 45 60
Mixed Farming 4 3 2 2 30 40
Migration
Livestock migration has not been reported in any of the 3 livelihood zones, apart from the usual
movements. In normal years, the animals would have migrated by such a time in search of water
and pasture especially in pastoral livelihoods residing in Pokot Central and Pokot North.

7
Mortalities and Diseases
The main notifiable livestock disease outbreaks reported in different parts of the County were,
Lumpy Skin Disease (LSD) and Foot and Mouth Disease (FMD) in Lelan, Tapach and Chepareria
Wards of Pokot South Sub-County. In Pokot North Sub-County Lumpy Skin Disease was
reported in Suam, Kapchok and Kodich Wards. Other diseases reported were Peste des Petits
Ruminants (PPR) in Seker, Lomut, and parts of Kasei wards across the county. As a result of Foot
and mouth disease outbreak in Lelan markets were closed to prevent the spread of the disease.
The livestock diseases and deaths affected productivity and body condition in the outbreak areas.
Water for Livestock
The main sources of water for livestock and domestic use are rivers, streams, water pans, laggas,
shallow wells, and boreholes. The water sources had over 70 percent recharge in all livelihood
zones and expected to last for 3-4 months compared to 1-2 months normally. The current trekking
distance from grazing areas to water points is shorter compared to normal. The distance in
pastoral and agro-pastoral zones is two kilometers while that of mixed farming zones is less than
one kilometer compared to five and two respectively. The frequency of watering livestock in
Pastoral and agro-pastoral areas is 7 times a week in all livelihood zones. Under normal
circumstances for such time of the year, the watering frequency is usually 3-4 times per week in
pastoral and agro-pastoral zones.
Table 8: Water for livestock
Livelihood
zone
Return trekking
distances (Kms)
Expected duration to
last (Months)
Watering frequency
Current Normal Current Normal Current Normal
Pastoral 2 7 4 3 7 4
Agro pastoral 1 3 4 3 7 6
Mixed
Farming
0.5 2 4 3 7 7
3.1.4 Impact on availability
The good body condition has contributed to improved milk availability, high livestock prices, and
quality meat all of which have improved food security at the household level. The high maize
stocks at the household level have improved food availability.
3.2 Access
3.2.1 Market – prices and functioning
All markets were operating without disruptions except the ones in Lelan ward, which had been
closed indefinitely after the veterinary services confirmed the presence of FMD. Farmers in these
areas could not be able to sell or buy livestock, therefore, affecting their livelihoods and income.
However, the markets will soon be opened because the animals have already been vaccinated. The
main livestock markets in the county are Kishaunet in the mixed farming, Chepareria, Ortum,
Sigor, Lomut in agro-pastoral livelihood zone and Orolwo, Nakujit and Kacheliba in the pastoral
livelihood zones. Foodstuff markets are Makutano, Chepareria, Chepkopegh, Ortum, Orolwo,
Kaibichbich, Kacheliba and Amakuriat. The market supply of livestock is currently low across the
livelihood zones compared to normal. The sources of livestock are mainly from within the
communities around the market area, the neighbouring wards and in North Pokot some livestock
are from Uganda. Livestock trade is likely to increase in the next 3 months, especially in agro-

8
Figure 3: Maize prices in West Pokot County
Figure 2: Goat Prices in West Pokot County
pastoral and pastoral zones. Currently, both the buyers and sellers of livestock are complaining of
the flow of livestock trade. Farmers cited subsidies of school fees as a reason why the supply of
livestock is low. Traders claim the needs of the farmers are not so high therefore not selling their
livestock in plenty, as some needs are met by income from other sources like farm produce and
livestock products. There were no variations between livelihoods. The common livestock traded
are cattle, sheep, and goats while food items sold on the markets are maize and beans with other
household commodities in the markets being cooking oil, sugar, and soap. The quantities traded
are normal for such time of the year.
Market Prices
Maize price
The current maize price per kg is Ksh. 36, being 14 percent below STA and three percent above
the previous month (Figure 3). There was no significant price variation between livelihoods since
all of them depended on the same sources. The trend of maize price is stable and is attributed to
high supply of maize from external sources which are mainly Trans Nzoia County and the
republic of Uganda as well as local harvests in all livelihood zones.
The maize price is however likely to go up in the
next three months as next season harvests are still
far in October.
Goat price
The current price of a two year medium size goat is
Ksh. 3,780, which is 54 percent above the LTA
price and one percent above the previous month
(Figure 4). The goat price remained invariable
between livelihood zones and is projected to remain
stable in the next 3 months due to expected onset of
long rains which would enhance the body condition
as water and browse remain plenty.

9
Figure 5: Terms of Trade in West Pokot County
3.2.2 Terms of Trade
The current terms of trade (ToT) is 106,
being 81 percent above LTA and one
percent lower than the one reported in the
previous month (Figure 5). The ToT is
similar across the livelihood zones and is
predicted to decline in the next three
months as the price of goat is likely to be
stable while that of maize projected to
increase.
3.2.3 Income sources
The current main income sources include;
sale of livestock and livestock products in
pastoral and agro-pastoral livelihood zones
whereas households in mixed farming
livelihood zone relied on sale of farm produce. Sale of poultry is common across livelihoods.
3.2.4 Water access and availability
Major water sources
The major sources of water in the County for both households and livestock were boreholes,
rivers, water pans, traditional water wells and springs. Generally, there was 32 percent for
traditional river wells, 19 percent for both boreholes and pans and dams, 15 percent for rivers
while use of traditional water wells at 6 percent. Agro-pastoral livelihood zones relied mostly on
boreholes and traditional water wells while mixed farming livelihood zone relied on rivers and
springs as pastoral livelihood zones depended mostly on boreholes, traditional shallow wells and
water pans. There was a significant recharge on the water sources in all livelihood zones that
filled between 75 and 80 percent. Generally, the level of water in rivers is approximately 75
percent while boreholes are fully recharged. In the normal year at such time, most people rely on
fewer sources such as boreholes, water pans and rivers alone, as compared to the current year
where people are getting water from different sources such as boreholes, rivers, springs, scooping
from laggas. In the entire County, there are a total of 174 boreholes, 89 water pans and 297
springs that are operational with 33 boreholes and 10 springs being non-operational. The non-
operational water sources were due to borehole breakdown, non-replacement of boreholes parts
and inadequate spare parts to repair them, poor siting and siltation of water pans while springs
were covered by mud and huge boulders during the landslides that occurred in November 2019.
Location and name of operational and non- operational water sources
Table 9: Operational water sources
Source Pokot
North
Pokot
South
Pokot
Central
West
Pokot
Total
Boreholes 104 20 30 20 174
Water pans 40 4 25 20 89
Springs 2 213 24 58 297
Total 107 236 58 83 484

10
Table 10: Non- operational water sources
Source Pokot
North
Pokot
South
Pokot
Central
West
Pokot
Total
Boreholes 15 4 6 8 33
Water pans 10 2 4 3 19
Springs 0 10 0 0 10
Total 34 4 16 8 62
The existing water in the water pans in the agro-pastoral and pastoral zones is expected to last for
three months while the boreholes and springs are expected to last for the whole year across all the
livelihood zones.
Distance to water sources
The return distance of water points have decreased from 3 km to 2 km in agro-pastoral zones
while that in pastoral zones from 5 km to 4km as the one in mixed farming livelihood zones
remained 0.2 km.
Waiting time at the source
The waiting time at water sources was normal across the three livelihood zones; in pastoral zones
at 0-60 minutes, 0-45 minutes in agro-pastoral and 0-30 minutes in mixed farming zones. In the
pastoral livelihood zones, the long waiting time is a result of giving preference for livestock to
drink water first.
Cost of water
The water remained free across the three livelihood zones at the source. However, there was a
decrease in water vendors' cost from Kshs 50 to Kshs 20 per 20 litre jerrican. The decrease is
attributed to the reduction in the return distance to the water sources. Households around market
centres and towns across the livelihood zones in the County were mainly supplied water by
vendors, whose price was similar.
Water consumption
The average water consumption was 15 litres per person per day (lpppd) in the mixed farming
zone, 10 lpppd in the agro-pastoral livelihood zones and 8 lpppd in pastoral livelihood zones.
Least consumption was noted in pastoral zones as attributed to relatively longer return distance to
water sources and more waiting time at water sources. Currently, latrine coverage is at 25, 50 and
80 percent coverage in the pastoral, agro-pastoral and mixed farming livelihood zone respectively.
There is possible contamination across the livelihood zones at water sources especially in water
pans and rivers where both livestock and humans wade in to drink, bathe, launder and surface
runoff as a result of rains.
3.2.5 Food Consumption
Food Consumption
A total of 98 percent of households fell in the acceptable food consumption score, with 0.7
percent being in borderline and 1.3 percent in the poor category in February 2020, indicating an
improvement compared to 78, 21.3 and 0.7 percent for acceptable, borderline and poor categories
respectively recorded in January 2020. There was significant variation between the two livelihood
zones with for instance 100 percent of households in the agro-pastoral zone being categorized as
having acceptable FCS compared to 63 percent households under the same category in the
pastoral livelihood zone. There is high food source diversity in agro-pastoral livelihood zones as
compared to pastoral livelihoods.
11
Milk consumption
Currently, households across livelihood zones in January 2020 have an average milk consumption
of 1.6 litres per household per day, representing 33 percent above that of the LTA while similar to
that of December 2019. (National drought management authority Drought Early Warning Bulletin
for January 2020). The above-normal milk consumption is attributed to the increased milk
production associated with good livestock body condition due to adequate forage and water. The
current average price of milk is Kshs 45 per litre, being 25 percent below the LTA price. The
below normal price is a result of plenty of milk at the household level, which translates to better
food security.
3.2.6 Coping strategy
The reduced coping strategy index (rCSI) for February 2020 was 84.7, 11.3, 2.7 and 1.3 percent
for none, stressed crisis and emergency categories respectively. The levels indicate a general
improvement compared to the one recorded in January 2020 was 75.8 and 24.2 percent were for
none and stressed categories with zero percent for crisis and emergency each. The decrease
indicates that households employed fewer strategies to cope with cases of food inadequacy. The
lower rCSI, therefore, is attributed to favourable food commodity availability and access at
households and markets respectively. There was no significant variation in coping between
livelihood zones.
Livelihood Coping
Households are categorized to be having no coping, stressed coping, crisis coping and emergency
coping at 98.3, 0.8, zero and 0.8 percent respectively in February 2020, as compared to 98, 0.7,
zero and 1.3 percent in none, stressed coping, crisis coping and emergency coping respectively.
The percent for both crisis and emergency coping decreased from 1.3 in January to 0.8 in
February indicating a notable improvement.
3.3 Utilization
3.3.1 Morbidity and mortality patterns There was a significant decline in morbidity cases of the three main diseases; Upper Respiratory
Tract Infections, Diarrhoea and Malaria compared to the year, 2018. The decline is attributed to a
series of health interventions conducted at the community level such as health education on
disease prevention by use of long-lasting insecticide-treated nets (LLITN) in preventing the
spread of Malaria, community-led total sanitation (CLTS) through sanitation nutrition activities
and availability of freshwater which reduced contamination thus few cases of diarrheal cases. The
County experienced an outbreak of Measles in three wards of Kiwawa, Kasei and Alale of Pokot
North in which five cases were confirmed and the health team responded immediately and was
able to contain the situation. There were no deaths reported. Epidemic prone and waterborne
diseases including Malaria and Typhoid fever increased significantly as compared to 2018 due to
enhanced rains during the year which favored high mosquito breeding while low latrine coverage
coupled with open defecation of 51.3 percent in 2019 being responsible for upsurge cases of
Typhoid. The under 5 (U5) years mortality rate and crude mortality rate were 0.11 percent, which
is an insignificant value compared to the threshold of <10 percent, which is within the WHO
acceptable threshold.
3.3.2 Immunization and Vitamin A supplementation
The immunization coverage for fully immunized child (FIC) slightly increased from 42 to 47
percent in the year 2019 compared to 2018, being below average as the WHO recommends 80

12
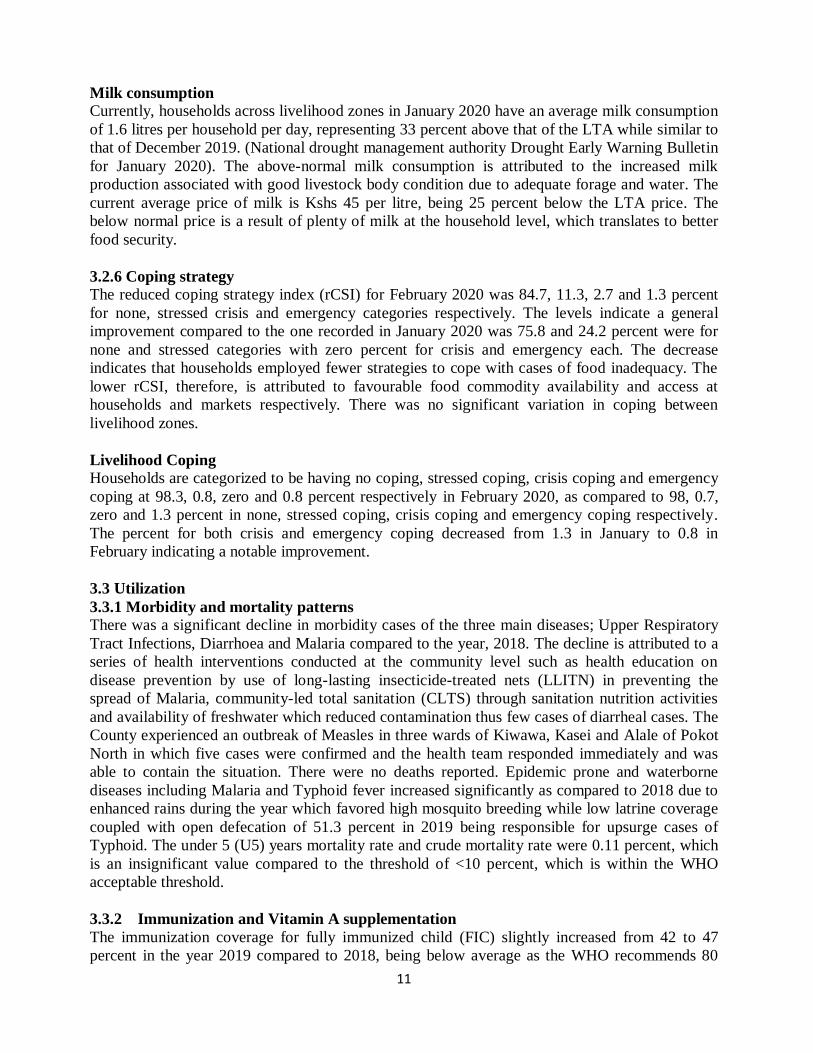
Figure 6: percent of children at risk by MUAC in West
percent coverage for better immunity in child protection from childhood illnesses. The antigen
coverage for both OPV1 and Measles increased from 57 to 59 percent and 42 to 47 percent in
2018 and 2019 respectively, whence attributed to increased outreach sites and availability of the
vaccines. Coverage for antigen OPV3 dropped from 54 percent in 2018 to 40 percent in 2019.
The reasons for low coverage were linked to stock-outs of the vaccines and break down of
expanded programme on immunization (EPI) fridges. The Vitamin A supplementation coverage
for children between six to 59 months registered a significant improvement of 75 in 2019
compared to 69 percent in 2018. The improvement is attributed to the availability of Vitamin A
capsules, integrated health services during outreaches, monthly monitoring, OJT & mentorship of
health services providers and quarterly support supervision by the County and Sub-county health
management teams. The trends for both U5s and the general population morbidities follow a
common pattern such that, when there is a decrease or increase in U5s, that of the general
population decreases/increases too.
3.3.2 Nutritional status and dietary diversity
The proportion of 49 and 51 percent of
girls and boys under 5 years respectively
were sampled in February 2020, where the
children rated as being ‘at risk’ of
malnutrition were at 2.5 percent, showing
a decrease from 2.6 reported in January
2020 while being 78 percent lower than
LTA. The nutrition status of under-fives
improved and is linked to sufficient milk
consumption alongside other essential
health and nutrition commodities. These
were the main drivers for the reducing
number of children ‘at risk’ of
malnutrition. The number of meals
consumed by households fell within the
normal range of between two to three per
day, for both U5 and the general population. The household dietary diversity was 36.9 percent in
2017 up from 24.6 percent in 2014 (KAP and SMART Surveys, 2017). The Early initiation to
breastfeeding was 95.5 percent whereas exclusive breastfeeding rate is 39.9 percent which again
is below the national threshold of 61 percent and below average, main reasons being: inadequate
knowledge on maternal-infant and young child nutrition, poor feeding practices including
maternal workload. The current levels of malnutrition in the County are as follows, stunting rate
at 35.1 percent in 2019 down from 38.2 percent in 2018, Global Acute Malnutrition (GAM) at
11.7 percent in 2019 slightly up from11 percent in 2018, Severe Acute Malnutrition (SAM) at 1.9
percent in 2019 up from 0.9 percent in 2018 and for underweight at 31.4 percent in 2019 down
from 40.1 percent in 2018. The malnutrition trends have been on downward in all the programme
indicators due to MOH and Partners support in Nutrition programming, for example, capacity
building of health care workers on new programs, scaling up of health facilities on IMAM Surge
services, health & nutrition education at the community level. The most likely cause of
malnutrition in West Pokot County are Poor feeding practices among children under five years,
poor dietary diversity among children under five years, child illnesses or diseases, inadequate
knowledge on maternal-infant and young child nutrition by the community, inadequate technical

13
staff to deliver correct information on maternal-infant and young child nutrition and maternal
workload affect women ability to feed young children.
3.3.2 Sanitation and Hygiene
The main sources of water for domestic use are water pan/dams, rivers/springs, shallow wells,
pipe systems and boreholes at 34, 15, 14, 11 and 10 percent respectively with the percent of
households using unprotected water sources being 70 countywide. The households draw their
water using jerricans and store either covered with lids while others do not cover, the former, who
constitute the majority. Most of the households do not treat their water and are estimated at 90
percent while the rest do the treatment by either boiling, use of aqua tabs or chlorine. The above
behavior contributed to increased cases of typhoid. The water treatment is more practiced in
mixed farming and agro-pastoral compared to the pastoral livelihood zones, the reason being that
awareness is currently high in the mixed farming and agro-pastoral compared to pastoral
livelihood zone, hence high vulnerability to waterborne diseases in pastoral zones. Sources of
water contamination are rivers, unprotected springs and shallow wells in all livelihoods with
water pans and dams leading in Pastoral and agro-pastoral livelihood zones. The corrective
measures taken by livelihood zones include: Development of the wells by use of culverts,
brick-lining with use of hand pumps on traditional shallow wells. Construction of draw-off
structures, encouragement of water treatment practices and capacity build the community on good
hygiene practices with enforcement law on discouraging people from bathing in rivers to target
open water source users. Most of the community members disposed of their human and household
wastes in the open while few used pit-latrines and waste pits. The latrine coverage is 55, 30 and
15 percent for mixed farming, agro-pastoral and pastoral livelihood zones respective. The
majority of the households (80 percent) do not practice handwashing at 5 critical times in which
most only wash their hands before and after eating and after visiting toilets. This is the likely
major cause of food contamination and WASH associated diseases in the population.
3.4 Trends of key food security indicators
Table 11: Food security trends
Indicator Long rains assessment, July
2019
Short rains assessment, Feb
2020
Percent of maize stocks held
by households (Agro-
pastoral)
128 111
Livestock body condition Good Good
Water consumption (litres
per person per day) 8 lpppd 15 lpppd
Price of maize per kg Kshs 54 Kshs 36
Distance to grazing 4.8 km 3.3 km
Terms of Trade 57 106
Coping strategy index 2.3 2.2
FCS: Across all livelihoods:
Acceptable 69 98
Borderline 26 0.7

14
Indicator Long rains assessment, July
2019
Short rains assessment, Feb
2020
Poor 5 1.3
rCSI (None, Stressed, Crisis) 77.4, 26.2 and 2 75.8, 24.2 and 0
Livelihood Coping (N, S, C
and E)
98, 1.2, 0 and 0.8 98.3, 0.8, 0 and 0.8
3.5 Education
3.5.1 Enrolment
There was a higher enrolment of girls than boys in early child development at 50.2 and 49.8
percent respectively, with no notable transfers at the early child development level. Most feeder
early child development had no classrooms and learning was taking place in churches and under
trees mainly in pastoral and agro-pastoral livelihood zones. The early child development
education learners did not have any form of school feeding program during the study period. A
few schools mainly in mixed farming and urban centres had arranged to have some feeding
program supported by the parents. In primary schools, there were more boys than girls at 51.1 and
48.9 percent respectively. The enrolment was stable mainly because of food presence at home and
school. Regular school meals program (RSMP) was available in all schools while Home Grown
School Meals Programme (HGSMP) in some schools. There were low-cost boarding primary
schools in some parts of the county and no notable inter- sub-county transfers were experienced.
At the secondary school level, enrolment was stable in comparison to the previous period, due to
affordable fees owing to government subsidy including allocation of bursaries by county
government, national government, and partners. Besides, the national government’s 100 percent
transition policy has contributed to the stability in school enrolments.
3.5.2 Participation
There was an increase in attendance rate in ECDE in term one 2020, compared to third term 2019
for both boys and girls by 6.8 and 4.8 percent. In primary schools, attendance of girls increased by
2.3 percent while boys’ attendance increased by 2.7 percent. The increase in attendance by both
boys and girls is attributed to the availability of food at home and at school as well as minimal
migration experienced during the assessment period since there were no unusual livestock
migrations reported in the county. Attendance in secondary schools was stable mainly because of
bursaries, fees subsidy and 100 percent transition policy. It was further observed that the absence
of sanitary towels among the adolescent girls had negatively affected their school participation at
both primary and secondary school levels.
3.5.3 Retention
The dropout rate decreased across the three levels of education in the first term 2020, as compared
to the third term 2019. The main factors contributing to the drop out in ECDE and primary
schools includes the absence of food, long distance to school and family labour responsibilities.
•In secondary schools teenage pregnancies, child marriages, fees, and cost of education, family
ignorance on the value of schooling and family labour responsibility were among the factors
leading to the dropout.
3.5.4 School meals programme

15
All the schools in the county were enrolled on RSMP compared to the third term 2019 when only
sub-county (North Pokot) was benefitting from the program. All schools that were benefiting
from ECDE fortified porridge had not received the consignment during the assessment period. It
was established that RSMP benefits 94,190 boys and 93,343 girls in entire West Pokot County.
The feeding program has enhanced enrolment, retention and improved school attendance. There
were no school meals for ECDE learners and as such, the absence of food at school for these
levels had negatively affected enrolment, attendance, retention, and transition.
3.5.5 Inter-Sectoral links where available
The majority of schools get water from rivers and boreholes which constitute 70 percent while the
remaining 30 percent have piped water which is not sustainable. All schools have toilets although
most of them are inadequate. 80 percent of schools do not have handwashing facilities while the
majority of feeder early child development education centres do not have functional latrines.
Deworming and Vitamin A supplements were done in all early child development education
centers and data in the Ministry of Health estimated 80 percent of ECDE children were
supplemented with Vitamin A and deworming drugs. Currently, there is no corporal punishment.
Majority of the teaching staff are hired by School Management Boards (BOMs) which comprise
of 60 percent of total staff. Teachers Service Commission (TSC) employed teachers comprise of
40 percent. Some teachers do not regularly attend classes due to drug addiction (alcoholism).
Most of the schools have few classrooms which have contributed to overcrowding in classes
while some classes are conducted under trees, a scenario that cuts across the entire county,
although mostly in pastoral and agro-pastoral livelihood zones of Pokot North and Pokot Central
sub-counties.
4.0 FOOD SECURITY PROGNOSIS
4.1 Prognosis Assumptions
As per the Kenya Meteorological Department (KMD), downscaled forecast, the county is
expected to continue receiving enhanced including long rains (MAM 2020) through to June
2020.
The maize price is likely to increase in the next six months as next season harvest is still far
in October. Goat prices are expected to remain stable over the same period since the
projected good long rains would boost forage and water for sustained body condition.
The County’s terms of trade are anticipated to maintain the above normal levels and being
favorable over the next six months as maize and goat prices assume upward and stability
trends respectively.
Considering the positive rainfall forecast, the current condition of pasture and browse is
likely to remain good and last beyond MAM 2020. As such, milk production and
consumption would be good and enhance food security in the County.
Given the current trend of main water sources, respective return distances for both domestic
and livestock while taking into account the projected duration as well as the positive MAM
forecast, water availability is expected to remain stable across the livelihood zones beyond
the MAM season.
Based on the analysis, the County’s food availability and access are likely to fluctuate
within the normal ranges, posing none or minimal threat to eventual food security at the
household level.
As the season is projected to be successful based on the forecast, crop performance is
expected to be good and lead to pumper harvests resulting in high stocks.

16
4.2 Food security Outlook for the next 6 months
Food security outcome in the next three months (February to April)
The food consumption at the household level is expected to remain stable as milk consumption
will still be good during the March April May (MAM) season since livestock will be having high
production. Forage conditions are currently good and projected to remain good are likely to
maintain the good body condition of livestock leading to improved livestock productivity, thus
enhancing birth rates and subsequent TLUs. The likely stable food consumption would enable
improved nutrition status for children as households are likely to have access as required. As
human welfare remains stable with the current below normal mortality rates, the situation is
expected to remain good since there are no anticipated hazards and shocks. The majority of the
households therefore currently classified as None/Minimal (IPC Phase 1) and expected to remain
in this phase up to May 2020.
Food security outcome for May to July
By July 2020, the food consumption at the household level is expected to remain stable since milk
consumption will still be good, just one month from the MAM season. During the same period,
livestock will continue in high production level having come from the main rain season. Forage
conditions are would equally remain good and therefore likely to maintain the good body
condition of livestock leading to improved livestock productivity and enhanced birth rates for
higher TLUs. The improved food consumption is expected to sustain good nutrition status for
children. During this period, the food commodity prices would have not changed much thus food
access will still be good and normal. Mortality rates will still be below normal during the
forecasted period. Most of the households in the County will still be classified as None/Minimal
(IPC Phase 1) as of July 2020.
5.0 CONCLUSION AND INTERVENTIONS
5.1 Conclusion
5.1.1 Phase classification The Phase Classification is ‘None/Minimal’ (IPC Phase 1) all livelihood zones of the county.
5.1.2 Summary of Findings
The rainfall performance was above normal, with timely onset, even spatial and good temporal
distribution in addition to above normal cumulative amounts besides early cessation. The county
experienced shocks from landslides and floods on top of cases of livestock/crop pests and
diseases including FMD, LSD and desert locust invasion. Although October, November, and
December are not the main cropping season, the excessive rains affected normal production. The
maize price was below the LTA price. There was generally improved livestock production owing
to good rains that enabled enhanced forage and water availability in all livelihoods. Livestock
prices increased and remained above the LTA price across livelihoods, with the terms of trade
improving to above normal. Distance to water sources decreased significantly as main water
sources recharged sufficiently and projected to last for more than a normal period. There were
downward morbidity trends across livelihood zones for Upper Respiratory Tract Infections,
Malaria, and Diarrhoea as common diseases in the County. Rates for both GAM and SAM were
lower than standard with a downward trend. The county, however, maintained low latrine
coverage, especially in the pastoral livelihood zones. There was improved Vitamin A
supplementation coverage as well as fully immunized children. Food consumption improved

17
compared to November 2019 as the CSI decrease, indicating an improved food security situation
in all livelihoods.
5.1.3 Sub-county ranking
Sub County Food security
rank (1-10)
Main food security threat (if any)
Pokot Central 4 - Affected by landslides/Floods
- Locusts invasion
- Cut-off roads network
- Post-harvest losses
- Low access to health facilities, erratic supply of drugs
- Poor sanitation practices
- Livestock diseases
Pokot North 3 - Livestock diseases
- Outbreak of measles
- Locust invasion
- Crop pest and diseases
- Poor sanitation practices
- Limited access to health care services
Pokot South 2 - Affected by landslides/floods
- Livestock diseases
- Crop pests and diseases
- Cut off roads network
Pokot West 1 - Access to services- health, infrastructure
- Even distribution of rainfall
- Operational markets
- Still having household stocks
- Water availability and accessibility
5.2 Ongoing Interventions
5.2.1 Food interventions
5.2.2 Non-food interventions
Intervention Objective Specific
Locatio
n
Activit
y
target
Cos
t
No. of
beneficiari
es
Implemen
tation
Time
Frame
Implementatio
n stakeholders
1. Water
Sector
Rehabilitatio
n/upgrade of
boreholes to
solar power
To increase
availability
and
accessibility
of clean and
safe water
Alale,ka
pchok,S
uam,
Kodich,
Masol,C
hepareri
19200 25.6
M
19200 2019-2020 ACF. World
Vision and
COG

18
a
Pipeline
extension
To increase
availability
and
accessibility
of clean and
safe water
Tapach,
Cheparer
ia, Batei,
Kodich,
Lomut,
siyoi
2400 3M 2400 2019-2020 COG
Distribution
of water
storage
containners,
soaps, and
water
treatment
chemicals
(Aquatabs)
To increase
availability
and
accessibility
of clean and
safe water
and
handwashin
g practices
Alale,ka
pchok,S
uam,
Kodich,
Masol,C
hepareri
a
42500 3.8
M
42500 2019-2020 ACF
Construction
of intakes
and treatment
works
To increase
the
availability
and
accessibility
of clean and
safe water
Batei 5000 9M 5000 2019-2020 COG
Rehabilitatio
n of intakes
rising main,
tank
construction
To increase
the
availability
and
accessibility
of clean and
safe water
Lelan,
Tapach,
Siyoi
and
Lomut
6000
4.8
M
6000 2019-2020 COG
Dam
construction
To increase
the
availability
and
accessibility
of clean and
safe water
Kiwawa 4000 70
M
4000 2019-2020 GOK
2. Agriculture
Construction
of Kamelei
Reduce
post-harvest
Tapach 1 4M 1Year County
goverment

19
potato cool
store
losses and
increase
income
Construction
of Onion
store
Reduce
post-harvest
losses and
increase
income
Batei 1 2M 1 Year County
goverment
Distribution
of Onion
seeds
Increase
area under
bulb onions
Batei,
Lomut
8M Over 200
farmers
1Year Counthgoverme
nt
3. Health and Nutrition (Countywide)
Intervention
Location No. of beneficiaries Implemente
rs
Estimated
Cost (Ksh)
Time Frame
Male Female
Vitamin A
Supplementation
All
immunizing
health
facilities
(130 )
54453 49167 MOH,
MOE,
Partners
(ACF,UNIC
EF)
4.6Million Ongoing
Zinc
Supplementation
All health
facilities
( 117 )
54453 49167 MOH and
partners (
UNICEF,
ACF)
Ongoing
Management of
Acute
Malnutrition
(IMAM)
84 0f 105
health
facilities and
61 outreach
sites
43456 60164 MOH,
Partners
(ACF, ,
KRCS, )
10 million 1 year
IYCN
Interventions
(EBF and Timely
Intro of
complementary
Foods)
112 of 117
health
facilities and
61 outreach
sites
28640 MOH,
Partners(AC
F, UNICEF,
KRCS)
3 million Ongoing
Iron Folate
Supplementation
among Pregnant
Women
All
immunizing
health
facilities and
outreach sites
28867 MOH,
Partners
(ACF,
UNICEF,
KRCS,)
500000 5 years
Deworming All
immunizing
108913 MOH,
MOE,
2million 5 years

20
health
facilities
Partners
(ACF,
UNICEF,
KRCS)
Food Fortification Wholesalers,
supermarkets,
retail shops,
open markets
and
households
112620 108913 MOH,
Partners
(ACF,
UNICEF,)
3.4Million 5yeara
OTHER
PUBLIC
HEALTH
INTERVENTIO
NS
1. CLTS All the
community
695447 NGO, RED
CROSS,
3Million 2years
SANut All 675447 MOH/RED
CROSS/AC
F/UNICEF
1.5 Million 2years
4. Livestock
Intervention Ward No .of
beneficiarie
s
Implemen
ters
Impacts in terms
of food security
Cost Time
Frame
Logistical
support in
livestock
disease
surveillance,
treatment,
deworming
and
vaccination
Seker,
Lomut,
Chepareria
, Tapach,
Lelan,
Kodich,
Kapchok,
Alale,
Suam,
Kasei,
135,390
livestock
13,539
farmers
Action
Against
Hunger
(ACF)
Timely response
to interventions
thus safeguarding
livelihoods and
source of food
(milk and meat)
3,070,929 2019 Aug-
2020 Aug
Training of
veterinary staff
and
Community
Disease
Reporters on
Participatory
Disease
Surveillance
34
veterinary
staff
100
Community
Disease
Reporters
Action
Against
Hunger
(ACF)
Improved
livestock disease
reporting thus
protecting the
source of
livelihoods and
source of food
(milk and meat).
5,586,799 2019 Aug-
2020 Aug

21
Purchase of
pasture seeds
West and
south sub-
county
County
governme
nt
2020/2021 10,000000 ongoing
5.3 Recommended Interventions
5.3.1 Food interventions
Sub-county Food security rank (1-4) Proportion in need of immediate food
assistance (%)
Pokot North 1 15-20
Pokot Central 2 10-15
Pokot South 3 5-10
Pokot West 4 5-10
5.3.2 Non-food interventions
Sub-
county
Interventi
on
Location No. of
targeted
beneficia
ries
Proposed
implemente
rs
Require
d
resourc
es
Availab
le
resourc
es
Timeframe
1. Water
Pokot
North and
Pokot
Central
Equipping
of drilled
boreholes
Kapchok,
Suam
,Kiwawa and
Masol
7000 GOK,
C.O.G and
Developme
nt partners
2M 0 2019-2021
Pokot
North
Central,
and West
Desilting
of water
pans
Kapchok,
Suam,Alale
,Kiwawa,
Kodich,Kasei
, Masol and
Kong’elai
12000 GOK,
C.O.G and
Developme
nt partners
38M 0 2019-2021
Pokot
North
Central,
and West
Sand dam
constructio
n
Kapchok,
Suam
,Kiwawa,
Kodich,Kasei
, Masol and
Kong’elai
17000 GOK, COG
and
Developme
nt partners
10.8M 0 2019-2021
Pokot
North
Central,
South and
West
Supply of
10,000 ltrs
plastic
tanks
Alale,
Kapchok,Kas
ei, Kiwawa,
Kodich,
Suam,
Mnagei,
Riwo,
Kapenguria,
Siyoi,
Endogh,
Sook,
Tapach,
40000 GOK, COG
and
Developme
nt partners
14.4M 0 2019-2021

22
Lelan, Batei,
Madol,
Lomut,
Sekerr
2. Livestock
Sub County Intervention War
d
No .of
beneficiari
es
Implemente
rs
Impact
s in
terms
of food
securit
y
Cost Time
Frame
Central
Pokot
Holding
ground
rehabilitation(s
urveying
fencing
construction of
office/bomas)
Runo
Weiw
ei
ward
County
government
15,000,0
00
2020/2021
All sub-
counties
Poultry supply All
wards
County
government
To
promot
e food
security
and
income.
20,
000,000
new
South Pokot Wool sheep
merino
South
Pokot
To
improv
e
income
generati
on
4,000,00
0
new
Central/Nort
h Pokot
Boran bulls Improv
e cattle
breeds
15,000,0
00
new
3. Health and Nutrition
Immediate Recommended Interventions
Sub-
County
Intervention Location No. of
beneficiaries
Proposed
Implement
ers
Required
Resources
Availabl
e
Resourc
es
Time
Frame
All Accelerated
Integrated
outreach
Pastoral
and
agropasto
Children <5
years
(108913)
County
Government
,
Funds,
Equipment,
medical
Human
resource
though
1year

23
services ral zones
acrss the
county
and parts
of mixed
farming
zones
Pregnant and
lactating
mothers of
children less
than 6 months
MOH,Partn
ers (ACF,
KRCS,
UNICEF)
supplies,
Nutrition
commoditi
es,
IEC
materials,
Report
tools
Utility
vehicle
inadequa
te
All Cbfci
implementati
on
All the
livelihood
zones
All the
communityCh
ildren<5 years
(112287)
County
Government
,
MOH,Partn
ers (ACF,
KRCS,
UNICEF)
Utilityvehi
cle,
Human
resource
though
inadequa
te
1year
All Accelerated
Integrated
outreach
services
Pastoral
and
agropasto
ral zones
across the
county
and parts
of mixed
farming
zones
Children <5
years
(108913)
Pregnant and
lactating
mothers of
children less
than 6 months
County
Government
, MOH,
Partners
(ACF,
KRCS,
UNICEF,
WVK)
Funds,
Equipment,
medical
supplies,
Nutrition
commoditi
es,
IEC
materials,
Report
tools
Utility
vehicle
Human
resource
though
inadequa
te
1year
All
SaNut
activity
Pastoral
and
agropasto
ral zones
across the
county
and parts
of mixed
farming
zones
All
Households
with children
under five
years,
pregnant and
lactating
mothers of
children 6-23
months
County
Government
, MOH,
Partners
(ACF,
KRCS,
UNICEF)
Funds Human
resource
though
inadequa
te
1year
Medium and Long term Recommended Interventions
Sub-
County
Intervention Location No. of
beneficiaries
Proposed
Implement
ers
Required
Resources
Availabl
e
Resourc
es
Time
Frame

24
All Roll out of
IMAM surge
model
Pastoral
and agro-
pastoral
zones
across the
county
Health
facilities at the
pastoral and
agro-pastoral
livelihood
zones (84)
MOH, ACF,
UNICEF
Funds for
training,
Nutrition
commoditi
es, medical
supplies
Human
resource
Not
adequate
1 year
All Enhance
Promotion of
appropriate
MIYCN
County Whole
population
(675447)
County
Government
, MOH
Partners
(ACF,
KRCS,
UNICEF)
Funds for
training
Human
resource
1 year
All Enhance
Promotion of
appropriate
WASH
practices
County Whole
population
(675447)
County
Government
, MOH,
Partners
(ACF,
KRCS,
UNICEF)
All Training on
integrated
management
of acute
malnutrition
County Newly
recruited
health care
service
providers
(120)
County
Government
, MOH,
Partners
(ACF,
Funds for
training
Human
resource
1 year
All Role out of
BFCI in
community
units
County 8 Community
Units
100,000
County
Government
, MOH,
Partners
(ACF
Funds for
training
Human
resource
Continu
ing
All Role out of
family
MUAC
County 4 units trained County
Government
, MOH,
Partners
(ACF
Funds for
training,
Family
MUAC
tapes
Human
resource
s
Continu
ing