Embed Size (px)
Citation preview
i
BARINGO COUNTY
2020 SHORT RAINS FOOD AND NUTRITION SECURITY ASSESSMENT REPORT
A joint report by the Kenya Food Security Steering Group and
Baringo County Steering Group
February 2021

i
EXECUTIVE SUMMARY
Food security assessments are carried out twice a year by the Kenya Food Security Steering Group
(KFSSG) and technical government departments of the County Steering Group (CSG). The 2020
short rains assessment in Baringo County was conducted from 18th -29th January, 2021 with the
overall goal of developing an objective, evidence-based and transparent food security situation
analysis following the performance of 2020 short rains. The assessment was also to take into
consideration the cumulative effects of previous seasons and provide recommendations for
possible response options based on the situation analysis.
The onset of the OND was normal and took place in the first dekad of October resulting in an
average amount of 206 mm of rainfall against a normal of 180mm. Both spatial and temporal
distribution of the rains was poor with the peak of the season being observed in the second dekad
of October while cessation of the season was earlier than normal (first dekad of December).
COVID-19 -19 restrictions were still in place which hampered smooth flow of goods and services,
but the most affected were the health and education sectors. The County experienced insecurity
challenges in parts of Tiaty Sub County which led to disruption of markets and other essential
services and currently there is a major security operation going on to restore law and order.
Livestock disease cases were minimal while lake waters are still high causing displacements and
submerging of land. Area under maize acreage reduced for both rain fed and irrigated agriculture
while yield from rain fed agriculture was less than 60 percent of Long-Term Average (LTA) due
to early rainfall cessation. Household stocks were 20 percent above LTA due to carry over from
long rains harvest while forage conditions were good in all livelihood zones except in the pastoral
areas where it’s poor to fair. Livestock body condition was good for all the species across the
livelihood zones other than in pastoral areas where body condition for cattle was fair. Milk
production was below LTA across the County and consumption was near normal, the prices of
milk were above the LTA. Tropical livestock units were below the LTA with livestock disease
outbreak being minimal. Main water sources were at normal capacities, the access distances to
water points remained normal other than in pastoral areas where trekking distances were above
LTA. Waiting time at water points and water consumption were normal across the County.
About 73 percent of the households had acceptable food consumption score while another 25
percent had borderline food consumption score, the coping strategy index (CSI) stands at 12.47
with Agro pastoral livelihood zone having the highest CSI at 16.6. Adult morbidity was on a
declining trend compared to the last three years and the three most common diseases reported were
malaria, diarrhoea and typhoid although the reported cases were lower than in 2019. COVID-19 -
19 impacted heavily on Vitamin A immunization coverage leading to low coverage compared to
the year 2019. Latrine coverage and hand washing practices were reported to be lowest in pastoral
areas at three and two percent respectively but highest in the mixed farming livelihood zone at 78
and 69 percent respectively. According to SMART survey of 2019, malnutrition was highest in
Tiaty Sub County at 20.9 percent (GAM), 9.3 percent (SAM) and 40.1 percent for stunting while
malnutrition by MUAC in December showed 95 percent of the children not being malnourished.
There was a reduction in enrolment for term II compared to term I in both primary and secondary
schools and this was due to COVID-19 related issues that took place while students were at home
such as teen pregnancies, circumcision ceremonies among others. Nearly 5,700 girls did not report
back to school of which 70 percent of the cases could be due to pregnancies. About 73 percent of
all the students in primary schools are under school feeding programs. The indicative phase of
food security classification is Stressed (IPC Phase 2).

ii
Table of Contents
Executive Summary i Table of Contents ............................................................................................................................ ii 1.0 Introduction ................................................................................................................................1
1.1 Methodology and approach 1
2.0 Drivers of food and nutrition security in the County .................................................................2 2.1 Rainfall performance 2 2.2 Conflict/Insecurity 2 2.3 COVID-19 Pandemic 2 2.4 Other shocks and hazards 3
2.4.1 Shocks ..............................................................................................................................3 2.4.2 Hazards 3
3.0 Impact of drivers on food and nutrition security .......................................................................4
3.1 Availability 4 3.1.1 Crop production ...............................................................................................................5 3.1.2 Main cereal stocks ...........................................................................................................7
3.1.3 Livestock production .......................................................................................................7 3.1.3 Water for Livestock .......................................................................................................11
3.1.4 Impact on availability ....................................................................................................15 3.2 .1 Market prices 15
3.2.2 Terms of trade ................................................................................................................17
3.2.3 Income sources ..............................................................................................................17 3.2.4 Water access and availability ........................................................................................18
3.2.5 Food Consumption ........................................................................................................20 3.2.6 Coping Strategy .............................................................................................................21
3.3 Utilization 21 3.3.1 Morbidity and mortality patterns ...................................................................................21
3.3.2 Immunization and Vitamin A supplementation.............................................................22 3.3.4 Health and Nutrition sector in COVID-19 context ........................................................23 3.3.5 Public interventions, risk communication and community level action ........................23
3.3.6 Coordination and leadership in COVID-19 pandemic preparedness and response.......24 3.4 Trends of key food security indicators .............................................................................26
4.0 Food security prognosis ...........................................................................................................29 4.1 Prognosis assumptions .............................................................................................................29
4.2 Food security outlook 30 5.0 Conclusions and interventions .................................................................................................31 5.1 Conclusions ..............................................................................................................................32
5.1.1 Phase classifications..............................................................................................................32 5.1.2 Summary of finding .......................................................................................................32 5.1.3 Sub County ranking .......................................................................................................32 5.2 Ongoing interventions ......................................................................................................33
5.2.1 Food interventions .........................................................................................................33 5.2.2 Nonfood interventions ...................................................................................................33
5.3 Recommended interventions 37 5.3.1 Food interventions .........................................................................................................37 5.3.2 Nonfood interventions ...................................................................................................38
1
1.0 INTRODUCTION
Baringo County borders Turkana and
Samburu Counties to the North,
Laikipia to the East, Nakuru and
Kericho to the South, Uasin Gishu to
the South West, and Elgeyo -
Marakwet and West Pokot to the West.
The area of the County is approximated
at 11,015 square kilometers (Km2) and
a population of 666,783 persons (2019
Housing and Population census, Kenya
National Bureau of Statistics-KNBS).
The County is divided into six (7) sub
Counties namely: - Baringo North,
Baringo Central, Baringo South,
Mogotio, Tiaty East, Tiaty West and
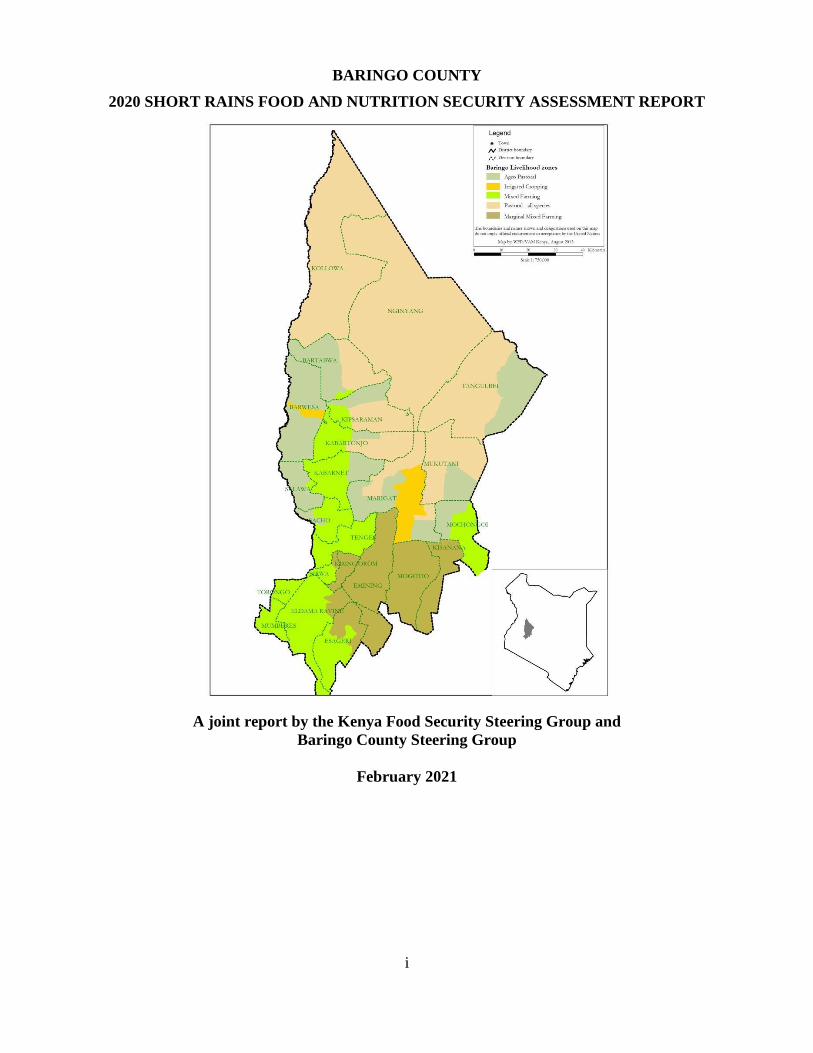
Eldama Ravine. There are four main livelihood zones in the County which include mixed farming,
pastoral, agropastoral and irrigated cropping (Figure 1). The main hazards in the County across
the livelihoods are drought, water shortages and conflicts. Other hazards are crop pests and
diseases in the irrigated cropping and the mixed farming livelihood zones including migratory
pests like Desert Locusts.
1.1 Methodology and approach
The food and nutrition security assessment exercise is usually conducted twice a year to assess the
impact of long and short rains on the livelihoods and as such develop an objective, evidence–based
and transparent food and nutrition security situation analysis using primary and secondary data.
The 2020 Short rains assessment was no different, Primary data was collected from the community
in sample sites that would have focus group discussions, key informant and market interviews.
Transect drive and observation was also used.
Checklists were administered to the relevant departments to collect secondary quantitative data.
Other data that was available to assist in the analysis included livelihood zone data, satellite data
for rainfall, routine Demographic Health Information Systems (DHIS) data and National Drought
Management Authority (NDMA) bulletins. Data collected was then collated, analyzed and
triangulated and analysis made by livelihood zones. The integrated food security phase
classification (IPC) protocols were used to do the classification of the severity and identify the
possible causes of food insecurity. The assessment exercise was conducted by a multi sectoral and
multi-agency team from the County Steering Group and technical experts from the Departments
of Agriculture, Livestock, Water, Education and Health and Nutrition at the County level. The
assessment in the County was done from 18th to 29th January 2021.
Figure SEQ Figure \* ARABIC 1:
Population by livelihoods Figure 1: Population by livelihood zones
31%
22%4%
43%
Baringo County Population
by livelihoods
Pastoral
Agropastoral
Irrigated Cropping
Mixed Farming
2
2.0 DRIVERS OF FOOD AND NUTRITION SECURITY IN THE COUNTY
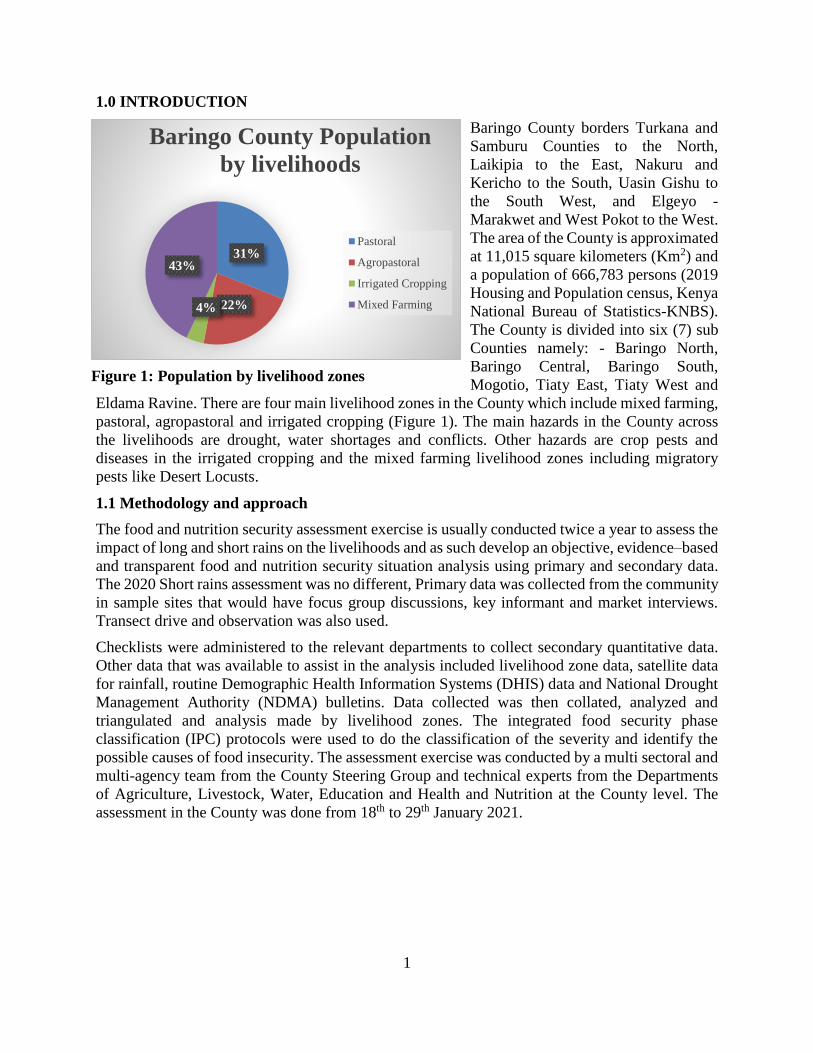
2.1 Rainfall performance
Baringo County receives bimodal rainfall and is
dependent on the long rains of March-April-May
(MAM) which extends to July for crop production. The
short rains season is in October, November and
December (OND). The onset of the OND was normal
and took place in the first dekad of October resulting in
an average amount of 206 mm against a normal of
180mm. The Southern and Western parts of the County
comprising of Eldama Ravine, Mogotio, Baringo
Central, Baringo North and West of Tiaty Sub Counties
received 126 to 200 percent of the normal rains while
Baringo South and East of Tiaty Sub Counties received
less than 100 percent of the normal rains (Figure 2).Both
spatial and temporal distribution of the rains were poor
with the peak of the season being observed in the second
dekad of October. There was early cessation of the
season which happened by first dekad of December.
2.2 Conflict/Insecurity
There is some serious conflict in some parts of the County which has triggered massive security
operation by the government in an effort to restore law and order. The conflict has been triggered
by issues of natural resource sharing, cattle rustling as well as conflict arising from
administrative/political boundaries. The main hot spot is currently in Kapedo East and West sub
locations in Silale ward, Tiaty Sub County. Other hot spots include Nakoko sub location in Ribkwo
ward in Tiaty East Sub County, Kalabata, Tuluk and Kapturo Sub locations in Bartabwa ward of
Baringo North sub County, Mukutani, Rugus, Arabal and Kiserian sub locations in Mukutani ward
of Baringo South Sub County as well as Barketiew and Loruk sub locations in Saimo Soi ward in
Baringo North Sub County. Total of five wards are affected by the insecurity, it’s estimated that
populations affected is 50 percent in Silale ward, 15 percent in Bartabwa ward and 20 percent in
Ribkwo, Mukutani and Saimo Soi wards.
The conflict has led to food market disruptions leading to their closure in the affected areas while
movement of goods and transport services has come to a halt. The conflict has resulted in
disruption of livelihood activities and displacement of populations in the affected areas while
provision of health and education services has been affected as some schools have been shut down
especially in Silale ward.
2.3 COVID-19 Pandemic
Since the outbreak of COVID-19 pandemic, basic social services were interrupted whereby the
number of people seeking essential nutrition and health services in health facilities declined. The
County Government put in place mechanisms that ensured that there was continuity in frequency
of visits to the health facilities and improve on COVID-19 preventive measures such as placing of
hand washing facilities in designated sites with water and soap, screening of patients visiting the
health facilities and ongoing Community led total sanitation (CLTS) interventions. With the
closure of schools, there was a drastic decline of stocks held by farmers by 40 percent within three
Figure SEQ Figure \* ARABIC
2: Rainfall performance Figure 2:Rainfall performance

3
months and this was high compared to long term average (LTA) consumption. Most of the food
markets were operational but COVID-19 protocols were not followed strictly, for instance the
sampled markets of Emining, Mogotio, Tenges and Kapkayo no functional hand washing facilities
were seen, social distancing and wearing of mask was not also followed and its recommended that
the regulations be implemented to avoid any spike in the near future. Schools were still closed
until January 2021 when they reopened.
2.4 Other shocks and hazards
2.4.1 Shocks
High food commodity prices
In Pastoral areas, prices of cereals and pulses were relatively higher compared to the previous
seasons. With the ongoing conflict in some parts of the pastoral areas, the prices are expected to
shoot up further due to disruptions of markets and food supplies.
2.4.2 Hazards
Floods
The impact of floods caused by rising water levels of Lake Baringo, Lake 94 and Lake Bogoria is
still being felt in the affected areas around these lakes in Baringo South Sub County. The floods
have caused displacement of households and at least 700 hectares of farm land has been
submerged. This has caused reduction of available land for agricultural production mostly in the
irrigated livelihood zone.
Livestock diseases
Some pockets in the County are being affected by livestock diseases thus affecting livestock
productivity. In the pastoral areas, contagious caprine pleuropneumonia (CCPP) and Pests des
petits ruminants (PPR) are the most common diseases affecting the small stock while lumpy skin
disease (LSD) and foot and mouth (FMD) diseases are the most common in mixed farming
livelihood zone. Blue tongue disease was also reported in the marginal mixed farming areas of
Mogotio and irrigated livelihood zone of Mogotio.
Desert Locusts
The County reported the second wave of Desert Locusts, swarms of immature adults have criss
crossed and also roosted in the County, five wards reported invasion (Mochongoi, Kabarnet and
Bartabwa, Kolloa and Tenges) The latest swarm of Desert Locusts have roosted at Tenges ward
for two days on forested area, causing damage to pasture and fodder, currently surveillance is
continuing for purposes of control as residents scare them away also.(Not recommended) The
swarms reported at Bartabwa Ward of Baringo North Sub County was moving westward of the
County towards Elgeyo Marakwet County. The second Swarm was reported at the border between
Baringo and Elgeyo Marakwet. The third and fourth Swarms were reported at Mochongoi Ward
at the Border between Laikipia County and Baringo. Surveillance and reporting are being carried
by trained Scouts and staff.
4
3.0 IMPACT OF DRIVERS ON FOOD AND NUTRITION SECURITY
3.1 Availability
Short rains in Baringo are critical for food and Nutrition security as they supplement the harvest
from the Long rains and help in recharge of water bodies for irrigation purposes. In 2020 the
County had above normal long rains and this affected land preparation and cropping of the short
rains. The short rains of 2020 in the County were slightly above the LTA average. Most of the
farmers planted various crops during the OND rains and this increased the area under rain fed crop
farming, for instance area under green grams and beans was 82 percent and four percent
respectively of their LTA achievement.
The crop was good but from the first dekad of December the rains reduced, the early cessation of
the rains affected the yield of most rain fed crops by between 30 percent to 40 percent. The crops
have been harvested in Agropastoral but in mixed farming harvesting is still going on. The onset
of OND rains was timely on the first dekad of October but the cessation was early compared to
LTA-i.e. First dekad of December. The distribution over space and time was fair across all the
livelihood zones. High temperatures and intermittent dry periods were experienced during the
month of December which caused flower abortion in beans affecting the yields and caused stunted
growth of late planted maize. The area under crop during the assessment was low compared to the
LTA this was because farmers heeded to advisories given by extension officers and Meteorological
department on the performance of the short rains which was forecasted to be below average. Farm
lands were still submerged by increased waters of Lakes Baringo, 94 and Bogoria (Loboi, Ilchamus
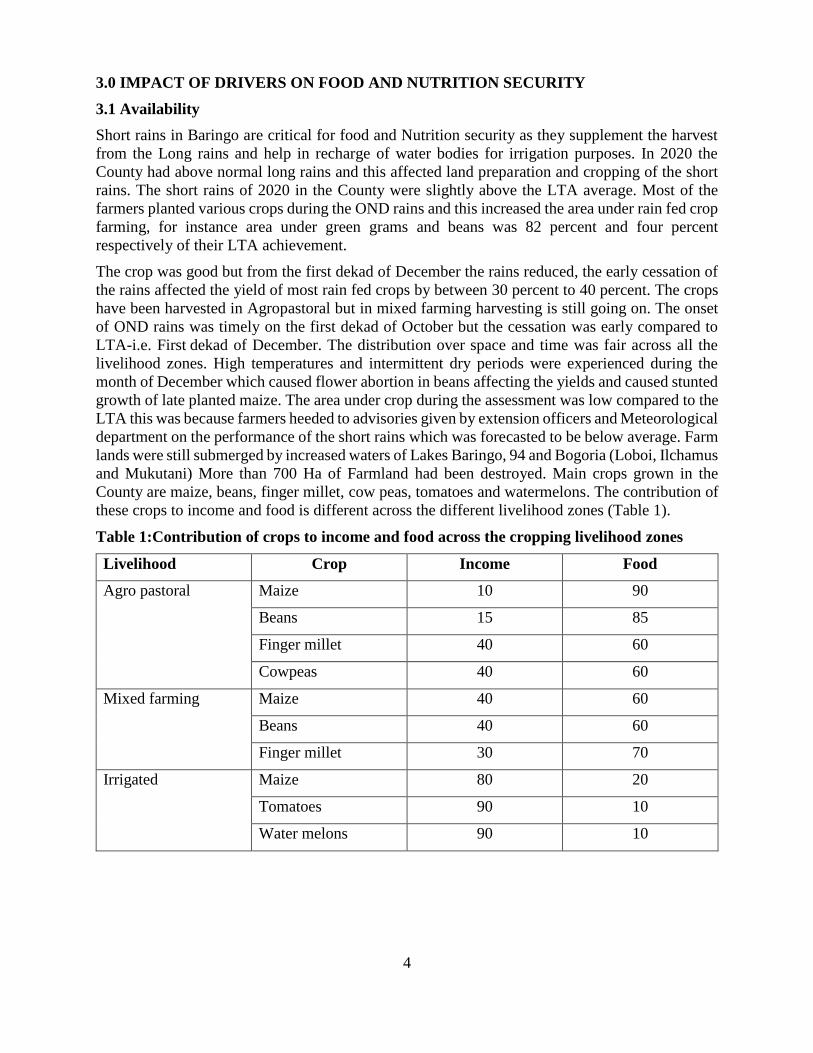
and Mukutani) More than 700 Ha of Farmland had been destroyed. Main crops grown in the
County are maize, beans, finger millet, cow peas, tomatoes and watermelons. The contribution of
these crops to income and food is different across the different livelihood zones (Table 1).
Table 1:Contribution of crops to income and food across the cropping livelihood zones
Livelihood Crop Income Food
Agro pastoral Maize 10 90
Beans 15 85
Finger millet 40 60
Cowpeas 40 60
Mixed farming Maize 40 60
Beans 40 60
Finger millet 30 70
Irrigated Maize 80 20
Tomatoes 90 10
Water melons 90 10
5
3.1.1 Crop production
Rain fed Agriculture
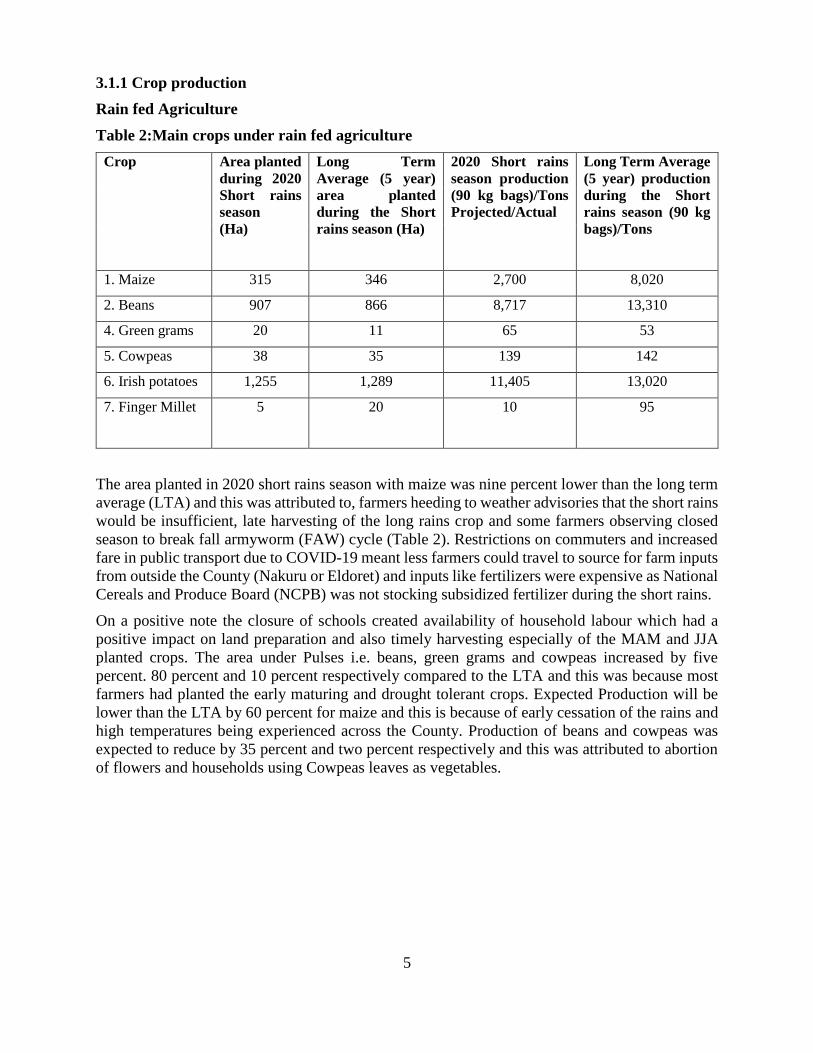
Table 2:Main crops under rain fed agriculture
Crop Area planted
during 2020
Short rains
season
(Ha)
Long Term
Average (5 year)
area planted
during the Short
rains season (Ha)
2020 Short rains
season production
(90 kg bags)/Tons
Projected/Actual
Long Term Average
(5 year) production
during the Short
rains season (90 kg
bags)/Tons
1. Maize 315 346 2,700 8,020
2. Beans 907 866 8,717 13,310
4. Green grams 20 11 65 53
5. Cowpeas 38 35 139 142
6. Irish potatoes 1,255 1,289 11,405 13,020
7. Finger Millet 5 20 10 95
The area planted in 2020 short rains season with maize was nine percent lower than the long term
average (LTA) and this was attributed to, farmers heeding to weather advisories that the short rains
would be insufficient, late harvesting of the long rains crop and some farmers observing closed
season to break fall armyworm (FAW) cycle (Table 2). Restrictions on commuters and increased
fare in public transport due to COVID-19 meant less farmers could travel to source for farm inputs
from outside the County (Nakuru or Eldoret) and inputs like fertilizers were expensive as National
Cereals and Produce Board (NCPB) was not stocking subsidized fertilizer during the short rains.
On a positive note the closure of schools created availability of household labour which had a
positive impact on land preparation and also timely harvesting especially of the MAM and JJA
planted crops. The area under Pulses i.e. beans, green grams and cowpeas increased by five
percent. 80 percent and 10 percent respectively compared to the LTA and this was because most
farmers had planted the early maturing and drought tolerant crops. Expected Production will be
lower than the LTA by 60 percent for maize and this is because of early cessation of the rains and
high temperatures being experienced across the County. Production of beans and cowpeas was
expected to reduce by 35 percent and two percent respectively and this was attributed to abortion
of flowers and households using Cowpeas leaves as vegetables.

6
Irrigated Agriculture
Table 3: Main crops under irrigated agriculture
Crop Area
planted
during 2020
Short rains
season (Ha)
Long Term
Average area
planted during the
Short rains season
(Ha)
2020 Short rains
season production
(90 kg bags)
Projected/Actual
Long Term
Average production
during the Short
rains season (90 kg
bags)
Maize 30 31 1,500 1,250
Beans 22 15 132 83
Tomatoes 47 27.6 471 297
Watermelons 103 85 1964 1580
Cow peas 10 10 40 16
Green Grams 245 167 1822 1627
Kales 39 29 234 155
Onions 2 1 2 1
Black night shade 14 5 54 22
Spinach 10 0 50 0
There was fair to good recharge of irrigation water sources depending on the livelihood zone. The
area under maize reduced by three percent and this was attributed to good long rains harvests that
made farmers not to plant again (Table 3). Increased campaigns on household food security led to
significant increase in area of the other crops especially horticultural crops and pulses.
Deliberate efforts done by the County Government, National Government and development
partners had contributed to increase on the area under irrigation including household irrigation for
food and Nutrition security. A lot of emphasis has been done on Kitchen gardening through
projects like Drought Resilient and Sustainable Livelihood Program (DRSLP), Kenya Climate
Smart Agriculture Program (KCSAP) and Baringo County Resilient project (SFSP) saw the area
under irrigation increase. Production for all crops under irrigation is expected to be higher than the
LTA

7
3.1.2 Main cereal stocks
Table 4: Cereal stocks
Commodity
Held by
Maize Rice Sorghum Green gram TOTAL
Current LTA Current LTA Current LTA Current LTA Current LTA
Farmers 717,384 605,966 - - 1,880 468 703 620 719,967 595,03
3
Traders 104,105 72,767 187 101 418 326 170 150 104,880 73,344
Millers 35,370 17,463 - - - - - - 35,370 17,463
Food
Assistance
- - - - - - - - - -
NCPB - 14,400 58 3 - - - - 58 14,403
The stocks held by Households were 20 percent above LTA and this was because farmers had
good harvests during the 2020 long rains (Table 4). Mixed farming Livelihood zone had the
highest stocks held by farmers, for instance, Eldama Ravine had the highest number of stocks at
52 percent (half of what is held by households) of the total stocks held by households. Traders and
Millers had stocks above their long-term average and this was attributed to poor purchasing
capacity of the households. The closure of schools due to COVID-19 also affected stocks held by
traders as schools were a major market for the traders. During the assessment no NCPB stores had
maize stocks except rice which was being sold commercially. But the stores are currently buying
maize from farmers at the cost of Kshs 2700, which is higher than the prevailing market price of
average Kshs 2500. The pastoral zones have no significant stocks and most of the households were
depending on markets for their supplies. There was disruption of market functions in most of the
pastoral livelihood zones due to increased conflict while in the agro-pastoral livelihood zone 30
percent of the households had stocks which could last between 1-2 months. In the irrigated and
mixed farming livelihood zones the stocks held are between 60 to 80 percent and this will last
between 3- 5 months.
With the closure of schools due to COVID-19, there was an increase in household size which led
to increased consumption rate of household stocks and on the other hand during the reopening of
schools, farmers disposed some of their stocks for payment of school fees. This led to decline of
stocks held by farmers by 40 percent within three months and this is high compared to LTA
consumption
3.1.3 Livestock production
Introduction
The main livestock species in Baringo County are cattle, goats, sheep, honeybees, poultry and
camels. Livestock production is an important source of food and income in the County whereby it
contributes 25 percent as a source of food in both mixed farming and irrigated livelihood zones
whereas in agropastoral and pastoral livelihood zones, it contributes 20 percent and 21 percent
respectively. As a source of income, livestock contributes 23 percent, eight percent, 50 percent
and 88 percent in mixed farming, irrigated farming, agropastoral and pastoral livelihood zones
respectively. The short rains season are important for the regeneration of pastures and browse and

8
at the same time contributing significantly in the recharge of water sources for livestock. The rains
are important in supplementing livestock feed by providing crop residues from the farms.
Pasture and browse condition
The current forage condition and expected duration is due to the cumulative effects of the long
rains, short rains and off-season (JJA) rains, overall, there is a decline in forage quantity and quality
in the pastoral livelihood zone due to poor performance of the 2020 short rains. The pastures are
expected to last for three months in mixed and irrigated cropping livelihood zones and 2-5 months
in agro-pastoral and pastoral livelihood zones (Table 5). Factors limiting forage access are
persistent insecurity and tensions around Saimo Soi, Kalabata, Arabal and Kapedo areas. Pasture
conservation and harvesting is picking up as more farmers have been sensitized on its importance
as a source of feed during periods of drought spells and also as a source of cash income (Table 6).
Table 5: Pasture and browse condition
Liveliho
od Zone
Pasture Browse
Condition Projected
Duration to
last (Months)
Factor
s
limitin
g
access
Condition Projected
Duration to
last (month)
Factor
s
limitin
g
access
Curre
nt
Norm
al
Curre
nt
Norm
al
Curre
nt
Norm
al
Curre
nt
Norm
al
Mixed
farming
Good Good 3 3 No
limit
Good Good 3 3 No
limit
Irrigated
cropping
Good
to fair
Good 3 3 Floods Good Good 3 3 Floods
Agro-
pastoral
Good
to fair
Good 2 3 No
limit
Good
to fair
Good 2.5 3 No
limit
Pastoral Fair Good 2 3 Insecur
ity
tension
s and
floods
Good
to fair
Good 2.5 3 Insecur
ity
tension
s and
floods

9
Baled hay status
Table 6: Bailed hay status
Livelihood
Zone
No. of Hay
Stores
Storage
Capacity
(Total
number of
bales)
No. of Bales
currently
being held
Average
Weight
per bale
(in Kgs)
Average
price per
bale
(Kshs.)
Comments – E.g.
percentage held
by farmers and
other
Institutions
Baringo
South
17 7,500 4,500 15 400 2% are held by
KVDA
88% Held by
farmers
Baringo
Central
2 5000 4000 15 200 30 % by farmers
and 70% by
Association.
E/Ravine 3 500,000 430,000 15 150 80% by farmers
20% FCS
Tiaty 0 0 0 0 0 N/A
Farmers graze
directly but some
harvest seeds
Baringo
North
5 150,000 100,000 15 250 100% by farmers
from community
stores
Mogotio 4 500,000 385,000 15 200 75%By farmer
groups
25% by
individuals
Livestock Productivity
Livestock Body Condition
During 2020 the County received good long rains, and off-season rains, forage condition was good
in all livelihood zones (Table 7). However, the underperformance of short rains coupled with high
temperatures has led to rapid depletion of forages quality and nutritional quality thus affecting the
performance of livestock. The resultant forage situation has led to both cattle and sheep being in
good to fair and fair body condition in agropastoral and pastoral livelihood zones respectfully but
goats and camels have remained in good condition across all livelihood zones. The present body
condition is attributed to present quality of both pastures and browse.

10
Table 7: Livestock body condition
Livelihoo
d Zone
Cattle Sheep Goat Camel
Current Norma
l
Current
ly
Norma
l
Curre
nt
Norma
l
Curre
nt
Norma
l
Mixed
farming
Good Good Good Good Good Good N/A N/A
Irrigated
cropping
Good Good Good Good Good Good
Agro-
pastoral
Good to
Fair
Good Good to
Fair
Good Good Good Good Good
Pastoral Fair Good Fair Good Good Good Good Good
Livestock Birth Rates
The general birth rates are normal across all livelihood zones, at three percent. The calving, kidding
and lambing rates are attributed to good quality pastures across all livelihood zones during
gestation period and at birth. The rainfall performance influenced all contributing factors
including, good nutrition, and decreased trekking distance.
The birth rates are attributed to good performance of both off-season rains (JJA)of 2019 and long
rains of 2020 during conception and gestation period. This contributed to good quality forages
during this period
Tropical Livestock Units
Table 8: Tropical livestock unit
Livelihood zone Poor income households Medium income households
Current Normal Current Normal
Mixed Farming 2.4 3 5.8 5.5
Irrigated cropping 2.8 3.5 6.2 6.5
Agro-pastoral 4.2 5 6.9 7
Pastoral 5.7 6 8.5 7
Average 3.8 4.5 6.9 7-9
The mixed farming and irrigated crop zone raise crops and keep some livestock for dairy. The agro
pastoral zones have livestock and practice some crop production. The pastoral zones depend
entirely on livestock with some pockets of drought tolerant crops being planted. The present
tropical livestock unit (TLU) possession per household which are slightly higher than the last
assessment (LRA), are attributed to continued good rainfall performance for the last three seasons,
which in turn has resulted to increased quality of forage. The variations in TLUs are also attributed
to improvement in birth rates due to improved forage quality during conception.
11
The average translated to 3.8 TLU in poor households as compared to 6.9 in medium households
(Table 8). The present TLU are compared to 3.4 in poor and 5.7 in medium income households in
the last assessment. There was slight increase in TLU as compared to last assessment.
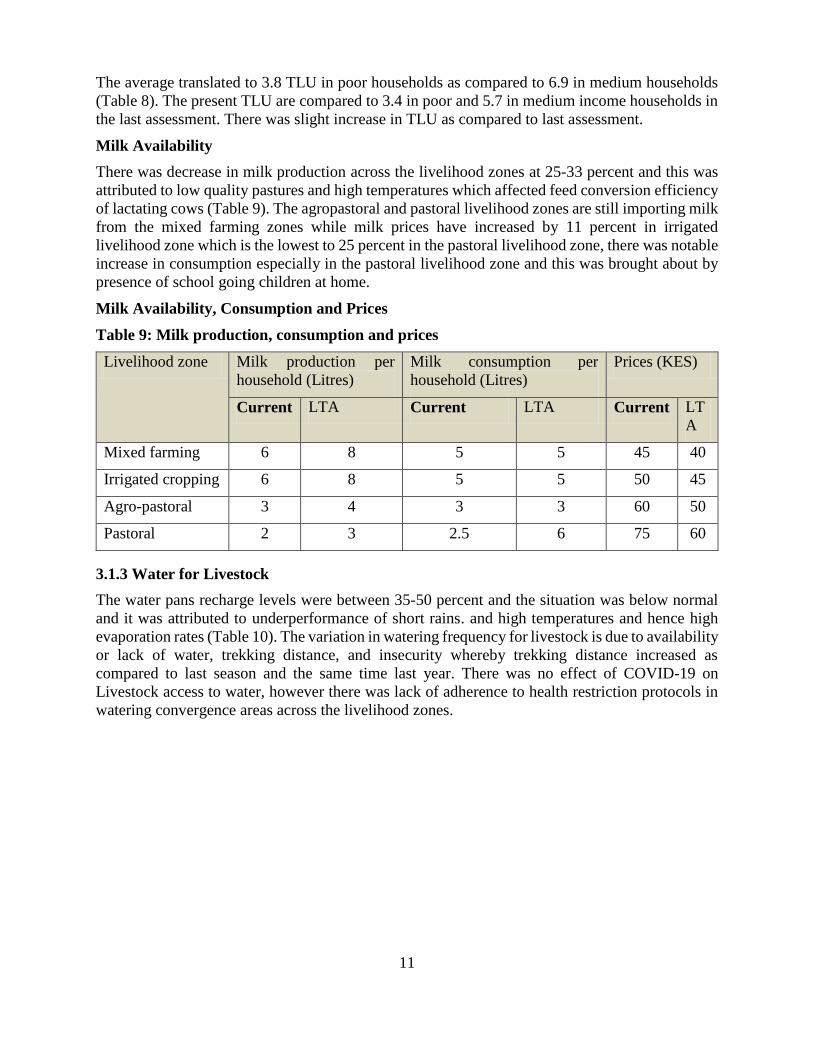
Milk Availability
There was decrease in milk production across the livelihood zones at 25-33 percent and this was
attributed to low quality pastures and high temperatures which affected feed conversion efficiency
of lactating cows (Table 9). The agropastoral and pastoral livelihood zones are still importing milk
from the mixed farming zones while milk prices have increased by 11 percent in irrigated
livelihood zone which is the lowest to 25 percent in the pastoral livelihood zone, there was notable
increase in consumption especially in the pastoral livelihood zone and this was brought about by
presence of school going children at home.
Milk Availability, Consumption and Prices
Table 9: Milk production, consumption and prices
Livelihood zone Milk production per
household (Litres)
Milk consumption per
household (Litres)
Prices (KES)
Current LTA Current LTA Current LT
A
Mixed farming 6 8 5 5 45 40
Irrigated cropping 6 8 5 5 50 45
Agro-pastoral 3 4 3 3 60 50
Pastoral 2 3 2.5 6 75 60
3.1.3 Water for Livestock
The water pans recharge levels were between 35-50 percent and the situation was below normal
and it was attributed to underperformance of short rains. and high temperatures and hence high
evaporation rates (Table 10). The variation in watering frequency for livestock is due to availability
or lack of water, trekking distance, and insecurity whereby trekking distance increased as
compared to last season and the same time last year. There was no effect of COVID-19 on
Livestock access to water, however there was lack of adherence to health restriction protocols in
watering convergence areas across the livelihood zones.

12
Water for Livestock
Table 10: Water for livestock
Livelihoo
d zone
Sources Return trekking
distance (Km)
Expected
duration
Watering
frequency
(No of days per
week)
Current Normal Curren
t
Norma
l
Curren
t
Norma
l
Curren
t
Norma
l
Mixed
farming
Rivers,
springs,
piped
water,
boreholes,
Streams,
Rivers,
springs,
piped
water,
boreholes
1-3 1-2.5 All
throug
h the
year
All
throug
h the
year
7 7
Irrigated
cropping
Rivers,
shallow
wells and
springs.
Rivers,
shallow
wells and
springs.
1-3 1-2.5 All
throug
h the
year
All
throug
h the
year
7 7
Agro-
pastoral
Water
pans,
Boreholes
, rivers
Streams,
water
pans,
Borehole
s
4-9 4-6 2 3 5 7
Pastoral Bore-
holes,
water
pans.
Water-
pans,
Bore-
holes
rivers
4-10 4-7 2 3 5 7
Livestock Movement and Migration
There were no reported migrations due to pasture and water deficiency. However, insecurity
tensions between Baringo North with Tiaty and Tiaty with Turkana have caused households to
move to the interior of their sub-counties. There are minimal migrations from Kinyach, Baringo
North and Arabal, Baringo South to the hilly sides in search of pastures.
On the Projected trend of migration, it’s anticipated that in the next two months, livestock are
likely to move from Kinyach, Kolloa to Kalabata and Kerio valley areas while others are likely to
move from Kapedo to Kasarani, Malaso areas as well as in to Marakwet and West Pokot counties.
Other animals are likely to move from Yatya to Sibilo and around areas surrounding Lake Baringo.
In areas around Nginyang Loyamorok, animals are likely to move to Amaya and in to Samburu
and Laikipia counties. Animals in Mogotio Sub County are likely to move to Nakuru County and
Eldama Ravine forest while those in Sibilo and Bartum locations will move to Perkerra, Arabal,
Mukutani, TangulBei and then in to Laikipia County. These are not normal movements and are
13
being contributed by the insecurity issues in Tiaty Sub County and deterioration of pasture
conditions in the pastoral areas. With the movement of animals, milk production is expected to
decline at the household level while local markets are likely to be deprived of animals for sales
thus affecting income flow for the pastoral households.
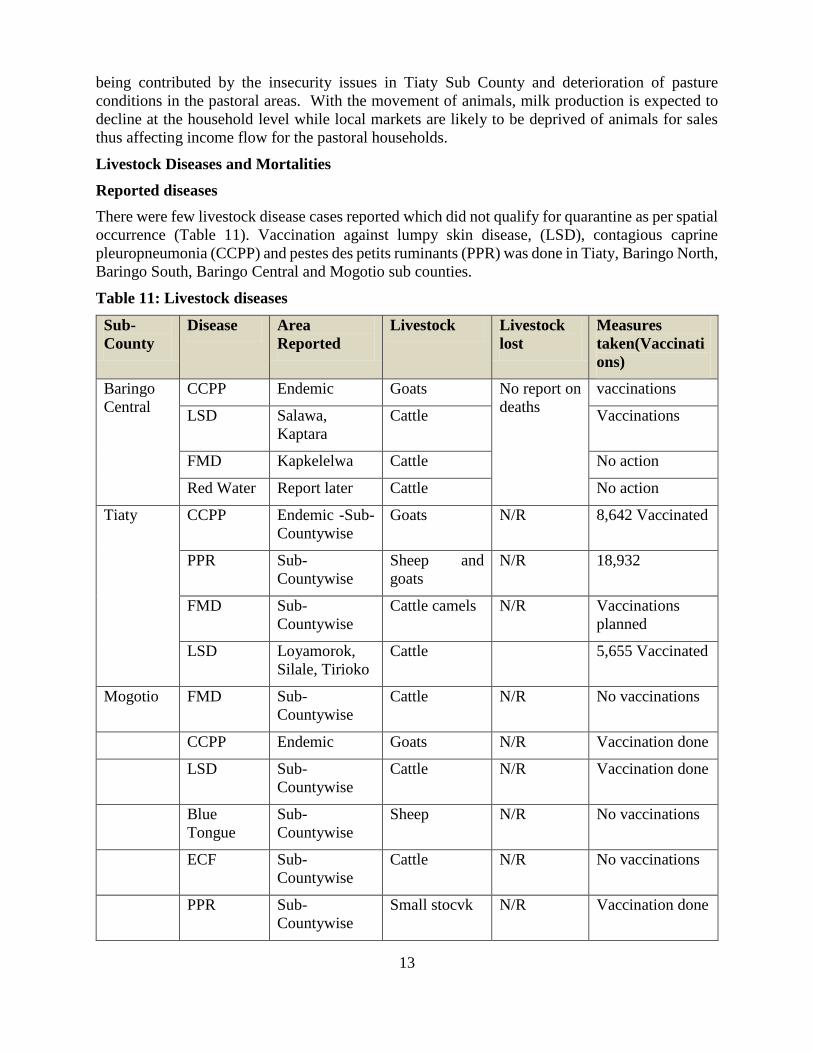
Livestock Diseases and Mortalities
Reported diseases
There were few livestock disease cases reported which did not qualify for quarantine as per spatial
occurrence (Table 11). Vaccination against lumpy skin disease, (LSD), contagious caprine
pleuropneumonia (CCPP) and pestes des petits ruminants (PPR) was done in Tiaty, Baringo North,
Baringo South, Baringo Central and Mogotio sub counties.
Table 11: Livestock diseases
Sub-
County
Disease Area
Reported
Livestock Livestock
lost
Measures
taken(Vaccinati
ons)
Baringo
Central
CCPP Endemic Goats No report on
deaths
vaccinations
LSD Salawa,
Kaptara
Cattle Vaccinations
FMD Kapkelelwa Cattle No action
Red Water Report later Cattle No action
Tiaty CCPP Endemic -Sub-
Countywise
Goats N/R 8,642 Vaccinated
PPR Sub-
Countywise
Sheep and
goats
N/R 18,932
FMD Sub-
Countywise
Cattle camels N/R Vaccinations
planned
LSD Loyamorok,
Silale, Tirioko
Cattle 5,655 Vaccinated
Mogotio FMD Sub-
Countywise
Cattle N/R No vaccinations
CCPP Endemic Goats N/R Vaccination done
LSD Sub-
Countywise
Cattle N/R Vaccination done
Blue
Tongue
Sub-
Countywise
Sheep N/R No vaccinations
ECF Sub-
Countywise
Cattle N/R No vaccinations
PPR Sub-
Countywise
Small stocvk N/R Vaccination done

14
Eldama
Ravine
No diseases reported
Baringo
south
CCPP Endemic Goats 20 10,256
Heart water Bekibon Goats 18 N/R
FMD Marigat and
Kimoriot
Cattle N/R
Mange Kapuikui Goats N/R
Lumpy
Skin
Disease
Marigat,
Loboi,
Salabani
Cattle 3,250
Baringo
north
CCPP Sub-
Countywise
(Endemic)
Goats No deaths 860 goats
vaccinated.
PPR Kabartonjo,
Bartabwa,
Saimo
soi,Saimo
Kipasaraman
Shoats No deaths 19,322
vaccinated
Fowl
typhoid
All wards Poultry 200 deaths Treatment done
on affected
LSD Barwessa,
Bartabwa
Cattle 76 deaths 19,068
vaccinated
Anaplasmo
sis
Saimo soi Cattle 9
Rabies All wards
except Saimo
soi
dogs No deaths 213 vaccinated

15
3.1.4 Impact on availability
Household maize stocks are above normal compared to long term mean and this should be able to
sustain the food requirements of the mixed livelihood zone up to the next long rains harvest while
on the other hand, production of pulses will be lower than the LTA due to early cessation of the
short rains and therefore the County will have to rely on supplies from outside the County. Milk
production is low compared to the LTA thus there is going to be a deficit for milk consumption at
the household level particularly in the pastoral areas. Household TLUs are lower than LTA but on
a recovery trend while livestock body condition is good which should be able to fetch good prices
more so in areas that do not face security challenges. In Tiaty Sub County, the ongoing security
operations are likely to trigger massive livestock migrations and other forms of livelihood
disruptions which will affect milk production.
3.2 .1 Market prices
On effects of COVID-19 on market operations, most of the food stuff markets were operational
but COVID-19 protocols were not followed strictly. In the sampled markets of Emining, Mogotio,
Tenges and Kapkayo the hand washing facilities were available but were not being utilized, social
distancing and wearing of mask was not also followed. Recommendations is to have the
regulations implemented to avoid any spike in the near future. In pastoral livelihood zone 85
percent of the population was depending on markets for access of their stocks while in agropastoral
zone, 40 percent were depending on markets. In mixed farming and irrigated livelihood zones less
than five percent were depending on markets especially those who are urban habitants.
The price of maize in the County ranged between Kshs. 27-30/Kg in mixed farming livelihood
zone and Kshs 42-45 in the pastoral areas while a 90 kg bag was retailing at Kshs 2000-3600. The
highest price was recorded in pastoral zone and lowest in the mixed farming Livelihood zone.
Most of the stocks were sourced locally from Eldama Ravine Sub County and Mochongoi ward in
Baringo South Sub County.
In the pastoral, agropastoral and marginal mixed farming livelihood zones, more farmers are
purchasing from traders and in the next three months more households will be purchasing food
from markets as household stocks will have been depleted
The main markets for livestock in the County are Kipsaraman, Barwessa, Loruk and Kinyach in
Baringo North; Kolloa, Nginyang, Tangulbei and Amaya in Tiaty; Marigat, Kabel in Baringo
South; Kaptara in Baringo Central; Majimoto, and Emining in Mogotio and Iloti, Kapchorua and
Kapcholoi in Eldama Ravine sub-counties. Livestock markets are operational except those in Tiaty
Sub County where there is ongoing conflict and security operations have disrupted movement of
animals and people to the markets. Livestock animals being traded are mostly being sourced from
within the County while the buyers coming from outside the County are mostly from Nairobi and
Nakuru counties.
For food crops, there were no notable market disruptions in the County during the short rains
period. But there was controlled movement of transport to areas affected by conflict in Tiaty Sub
County which affected access of food stuffs at the markets. Despite the areas near the lakes
experiencing increased water levels, markets were not closed but accessibility was hindered as
other means of transportation like boats were being used. In the next six months the operations in
the agropastoral, mixed farming and irrigated livelihood zones will remain stable but in the pastoral
zones especially of Tiaty Sub County, markets functions might remain disrupted due to the
ongoing conflict. The main source of maize and beans are mostly from within the County although
16
the volumes being traded in mixed farming, marginal mixed farming and irrigated livelihood zones
are extremely low due to low demand as households are still keeping large stocks that were carried
forward from the long rains harvest. About five percent, 65 percent and 85 percent of the
households in mixed farming, agropastoral and pastoral livelihood zones are currently dependent
on markets for food.
Market prices
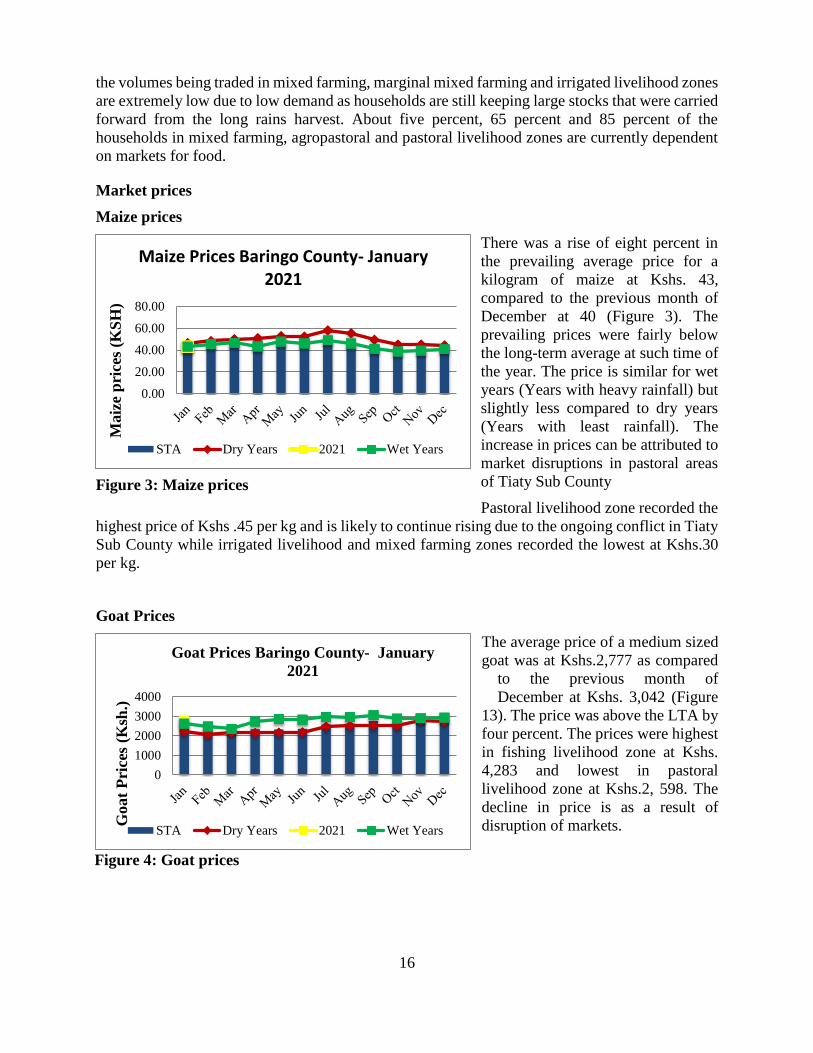
Maize prices
There was a rise of eight percent in
the prevailing average price for a
kilogram of maize at Kshs. 43,
compared to the previous month of
December at 40 (Figure 3). The
prevailing prices were fairly below
the long-term average at such time of
the year. The price is similar for wet
years (Years with heavy rainfall) but
slightly less compared to dry years
(Years with least rainfall). The
increase in prices can be attributed to
market disruptions in pastoral areas
of Tiaty Sub County
Pastoral livelihood zone recorded the
highest price of Kshs .45 per kg and is likely to continue rising due to the ongoing conflict in Tiaty
Sub County while irrigated livelihood and mixed farming zones recorded the lowest at Kshs.30
per kg.
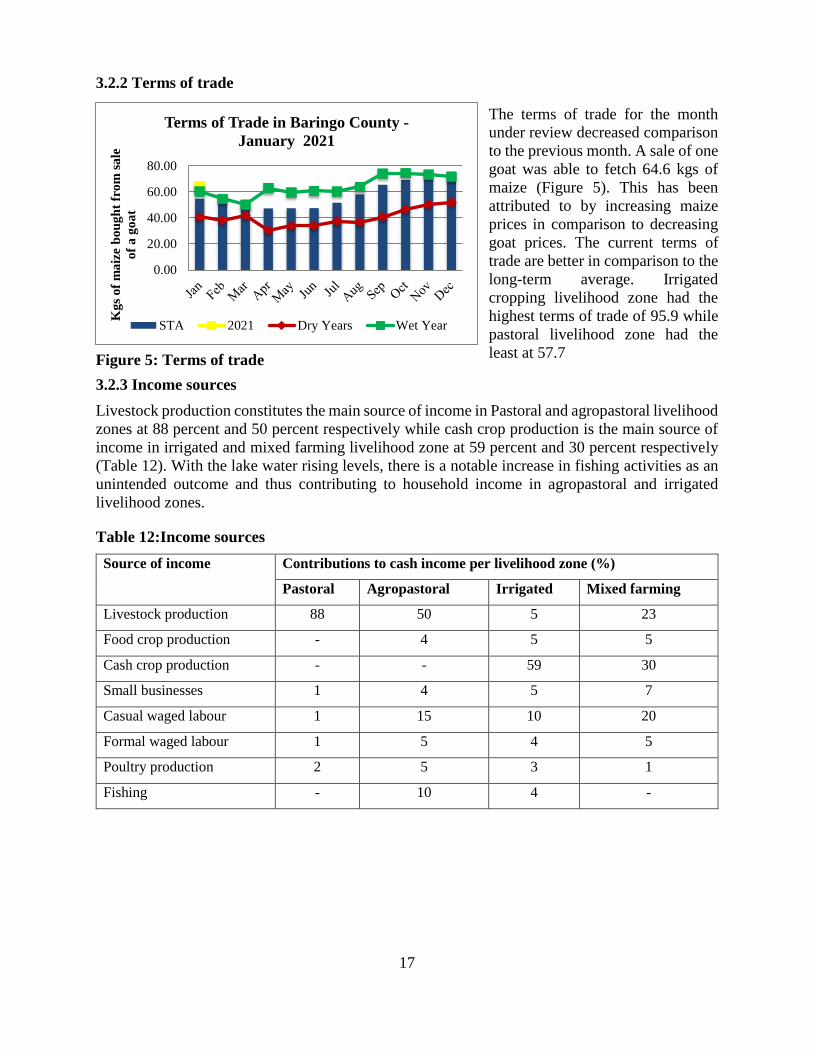
Goat Prices
The average price of a medium sized
goat was at Kshs.2,777 as compared
to the previous month of
December at Kshs. 3,042 (Figure
13). The price was above the LTA by
four percent. The prices were highest
in fishing livelihood zone at Kshs.
4,283 and lowest in pastoral
livelihood zone at Kshs.2, 598. The
decline in price is as a result of
disruption of markets.
Figure 3: Maize prices
0.00
20.00
40.00
60.00
80.00
Maiz
e p
rice
s (K
SH
)
Maize Prices Baringo County- January2021
STA Dry Years 2021 Wet Years
Figure 3: Maize prices
0
1000
2000
3000
4000
Goat
Pri
ces
(Ksh
.)
Goat Prices Baringo County- January
2021
STA Dry Years 2021 Wet Years
Figure 4: Goat prices
17
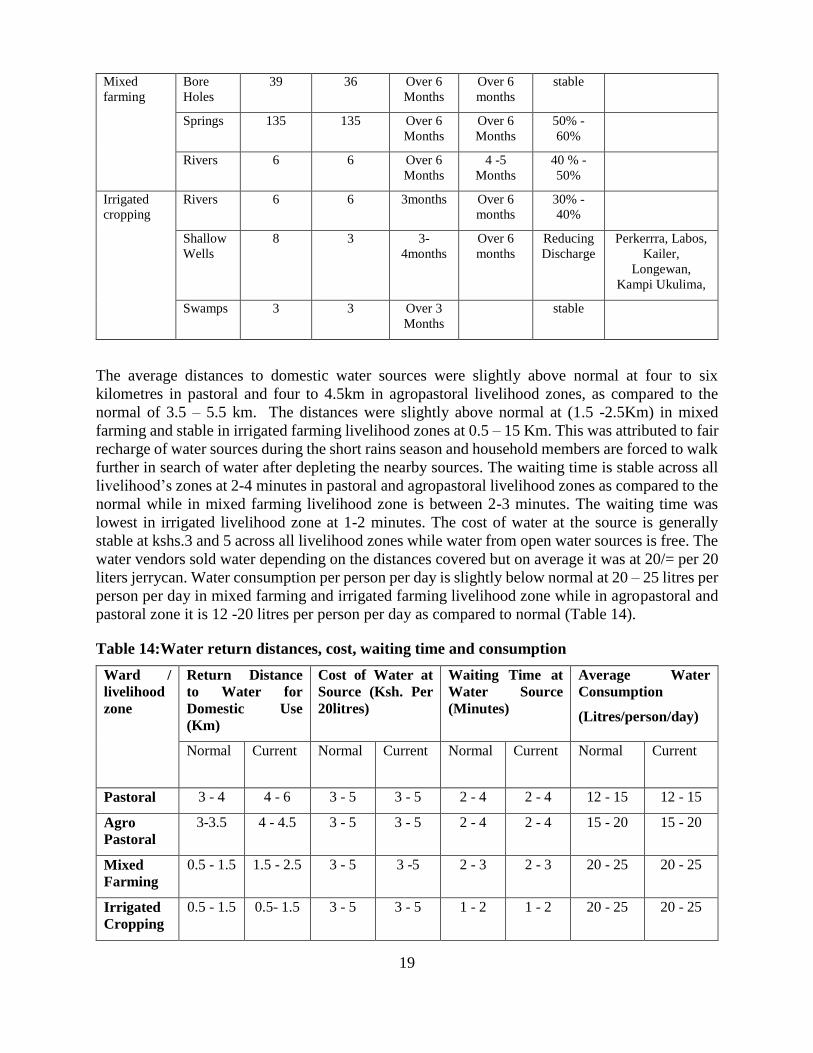
3.2.2 Terms of trade
The terms of trade for the month
under review decreased comparison
to the previous month. A sale of one
goat was able to fetch 64.6 kgs of
maize (Figure 5). This has been
attributed to by increasing maize
prices in comparison to decreasing
goat prices. The current terms of
trade are better in comparison to the
long-term average. Irrigated
cropping livelihood zone had the
highest terms of trade of 95.9 while
pastoral livelihood zone had the
least at 57.7
3.2.3 Income sources
Livestock production constitutes the main source of income in Pastoral and agropastoral livelihood
zones at 88 percent and 50 percent respectively while cash crop production is the main source of
income in irrigated and mixed farming livelihood zone at 59 percent and 30 percent respectively
(Table 12). With the lake water rising levels, there is a notable increase in fishing activities as an
unintended outcome and thus contributing to household income in agropastoral and irrigated
livelihood zones.
Table 12:Income sources
Source of income Contributions to cash income per livelihood zone (%)
Pastoral Agropastoral Irrigated Mixed farming
Livestock production 88 50 5 23
Food crop production - 4 5 5
Cash crop production - - 59 30
Small businesses 1 4 5 7
Casual waged labour 1 15 10 20
Formal waged labour 1 5 4 5
Poultry production 2 5 3 1
Fishing - 10 4 -
0.00
20.00
40.00
60.00
80.00
Kg
s o
f m
aiz
e b
ou
gh
t fr
om
sa
le
of
a g
oa
tTerms of Trade in Baringo County -
January 2021
STA 2021 Dry Years Wet Year
Figure 5: Terms of trade

18
3.2.4 Water access and availability
Main sources of water
Generally, the main sources of water for domestic use include; Rivers, water pans, dams, lakes,
streams, protected shallow wells, springs, swamps, boreholes and traditional river wells (Table
13). The water sources are mainly concentrated in mixed farming livelihood zones where the
potential is high and rainfall amounts are higher as compared to pastoral and agropastoral
livelihood zones which are rocky and poorly served by rivers. Mixed farming and irrigated farming
zones Communities have more access to water than in pastoral livelihood zone.
Most of the Water pans across the County in the pastoral and agropastoral livelihood areas were
recharged to between 50-60 percent of their normal capacity as compared to 60-70 percent
normally. The available water is likely to last for one to two months as compared to two to three
months of their normal. In mixed and irrigated livelihood zones, rivers were recharged 40-60
percent of their normal capacity except for Waseges, Kiserian, Yeptos and Emoo rivers that have
low water levels and had low recharges respectively. The water is expected to last for three to four
months. The general status of water levels in springs, rivers and water pans in all livelihood zones
are below normal and are in a declining trend due high temperatures, utilization and siltation levels.
Currently, 80 - 90 percent of the boreholes are operational across all livelihood zones; however
some few boreholes are not operational due to normal electromechanical break downs for example
Kirim , Ngoron, Kapkun , Tinomoi and Barkipi boreholes while water quality challenges is high
at Perkerra, Loboi, Kailer, Longewan, Kampi Ukulima, Kisrian, Logumgum, Muserech among
others areas.
Table 13: Main water sources
Ward/
Livelihood
zone
Water
Source
(Three
(3)
major
sources)
No. of
Normal
Operatio
nal
No. of
Current
Operation
al Sources
Projected
Duration
(Operati
onal
Sources)
Normal
Duration
that water
last in
months
% of full
Capacity
Recharge
d by the
Rains
Locality of Non-
operational
Water Sources
Pastoral Bore
Holes
76 70 Over 6
Months
Over 6
months
stable Ngo’oron, Kreeze
, Kirim , Ngoron,
Barkipii,
Tinomoi,
Tangulbei, Tebei,
Kapkun boreholes
Water
Pans
63 63 1 – 2
Months
3 – 4
Months
50% -
60%
Springs 10 10 3 - 4
Months
4 – 5
Months
30 % -
40%
Agro
pastoral
Bore
Holes
56 52 Over 6
Months
Over 6
months
stable
Water
Pans
23 19 1–2
Months
3 – 4
Months
50% -
60%
Springs 18 18 3-
4Months
Over 6
months
30 % -
40%
19
Mixed
farming
Bore
Holes
39 36 Over 6
Months
Over 6
months
stable
Springs 135 135 Over 6
Months
Over 6
Months
50% -
60%
Rivers 6 6 Over 6
Months
4 -5
Months
40 % -
50%
Irrigated
cropping
Rivers 6 6 3months Over 6
months
30% -
40%
Shallow
Wells
8 3 3-
4months
Over 6
months
Reducing
Discharge
Perkerrra, Labos,
Kailer,
Longewan,
Kampi Ukulima,
Swamps 3 3 Over 3
Months
stable
The average distances to domestic water sources were slightly above normal at four to six
kilometres in pastoral and four to 4.5km in agropastoral livelihood zones, as compared to the
normal of 3.5 – 5.5 km. The distances were slightly above normal at (1.5 -2.5Km) in mixed
farming and stable in irrigated farming livelihood zones at 0.5 – 15 Km. This was attributed to fair
recharge of water sources during the short rains season and household members are forced to walk
further in search of water after depleting the nearby sources. The waiting time is stable across all
livelihood’s zones at 2-4 minutes in pastoral and agropastoral livelihood zones as compared to the
normal while in mixed farming livelihood zone is between 2-3 minutes. The waiting time was
lowest in irrigated livelihood zone at 1-2 minutes. The cost of water at the source is generally
stable at kshs.3 and 5 across all livelihood zones while water from open water sources is free. The
water vendors sold water depending on the distances covered but on average it was at 20/= per 20
liters jerrycan. Water consumption per person per day is slightly below normal at 20 – 25 litres per
person per day in mixed farming and irrigated farming livelihood zone while in agropastoral and
pastoral zone it is 12 -20 litres per person per day as compared to normal (Table 14).
Table 14:Water return distances, cost, waiting time and consumption
Ward /
livelihood
zone
Return Distance
to Water for
Domestic Use
(Km)
Cost of Water at
Source (Ksh. Per
20litres)
Waiting Time at
Water Source
(Minutes)
Average Water
Consumption
(Litres/person/day)
Normal Current Normal Current Normal Current Normal Current
Pastoral 3 - 4 4 - 6 3 - 5 3 - 5 2 - 4 2 - 4 12 - 15 12 - 15
Agro
Pastoral
3-3.5 4 - 4.5 3 - 5 3 - 5 2 - 4 2 - 4 15 - 20 15 - 20
Mixed
Farming
0.5 - 1.5 1.5 - 2.5 3 - 5 3 -5 2 - 3 2 - 3 20 - 25 20 - 25
Irrigated
Cropping
0.5 - 1.5 0.5- 1.5 3 - 5 3 - 5 1 - 2 1 - 2 20 - 25 20 - 25
20
About 25–30 percent of households in pastoral and agropastoral livelihood zones in Muserechi,
Mbechot, Chepkalacha, Sirata, Kaptara, Sintaani reported persistence of water related diseases
like typhoid, amoeba, diarrhea and malaria as a result of inadequate toilet coverage and low levels
of personal hygiene.
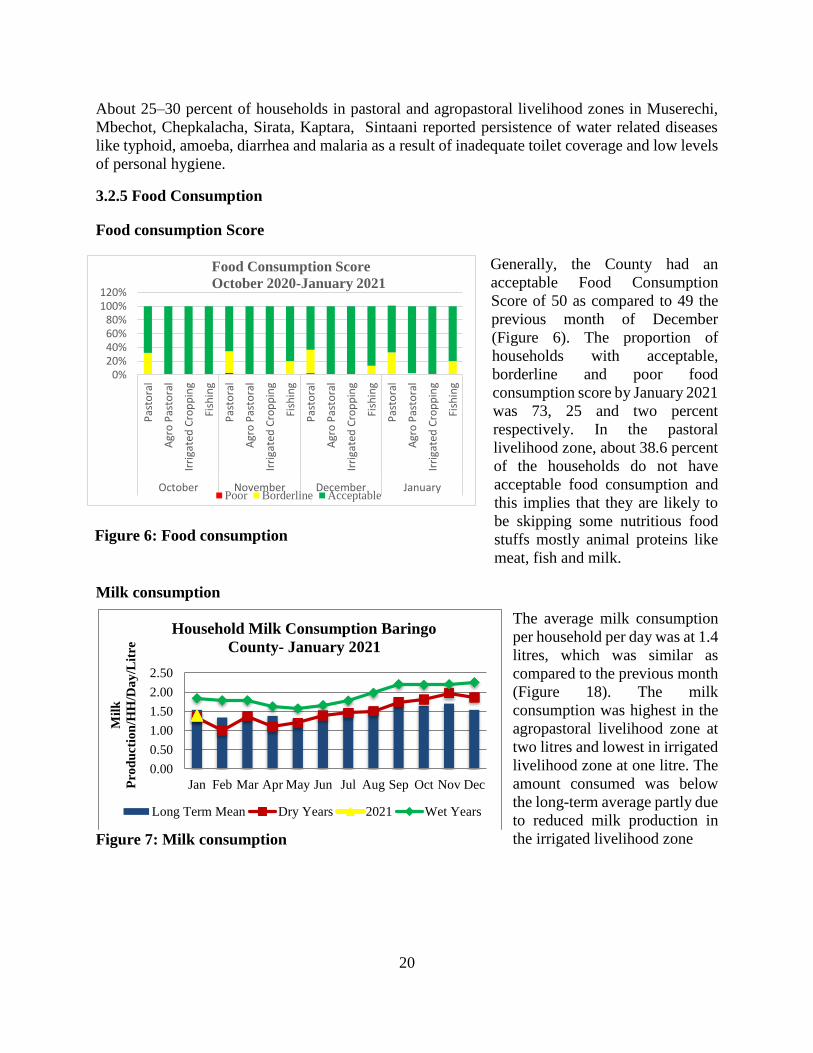
3.2.5 Food Consumption
Food consumption Score
Generally, the County had an
acceptable Food Consumption
Score of 50 as compared to 49 the
previous month of December
(Figure 6). The proportion of
households with acceptable,
borderline and poor food
consumption score by January 2021
was 73, 25 and two percent
respectively. In the pastoral
livelihood zone, about 38.6 percent
of the households do not have
acceptable food consumption and
this implies that they are likely to
be skipping some nutritious food
stuffs mostly animal proteins like
meat, fish and milk.
Milk consumption
The average milk consumption
per household per day was at 1.4
litres, which was similar as
compared to the previous month
(Figure 18). The milk
consumption was highest in the
agropastoral livelihood zone at
two litres and lowest in irrigated
livelihood zone at one litre. The
amount consumed was below
the long-term average partly due
to reduced milk production in
the irrigated livelihood zone
0%20%40%60%80%
100%120%
Pas
tora
l
Agr
o P
asto
ral
Irri
gate
d C
rop
pin
g
Fish
ing
Pas
tora
l
Agr
o P
asto
ral
Irri
gate
d C
rop
pin
g
Fish
ing
Pas
tora
l
Agr
o P
asto
ral
Irri
gate
d C
rop
pin
g
Fish
ing
Pas
tora
l
Agr
o P
asto
ral
Irri
gate
d C
rop
pin
g
Fish
ing
October November December January
Food Consumption Score
October 2020-January 2021
Poor Borderline Acceptable
Figure 6: Food consumption
0.00
0.50
1.00
1.50
2.00
2.50
Jan Feb Mar Apr May Jun Jul Aug Sep Oct Nov Dec
Mil
k
Pro
du
ctio
n/H
H/D
ay
/Lit
re
Household Milk Consumption Baringo
County- January 2021
Long Term Mean Dry Years 2021 Wet Years
Figure 7: Milk consumption
21
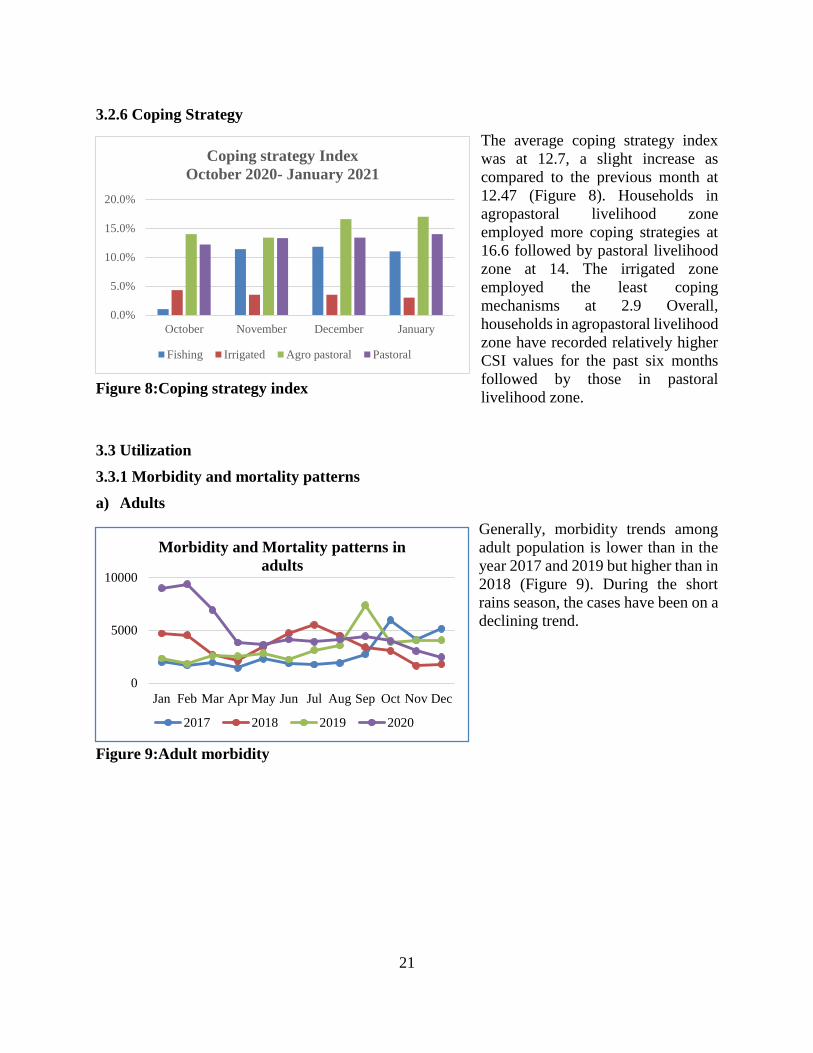
3.2.6 Coping Strategy
The average coping strategy index
was at 12.7, a slight increase as
compared to the previous month at
12.47 (Figure 8). Households in
agropastoral livelihood zone
employed more coping strategies at
16.6 followed by pastoral livelihood
zone at 14. The irrigated zone
employed the least coping
mechanisms at 2.9 Overall,
households in agropastoral livelihood
zone have recorded relatively higher
CSI values for the past six months
followed by those in pastoral
livelihood zone.
3.3 Utilization
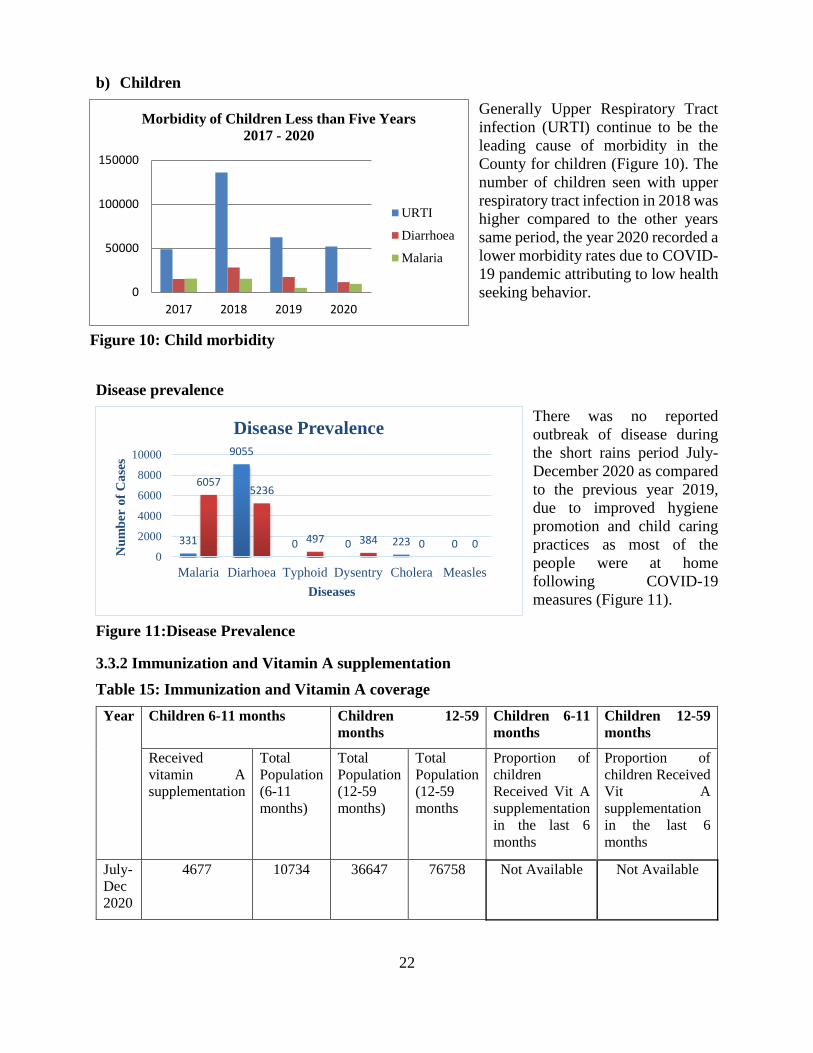
3.3.1 Morbidity and mortality patterns
a) Adults
Generally, morbidity trends among
adult population is lower than in the
year 2017 and 2019 but higher than in
2018 (Figure 9). During the short
rains season, the cases have been on a
declining trend.
Figure SEQ Figure \* ARABIC 9: Adult morbidity
0.0%
5.0%
10.0%
15.0%
20.0%
October November December January
Coping strategy Index
October 2020- January 2021
Fishing Irrigated Agro pastoral Pastoral
Figure 8:Coping strategy index
Figure 9:Adult morbidity
0
5000
10000
Jan Feb Mar Apr May Jun Jul Aug Sep Oct Nov Dec
Morbidity and Mortality patterns in
adults
2017 2018 2019 2020
22
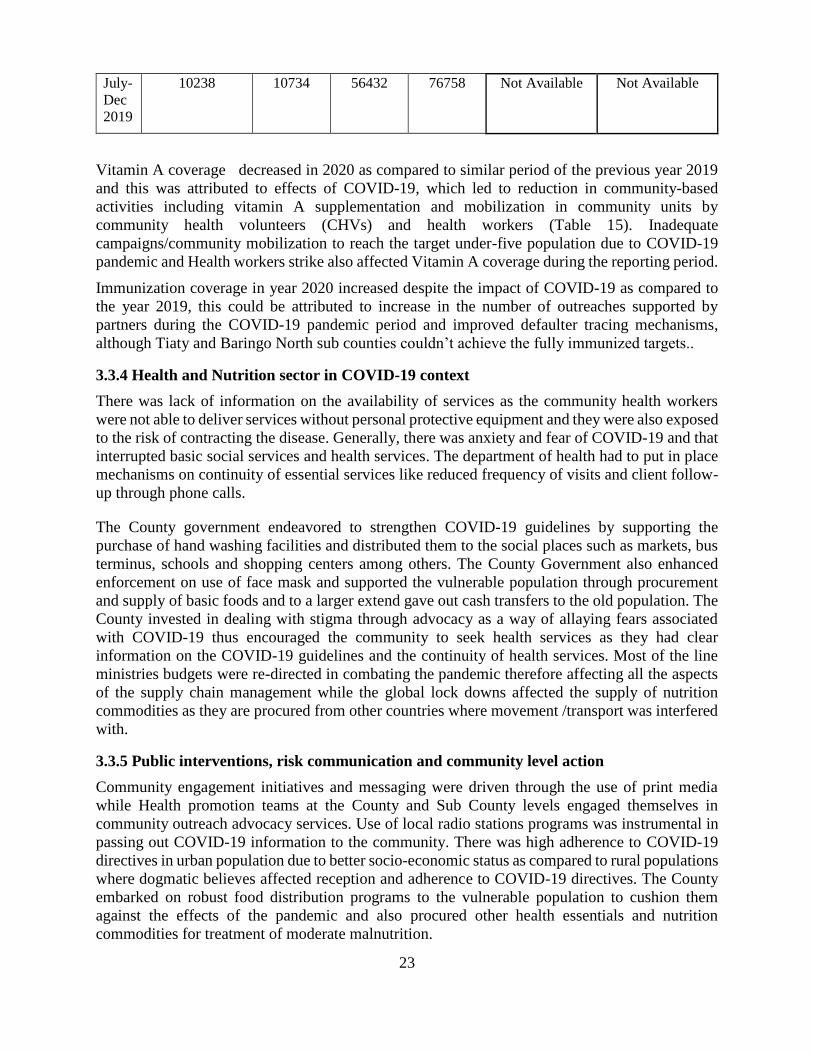
b) Children
Generally Upper Respiratory Tract
infection (URTI) continue to be the
leading cause of morbidity in the
County for children (Figure 10). The
number of children seen with upper
respiratory tract infection in 2018 was
higher compared to the other years
same period, the year 2020 recorded a
lower morbidity rates due to COVID-
19 pandemic attributing to low health
seeking behavior.
Disease prevalence
There was no reported
outbreak of disease during
the short rains period July-
December 2020 as compared
to the previous year 2019,
due to improved hygiene
promotion and child caring
practices as most of the
people were at home
following COVID-19
measures (Figure 11).
3.3.2 Immunization and Vitamin A supplementation
Table 15: Immunization and Vitamin A coverage
Year Children 6-11 months Children 12-59
months
Children 6-11
months
Children 12-59
months
Received
vitamin A
supplementation
Total
Population
(6-11
months)
Total
Population
(12-59
months)
Total
Population
(12-59
months
Proportion of
children
Received Vit A
supplementation
in the last 6
months
Proportion of
children Received
Vit A
supplementation
in the last 6
months
July-
Dec
2020
4677 10734 36647 76758
Not Available Not Available
Figure SEQ Figure \* ARABIC 10: Child morbidity
Figure 10: Child morbidity
0
50000
100000
150000
2017 2018 2019 2020
Morbidity of Children Less than Five Years
2017 - 2020
URTI
Diarrhoea
Malaria
331
9055
0 0 223 0
60575236
497 384 0 00
2000
4000
6000
8000
10000
Malaria Diarhoea Typhoid Dysentry Cholera Measles
Nu
mb
er o
f C
ase
s
Diseases
Disease Prevalence
Figure 11:Disease Prevalence
23
July-
Dec
2019
10238 10734 56432 76758
Not Available Not Available
Vitamin A coverage decreased in 2020 as compared to similar period of the previous year 2019
and this was attributed to effects of COVID-19, which led to reduction in community-based
activities including vitamin A supplementation and mobilization in community units by
community health volunteers (CHVs) and health workers (Table 15). Inadequate
campaigns/community mobilization to reach the target under-five population due to COVID-19
pandemic and Health workers strike also affected Vitamin A coverage during the reporting period.
Immunization coverage in year 2020 increased despite the impact of COVID-19 as compared to
the year 2019, this could be attributed to increase in the number of outreaches supported by
partners during the COVID-19 pandemic period and improved defaulter tracing mechanisms,
although Tiaty and Baringo North sub counties couldn’t achieve the fully immunized targets..
3.3.4 Health and Nutrition sector in COVID-19 context
There was lack of information on the availability of services as the community health workers
were not able to deliver services without personal protective equipment and they were also exposed
to the risk of contracting the disease. Generally, there was anxiety and fear of COVID-19 and that
interrupted basic social services and health services. The department of health had to put in place
mechanisms on continuity of essential services like reduced frequency of visits and client follow-
up through phone calls.
The County government endeavored to strengthen COVID-19 guidelines by supporting the
purchase of hand washing facilities and distributed them to the social places such as markets, bus
terminus, schools and shopping centers among others. The County Government also enhanced
enforcement on use of face mask and supported the vulnerable population through procurement
and supply of basic foods and to a larger extend gave out cash transfers to the old population. The
County invested in dealing with stigma through advocacy as a way of allaying fears associated
with COVID-19 thus encouraged the community to seek health services as they had clear
information on the COVID-19 guidelines and the continuity of health services. Most of the line
ministries budgets were re-directed in combating the pandemic therefore affecting all the aspects
of the supply chain management while the global lock downs affected the supply of nutrition
commodities as they are procured from other countries where movement /transport was interfered
with.
3.3.5 Public interventions, risk communication and community level action
Community engagement initiatives and messaging were driven through the use of print media
while Health promotion teams at the County and Sub County levels engaged themselves in
community outreach advocacy services. Use of local radio stations programs was instrumental in
passing out COVID-19 information to the community. There was high adherence to COVID-19
directives in urban population due to better socio-economic status as compared to rural populations
where dogmatic believes affected reception and adherence to COVID-19 directives. The County
embarked on robust food distribution programs to the vulnerable population to cushion them
against the effects of the pandemic and also procured other health essentials and nutrition
commodities for treatment of moderate malnutrition.

24
3.3.6 Coordination and leadership in COVID-19 pandemic preparedness and response
There was a functional coordinating system in the department of health services for all health
services as there already existed a health stakeholder’s forum which held its meeting on quarterly
basis. Also, there is a County nutrition technical forum which is cascaded down to the Sub County
level and is held on a quarterly basis.
3.3.7 Sanitation and Hygiene
Latrine coverage and utilization
Table 16: Latrine coverage
Sub County/
Livelihood zone
Latrine Coverage
January to June 2020
% Coverage
July to December 2020
% Coverage
Koibatek 78 78
Baringo Central 47 47
Marigat 46 46
Mogotio 45 45
Baringo North 42 42
East Pokot 3.14 3.14
Tiaty East 3.14 3.14
Baringo County 43.6 43.6
The toilet coverage in the County is average 38 percent and the distribution is seven percent, 18
percent, 23 percent and 52 percent in pastoral, agropastoral, irrigated cropping and mixed farming
livelihood zones respectively and this is attributed to culture and nature of livelihood zones (Table
16). Toilet coverage in mixed livelihood zone is higher as a result of concentrated development in
terms of urban setup and exposure to quality sanitation while in irrigated cropping it is low due to
few settlements at the farm fields.
Water treatment was being done by a dismal 4.4 percent households in Tiaty Sub County while
28.6 percent in Baringo North and South did the same. The most common treatment method used
in Baringo North and South was boiling (71.1 percent) while in Tiaty most of the households used
pot filters (59.1 percent) (SMART Survey, July 2019). The low water treatment rates may be the
cause of the water borne diseases reported in the community
Hand washing during critical moments
Hand washing at the four critical moments was at two percent in Tiaty, 10.2 percent in Baringo
North and South sub counties. Those who used soap and water were 24.7 percent in Tiaty while in
Baringo North and South sub counties, those who did hand washing using soap and water were
69.5 percent. However, there could be an increase in the proportion of hand washing during the

25
four critical time and use of soap due to the on-going COVID-19 sensitization by Baringo County
Government and Partners.
Nutrition status
Table 17:Nutrition status by weight for age
SMART survey years Prevalence of weight for age (Underweight)
2020 Data not available
2019 County average: 21.4
Tiaty sub County: 40.4
2018 Tiaty sub County: 29.1
County average: 18.7
2017 44.5
The nutritional status of children under five assessed by weight for age shows to be reducing from
2017 to 2019 in all the livelihood zones (Table 17), which was attributed to scale-up of nutrition
interventions in the County.
Table 18: SMART survey findings of 2019
SMART survey years % Global Acute
Malnutrition
(GAM) by weight
for height Z scores
% Severe Acute
Malnutrition (SAM)
by weight for height Z
scores
% Chronic
Malnutrition
(Stunting) by
Height for age Z
scores
2020 Data not available Data not available Data not available
2019 County
average:9.3
Tiaty Sub
County:20.9
County average:2.3
Tiaty Sub County: 9.3
County average:
28.1
Tiaty sub County:
40.1
2018 Tiaty sub County:
16.68
County average:
7.8
Tiaty sub-County: 4
County average: 0.2
Tiaty sub County:
30.0
County average:
28.5
2017 25.2-Tiaty sub
County
5.8-Tiaty sub County 41.2 Tiaty sub
County
The nutritional status of children under five shows that wasting and stunting was high in Tiaty Sub
County in the year 2017 as compared to 2018 while County malnutrition rates reduced in 2018 as
compared to other years due to blanket supplementary feeding strategy and scale-up of high impact
nutrition interventions (Table 18). Admissions both severe acute malnutrition (SAM) and
moderate acute malnutrition (MAM) clients in 2020 was largely below long-term average and
significantly fewer compared to similar period the previous year. This was attributed to fear of
26
COVID-19 which was reported in the Country in March 2020 and health workers strike affecting
facility visits /admission hence reduced screening referral services at community level by
Community health Volunteers.
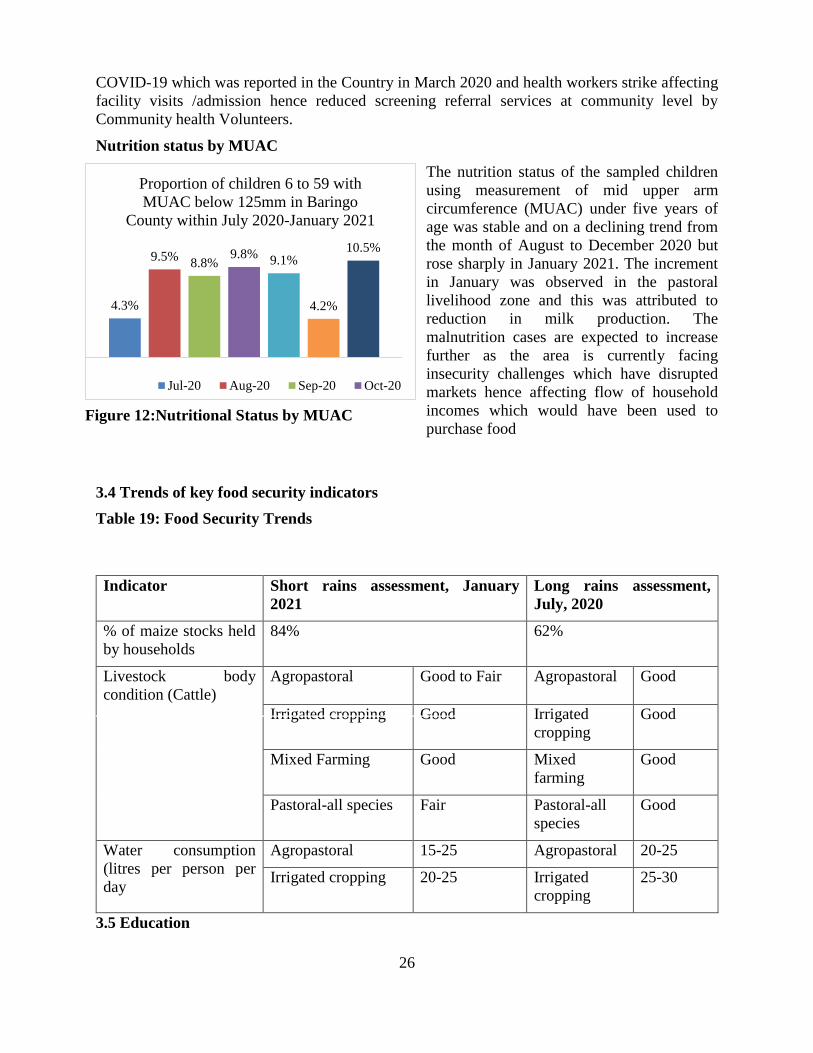
Nutrition status by MUAC
The nutrition status of the sampled children
using measurement of mid upper arm
circumference (MUAC) under five years of
age was stable and on a declining trend from
the month of August to December 2020 but
rose sharply in January 2021. The increment
in January was observed in the pastoral
livelihood zone and this was attributed to
reduction in milk production. The
malnutrition cases are expected to increase
further as the area is currently facing
insecurity challenges which have disrupted
markets hence affecting flow of household
incomes which would have been used to
purchase food
3.4 Trends of key food security indicators
Table 19: Food Security Trends
3.5 Education
Indicator Short rains assessment, January
2021
Long rains assessment,
July, 2020
% of maize stocks held
by households
84% 62%
Livestock body
condition (Cattle)
Agropastoral Good to Fair Agropastoral Good
Irrigated cropping Good Irrigated
cropping
Good
Mixed Farming Good Mixed
farming
Good
Pastoral-all species Fair Pastoral-all
species
Good
Water consumption
(litres per person per
day
Agropastoral 15-25 Agropastoral 20-25
Irrigated cropping 20-25 Irrigated
cropping
25-30
4.3%
9.5%8.8%
9.8%9.1%
4.2%
10.5%
Proportion of children 6 to 59 with
MUAC below 125mm in Baringo
County within July 2020-January 2021
Jul-20 Aug-20 Sep-20 Oct-20
Figure 12:Nutritional Status by MUAC
Figure SEQ Figure \* ARABIC 12: Nutrition status by
MUAC

27
3.5.1 Enrolment
Table 20: Enrolment
LEVEL TERM II 2021 TERM 1 2020 DEVIATION PERCENTAGE
ECD BOYS 25,283 27,360 2077 -7.6
GIRLS 24,143 22,753 1390 +6.1
TOTAL 49, 426 50,113 687 -1.4
PRY BOYS 71,237 76,801 5564 -7.2
GIRLS 66,929 71,760 4831 -6.7
TOTAL 138,166 148,561 10,395 -7
SEC BOYS 23,660 24,734 1,074 -4.3
GIRLS 25,094 25,995 901 -3.4
TOTAL 48,754 50,729 1,975 -3.8
ECDE enrolment during the opening of term II, 2021 reflected a deviation of boys’ -7.6 percent
and girl’s +6.1 percent from enrolment of term 1 2020 while in primary school enrolment showed
a deviation of -7.2 percent and -6.7 percent boys and girls respectively from enrolment in term 1,
2020 (Table 20).
Mixed Farming 20-25 Mixed
Farming
25-30
Pastoral-all species 12-15 Pastoral-all
species
20-25
Price of maize (per kg) Kshs 40 Kshs 47
Distance to grazing Agropastoral 4-9 Agropastoral 1-4
Irrigated cropping 1-3 Irrigated
cropping
0.5-1.5
Mixed Farming 1-3 Mixed
Farming
0.5-1.5
Pastoral-all species 4-10 Pastoral-all
species
1-5
Terms of trade (pastoral
zone)
75.4 56
Coping strategy index County-13
Agropastoral-17
Pastoral-13
Irrigated Cropping-4
County-13
Agropastoral-20
Pastoral-14
Irrigated Cropping-4
Food consumption
score
Acceptable 72.9 Acceptable 73.3
Borderline 25.2 Borderline 25.6
Poor 1.9 Poor 1.1

28
While in secondary schools, 4.3 percent of boys and 3.4 percent of girls didn’t report back to school
for term II 2021 and this was contributed by several factors including fear of contracting COVID-
19, lack of school fees, lack of school meals program, circumcision of boys, pregnancies among
school girls, charcoal burning, fishing, and motorbike businesses among others.
3.5.2 Effects of COVID-19 in schools
During the pandemic period, a number of parents and guardians lost their incomes and livelihoods
resulting from job layoffs and collapse of businesses, the loss of income meant that they could not
afford to pay school fees for their children. To mitigate on the loss of income by parents and
guardians it forced some students to be transferred from private schools to public schools
especially around urban areas such as Kabarnet and Mogotio towns. There were also other parents
who were yet to send their students back to school due to fear of contracting COVID-19 at school,
inability to buy masks and sanitizers for their children. During the prolonged closure of schools,
some parents took their boys for circumcision ceremonies and some of them are yet to return to
school mostly in the pastoral livelihood zone, while cases of teenage pregnancies were reported in
nearly all the schools. Total of 5,732 girls did not report back to school for term two for both
primary and secondary schools, for the girls not reporting back it was estimated that about 70
percent of the cases could have been due to pregnancies.
During the short rains period, there were no reports of infrastructure damages, food store damages,
child abuse, physical violence and school gender-based violence. Cases of child labour were
reported in pastoral areas of Baringo South mostly around the lakes where boys were engaged in
fishing as a result of rising levels of the lakes. The percentage of students accessing E-learning
offered by Kenya Institute of Curriculum Development (KICD) through various platforms was
less than 20 percent and this was contributed by a number of factors like poor internet connectivity,
lack of interest from students, lack of appropriate gadgets such as smart phones.
3.5.3 Effects of long rains on schools
There were schools that were affected by floods during the long rains season (MAM and JJA) and
are still marooned by the floods, these include Ngambo primary and secondary school, Lake
Bogoria Girls, Loruk primary and Day Mixed Secondary and Lake Baringo Secondary school
which was relocated to higher grounds.
3.5.4 School feeding program
The County benefits from two types of school meals these are: Home Grown School Meals
Program (HGSMP) and Regular School Meals Program (RSMP). A total of 28,582 (14,610 boys
and 13,972 girls) are under RSMP. The HGSMP program funds a total of 79,339 learners of whom
40,952 are boys while 38,387 are girls. A total of 107,921 students (55, 562 boys and 52,359 girls)
are under school feeding program while 39,286 students (20,696 boys and 18,590 girls) are not
under any school feeding program. All ECDE learners are supported by the two school feeding
programs. However, by end of January 2021, funds for HGSMP had not been disbursed to schools.
3.5.5 Inter Sector links
The National Government through the Ministry of Education (MOE) provided masks to some
schools, water tanks and teachers were trained to guide and counsel children during the opening
of term two 2021. Sensitize children on MOH COVID-19 protocols in schools particularly
observing social distance. The GOK through MOE have also provided desks to help maintain
social distance to few schools that were identified as very needy. These desks were provided at a
cost of Kes 2500.00 for primary schools and Kes 3,800 for secondary schools.

29
In secondary schools, funds were provided to expand classrooms to meet the MOH protocols and
funding of free day secondary education. The Ministry of Interior and Coordination of National
Government through the chiefs and Nyumba Kumi are continuing to collaborate in identifying
children who have not reported back to school.
4.0 FOOD SECURITY PROGNOSIS
4.1 Prognosis assumptions
30
● According to FEWSNET Food security outlook report of December 2021, international
forecasts and the Kenya Meteorological Department (KMD) predict that La Niña conditions
are expected to persist at least through April 2021. The Long rains season of 2021 will be
normal. High day light temperatures are expected to persist up to March 2021.
● COVID-19 cases are likely to persist in the first half of 2021 and therefore necessitating the
continuation of restrictions and other COVID-19 control measures.
● According to the Desert Locust Global Forecast by FAO, a small third generation of breeding
is likely to commence in October in Samburu County and other areas with residual swarms but
may be limited by the forecasted below-normal October to December short rains that will limit
the moisture needed for the hatching of laid eggs. However, with the change of monsoon winds
during the October-December short rains season, there is a risk of re-invasion from Ethiopia,
Somalia, and Yemen into Kenya. The swarms have already entered Kenya and Baringo has
experienced invasion.
● The ongoing conflict and security operations in Tiaty Sub County are likely to last through
February to March 2021. This will likely trigger livestock migrations within and outside the
County.
● Forage conditions in range lands are likely to deteriorate in pastoral and agropastoral areas due
to the depressed short rains season.
● Food prices are expected to be above normal in pastoral areas due to market disruptions due to
insecurity.
● Lake water levels will continue to be higher than normal and that the long rains will exacerbate
the situation.
● Water access and availability will be stressed in pastoral areas for the next two months
● Other than in pastoral areas, livestock body condition will remain good to fair. In pastoral
areas, livestock body condition is likely to deteriorate in the next two months.
● Malnutrition rates will be below the long-term means
4.2 Food security outlook
Food security outlook for the next three months (February, March, April)
Food consumption is likely to worsen more so in pastoral areas like Tiaty due to limited access to
food as market operations have been interrupted by conflict. Household in pastoral areas are
expected to employ more coping strategies to overcome food shortages. Water availability and
access will be stressed as the high temperatures being experienced in the County will increase the
evaporation of water resources from surface based open sources. Maize prices will remain below
the LTA apart from the pastoral areas while terms of trade will be unfavorable in areas
experiencing insecurity challenges due to low livestock prices and high food prices. Malnutrition
cases in the County are expected to remain stable other than pockets of pastoral areas where the
rates are likely to rise. Household stocks will remain stable and sustain the County up to the onset
of the next rainfall season. Household incomes are likely to decline with the re-introduction of the
pre COVID-19 tax rates hence less money to purchase food and non-food items.
Food security outlook (May, June, July)
31
Livestock body condition is expected to be good due to the availability of good forage occasioned
by the long rains season hence an increase in milk production is expected. Household stocks will
be lower than normal pending replenishment from the long rains harvest while water resources in
terms of access and availability will be normal as a result of water source recharge from the long
rains. Livestock and cereal prices are likely to be normal across the County as markets shall have
resumed normal operations after restoration of security in conflict prone areas. Sanitation and
hygiene will likely be compromised around areas bordering the lakes due to flooding. Crop
performance is expected to be good due to the forecasted normal long rains but the gains might be
reversed if another wave of locust invasion was to materialize. Household incomes are likely to
improve due to the expected better market prices for both crops and livestock which will lead to
an improvement in the terms of trade.
Food consumption at the household will be good due to improved household incomes and crop
yield while water consumption will be normal to above normal following recharge of water
sources. Milk consumption is expected to be normal following improvement in milk production
and therefore causing a reduction in malnutrition incidents in the County.
5.0 CONCLUSIONS AND INTERVENTIONS

32
5.1 Conclusions
5.1.1 Phase classifications
The phase classification for the County is stressed (IPC PHASE 2). Some populations in pastoral
livelihood zone that are facing insecurity challenges are likely are likely to fall into crisis due to
challenges of food access, though may not meet the threshold to classify the area under phase 3.
5.1.2 Summary of finding
The onset of the short rains season was early in the first dekad of October while the distribution in
terms of time and space was poor to fair. Amounts received were near normal with the western
and Northern parts of the County receiving more than 100 percent of their normal rains while
southern and eastern parts received less than 100 percent of their normal rains. The County is
facing security challenges mostly in Tiaty Sub County which has affected market operations and
other service delivery. Area under acreage for maize declined slightly for both rain fed and
irrigated agriculture due to depressed season while household stocks are above the long-term
average due to the carry overs from the long rains harvest. Forage conditions are good apart from
the pastoral livelihood zone where they are in poor to fair conditions while TLUs are lower than
LTAs but higher than what was recorded in the previous assessment. Milk production is normal
other than in pastoral areas where it is below normal while milk prices are above the long term
means across all the livelihood zones. No major livestock disease outbreak was reported. Cases of
market interruptions have been reported in pastoral areas that are currently facing security
challenges but in other parts of the County, market operations are normal. Water access and
availability is stable although in pastoral areas, return trekking distances are above normal with
available water in surface based open sources being less than 50 percent. The terms of trade are
stable and above the long term means due to the prevailing price stability in cereals and livestock.
Food consumption score is acceptable across the livelihood zones while water consumption is
normal. Milk consumption is below normal while milk prices are above the LTAs. Household are
applying normal coping strategies although households in pastoral and agro pastoral are applying
more coping strategies in comparison to other areas. Food consumption score is acceptable across
the County while milk consumption is below normal. Water consumption at household level is
normal while malnutrition cases are low and stable according to MUAC data. The overall county
IPC classification is in phase two.
5.1.3 Sub County ranking
Sub
County
Predominant
Livelihood
Food
security
rank (1-6)
Main food security threat / Contributing factors
Tiaty Pastoral 1 ● Conflict
● Poor forage
● Poor water quality
and quantity
● Malnutrition
● High food prices
● Market interruptions
● Disruption of
transport services
● Low livestock prices
● Livestock diseases
● Poor access to
extension services

33
Baringo
South
Irrigated/
Pastoral
2 ● Floods (Rising waters
of the lake)
● Conflict
● Livestock diseases
● Displacement of
populations
● Disruption of
livelihoods
● Poor forage
● Poor water quality
and quantity
● Malnutrition
Baringo
North
Agropastoral 3 ● Floods (Rising waters
of the lake)
● Conflict
● Displacement of
populations
● Human wildlife
conflict
● Disruption of
livelihoods
● Poor forage
● Poor water quality
and quantity
● Malnutrition
Mogotio Agropastoral 4 ● Poor water quality
● Fair forage conditions
● Pasture harvesting
and conservation
Baringo
Centra
Mixed
Farming
5 ● Functional markets
● Better access roads
● Availability of green
vegetables and fruits
Eldama
Ravine
Mixed
Farming
6 ● Stable farm produce
● Good forage
conditions
Very Good (5-6) Good (4) Fair (3) Poor (1-2)
5.2 Ongoing interventions
5.2.1 Food interventions
There are no ongoing food interventions for now.
5.2.2 Nonfood interventions
Agriculture sector
Sub County Intervention Ward No. of
beneficiari
es
Implemente
rs
Impacts
in terms
of food
security
Cost Time
Frame
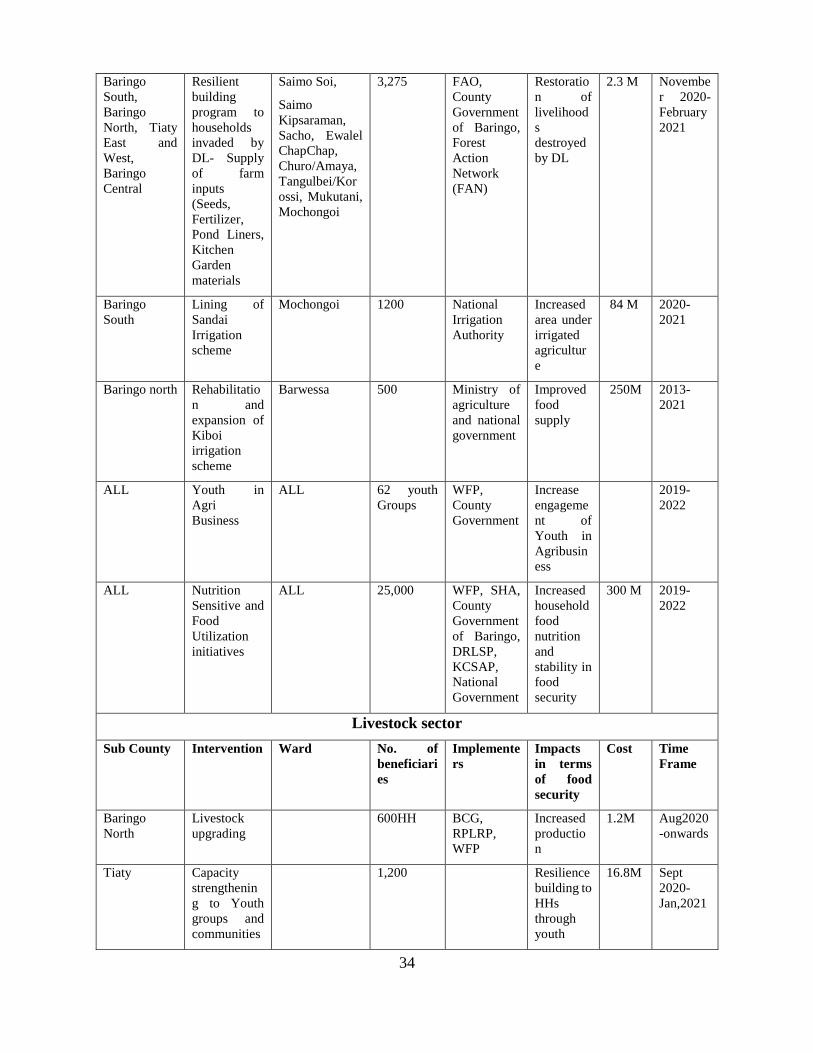
34
Baringo
South,
Baringo
North, Tiaty
East and
West,
Baringo
Central
Resilient
building
program to
households
invaded by
DL- Supply
of farm
inputs
(Seeds,
Fertilizer,
Pond Liners,
Kitchen
Garden
materials
Saimo Soi,
Saimo
Kipsaraman,
Sacho, Ewalel
ChapChap,
Churo/Amaya,
Tangulbei/Kor
ossi, Mukutani,
Mochongoi
3,275 FAO,
County
Government
of Baringo,
Forest
Action
Network
(FAN)
Restoratio
n of
livelihood
s
destroyed
by DL
2.3 M Novembe
r 2020-
February
2021
Baringo
South
Lining of
Sandai
Irrigation
scheme
Mochongoi 1200 National
Irrigation
Authority
Increased
area under
irrigated
agricultur
e
84 M 2020-
2021
Baringo north Rehabilitatio
n and
expansion of
Kiboi
irrigation
scheme
Barwessa 500 Ministry of
agriculture
and national
government
Improved
food
supply
250M 2013-
2021
ALL Youth in
Agri
Business
ALL 62 youth
Groups
WFP,
County
Government
Increase
engageme
nt of
Youth in
Agribusin
ess
2019-
2022
ALL Nutrition
Sensitive and
Food
Utilization
initiatives
ALL 25,000 WFP, SHA,
County
Government
of Baringo,
DRLSP,
KCSAP,
National
Government
Increased
household
food
nutrition
and
stability in
food
security
300 M 2019-
2022
Livestock sector
Sub County Intervention Ward No. of
beneficiari
es
Implemente
rs
Impacts
in terms
of food
security
Cost Time
Frame
Baringo
North
Livestock
upgrading
600HH BCG,
RPLRP,
WFP
Increased
productio
n
1.2M Aug2020
-onwards
Tiaty Capacity
strengthenin
g to Youth
groups and
communities
1,200 Resilience
building to
HHs
through
youth
16.8M Sept
2020-
Jan,2021
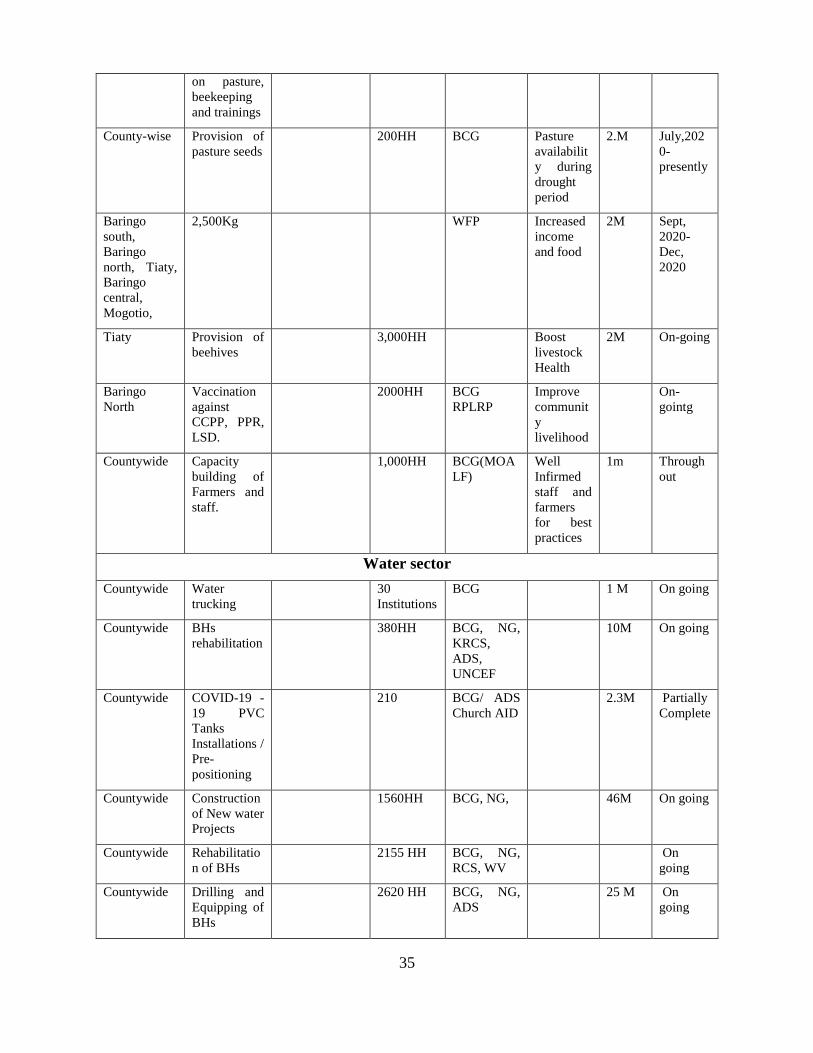
35
on pasture,
beekeeping
and trainings
County-wise Provision of
pasture seeds
200HH BCG Pasture
availabilit
y during
drought
period
2.M July,202
0-
presently
Baringo
south,
Baringo
north, Tiaty,
Baringo
central,
Mogotio,
2,500Kg WFP Increased
income
and food
2M Sept,
2020-
Dec,
2020
Tiaty Provision of
beehives
3,000HH Boost
livestock
Health
2M On-going
Baringo
North
Vaccination
against
CCPP, PPR,
LSD.
2000HH BCG
RPLRP
Improve
communit
y
livelihood
On-
gointg
Countywide Capacity
building of
Farmers and
staff.
1,000HH BCG(MOA
LF)
Well
Infirmed
staff and
farmers
for best
practices
1m Through
out
Water sector
Countywide Water
trucking
30
Institutions
BCG 1 M On going
Countywide BHs
rehabilitation
380HH BCG, NG,
KRCS,
ADS,
UNCEF
10M On going
Countywide COVID-19 -
19 PVC
Tanks
Installations /
Pre-
positioning
210 BCG/ ADS
Church AID
2.3M Partially
Complete
Countywide Construction
of New water
Projects
1560HH BCG, NG, 46M On going
Countywide Rehabilitatio
n of BHs
2155 HH BCG, NG,
RCS, WV
On
going
Countywide Drilling and
Equipping of
BHs
2620 HH BCG, NG,
ADS
25 M On
going

36
Countywide Capacity
building on
water
management
and
Catchment
protection
2130 HH BCG,
PLRRP,
RCS, WV,
UNCEF
20M On going
Health and Nutrition
BFCI
implementati
on
Building the
capacity of
CHV’s and
caregivers on
BFCI
Kolowa and
Lokis Wards in
Tiaty West
Pregnant,
Lactating
mothers
and
children
below 2
years
15M 15,000 ongoin
g
WVK,
FSK and
BCG
Support
formation of
new M2MSG
and CMSG,
and monthly
meetings of
M2MSG
Ptikii, Kreese
and Chepturu
CUs Tiaty West
Pregnant,
Lactating
mothers
and
children
below 2
years
10M 15,000 Feb
2021 –
April
2021
WVK,
FSK and
BCG
IMAM surge
strengthening
and
implementati
on
Real time
monitoring
of new
admission in
health
facilities and
real time
update of the
dash board
16 facilities in
Tiaty
Pregnant,
Lactating
mothers
and
children
below 2
years
2.0M 50,000 On
going
UNICEF,
MOH
Strengthen
LMIS
Timely
monthly
requisition of
nutrition
commodities
for treatment
of severe
malnutrition
All sub
counties-120
health facilities
offering IMAM
Severely
Malnouris
hed
children
below 5
years
100,000 3000 ongoin
g
SCNC,
CNO
Nutrition
sensitive
activities-
Strengthenin
g Household
food and
Nutrition
security
Establishmen
t of Kitchen
gardens and
small animal
raring to
promote
dietary
diversificatio
n
Tiaty, Baringo,
south, Central,
North and
Mogotio
Pregnant,
Lactating
mothers
and
children
below 5
years
5,0M 100,000 Ongoi
ng
WFP
Strengthenin
g Vit A
supplementat
ion
Upscaling
routine Vit
A,
deworming
supplementat
All facilities
and ECD’s --
Baringo
County
children
below 5
years
2,200,000 80,000 ongoin
g
BCG,
UNICEF,
Afya
uzazi

37
ion in all
facilities,
outreaches
and ECD and
through
Malezi bora
weeks-June
and
December
every year
Zinc
Supplementat
ion
Strengthen
management
of diarrheal
diseases
All health
facilities
children
below 5
years
867,000 75,000 Ongoi
ng
routine
BCG,
UNICEF
Management
of Acute
Malnutrition
(IMAM 100
health
facilities
Strengthen
access to
treatment of
malnutrition
All 100 IMAM
facilities
PLW,
Children
below 5
years
22,000,000 30,000 ongoin
g
MOH-
National,
BCG,
UNICEF
5.3 Recommended interventions
5.3.1 Food interventions
Population in need of food assistance
Sub-County Food
security rank
(Worst to best)
Main food security threat
/ Contributing factors
Proportion in need of
Immediate food
assistance (%)
Tiaty 1 ● Conflict
● Poor forage
● Poor water quality and quantity
● Malnutrition
● High food prices
● Market interruptions
● Disruption of transport services
● Low livestock prices
● Livestock diseases
● Poor access to extension services
25%-30%
Baringo South 2 ● Floods (Rising waters of the lake)
● Conflict
● Livestock diseases
● Displacement of populations
● Disruption of livelihoods
● Poor forage
● Poor water quality and quantity
● Malnutrition
10%-15%

38
Baringo North 3 ● Floods (Rising waters of the lake)
● Conflict
● Displacement of populations
● Human wildlife conflict
● Disruption of livelihoods
● Poor forage
● Poor water quality and quantity
● Malnutrition
10%-15%
5.3.2 Nonfood interventions
Agriculture sector recommendations
Sub County Intervention Ward No. of
beneficiar
ies
Implementers Impacts in
terms of
food
security
Cost Time
Frame
Countywide Inputs
provision
(Seeds,
Kitchen
Garden
Materials,
Fertilizers)
including
capacity
building on
post-harvest
and safe use of
chemicals
all 10000 National
Government,
County
Government and
FAO, WFP Other
development
partners,
Finances
(Kshs 50
million)
Staff 2019-
2022
County wide Value addition
of produce
cereals
(Maize,
Sorghum and
Millet)
through
milling and
fortification of
flour and
Market
linkages
Mogoti
o,
Mariga
t
Tenges
2000 WFP and County
Government of
Baringo
56M Staff,
Groups
identifie
d for
support
2019-
2022

39
Countywide Enhance asset
creation for
households
especially
Farm ponds
and water pans
for food
production
especially
Kitchen
Gardening
10000 National
Government,
County
Government and
development
partners
Finances
(Kshs 200
Million)
Staff 2019-
2022
Countywide Enhance
irrigated
Agriculture by
conducting
Soil analysis
and crops
suitability
surveys in all
irrigation
schemes and
canaling
All National
Government,
County
Government and
development
partners
Finances
(Kshs 200
Million)
Staff 2019-
2022
Livestock sector recommendations
-B/North,
Mogotio &
Tiaty(LSD,
CCPP)
-Vaccination
against, CCPP,
LSD and PPR
BCG, National
government and
Development
partners
4M - Feb,2021
-May,
2021
Tiaty,
B/North(LS
D)
-Disease
surveillance
270,000
goats
BCG 20M 0.5M Mar,202
1-June,
2021
Countywide Establishment
of strategic
livestock feed
reserves; in
ward level 3 in
Tiaty, 2 in
Baringo North
2 in Baringo
south and 1 in
Mogotio
4,500HH 80m Feb
2021-
Dec,202
1
Countywide Hay
harvesting and
baling
machinery
41,500HH 60m Feb
2021-
Dec,202
1
Countywide Provision of
COVID-19 -
19 control
facilities and
like masks,
water washing
tanks and
41,500HH
BCG
RPLRP
KCSAP
20m Feb,2021
-
Onwards

40
related
sanitizers
-COVID-19 -
19
sensitization at
markets
Water sector interventions
Countywide 15 No. Water
Supply
Rehabilitation
/ upgrading /
Servicing and
replacement of
pumping units
2480HH BCG, NG,
KRCS, WV,
UNCEF,
ACTED, USAID,
NDMA
120M 10M 1- 6
months
Countywide Stock piling of
Fast-Moving
Spares 18 No.
community
water supplies
1,260 HHs
ASAL
areas
BCG, NG,
KRCS, WV,
UNCEF, NDMA
300,000 _ 1- 6
months
Countywide Capacity
Strengthening
on WASH /
Water
Management
and Catchment
protection
30 No.
Communit
y Water
supplies
BCG, NG,
KRCS, WV,
UNCEF,
ACTED,
ACTION AID,
USAID, NDMA
10 M _ 1- 6
months
Countywide Supply of
Water
treatment
equipment’s
like water
purifiers, Pur,
Aqua tabs etc
3,000HHs BCG, NG,
KRCS, WV,
UNCEF,
ACTED,
ACTION AID,
USAID, NDMA
6 M - 1 -6
Months
Countywide Water trucking
to vulnerable
Institutions
and
Communities
40-60
Institutions
BCG, NG,
KRCS, WV,
UNCEF,
ACTED,
ACTION AID,
USAID, NEMA,
NDMA, WFP
3.5M 1 M 1 -6
Months
Health Sector interventions
Pastoral and
agropastoral
Zones
Mass
screening
50 sites County
department of
health services,
KRCS, UNICEF
Catholic mission,
NDMA
1,500,000 0 1 year
East Pokot,
Baringo
North,
Integrated
medical
outreaches
30 sites County
department of
health services,
KRCS, UNICEF,
5,000,000 1,000,00
0
1 year

41
Marigat &
Mogotio
Action aid,
catholic, NDMA
pastoral and
agro –
pastoral
Zones
Purchase and
distribute
water
treatment
drugs and
chemicals
All County
department of
health services,
UNICEF, KRCS,
ACTIONAID
WVK
3,000,000
1,000,00
0
1 year
All pastoral
and
agropastoral
Dissemination
of health and
nutrition
messages to
the community
35 CUs
County
County
department of
health services,
UNICEF, KRCS,
ACTIONAID
WVK
4,000,000 200,000 1 year
Tiaty East,
East Pokot,
Marigat,
Baringo,
North,
Mogotio and
Baringo
central
Nutrition
sensitive
interventions-
scale-up
18 wards County
department of
health services,
WFP, Self Help
Africa (SHA)
10,0000,00
0
2,000,00
0
1 year
imam surge
in 40 health
facilities
Implement
imam surge
Tiaty East,
West,
Baringo
North and
South
County
department of
health services,
UNICEF, KRCS,
ACTIONAID,
WVK, NDMA
6,000,000 1,500,00
0
1 year
Pastoral and
agropastoral
zones
Trained
caregivers on
family MUAC
11 sentinel
sites
County
department of
health services,
UNICEF, KRCS,
ACTION AID,
WVK, NDMA
3,000,000 0 1 year