Embed Size (px)
Citation preview

Sensitive
WE’RE DIFFERENTIn pursuit of a better way.
February 2020
Investor Presentation
Sensitive
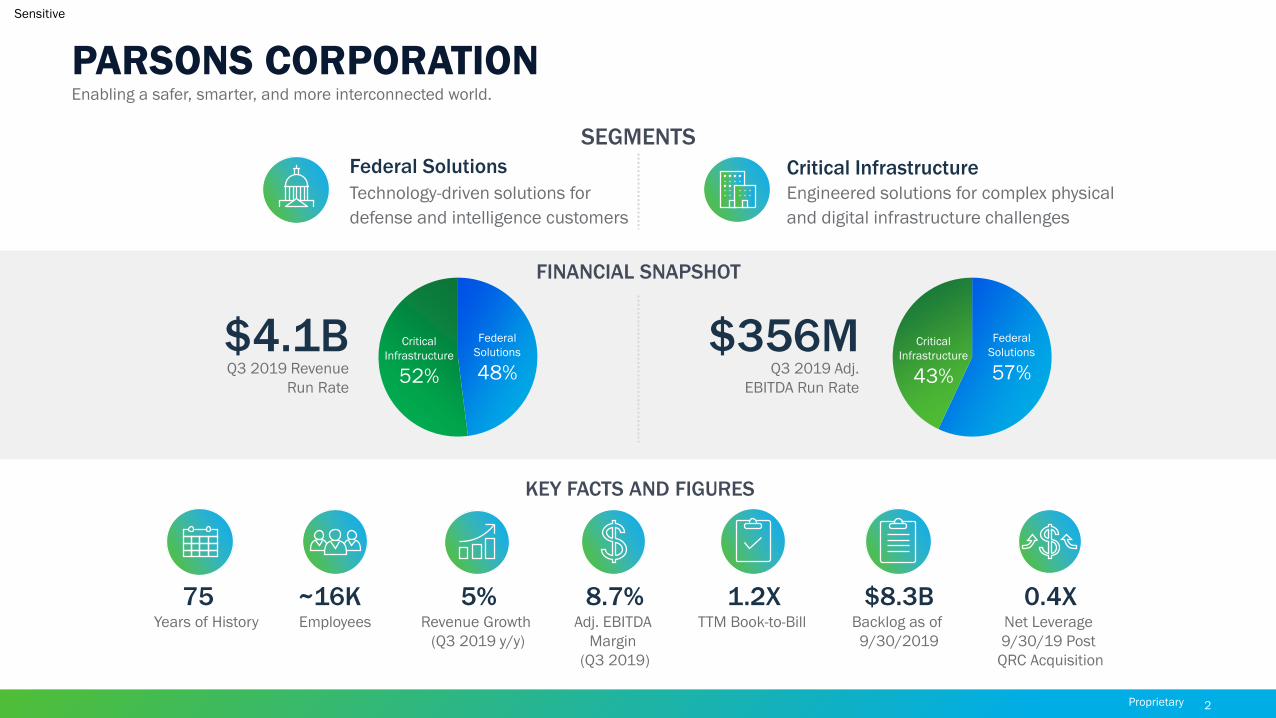
Engineered solutions for complex physical
and digital infrastructure challenges
SEGMENTS
KEY FACTS AND FIGURES
Technology-driven solutions for
defense and intelligence customers
FINANCIAL SNAPSHOT
$4.1B Q3 2019 Revenue
Run Rate
$356MQ3 2019 Adj.
EBITDA Run Rate
75Years of History
Federal
Solutions
48%
Critical
Infrastructure
52%
Federal
Solutions
57%
Critical
Infrastructure
43%
Federal Solutions Critical Infrastructure
~16KEmployees
5%Revenue Growth
(Q3 2019 y/y)
8.7%Adj. EBITDA
Margin
(Q3 2019)
1.2XTTM Book-to-Bill
$8.3BBacklog as of
9/30/2019
0.4XNet Leverage
9/30/19 Post
QRC Acquisition
PARSONS CORPORATIONEnabling a safer, smarter, and more interconnected world.
Proprietary 2
Sensitive
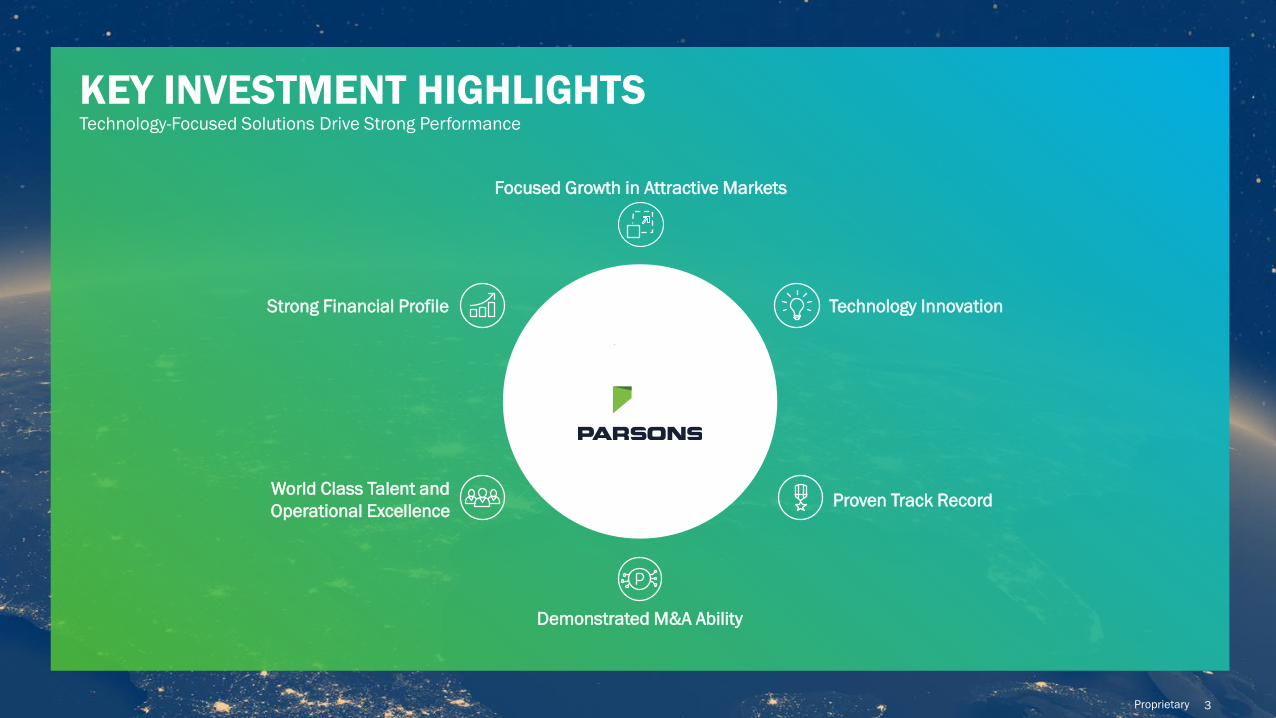
Strong Financial Profile
Proven Track Record
Focused Growth in Attractive Markets
Technology Innovation
Demonstrated M&A Ability
World Class Talent and
Operational Excellence
Proprietary 3
KEY INVESTMENT HIGHLIGHTSTechnology-Focused Solutions Drive Strong Performance
Sensitive
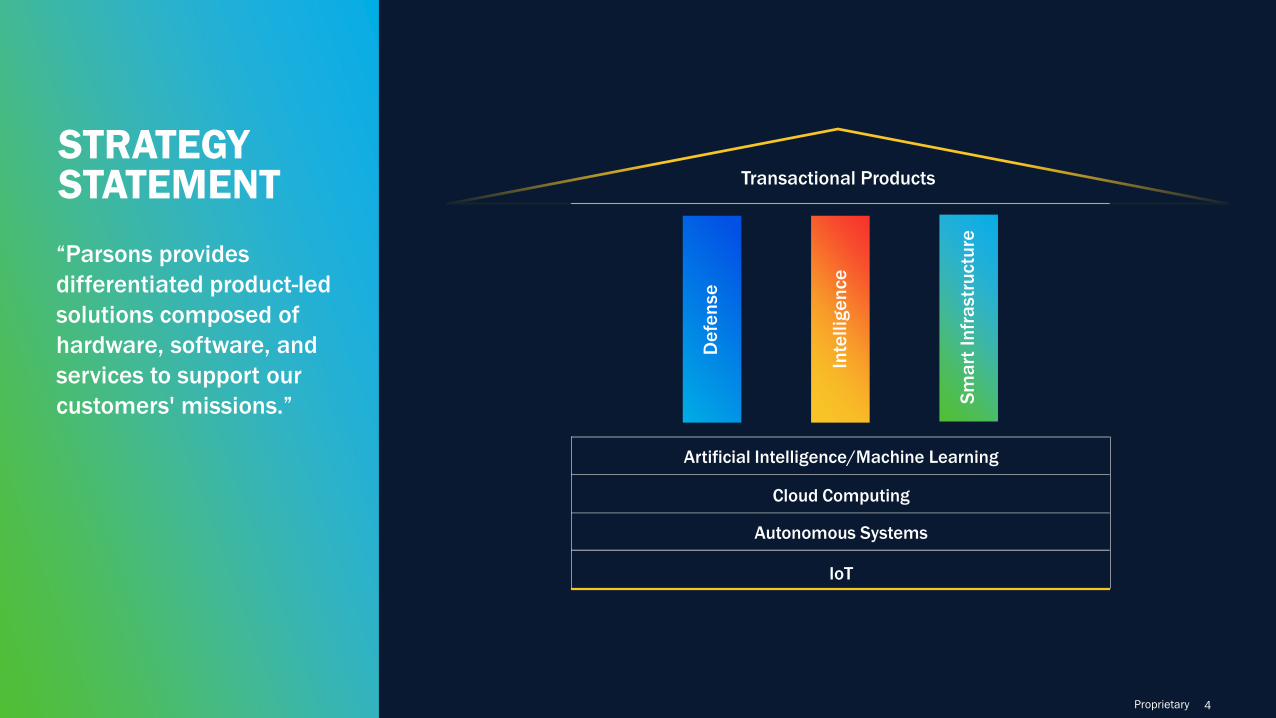
STRATEGY STATEMENT
“Parsons provides
differentiated product-led
solutions composed of
hardware, software, and
services to support our
customers' missions.”
Transactional Products
Artificial Intelligence/Machine Learning
Cloud Computing
Autonomous Systems
IoT
De
fen
se
Inte
llig
en
ce
Sm
art
In
fra
str
uctu
re
Proprietary 4
Sensitive
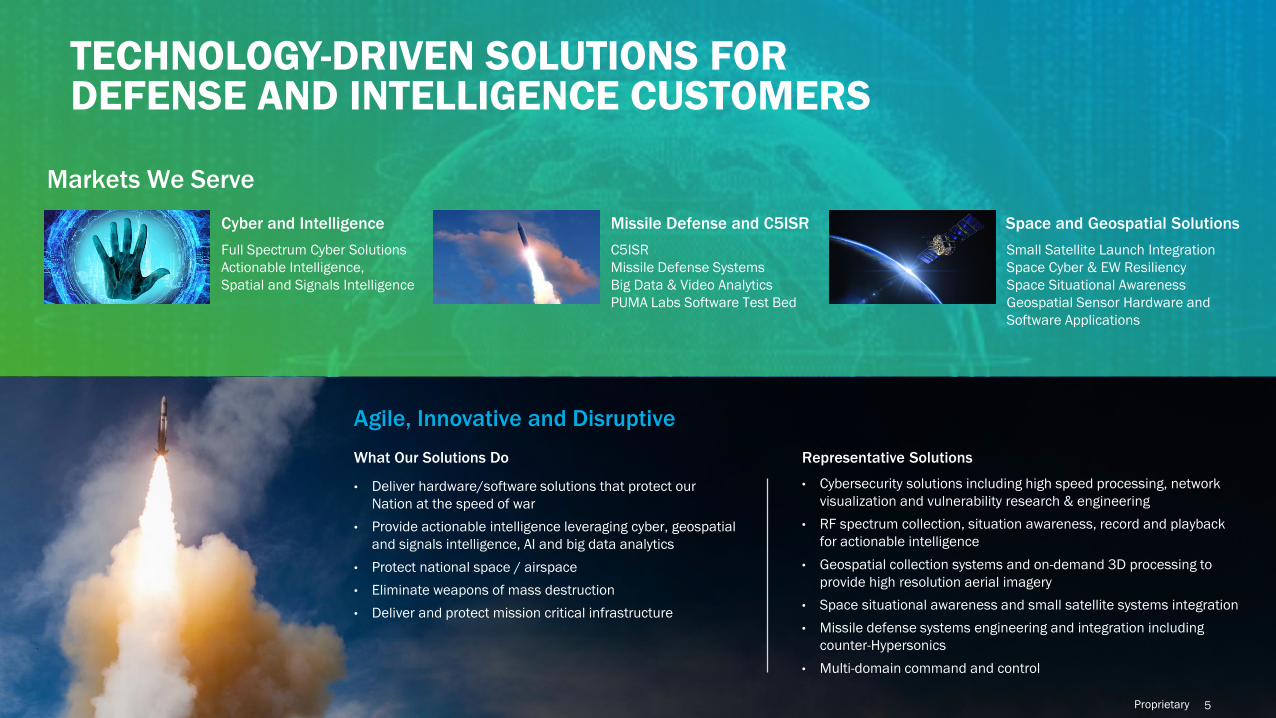
TECHNOLOGY-DRIVEN SOLUTIONS FOR DEFENSE AND INTELLIGENCE CUSTOMERS
Proprietary 5
Markets We Serve
Cyber and Intelligence
Full Spectrum Cyber Solutions
Actionable Intelligence,
Spatial and Signals Intelligence
Space and Geospatial Solutions
Small Satellite Launch Integration
Space Cyber & EW Resiliency
Space Situational Awareness
Geospatial Sensor Hardware and
Software Applications
Missile Defense and C5ISR
C5ISR
Missile Defense Systems
Big Data & Video Analytics
PUMA Labs Software Test Bed
• Deliver hardware/software solutions that protect our
Nation at the speed of war
• Provide actionable intelligence leveraging cyber, geospatial
and signals intelligence, AI and big data analytics
• Protect national space / airspace
• Eliminate weapons of mass destruction
• Deliver and protect mission critical infrastructure
What Our Solutions Do
• Cybersecurity solutions including high speed processing, network
visualization and vulnerability research & engineering
• RF spectrum collection, situation awareness, record and playback
for actionable intelligence
• Geospatial collection systems and on-demand 3D processing to
provide high resolution aerial imagery
• Space situational awareness and small satellite systems integration
• Missile defense systems engineering and integration including
counter-Hypersonics
• Multi-domain command and control
Agile, Innovative and Disruptive
Representative Solutions
Sensitive
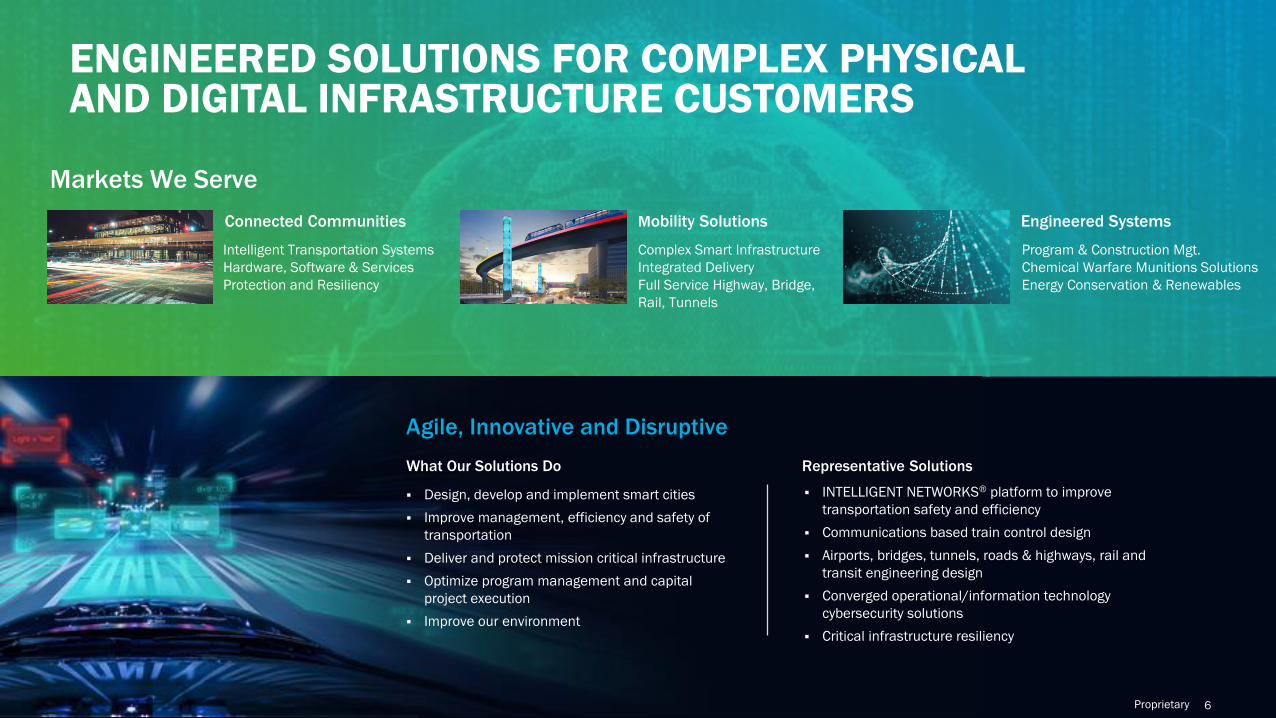
ENGINEERED SOLUTIONS FOR COMPLEX PHYSICAL AND DIGITAL INFRASTRUCTURE CUSTOMERS
Future Technologies
• Dark analytics
• NoOps/quantum computing
• Autonomous intelligence
• Hypersonics, directed energy
• New emerging technologies
Proprietary 6
Markets We Serve
Connected Communities
Intelligent Transportation Systems
Hardware, Software & Services
Protection and Resiliency
Engineered Systems
Program & Construction Mgt.
Chemical Warfare Munitions Solutions
Energy Conservation & Renewables
Mobility Solutions
Complex Smart Infrastructure
Integrated Delivery
Full Service Highway, Bridge,
Rail, Tunnels
▪ Design, develop and implement smart cities
▪ Improve management, efficiency and safety of
transportation
▪ Deliver and protect mission critical infrastructure
▪ Optimize program management and capital
project execution
▪ Improve our environment
What Our Solutions Do
▪ INTELLIGENT NETWORKS® platform to improve
transportation safety and efficiency
▪ Communications based train control design
▪ Airports, bridges, tunnels, roads & highways, rail and
transit engineering design
▪ Converged operational/information technology
cybersecurity solutions
▪ Critical infrastructure resiliency
Agile, Innovative and Disruptive
Representative Solutions
Sensitive
7
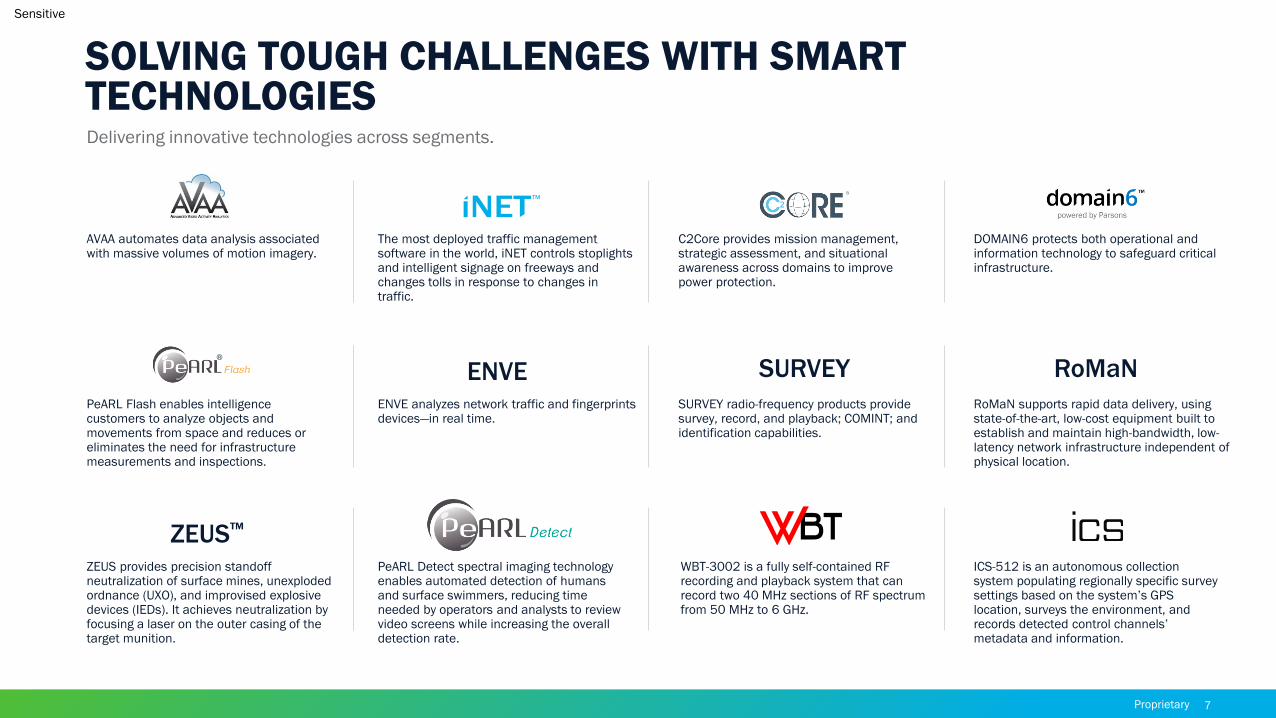
Delivering innovative technologies across segments.
SOLVING TOUGH CHALLENGES WITH SMART TECHNOLOGIES
AVAA automates data analysis associated with massive volumes of motion imagery.
The most deployed traffic management software in the world, iNET controls stoplights and intelligent signage on freeways and changes tolls in response to changes in traffic.
C2Core provides mission management, strategic assessment, and situational awareness across domains to improve power protection.
DOMAIN6 protects both operational and information technology to safeguard critical infrastructure.
™
®
ENVEPeARL Flash enables intelligence customers to analyze objects and movements from space and reduces or eliminates the need for infrastructure measurements and inspections.
ENVE analyzes network traffic and fingerprints devices—in real time.
SURVEY radio-frequency products provide survey, record, and playback; COMINT; and identification capabilities.
RoMaN supports rapid data delivery, using state-of-the-art, low-cost equipment built to establish and maintain high-bandwidth, low-latency network infrastructure independent of physical location.
ZEUS provides precision standoff neutralization of surface mines, unexploded ordnance (UXO), and improvised explosive devices (IEDs). It achieves neutralization by focusing a laser on the outer casing of the target munition.
PeARL Detect spectral imaging technology enables automated detection of humans and surface swimmers, reducing time needed by operators and analysts to review video screens while increasing the overall detection rate.
WBT-3002 is a fully self-contained RF recording and playback system that can record two 40 MHz sections of RF spectrum from 50 MHz to 6 GHz.
SURVEY RoMaN
ZEUS™
Proprietary 7
ICS-512 is an autonomous collection system populating regionally specific survey settings based on the system’s GPS location, surveys the environment, and records detected control channels’ metadata and information.
Sensitive
8
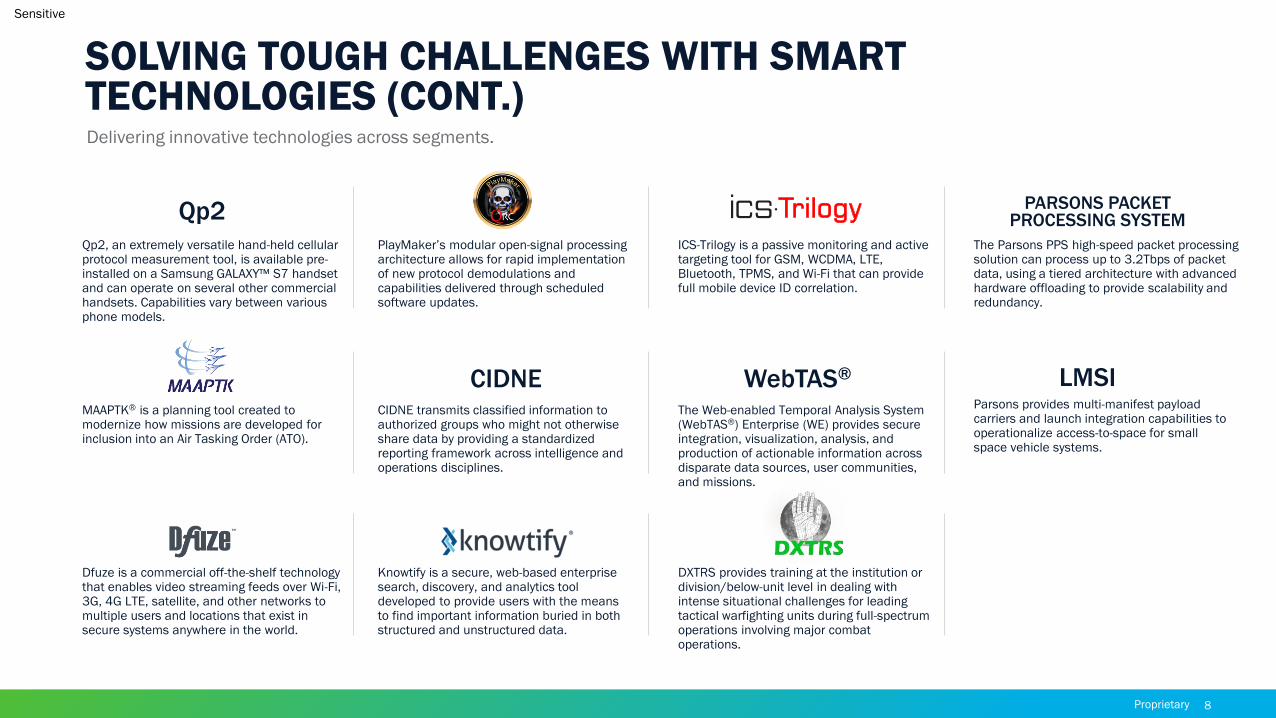
Delivering innovative technologies across segments.
SOLVING TOUGH CHALLENGES WITH SMART TECHNOLOGIES (CONT.)
Qp2, an extremely versatile hand-held cellular protocol measurement tool, is available pre-installed on a Samsung GALAXY™ S7 handset and can operate on several other commercial handsets. Capabilities vary between various phone models.
PlayMaker’s modular open-signal processing architecture allows for rapid implementation of new protocol demodulations and capabilities delivered through scheduled software updates.
ICS-Trilogy is a passive monitoring and active targeting tool for GSM, WCDMA, LTE, Bluetooth, TPMS, and Wi-Fi that can provide full mobile device ID correlation.
The Parsons PPS high-speed packet processing solution can process up to 3.2Tbps of packet data, using a tiered architecture with advanced hardware offloading to provide scalability and redundancy.
MAAPTK® is a planning tool created to modernize how missions are developed for inclusion into an Air Tasking Order (ATO).
CIDNE transmits classified information to authorized groups who might not otherwise share data by providing a standardized reporting framework across intelligence and operations disciplines.
The Web-enabled Temporal Analysis System (WebTAS®) Enterprise (WE) provides secure integration, visualization, analysis, and production of actionable information across disparate data sources, user communities, and missions.
Dfuze is a commercial off-the-shelf technology that enables video streaming feeds over Wi-Fi, 3G, 4G LTE, satellite, and other networks to multiple users and locations that exist in secure systems anywhere in the world.
Knowtify is a secure, web-based enterprise search, discovery, and analytics tool developed to provide users with the means to find important information buried in both structured and unstructured data.
DXTRS provides training at the institution or division/below-unit level in dealing with intense situational challenges for leading tactical warfighting units during full-spectrum operations involving major combat operations.
Parsons provides multi-manifest payload carriers and launch integration capabilities to operationalize access-to-space for small space vehicle systems.
Qp2 PARSONS PACKET PROCESSING SYSTEM
CIDNE WebTAS® LMSI
Proprietary 8
Sensitive
9
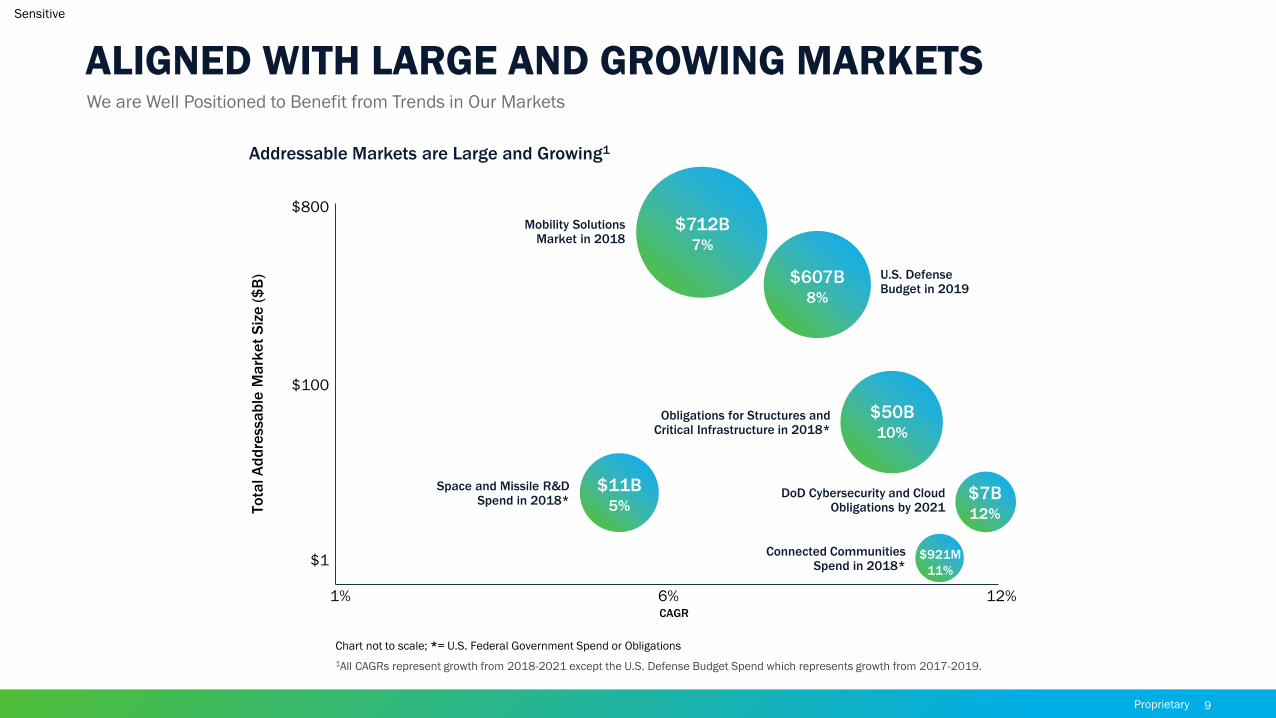
We are Well Positioned to Benefit from Trends in Our Markets
ALIGNED WITH LARGE AND GROWING MARKETS
Proprietary 9
Addressable Markets are Large and Growing1
1All CAGRs represent growth from 2018-2021 except the U.S. Defense Budget Spend which represents growth from 2017-2019.
1% 12%6%CAGR
Chart not to scale; *= U.S. Federal Government Spend or Obligations
To
tal A
dd
ressa
ble
Ma
rke
t S
ize
($
B)
$1
$100
$800
$921M
11%
Connected Communities Spend in 2018*
$7B12%
DoD Cybersecurity and Cloud Obligations by 2021
$11B5%
Space and Missile R&D Spend in 2018*
$50B10%
Obligations for Structures and Critical Infrastructure in 2018*
$607B8%
U.S. Defense Budget in 2019
$712B7%
Mobility Solutions Market in 2018
Sensitive
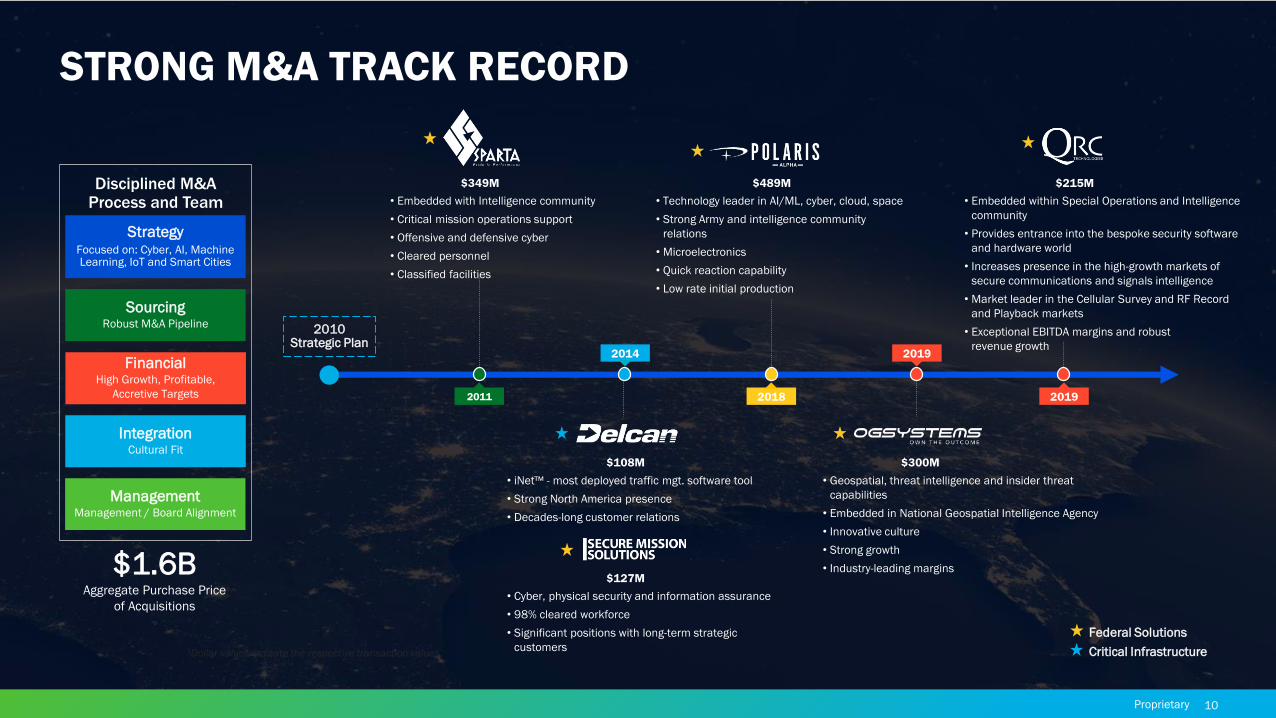
StrategyFocused on: Cyber, AI, Machine Learning, IoT and Smart Cities
SourcingRobust M&A Pipeline
FinancialHigh Growth, Profitable,
Accretive Targets
ManagementManagement / Board Alignment
IntegrationCultural Fit
• Embedded with Intelligence community
• Critical mission operations support
• Offensive and defensive cyber
• Cleared personnel
• Classified facilities
• iNet™ - most deployed traffic mgt. software tool
• Strong North America presence
• Decades-long customer relations
• Cyber, physical security and information assurance
• 98% cleared workforce
• Significant positions with long-term strategic
customers
• Technology leader in AI/ML, cyber, cloud, space
• Strong Army and intelligence community
relations
• Microelectronics
• Quick reaction capability
• Low rate initial production
• Geospatial, threat intelligence and insider threat
capabilities
• Embedded in National Geospatial Intelligence Agency
• Innovative culture
• Strong growth
• Industry-leading margins
• Embedded within Special Operations and Intelligence
community
• Provides entrance into the bespoke security software
and hardware world
• Increases presence in the high-growth markets of
secure communications and signals intelligence
• Market leader in the Cellular Survey and RF Record
and Playback markets
• Exceptional EBITDA margins and robust
revenue growth
Federal Solutions
Critical Infrastructure
2010 Strategic Plan
2011
2014
$349M $489M $215M
$300M$108M
$127M
2018
2019
2019
Disciplined M&A Process and Team
1Dollar values indicate the respective transaction values.
$1.6BAggregate Purchase Price
of Acquisitions
Proprietary 10
STRONG M&A TRACK RECORD
Sensitive
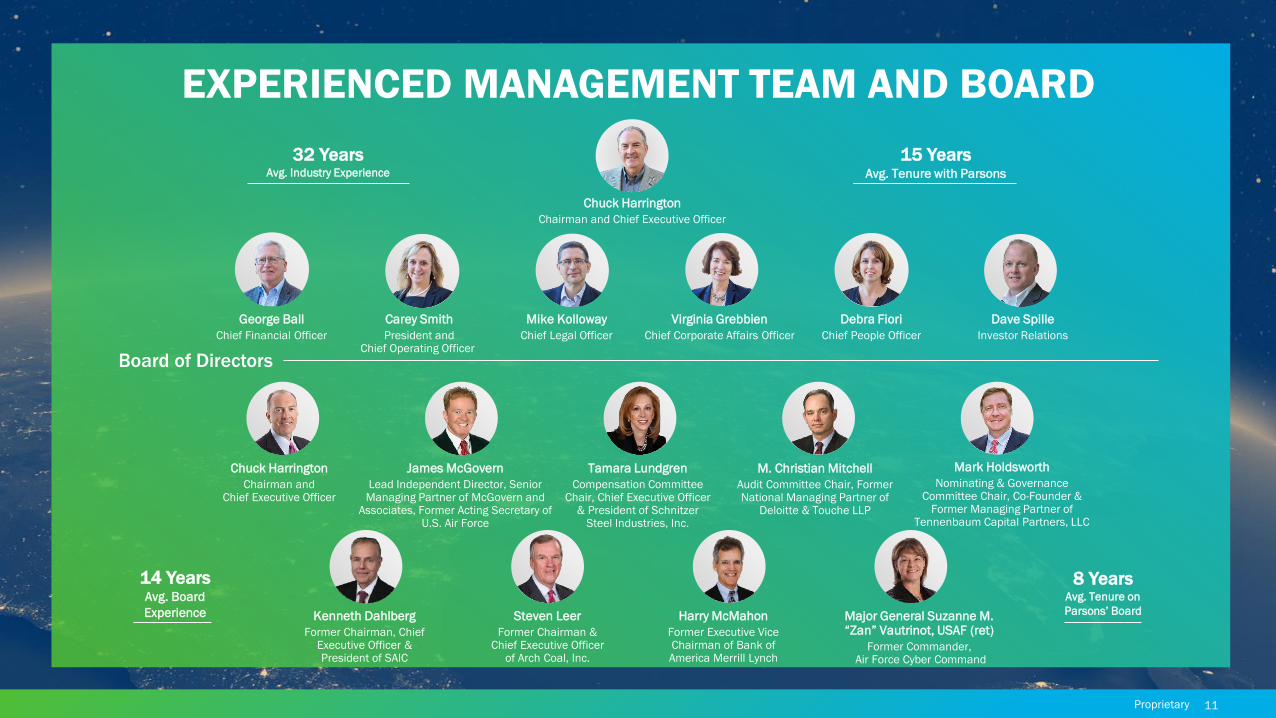
EXPERIENCED MANAGEMENT TEAM AND BOARD
Chuck Harrington
Chairman and Chief Executive Officer
Major General Suzanne M. “Zan” Vautrinot, USAF (ret)
Former Commander,Air Force Cyber Command
George Ball
Chief Financial Officer
Carey Smith
President and Chief Operating Officer
Mike Kolloway
Chief Legal Officer
Virginia Grebbien
Chief Corporate Affairs Officer
Mark Holdsworth
Nominating & Governance Committee Chair, Co-Founder &
Former Managing Partner of Tennenbaum Capital Partners, LLC
Harry McMahon
Former Executive Vice Chairman of Bank of America Merrill Lynch
Steven Leer
Former Chairman & Chief Executive Officer
of Arch Coal, Inc.
Kenneth Dahlberg
Former Chairman, Chief Executive Officer & President of SAIC
Chuck Harrington
Chairman and Chief Executive Officer
James McGovern
Lead Independent Director, Senior Managing Partner of McGovern and
Associates, Former Acting Secretary of U.S. Air Force
Tamara Lundgren
Compensation Committee Chair, Chief Executive Officer
& President of Schnitzer Steel Industries, Inc.
M. Christian Mitchell
Audit Committee Chair, Former National Managing Partner of
Deloitte & Touche LLP
Debra Fiori
Chief People Officer
32 YearsAvg. Industry Experience
15 YearsAvg. Tenure with Parsons
Dave Spille
Investor Relations
8 Years Avg. Tenure on
Parsons’ Board
14 Years Avg. Board
Experience
Board of Directors
11Proprietary
Sensitive
12
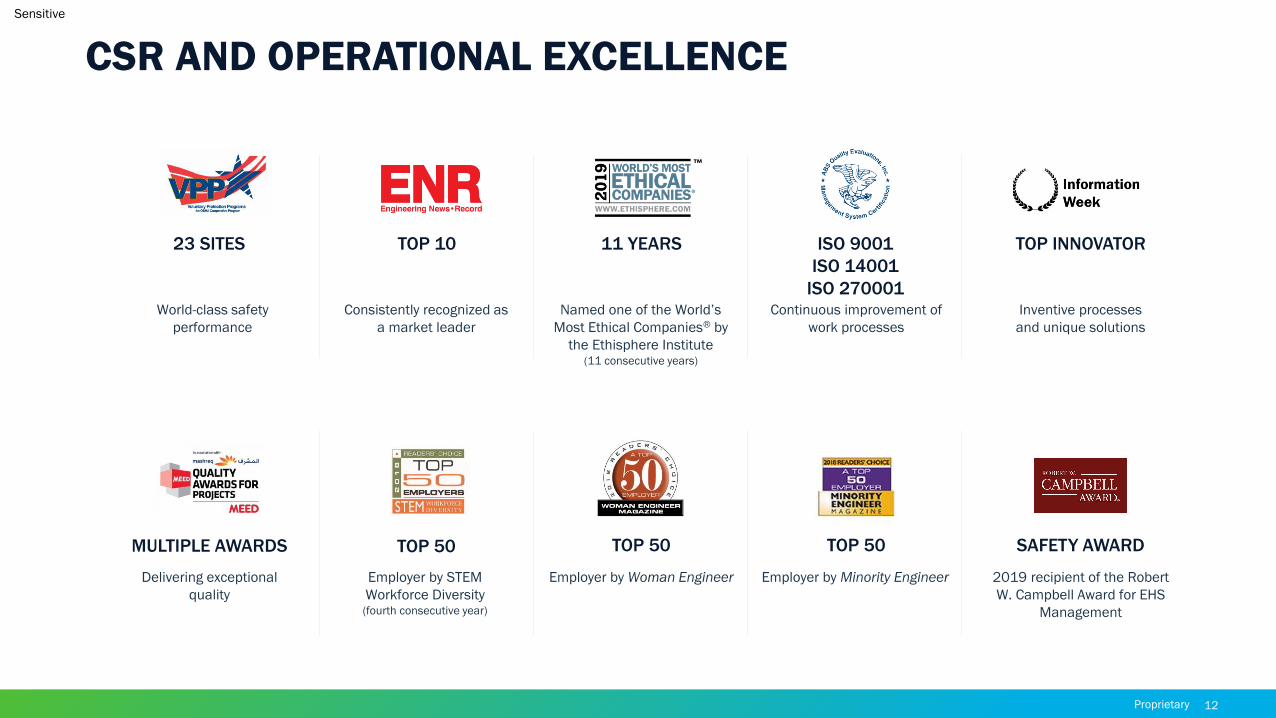
23 SITES
MULTIPLE AWARDS
TOP 10 11 YEARS ISO 9001
ISO 14001
ISO 270001
TOP INNOVATOR
World-class safety
performance
Consistently recognized as
a market leader
Named one of the World’s
Most Ethical Companies® by
the Ethisphere Institute(11 consecutive years)
Continuous improvement of
work processes
Inventive processes
and unique solutions
Delivering exceptional
quality
TOP 50
Employer by STEM
Workforce Diversity (fourth consecutive year)
TOP 50
Employer by Woman Engineer
TOP 50
Employer by Minority Engineer
SAFETY AWARD
2019 recipient of the Robert
W. Campbell Award for EHS
Management
CSR AND OPERATIONAL EXCELLENCE
Proprietary 12

Sensitive
FINANCIAL HIGHLIGHTS
Proprietary 13
Sensitive
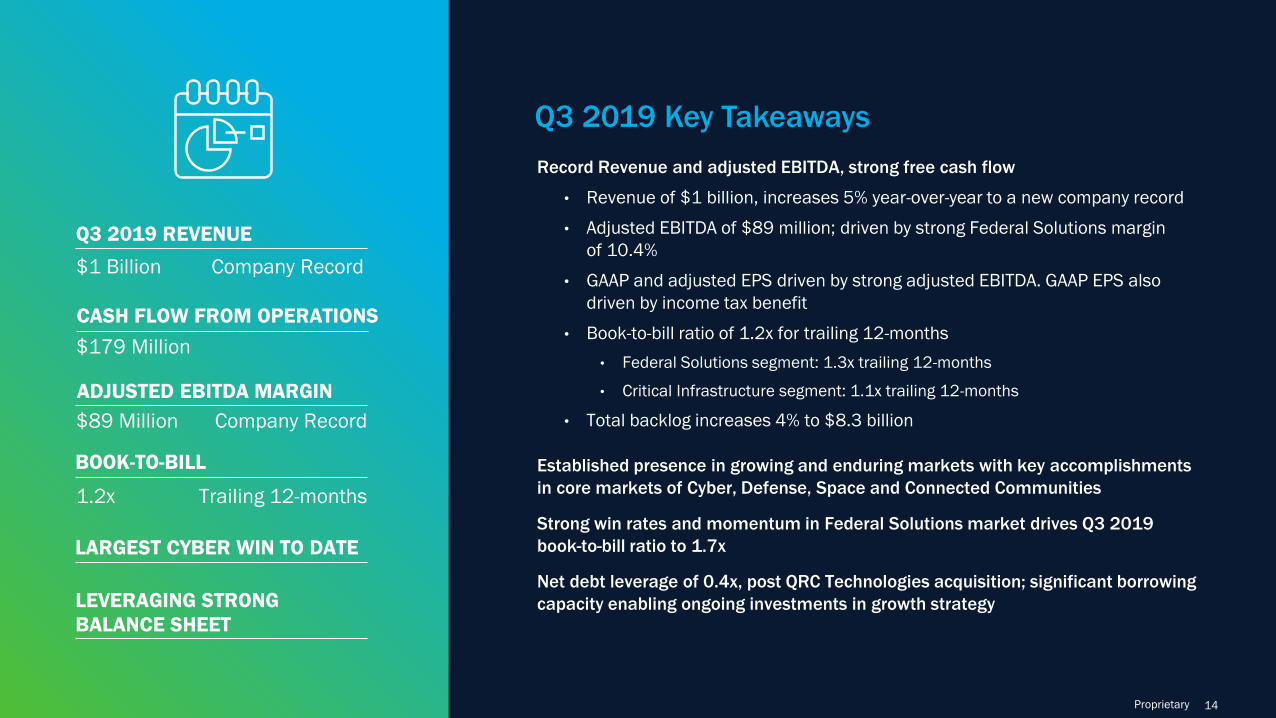
Q3 2019 REVENUE
$1 Billion Company Record
ADJUSTED EBITDA MARGIN
$89 Million
BOOK-TO-BILL
1.2x Trailing 12-months
LARGEST CYBER WIN TO DATE
LEVERAGING STRONG
BALANCE SHEET
CASH FLOW FROM OPERATIONS
Company Record
$179 Million
Proprietary 14
Q3 2019 Key Takeaways
Established presence in growing and enduring markets with key accomplishments
in core markets of Cyber, Defense, Space and Connected Communities
Strong win rates and momentum in Federal Solutions market drives Q3 2019
book-to-bill ratio to 1.7x
Net debt leverage of 0.4x, post QRC Technologies acquisition; significant borrowing
capacity enabling ongoing investments in growth strategy
Record Revenue and adjusted EBITDA, strong free cash flow
• Revenue of $1 billion, increases 5% year-over-year to a new company record
• Adjusted EBITDA of $89 million; driven by strong Federal Solutions margin
of 10.4%
• GAAP and adjusted EPS driven by strong adjusted EBITDA. GAAP EPS also
driven by income tax benefit
• Book-to-bill ratio of 1.2x for trailing 12-months
• Federal Solutions segment: 1.3x trailing 12-months
• Critical Infrastructure segment: 1.1x trailing 12-months
• Total backlog increases 4% to $8.3 billion
Sensitive
Q3 2019 BUSINESS SEGMENT HIGHLIGHTS
Proprietary 15
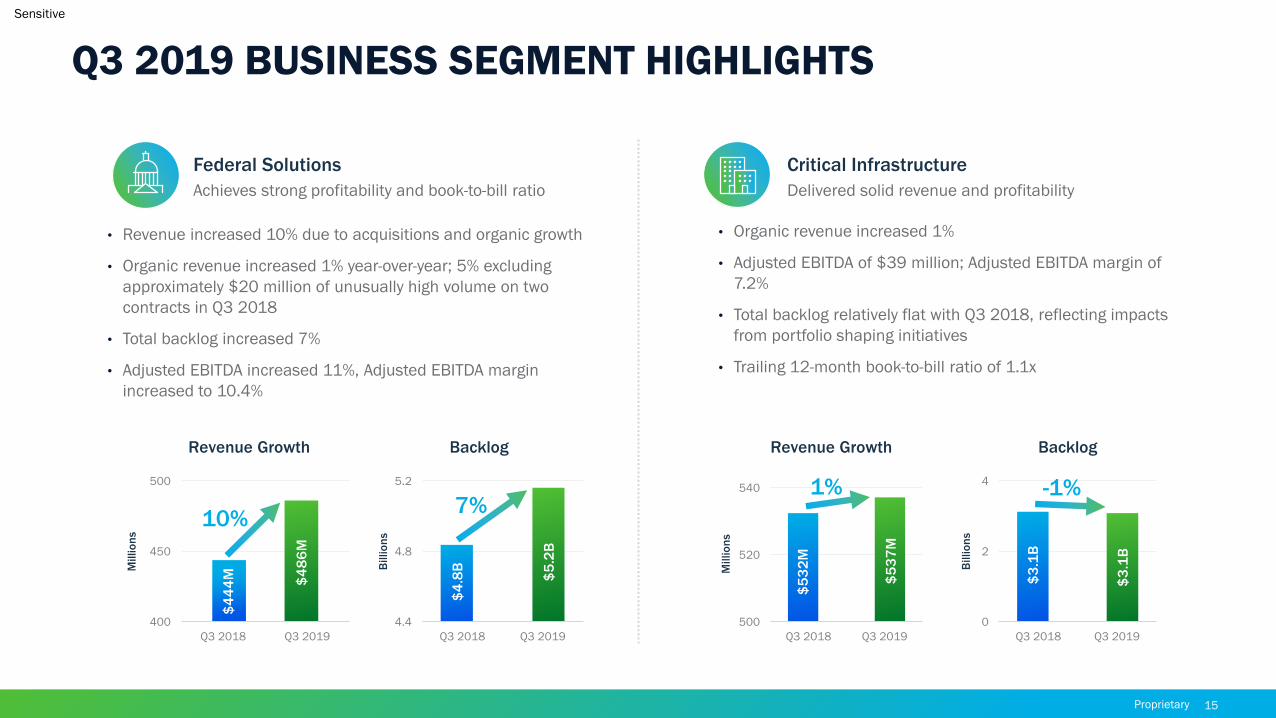
Achieves strong profitability and book-to-bill ratio
Federal Solutions
Delivered solid revenue and profitability
Critical Infrastructure
• Revenue increased 10% due to acquisitions and organic growth
• Organic revenue increased 1% year-over-year; 5% excluding
approximately $20 million of unusually high volume on two
contracts in Q3 2018
• Total backlog increased 7%
• Adjusted EBITDA increased 11%, Adjusted EBITDA margin
increased to 10.4%
• Organic revenue increased 1%
• Adjusted EBITDA of $39 million; Adjusted EBITDA margin of
7.2%
• Total backlog relatively flat with Q3 2018, reflecting impacts
from portfolio shaping initiatives
• Trailing 12-month book-to-bill ratio of 1.1x
Revenue Growth Revenue Growth
400
450
500
Q3 2018 Q3 2019
4.4
4.8
5.2
Q3 2018 Q3 2019
7%
$4
86
M
$4
44
M
$4
.8B
$5
.2B
0
2
4
Q3 2018 Q3 2019
-1%
$3
.1B
$3
.1B
Millio
ns
Billio
ns
500
520
540
Q3 2018 Q3 2019
$5
32
M
$5
37
M
10%
1%
Millio
ns
Billio
ns
Backlog Backlog
Sensitive
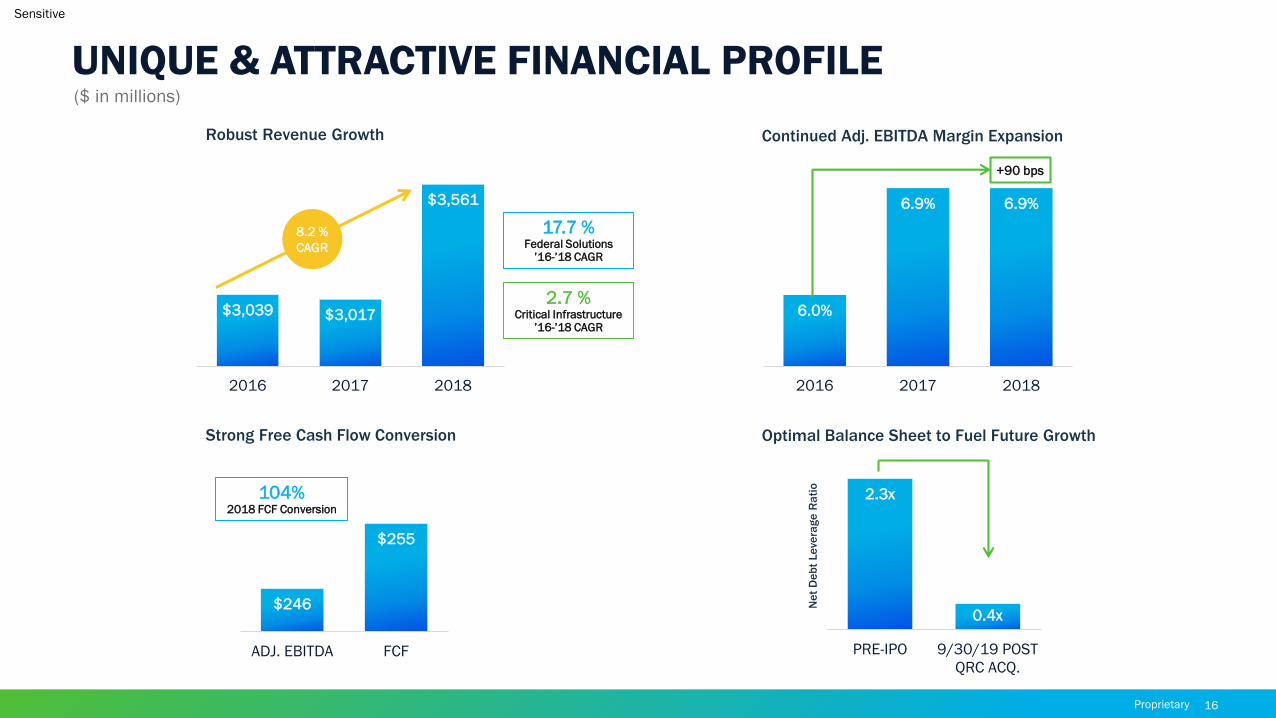
UNIQUE & ATTRACTIVE FINANCIAL PROFILE
Proprietary 16
2.3x
0.4x
PRE-IPO 9/30/19 POST
QRC ACQ.
6.0%
6.9% 6.9%
2016 2017 2018
($ in millions)
Robust Revenue Growth Continued Adj. EBITDA Margin Expansion
Strong Free Cash Flow Conversion
17.7 % Federal Solutions
’16-’18 CAGR
2.7 % Critical Infrastructure
’16-’18 CAGR
Optimal Balance Sheet to Fuel Future Growth
$3,039 $3,017
$3,561
2016 2017 2018
8.2 %
CAGR
$246
$255
ADJ. EBITDA FCF
104% 2018 FCF Conversion
Ne
t D
eb
t Le
vera
ge
Ra
tio
+90 bps
Sensitive
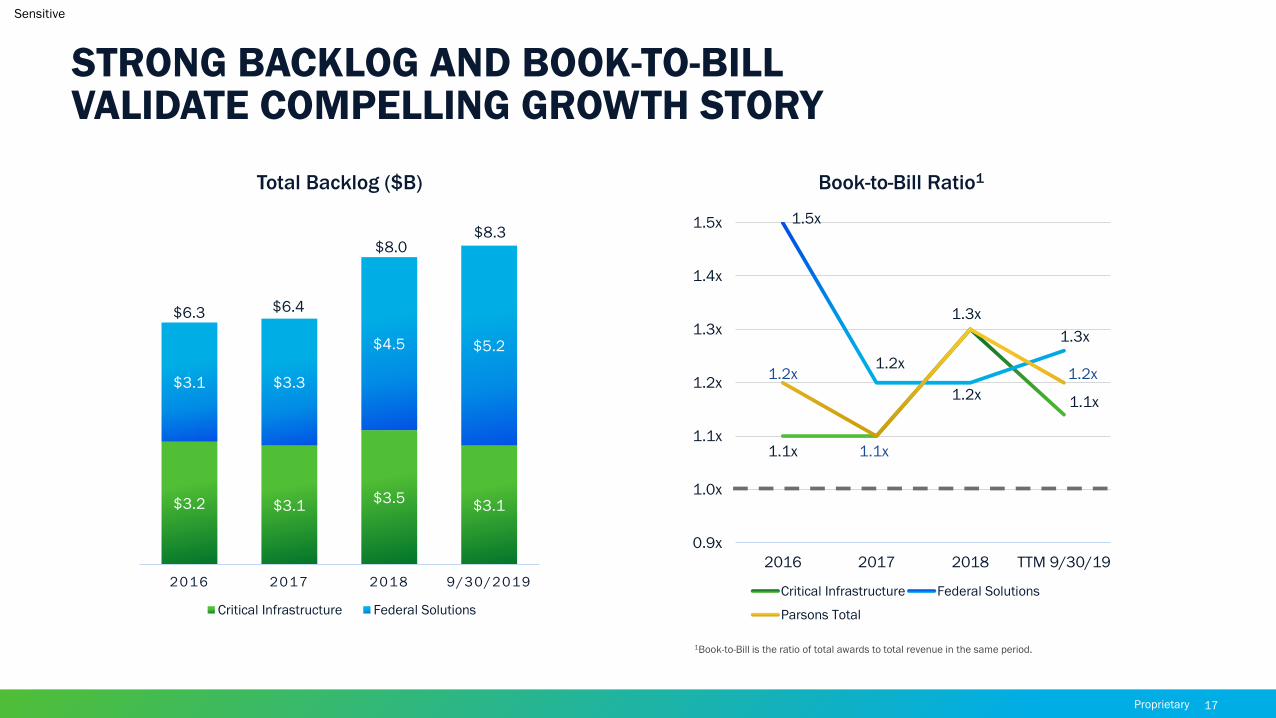
STRONG BACKLOG AND BOOK-TO-BILL VALIDATE COMPELLING GROWTH STORY
Proprietary 17
Total Backlog ($B)
1Book-to-Bill is the ratio of total awards to total revenue in the same period.
$3.2 $3.1$3.5
$3.1
$3.1 $3.3
$4.5 $5.2
2016 2017 2018 9/30/2019
Critical Infrastructure Federal Solutions
$6.3 $6.4
$8.0$8.3
Book-to-Bill Ratio1
1.1x
1.3x
1.1x
1.5x
1.2x
1.2x
1.3x
1.2x
1.1x
1.2x
0.9x
1.0x
1.1x
1.2x
1.3x
1.4x
1.5x
2016 2017 2018 TTM 9/30/19
Critical Infrastructure Federal Solutions
Parsons Total
Sensitive
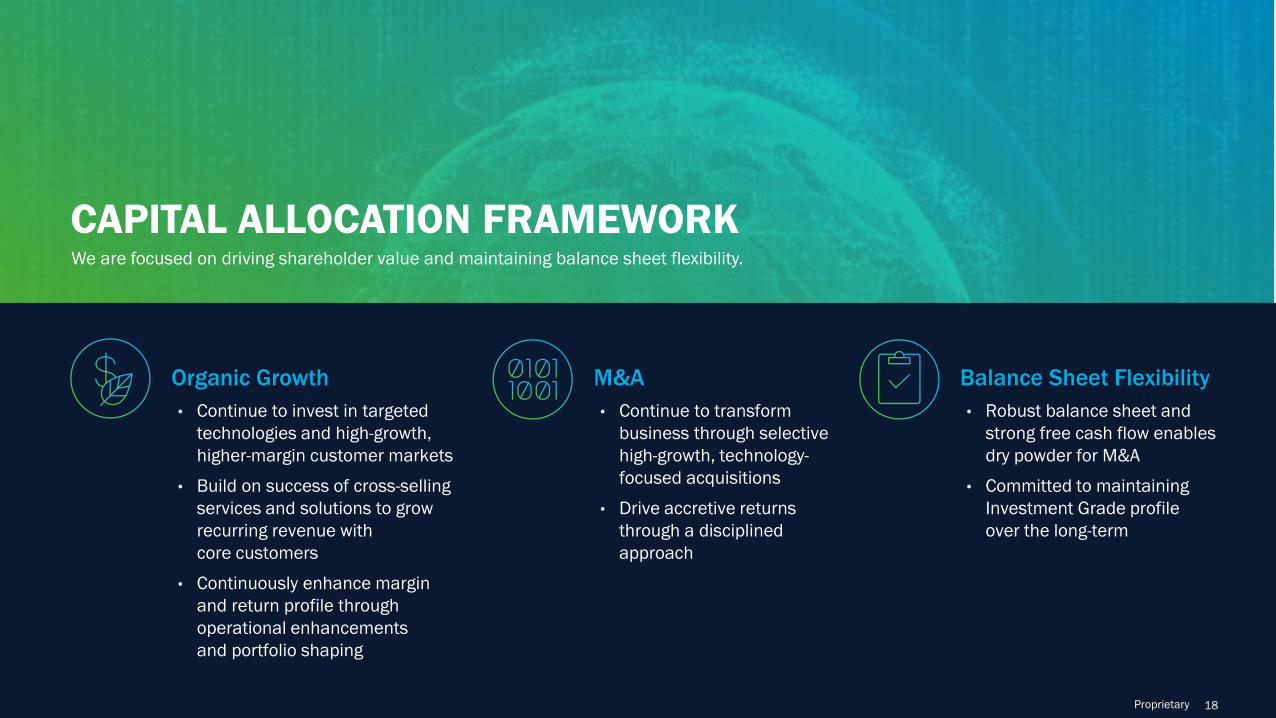
CAPITAL ALLOCATION FRAMEWORK
M&A
• Continue to transform
business through selective
high-growth, technology-
focused acquisitions
• Drive accretive returns
through a disciplined
approach
Organic Growth
• Continue to invest in targeted
technologies and high-growth,
higher-margin customer markets
• Build on success of cross-selling
services and solutions to grow
recurring revenue with
core customers
• Continuously enhance margin
and return profile through
operational enhancements
and portfolio shaping
Balance Sheet Flexibility
• Robust balance sheet and
strong free cash flow enables
dry powder for M&A
• Committed to maintaining
Investment Grade profile
over the long-term
Proprietary 18
We are focused on driving shareholder value and maintaining balance sheet flexibility.

Sensitive
APPENDIX: SUPPLEMENTAL MATERIALS
Proprietary 19
Sensitive
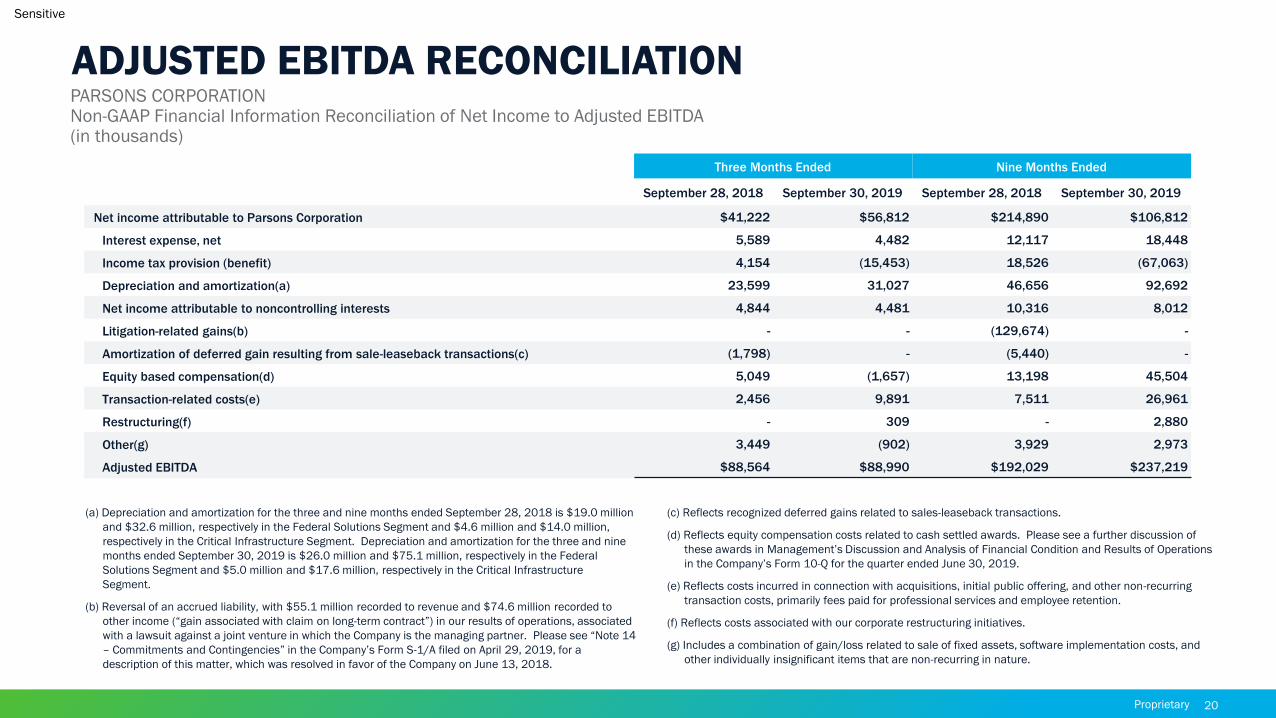
ADJUSTED EBITDA RECONCILIATION
Proprietary 20
Three Months Ended Nine Months Ended
September 28, 2018 September 30, 2019 September 28, 2018 September 30, 2019
Net income attributable to Parsons Corporation $41,222 $56,812 $214,890 $106,812
Interest expense, net 5,589 4,482 12,117 18,448
Income tax provision (benefit) 4,154 (15,453) 18,526 (67,063)
Depreciation and amortization(a) 23,599 31,027 46,656 92,692
Net income attributable to noncontrolling interests 4,844 4,481 10,316 8,012
Litigation-related gains(b) - - (129,674) -
Amortization of deferred gain resulting from sale-leaseback transactions(c) (1,798) - (5,440) -
Equity based compensation(d) 5,049 (1,657) 13,198 45,504
Transaction-related costs(e) 2,456 9,891 7,511 26,961
Restructuring(f) - 309 - 2,880
Other(g) 3,449 (902) 3,929 2,973
Adjusted EBITDA $88,564 $88,990 $192,029 $237,219
(a) Depreciation and amortization for the three and nine months ended September 28, 2018 is $19.0 million
and $32.6 million, respectively in the Federal Solutions Segment and $4.6 million and $14.0 million,
respectively in the Critical Infrastructure Segment. Depreciation and amortization for the three and nine
months ended September 30, 2019 is $26.0 million and $75.1 million, respectively in the Federal
Solutions Segment and $5.0 million and $17.6 million, respectively in the Critical Infrastructure
Segment.
(b) Reversal of an accrued liability, with $55.1 million recorded to revenue and $74.6 million recorded to
other income (“gain associated with claim on long-term contract”) in our results of operations, associated
with a lawsuit against a joint venture in which the Company is the managing partner. Please see “Note 14
– Commitments and Contingencies” in the Company’s Form S-1/A filed on April 29, 2019, for a
description of this matter, which was resolved in favor of the Company on June 13, 2018.
(c) Reflects recognized deferred gains related to sales-leaseback transactions.
(d) Reflects equity compensation costs related to cash settled awards. Please see a further discussion of
these awards in Management’s Discussion and Analysis of Financial Condition and Results of Operations
in the Company’s Form 10-Q for the quarter ended June 30, 2019.
(e) Reflects costs incurred in connection with acquisitions, initial public offering, and other non-recurring
transaction costs, primarily fees paid for professional services and employee retention.
(f) Reflects costs associated with our corporate restructuring initiatives.
(g) Includes a combination of gain/loss related to sale of fixed assets, software implementation costs, and
other individually insignificant items that are non-recurring in nature.
PARSONS CORPORATIONNon-GAAP Financial Information Reconciliation of Net Income to Adjusted EBITDA(in thousands)
Sensitive
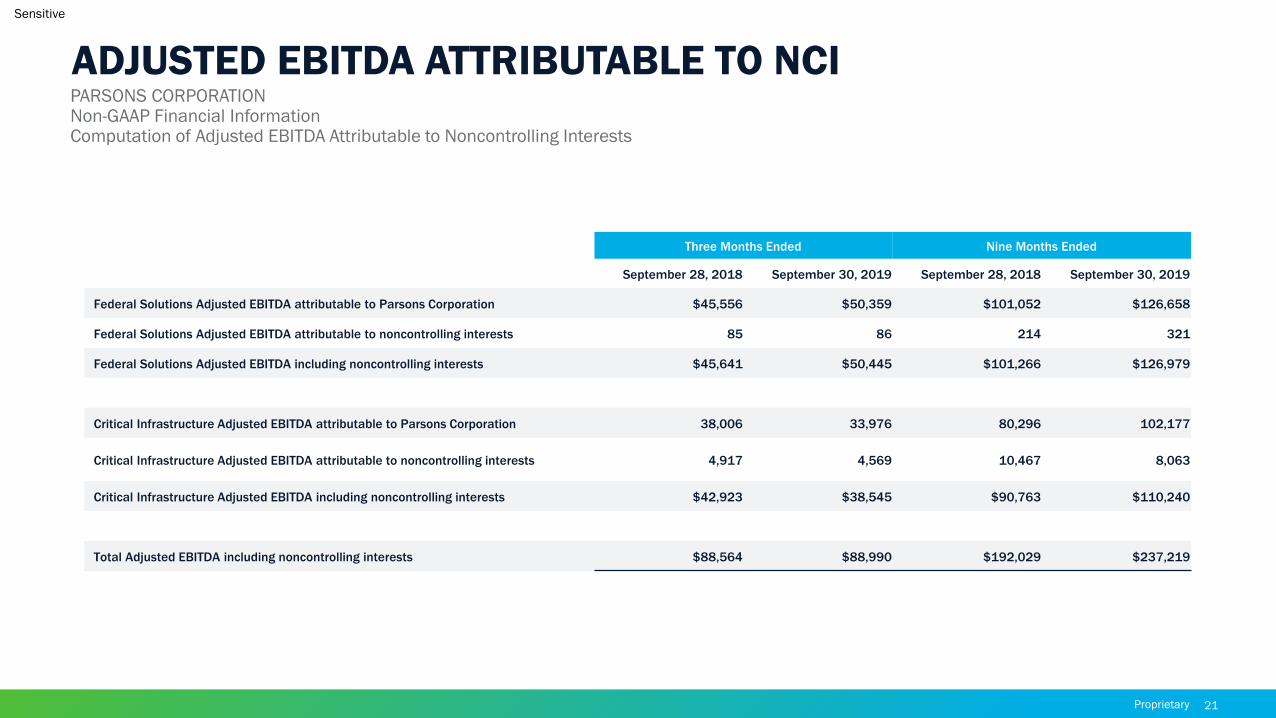
ADJUSTED EBITDA ATTRIBUTABLE TO NCI
Proprietary 21
PARSONS CORPORATIONNon-GAAP Financial InformationComputation of Adjusted EBITDA Attributable to Noncontrolling Interests
Three Months Ended Nine Months Ended
September 28, 2018 September 30, 2019 September 28, 2018 September 30, 2019
Federal Solutions Adjusted EBITDA attributable to Parsons Corporation $45,556 $50,359 $101,052 $126,658
Federal Solutions Adjusted EBITDA attributable to noncontrolling interests 85 86 214 321
Federal Solutions Adjusted EBITDA including noncontrolling interests $45,641 $50,445 $101,266 $126,979
Critical Infrastructure Adjusted EBITDA attributable to Parsons Corporation 38,006 33,976 80,296 102,177
Critical Infrastructure Adjusted EBITDA attributable to noncontrolling interests 4,917 4,569 10,467 8,063
Critical Infrastructure Adjusted EBITDA including noncontrolling interests $42,923 $38,545 $90,763 $110,240
Total Adjusted EBITDA including noncontrolling interests $88,564 $88,990 $192,029 $237,219
Sensitive
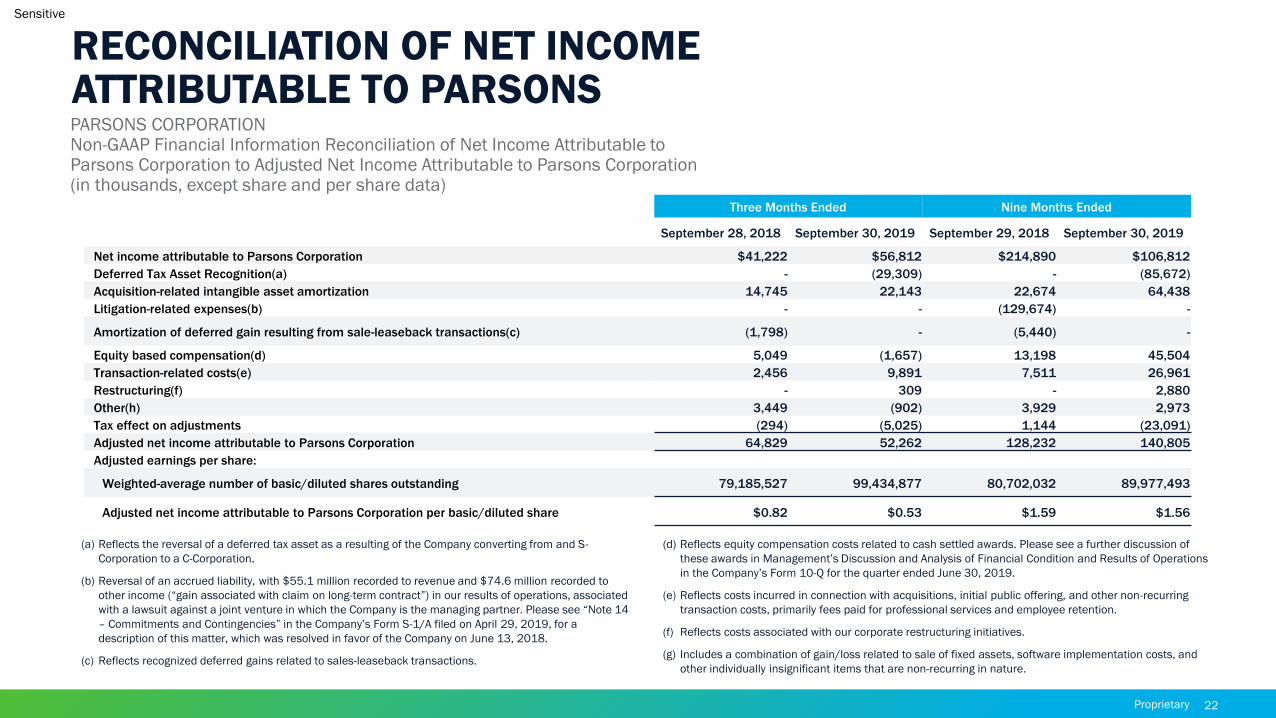
RECONCILIATION OF NET INCOME ATTRIBUTABLE TO PARSONS
Proprietary 22
(a) Reflects the reversal of a deferred tax asset as a resulting of the Company converting from and S-
Corporation to a C-Corporation.
(b) Reversal of an accrued liability, with $55.1 million recorded to revenue and $74.6 million recorded to
other income (“gain associated with claim on long-term contract”) in our results of operations, associated
with a lawsuit against a joint venture in which the Company is the managing partner. Please see “Note 14
– Commitments and Contingencies” in the Company’s Form S-1/A filed on April 29, 2019, for a
description of this matter, which was resolved in favor of the Company on June 13, 2018.
(c) Reflects recognized deferred gains related to sales-leaseback transactions.
(d) Reflects equity compensation costs related to cash settled awards. Please see a further discussion of
these awards in Management’s Discussion and Analysis of Financial Condition and Results of Operations
in the Company’s Form 10-Q for the quarter ended June 30, 2019.
(e) Reflects costs incurred in connection with acquisitions, initial public offering, and other non-recurring
transaction costs, primarily fees paid for professional services and employee retention.
(f) Reflects costs associated with our corporate restructuring initiatives.
(g) Includes a combination of gain/loss related to sale of fixed assets, software implementation costs, and
other individually insignificant items that are non-recurring in nature.
PARSONS CORPORATIONNon-GAAP Financial Information Reconciliation of Net Income Attributable to Parsons Corporation to Adjusted Net Income Attributable to Parsons Corporation(in thousands, except share and per share data)
Three Months Ended Nine Months Ended
September 28, 2018 September 30, 2019 September 29, 2018 September 30, 2019
Net income attributable to Parsons Corporation $41,222 $56,812 $214,890 $106,812
Deferred Tax Asset Recognition(a) - (29,309) - (85,672)
Acquisition-related intangible asset amortization 14,745 22,143 22,674 64,438
Litigation-related expenses(b) - - (129,674) -
Amortization of deferred gain resulting from sale-leaseback transactions(c) (1,798) - (5,440) -
Equity based compensation(d) 5,049 (1,657) 13,198 45,504
Transaction-related costs(e) 2,456 9,891 7,511 26,961
Restructuring(f) - 309 - 2,880
Other(h) 3,449 (902) 3,929 2,973
Tax effect on adjustments (294) (5,025) 1,144 (23,091)
Adjusted net income attributable to Parsons Corporation 64,829 52,262 128,232 140,805
Adjusted earnings per share:
Weighted-average number of basic/diluted shares outstanding 79,185,527 99,434,877 80,702,032 89,977,493
Adjusted net income attributable to Parsons Corporation per basic/diluted share $0.82 $0.53 $1.59 $1.56