Embed Size (px)
Citation preview

aT RLI, we’Re DIFFeReNT.
and that’s good for you. RLI CoRP. 2007 SuMMaRy aNNuaL RePoRT
Table of conTenTs
PReSIDeNT’S LeTTeR 02
FINaNCIaL HIgHLIgHTS 04
RLI aT a gLaNCe 08
we’Re DIFFeReNT. aND THaT’S gooD FoR you. 10
we have the best underwriters in the industry. 12
we have a specialty focus. 14
we are profitable year after year. 16
we give our people freedom to succeed. 18
we give back to our employees and communities. 20
we put our customers first and serve them well. 22
we’Re DIFFeReNT. aND you CaN CouNT oN IT. 24
FINaNCIaLS 26
Review of operations 28
Financial information 38
Selected financial data 44
glossary 48
Investor information 49
CoMPaNy LeaDeRS 50
abouT THe ILLuSTRaTIoN 52

“ Two roads diverged in a wood and I,
I took the one less traveled by, and
that has made all the difference.”
so said Robert frost in 1920 and so
believes RlI. We have built an insurance
company that is different — more
entrepreneurial and, not coincidentally,
more successful than most.
aT RLI, we’Re DIFFeReNT.
and that’s good for you.
Jonathan e. Michael, PReSIDeNT & Ceo
3
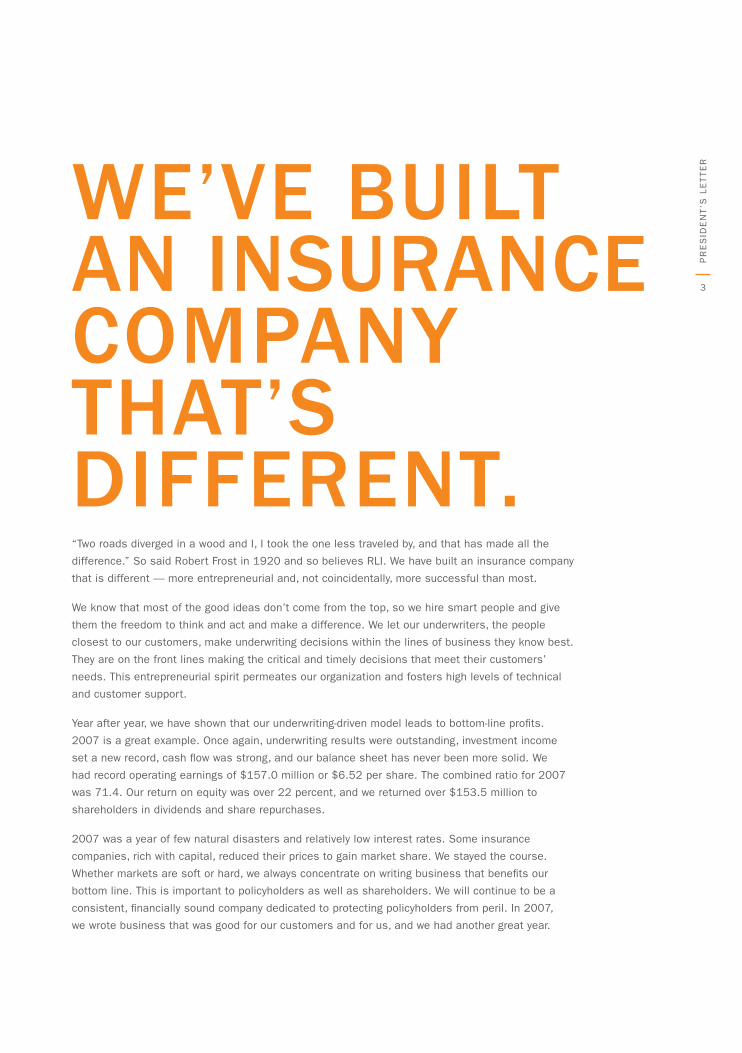
“Two roads diverged in a wood and I, I took the one less traveled by, and that has made all the
difference.” So said Robert Frost in 1920 and so believes RLI. we have built an insurance company
that is different — more entrepreneurial and, not coincidentally, more successful than most.
we know that most of the good ideas don’t come from the top, so we hire smart people and give
them the freedom to think and act and make a difference. we let our underwriters, the people
closest to our customers, make underwriting decisions within the lines of business they know best.
They are on the front lines making the critical and timely decisions that meet their customers’
needs. This entrepreneurial spirit permeates our organization and fosters high levels of technical
and customer support.
year after year, we have shown that our underwriting-driven model leads to bottom-line profits.
2007 is a great example. once again, underwriting results were outstanding, investment income
set a new record, cash flow was strong, and our balance sheet has never been more solid. we
had record operating earnings of $157.0 million or $6.52 per share. The combined ratio for 2007
was 71.4. our return on equity was over 22 percent, and we returned over $153.5 million to
shareholders in dividends and share repurchases.
2007 was a year of few natural disasters and relatively low interest rates. Some insurance
companies, rich with capital, reduced their prices to gain market share. we stayed the course.
whether markets are soft or hard, we always concentrate on writing business that benefits our
bottom line. This is important to policyholders as well as shareholders. we will continue to be a
consistent, financially sound company dedicated to protecting policyholders from peril. In 2007,
we wrote business that was good for our customers and for us, and we had another great year.
PR
eS
IDe
NT
’S L
eT
Te
R
We’ve buIlT an InsuRance company ThaT’s dIffeRenT.
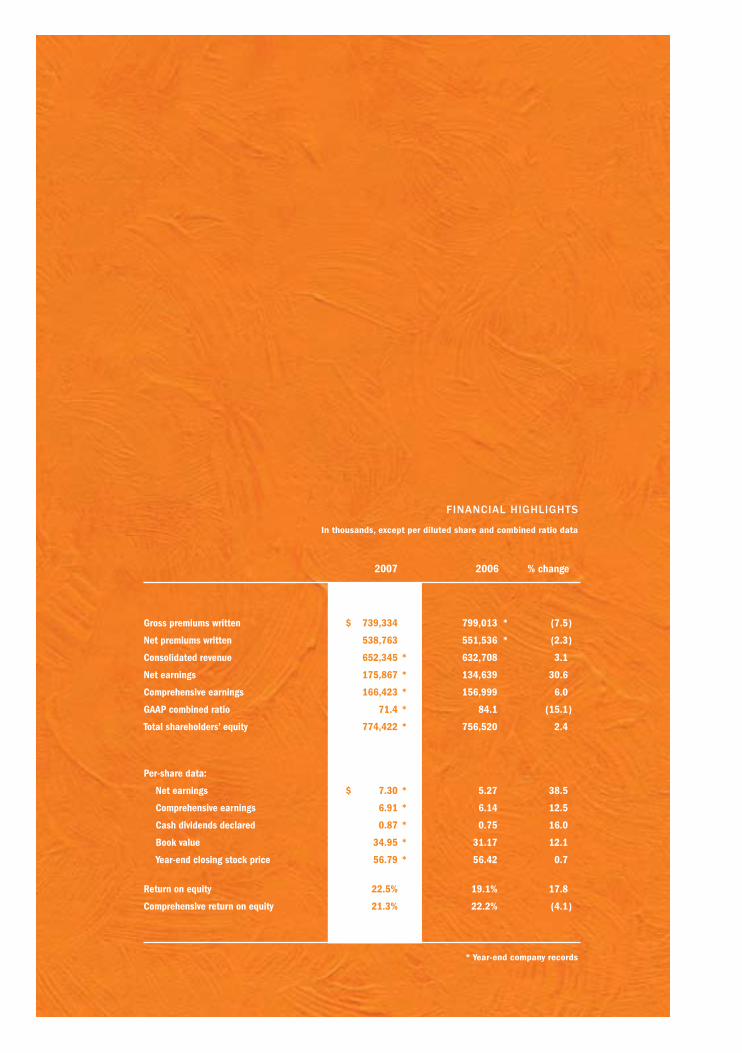
fInancIal hIghlIghTs
In thousands, except per diluted share and combined ratio data
* Year-end company records
2007 2006 % change
Gross premiums written $ 739,334 799,013 * (7.5 )
Net premiums written 538,763 551,536 * (2.3 )
Consolidated revenue 652,345 * 632,708 3.1
Net earnings 175,867 * 134,639 30.6
Comprehensive earnings 166,423 * 156,999 6.0
GAAP combined ratio 71.4 * 84.1 (15.1 )
Total shareholders’ equity 774,422 * 756,520 2.4
Per-share data:
Net earnings $ 7.30 * 5.27 38.5
Comprehensive earnings 6.91 * 6.14 12.5
Cash dividends declared 0.87 * 0.75 16.0
Book value 34.95 * 31.17 12.1
Year-end closing stock price 56.79 * 56.42 0.7
Return on equity 22.5% 19.1% 17.8
Comprehensive return on equity 21.3% 22.2% (4.1 )
5
underwriting results
whereas some insurance companies rely on investment income to support a “quantity over quality”
underwriting philosophy, we focus on underwriting for profit. Money earned in our underwriting
operations drives our success and enables us to sustain our performance in differing market cycles.
when an underwriting opportunity makes good business sense, we write the business. when the
return is not justified by the risk, we walk away. 2007 was the 12th consecutive year of underwriting
income for RLI and the 27th time we have produced underwriting profit in the last 31 years.
as evidence of our underwriters’ ability, the quality of business we wrote the last few years was
better than anticipated, resulting in favorable development in prior years’ loss reserves.
Investment results
Investment income grew 11 percent in spite of a relatively low interest rate environment and our
having returned more than $153.5 million to shareholders in the form of share repurchases and
dividends. our high-quality investment portfolio protects policyholders and provides long-term
growth in value. we have very little exposure to subprime investments. Shareholders’ equity of
$774 million is supported by $1.8 billion in invested assets.
balance sheet strength
while our priority is to deploy capital effectively, we recognize the fact that shareholders have
placed trust in our ability to manage that capital. when we cannot find suitable opportunities and
have excess capital, we will return it to our shareholders. Such was the case this year. we returned
$133.3 million by repurchasing 2.3 million shares.
our balance sheet remains strong as demonstrated by our a+ (Superior) rating from a.M. best,
a distinction held by fewer than 10 percent of all property and casualty insurance companies in
the country. we are well positioned to enhance shareholder value even as we pursue opportunities.
Rest assured, we will adhere to our principle of underwriting for profit in all of our growth initiatives
— through new products and existing products.
Smart, empowered employees
Taking the road less traveled means we’re not afraid of being different. we are not the typical
insurance company. and even within the specialty property and casualty industry there is no replica
of RLI. our business model, based on having smart, empowered employees, makes us different.
Very successfully different, I might add. I am excited about the look and message of our new
advertising campaign, “Different works,” because it makes business leaders, underwriters, and
potential employees more aware of RLI than ever before. and, the great response we are getting
from it can only help fuel our growth.
another difference is that our long-ingrained culture of ownership gives employees a piece of the
pie. our employee Stock ownership Plan causes people to think and act responsibly. They watch
expenses and continually seek process improvements as if RLI were their own company, because
it is. we all share the responsibility of making this a place that works better as well as making it
a better place to work.
PR
eS
IDe
NT
’S L
eT
Te
R
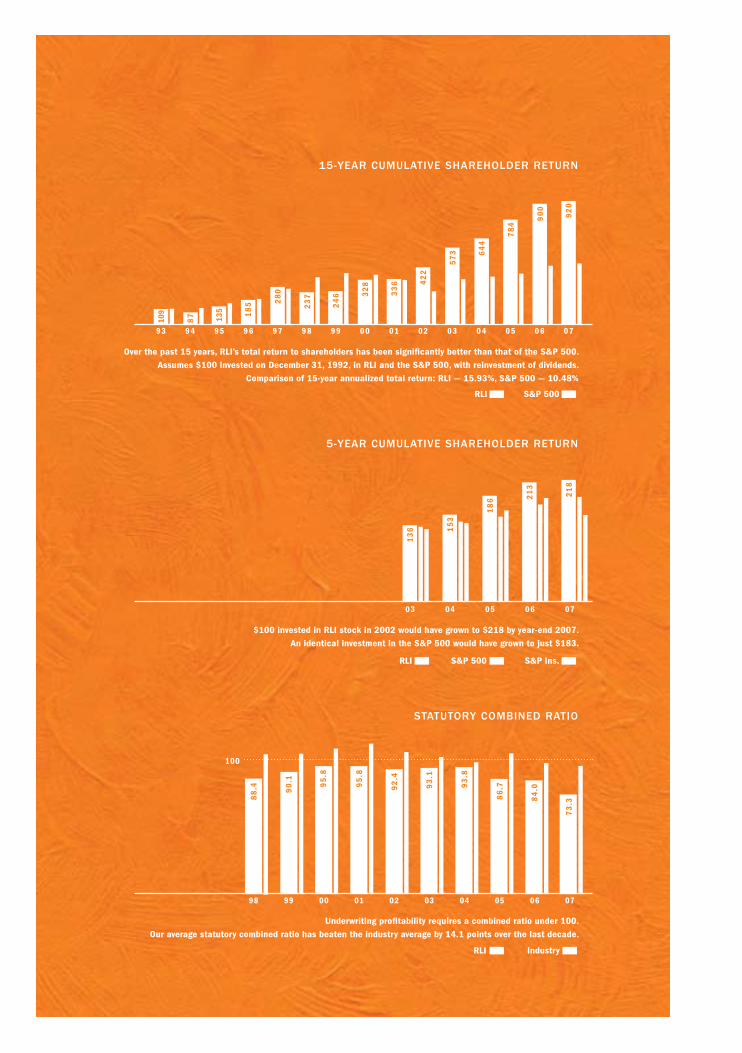
15-yeaR cumulaTIve shaReholdeR ReTuRn
5-yeaR cumulaTIve shaReholdeR ReTuRn
sTaTuToRy combIned RaTIo
93 94 95 96 97 98 99 00 01 02 03 04 05 06 07
98 99 00 01 02 03 04 05 06 07
03 04 05 06 07
Over the past 15 years, RLI’s total return to shareholders has been significantly better than that of the S&P 500. Assumes $100 invested on December 31, 1992, in RLI and the S&P 500, with reinvestment of dividends.
Comparison of 15-year annualized total return: RLI — 15.93%, S&P 500 — 10.48%
$100 invested in RLI stock in 2002 would have grown to $218 by year-end 2007. An identical investment in the S&P 500 would have grown to just $183.
Underwriting profitability requires a combined ratio under 100. Our average statutory combined ratio has beaten the industry average by 14.1 points over the last decade.
100
RLI S&P 500
RLI
RLI
S&P 500
Industry
S&P Ins.
88
.4 90
.1 95
.8
109
87 13
5 18
5 28
0
23
7
24
6 32
8
33
6 42
2
57
3 64
4
78
4
90
0
92
02
18
21
3
18
6
15
3
13
6
95
.8
92
.4
93
.1
93
.8
86
.7
84
.0
73
.3
7
PR
eS
IDe
NT
’S L
eT
Te
RLooking ahead
I believe that this is an unprecedented time in the insurance industry and for RLI. our balance
sheet is stronger than ever. Information technology has advanced to the point where we receive
real-time data that enhances our underwriting decisions and enables us to effectively manage our
portfolio of products.
2008 will continue to be a challenging rate environment for us. The industry’s capital position has
grown 71 percent over the past five years versus premium growth of 17 percent. Companies will
look for ways to deploy this capital, and when supply exceeds demand, prices will fall. Regardless,
we will continue to be a good steward of our capital. when we need it, we will tap the capital
markets; when we don’t, we will return it.
we have an enviable track record of success in terms of delivering underwriting profit and
shareholder value. I am confident we can sustain this performance, as our shareholders have
come to expect. we will look for opportunities in underserved markets just as we have done in the
past, continuing to be a highly profitable specialty property and casualty insurance company with
a diverse portfolio of profitable products. we are not immune to recessions or slowdowns in the
marketplace, but we are well positioned. we are able to retrench, find opportunity, and take action.
as we navigate through this soft market cycle, I would expect to see further consolidation within
the industry. with capital at record levels and premium growth not keeping pace, the industry
will look for growth via mergers and acquisitions. we have and will continue to look cautiously at
opportunities. For an acquisition to make sense, it must achieve the return shareholders have
come to expect from us.
our growth will most likely come from product expansion, like marine and surety, or by bringing
entrepreneurial people on board with books of business and knowledge of customers that foster
our growth. we have the underwriting talent, information technology capacity, and support functions
to address market needs and write new products.
RLI is different and we are proud of it. we see market challenges as opportunities to create new
solutions. 2007 had its complications and obstacles, as will the year ahead. we are ready. we
maintain our focus on the customer and give our people the freedom to make decisions and make
things happen. we’re different, and that’s good for all of our shareholders.
Jonathan e. Michael
PReSIDeNT & Ceo
FebRuaRy 22, 2008
8
RL
I a
NN
ua
L R
eP
oR
T 2
00
7
ouR company
Who We are
we are a specialty property and casualty
insurer operating nationwide on both an
admitted (regulated) and excess and surplus
lines (less regulated) basis. we combine
profitable underwriting, solid investment
returns, and effective capital management
to deliver consistent, long-term growth in
shareholder value. our officers and employees
are rewarded on metrics that align with our
shareholders’ interests.
Insurance is an industry with nearly $500
billion in direct written premiums. In 2007,
we wrote $793.3 million of coverage, 90
percent commercial lines, 10 percent personal
lines. a.M. best Company rates all three of
our insurance subsidiaries a+ (Superior), a
distinction held by fewer than 10 percent of
all property and casualty insurance companies
in the country.
how We do It
we develop coverages designed to meet
specific needs. These range from highly
automated, self-underwriting products to highly
complex, individually underwritten coverages.
In all cases, we leverage technology to bring
superior service to underserved customers.
our customers are businesses and individuals
throughout the united States.
Insurance coverages are distributed through many
means. wholesale brokers help retail agencies
place complex commercial coverages. other
products are more common, are “value added”
coverages, or are specialized for an industry, and
are delivered through retailers. other coverages
are more suited for general agencies. Page 37
shows how RLI products are distributed.
ouR mIssIon
we provide our customers with outstanding
service through innovative risk management
products and solutions.
we are dedicated to carefully chosen
niche markets.
we attract outstanding talent and continuously
develop our expertise.
we constantly re-evaluate, enhance, and
reinvigorate our business model to create new
products, services, and delivery systems.
we create long-term shareholder value by
pursuing profitable growth, underwriting for a
profit, and earning returns that significantly
exceed our cost of capital.
ouR vIsIon
as the leading provider of specialized insurance
and financial services, RLI is focused on
building and managing a portfolio of innovative
products and solutions that meet and surpass
the expectations of shareholders.
ouR values
we are talented.
we are innovative.
we are customer focused.
we are driven.
we are people of integrity.
we are respectful.
we are owners.
RlI aT a glance
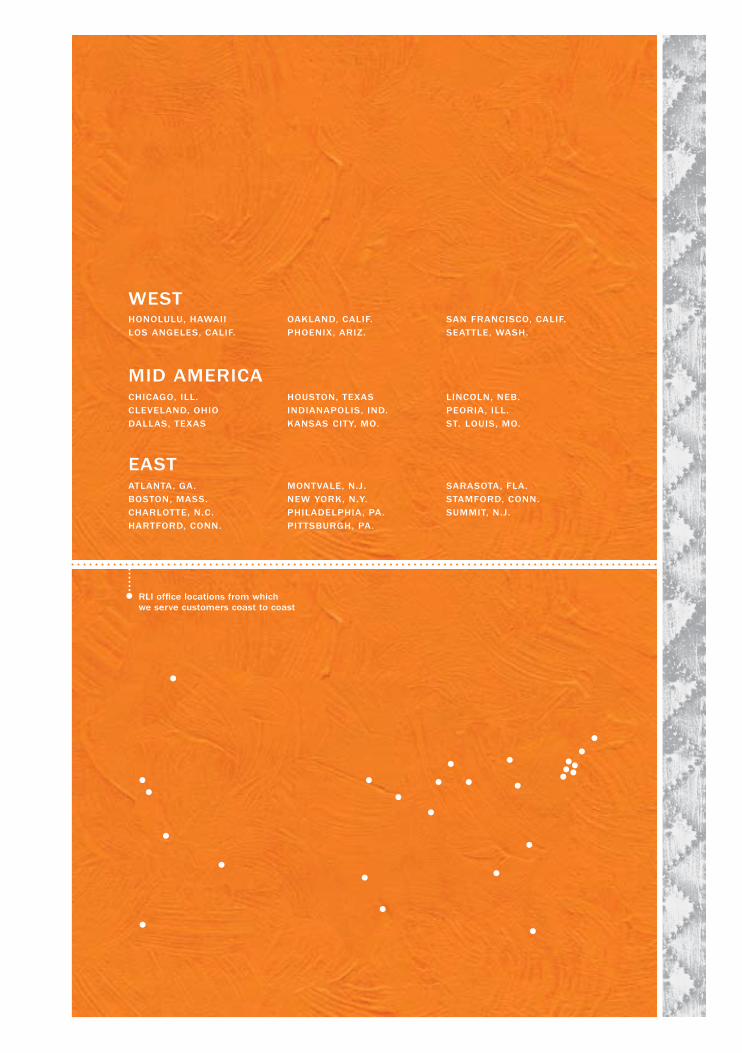
WesT
mId ameRIca
easT
honolulu, haWaII
los angeles, calIf.
oakland, calIf.
phoenIx, aRIz.
san fRancIsco, calIf.
seaTTle, Wash.
chIcago, Ill.
cleveland, ohIo
dallas, Texas
housTon, Texas
IndIanapolIs, Ind.
kansas cITy, mo.
lIncoln, neb.
peoRIa, Ill.
sT. louIs, mo.
aTlanTa, ga.
bosTon, mass.
chaRloTTe, n.c.
haRTfoRd, conn.
monTvale, n.j.
neW yoRk, n.y.
phIladelphIa, pa.
pITTsbuRgh, pa.
saRasoTa, fla.
sTamfoRd, conn.
summIT, n.j.
RlI office locations from which we serve customers coast to coast


aT RLI, we’Re DIFFeReNT. aND THaT’S gooD FoR you. we HaVe THe beST uNDeRwRITeRS IN THe INDuSTRy. we HaVe a SPeCIaLTy FoCuS. we aRe PRoFITabLe
yeaR aFTeR yeaR. we gIVe ouR PeoPLe FReeDoM To SuCCeeD. we gIVe baCk To ouR eMPLoyeeS aND
CoMMuNITIeS. we PuT ouR CuSToMeRS FIRST aND SeRVe THeM weLL.
12
RL
I a
NN
ua
L R
eP
oR
T 2
00
7
The specialty insurance industry is a competitive environment. and in soft markets like the one we faced in 2007, it becomes even more competitive.
Flush with capital, many insurance companies
drop prices in an attempt to gain market
share. The spiral continues until there is no
more room to cut prices. when the next hard
market suddenly hits — and it will — many
companies will find themselves unable to
keep up.
while RLI is not immune to market trends, our
way of doing business keeps us steady on our
course. we have the most talented underwriters
in the industry on the front line, with the power
to make the tough decisions — whether that’s
taking on risk, or turning it down.
our underwriters aren’t rewarded for selling
policies; they’re rewarded for doing what’s
best for our customers, our company, and our
shareholders. whenever possible, they use their
deep industry knowledge and niche expertise to
come up with creative solutions to meet their
customers’ needs. at the same time, they make
sure those solutions adhere to our company’s
focus on profitable underwriting.
In soft markets like this one, we focus on the
opportunities to come with the next market
turn. our underwriters help us identify and
develop new coverage areas and new products,
so we’re prepared to grow when the time is
right. and we’re always seeking out proven
underwriting talent to grow our existing products
or expand our product portfolio.
our remarkable underwriters make RLI stand
out among the competition. They helped make
2007 one of our best years ever.
we’Re DIFFeReNT.
We have The besT
undeRWRITeRs In The
IndusTRy

aND THaT’S gooD FoR you.
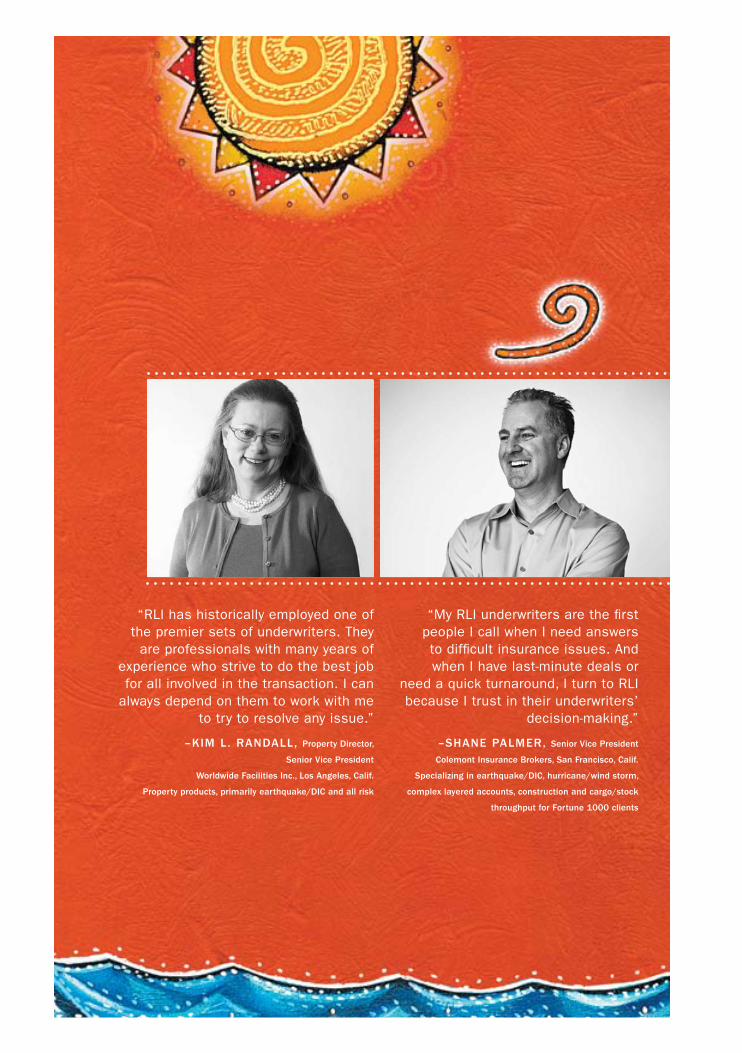
“RLI has historically employed one of the premier sets of underwriters. They
are professionals with many years of experience who strive to do the best job for all involved in the transaction. I can
always depend on them to work with me to try to resolve any issue.”
–kIm l. Randall, property director,
senior vice president
Worldwide facilities Inc., los angeles, calif.
property products, primarily earthquake/dIc and all risk
“My RLI underwriters are the first people I call when I need answers to difficult insurance issues. and when I have last-minute deals or
need a quick turnaround, I turn to RLI because I trust in their underwriters’
decision-making.”
–shane palmeR, senior vice president
colemont Insurance brokers, san francisco, calif.
specializing in earthquake/dIc, hurricane/wind storm,
complex layered accounts, construction and cargo/stock
throughput for fortune 1000 clients
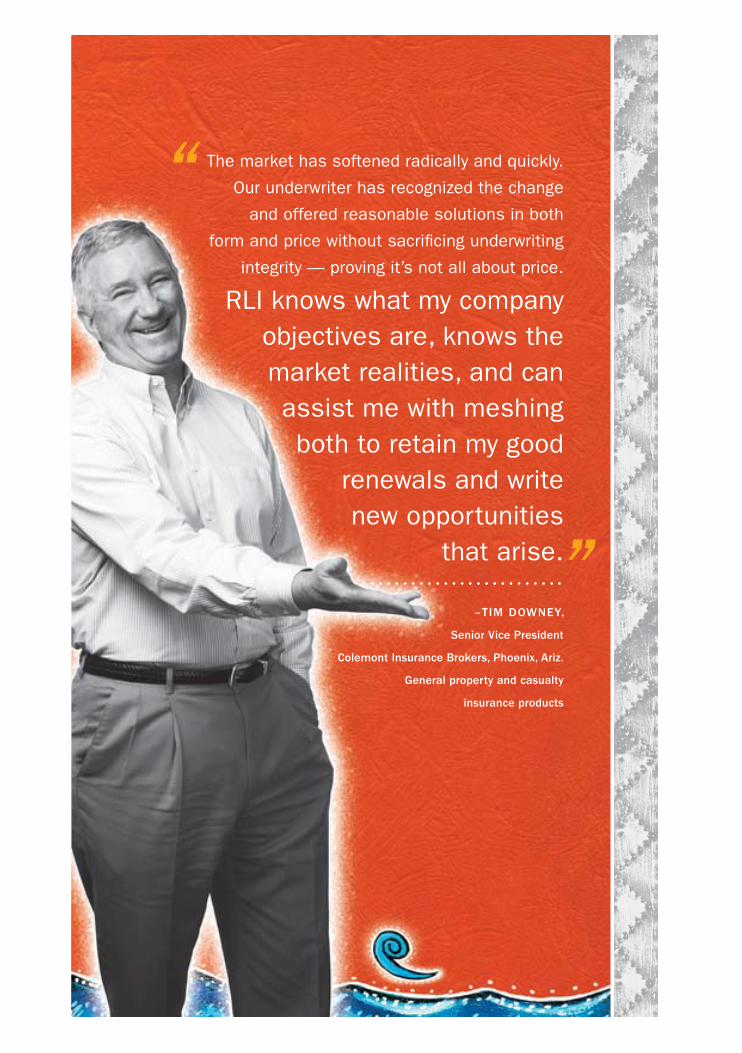
The market has softened radically and quickly.
our underwriter has recognized the change
and offered reasonable solutions in both
form and price without sacrificing underwriting
integrity — proving it’s not all about price.
RLI knows what my company objectives are, knows the market realities, and can assist me with meshing both to retain my good
renewals and write new opportunities
that arise.
–TIm doWney,
senior vice president
colemont Insurance brokers, phoenix, ariz.
general property and casualty
insurance products
“
”
14
RL
I a
NN
ua
L R
eP
oR
T 2
00
7
when you think of typical insurance companies, RLI may not come to mind. That doesn’t surprise us, because we’re not like anyone else. we’re a specialty
insurance company, serving niche markets that
most standard insurance companies don’t have
the resources — or the expertise — to handle.
our diversified portfolio of property and casualty
insurance and surety bonds allows us to offer
nearly 40 different types of coverage. each
of our coverages addresses a niche, and
each product group is under the leadership
of underwriting experts who have years of
experience in their particular line. If an existing
product doesn’t exactly meet a customer’s
needs, they have the talent — and the authority
— to customize coverage to address those
challenges.
when you look at RLI next year, you may not see
the exact same company you see today. we’ll
keep offering products that make sense for our
company and our customers; we’ll discontinue
the ones that don’t. we count on our talented
underwriters to grow their existing product lines
and help us expand our portfolio. we’re always
on the lookout for underserved niches, books
of business, other companies, and innovative
products that will allow us to better meet the
needs of our brokers, agents, and policyholders.
For example, in 2007 we launched RLI
Reinsurance (RLI Re) — a new division based
in Stamford, Conn., under the leadership of
reinsurance veteran kevin brawley. RLI Re will
underwrite property facultative reinsurance.
also in 2007, we added coverages to the
specialty lines we already offer. we’re meeting
the need for small-fleet coverage in RLI
Transportation. RLI Marine added specialty
cargo coverage to its product line, focusing
on products like high-tech goods, capital
equipment, temperature-sensitive products, and
medications. and our Target Market Specialists
group identified a need for coverage for the
sports/leisure market.
at RLI, we don’t follow a cookie cutter approach
to underwriting. we’ve been customizing
products to serve the specialty market for over
40 years.
we’Re DIFFeReNT.
We have a specIalTy
focus

aND THaT’S gooD FoR you.
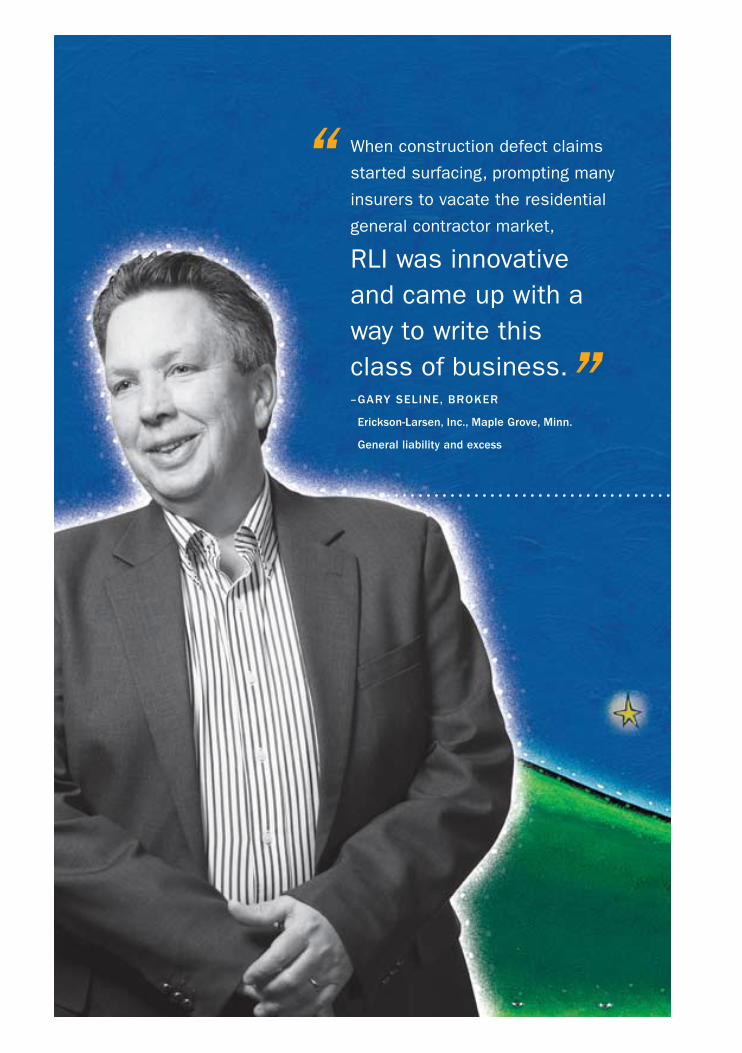
when construction defect claims
started surfacing, prompting many
insurers to vacate the residential
general contractor market,
RLI was innovative and came up with a way to write this class of business.– gaRy selIne, bRokeR
erickson-larsen, Inc., maple grove, minn.
general liability and excess
“
”
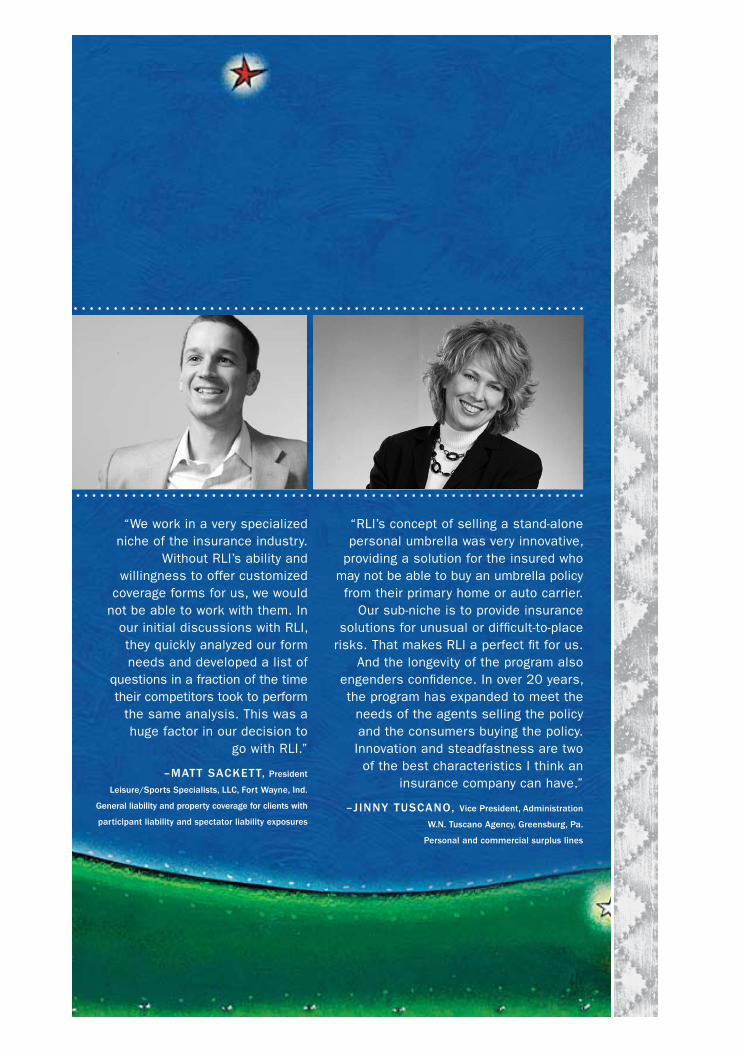
“we work in a very specialized niche of the insurance industry.
without RLI’s ability and willingness to offer customized
coverage forms for us, we would not be able to work with them. In
our initial discussions with RLI, they quickly analyzed our form needs and developed a list of
questions in a fraction of the time their competitors took to perform
the same analysis. This was a huge factor in our decision to
go with RLI.”
–maTT sackeTT, president
leisure/sports specialists, llc, fort Wayne, Ind.
general liability and property coverage for clients with
participant liability and spectator liability exposures
“RLI’s concept of selling a stand-alone personal umbrella was very innovative,
providing a solution for the insured who may not be able to buy an umbrella policy from their primary home or auto carrier.
our sub-niche is to provide insurance solutions for unusual or difficult-to-place
risks. That makes RLI a perfect fit for us. and the longevity of the program also
engenders confidence. In over 20 years, the program has expanded to meet the
needs of the agents selling the policy and the consumers buying the policy. Innovation and steadfastness are two
of the best characteristics I think an insurance company can have.”
–jInny Tuscano, vice president, administration
W.n. Tuscano agency, greensburg, pa.
personal and commercial surplus lines
16
RL
I a
NN
ua
L R
eP
oR
T 2
00
7
There is no question this was a challenging year. we saw competition
intensify and prices come down. our response?
To stick with our principles — maintaining our
pricing discipline and working to produce a
profit despite a loss of market share. overall,
we experienced the best results in our history,
thanks to our relentless pursuit of profitable
underwriting. and while we didn’t achieve
premium growth in 2007, we preserved and
maintained our profitability while positioning
ourselves for the future.
we’ve been a part of this industry for a long
time, so we know that soft markets are only
temporary. In 2007, we focused on setting
ourselves up for a changing marketplace. we
made process improvements and implemented
ways to obtain more efficient data and metrics
to better manage our business.
we used our surplus capital to build support
infrastructure, add talented people across all
of our product lines, and create new product
groups. we worked to implement the support
and resources necessary to attract talented
underwriters and to be ready to bring them on
board when the time is right. and we further
managed the surplus by repurchasing $133.3
million worth of our stock.
2007 also meant a renewed focus on enterprise
risk management — identifying, measuring, and
looking for ways to mitigate risks and maximize
returns. we made significant reductions in
our earthquake portfolio and brought wind
exposures down in Hawaii where the risk-
adjusted returns weren’t justified.
we also developed ongoing monitoring and target
thresholds that help us manage risks and make
RLI a stronger company overall. This helps us
maintain our a+ rating by a.M. best Company.
and most importantly, it keeps RLI financially
strong to meet our customers’ future needs.
we have the potential to perform in the next 20
years as we have in the past 20. our business
model creates a tremendous opportunity for
growth. when the time is right, we’ll be ready.
we’Re DIFFeReNT.
We aRe pRofITable yeaR afTeR
yeaR

aND THaT’S gooD FoR you.
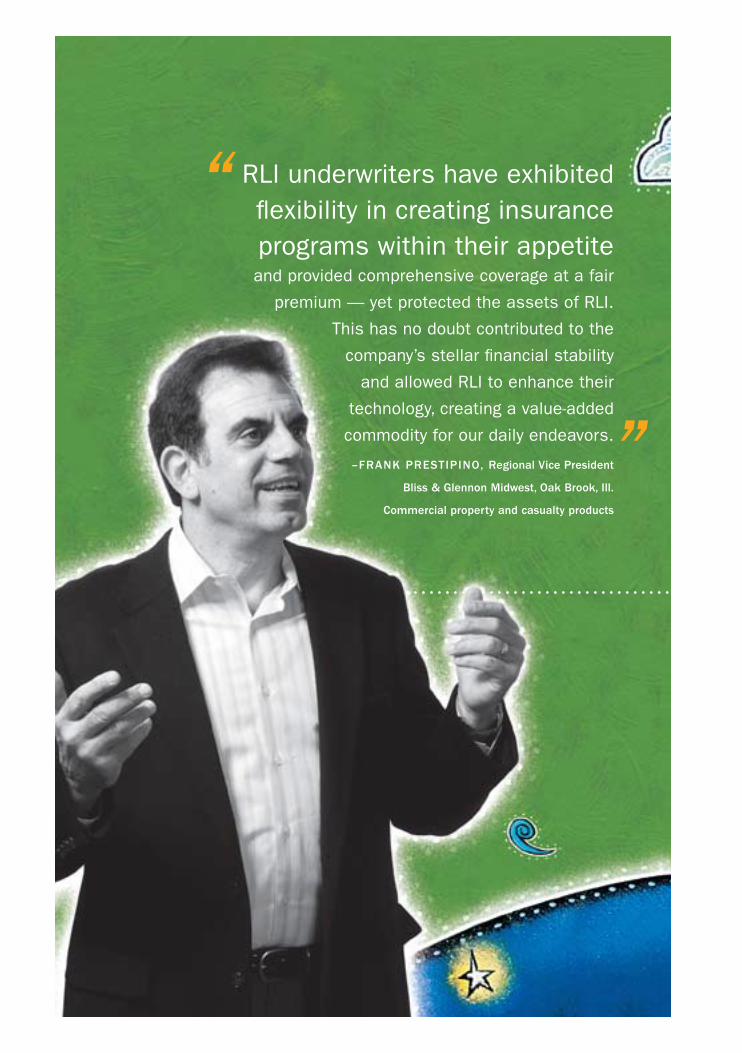
“ RLI underwriters have exhibited flexibility in creating insurance programs within their appetite and provided comprehensive coverage at a fair
premium — yet protected the assets of RLI.
This has no doubt contributed to the
company’s stellar financial stability
and allowed RLI to enhance their
technology, creating a value-added
commodity for our daily endeavors.
–fRank pResTIpIno, Regional vice president
bliss & glennon midwest, oak brook, Ill.
commercial property and casualty products
”

“ RLI is a steady, long-term market, not a fast food, in-and-out market that requires you to replace coverage every couple of years as they change underwriting philosophy.”
– john kRebs, president
W. brown & associates, Irvine, calif.
property and casualty insurance products
“ RLI’s long-term financial strength and ability to withstand several hard hits are two of the main reasons I do business with them with confidence. I know for a fact, based on past experience, that they will be there when I need them at claims time.”
– kIm Randall, property director, senior vice president
Worldwide facilities Inc., los angeles, calif.
property products, primarily earthquake/dIc and all risk
18
RL
I a
NN
ua
L R
eP
oR
T 2
00
7
we have a lot of talented people at RLI. People who are experts at information
technology. underwriters who are the best in the
industry. Claims people who know how to deliver
top-notch service to our customers in their time
of need. and leaders who give these smart
people the freedom to do their jobs.
ask the people who work at RLI and they’ll tell you
how our entrepreneurial culture makes them feel.
empowered. Supported. autonomous. Free. Free to
expand their horizons, get out of their comfort zones,
take risks, make mistakes — and learn from them.
we’ve grown by leaps and bounds over the last
four decades. In 2007, we added new products
like sports/leisure, and a new division called RLI
Reinsurance. Those additions don’t reduce the
impact of the people and products we already have.
everyone influences and contributes to his or her
individual area — and to the company as a whole.
RLI’s product leaders are just that — leaders.
They run their divisions day-to-day. They decide
when it makes sense to grow, and when it
doesn’t. and underwriters are authorized to
make quick decisions without waiting days for
approval from someone at the home office.
These individual groups are supported by
executives who have decades of experience in
this industry and consider it their responsibility
to clear away as many obstacles to performance
as possible. our people benefit from the latest
in technology and expert support from the home
office. Metrics are gathered and data delivered
every day to help underwriters make faster,
better decisions, and to help product leaders
manage their portfolios.
In 2007, we developed a faster way to deliver
catastrophe modeling data — putting more
information and better tools into the hands
of our underwriters. we’re building a solid
foundation of information technology systems
that help us quickly get new products to market
— a true differentiator in the industry.
as our founder gerald Stephens said,
“Traditional management focuses on what is.
Creative management focuses on what can be.”
RLI people are always on the lookout for new
and better solutions.
we’Re DIFFeReNT.
We gIve ouR people fReedom To
succeed

aND THaT’S gooD FoR you.
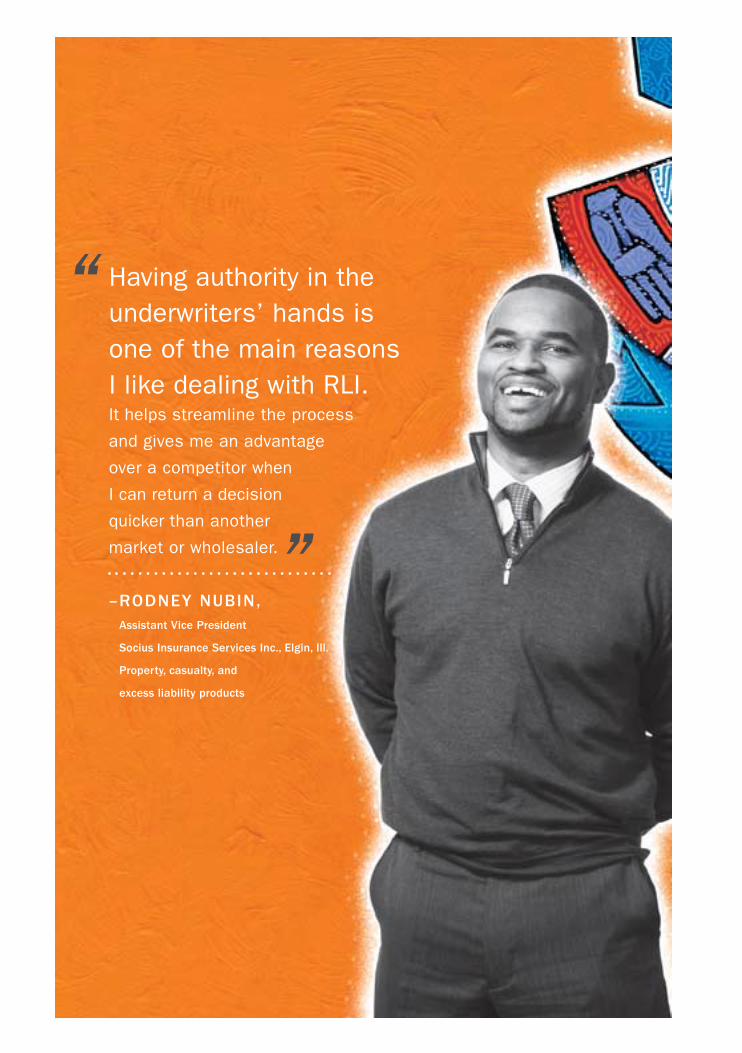
Having authority in the underwriters’ hands is one of the main reasons I like dealing with RLI. It helps streamline the process
and gives me an advantage
over a competitor when
I can return a decision
quicker than another
market or wholesaler.
– Rodney nubIn, assistant vice president
socius Insurance services Inc., elgin, Ill.
property, casualty, and
excess liability products
“
”
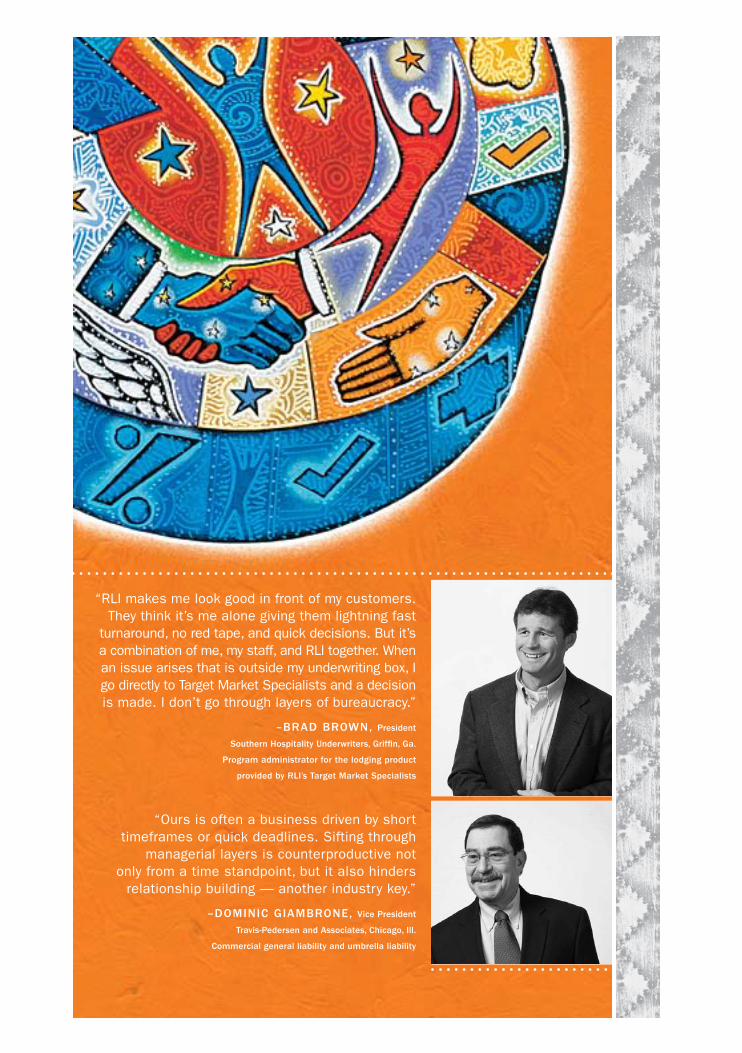
“ours is often a business driven by short timeframes or quick deadlines. Sifting through
managerial layers is counterproductive not only from a time standpoint, but it also hinders
relationship building — another industry key.”
–domInIc gIambRone, vice president
Travis-pedersen and associates, chicago, Ill.
commercial general liability and umbrella liability
“RLI makes me look good in front of my customers. They think it’s me alone giving them lightning fast
turnaround, no red tape, and quick decisions. but it’s a combination of me, my staff, and RLI together. when an issue arises that is outside my underwriting box, I go directly to Target Market Specialists and a decision is made. I don’t go through layers of bureaucracy.”
–bRad bRoWn, president
southern hospitality underwriters, griffin, ga.
program administrator for the lodging product
provided by RlI’s Target market specialists
20
RL
I a
NN
ua
L R
eP
oR
T 2
00
7
RLI is a company founded on the principles of the golden Rule: Do unto others as you would have them do unto you. No matter who you are, we want you to be
rewarded by your relationship with RLI. Customers
can expect top-notch support if they have a claim.
Shareholders can be confident that RLI is a solid
investment. our local communities can count
on our support for charitable causes. and our
employees — from the executive team to those
in the trenches — know that when they succeed,
we reward them financially.
unlike some companies, RLI earnings aren’t
enjoyed only by those who sit in the executive
offices. all employees participate in incentive
plans and earn contributions to their employee
Stock ownership Plan (eSoP) and 401(k). we’ve
been an eSoP company for more than 30 years.
That means every person who works here is an
owner of this company. but the eSoP isn’t a gift;
every dollar our employees earn is a direct result
of their collective success. The more successful,
the better the reward. So far the rewards have
helped our employees achieve financial success
they could never have imagined. In 2007, the
eSoP/401(k) profit-sharing contributions were
15 percent of eligible earnings.
as we share monetarily with our employees,
they in turn share those rewards with the
communities in which they live. RLI employees
and the company as a whole have donated
millions of dollars — and hundreds of hours
of time — to charitable causes throughout
the country. we’ve collected toys and canned
goods, participated in 5ks and sat in dunk
tanks in support of worthy causes. our
matching fund donates dollar to dollar up to
$3,000 per employee for contributions made to
qualified organizations. In 2007 alone, RLI and
our employees contributed nearly $1.5 million
to charitable and community endeavors.
If you invest in RLI, we’ll invest in you. That’s
the golden Rule at work.
we’Re DIFFeReNT.
We gIve back To ouR
employees and communITIes

aND THaT’S gooD FoR you.
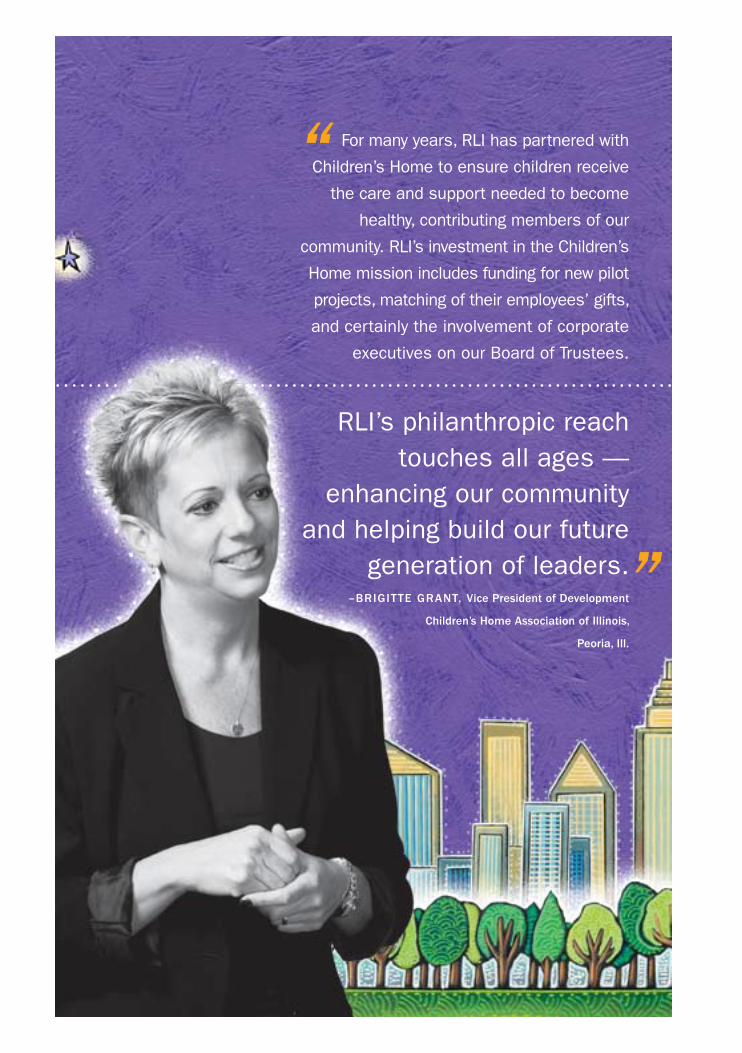
For many years, RLI has partnered with
Children’s Home to ensure children receive
the care and support needed to become
healthy, contributing members of our
community. RLI’s investment in the Children’s
Home mission includes funding for new pilot
projects, matching of their employees’ gifts,
and certainly the involvement of corporate
executives on our board of Trustees.
RLI’s philanthropic reach touches all ages —
enhancing our community and helping build our future
generation of leaders.–bRIgITTe gRanT, vice president of development
children’s home association of Illinois,
peoria, Ill.
“
”
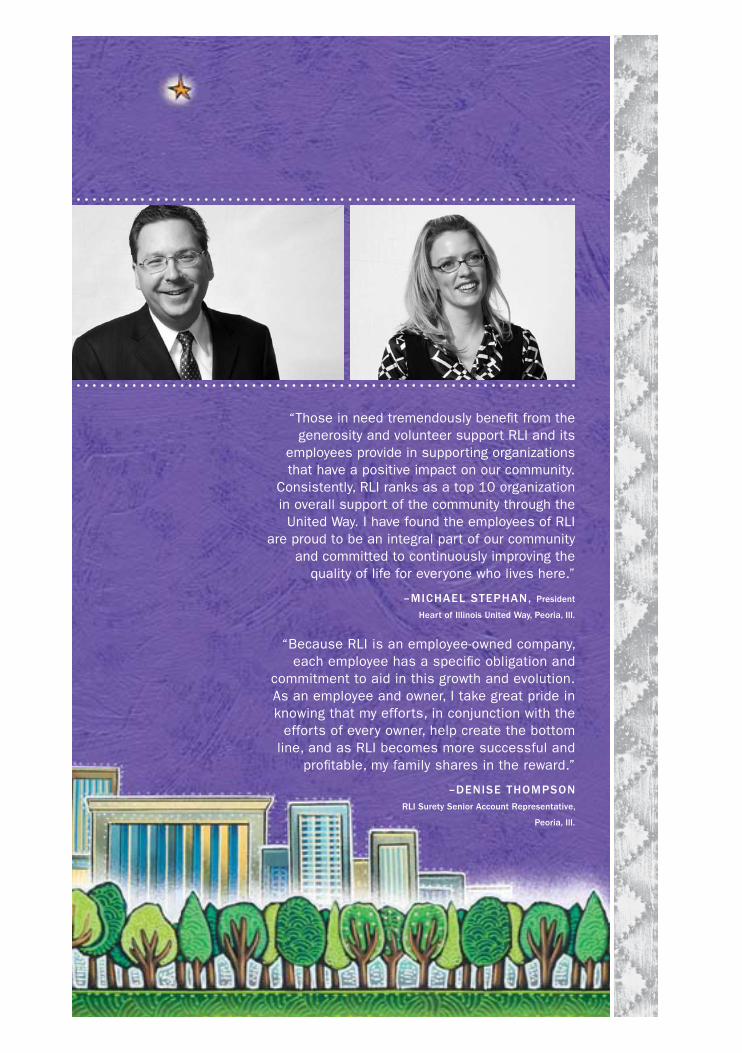
“because RLI is an employee-owned company, each employee has a specific obligation and
commitment to aid in this growth and evolution. as an employee and owner, I take great pride in knowing that my efforts, in conjunction with the
efforts of every owner, help create the bottom line, and as RLI becomes more successful and
profitable, my family shares in the reward.”
–denIse Thompson RlI surety senior account Representative,
peoria, Ill.
“Those in need tremendously benefit from the generosity and volunteer support RLI and its
employees provide in supporting organizations that have a positive impact on our community.
Consistently, RLI ranks as a top 10 organization in overall support of the community through the united way. I have found the employees of RLI
are proud to be an integral part of our community and committed to continuously improving the
quality of life for everyone who lives here.”
–mIchael sTephan, president
heart of Illinois united Way, peoria, Ill.
22
RL
I a
NN
ua
L R
eP
oR
T 2
00
7
RLI is an enormously successful company with decades of profitability, a top-notch portfolio, and hundreds of talented, empowered employees. but without our customers, we cease to exist. everything we do at RLI is focused
on quickly providing the best possible support
to those we serve — whether it’s a broker,
agent, policyholder, investor, or fellow employee.
we consider everyone our customer, and putting
others first is the way we do business.
In 2007, we made a lot of progress toward making
our organization more efficient and improving work
flow so we can provide more timely service. our
information technology experts are second-to-
none. For our internal customers, they’ve built
new data warehousing capabilities that make it
easier to access internal information, so what
once took four to five hours a month now takes
15 minutes. and they’re constantly busy with
new innovations and upgrades to applications
that make it easier to do business with RLI.
Those technology services are a real benefit for
our brokers and agents. They win business and
build relationships when they are able to quickly
make a decision, offer a quote, issue a policy,
or take care of a claim.
we don’t consider customer claims a burden;
rather, they’re an opportunity to keep our
promises and build relationships. our claim
department is staffed with experts who have
the knowledge to move claims along quickly.
we work to understand every situation and
determine the most appropriate adjustment.
our employees who deal directly with
policyholders spend significant effort building
relationships. In soft markets like the one we
are currently experiencing, those relationships
go a long way toward keeping our customers
when the competition drops prices, or bringing
them back when the hard market returns.
everyone at RLI — from our technology experts
to our claims representatives, our receptionists
to our attorneys — has a job for one reason: to
serve the customer. That’s a promise.
we’Re DIFFeReNT.
We puT ouR cusTomeRs
fIRsT and seRve Them Well

aND THaT’S gooD FoR you.
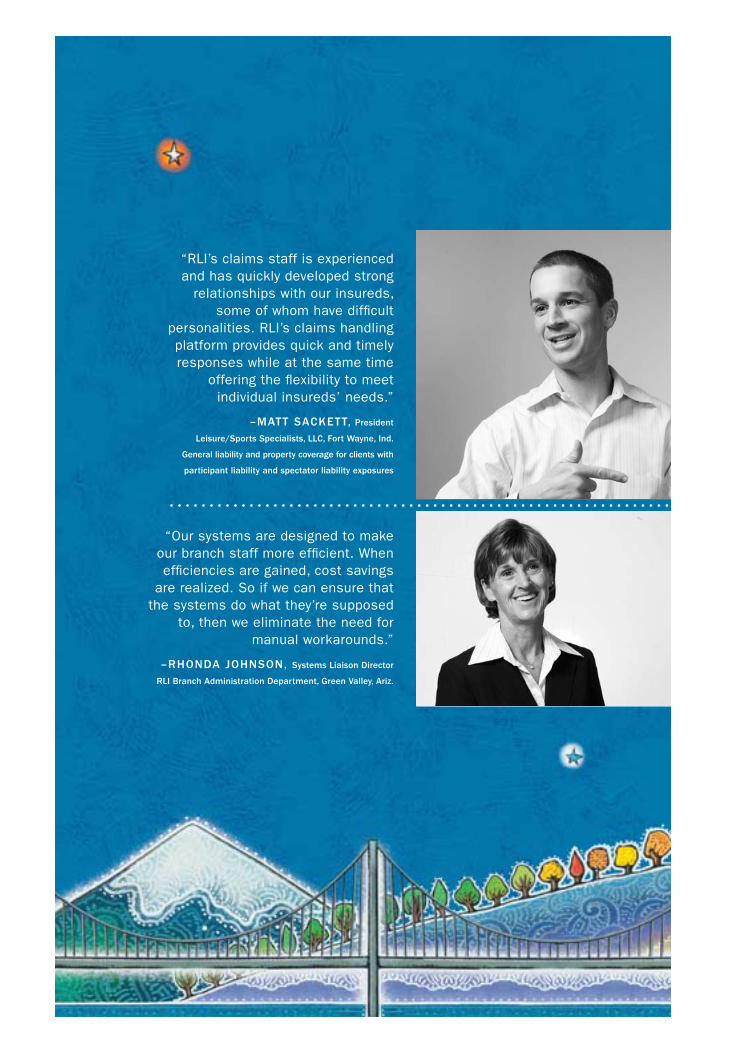
“our systems are designed to make our branch staff more efficient. when efficiencies are gained, cost savings
are realized. So if we can ensure that the systems do what they’re supposed
to, then we eliminate the need for manual workarounds.”
–Rhonda johnson, systems liaison director
RlI branch administration department, green valley, ariz.
“RLI’s claims staff is experienced and has quickly developed strong
relationships with our insureds, some of whom have difficult
personalities. RLI’s claims handling platform provides quick and timely responses while at the same time
offering the flexibility to meet individual insureds’ needs.”
–maTT sackeTT, president
leisure/sports specialists, llc, fort Wayne, Ind.
general liability and property coverage for clients with
participant liability and spectator liability exposures
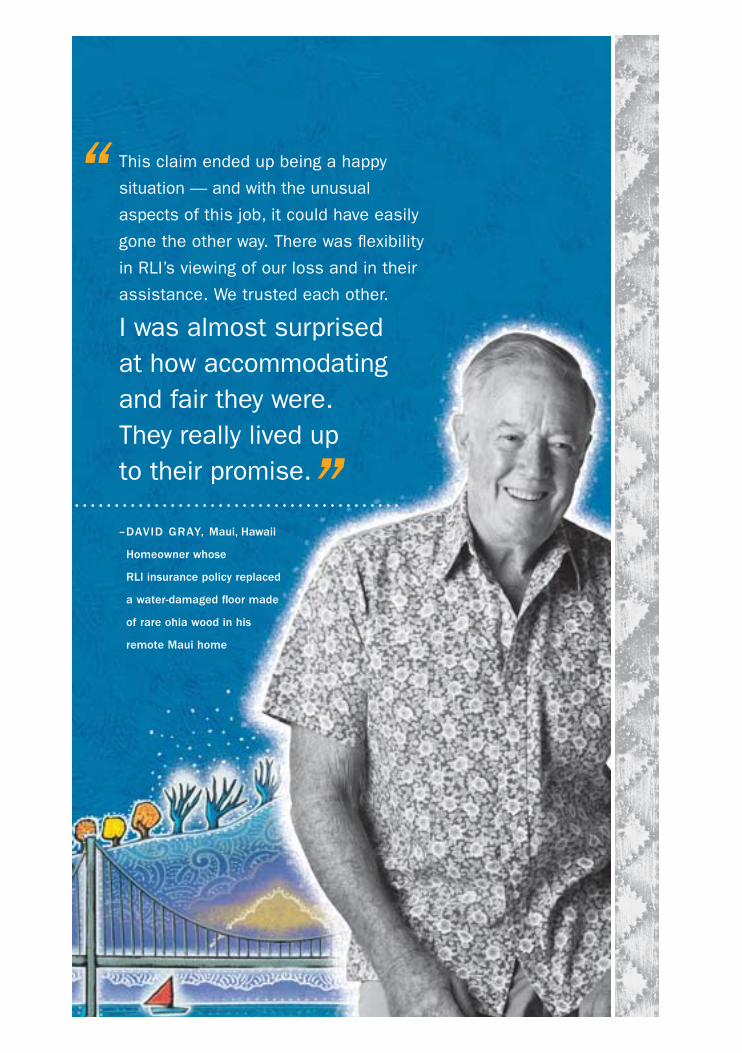
This claim ended up being a happy
situation — and with the unusual
aspects of this job, it could have easily
gone the other way. There was flexibility
in RLI’s viewing of our loss and in their
assistance. we trusted each other.
I was almost surprised at how accommodating and fair they were. They really lived up to their promise.
– davId gRay, maui, hawaii
homeowner whose
RlI insurance policy replaced
a water-damaged floor made
of rare ohia wood in his
remote maui home
“
”
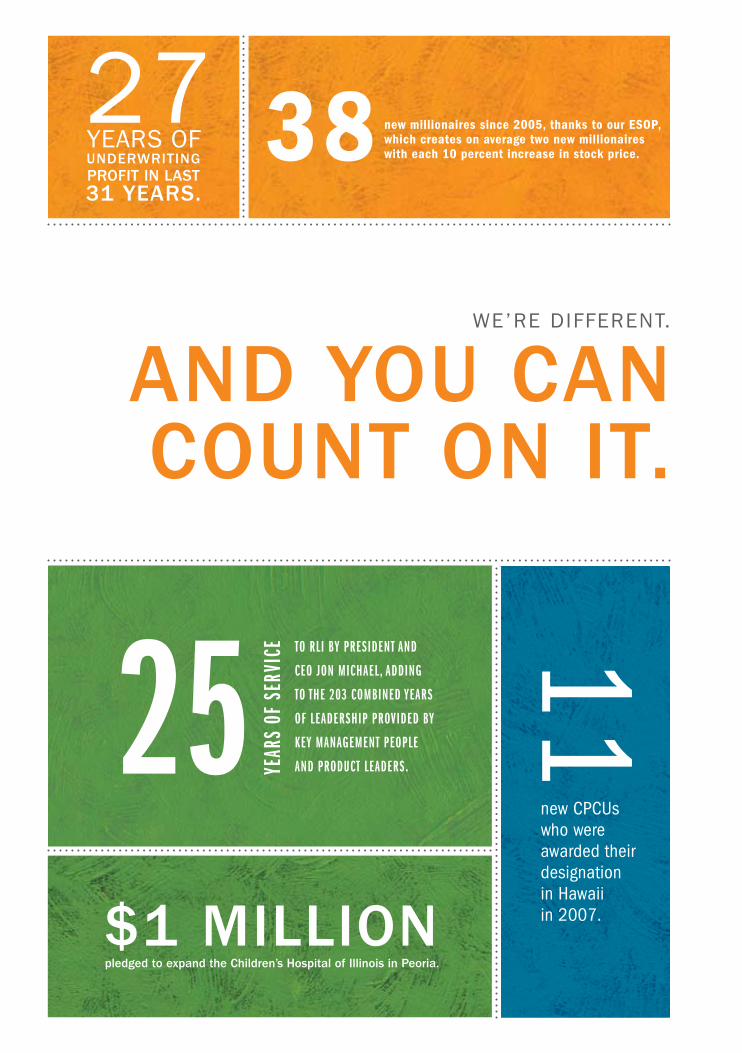
25 year
s of
ser
vice
27yeaRS oFundeRWRITIng
pRofIT In lasT 31 yeaRs.
11
new CPCUs who were awarded their designation in Hawaii in 2007.
we’Re DIFFeReNT.
and you can counT on IT.
38 new millionaires since 2005, thanks to our ESOP, which creates on average two new millionaires with each 10 percent increase in stock price.
to rLi by President and
ceo Jon MichaeL, adding
to the 203 coMbined years
of LeadershiP Provided by
key ManageMent PeoPLe
and Product Leaders.
$1 mIllIonpledged to expand the children’s hospital of Illinois in peoria.
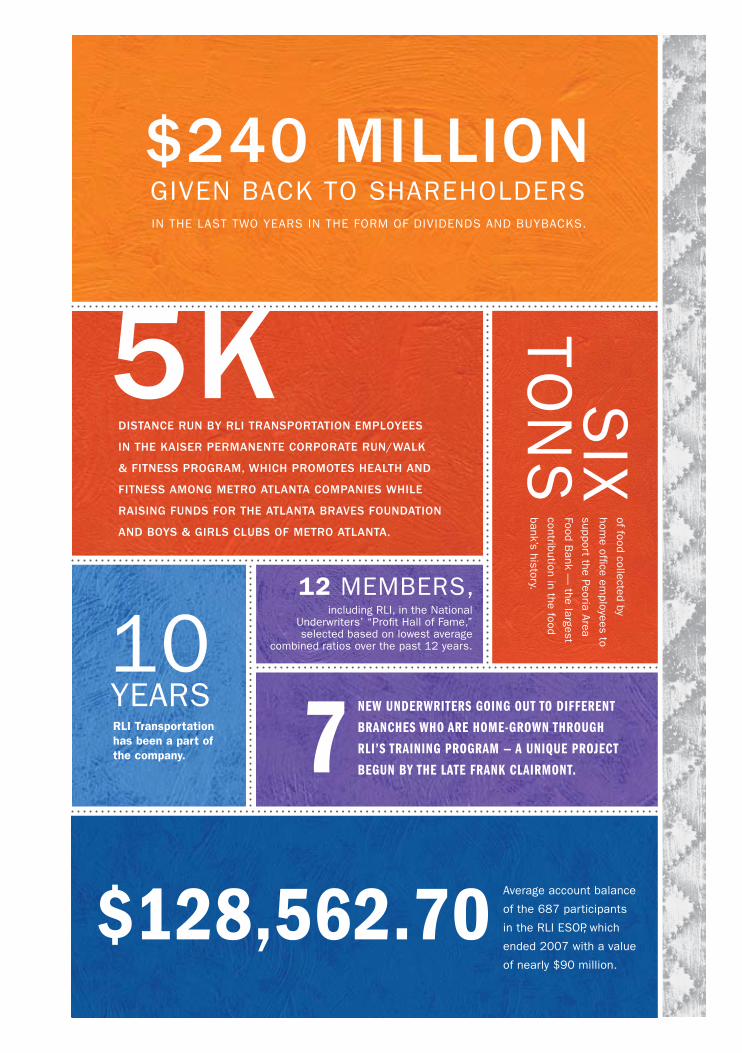
dIsTance Run by RlI TRanspoRTaTIon employees
In The kaIseR peRmanenTe coRpoRaTe Run/Walk
& fITness pRogRam, WhIch pRomoTes healTh and
fITness among meTRo aTlanTa companIes WhIle
RaIsIng funds foR The aTlanTa bRaves foundaTIon
and boys & gIRls clubs of meTRo aTlanTa.
of food collected by
home office em
ployees to
support the Peoria area
Food bank —
the largest
contribution in the food
bank’s history.
average account balance
of the 687 participants
in the RLI eSoP, which
ended 2007 with a value
of nearly $90 million.
SIx
ToN
S
5k
$128,562.70
New uNderwriters goiNg out to differeNt
braNches who are home-growN through
rLi’s traiNiNg program — a uNique project
beguN by the Late fraNk cLairmoNt.7
$240 mIllIon
10 yeaRSRLI Transportation has been a part of the company.
including RLI, in the National underwriters’ “Profit Hall of Fame,” selected based on lowest average
combined ratios over the past 12 years.
12 MeMbeRS,
IN THe LaST Two yeaRS IN THe FoRM oF DIVIDeNDS aND buybaCkS.
gIVeN baCk To SHaReHoLDeRS


FINaNCIaLSDIFFeReNT woRkS. RLI HaS SHowN THaT RewaRDINg PeoPLe FoR a Job weLL DoNe DRIVeS boTToM-LINe PRoFIT.
2007 IS a gReaT exaMPLe. oNCe agaIN, eMPoweReD eMPLoyeeS wITH STRoNg INCeNTIVe To MeeT CuSToMeR
NeeDS DRoVe ouR FINaNCIaL SuCCeSS. uNDeRwRITINg ReSuLTS weRe ouTSTaNDINg, INVeSTMeNT ReSuLTS SeT
ReCoRDS, aND ouR baLaNCe SHeeT HaS NeVeR beeN STRoNgeR.
28
RL
I a
NN
ua
L R
eP
oR
T 2
00
7 ReVIew oF oPeRaTIoNS
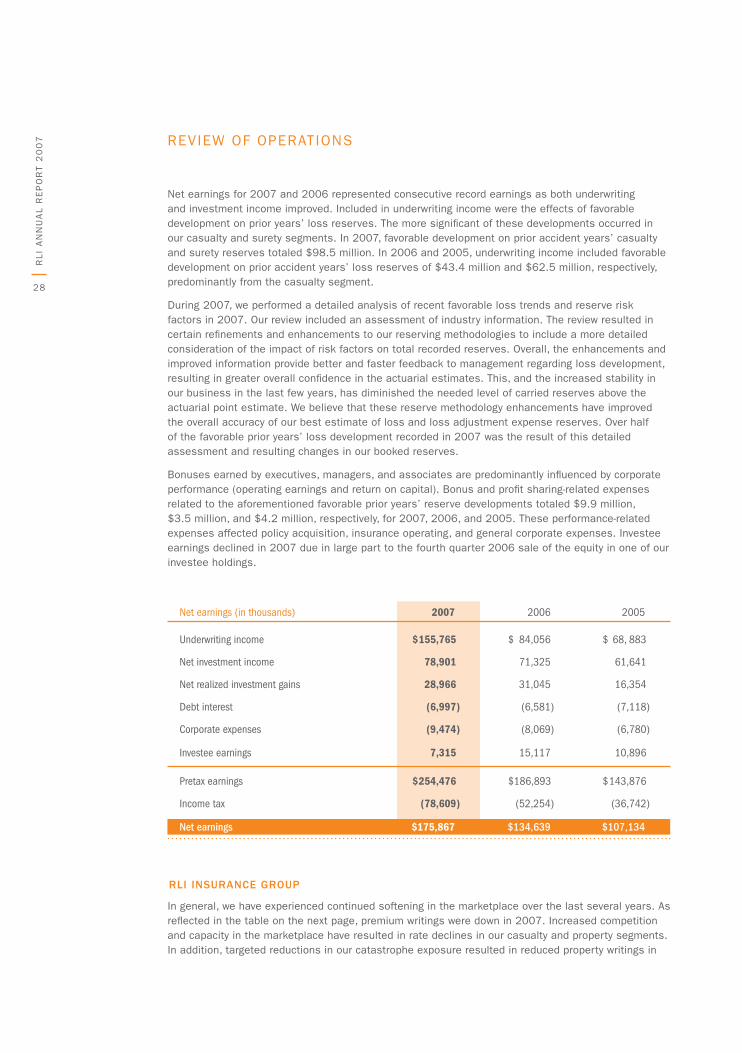
Net earnings for 2007 and 2006 represented consecutive record earnings as both underwriting and investment income improved. Included in underwriting income were the effects of favorable development on prior years’ loss reserves. The more significant of these developments occurred in our casualty and surety segments. In 2007, favorable development on prior accident years’ casualty and surety reserves totaled $98.5 million. In 2006 and 2005, underwriting income included favorable development on prior accident years’ loss reserves of $43.4 million and $62.5 million, respectively, predominantly from the casualty segment.
During 2007, we performed a detailed analysis of recent favorable loss trends and reserve risk factors in 2007. our review included an assessment of industry information. The review resulted in certain refinements and enhancements to our reserving methodologies to include a more detailed consideration of the impact of risk factors on total recorded reserves. overall, the enhancements and improved information provide better and faster feedback to management regarding loss development, resulting in greater overall confidence in the actuarial estimates. This, and the increased stability in our business in the last few years, has diminished the needed level of carried reserves above the actuarial point estimate. we believe that these reserve methodology enhancements have improved the overall accuracy of our best estimate of loss and loss adjustment expense reserves. over half of the favorable prior years’ loss development recorded in 2007 was the result of this detailed assessment and resulting changes in our booked reserves.
bonuses earned by executives, managers, and associates are predominantly influenced by corporate performance (operating earnings and return on capital). bonus and profit sharing-related expenses related to the aforementioned favorable prior years’ reserve developments totaled $9.9 million, $3.5 million, and $4.2 million, respectively, for 2007, 2006, and 2005. These performance-related expenses affected policy acquisition, insurance operating, and general corporate expenses. Investee earnings declined in 2007 due in large part to the fourth quarter 2006 sale of the equity in one of our investee holdings.
Net earnings (in thousands) 2007 2006 2005
Underwriting income $ 155,765 $ 84,056 $ 68, 883
Net investment income 78,901 71,325 61,641
Net realized investment gains 28,966 31,045 16,354
Debt interest (6,997 ) (6,581 ) (7,118 )
Corporate expenses (9,474 ) (8,069 ) (6,780 )
Investee earnings 7,315 15,117 10,896
Pretax earnings $ 254,476 $ 186,893 $ 143,876
Income tax (78,609 ) (52,254 ) (36,742 )
Net earnings $175,867 $134,639 $107,134
RlI InsuRance gRoup
In general, we have experienced continued softening in the marketplace over the last several years. as reflected in the table on the next page, premium writings were down in 2007. Increased competition and capacity in the marketplace have resulted in rate declines in our casualty and property segments. In addition, targeted reductions in our catastrophe exposure resulted in reduced property writings in
29
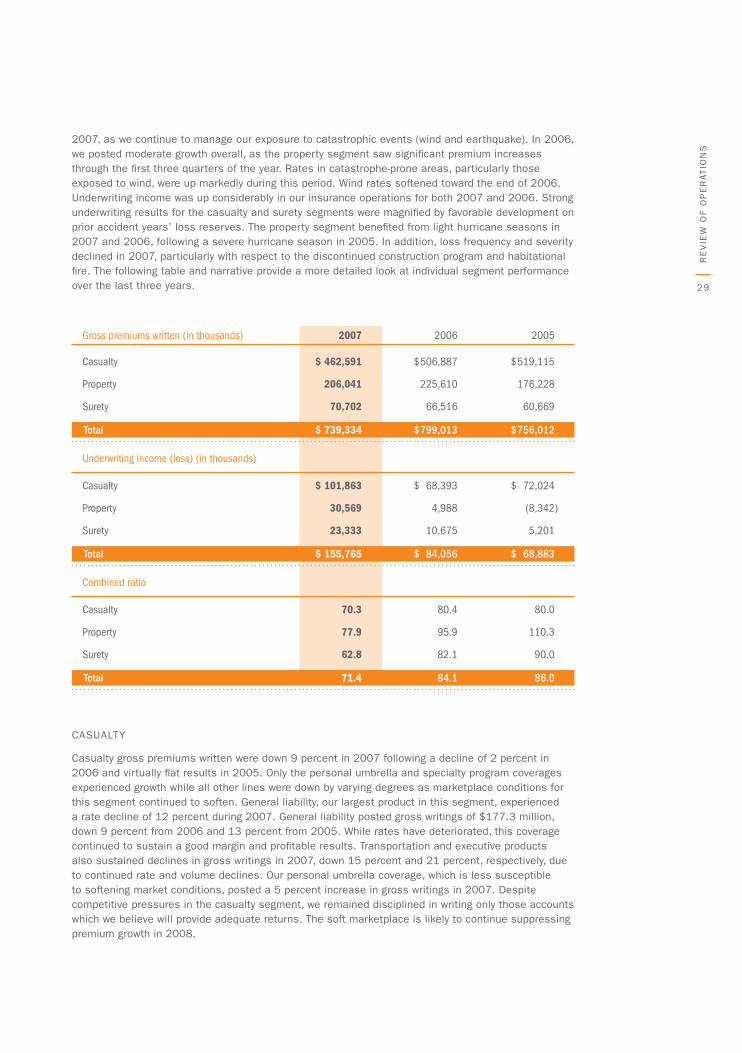
2007, as we continue to manage our exposure to catastrophic events (wind and earthquake). In 2006, we posted moderate growth overall, as the property segment saw significant premium increases through the first three quarters of the year. Rates in catastrophe-prone areas, particularly those exposed to wind, were up markedly during this period. wind rates softened toward the end of 2006. underwriting income was up considerably in our insurance operations for both 2007 and 2006. Strong underwriting results for the casualty and surety segments were magnified by favorable development on prior accident years’ loss reserves. The property segment benefited from light hurricane seasons in 2007 and 2006, following a severe hurricane season in 2005. In addition, loss frequency and severity declined in 2007, particularly with respect to the discontinued construction program and habitational fire. The following table and narrative provide a more detailed look at individual segment performance over the last three years.
Gross premiums written (in thousands) 2007 2006 2005
Casualty $ 462,591 $ 506,887 $ 519,115
Property 206,041 225,610 176,228
Surety 70,702 66,516 60,669
Total $ 739,334 $ 799,013 $ 756,012
Underwriting income (loss) (in thousands)
Casualty $ 101,863 $ 68,393 $ 72,024
Property 30,569 4,988 (8,342 )
Surety 23,333 10,675 5,201
Total $ 155,765 $ 84,056 $ 68,883
Combined ratio
Casualty 70.3 80.4 80.0
Property 77.9 95.9 110.3
Surety 62.8 82.1 90.0
Total 71.4 84.1 86.0
CaSuaLTy
Casualty gross premiums written were down 9 percent in 2007 following a decline of 2 percent in 2006 and virtually flat results in 2005. only the personal umbrella and specialty program coverages experienced growth while all other lines were down by varying degrees as marketplace conditions for this segment continued to soften. general liability, our largest product in this segment, experienced a rate decline of 12 percent during 2007. general liability posted gross writings of $177.3 million, down 9 percent from 2006 and 13 percent from 2005. while rates have deteriorated, this coverage continued to sustain a good margin and profitable results. Transportation and executive products also sustained declines in gross writings in 2007, down 15 percent and 21 percent, respectively, due to continued rate and volume declines. our personal umbrella coverage, which is less susceptible to softening market conditions, posted a 5 percent increase in gross writings in 2007. Despite competitive pressures in the casualty segment, we remained disciplined in writing only those accounts which we believe will provide adequate returns. The soft marketplace is likely to continue suppressing premium growth in 2008.
Re
VIe
w o
F o
Pe
RaT
IoN
S
30
RL
I a
NN
ua
L R
eP
oR
T 2
00
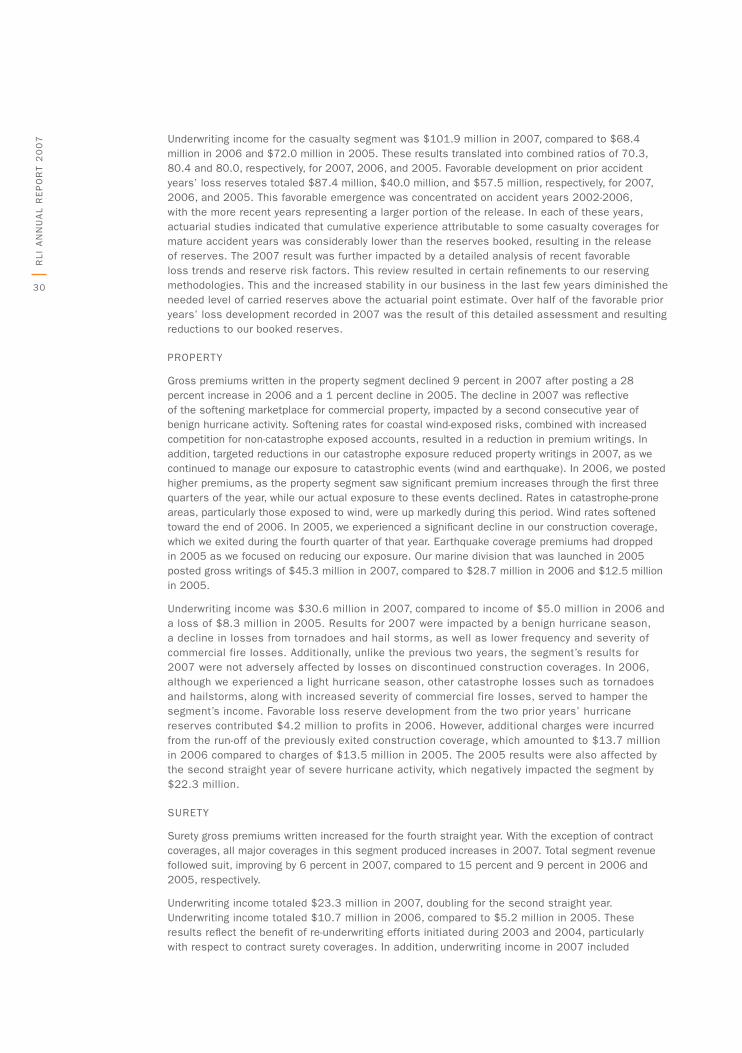
7 underwriting income for the casualty segment was $101.9 million in 2007, compared to $68.4 million in 2006 and $72.0 million in 2005. These results translated into combined ratios of 70.3, 80.4 and 80.0, respectively, for 2007, 2006, and 2005. Favorable development on prior accident years’ loss reserves totaled $87.4 million, $40.0 million, and $57.5 million, respectively, for 2007, 2006, and 2005. This favorable emergence was concentrated on accident years 2002-2006, with the more recent years representing a larger portion of the release. In each of these years, actuarial studies indicated that cumulative experience attributable to some casualty coverages for mature accident years was considerably lower than the reserves booked, resulting in the release of reserves. The 2007 result was further impacted by a detailed analysis of recent favorable loss trends and reserve risk factors. This review resulted in certain refinements to our reserving methodologies. This and the increased stability in our business in the last few years diminished the needed level of carried reserves above the actuarial point estimate. over half of the favorable prior years’ loss development recorded in 2007 was the result of this detailed assessment and resulting reductions to our booked reserves.
PRoPeRTy
gross premiums written in the property segment declined 9 percent in 2007 after posting a 28 percent increase in 2006 and a 1 percent decline in 2005. The decline in 2007 was reflective of the softening marketplace for commercial property, impacted by a second consecutive year of benign hurricane activity. Softening rates for coastal wind-exposed risks, combined with increased competition for non-catastrophe exposed accounts, resulted in a reduction in premium writings. In addition, targeted reductions in our catastrophe exposure reduced property writings in 2007, as we continued to manage our exposure to catastrophic events (wind and earthquake). In 2006, we posted higher premiums, as the property segment saw significant premium increases through the first three quarters of the year, while our actual exposure to these events declined. Rates in catastrophe-prone areas, particularly those exposed to wind, were up markedly during this period. wind rates softened toward the end of 2006. In 2005, we experienced a significant decline in our construction coverage, which we exited during the fourth quarter of that year. earthquake coverage premiums had dropped in 2005 as we focused on reducing our exposure. our marine division that was launched in 2005 posted gross writings of $45.3 million in 2007, compared to $28.7 million in 2006 and $12.5 million in 2005.
underwriting income was $30.6 million in 2007, compared to income of $5.0 million in 2006 and a loss of $8.3 million in 2005. Results for 2007 were impacted by a benign hurricane season, a decline in losses from tornadoes and hail storms, as well as lower frequency and severity of commercial fire losses. additionally, unlike the previous two years, the segment’s results for 2007 were not adversely affected by losses on discontinued construction coverages. In 2006, although we experienced a light hurricane season, other catastrophe losses such as tornadoes and hailstorms, along with increased severity of commercial fire losses, served to hamper the segment’s income. Favorable loss reserve development from the two prior years’ hurricane reserves contributed $4.2 million to profits in 2006. However, additional charges were incurred from the run-off of the previously exited construction coverage, which amounted to $13.7 million in 2006 compared to charges of $13.5 million in 2005. The 2005 results were also affected by the second straight year of severe hurricane activity, which negatively impacted the segment by $22.3 million.
SuReTy
Surety gross premiums written increased for the fourth straight year. with the exception of contract coverages, all major coverages in this segment produced increases in 2007. Total segment revenue followed suit, improving by 6 percent in 2007, compared to 15 percent and 9 percent in 2006 and 2005, respectively.
underwriting income totaled $23.3 million in 2007, doubling for the second straight year. underwriting income totaled $10.7 million in 2006, compared to $5.2 million in 2005. These results reflect the benefit of re-underwriting efforts initiated during 2003 and 2004, particularly with respect to contract surety coverages. In addition, underwriting income in 2007 included
31
$11.1 million of favorable development on prior accident years’ loss reserves. The majority of this development was the result of our actuary’s risk reassessment and reflection of significantly lower reserve risk, following continued favorable loss trends and further progress on the Commercial Money Center litigation.
neT InvesTmenT Income and RealIzed InvesTmenT gaIns
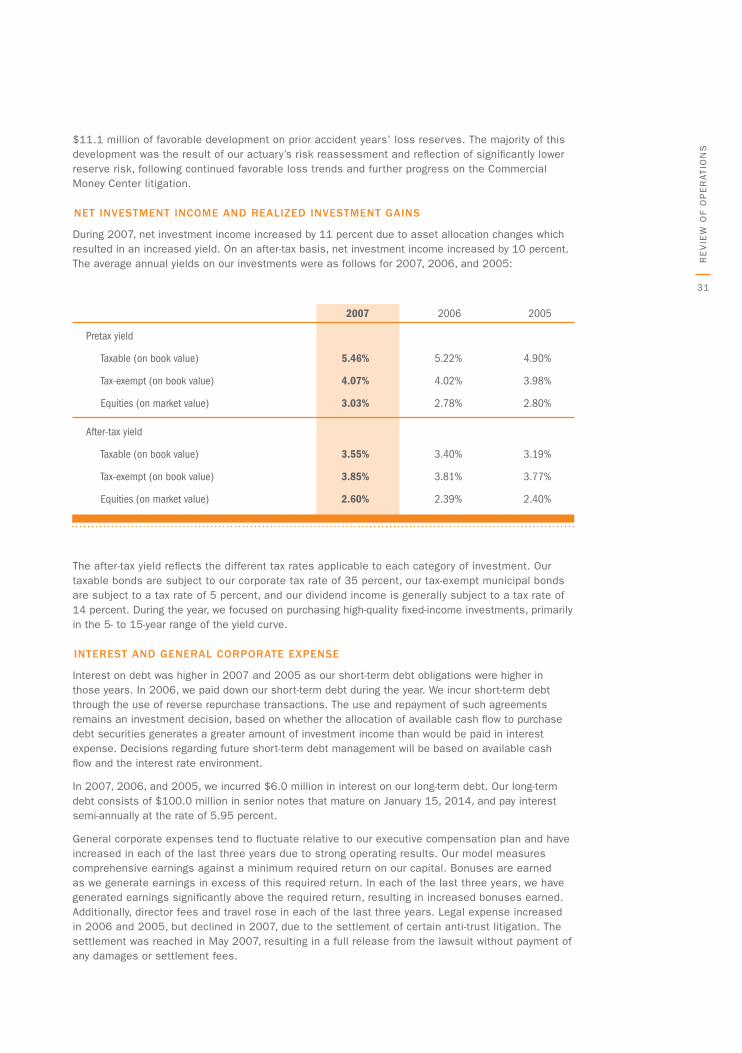
During 2007, net investment income increased by 11 percent due to asset allocation changes which resulted in an increased yield. on an after-tax basis, net investment income increased by 10 percent. The average annual yields on our investments were as follows for 2007, 2006, and 2005:
2007 2006 2005
Pretax yield
Taxable (on book value) 5.46% 5.22% 4.90%
Tax-exempt (on book value) 4.07% 4.02% 3.98%
Equities (on market value) 3.03% 2.78% 2.80%
After-tax yield
Taxable (on book value) 3.55% 3.40% 3.19%
Tax-exempt (on book value) 3.85% 3.81% 3.77%
Equities (on market value) 2.60% 2.39% 2.40%
The after-tax yield reflects the different tax rates applicable to each category of investment. our taxable bonds are subject to our corporate tax rate of 35 percent, our tax-exempt municipal bonds are subject to a tax rate of 5 percent, and our dividend income is generally subject to a tax rate of 14 percent. During the year, we focused on purchasing high-quality fixed-income investments, primarily in the 5- to 15-year range of the yield curve.
InTeResT and geneRal coRpoRaTe expense
Interest on debt was higher in 2007 and 2005 as our short-term debt obligations were higher in those years. In 2006, we paid down our short-term debt during the year. we incur short-term debt through the use of reverse repurchase transactions. The use and repayment of such agreements remains an investment decision, based on whether the allocation of available cash flow to purchase debt securities generates a greater amount of investment income than would be paid in interest expense. Decisions regarding future short-term debt management will be based on available cash flow and the interest rate environment.
In 2007, 2006, and 2005, we incurred $6.0 million in interest on our long-term debt. our long-term debt consists of $100.0 million in senior notes that mature on January 15, 2014, and pay interest semi-annually at the rate of 5.95 percent.
general corporate expenses tend to fluctuate relative to our executive compensation plan and have increased in each of the last three years due to strong operating results. our model measures comprehensive earnings against a minimum required return on our capital. bonuses are earned as we generate earnings in excess of this required return. In each of the last three years, we have generated earnings significantly above the required return, resulting in increased bonuses earned. additionally, director fees and travel rose in each of the last three years. Legal expense increased in 2006 and 2005, but declined in 2007, due to the settlement of certain anti-trust litigation. The settlement was reached in May 2007, resulting in a full release from the lawsuit without payment of any damages or settlement fees.
Re
VIe
w o
F o
Pe
RaT
IoN
S
32
RL
I a
NN
ua
L R
eP
oR
T 2
00
7 InvesTee eaRnIngs
we maintain a 40 percent equity interest in Maui Jim, a manufacturer of high-quality polarized sunglasses. Maui Jim’s chief executive officer owns a controlling majority of the outstanding shares of Maui Jim. In 2007, we recorded $7.3 million in earnings from this investment compared to $8.8 million in 2006 and $8.4 million in 2005. while sunglass sales advanced 15 percent in 2007, costs associated with expansion efforts and the discontinuance of certain sunglass styles resulted in a decline in earnings. In 2007, Maui Jim invested heavily in new sales and distribution offices (nationally and internationally), a new state-of-the-art Rx lab for prescription sunglasses, as well as new display programs and duty free and corporate gift channels across the world. In addition, the company recorded higher-than-normal expense associated with the discontinuance of some slow-moving styles and the replacement of temples on a specific product line.
also included in investee earnings in 2006 and 2005 were $6.3 million and $2.5 million, respectively, from our investment in Taylor, bean & whitaker Mortgage Corp. (Tbw). In the fourth quarter of 2006, we sold our equity in Tbw for $32.5 million, resulting in a pretax realized gain of $16.2 million.
Income Taxes
our effective tax rates were 30.9 percent, 28.0 percent, and 25.5 percent for 2007, 2006, and 2005, respectively. effective rates are dependent upon components of pretax earnings and the related tax effects. The effective rate for 2007 was higher than 2006 and 2005 due to the increase in underwriting income and net realized gains, which were taxed at 35.0 percent. Partially offsetting tax expense in 2007 was a $2.4 million tax benefit recorded in the third quarter to reflect the benefit expected to be realized upon the future payment of certain accrued compensation. Results for 2006 include the favorable resolution of a tax examination. During 2006, the Internal Revenue Service concluded an examination of our tax years 2000 through 2004. as a result of this exam, we recorded a $3.2 million tax benefit, resulting from a change in tax estimate related to the sale of assets. In 2006 and 2005, a tax benefit was realized associated with a dividend declared and paid in 2007 and 2006, respectively, from our unconsolidated investee, Maui Jim. as required under Statement of Financial accounting Standards (SFaS) 109, “accounting for Income Taxes,” the tax benefit results from applying the lower tax rate applicable to affiliated dividends (7 percent) as compared to the corporate capital gains tax rate (35 percent) on which previous tax estimates were based. In addition, our pretax earnings in 2007 included $29.8 million of investment income that is wholly or partially exempt from federal income tax, compared to $28.7 million and $28.2 million in 2006 and 2005, respectively.
ouTlook foR 2008
The insurance marketplace, and in particular the excess and surplus lines segment, is subject to cycles involving alternating periods of price increases (“hard markets”) and price decreases (“soft markets”). Pricing in the overall insurance marketplace has been on the decline for the past several years. we expect this trend to continue, although each of our insurance segments will likely be impacted by varying degrees. we expect to see premium growth in selected products in 2008 and underwriting income in all three of our insurance segments absent any major catastrophe. Specific details regarding events in our insurance segments follow.
CaSuaLTy
we expect the price softening seen in 2007 to continue in 2008. we will maintain our profit-focused strategy and look to broaden our production sources and product offerings as a means to holding our market position and potentially growing this segment. Rising profitability and rising levels of capital for the industry will serve to intensify competition for this segment. we look to our ability to exercise underwriting discipline and select quality risks to continue our profitability in 2008.
33
Re
VIe
w o
F o
Pe
RaT
IoN
S
PRoPeRTy
The industry has taken advantage of recent quiet atlantic hurricane seasons to rebuild capital depleted by hurricane events in 2005. we believe property pricing will continue to soften in the year ahead. Pricing actions continue to be tempered by greater rating agency focus on catastrophe claims-paying ability. we expect our marine business to grow moderately due to new product offerings and an increased focus on writing inland marine coverages. In addition, the recently launched facultative reinsurance product will be additive to premiums in 2008. we expect the segment to produce underwriting income in 2008, absent any major catastrophes.
SuReTy
The surety segment, like our other segments, will feel the pressure of a softening marketplace. our experienced underwriting staff coupled with our effective use of technology (IT platforms and decision-support tools) point to continued profitability. we expect to see modest premium growth in this segment in 2008.
INVeSTMeNTS
within our investment portfolio, we expect investment income to be relatively flat due to cash flow from operations funding a share repurchase program. at December 31, t we have $85.7 million remaining on the authorized repurchase plan. In addition, reinvestment rates into fixed income securities may be less than previous rates. Twenty percent of our portfolio is invested in equity securities. we expect the dividend income on these securities to grow and the value of this portfolio will be dictated by the performance of the general stock market, which is difficult to predict.
foRWaRd lookIng sTaTemenTs
Forward looking statements within the meaning of Section 27a of the Securities act of 1933 and Section 21e of the Securities exchange act of 1934 appear throughout this report. These statements relate to our current expectations, beliefs, intentions, goals, or strategies regarding the future and are based on certain underlying assumptions by us. These forward looking statements generally include words such as “expect,” “will,” “should,” “anticipate,” “believe,” and similar expressions. Such assumptions are, in turn, based on information available and internal estimates and analyses of general economic conditions, competitive factors, conditions specific to the property and casualty insurance industry, claims development, and the impact thereof on our loss reserves, the adequacy of our reinsurance programs, developments in the securities market and the impact on our investment portfolio, regulatory changes and conditions, and other factors. actual results could differ materially from those expressed in, or implied by, these forward looking statements. we assume no obligation to update any such statements. you should review the various risks, uncertainties, and other factors listed from time to time in our Securities and exchange Commission filings.
To view our comprehensive financial information, please refer to our 2007 RlI corp. financial Report.
34
RL
I a
NN
ua
L R
eP
oR
T 2
00
7
41.5
7
05 06 07
60.7
66.5
70.7
225.
650
6.9
176.
251
9.1
05 06 07
Dol
lars
in m
illio
ns
Dol
lars
in m
illio
ns
5.2
5.0
30.6
10.7
68.472
.0
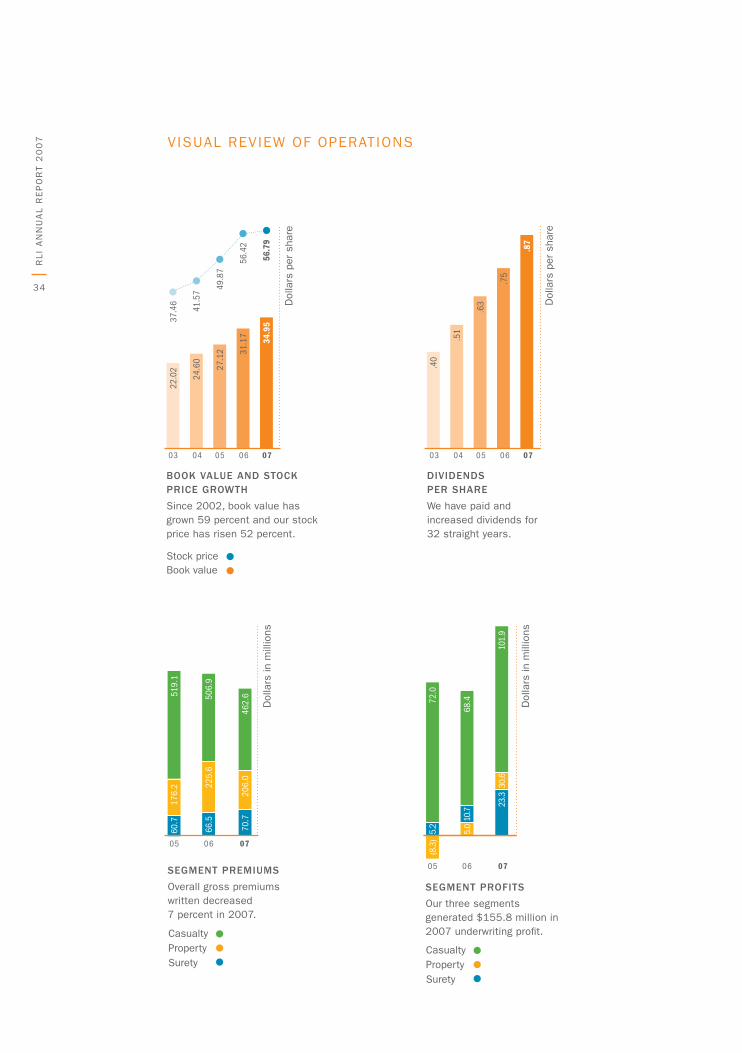
VISuaL ReVIew oF oPeRaTIoNS
03 04 05 06 07
22.0
2
book value and sTock pRIce gRoWTh
Since 2002, book value has grown 59 percent and our stock price has risen 52 percent.
segmenT pRofITs
our three segments generated $155.8 million in 2007 underwriting profit.
Dol
lars
per
sha
re
dIvIdends peR shaRe
we have paid and increased dividends for 32 straight years.
segmenT pRemIums
overall gross premiums written decreased 7 percent in 2007.
24.6
0
27.1
2 31.1
7
34.9
5
.40
Dol
lars
per
sha
re
.51
.63
.75
.87
CasualtyPropertySurety
CasualtyPropertySurety
Stock pricebook value
(8.3
)
37.4
6
49.8
7
56.4
2
56.7
9
03 04 05 06 07
23.3
101.
9
206.
046
2.6
35
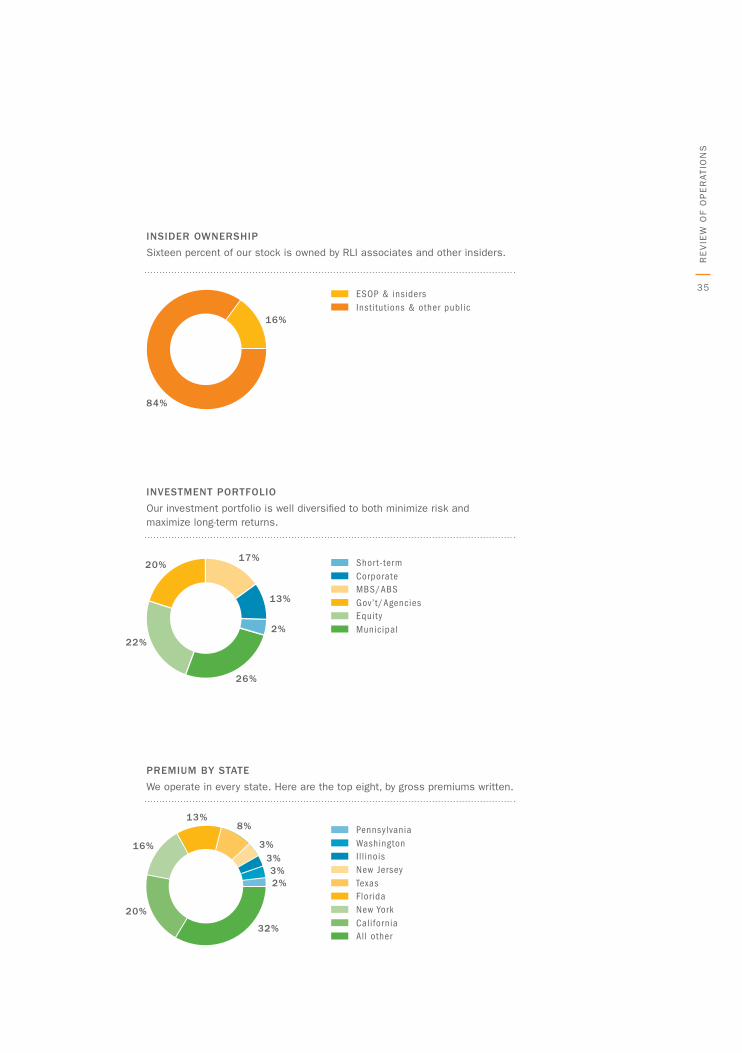
InsIdeR oWneRshIp
Sixteen percent of our stock is owned by RLI associates and other insiders.
InvesTmenT poRTfolIo
our investment portfolio is well diversified to both minimize risk and maximize long-term returns.
pRemIum by sTaTe
we operate in every state. Here are the top eight, by gross premiums written.
Re
VIe
w o
F o
Pe
RaT
IoN
S
ESOP & insiders
Shor t-term
Pennsylvania
New Jersey
New York
MBS/ABS
Il l inois
Florida
All other
Equity
Institutions & other public
Corporate
Washington
Texas
California
Gov’t/Agencies
Municipal
16%
84%
22%
20%
26%
2%
13%
17%
20%
13%8%
3%3%3%2%
32%
16%
36
RL
I a
NN
ua
L R
eP
oR
T 2
00
7 V ISuaL ReVIew oF oPeRaTIoNS, cont.
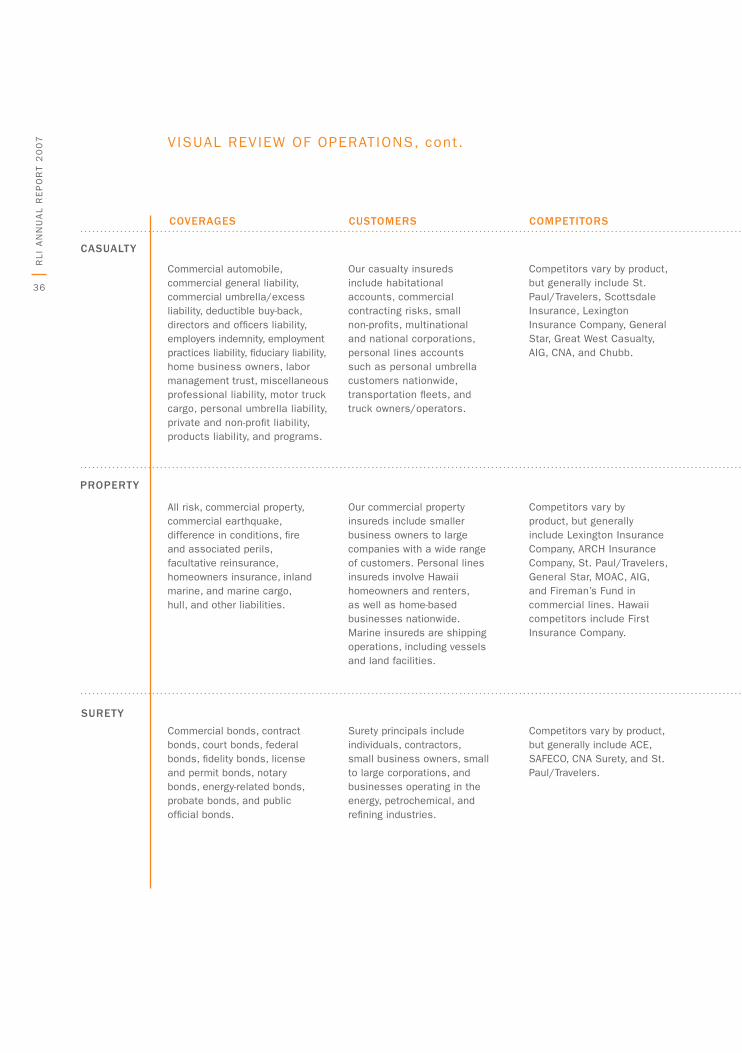
coveRages cusTomeRs compeTIToRs
Commercial automobile, commercial general liability, commercial umbrella/excess liability, deductible buy-back, directors and officers liability, employers indemnity, employment practices liability, fiduciary liability, home business owners, labor management trust, miscellaneous professional liability, motor truck cargo, personal umbrella liability, private and non-profit liability, products liability, and programs.
our casualty insureds include habitational accounts, commercial contracting risks, small non-profits, multinational and national corporations, personal lines accounts such as personal umbrella customers nationwide, transportation fleets, and truck owners/operators.
Competitors vary by product, but generally include St. Paul/Travelers, Scottsdale Insurance, Lexington Insurance Company, general Star, great west Casualty, aIg, CNa, and Chubb.
all risk, commercial property, commercial earthquake, difference in conditions, fire and associated perils, facultative reinsurance, homeowners insurance, inland marine, and marine cargo, hull, and other liabilities.
our commercial property insureds include smaller business owners to large companies with a wide range of customers. Personal lines insureds involve Hawaii homeowners and renters, as well as home-based businesses nationwide. Marine insureds are shipping operations, including vessels and land facilities.
Competitors vary by product, but generally include Lexington Insurance Company, aRCH Insurance Company, St. Paul/Travelers, general Star, MoaC, aIg, and Fireman’s Fund in commercial lines. Hawaii competitors include First Insurance Company.
Commercial bonds, contract bonds, court bonds, federal bonds, fidelity bonds, license and permit bonds, notary bonds, energy-related bonds, probate bonds, and public official bonds.
Surety principals include individuals, contractors, small business owners, small to large corporations, and businesses operating in the energy, petrochemical, and refining industries.
Competitors vary by product, but generally include aCe, SaFeCo, CNa Surety, and St. Paul/Travelers.
suReTy
pRopeRTy
casualTy
37
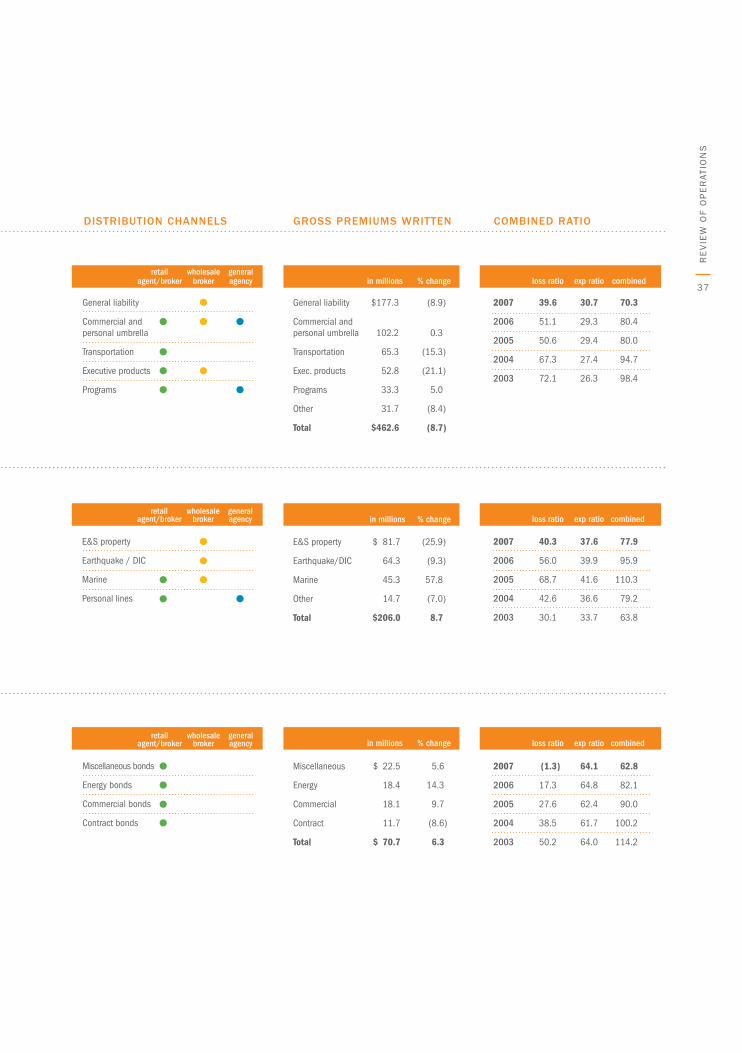
dIsTRIbuTIon channels gRoss pRemIums WRITTen combIned RaTIo
retail wholesale general agent/broker broker agency
Miscellaneous bonds
Energy bonds
Commercial bonds
Contract bonds
in millions % change
Miscellaneous $ 22.5 5.6
Energy 18.4 14.3
Commercial 18.1 9.7
Contract 11.7 (8.6)
Total $ 70.7 6.3
loss ratio exp ratio combined
2007 (1.3) 64.1 62.8
2006 17.3 64.8 82.1
2005 27.6 62.4 90.0
2004 38.5 61.7 100.2
2003 50.2 64.0 114.2
retail wholesale general agent/broker broker agency
E&S property
Earthquake / DIC
Marine
Personal lines
in millions % change
E&S property $ 81.7 (25.9)
Earthquake/DIC 64.3 (9.3)
Marine 45.3 57.8
Other 14.7 (7.0)
Total $206.0 8.7
loss ratio exp ratio combined
2007 40.3 37.6 77.9
2006 56.0 39.9 95.9
2005 68.7 41.6 110.3
2004 42.6 36.6 79.2
2003 30.1 33.7 63.8
retail wholesale general agent/broker broker agency
General liability
Commercial and personal umbrella
Transportation
Executive products
Programs
in millions % change
General liability $177.3 (8.9)
Commercial and personal umbrella 102.2 0.3
Transportation 65.3 (15.3)
Exec. products 52.8 (21.1)
Programs 33.3 5.0
Other 31.7 (8.4)
Total $462.6 (8.7)
loss ratio exp ratio combined
2007 39.6 30.7 70.3
2006 51.1 29.3 80.4
2005 50.6 29.4 80.0
2004 67.3 27.4 94.7
2003 72.1 26.3 98.4
Re
VIe
w o
F o
Pe
RaT
IoN
S
38
RL
I a
NN
ua
L R
eP
oR
T 2
00
7
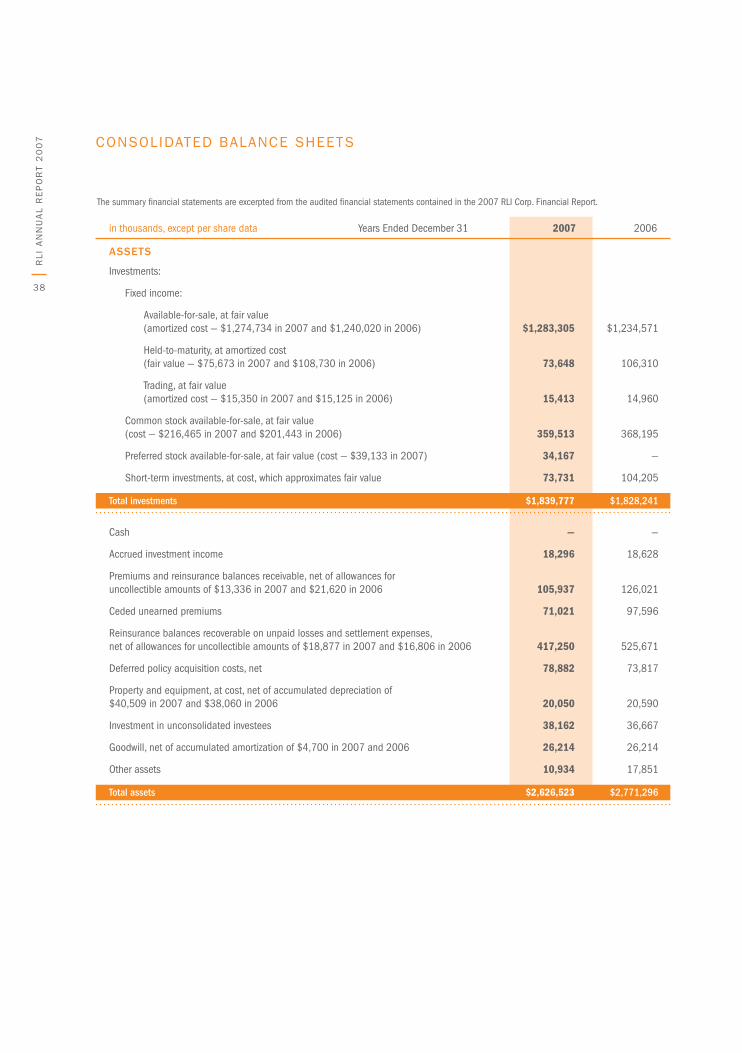
The summary financial statements are excerpted from the audited financial statements contained in the 2007 RLI Corp. Financial Report.
in thousands, except per share data Years Ended December 31 2007 2006
asseTs
Investments:
Fixed income:
Available-for-sale, at fair value (amortized cost — $1,274,734 in 2007 and $1,240,020 in 2006) $1,283,305 $1,234,571
Held-to-maturity, at amortized cost (fair value — $75,673 in 2007 and $108,730 in 2006) 73,648 106,310
Trading, at fair value (amortized cost — $15,350 in 2007 and $15,125 in 2006) 15,413 14,960
Common stock available-for-sale, at fair value (cost — $216,465 in 2007 and $201,443 in 2006) 359,513 368,195
Preferred stock available-for-sale, at fair value (cost — $39,133 in 2007) 34,167 —
Short-term investments, at cost, which approximates fair value 73,731 104,205
TotaI investments $1,839,777 $1,828,241
Cash — —
Accrued investment income 18,296 18,628
Premiums and reinsurance balances receivable, net of allowances for uncollectible amounts of $13,336 in 2007 and $21,620 in 2006 105,937 126,021
Ceded unearned premiums 71,021 97,596
Reinsurance balances recoverable on unpaid losses and settlement expenses, net of allowances for uncollectible amounts of $18,877 in 2007 and $16,806 in 2006 417,250 525,671
Deferred policy acquisition costs, net 78,882 73,817
Property and equipment, at cost, net of accumulated depreciation of $40,509 in 2007 and $38,060 in 2006 20,050 20,590
Investment in unconsolidated investees 38,162 36,667
Goodwill, net of accumulated amortization of $4,700 in 2007 and 2006 26,214 26,214
Other assets 10,934 17,851
Total assets $2,626,523 $2,771,296
CoNSoLIDaTeD baLaNCe SHeeTS
39
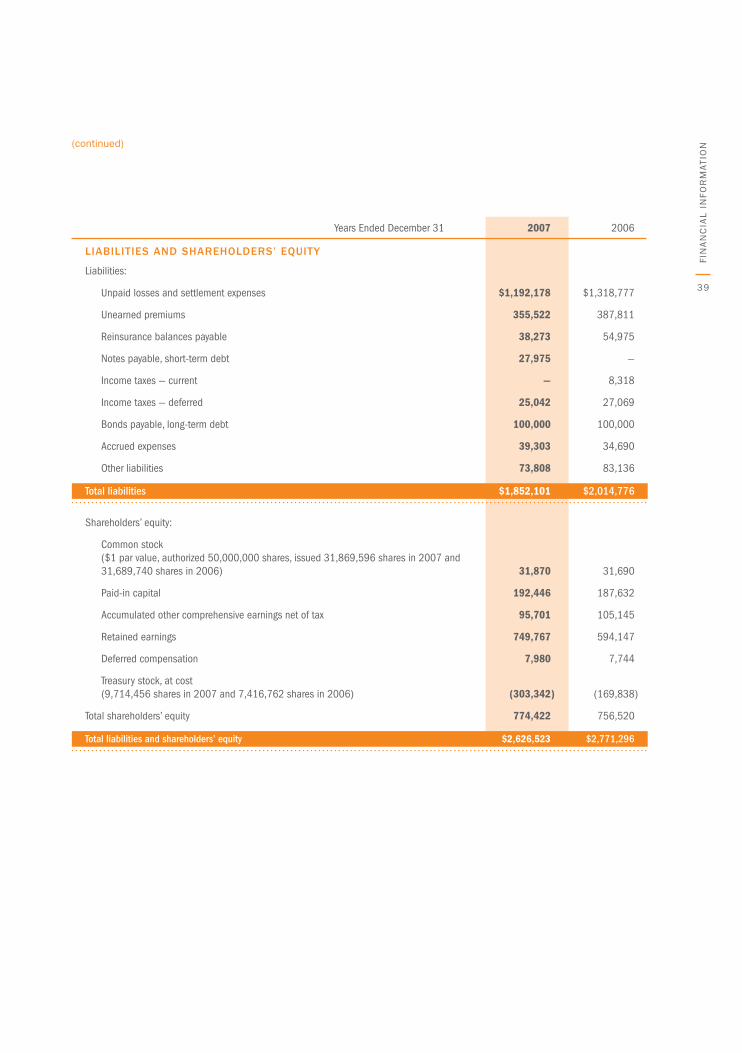
Years Ended December 31 2007 2006
lIabIlITIes and shaReholdeRs’ equITy
Liabilities:
Unpaid losses and settlement expenses $1,192,178 $1,318,777
Unearned premiums 355,522 387,811
Reinsurance balances payable 38,273 54,975
Notes payable, short-term debt 27,975 —
Income taxes — current — 8,318
Income taxes — deferred 25,042 27,069
Bonds payable, long-term debt 100,000 100,000
Accrued expenses 39,303 34,690
Other liabilities 73,808 83,136
Total liabilities $1,852,101 $2,014,776
Shareholders’ equity:
Common stock ($1 par value, authorized 50,000,000 shares, issued 31,869,596 shares in 2007 and 31,689,740 shares in 2006) 31,870 31,690
Paid-in capital 192,446 187,632
Accumulated other comprehensive earnings net of tax 95,701 105,145
Retained earnings 749,767 594,147
Deferred compensation 7,980 7,744
Treasury stock, at cost (9,714,456 shares in 2007 and 7,416,762 shares in 2006) (303,342 ) (169,838 )
Total shareholders’ equity 774,422 756,520
Total liabilities and shareholders’ equity $2,626,523 $2,771,296
(continued)
FIN
aN
CIa
L I
NFo
RM
aT
IoN
40
RL
I a
NN
ua
L R
eP
oR
T 2
00
7
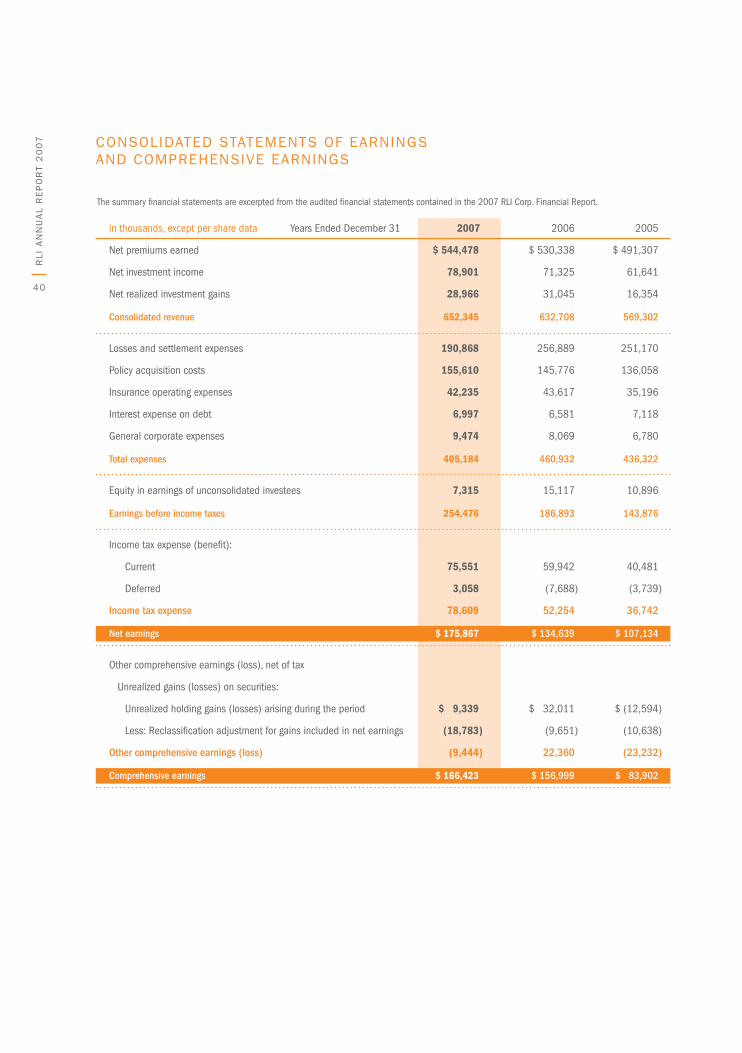
The summary financial statements are excerpted from the audited financial statements contained in the 2007 RLI Corp. Financial Report.
in thousands, except per share data Years Ended December 31 2007 2006 2005
Net premiums earned $ 544,478 $ 530,338 $ 491,307
Net investment income 78,901 71,325 61,641
Net realized investment gains 28,966 31,045 16,354
Consolidated revenue 652,345 632,708 569,302
Losses and settlement expenses 190,868 256,889 251,170
Policy acquisition costs 155,610 145,776 136,058
Insurance operating expenses 42,235 43,617 35,196
Interest expense on debt 6,997 6,581 7,118
General corporate expenses 9,474 8,069 6,780
Total expenses 405,184 460,932 436,322
Equity in earnings of unconsolidated investees 7,315 15,117 10,896
Earnings before income taxes 254,476 186,893 143,876
Income tax expense (benefit):
Current 75,551 59,942 40,481
Deferred 3,058 (7,688 ) (3,739 )
Income tax expense 78,609 52,254 36,742
Net earnings $ 175,867 $ 134,639 $ 107,134
Other comprehensive earnings (loss), net of tax
Unrealized gains (losses) on securities:
Unrealized holding gains (losses) arising during the period $ 9,339 $ 32,011 $ (12,594 )
Less: Reclassification adjustment for gains included in net earnings (18,783 ) (9,651 ) (10,638 )
Other comprehensive earnings (loss) (9,444 ) 22,360 (23,232 )
Comprehensive earnings $ 166,423 $ 156,999 $ 83,902
CoNSoLIDaTeD STaTeMeNTS oF eaRNINgS aND CoMPReHeNSIVe eaRNINgS
41
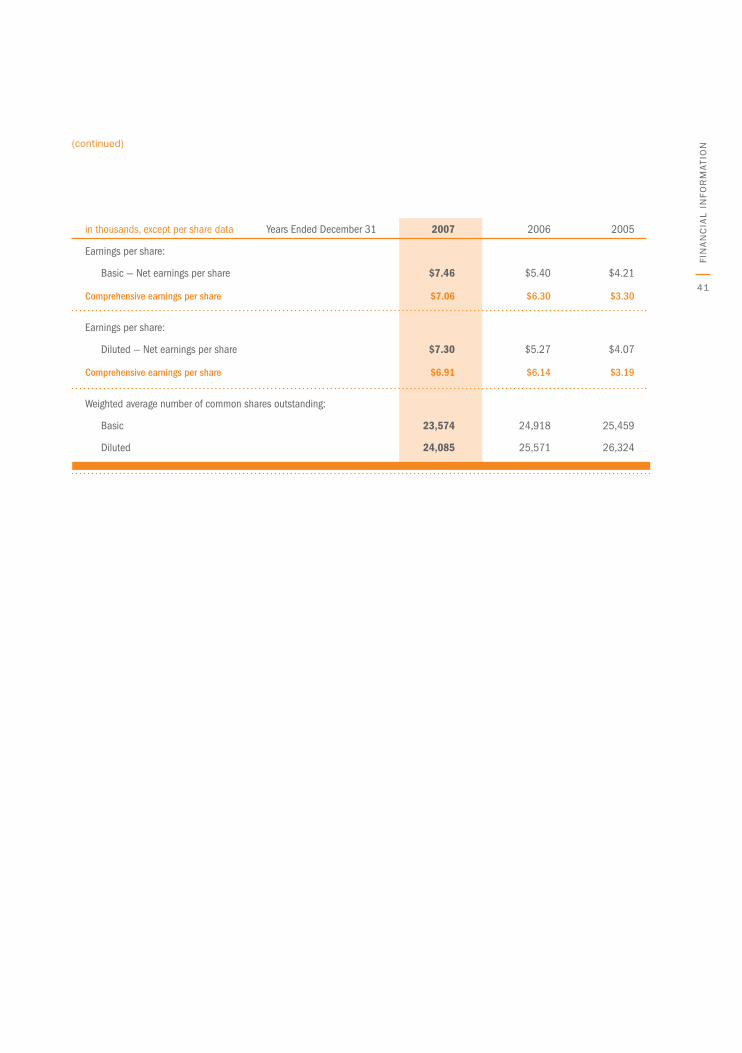
in thousands, except per share data Years Ended December 31 2007 2006 2005
Earnings per share:
Basic — Net earnings per share $7.46 $5.40 $4.21
Comprehensive earnings per share $7.06 $6.30 $3.30
Earnings per share:
Diluted — Net earnings per share $7.30 $5.27 $4.07
Comprehensive earnings per share $6.91 $6.14 $3.19
Weighted average number of common shares outstanding:
Basic 23,574 24,918 25,459
Diluted 24,085 25,571 26,324
(continued)
FIN
aN
CIa
L I
NFo
RM
aT
IoN
42
RL
I a
NN
ua
L R
eP
oR
T 2
00
7
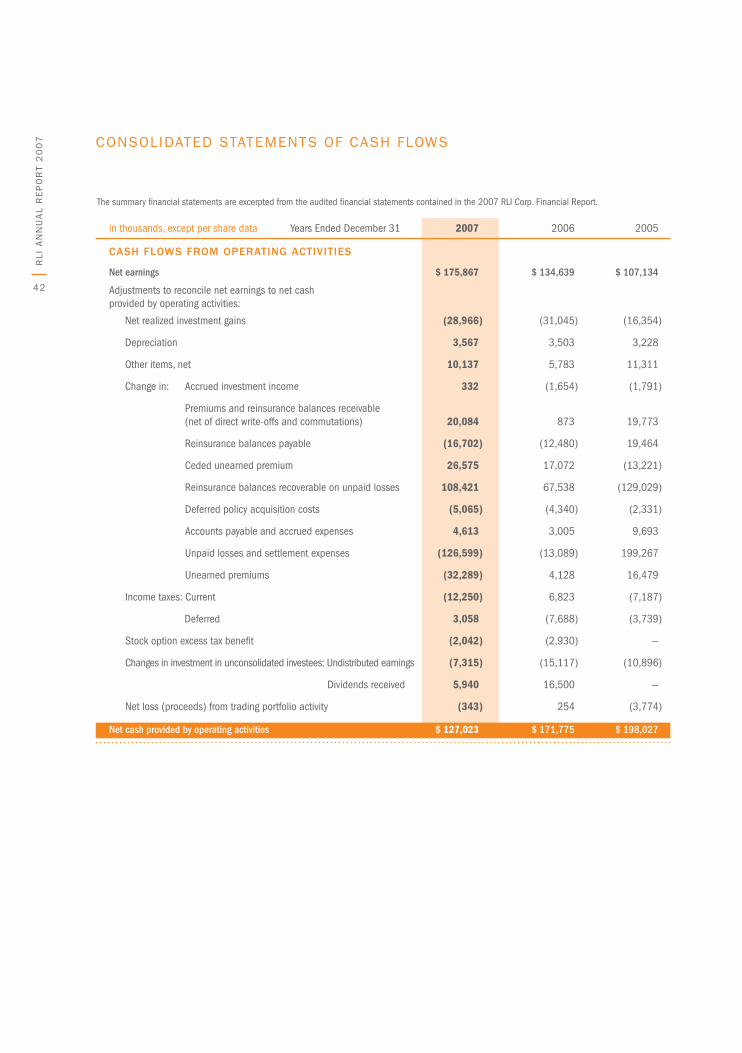
The summary financial statements are excerpted from the audited financial statements contained in the 2007 RLI Corp. Financial Report.
in thousands, except per share data Years Ended December 31 2007 2006 2005
cash floWs fRom opeRaTIng acTIvITIes
Net earnings $ 175,867 $ 134,639 $ 107,134
Adjustments to reconcile net earnings to net cash provided by operating activities:
Net realized investment gains (28,966 ) (31,045 ) (16,354 )
Depreciation 3,567 3,503 3,228
Other items, net 10,137 5,783 11,311
Change in: Accrued investment income 332 (1,654 ) (1,791 )
Premiums and reinsurance balances receivable (net of direct write-offs and commutations) 20,084 873 19,773
Reinsurance balances payable (16,702 ) (12,480 ) 19,464
Ceded unearned premium 26,575 17,072 (13,221 )
Reinsurance balances recoverable on unpaid losses 108,421 67,538 (129,029 )
Deferred policy acquisition costs (5,065 ) (4,340 ) (2,331 )
Accounts payable and accrued expenses 4,613 3,005 9,693
Unpaid losses and settlement expenses (126,599 ) (13,089 ) 199,267
Unearned premiums (32,289 ) 4,128 16,479
Income taxes: Current (12,250 ) 6,823 (7,187 )
Deferred 3,058 (7,688 ) (3,739 )
Stock option excess tax benefit (2,042 ) (2,930 ) —
Changes in investment in unconsolidated investees: Undistributed earnings (7,315 ) (15,117 ) (10,896 )
Dividends received 5,940 16,500 —
Net loss (proceeds) from trading portfolio activity (343 ) 254 (3,774 )
Net cash provided by operating activities $ 127,023 $ 171,775 $ 198,027
CoNSoLIDaTeD STaTeMeNTS oF CaSH FLowS
43
(continued)
FIN
aN
CIa
L I
NFo
RM
aT
IoN
in thousands, except per share data Years Ended December 31 2007 2006 2005
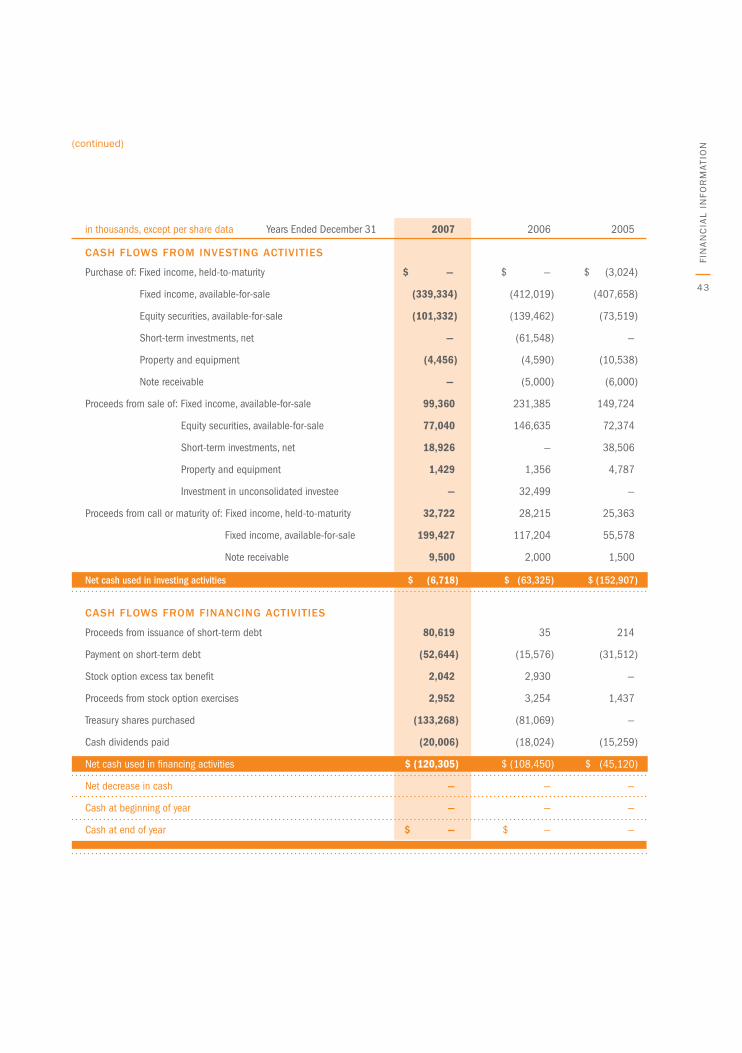
cash floWs fRom InvesTIng acTIvITIes
Purchase of: Fixed income, held-to-maturity $ — $ — $ (3,024 )
Fixed income, available-for-sale (339,334 ) (412,019 ) (407,658 )
Equity securities, available-for-sale (101,332 ) (139,462 ) (73,519 )
Short-term investments, net — (61,548 ) —
Property and equipment (4,456 ) (4,590 ) (10,538 )
Note receivable — (5,000 ) (6,000 )
Proceeds from sale of: Fixed income, available-for-sale 99,360 231,385 149,724
Equity securities, available-for-sale 77,040 146,635 72,374
Short-term investments, net 18,926 — 38,506
Property and equipment 1,429 1,356 4,787
Investment in unconsolidated investee — 32,499 —
Proceeds from call or maturity of: Fixed income, held-to-maturity 32,722 28,215 25,363
Fixed income, available-for-sale 199,427 117,204 55,578
Note receivable 9,500 2,000 1,500
Net cash used in investing activities $ (6,718 ) $ (63,325 ) $ (152,907 )
cash floWs fRom fInancIng acTIvITIes
Proceeds from issuance of short-term debt 80,619 35 214
Payment on short-term debt (52,644 ) (15,576 ) (31,512 )
Stock option excess tax benefit 2,042 2,930 —
Proceeds from stock option exercises 2,952 3,254 1,437
Treasury shares purchased (133,268 ) (81,069 ) —
Cash dividends paid (20,006 ) (18,024 ) (15,259 )
Net cash used in financing activities $ (120,305 ) $ (108,450 ) $ (45,120 )
Net decrease in cash — — —
Cash at beginning of year — — —
Cash at end of year $ — $ — —
44
RL
I a
NN
ua
L R
eP
oR
T 2
00
7
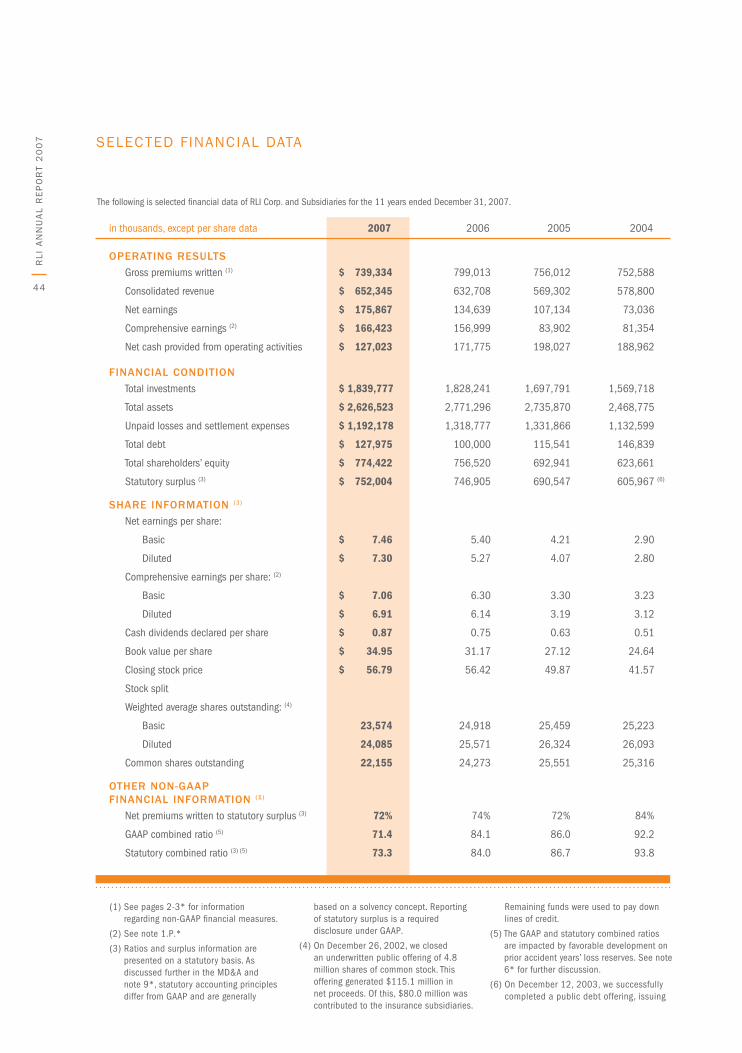
The following is selected financial data of RLI Corp. and Subsidiaries for the 11 years ended December 31, 2007.
in thousands, except per share data 2007 2006 2005 2004
opeRaTIng ResulTs
Gross premiums written (1) $ 739,334 799,013 756,012 752,588
Consolidated revenue $ 652,345 632,708 569,302 578,800
Net earnings $ 175,867 134,639 107,134 73,036
Comprehensive earnings (2) $ 166,423 156,999 83,902 81,354
Net cash provided from operating activities $ 127,023 171,775 198,027 188,962
fInancIal condITIon
Total investments $ 1,839,777 1,828,241 1,697,791 1,569,718
Total assets $ 2,626,523 2,771,296 2,735,870 2,468,775
Unpaid losses and settlement expenses $ 1,192,178 1,318,777 1,331,866 1,132,599
Total debt $ 127,975 100,000 115,541 146,839
Total shareholders’ equity $ 774,422 756,520 692,941 623,661
Statutory surplus (3) $ 752,004 746,905 690,547 605,967 (6)
shaRe InfoRmaTIon (3)
Net earnings per share:
Basic $ 7.46 5.40 4.21 2.90
Diluted $ 7.30 5.27 4.07 2.80
Comprehensive earnings per share: (2)
Basic $ 7.06 6.30 3.30 3.23
Diluted $ 6.91 6.14 3.19 3.12
Cash dividends declared per share $ 0.87 0.75 0.63 0.51
Book value per share $ 34.95 31.17 27.12 24.64
Closing stock price $ 56.79 56.42 49.87 41.57
Stock split
Weighted average shares outstanding: (4)
Basic 23,574 24,918 25,459 25,223
Diluted 24,085 25,571 26,324 26,093
Common shares outstanding 22,155 24,273 25,551 25,316
oTheR non-gaap fInancIal InfoRmaTIon (1)
Net premiums written to statutory surplus (3) 72% 74% 72% 84%
GAAP combined ratio (5) 71.4 84.1 86.0 92.2
Statutory combined ratio (3) (5) 73.3 84.0 86.7 93.8
s(1) See pages 2-3* for information
regarding non-GAAP financial measures.
(2) See note 1.P.*
(3) Ratios and surplus information are presented on a statutory basis. As discussed further in the MD&A and note 9*, statutory accounting principles differ from GAAP and are generally
based on a solvency concept. Reporting of statutory surplus is a required disclosure under GAAP.
(4) On December 26, 2002, we closed an underwritten public offering of 4.8 million shares of common stock. This offering generated $115.1 million in net proceeds. Of this, $80.0 million was contributed to the insurance subsidiaries.
Remaining funds were used to pay down lines of credit.
(5) The GAAP and statutory combined ratios are impacted by favorable development on prior accident years’ loss reserves. See note 6* for further discussion.
(6) On December 12, 2003, we successfully completed a public debt offering, issuing
SeLeCTeD FINaNCIaL DaTa
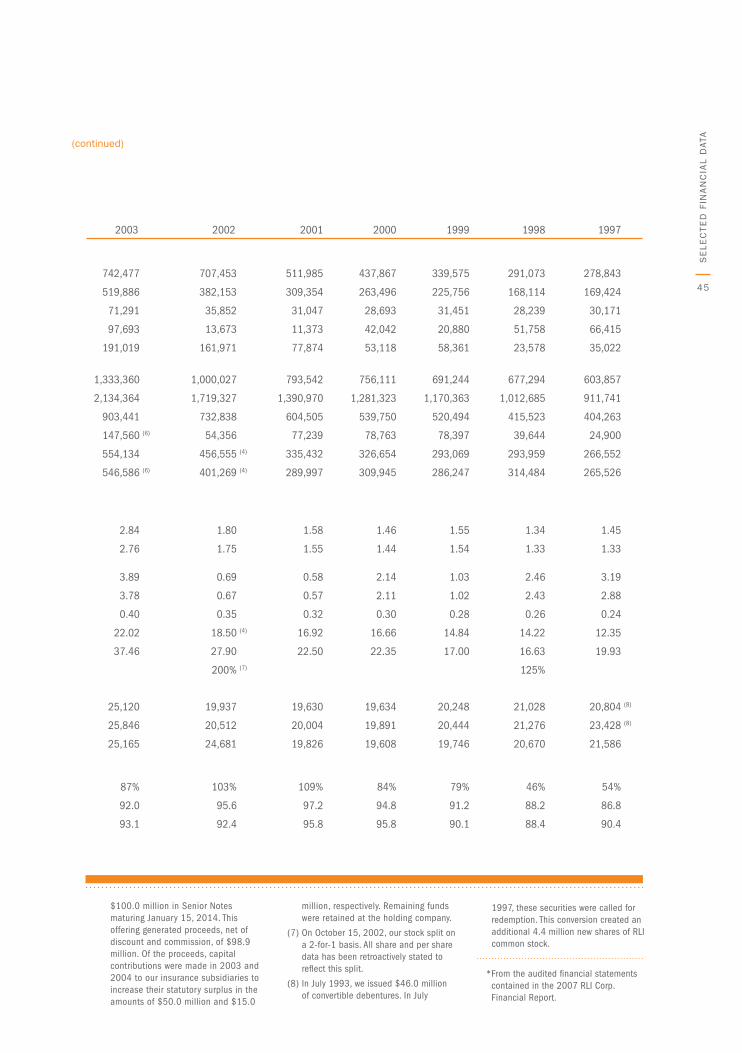
45
$100.0 million in Senior Notes maturing January 15, 2014. This offering generated proceeds, net of discount and commission, of $98.9 million. Of the proceeds, capital contributions were made in 2003 and 2004 to our insurance subsidiaries to increase their statutory surplus in the amounts of $50.0 million and $15.0
million, respectively. Remaining funds were retained at the holding company.
(7) On October 15, 2002, our stock split on a 2-for-1 basis. All share and per share data has been retroactively stated to reflect this split.
(8) In July 1993, we issued $46.0 million of convertible debentures. In July
2003 2002 2001 2000 1999 1998 1997
742,477 707,453 511,985 437,867 339,575 291,073 278,843
519,886 382,153 309,354 263,496 225,756 168,114 169,424
71,291 35,852 31,047 28,693 31,451 28,239 30,171
97,693 13,673 11,373 42,042 20,880 51,758 66,415
191,019 161,971 77,874 53,118 58,361 23,578 35,022
1,333,360 1,000,027 793,542 756,111 691,244 677,294 603,857
2,134,364 1,719,327 1,390,970 1,281,323 1,170,363 1,012,685 911,741
903,441 732,838 604,505 539,750 520,494 415,523 404,263
147,560 (6) 54,356 77,239 78,763 78,397 39,644 24,900
554,134 456,555 (4) 335,432 326,654 293,069 293,959 266,552
546,586 (6) 401,269 (4) 289,997 309,945 286,247 314,484 265,526
2.84 1.80 1.58 1.46 1.55 1.34 1.45
2.76 1.75 1.55 1.44 1.54 1.33 1.33
3.89 0.69 0.58 2.14 1.03 2.46 3.19
3.78 0.67 0.57 2.11 1.02 2.43 2.88
0.40 0.35 0.32 0.30 0.28 0.26 0.24
22.02 18.50 (4) 16.92 16.66 14.84 14.22 12.35
37.46 27.90 22.50 22.35 17.00 16.63 19.93
200% (7) 125%
25,120 19,937 19,630 19,634 20,248 21,028 20,804 (8)
25,846 20,512 20,004 19,891 20,444 21,276 23,428 (8)
25,165 24,681 19,826 19,608 19,746 20,670 21,586
87% 103% 109% 84% 79% 46% 54%
92.0 95.6 97.2 94.8 91.2 88.2 86.8
93.1 92.4 95.8 95.8 90.1 88.4 90.4
(continued)
1997, these securities were called for redemption. This conversion created an additional 4.4 million new shares of RLI common stock.
Se
Le
CT
eD
FIN
aN
CIa
L D
aTa
* From the audited financial statements contained in the 2007 RLI Corp. Financial Report.
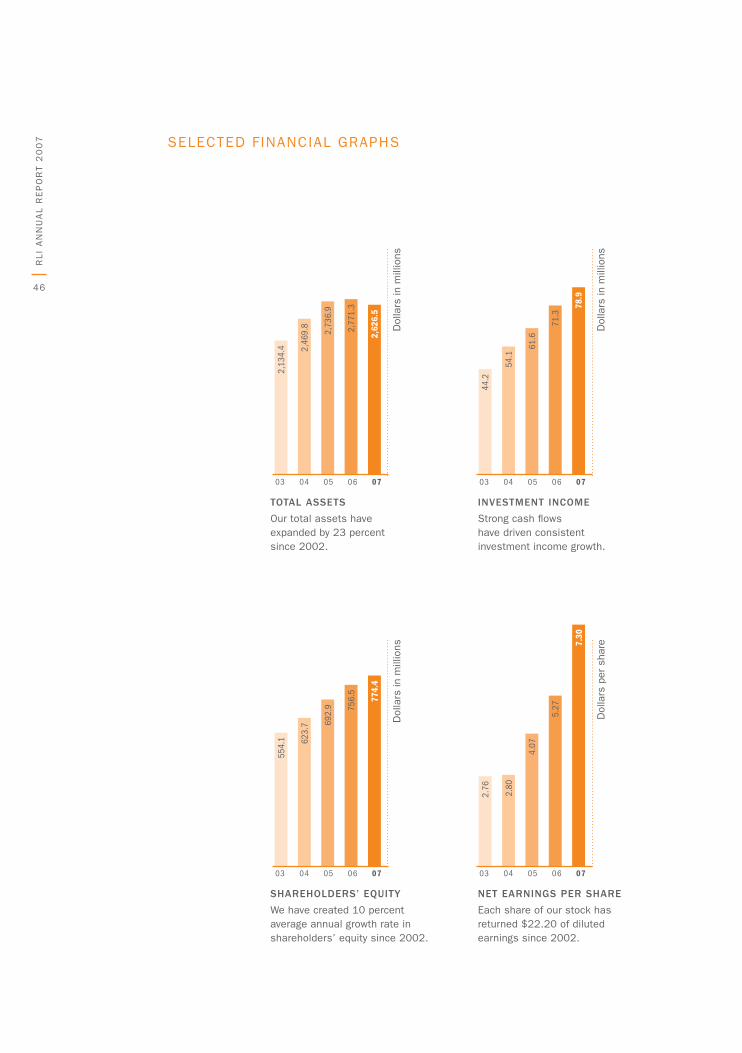
46
RL
I a
NN
ua
L R
eP
oR
T 2
00
7
03 04 05 06 07
2,13
4.4
ToTal asseTs
our total assets have expanded by 23 percent since 2002.
Dol
lars
in m
illio
ns
InvesTmenT Income
Strong cash flows have driven consistent investment income growth.
SeLeCTeD FINaNCIaL gRaPHS
2,46
9.8
2,73
6.9
2,77
1.3
2,62
6.5
03 04 05 06 0744
.2
Dol
lars
in m
illio
ns
54.1
61.6
71.3
78.9
03 04 05 06 07
554.
1
shaReholdeRs’ equITy
we have created 10 percent average annual growth rate in shareholders’ equity since 2002.
Dol
lars
in m
illio
ns
neT eaRnIngs peR shaRe
each share of our stock has returned $22.20 of diluted earnings since 2002.
623.
7 692.
9 756.
5
774.
4
03 04 05 06 07
2.76
Dol
lars
per
sha
re
2.80
4.07
5.27
7.30
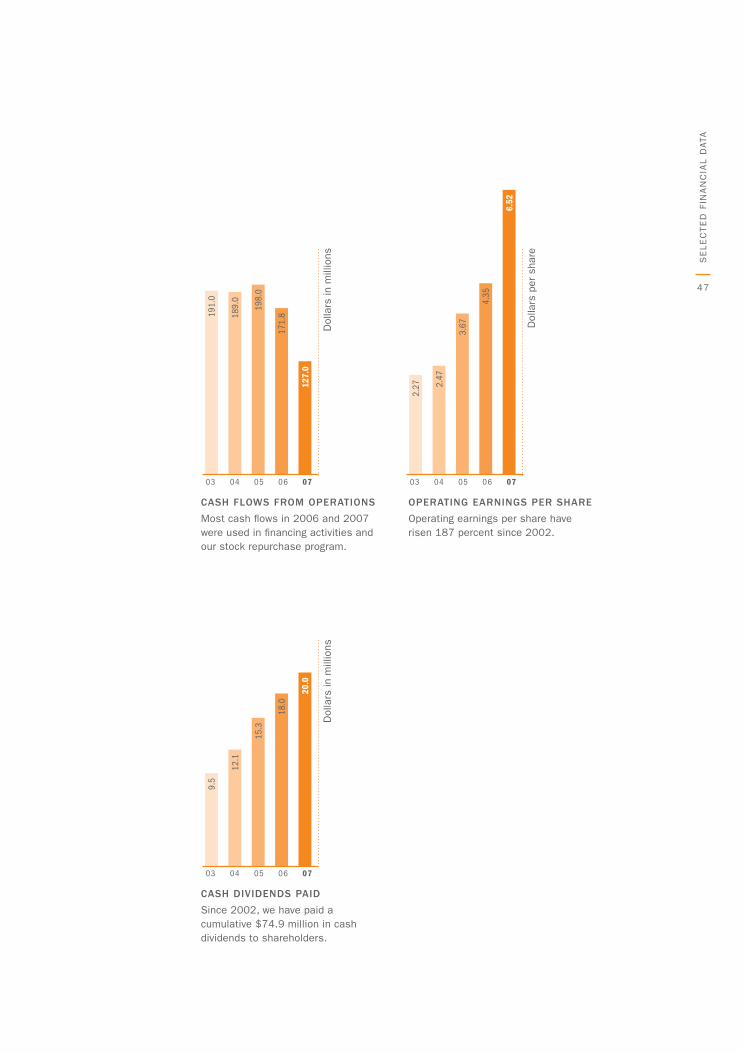
47
03 04 05 06 07
191.
0
cash floWs fRom opeRaTIons
Most cash flows in 2006 and 2007 were used in financing activities and our stock repurchase program.
Dol
lars
in m
illio
ns
opeRaTIng eaRnIngs peR shaRe
operating earnings per share have risen 187 percent since 2002.
189.
0
198.
0
171.
8
127.
0
03 04 05 06 07
2.27
Dol
lars
per
sha
re
2.47
3.67
4.35
6.52
03 04 05 06 07
9.5
cash dIvIdends paId
Since 2002, we have paid a cumulative $74.9 million in cash dividends to shareholders.
Dol
lars
in m
illio
ns
12.1
15.3
18.0
20.0
Se
Le
CT
eD
FIN
aN
CIa
L D
aTa
48
RL
I a
NN
ua
L R
eP
oR
T 2
00
7 gLoSSaRy
admITTed company an insurer domiciled in one state licensed to do business in one or more other states.
combIned RaTIo (gaap) a common measurement of underwriting profit (less than 100) or loss (more than 100). The sum of the expense and the loss ratios, which are based on premiums earned.
combIned RaTIo (sTaTuToRy) The same as a gaaP combined ratio, except in calculating the expense ratio, the denominator used is net premiums written instead of net premiums earned.
compRehensIve eaRnIngs The sum of net after-tax earnings and net after-tax unrealized gains (losses) on investments.
commeRcIal geneRal lIabIlITy InsuRance Liability coverage for all premises and operations, other than personal, for non-excluded general liability hazards.
consolIdaTed Revenue Net premiums earned plus net investment income and realized gains (losses).
dIffeRence In condITIons (dIc) InsuRance Coverage for loss normally excluded in standard commercial or personal property policies, particularly flood and earthquake.
excess InsuRance a policy or bond covering against certain hazards, only in excess of a stated amount.
expense RaTIo The percentage of the premium used to pay all the costs of acquiring, writing, and servicing business.
fIRe InsuRance Property insurance on which the predominant peril is fire, but generally includes wind and other lines.
gaap generally accepted accounting principles.
haRd/fIRm maRkeT when the insurance industry has limited capacity available to handle the amount of business written, creating a seller’s market, driving insurance prices upward.
Inland maRIne InsuRance Property coverage for perils arising from transportation of goods or covering types of property that are mobile, and other hazards.
loss RaTIo The percentage of premium used to pay for losses incurred.
maRkeT cap Short for market capitalization. The value of a company as determined by the market. Multiply the share price by the number of outstanding shares. Can change daily.
maRkeT value poTenTIal (mvp) an RLI incentive plan covering all employees that requires we first generate a return in excess of our cost of capital, aligning our interests with those of shareholders.
pRofessIonal lIabIlITy InsuRance Insures against claims for damages due to professional misconduct or lack of ordinary care in the performance of a service.
ReInsuReR/ReInsuRance a company that accepts part or all of the risk of loss covered by another insurer. Insurance for insurers.
ReseRves Funds set aside by an insurer for meeting estimated obligations when due. Periodically readjusted.
sofT maRkeT when the insurance industry has excess capacity to handle the amount of business written, creating a buyer’s market, lowering insurance prices overall.
sTandaRd lInes vs. specIalTy lInes Those insurance coverages or target market segments that are commonly insured through large, admitted insurers using standard forms and pricing are in contrast to unique insurance coverages or selected market niches that are served by only a single insurer or a select group of insurers, often with unique coverage forms and pricing approach.
suReTy bond Provides for compensation if specific acts are not performed within a stated period.
suRplus lInes company In most states, an insurer not licensed to do business in that state, but which may sell insurance in the state if admitted insurers decline to write a risk.
TRanspoRTaTIon InsuRance Coverage for transporting people or goods by land. For RLI, this involves motor vehicle transportation and focuses on automobile liability and physical damage, with incidental public liability, umbrella and excess liability, and motor truck cargo insurance.
unRealIzed gaIns (losses) The result of an increase (decrease) in fair value of an asset which is not recognized in the traditional statement of income. The difference between an asset’s fair and book values.
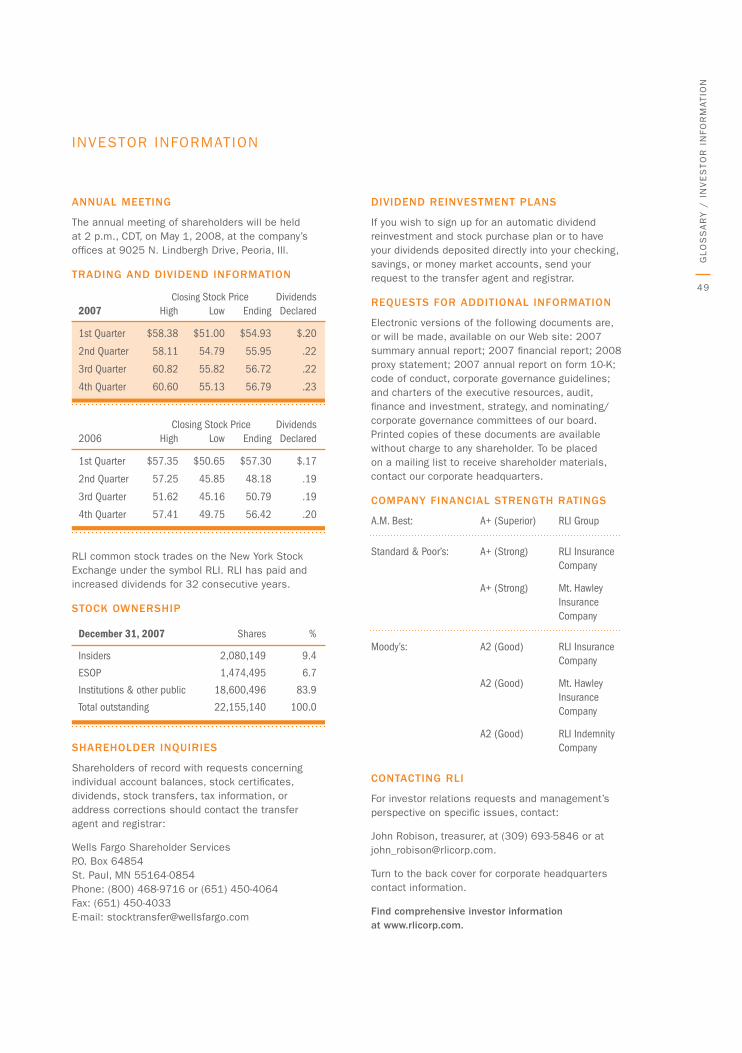
49
INVeSToR INFoRMaTIoN
annual meeTIng
The annual meeting of shareholders will be held at 2 p.m., CDT, on May 1, 2008, at the company’s offices at 9025 N. Lindbergh Drive, Peoria, Ill.
TRadIng and dIvIdend InfoRmaTIon
Closing Stock Price Dividends2007 High Low Ending Declared
1st Quarter $58.38 $51.00 $54.93 $.20
2nd Quarter 58.11 54.79 55.95 .22
3rd Quarter 60.82 55.82 56.72 .22
4th Quarter 60.60 55.13 56.79 .23
Closing Stock Price Dividends2006 High Low Ending Declared
1st Quarter $57.35 $50.65 $57.30 $.17
2nd Quarter 57.25 45.85 48.18 .19
3rd Quarter 51.62 45.16 50.79 .19
4th Quarter 57.41 49.75 56.42 .20
RLI common stock trades on the New york Stock exchange under the symbol RLI. RLI has paid and increased dividends for 32 consecutive years.
sTock oWneRshIp
December 31, 2007 Shares %
Insiders 2,080,149 9.4
ESOP 1,474,495 6.7
Institutions & other public 18,600,496 83.9
Total outstanding 22,155,140 100.0
shaReholdeR InquIRIes
Shareholders of record with requests concerning individual account balances, stock certificates, dividends, stock transfers, tax information, or address corrections should contact the transfer agent and registrar:
wells Fargo Shareholder Services P.o. box 64854 St. Paul, MN 55164-0854 Phone: (800) 468-9716 or (651) 450-4064 Fax: (651) 450-4033 e-mail: [email protected]
dIvIdend ReInvesTmenT plans
If you wish to sign up for an automatic dividend reinvestment and stock purchase plan or to have your dividends deposited directly into your checking, savings, or money market accounts, send your request to the transfer agent and registrar.
RequesTs foR addITIonal InfoRmaTIon
electronic versions of the following documents are, or will be made, available on our web site: 2007 summary annual report; 2007 financial report; 2008 proxy statement; 2007 annual report on form 10-k; code of conduct, corporate governance guidelines; and charters of the executive resources, audit, finance and investment, strategy, and nominating/corporate governance committees of our board. Printed copies of these documents are available without charge to any shareholder. To be placed on a mailing list to receive shareholder materials, contact our corporate headquarters.
company fInancIal sTRengTh RaTIngs
A.M. Best: A+ (Superior) RLI Group
Standard & Poor’s: A+ (Strong) RLI Insurance Company
A+ (Strong) Mt. Hawley Insurance Company
Moody’s: A2 (Good) RLI Insurance Company
A2 (Good) Mt. Hawley Insurance Company
A2 (Good) RLI Indemnity Company
conTacTIng RlI
For investor relations requests and management’s perspective on specific issues, contact:
John Robison, treasurer, at (309) 693-5846 or at [email protected].
Turn to the back cover for corporate headquarters contact information.
find comprehensive investor information at www.rlicorp.com.
gL
oS
Sa
Ry
/ I
NV
eS
To
R I
NFo
RM
aT
IoN
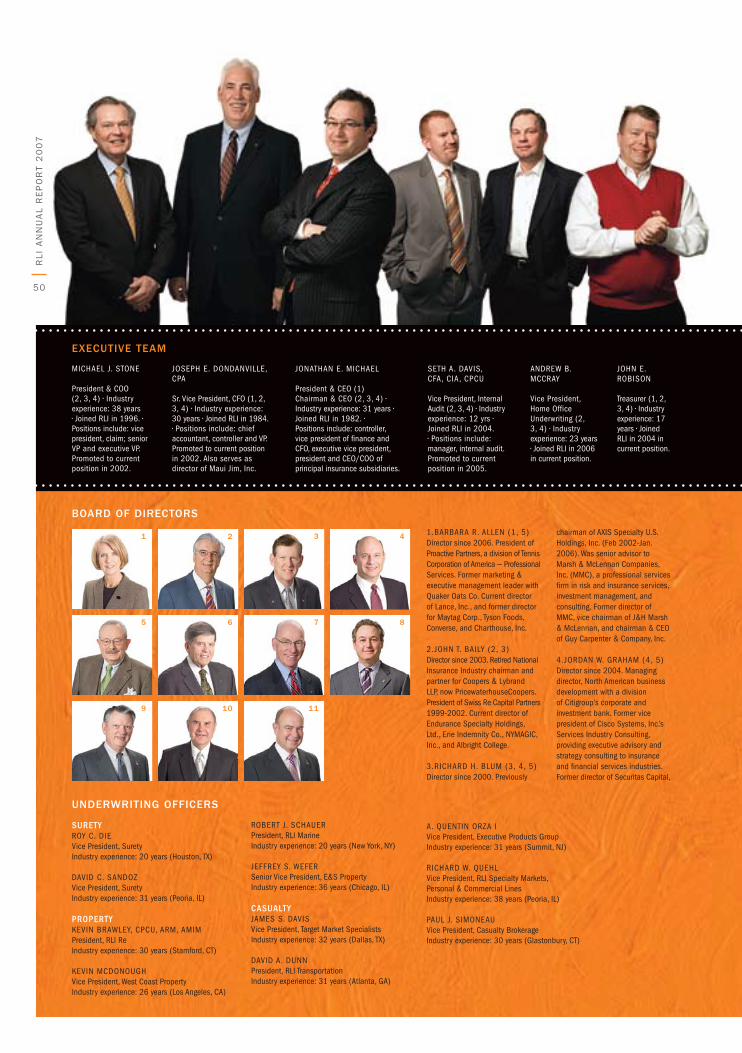
50
RL
I a
NN
ua
L R
eP
oR
T 2
00
7
MICHAEL J. STONE
President & COO (2, 3, 4) • Industry experience: 38 years • Joined RLI in 1996. • Positions include: vice president, claim; senior VP and executive VP. Promoted to current position in 2002.
JOSEPH E. DONDANVILLE, CPA
Sr. Vice President, CFO (1, 2, 3, 4) • Industry experience: 30 years • Joined RLI in 1984. • Positions include: chief accountant, controller and VP. Promoted to current position in 2002. Also serves as director of Maui Jim, Inc.
JONATHAN E. MICHAEL President & CEO (1) Chairman & CEO (2, 3, 4) • Industry experience: 31 years • Joined RLI in 1982. • Positions include: controller, vice president of finance and CFO, executive vice president, president and CEO/COO of principal insurance subsidiaries.
SETH A. DAVIS, CFA, CIA, CPCU
Vice President, Internal Audit (2, 3, 4) • Industry experience: 12 yrs • Joined RLI in 2004. • Positions include: manager, internal audit. Promoted to current position in 2005.
ANDREW B. MCCRAY
Vice President, Home Office Underwriting (2, 3, 4) • Industry experience: 23 years • Joined RLI in 2006 in current position.
JOHN E. ROBISON
Treasurer (1, 2, 3, 4) • Industry experience: 17 years • Joined RLI in 2004 in current position.
boaRd of dIRecToRs
execuTIve Team
undeRWRITIng offIceRs
1.BARBARA R. ALLEN (1, 5)Director since 2006. President of Proactive Partners, a division of Tennis Corporation of America — Professional Services. Former marketing & executive management leader with Quaker Oats Co. Current director of Lance, Inc., and former director for Maytag Corp., Tyson Foods, Converse, and Charthouse, Inc.
2.JOHN T. BAILY (2, 3)Director since 2003. Retired National Insurance Industry chairman and partner for Coopers & Lybrand LLP, now PricewaterhouseCoopers. President of Swiss Re Capital Partners 1999-2002. Current director of Endurance Specialty Holdings, Ltd., Erie Indemnity Co., NYMAGIC, Inc., and Albright College.
3.RICHARD H. BLUM (3, 4, 5)Director since 2000. Previously
chairman of AXIS Specialty U.S. Holdings, Inc. (Feb 2002-Jan. 2006). Was senior advisor to Marsh & McLennan Companies, Inc. (MMC), a professional services firm in risk and insurance services, investment management, and consulting. Former director of MMC, vice chairman of J&H Marsh & McLennan, and chairman & CEO of Guy Carpenter & Company, Inc.
4.JORDAN W. GRAHAM (4, 5)Director since 2004. Managing director, North American business development with a division of Citigroup’s corporate and investment bank. Former vice president of Cisco Systems, Inc.’s Services Industry Consulting, providing executive advisory and strategy consulting to insurance and financial services industries. Former director of Securitas Capital,
5 6
9
7
10
surETyROY C. DIEVice President, Surety Industry experience: 20 years (Houston, TX)
DAVID C. SANDOzVice President, Surety Industry experience: 31 years (Peoria, IL)
prOpErTy KEVIN BRAWLEY, CPCU, ARM, AMIM President, RLI ReIndustry experience: 30 years (Stamford, CT)
KEVIN MCDONOUGHVice President, West Coast Property Industry experience: 26 years (Los Angeles, CA)
ROBERT J. SCHAUERPresident, RLI Marine Industry experience: 20 years (New York, NY)
JEFFREY S. WEFERSenior Vice President, E&S Property Industry experience: 36 years (Chicago, IL)
CasualTy JAMES S. DAVISVice President, Target Market Specialists Industry experience: 32 years (Dallas, TX)
DAVID A. DUNNPresident, RLI Transportation Industry experience: 31 years (Atlanta, GA)
A. QUENTIN ORzA IVice President, Executive Products Group Industry experience: 31 years (Summit, NJ) RICHARD W. QUEHLVice President, RLI Specialty Markets, Personal & Commercial Lines Industry experience: 38 years (Peoria, IL)
PAUL J. SIMONEAUVice President, Casualty Brokerage Industry experience: 30 years (Glastonbury, CT)
1 2 3 4
8
11
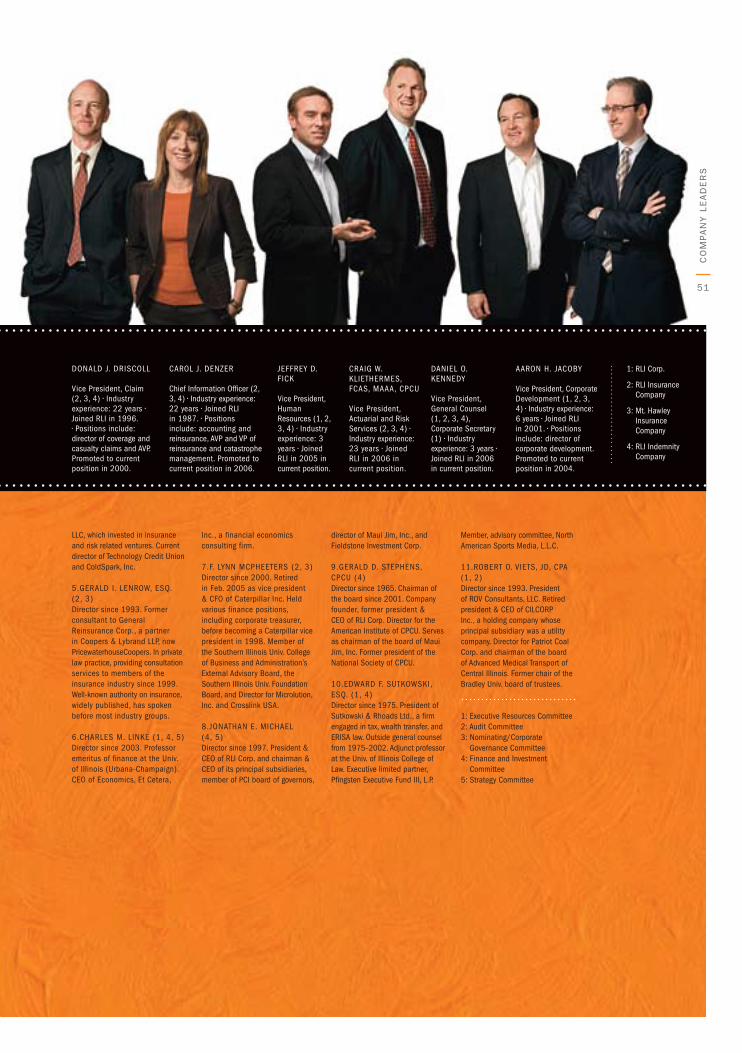
51
DONALD J. DRISCOLL
Vice President, Claim (2, 3, 4) • Industry experience: 22 years • Joined RLI in 1996. • Positions include: director of coverage and casualty claims and AVP. Promoted to current position in 2000.
CAROL J. DENzER
Chief Information Officer (2, 3, 4) • Industry experience: 22 years • Joined RLI in 1987. • Positions include: accounting and reinsurance, AVP and VP of reinsurance and catastrophe management. Promoted to current position in 2006.
JEFFREY D. FICK
Vice President, Human Resources (1, 2, 3, 4) • Industry experience: 3 years • Joined RLI in 2005 in current position.
DANIEL O. KENNEDY
Vice President, General Counsel (1, 2, 3, 4), Corporate Secretary (1) • Industry experience: 3 years • Joined RLI in 2006 in current position.
1: RLI Corp.
2: RLI Insurance Company
3: Mt. Hawley Insurance Company
4: RLI Indemnity Company
CRAIG W. KLIETHERMES, FCAS, MAAA, CPCU
Vice President, Actuarial and Risk Services (2, 3, 4) • Industry experience: 23 years • Joined RLI in 2006 in current position.
AARON H. JACOBY
Vice President, Corporate Development (1, 2, 3, 4) • Industry experience: 6 years • Joined RLI in 2001. • Positions include: director of corporate development. Promoted to current position in 2004.
LLC, which invested in insurance and risk related ventures. Current director of Technology Credit Union and ColdSpark, Inc.
5.GERALD I. LENROW, ESQ. (2, 3)Director since 1993. Former consultant to General Reinsurance Corp., a partner in Coopers & Lybrand LLP, now PricewaterhouseCoopers. In private law practice, providing consultation services to members of the insurance industry since 1999. Well-known authority on insurance, widely published, has spoken before most industry groups.
6.CHARLES M. LINKE (1, 4, 5)Director since 2003. Professor emeritus of finance at the Univ. of Illinois (Urbana-Champaign). CEO of Economics, Et Cetera,
Inc., a financial economics consulting firm.
7.F. LYNN MCPHEETERS (2, 3)Director since 2000. Retired in Feb. 2005 as vice president & CFO of Caterpillar Inc. Held various finance positions, including corporate treasurer, before becoming a Caterpillar vice president in 1998. Member of the Southern Illinois Univ. College of Business and Administration’s External Advisory Board, the Southern Illinois Univ. Foundation Board, and Director for Microlution, Inc. and Crosslink USA.
8.JONATHAN E. MICHAEL (4, 5)Director since 1997. President & CEO of RLI Corp. and chairman & CEO of its principal subsidiaries, member of PCI board of governors,
director of Maui Jim, Inc., and Fieldstone Investment Corp.
9.GERALD D. STEPHENS, CPCU (4)Director since 1965. Chairman of the board since 2001. Company founder, former president & CEO of RLI Corp. Director for the American Institute of CPCU. Serves as chairman of the board of Maui Jim, Inc. Former president of the National Society of CPCU.
10.EDWARD F. SUTKOWSKI, ESQ. (1, 4)Director since 1975. President of Sutkowski & Rhoads Ltd., a firm engaged in tax, wealth transfer, and ERISA law. Outside general counsel from 1975–2002. Adjunct professor at the Univ. of Illinois College of Law. Executive limited partner, Pfingsten Executive Fund III, L.P.
Member, advisory committee, North American Sports Media, L.L.C.
11.ROBERT O. VIETS, JD, CPA (1, 2)Director since 1993. President of ROV Consultants, LLC. Retired president & CEO of CILCORP Inc., a holding company whose principal subsidiary was a utility company. Director for Patriot Coal Corp. and chairman of the board of Advanced Medical Transport of Central Illinois. Former chair of the Bradley Univ. board of trustees.
1: Executive Resources Committee2: Audit Committee3: Nominating/Corporate
Governance Committee4: Finance and Investment
Committee5: Strategy Committee
Co
MP
aN
y L
ea
De
RS

RLI is a place where talented
people experience the magic of
entrepreneurship and the power of the
rewards it fosters. It is also a place that
provides protection against the threat
of misfortune and the peril of mishap.
The central figure in this illustration
represents the RLI underwriter, who
holds his brokers’ and customers’ best
interests above everything else. It also
represents the RLI employee serving
customers and coworkers in cities,
towns, and countrysides throughout
our land. He protects our insureds from
the swirling clouds that threaten their
businesses and their world.
abouT The IllusTRaTIon

9025 N. Lindbergh Drive, Peoria, IL 61615-1431 T 309-692-1000, 800-331-4929 F 309-692-1068 www.rlicorp.com©2008 RLI Corp.FP0308 5M