Embed Size (px)
Citation preview

Welcome to the PresentationWelcome to the PresentationPresentation Topic: “Promotional Initiatives for Creating
Customer Awareness in Computer Industry; A Study on HP."
Presentation Topic: “Promotional Initiatives for Creating Customer Awareness in Computer Industry;
A Study on HP."

IntroductionIntroduction
The basic scope of conducting this study was to analyze the promotional strategy and activities of Computer Source Ltd to create customer awareness. Here the report covered a little portion of their performance because they represent products from 43 reputed multinational brands. Since it’s a vast number of product line, I have shown the popular brand HP as the example. I collected information from the annual and periodic reports of the Company, face to face discussion with management, regular conversations with employee, questionnaire survey and other relevant sources, by working in some IT fairs, organizing some events and used those for the study purpose.
The basic scope of conducting this study was to analyze the promotional strategy and activities of Computer Source Ltd to create customer awareness. Here the report covered a little portion of their performance because they represent products from 43 reputed multinational brands. Since it’s a vast number of product line, I have shown the popular brand HP as the example. I collected information from the annual and periodic reports of the Company, face to face discussion with management, regular conversations with employee, questionnaire survey and other relevant sources, by working in some IT fairs, organizing some events and used those for the study purpose.

Objective of the ReportObjective of the Report
Broad Objective
The broad objective of the study is to understand the relationship between the promotional initiatives and customer awareness in the context of Computer Source Ltd.
Specific Objectives
i) To identify different promotional tools used by Computer Source Ltd create brand awareness about different computer brands
ii) To identify the Brand Performance of HP by using perception testiii) To identify the level of Customer Satisfaction related to
promotional initiatives of Computer Source Ltd regarding HP brandiv) To understand the relation between Customer Awareness and
satisfaction about Promotional Initiatives using regression analysis

Sample PlanSample Plan
#Population: The target population of this survey includes all the customers of computer product within the age of 20 to 50 years.
# Sample Unit: Existing customers of computer brands within the age of 20 to 50 years of Dhaka city have been considered here. The data were collected from the BCS Computer City, Agargaon.
# Sample Frame: There is no concrete list or number of customers belonging to the population.
# Sampling Procedure: Non-probability convenience sampling procedure has been used. Mainly mall intercept method is used for questionnaire survey. The total sample size for this study is 100 customers within the age of 20-50 years.
# Fieldwork/ Data Collection: The questionnaire survey has been executed in BCS Computer City, Agargaon in Dhaka city.
LimitationsLimitations
Though I tried my level best in preparing this report, some limitations were yet present there:
Unavailability of required secondary data in this area Lack of instrumental facilities to get proper information. Lack of available previous research works in this area for
guidance.
Though I tried my level best in preparing this report, some limitations were yet present there:
Unavailability of required secondary data in this area Lack of instrumental facilities to get proper information. Lack of available previous research works in this area for
guidance.

Company ProfileCompany Profile
Computer Source Ltd is the largest technology distributor of Bangladesh and a leading technology sales, marketing and logistics company. Computer Source provides comprehensive ICT solutions to its corporate partners. They create sales & profitability opportunities for their business partners and resellers through unique marketing initiatives, logistics services, technical supports, and financial support services. Since its beginning in 1993, Computer Source has connected technology solution providers with users nationwide, identifying markets and technologies that shape the IT industry. Today, Computer Source remains at the forefront of the technology marketplace, bringing the latest products and services to market and finding new ways to bring value to our customers. The company offers a broad array of solutions and services to thousands by distributing and marketing IT products from nearly 43 suppliers.
Computer Source Ltd is the largest technology distributor of Bangladesh and a leading technology sales, marketing and logistics company. Computer Source provides comprehensive ICT solutions to its corporate partners. They create sales & profitability opportunities for their business partners and resellers through unique marketing initiatives, logistics services, technical supports, and financial support services. Since its beginning in 1993, Computer Source has connected technology solution providers with users nationwide, identifying markets and technologies that shape the IT industry. Today, Computer Source remains at the forefront of the technology marketplace, bringing the latest products and services to market and finding new ways to bring value to our customers. The company offers a broad array of solutions and services to thousands by distributing and marketing IT products from nearly 43 suppliers.

Brand PortfolioBrand Portfolio

Questionnaire AnalysisDemographic Analysis
Questionnaire AnalysisDemographic Analysis

Gender DistributionGender Distribution
Male 57%
Female43%

Age DistributionAge Distribution
40%
37%
10%8%
5%
20-25 years25-30 years30-35 years35-40 yearsAbove 40

Educational LevelEducational Level
Below SSC HSC Graduation Post Garduation Others0%
5%
10%
15%
20%
25%
30%
35%
40%
45%
10%
15%
45%
25%
5%

Questionnaire AnalysisGeneral Analysis
Questionnaire AnalysisGeneral Analysis

Overview of product type preferenceOverview of product type preference
Monitor Netbook Laptop Key-board
Mouse Sound-box
Percent-age
0.05 0.25 0.4 0.12 0.08 0.1
3%
8%
13%
18%
23%
28%
33%
38%

Brand AwarenessBrand Awareness
95%
5%
Yes
No

Recalling of brandRecalling of brand
85%
15%
Yes
No

Confidence level AnalysisConfidence level Analysis
Poorly Confident
Less Confident
Medium
Confident
Fully Confident
0% 10% 20% 30% 40% 50% 60% 70% 80%
2%
5%
3%
15%
75%

Awareness about the brand HP
Awareness about the brand HP
Strongly Agree
Agree Neutral Disagree Strongly Disagree
0%
5%
10%
15%
20%
25%
30% 25%
30%
17%15%
13%

Brand PreferenceBrand Preference
15%
3%
20%
17%
15%
25%
5%
HPAppleSamsungDellAsusAcerOthers

Factors influencing brand preferences
Factors influencing brand preferences
20%
17%
13%15%
17%
15%3%
QualityPriceDurabilityReliabiltyInnovativenessPromotionsOthers

Questionnaire AnalysisBrand Awareness Analysis
Questionnaire AnalysisBrand Awareness Analysis

Sources of information about the brand HPSources of information about the brand HP
25%
13%
23%
10%
12%
7%
10%5%
Leaflet
Poster
Newspaper Ad
Mgazine Ad
Billboard
Retail Shop
Fair
Campaign

Fulfillment of expectation regarding the brand HP
Fulfillment of expectation regarding the brand HP
YesNo
0%
10%
20%
30%
40%
50%
60%
70%
70%
30%

Recalling of Brand ElementRecalling of Brand Element
0%
5%
10%
15%
20%
25%
30%

Questionnaire AnalysisPerception Test
Questionnaire AnalysisPerception Test

Measuring Perception about QualityMeasuring Perception about Quality
Name of the brand
Total Score
Average Recommendation Rank
HP 532 5.32 Good Quality 4th
Apple 675 6.75 Very Good Quality
1st
Dell 558 5.58 Good Quality 3rd
Samsung 619 6.19 Very Good Quality 2nd
Acre 456 4.56 Average Quality 5th
Asus 423 4.23 Average Quality 6th

Measuring Perception about PriceMeasuring Perception about Price
Name of the Brand
Total Score
Average
Recommendation
Rank
HP 437 4.37 Affordable Price 2nd
Apple 114 1.14 Very High Price 6th
Samsung 451 4.51 Affordable Price 1st
Dell 418 4.18 Affordable Price 4th
Acer 325 3.25 High Price 5th
Asus 422 4.22 Affordable Price 3rd
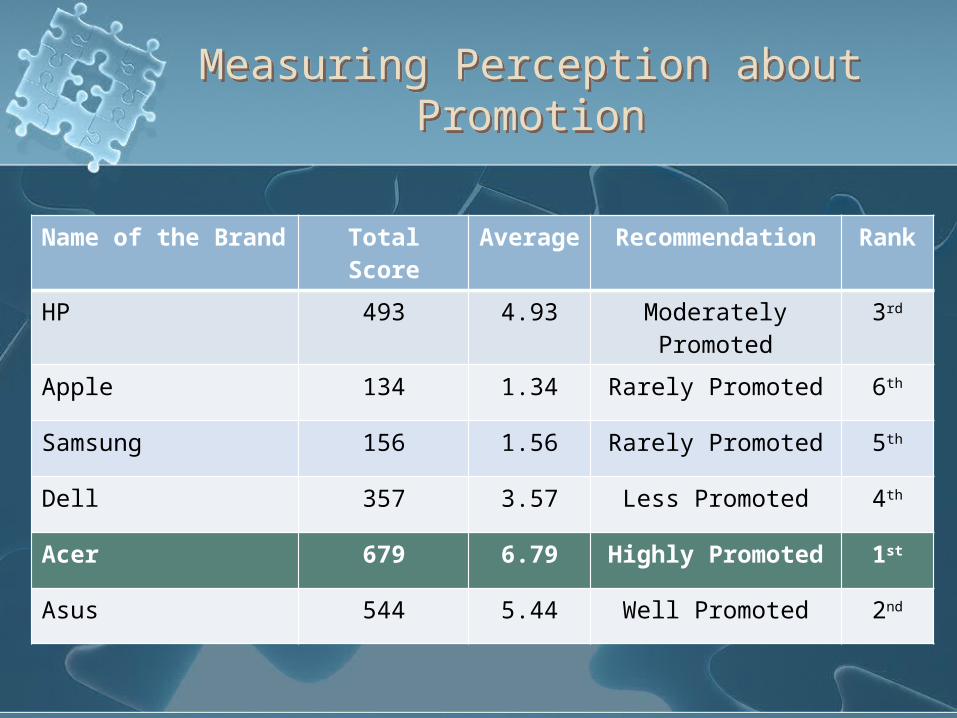
Measuring Perception about Promotion
Measuring Perception about Promotion
Name of the Brand
Total Score Average
Recommendation
Rank
HP 493 4.93 Moderately Promoted
3rd
Apple 134 1.34 Rarely Promoted 6th
Samsung 156 1.56 Rarely Promoted 5th
Dell 357 3.57 Less Promoted 4th
Acer 679 6.79 Highly Promoted 1st
Asus 544 5.44 Well Promoted 2nd

Measuring Perception about Attractiveness
Measuring Perception about Attractiveness
Name of the Brand
Total Score Average
Recommendation
Rank
HP 433 4.33 Moderately Attractive
6th
Apple 575 5.75 Quite Attractive 2nd
Samsung 501 5.01 Quite Attractive 3rd
Dell 597 5.97 Quite Attractive 1st
Acer 435 4.35 Highly Attractive 5th
Asus 453 4.53 Quite Attractive 4th

Measuring Perception about Overall Brand Performance
Measuring Perception about Overall Brand Performance
Brand Name
Quality
Price Promotion
Attractiveness
Total Scor
e
Overall Positio
n
HP 4 2 3 6 15 3rd
Apple 1 6 6 2 15 3rd
Samsung 3 1 5 3 12 2nd
Dell 2 4 4 1 11 1st
Acer 5 5 1 5 16 4th
Asus 6 3 2 4 15 3rd

Questionnaire AnalysisPromotional Effectiveness TestQuestionnaire Analysis
Promotional Effectiveness Test

Promotion of HPPromotion of HP
Fully Agree Agree Neither agree or disagree
Disagree Fully Disagree
0%
10%
20%
30%
40%
50%
60%
55%
27%
13% 3% 2%

Percentage of purchasing after watching the advertisement
Percentage of purchasing after watching the advertisement
Fully Agree Agree Neither agree or disagree
Disagree Fully Disagree
0%
5%
10%
15%
20%
25%
30%
35%
28%22%
5%
35%
10%

Importance of promotional tools to create brand awareness
Importance of promotional tools to create brand awareness
Fully Agree Agree Neither agree or disagree
Disagree Fully Disagree
0%
10%
20%
30%
40%
50%
60%
70%
63%
27%
6% 3% 1%
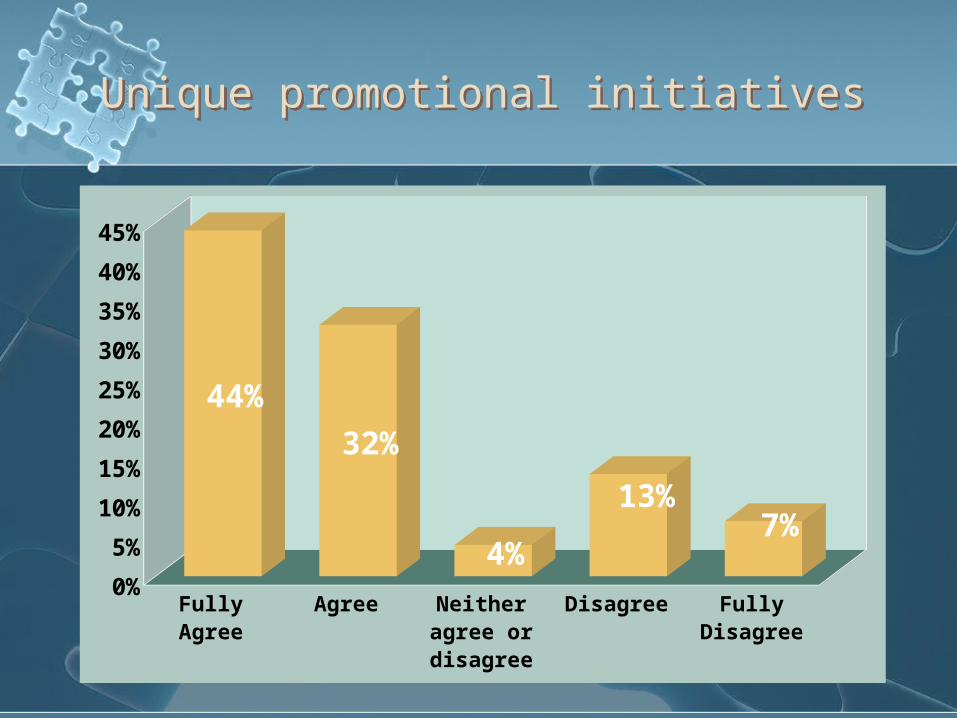
Unique promotional initiativesUnique promotional initiatives
Fully Agree Agree Neither agree or disagree
Disagree Fully Disagree
0%
5%
10%
15%
20%
25%
30%
35%
40%
45%
44%
32%
4%
13%7%

Satisfied with the product qualitySatisfied with the product quality
Fully Agree Agree Neither agree or disagree
Disagree Fully Disagree
0%
5%
10%
15%
20%
25%
30%
35%
33%31%
2%
17% 17%

Satisfaction about the offeringSatisfaction about the offering
Fully Agree Agree Neither agree or disagree
Disagree Fully Disagree
0%
5%
10%
15%
20%
25%
30%
35%
40%
45%
50%
37%49%
7% 5% 2%

Evaluation of HP as a wholeEvaluation of HP as a whole
Fully Agree Agree Neither agree or disagree
Disagree Fully Disagree
0%
5%
10%
15%
20%
25%
30%
35%
15%
35%
2%
27%21%

Impact of promotional toolsImpact of promotional tools
Fully Agree Agree Neither agree or disagree
Disagree Fully Disagree
0%
5%
10%
15%
20%
25%
30%
35%
40%
45%
41%38%
11%3% 7%

Recalling Advertisement of HPRecalling Advertisement of HP
Yes No0%
10%20%30%40%50%60%70%80%90%
100%89%
11%

Satisfaction level about the advertisement
Satisfaction level about the advertisement
Fully Satisfied Satisfied Neutral DissatisfiedFully Dissatisfied0%
10%
20%
30%
40%
50%
60%
51%
20% 15%5% 9%

Recalling Billboard Advertisement of HP
Recalling Billboard Advertisement of HP
Yes No0%
10%20%30%40%50%60%70%80%90%
78%
22%

Satisfaction level about the billboard advertisement
Satisfaction level about the billboard advertisement
Fully Satisfied Satisfied Neutral DissatisfiedFully Dissatisfied0%
5%
10%
15%
20%
25%
30%
35%
40%
45%
43%
28%
14%7% 8%

Recalling Leaflet Advertisement of HP
Recalling Leaflet Advertisement of HP
Yes No0%
10%
20%
30%
40%
50%
60%
70%
80%
67%
33%

Satisfaction level about the leaflet advertisement
Satisfaction level about the leaflet advertisement
Fully Satisfied Satisfied Neutral DissatisfiedFully Dissatisfied0%5%
10%15%20%25%30%35%40%45%50%
50%
20% 19%10% 9%

Recalling In-house Branding of HPRecalling In-house Branding of HP
Yes No0%
10%
20%
30%
40%
50%
60%
70%
80%
90%81%
19%

Satisfaction level about the In-house Branding
Satisfaction level about the In-house Branding
Fully Satisfied Satisfied Neutral Dissatisfied Fully Dissatisfied0%
10%
20%
30%
40%
50%
60%
55%
20%15%
4% 6%

Recalling Poster Advertisement of HPRecalling Poster Advertisement of HP
Yes No0%
10%
20%
30%
40%
50%
60%
70%63%
37%

Satisfaction level about the poster advertisement
Satisfaction level about the poster advertisement
Fully Satisfied Satisfied Neutral DissatisfiedFully Dissatisfied0%
5%
10%
15%
20%
25%
30%
35%
35%
30%
20%
6% 9%

Recalling Event of HPRecalling Event of HP
Yes No0%
10%
20%
30%
40%
50%
60%
70%
80%
90% 85%
15%

Satisfaction level about the eventSatisfaction level about the event
Fully Satisfied Satisfied Neutral Dissatisfied Fully Dissatisfied0%
10%
20%
30%
40%
50%
60%
53%
22%
10% 8% 7%

Ranking promotional tools according to their positive impact on creating Brand
Awareness
Ranking promotional tools according to their positive impact on creating Brand
Awareness
Promotional Tools Total Score Average Rank
Advertisement 351 3.51 3rd
Billboard 284 2.84 2nd
Leaflet 457 4.57 4th
Poster 632 6.32 6th
In-house Branding 196 1.96 1st
Event 523 5.23 5th
Sponsor 655 6.55 7th

Questionnaire AnalysisRegression Analysis
Questionnaire AnalysisRegression Analysis
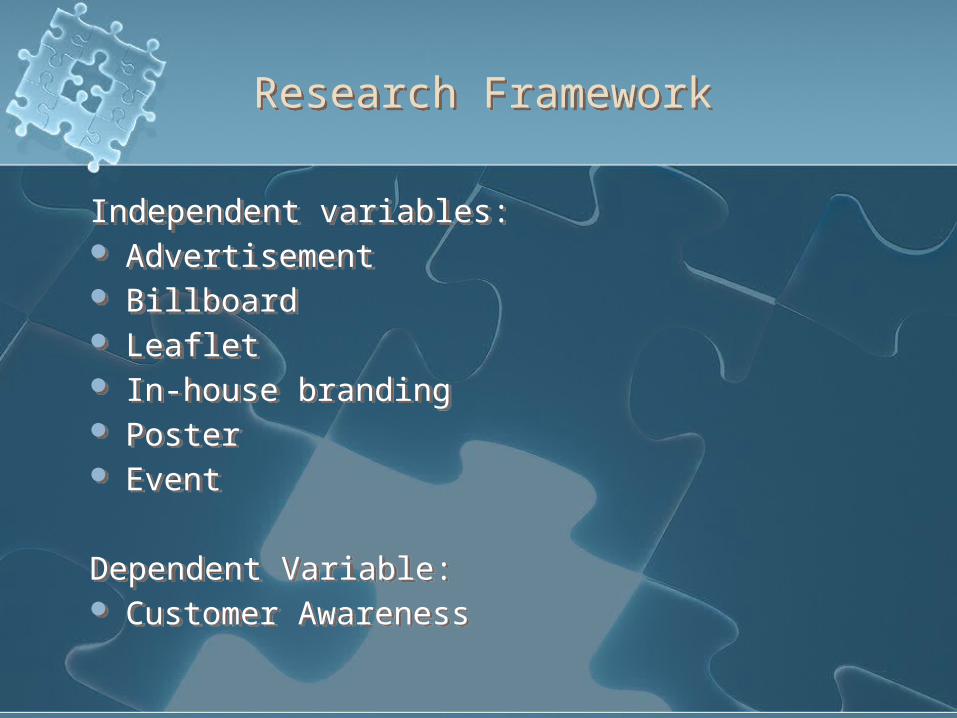
Research FrameworkResearch Framework
Independent variables: Advertisement Billboard Leaflet In-house branding Poster Event
Dependent Variable: Customer Awareness
Independent variables: Advertisement Billboard Leaflet In-house branding Poster Event
Dependent Variable: Customer Awareness

Model DevelopmentModel Development
Customer Awareness = f (Advertisement, Billboard, Leaflet, In house branding, Poster and Event). Using the function a regression model can be estimated to find out the impact of the independent variables on customer awareness.
Y = α + β1X1 + β2X2 + β3X3 + β4X4 + β5X5 + β6X6
Where, Y = Customer AwarenessX1= Advertisement
X2= Billboard
X3= Leaflet
X4= In-house branding
X5= Poster
X6= Event

Thus the model is,
Customer Awareness = α + β1 Advertisement + β2
Billboard + β3 Leaflet + β4 In-house branding + β5 Poster + β6 Event
Thus the model is,
Customer Awareness = α + β1 Advertisement + β2
Billboard + β3 Leaflet + β4 In-house branding + β5 Poster + β6 Event

Development of HypothesisDevelopment of Hypothesis
H0 : β1 = β2 = β3 = β4 = β5 = β6 = 0 (There is no significant impact of promotional tools on creating customer awareness)
H1 : There is significant impact of promotional tools on creating customer awareness
Predictors: (Constant), Advertisement, Billboard, Leaflet, In-house branding, Poster and Event
Dependent Variable: Customer Awareness
Source DF SS MS F P
Regression 6 8.9041 1.4840 8.66 0.000
Residual Error 93 15.9356 0.1714
Total 99 24.8400

On the basis of the above table we observed that the value of F-statistic is 8.66 and its correspondence significant value is 0.000. So, we reject the null hypothesis considering 5% level of significance.
H0 = Null Hypothesis, H1 = Alternative Hypothesis
On the basis of the above table we observed that the value of F-statistic is 8.66 and its correspondence significant value is 0.000. So, we reject the null hypothesis considering 5% level of significance.
H0 = Null Hypothesis, H1 = Alternative HypothesisPredictor Coef SE Coef T P
Constant 1.2197 0.8338 1.46 0.031
Advertisement 0.07408 0.06829 1.08 0.028
Billboard 0.17590 0.06620 2.66 0.009
Leaflet 0.0466 0.1034 0.45 0.035
In-house Branding 0.28244 0.06808 4.15 0.000
Poster 0.0154 0.1095 0.14 0.889
Event 0.1724 0.1006 1.71 0.048

Now we shall test the regression coefficients. On the basis of the value of t-statistics given in above table, it is observed that none of the regression coefficient is statistically insignificant considering 5% level of significance. Here, the promotional tool poster’s value is 0.889, so we cannot be sure about whether poster has any impact on creating customer awareness or not.
Thus the fitted model is
Y = 1.2197+ 0.07408X1 + 0.17590X2 + 0.0466X3 + 0.28244X4 + 0.0154X5 + 0.1724X6
For this we can develop the following hypothesis:-H0 : Promotional tools have no impact on creating customer awareness
H1 : Promotional tools have significant impact on creating customer awareness

it can be observed that P value is <0.05, this means there is a little support for null hypothesis (no relation or impact). So, null hypothesis is rejected. So it is clear that there exists a significant impact or systematic relationship between the two variables.
S = 0.4139 R Sq = 72.8% R Sq (adj) =
68.7%
From the regression analysis result it is found that the adjusted R Sq is 68.7%, which shows that the model is good enough to predict the relationship between dependent and independent variables.

Major FindingsMajor Findings
Those who know about the brand HP knows very well about the brand. They are quite aware about the brand. From this analysis it can be predicted that, as they are fully confident about identifying the brand logo so they can be aware of the promotional tools of HP which can be helpful for further analysis.
Customers get information about the brand HP mainly from leaflets, posters and newspaper ads. Because the young generation is the main customers of computer products, they visit places to get latest information about computer products. Mainly they look for news about computer products and get attracted by latest offers.
There is a little support for null hypothesis (no relation or impact). So, null hypothesis is rejected. So it is clear that there exists a significant impact or systematic relationship between the two variables. From the regression analysis result it is found that the adjusted R Sq is 68.7%, which shows that the model is good enough to predict the relationship between dependent and independent variables.

Recommendation Recommendation
Profitability Improvement in Promotional activities Strong Management Quick Learning from past mistakes Use distribution channel perfectly Give Training to employee
Profitability Improvement in Promotional activities Strong Management Quick Learning from past mistakes Use distribution channel perfectly Give Training to employee

ConclusionConclusion
As there is impact of promotional tools on creating customer awareness, so Computer Source Ltd should focus more on promotions. As customers get information about the brand HP mainly from leaflets, posters and newspaper ads Computer Source Ltd should use these three promotional tools mainly to increase customer awareness.
As there is impact of promotional tools on creating customer awareness, so Computer Source Ltd should focus more on promotions. As customers get information about the brand HP mainly from leaflets, posters and newspaper ads Computer Source Ltd should use these three promotional tools mainly to increase customer awareness.