Embed Size (px)
Citation preview
EconomicResearchUnitCreditLibanaisHeadquarters
AdliehBeirut,[email protected]
CREDIT LIBANAIS S.A.L.
WeeklyMarketWatch
IssueNo.501
May7th‐May13th2016

LLEEBBAANNOONN NEWS
ECONOMIC INSIGHTS
> IMF Urges Lebanon for Higher Public Investments 1 > The USTR Keeps Lebanon on its Watch List for 2016 1 > Commercial Banks’ Assets Near $188 Billion in March 2016 2 > Gross Public Debt at $71.04 Billion at End of Q1-2016 3 > Lebanon’s CPI Rises by 0.40% Y-O-Y in March 2016 4 > The Coincident Indicator Increases by 11.89% Y-O-Y in
February 2016 4 > New Car Sales Notch 3.33% Higher Y-O-Y by April 2016 5 > The Number of BIA Passengers Adds 5.52% Y-O-Y by April
2016 6 > ABL Amends the BRR on LBP and USD Lending 7 > Residential Prices in Municipal Beirut Down by 1.2% in 2015 7
CORPORATE NEWS
> Capital Intelligence Affirms Bank Audi’s Rating 8 > Byblos Bank Acquires Banque Pharaon & Chiha 8 > Solidere Group Reports a Net loss of $87.21 Million in 2015 9 > ODEABANK A.Ş. Posts Net Profits of TRY 22.64 Million in
Q1-2016 10 MONETARY PERFORMANCE
> Monetary Aggregates 11 > Money Markets 11 LEBANESE EQUITIES
> Lebanese Equities & Credit Libanais Indices 12
Lebanon's Economic & Financial Sector Indicators 14 Lebanon's Ratings 15
IMF URGES LEBANON FOR HIGHER PUBLIC INVESTMENTS
The IMF prompted Lebanese authorities to bolster public investment through a shift in the composition of public spending and an increase in taxes “in a fair manner”. THE USTR KEEPS LEBANON ON ITS WATCH LIST FOR 2016
The USTR maintained Lebanon on its Watch List in the year 2016, yet praised the unremitting efforts made by the Intellectual Property Protection Office at the Lebanese Ministry of Economy and Trade and the concerned law enforcement agencies to enhance the country’s “administrative and enforcement capacity for IPR protection”. COMMERCIAL BANKS’ ASSETS NEAR $188 BILLION IN MARCH 2016
The consolidated assets of the banking sector rose by 6.05% Y-O-Y to $187.66 billion at end of March 2016 from $176.95 billion a year before. NEW CAR SALES NOTCH 3.33% HIGHER Y-O-Y BY APRIL 2016
New car sales rose by 3.33% y-o-y to 11,099 cars by the end of the first four months of the current year, up from 10,741 cars during that same period last year. CAPITAL INTELLIGENCE AFFIRMS BANK AUDI’S RATING
Capital Intelligence affirmed Bank Audi’s long-term and short-term foreign currency rating at “B”, while maintaining the bank’s “Negative” outlook.
TABLE OF CONTENTS
Weekly Market Watch
ECONOMIC RESEARCH UNIT - ADLIEH, BEIRUT LEBANON - TEL: 01-608000 FAX: 01-608231

"BDL" Banque Du Liban "ABL" Association of Banks in Lebanon "MOF" The Lebanese Ministry of
Finance "BOP" Balance of Payment "IMF" The International Monetary Fund "Moody's" Moody's Investors Service "BSE" Beirut Stock Exchange "GDRs" Global Depositary Receipts "M1" Currency in Circulation + Demand
Deposits in LBP "M2" M1 + Other Deposits in LBP "M3" M2 + Deposits in Foreign Currencies "M4" M3+ Treasury Bills Held By Non Banking System, Including Accrued
Interests "CPI" Consumer Price Index "PPI" Producer Price Index "CLASI" Credit Libanais Aggregate Stock Index "CLFI" Credit Libanais Financial Sector Stock Index
"CLCI" Credit Libanais Construction Sector Stock Index “EIU” Economist Intelligence Unit “EOY” End of Year "P/E" Price to Earnings Multiple "P/BV" Price to Book Multiple "YTD" Year To Date "YTD Price Performance" Yield to Date Price Appreciation
"Forex" Foreign Exchange "LBP" The Lebanese Pound "USD" The United States Dollar "Yen" The Japanese Yen "GBP" The British Pound/ Sterling Pound "CHF" The Swiss Franc "Y-O-Y" Year-On-Year "GDP" Gross Domestic Product "MENA" Middle East and North Africa
“LE” Livre Egyptienne – Egyptian Pound
“SAR” Saudi Arabian Riyal “AED” United Arab Emirates Dirham “BD” Bahraini Dinar
SYNOPSIS OF TERMS
Weekly Market Watch
ECONOMIC RESEARCH UNIT - ADLIEH, BEIRUT LEBANON - TEL: 01-608000 FAX: 01-608231

LEBANON NEWS
Weekly Market Watch
SOURCE: IMF, USTR, CREDIT LIBANAIS ECONOMIC RESEARCH UNIT 1
IMF URGES LEBANON FOR HIGHER PUBLIC INVESTMENTS
The International Monetary Fund (IMF) released earlier this week a report titled “Investment and Growth in the Arab World - A Scoping Note” in the aftermath of the Annual Meeting of Arab Finance Ministers, which was convened in Bahrain during the month of April 2016. The report mostly emphasized on the importance of boosting public and private investment to spur economic growth and create new job opportunities. The IMF noted, however, that despite the progress witnessed in investment rates across Arab countries throughout the previous decades, private investment and foreign direct investment (FDI) remained rather frail when compared to their international peers and failed to significantly fuel economic growth. Similarly, the IMF pointed to the gap in public capital spending between oil exporting and oil importing countries. In this context, the report suggested a set of reform measures that could be undertaken by policymakers in the region to encourage investment in their respective countries. As far as Lebanon is concerned, the IMF urged Lebanese authorities to work on improving the country’s primary fiscal surpluses and attenuating its public debt burden and swelling debt service. The IMF also prompted Lebanese authorities to bolster public investment through a shift in the composition of public spending and an increase in taxes “in a fair manner”. In fact, the report deemed public investment in Lebanon as low when compared to its regional peers, and called for the prompt implementation of “the most productive” projects that have already secured a concessional financing out of the country’s total projects in the pipeline. In parallel, the IMF spotted the light on the necessity to pass the Public-Private Partnership (PPP) law in Lebanon to facilitate the usage of such a scheme in the development of the country’s ailing infrastructure, and especially in the electricity sector. From another perspective, the report cited the peg of the Lebanese Pound to the U.S. Dollar and its impact on economic stability and investor confidence, and stressed on the importance of preserving the ample reserves at the Central Bank. Furthermore, and according to the IMF, the reforms of Lebanon’s capital markets must be maintained and privatization of the Beirut Stock Exchange should kick-in. THE USTR KEEPS LEBANON ON ITS WATCH LIST FOR 2016
The Office of the United States Trade Representative (USTR) recently published its Special 301 Report on the state of intellectual property rights (IPR) around the globe, highlighting that the protection of such rights helps support job growth locally and internationally. The USTR maintained China on its Priority Watch List for the year 2016 despite the palpable progress reported across numerous areas of intellectual property rights protection in the country, and this owing to the prevailing physical and online piracy and counterfeiting practices, trade secret theft, and other IPR violations. India was also kept on the USTR’s Priority Watch List for yet another year in the absence of satisfactory measurable reforms in its IPR framework. Concurrently, Switzerland newly joined the USTR’s Watch List on the back of the swelling online infringements in the country. On the other hand, the report hailed the improvements witnessed in each of Pakistan, Ecuador, Tajikistan, Belarus and Trinidad, and Tobago in terms of IPR protection. On the local front, the United States Trade Representative maintained Lebanon on its Watch List in the year 2016, yet praised the unremitting efforts made by the Intellectual Property Protection Office at the Lebanese Ministry of Economy and Trade and the concerned law enforcement agencies to enhance the country’s “administrative and enforcement capacity for IPR protection”. In this context, the USTR called for the transfer of more funds and resources towards supporting the aforementioned efforts. In parallel, the report spotted the light on the measures taken by law enforcement agencies in Lebanon to prioritize actions against forged goods, of which pharmaceutical products, that may harm public health and safety. From another standpoint, the USTR recommended developing Lebanon’s intellectual property rights environment by adopting all pending legislative reforms including, among others, amendments to Lebanon’s copyright and patent laws. For this purpose, the USTR encouraged the country to consider international intellectual property right treaties, namely the Paris Convention for the Protection of Intellectual Property, the Berne Convention for Protection of Literary and Artistic Works, the Nice Agreement Concerning the International Classification of Goods and Services for the Purposes of the Registration of Marks, the Singapore Treaty, the Patent Cooperation Treaty, and the Madrid Treaty, only to name a few. The report further confirmed the United States’ willingness to continue helping Lebanon in resolving all issues related to intellectual property rights protection.
LEBANON NEWS
Weekly Market Watch
SOURCE: ABL, CREDIT LIBANAIS ECONOMIC RESEARCH UNIT 2
COMMERCIAL BANKS’ ASSETS NEAR $188 BILLION IN MARCH 2016
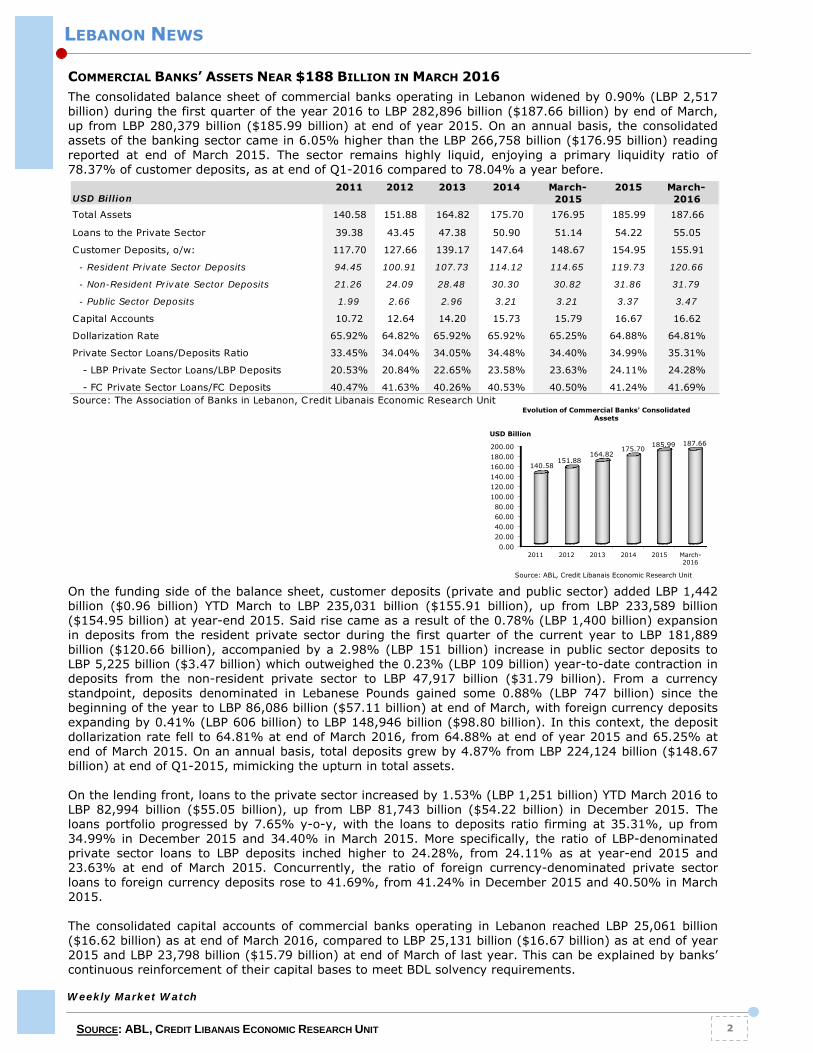
The consolidated balance sheet of commercial banks operating in Lebanon widened by 0.90% (LBP 2,517 billion) during the first quarter of the year 2016 to LBP 282,896 billion ($187.66 billion) by end of March, up from LBP 280,379 billion ($185.99 billion) at end of year 2015. On an annual basis, the consolidated assets of the banking sector came in 6.05% higher than the LBP 266,758 billion ($176.95 billion) reading reported at end of March 2015. The sector remains highly liquid, enjoying a primary liquidity ratio of 78.37% of customer deposits, as at end of Q1-2016 compared to 78.04% a year before. On the funding side of the balance sheet, customer deposits (private and public sector) added LBP 1,442 billion ($0.96 billion) YTD March to LBP 235,031 billion ($155.91 billion), up from LBP 233,589 billion ($154.95 billion) at year-end 2015. Said rise came as a result of the 0.78% (LBP 1,400 billion) expansion in deposits from the resident private sector during the first quarter of the current year to LBP 181,889 billion ($120.66 billion), accompanied by a 2.98% (LBP 151 billion) increase in public sector deposits to LBP 5,225 billion ($3.47 billion) which outweighed the 0.23% (LBP 109 billion) year-to-date contraction in deposits from the non-resident private sector to LBP 47,917 billion ($31.79 billion). From a currency standpoint, deposits denominated in Lebanese Pounds gained some 0.88% (LBP 747 billion) since the beginning of the year to LBP 86,086 billion ($57.11 billion) at end of March, with foreign currency deposits expanding by 0.41% (LBP 606 billion) to LBP 148,946 billion ($98.80 billion). In this context, the deposit dollarization rate fell to 64.81% at end of March 2016, from 64.88% at end of year 2015 and 65.25% at end of March 2015. On an annual basis, total deposits grew by 4.87% from LBP 224,124 billion ($148.67 billion) at end of Q1-2015, mimicking the upturn in total assets. On the lending front, loans to the private sector increased by 1.53% (LBP 1,251 billion) YTD March 2016 to LBP 82,994 billion ($55.05 billion), up from LBP 81,743 billion ($54.22 billion) in December 2015. The loans portfolio progressed by 7.65% y-o-y, with the loans to deposits ratio firming at 35.31%, up from 34.99% in December 2015 and 34.40% in March 2015. More specifically, the ratio of LBP-denominated private sector loans to LBP deposits inched higher to 24.28%, from 24.11% as at year-end 2015 and 23.63% at end of March 2015. Concurrently, the ratio of foreign currency-denominated private sector loans to foreign currency deposits rose to 41.69%, from 41.24% in December 2015 and 40.50% in March 2015. The consolidated capital accounts of commercial banks operating in Lebanon reached LBP 25,061 billion ($16.62 billion) as at end of March 2016, compared to LBP 25,131 billion ($16.67 billion) as at end of year 2015 and LBP 23,798 billion ($15.79 billion) at end of March of last year. This can be explained by banks’ continuous reinforcement of their capital bases to meet BDL solvency requirements.
USD Billion2011 2012 2013 2014 March-
20152015 March-
2016Total Assets 140.58 151.88 164.82 175.70 176.95 185.99 187.66
Loans to the Private Sector 39.38 43.45 47.38 50.90 51.14 54.22 55.05
Customer Deposits, o/w: 117.70 127.66 139.17 147.64 148.67 154.95 155.91
- Resident Private Sector Deposits 94.45 100.91 107.73 114.12 114.65 119.73 120.66
- Non-Resident Private Sector Deposits 21.26 24.09 28.48 30.30 30.82 31.86 31.79
- Public Sector Deposits 1.99 2.66 2.96 3.21 3.21 3.37 3.47
Capital Accounts 10.72 12.64 14.20 15.73 15.79 16.67 16.62
Dollarization Rate 65.92% 64.82% 65.92% 65.92% 65.25% 64.88% 64.81%
Private Sector Loans/Deposits Ratio 33.45% 34.04% 34.05% 34.48% 34.40% 34.99% 35.31%
- LBP Private Sector Loans/LBP Deposits 20.53% 20.84% 22.65% 23.58% 23.63% 24.11% 24.28%
- FC Private Sector Loans/FC Deposits 40.47% 41.63% 40.26% 40.53% 40.50% 41.24% 41.69%Source: The Association of Banks in Lebanon, Credit Libanais Economic Research Unit
0.0020.0040.0060.0080.00
100.00120.00140.00160.00180.00200.00
2011 2012 2013 2014 2015 March-2016
140.58151.88
164.82175.70 185.99 187.66
USD Billion
Evolution of Commercial Banks' Consolidated Assets
Source: ABL, Credit Libanais Economic Research Unit
LEBANON NEWS
Weekly Market Watch
SOURCE: ABL, CREDIT LIBANAIS ECONOMIC RESEARCH UNIT 3
GROSS PUBLIC DEBT AT $71.04 BILLION AT END OF Q1-2016
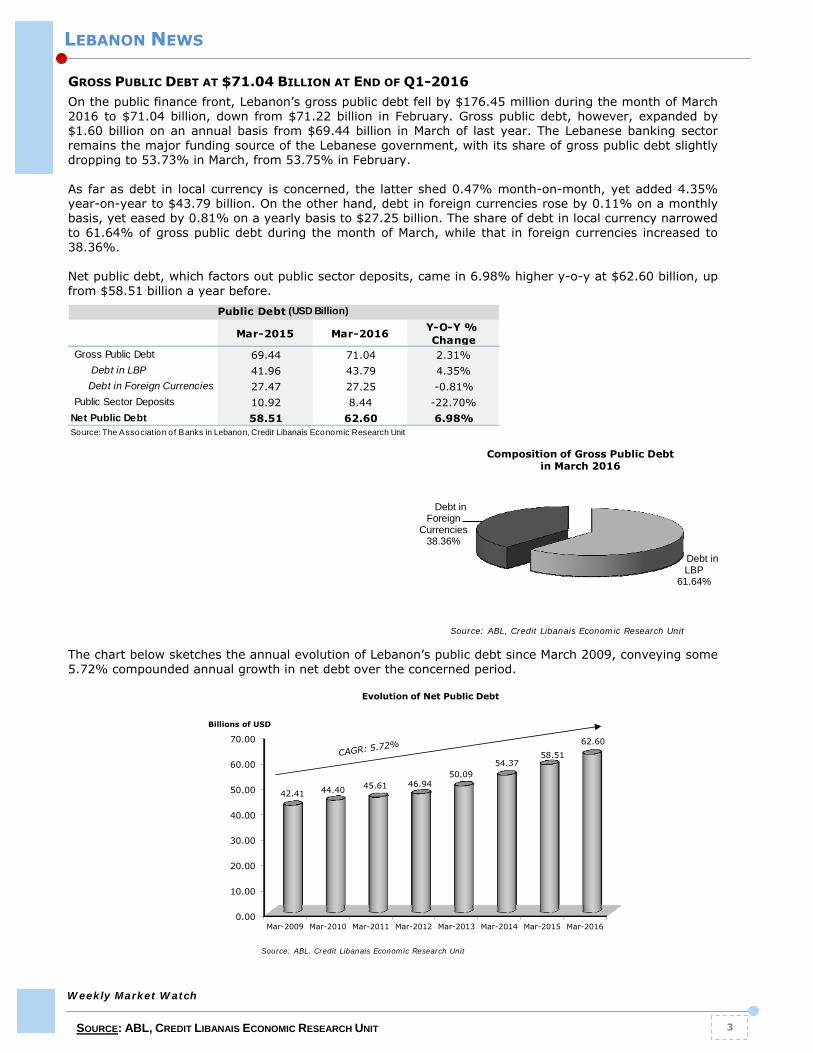
On the public finance front, Lebanon’s gross public debt fell by $176.45 million during the month of March 2016 to $71.04 billion, down from $71.22 billion in February. Gross public debt, however, expanded by $1.60 billion on an annual basis from $69.44 billion in March of last year. The Lebanese banking sector remains the major funding source of the Lebanese government, with its share of gross public debt slightly dropping to 53.73% in March, from 53.75% in February. As far as debt in local currency is concerned, the latter shed 0.47% month-on-month, yet added 4.35% year-on-year to $43.79 billion. On the other hand, debt in foreign currencies rose by 0.11% on a monthly basis, yet eased by 0.81% on a yearly basis to $27.25 billion. The share of debt in local currency narrowed to 61.64% of gross public debt during the month of March, while that in foreign currencies increased to 38.36%. Net public debt, which factors out public sector deposits, came in 6.98% higher y-o-y at $62.60 billion, up from $58.51 billion a year before. The chart below sketches the annual evolution of Lebanon’s public debt since March 2009, conveying some 5.72% compounded annual growth in net debt over the concerned period.
Mar-2015 Mar-2016 Y-O-Y % Change
Gross Public Debt 69.44 71.04 2.31% Debt in LBP 41.96 43.79 4.35% Debt in Foreign Currencies 27.47 27.25 -0.81%Public Sector Deposits 10.92 8.44 -22.70%
Net Public Debt 58.51 62.60 6.98%
Public Debt (USD Billion)
Source: The Association of Banks in Lebanon, Credit Libanais Economic Research Unit
Debt in LBP
61.64%
Debt in Foreign
Currencies38.36%
Composition of Gross Public Debt in March 2016
Source: ABL, Credit Libanais Economic Research Unit
0.00
10.00
20.00
30.00
40.00
50.00
60.00
70.00
Mar-2009 Mar-2010 Mar-2011 Mar-2012 Mar-2013 Mar-2014 Mar-2015 Mar-2016
42.41 44.40 45.61 46.9450.09
54.3758.51
62.60
Billions of USD
Evolution of Net Public Debt
Source: ABL, Credit Libanais Economic Research Unit

LEBANON NEWS
Weekly Market Watch
SOURCE: ABL, BDL, CREDIT LIBANAIS ECONOMIC RESEARCH UNIT 4
LEBANON’S CPI RISES BY 0.40% Y-O-Y IN MARCH 2016
According to the Association of Banks in Lebanon (ABL), annual inflation, as captured by the yearly change in ABL’s consumer price index (CPI) stood at 0.40% in March 2016, in comparison with 0.78% in February and 1.47% in January. More specifically, March’s CPI rose to 148.89, up from 148.29 during that same month a year before. On a monthly basis, Lebanon’s CPI fell by 0.13% in March 2016, compared to a 1.81% contraction in February and a 2.25% appreciation in January.
THE COINCIDENT INDICATOR INCREASES BY 11.89% Y-O-Y IN FEBRUARY 2016
Banque Du Liban’s coincident indicator, which is an indicative measure of the country’s overall economic activity, and which comprises import of petroleum derivatives, electricity production, check clearing activity, cement deliveries, foreign passengers, foreign trade, and the M3 monetary aggregate, added 5.44% during the month of February 2016 to 294.6, up from 279.4 in January. Concurrently, the coincident indicator rose by 11.89% year-on-year when benchmarked to last year’s reading of 263.3, portraying as such a moderate improvement in economic activity.
CPI Monthly % Change
Yearly % Change
Mar-2015 148.29 0.35% 0.00%Apr-2015 149.46 0.79% -0.17%May-2015 150.21 0.50% -0.13%Jun-2015 150.21 0.00% -0.38%July-2015 148.45 -1.17% -1.11%Aug-2015 151.52 2.07% 1.02%Sep-2015 151.11 -0.27% -0.64%Oct-2015 150.75 -0.24% 0.41%Nov-2015 150.90 0.10% -0.17%Dec-2015 148.49 -1.60% 1.40%Jan-2016 151.83 2.25% 1.47%Feb-2016 149.08 -1.81% 0.78%Mar-2016 148.89 -0.13% 0.40%Source: ABL, Credit Libanais Economic Research Unit
-2.50%-2.00%-1.50%-1.00%-0.50%0.00%0.50%1.00%1.50%2.00%2.50%
146.00
147.00
148.00
149.00
150.00
151.00
152.00
153.00
Mar
-201
5
Apr
-201
5
May
-201
5
Jun-
2015
July
-201
5
Aug
-201
5
Sep
-201
5
Oct
-201
5
Nov
-201
5
Dec
-201
5
Jan-
2016
Feb-
2016
Mar
-201
6
Evolution of Lebanon's Consumer Price Index
Consumer Price Index CPI (%)
Source: ABL, Credit Libanais Economic Research Unit
240
250
260
270
280
290
300
310
Feb-15 Apr-15 Jun-15 Aug-15 Oct-15 Dec-15 Feb-16
263.3
279.7
288.2285.0
277.7
264.6266.6
271.5
281.4
293.1
302.3
279.4
294.6
Evolution of Lebanon's Coincident Indicator
Source: BDL, Credit Libanais Economic Research Unit

LEBANON NEWS
Weekly Market Watch
SOURCE: AIA, CREDIT LIBANAIS ECONOMIC RESEARCH UNIT 5
NEW CAR SALES NOTCH 3.33% HIGHER Y-O-Y BY APRIL 2016
According to the monthly statistics published by the Automobile Importers Association (AIA), new car sales in Lebanon reached 3,109 vehicles during the month of April 2016, compared to 2,966 vehicles in March and 3,198 in April 2015. On a cumulative basis, new car sales rose by 3.33% y-o-y to 11,099 cars during the first four months of the current year, up from 10,741 cars during that same period last year. This comes as a result of the 9.61% annual expansion in the sales of European cars to 2,430 units, coupled with some 2.91% increase in the sales of Korean cars to 3,851 and a 14.72% hike in the sales of American cars to 639, which altogether outweighed the 0.31% drop in the sales of Japanese cars to 4,140 units. Despite said drop, Japanese cars continued to control the lion’s share of new car sales in Lebanon, amassing alone 37.30% of total volume sales by end of April 2016, followed by Korean (34.70%), European (21.89%), American (5.76%), and Chinese (0.35%) cars.
The Korean “KIA” brand sold 2,230 units YTD April, enjoying the highest stake (20.09%) of total sales, followed by the Korean “Hyundai” (1,601 cars <14.42%>) and the Japanese “Toyota” (1,558 cars <14.04%>) brands, only to name a few.
Apr-2015 Apr-2016 % ChangeJapanese 4,153 4,140 -0.31%European 2,217 2,430 9.61%Korean 3,742 3,851 2.91%American 557 639 14.72%Chinese 72 39 -45.83%Total 10,741 11,099 3.33%
New Car Sales During the Four-Month Period Ending
Source: AIA, Credit Libanais Economic Research Unit
Japanese, 37.30%
European , 21.89%
Korean, 34.70%
American, 5.76%
Chinese, 0.35%
Breakdown of New Car Sales up to April 2016
Source: AIA, Credit Libanais Economic Research Unit
- 500 1,000 1,500 2,000 2,500
KIA
Hyundai
Toyota
Nissan
Renault
Mitsubishi
Suzuki
Chevrolet
Mercedes
BMW
2,2
30
1,6
01
1,5
58
1,1
00
56
8
45
5
44
4
40
9
32
8
27
6
Top 10 New Car Sales Brands up to April 2016
Source: AIA, Credit Libanais Economic Research Unit
LEBANON NEWS
Weekly Market Watch
SOURCE: BIA, ALIWAA NEWSPAPER, CREDIT LIBANAIS ECONOMIC RESEARCH UNIT 6
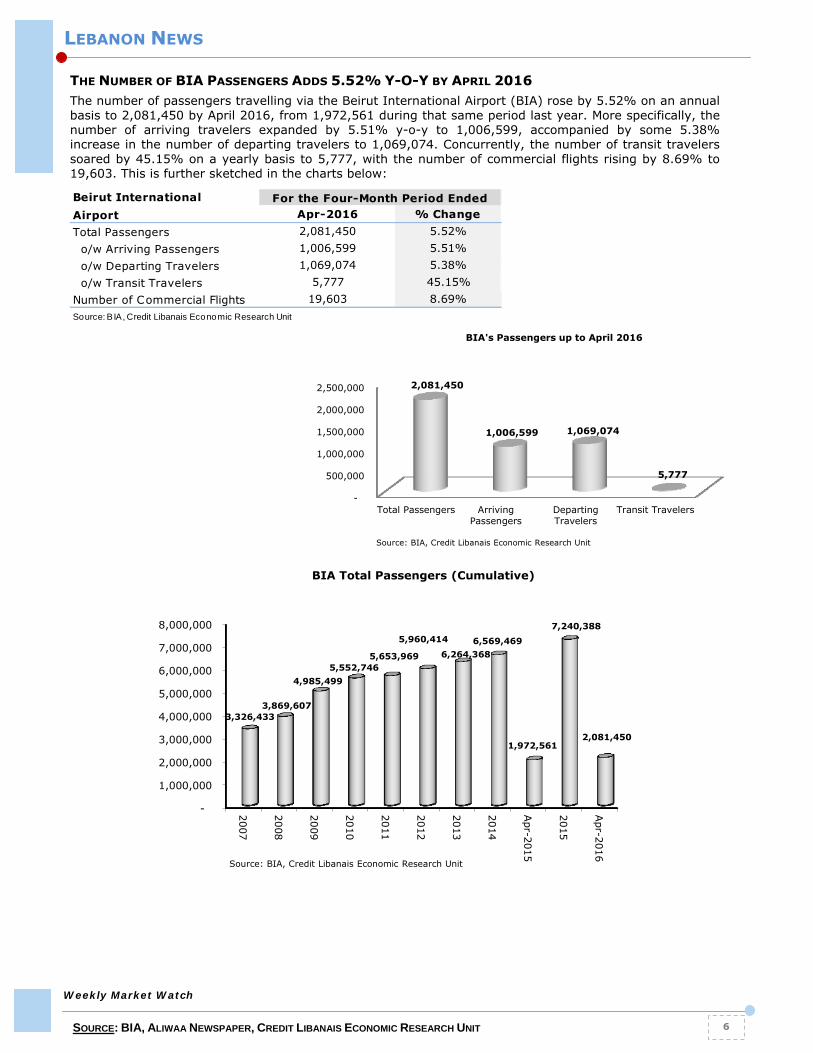
THE NUMBER OF BIA PASSENGERS ADDS 5.52% Y-O-Y BY APRIL 2016
The number of passengers travelling via the Beirut International Airport (BIA) rose by 5.52% on an annual basis to 2,081,450 by April 2016, from 1,972,561 during that same period last year. More specifically, the number of arriving travelers expanded by 5.51% y-o-y to 1,006,599, accompanied by some 5.38% increase in the number of departing travelers to 1,069,074. Concurrently, the number of transit travelers soared by 45.15% on a yearly basis to 5,777, with the number of commercial flights rising by 8.69% to 19,603. This is further sketched in the charts below:
-
500,000
1,000,000
1,500,000
2,000,000
2,500,000
Total Passengers ArrivingPassengers
DepartingTravelers
Transit Travelers
2,081,450
1,006,599 1,069,074
5,777
BIA's Passengers up to April 2016
Source: BIA, Credit Libanais Economic Research Unit
Beirut InternationalAirport Apr-2016 % ChangeTotal Passengers 2,081,450 5.52% o/w Arriving Passengers 1,006,599 5.51% o/w Departing Travelers 1,069,074 5.38% o/w Transit Travelers 5,777 45.15%Number of Commercial Flights 19,603 8.69%Source: BIA, Credit Libanais Economic Research Unit
For the Four-Month Period Ended
-
1,000,000
2,000,000
3,000,000
4,000,000
5,000,000
6,000,000
7,000,000
8,000,000
2007
2008
2009
2010
2011
2012
2013
2014
Apr-2015
2015
Apr-2016
3,326,433 3,869,607
4,985,499 5,552,746
5,653,969
5,960,414
6,264,368 6,569,469
1,972,561
7,240,388
2,081,450
BIA Total Passengers (Cumulative)
Source: BIA, Credit Libanais Economic Research Unit
LEBANON NEWS
Weekly Market Watch
SOURCE: ABL, RAMCO, CREDIT LIBANAIS ECONOMIC RESEARCH UNIT 7
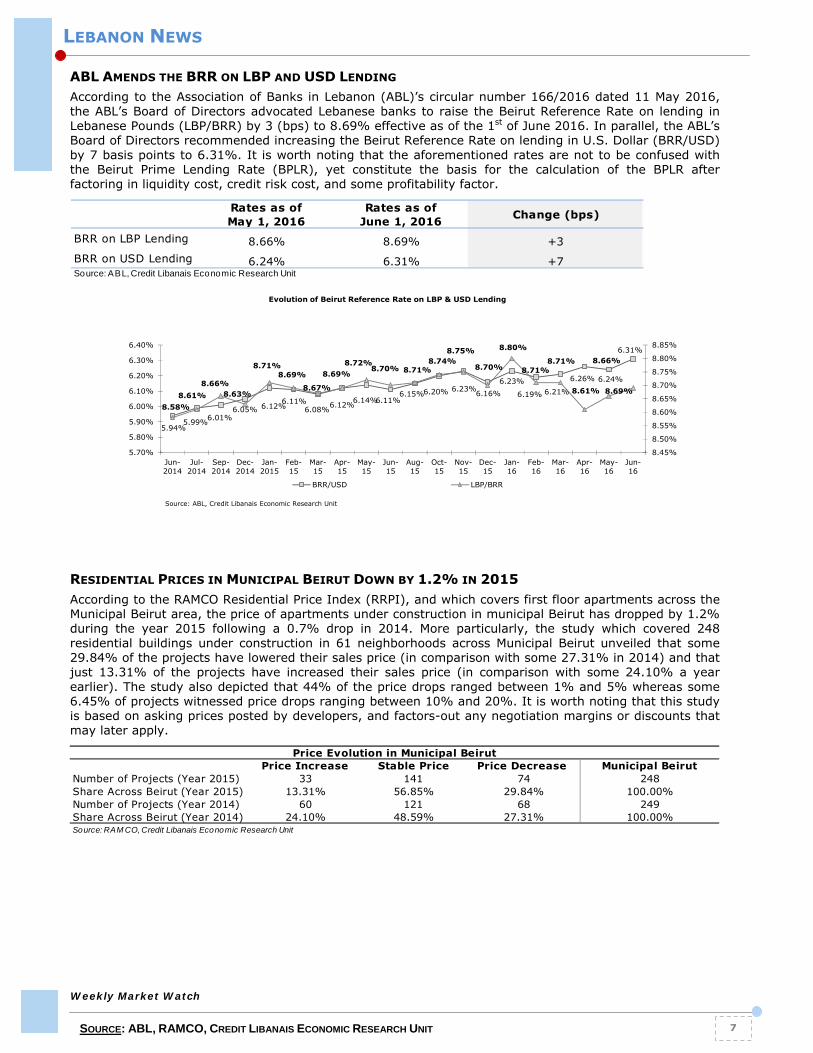
ABL AMENDS THE BRR ON LBP AND USD LENDING
According to the Association of Banks in Lebanon (ABL)’s circular number 166/2016 dated 11 May 2016, the ABL’s Board of Directors advocated Lebanese banks to raise the Beirut Reference Rate on lending in Lebanese Pounds (LBP/BRR) by 3 (bps) to 8.69% effective as of the 1st of June 2016. In parallel, the ABL’s Board of Directors recommended increasing the Beirut Reference Rate on lending in U.S. Dollar (BRR/USD) by 7 basis points to 6.31%. It is worth noting that the aforementioned rates are not to be confused with the Beirut Prime Lending Rate (BPLR), yet constitute the basis for the calculation of the BPLR after factoring in liquidity cost, credit risk cost, and some profitability factor.
RESIDENTIAL PRICES IN MUNICIPAL BEIRUT DOWN BY 1.2% IN 2015
According to the RAMCO Residential Price Index (RRPI), and which covers first floor apartments across the Municipal Beirut area, the price of apartments under construction in municipal Beirut has dropped by 1.2% during the year 2015 following a 0.7% drop in 2014. More particularly, the study which covered 248 residential buildings under construction in 61 neighborhoods across Municipal Beirut unveiled that some 29.84% of the projects have lowered their sales price (in comparison with some 27.31% in 2014) and that just 13.31% of the projects have increased their sales price (in comparison with some 24.10% a year earlier). The study also depicted that 44% of the price drops ranged between 1% and 5% whereas some 6.45% of projects witnessed price drops ranging between 10% and 20%. It is worth noting that this study is based on asking prices posted by developers, and factors-out any negotiation margins or discounts that may later apply.
Rates as of May 1, 2016
Rates as of June 1, 2016 Change (bps)
BRR on LBP Lending 8.66% 8.69% +3BRR on USD Lending 6.24% 6.31% +7Source: ABL, Credit Libanais Economic Research Unit
5.94%5.99%6.01%
6.05% 6.12%6.11%6.08%6.12%6.14%6.11%
6.15%6.20% 6.23%6.16%6.23%
6.19% 6.21%
6.26% 6.24%
6.31%
8.58%8.61%
8.66%8.63%
8.71%8.69%
8.67%
8.69%8.72%
8.70% 8.71%8.74%
8.75%
8.70%
8.80%
8.71%8.71%
8.61%
8.66%
8.69%
8.45%
8.50%
8.55%
8.60%
8.65%
8.70%
8.75%
8.80%
8.85%
5.70%
5.80%
5.90%
6.00%
6.10%
6.20%
6.30%
6.40%
Jun-2014
Jul-2014
Sep-2014
Dec-2014
Jan-2015
Feb-15
Mar-15
Apr-15
May-15
Jun-15
Aug-15
Oct-15
Nov-15
Dec-15
Jan-16
Feb-16
Mar-16
Apr-16
May-16
Jun-16
Evolution of Beirut Reference Rate on LBP & USD Lending
BRR/USD LBP/BRR
Source: ABL, Credit Libanais Economic Research Unit
Price Increase Stable Price Price Decrease Municipal BeirutNumber of Projects (Year 2015) 33 141 74 248Share Across Beirut (Year 2015) 13.31% 56.85% 29.84% 100.00%Number of Projects (Year 2014) 60 121 68 249Share Across Beirut (Year 2014) 24.10% 48.59% 27.31% 100.00%
Price Evolution in Municipal Beirut
Source: RAM CO, Credit Libanais Economic Research Unit

CAPITAL INTELLIGENCE AFFIRMS BANK AUDI’S RATING
Capital Intelligence, the international rating agency, affirmed in its Credit Rating Announcement dated May 12, 2016 Bank Audi’s long-term and short-term foreign currency rating at “B”, while maintaining the bank’s “Negative” outlook. In addition, the bank’s Financial Strength Rating (FSR) was affirmed at BBB-, with a “Negative” outlook, constrained by the bank’s sovereign risk exposure, “relatively low” Common Equity Tier 1 (CET1) and Tier 1 ratios, “moderate” operating profitability, and Lebanon’s lackluster economic growth. In this context, the rating agency commented that despite the bank’s recent efforts to bolster its capital base, citing the $300 million capital increase in September 2014, its CET1 and Tier 1 ratios remain barely above the regulatory required thresholds the thing which is limiting the bank’s growth opportunities. The agency also stated that the tepid local economic growth along with instabilities in other MENA markets in which the bank has established a foothold have driven its non-performing loans (NPLs) to higher grounds, albeit this was partly mitigated by a robust growth in the loans portfolio and ultimately led to only a small deterioration in the NPL ratio. On a positive note, the rating agency praised the bank’s international endeavors, with its Turkish subsidiary Odeabank ranking 9th in terms of assets and 8th in terms of deposits among private sector banks in Turkey only four years after its establishment, with Audi’s Egyptian subsidiary (7th in terms of assets among Egyptian private sector banks) reporting a solid growth in terms of deposits and loans. Finally the rating agency highlighted that the bank has “proficiently managed its balance sheet” in the wake of the heightened credit and geopolitical risks and that the bank’s liquidity is considered robust. BYBLOS BANK ACQUIRES BANQUE PHARAON & CHIHA
According to a press release circulated by the Beirut Stock Exchange, Byblos Bank announced this week that it finalized the acquisition of 99.18% of the shares of Banque Pharaon & Chiha under the umbrella of a tripartite transaction. More particularly, ZR group (comprising Mr. Raymond Zina Rahmeh and Mr. Teddy Zina Rahmeh) which has previously concluded a share purchase agreement with the old shareholders of Banque Pharaon & Chiha, assigned its shares and rights in the contemplated acquisition to Byblos Bank for a total consideration of $91 million representing the valuation of 100% of the shares of the Bank. In addition, ZR Group has secured the preliminary approval of the Central Bank to purchase up to 5.6% of Byblos Bank’s common shares at a multiple of 1.25 times the audited book value per share of Byblos Bank as at end of year 2015. Byblos Bank is one of the largest banks in Lebanon belonging to the Alpha group of banks with its branch network comprising 105 branches (of which 80 are domestic and 25 are foreign) as at end of year 2015 and having a presence in 12 countries. The bank had total assets of just above $20 billion at end of March 2016, customer deposits of $16.73 billion, and net loans of around $4.89 billion. The bank’s equity stood at $1.74 billion at end of Q1 2016 and posted quarterly net profits of $33.76 million. On its part, Banque Pharaon & Chiha falls under the Gamma group of banks and has a branch network of 5 domestic branches, a taskforce comprising 100 employees, customer deposits of $242 million and 30,000 accounts as at end of year 2015 according to the press release by Byblos Bank. Other key financial are captured by the table below:
CORPORATE NEWS
Weekly Market Watch
SOURCE: CAPITAL INTELLIGENCE, BSE, BYBLOS BANK, CREDIT LIBANAIS ECONOMIC RESEARCH UNIT 8
In Millions of USDQ1-2016
Key Financial Figures
Total Assets 20,050.30Net Loans and Advances 4,883.75Customer Deposits 16,733.41Shareholders' Equity 1,739.50Net Profits 33.76Source: BSE, Byblos Bank, Credit Libanais Economic Research Unit
Byblos Bank
In Millions of USD2014
Key Financial Figures
Total Assets 304.09Net Loans and Advances 89.43Customer Deposits 228.03Shareholders' Equity 52.72Net Profits 3.78
Banque Pharaon & Chiha
Source: Bilanbanques, Credit Libanais Economic Research Unit

SOLIDERE GROUP REPORTS A NET LOSS OF $87.21 MILLION IN 2015
The Lebanese Company for the Development and Reconstruction of the Beirut Central District s.a.l. (Solidere) released its consolidated unaudited financial statements (which take into account the company’s subsidiaries and affiliates) for the full year 2015, reporting a net loss of $87.21 million, in comparison with a net profit of $113.70 million in 2014. Solidere attributed this loss to some $82 million provision on the cancellation of two sale contracts according to a press release by the company, added general provisions for any possible future delinquencies which together increased total provisioning constituted in 2015 to $104.20 million. In addition, the economic recession had casted a negative toll on the activities of Solidere which saw some 84.19% slump in gross revenues from property and land sales to $26.80 million. The Group’s operations in Lebanon alone suffered a net loss of $118.9 million in 2015, attenuated, to some extent, by the $61.9 million profits generated by its foreign entity “Solidere International” (39%-owned by the Group). On the balance sheet front, Solidere’s consolidated assets narrowed by 1.57% in 2015 to just below $2.92 billion, from $2.96 billion at end of 2014. More specifically, the company’s land inventory remained almost flat at $1.13 billion (around 39% of total assets), noting that the share of accounts receivable, real estate investments, and investments in affiliates rose slightly from 70.24% of total assets in 2014 to 73.18% of total assets in 2015. Consequently, the company suffered a major setback in equity which dropped by 5.19% in 2015 to $1.96 billion resulting in an increase in the total debt (short plus long-term) to equity ratio from 31.93% to 35.16%. It is worth noting, however, that the press release circulated by the Group commented that Solidere’s activity is expected to pick up in 2016, having already witnessed the inking of some $158 million worth of property sale contracts so far and total sales projected to surpass the $200 million mark by end of 2016.
CORPORATE NEWS
Weekly Market Watch
SOURCE: BSE, SOLIDERE, CREDIT LIBANAIS ECONOMIC RESEARCH UNIT 9
In Millions of USDEnd of
Year 2014End of
Year 2015%
ChangeKey Balance Sheet FiguresTotal Assets 2,964.09 2,917.50 -1.57% o/w: Accounts receivable 552.29 466.21 -15.59% Land inventory & projects under construction 1,128.28 1,134.11 0.52% Real Estate investments 578.86 593.44 2.52% Investments in affiliates & related companies 374.90 407.63 8.73%
Total Liabilities 899.49 960.01 6.73% o/w: Short term credit facilities 548.58 556.04 1.36% Long term loans 110.08 132.37 20.25% Other Liabilities 240.84 271.59 12.77%
Shareholders' Equity 2,064.59 1,957.49 -5.19%
In Millions of USD 2014 2015Y-O-Y % Change
Key P&L FiguresGross Revenues from Property and Land Sale 169.47 26.80 -84.19%Net Operating Profits 180.60 55.36 -69.35%General and Administrative Expenses 34.31 33.87 -1.28%Net After-Tax profit 113.70 -87.21 -176.70%Source: BSE, Credit Libanais Economic Research Unit
Solidere Group
Weekly Market Watch
SOURCE: BSE, BANK AUDI, CREDIT LIBANAIS ECONOMIC RESEARCH UNIT 10
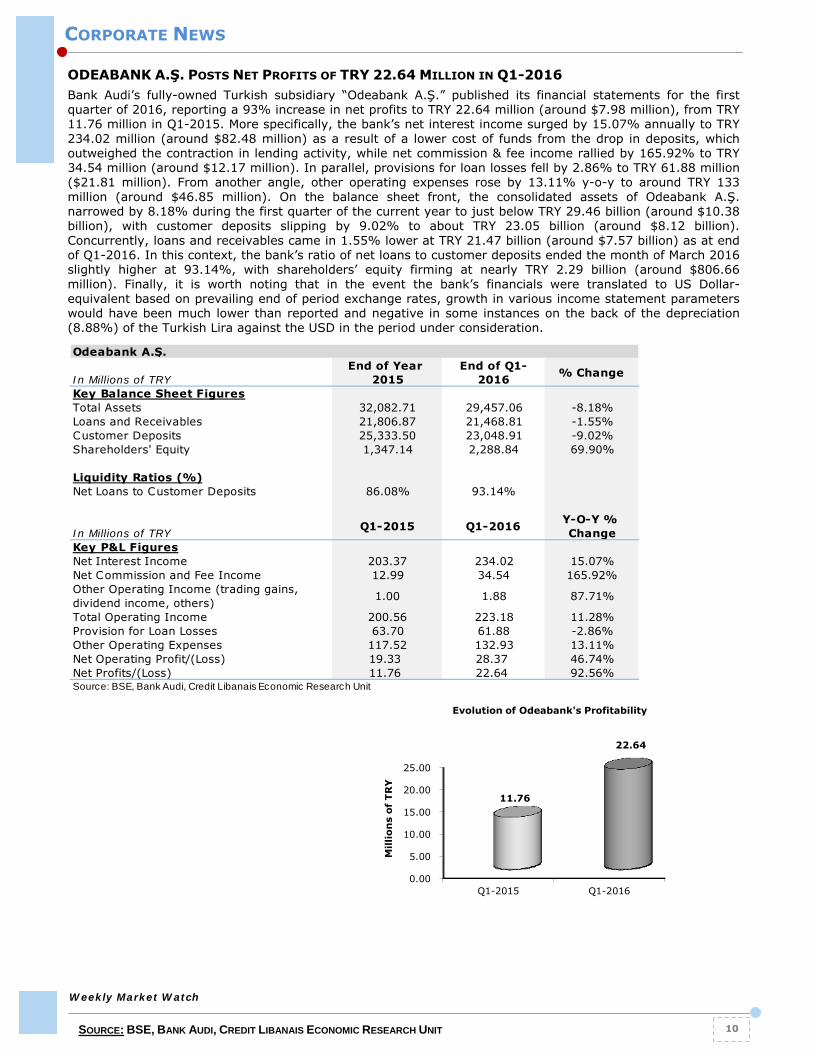
ODEABANK A.Ş. POSTS NET PROFITS OF TRY 22.64 MILLION IN Q1-2016
Bank Audi’s fully-owned Turkish subsidiary “Odeabank A.Ş.” published its financial statements for the first quarter of 2016, reporting a 93% increase in net profits to TRY 22.64 million (around $7.98 million), from TRY 11.76 million in Q1-2015. More specifically, the bank’s net interest income surged by 15.07% annually to TRY 234.02 million (around $82.48 million) as a result of a lower cost of funds from the drop in deposits, which outweighed the contraction in lending activity, while net commission & fee income rallied by 165.92% to TRY 34.54 million (around $12.17 million). In parallel, provisions for loan losses fell by 2.86% to TRY 61.88 million ($21.81 million). From another angle, other operating expenses rose by 13.11% y-o-y to around TRY 133 million (around $46.85 million). On the balance sheet front, the consolidated assets of Odeabank A.Ş. narrowed by 8.18% during the first quarter of the current year to just below TRY 29.46 billion (around $10.38 billion), with customer deposits slipping by 9.02% to about TRY 23.05 billion (around $8.12 billion). Concurrently, loans and receivables came in 1.55% lower at TRY 21.47 billion (around $7.57 billion) as at end of Q1-2016. In this context, the bank’s ratio of net loans to customer deposits ended the month of March 2016 slightly higher at 93.14%, with shareholders’ equity firming at nearly TRY 2.29 billion (around $806.66 million). Finally, it is worth noting that in the event the bank’s financials were translated to US Dollar-equivalent based on prevailing end of period exchange rates, growth in various income statement parameters would have been much lower than reported and negative in some instances on the back of the depreciation (8.88%) of the Turkish Lira against the USD in the period under consideration.
CORPORATE NEWS
0.00
5.00
10.00
15.00
20.00
25.00
Q1-2015 Q1-2016
11.76
22.64
Mill
ion
s of
TR
Y
Evolution of Odeabank's Profitability
In Millions of TRYEnd of Year
2015End of Q1-
2016 % Change
Key Balance Sheet FiguresTotal Assets 32,082.71 29,457.06 -8.18%Loans and Receivables 21,806.87 21,468.81 -1.55%Customer Deposits 25,333.50 23,048.91 -9.02%Shareholders' Equity 1,347.14 2,288.84 69.90%
Liquidity Ratios (%)Net Loans to Customer Deposits 86.08% 93.14%
In Millions of TRY Q1-2015 Q1-2016 Y-O-Y % Change
Key P&L FiguresNet Interest Income 203.37 234.02 15.07%Net Commission and Fee Income 12.99 34.54 165.92%Other Operating Income (trading gains, dividend income, others) 1.00 1.88 87.71%
Total Operating Income 200.56 223.18 11.28%Provision for Loan Losses 63.70 61.88 -2.86%Other Operating Expenses 117.52 132.93 13.11%Net Operating Profit/(Loss) 19.33 28.37 46.74%Net Profits/(Loss) 11.76 22.64 92.56%
Odeabank A.Ş.
Source: BSE, Bank Audi, Credit Libanais Economic Research Unit

MONETARY AGGREGATES
All monetary indicators ended the week of April 28, 2016 on a positive note. More specifically, the overall money supply, “M4”, expanded by LBP 1,095.49 billion to LBP 199,339 billion noting however that the non-banking sector Treasury bills portfolio dropped by LBP 6 billion. In parallel, Lebanese-pound denominated deposits and currency in circulation, “M1”, increased by LBP 554.48 billion week-on-week to LBP 8,864 billion, and this on the back of some LBP 160 billion expansion in money in circulation coupled with some LBP 394 billion surge in demand deposits. Similarly, local currency term deposits, “M2”, added LBP 719.39 billion on a weekly basis and registered an 8.42% year-on-year increase to LBP 79,548 billion. Consequently, private sector term and saving deposits denominated in LBP (“M2- M1”) edged slightly higher to LBP 70,685 billion, with deposits denominated in foreign currencies (“M3–M2”) firming at LBP 109,073 billion. MONEY MARKETS
The May 5th Treasury bill auction raised some LBP 318.23 billion ($211.09 million), compared to LBP 311.33 billion ($206.52 million) in the auction of the previous week.
Subscriptions were majority (86.56%) concentrated in the one-year to maturity T-bonds, followed by the five-year (11.80%) and three-month (1.63%) tenure bills.
Consequently, the weighted average yield on Lebanese Pound Treasury bills stood at 5.50% in the auction of May 5. The yields on the three-month, one-year and five-year to maturity treasury securities remained flat at 4.44%, 5.35% and 6.74% respectively.
MONETARY PERFORMANCE
Weekly Market Watch
SOURCE: BDL, REUTERS, CREDIT LIBANAIS ECONOMIC RESEARCH UNIT 11
3 Months
6 Months
12 Months
24 Months
36 Months
60 Months
84 Months
120 Months
180 Months
3.00%
4.00%
5.00%
6.00%
7.00%
8.00%
9.00%
0 1 2 3 4 5 6 7 8 9 10
On The Run Yield Curve
Lebanese Treasury Bills 3 Months 6 Months 12 Months 24 Months 36 Months 60 Months 84 Months 120 Months 180 MonthsTreasury Yield 4.44% 4.99% 5.35% 5.84% 6.50% 6.74% 7.08% 7.46% 7.90%
Money Supply
LBP billion
M1 8 ,3 0 9 8 ,86 4 6 .6 7%
M2 7 8 ,8 2 9 7 9 ,5 4 8 0 .91%
M3 18 7 ,5 2 0 18 8 ,6 21 0 .5 9%
M4 19 8 ,2 4 4 19 9 ,3 3 9 0 .5 5%
M2 - M1 7 0 ,5 2 0 7 0 ,6 8 5 0 .2 3%
M3 - M2 10 8 ,6 91 10 9 ,0 7 3 0 .3 5%Source: Banque Du Liban, Credit Libanais Economic Research Unit
April 21, 20 16 April 28 , 20 16 % Change
6,000
26,000
46,000
66,000
86,000
April 21, 2016
April 28, 2016
198,244 199,339187,520 188,621
Money Supply - LBP Billion -
M4 M3
Source: BDL, Credit Libanais Economic Research Unit
Lebanese Treasury Bills
Yield (%) Face Value (in billions
of LBP)
% of Total Face Value
3 Months 4.44% 5.200 1.63%12 Months 5.35% 275.461 86.56%60 Months 6.74% 37.564 11.80% Total 318.225 100.00%Source: Reuters, Credit Libanais Economic Research Unit
May 5, 2016

LEBANESE EQUITIES
Stock market activity was rather dynamic this week amid block trades on Bank Audi GDRs (more than 1 million GDRs), with 2,155,922 shares changing hands, up from 730,298 shares last week. Consequently, value traded soared to $14.52 million, from $4.85 million a week before. The contribution of banking sector stocks to total weekly traded volume stood at 96.82%. The average daily trading volume rose to 431,184 shares this week, from 182,575 shares last week. Similarly, the average daily trading value increased to $2.90 million, from $1.21 million a week earlier. Five losers and seven gainers were screened this week, lifting the BSE’s market capitalization higher by 0.32% week-on-week to around $11.07 billion and the Credit Libanais Aggregate Stock Index (“CLASI”) higher by 0.47% to 1,080.53. In the real estate sector, trades mainly consisted of Solidere “A” and “B” shares (2.50% of total traded volume) this week, with the price of Solidere “A” dropping by 0.10% to $9.84 while that of Solidere “B” added 0.10% to $9.90. Consequently, the Credit Libanais Construction Sector Stock Index (“CLCI”) ended its week up by 0.15% at 554.78. In the banking sector, Bank Audi GDRs amassed the highest concentration of trades (79.58% of total traded volume) on a turnover ratio of 1.49%. The Credit Libanais Financial Sector Stock Index (“CLFI”) rose by 0.55% this week to 1,415.35. This owes to the 0.68% appreciation in the price of the Bank Audi listed share to $5.90, coupled with a 3.28% hike in the price of the Bank Audi GDR to $5.99 and a 0.70% increase in the price of the BLOM Bank listed share to $10.12, which altogether outweighed the 0.61% contraction in the price of Byblos Bank listed shares to $1.63 and the 0.77% decline in the price of the BLOM Bank GDR to $10.31.
LEBANESE EQUITIES
Weekly Market Watch
SOURCE: BSE, CREDIT LIBANAIS ECONOMIC RESEARCH UNIT 12
Credit Libanais Week of Week of Weekly YTDIndices 6-May-16 13-May-16 % Change % ChangeCredit Libanais AggregateStock Index <.CLASI> 1,075.48 1,080.53 0.47% 1.19%
Credit Libanais FinancialSector Stock Index <.CLFI> 1,407.56 1,415.35 0.55% 2.09%
Credit Libanais ConstructionSector Stock Index <.CLCI> 553.93 554.78 0.15% -2.13%
1,000
1,020
1,040
1,060
1,080
1,100
1,120
1,140
13-M
ay-1
5
04-J
ul-1
5
25-A
ug-1
5
16-O
ct-1
5
07-D
ec-1
5
28-J
an-1
6
20-M
ar-1
6
11-M
ay-1
6
Ind
ex V
alu
e
Credit Libanais Aggregate Stock IndexWeekly Performance
CLASI
CLASI 0.47%
1,300
1,320
1,340
1,360
1,380
1,400
1,420
1,440
1,460
1,480
13-M
ay-1
5
04-J
ul-1
5
25-A
ug-1
5
16-O
ct-1
5
07-D
ec-1
5
28-J
an-1
6
20-M
ar-1
6
11-M
ay-1
6
Ind
ex V
alu
e
Credit Libanais Financial Sector Stock IndexWeekly Performance
CLFI
CLFI 0.55%
450
500
550
600
650
700
13-M
ay-1
5
04-J
ul-1
5
25-A
ug-1
5
16-O
ct-1
5
07-D
ec-1
5
28-J
an-1
6
20-M
ar-1
6
11-M
ay-1
6
Ind
ex V
alu
e
Credit Libanais Construction Sector Stock IndexWeekly Performance
CLCI
CLCI 0.15%
.CLASI Credit Libanais Aggregate Stock Index
Value Daily % Chng Daily Net Chng
1,080.53 0.046% 0.50
Yr.High Year Hi.Date Yr.Low Year.Lo.Date
1,115.09 6-Apr-16 1,065.48 9-Mar-16
Life High Life Hi.Date Life Low Life.Lo.Date
1,801.01 7-Jul-08 836.11 25-Mar-09
Friday, May 13, 2016

The weighted average price to earnings (P/E) multiple of listed stocks extended its upturn for the second consecutive week, closing its Friday session higher at 7.132x. The price to book (P/BV) metric of listed shares was no exception, bucking its downturn after four consecutive bearish weeks to reach 0.871x by Friday.
LEBANESE EQUITIES
Weekly Market Watch
SOURCE: BSE, CREDIT LIBANAIS ECONOMIC RESEARCH UNIT 13
P/E P/BV
Solidere A $9.84 -0.10% 41,658 1.93% $412,340 2.84% 100,000,000 $984,000 n.a 0.81 -11.03%Solidere B $9.90 0.10% 12,285 0.57% $122,124 0.84% 65,000,000 $643,500 n.a 0.81 -10.57%BLC Bank $1.69 0.00% - - - - 51,033,333 $86,246 7.35 0.70 -0.59%BLC Bank Preferred Class "A" $100.50 0.00% - - - - 400,000 $40,200 n.a n.a 0.50%BLC Bank Preferred Class "B" $101.00 0.00% - - - - 550,000 $55,550 n.a n.a -1.46%BLC Bank Preferred Class "C" $101.00 0.00% - - - - 350,000 $35,350 n.a n.a 0.00%Bank Audi - Listed Shares $5.90 0.68% 19,344 0.90% $113,888 0.78% 399,749,204 $2,358,520 6.56 0.82 -2.48%Bank Audi GDR $5.99 3.28% 1,715,755 79.58% $10,149,868 69.88% 114,988,117 $688,779 6.66 0.83 -0.17%Bank Audi Preferred "F" $100.00 0.00% 441 - $44,100 - 1,500,000 $150,000 n.a n.a -1.67%Bank Audi Preferred "G" $100.00 0.00% - - - - 1,500,000 $150,000 n.a n.a -0.99%Bank Audi Preferred "H" $100.00 0.00% 7,000 0.32% $700,200 4.82% 750,000 $75,000 n.a n.a -1.48%Bank Of Beirut - Listed Shares $18.80 0.00% - - - - 16,822,467 $316,262 9.08 1.29 0.00%Bank Of Beirut Priority Shares 2014 $21.00 0.00% - - - - 4,762,000 $100,002 10.14 1.44 0.00%Bank Of Beirut Preferred "H" $25.25 -4.72% 1,000 - $25,250 - 5,400,000 $136,350 n.a n.a -4.72%Bank Of Beirut Preferred "I" $25.25 -4.72% 11,990 - 302,748 - 5,000,000 $126,250 n.a n.a -4.72%Bank Of Beirut Preferred "J" $26.50 0.00% - - - - 3,000,000 $79,500 n.a n.a 2.91%Byblos Bank - Listed Shares $1.63 -0.61% 166,363 7.72% $270,728 1.86% 565,515,040 $921,790 7.76 0.73 1.24%Byblos Bank Preferred Class 2008 $100.90 0.90% 1,160 0.05% $117,000 0.81% 2,000,000 $201,800 n.a n.a -0.30%Byblos Bank Preferred Class 2009 $100.20 0.00% 2,277 0.11% $227,934 1.57% 2,000,000 $200,400 n.a n.a -0.40%Byblos Bank GDR $81.00 0.00% - - - - 1,309,078 $106,035 7.71 0.72 1.25%BEMO Bank - Listed Shares $1.75 0.00% - - - - 51,400,000 $89,950 9.72 1.09 -7.89%BEMO Bank Preferred Class 2013 $100.00 0.00% 2,500 0.12% $250,000 1.72% 350,000 $35,000 n.a n.a 0.00%BLOM Bank GDR $10.31 -0.77% 108,430 5.03% $1,116,907 7.69% 73,896,010 $761,868 5.93 0.90 5.74%BLOM Bank Listed Shares $10.12 0.70% 44,449 2.06% $450,585 3.10% 215,000,000 $2,175,800 5.82 0.89 7.66%BLOM Bank Preferred Class 2011 $10.10 1.00% 20,000 0.93% $202,000 1.39% 20,000,000 $202,000 n.a n.a -0.49%RYMCO Class "B" $3.23 0.00% - - - - 10,920,000 $35,272 14.04 1.66 0.00%Holcim Liban $14.47 1.19% 1,270 0.06% $18,783 0.13% 19,516,040 $282,397 19.3 1.23 -0.34%Ciment Blancs Bearer $3.00 0.00% - - - - 6,000,000 $18,000 6.25 1.23 -23.08%Ciment Blancs Nominal $3.10 0.00% - - - - 3,000,000 $9,300 6.46 1.27 0.00%
Lebanese Equities
BEIRUT STOCK EXCHANGE
Weekly Value Traded
Total Listed Shares
Weekly %Change
Closing
Source: Beirut Stock Exchange, Credit Libanais Economic Research Unit
% of Weekly Volume Traded
% of Weekly Value Traded
Note: n.a stands for not applicable
Market Capitalisation
($000) YTD Price
Perf.
Weekly Volume Traded
Source: BSE, Credit Libanais Economic Research Unit
0
2
4
6
8
May 6, 2016 May 13, 2016
7.091 7.132
0.867 0.871
Evolution of Beirut Bourse Comparable Benchmarks
P/E P/BV
Previous Last % ChangeValue Traded ($) 4,851,588 14,524,456 199.38%Volume Traded 730,298 2,155,922 195.21%Average Daily Trading Value ($) 1,212,897 2,904,891 139.50%Average Daily Trading Volume 182,575 431,184 136.17%Market Cap - BSE ($) 11,030,032,626 11,065,121,232 0.32%Weighted Average P/E 7.091 7.132 0.57%Weighted Average P/BV 0.867 0.871 0.47%
Activity Analysis
Source: Beirut Stock Exchange, Credit Libanais Economic Research Unit

LEBANON’S MAIN INDICATORS
Weekly Market Watch
SOURCE: BDL, ABL, MOF, IMF, CREDIT LIBANAIS ECONOMIC RESEARCH UNIT 14
2 0 0 9 2 0 10 2 0 11 2 0 12 2 0 13 2 0 14 2 0 15 2 0 16
MACROECONOMIC INDICATORS
GDP ($ Billion) 35.14 38.01 40.08 44.10 47.60 49.94* 51.17* 52.80*
Real GDP Growth Rate 10.30% 8.00% 0.90% 2.80% 2.50% 2.00%* 1.00%* 1.00%*
GDP Per Capita ($) 8,274 8,756 9,144 9,966 10,655 11,073* 11,237* 11,484*
Net Foreign Direct Investment ($ Billion) 4.84 4.96 3.40 2.30 3.79
FDI/GDP Ratio 13.77% 13.05% 11.79% 7.86% 12.71%
INDUS TRY
Industrial Exports ($ Million) 2,595 3,291 3,530 2,952 3,076 3,150 2,956
Import of Industrial Machinery ($ Million) 199 227 239 288 300 269 234
TOURISM
Total Number of Tourists 1,851,081 2,167,989 1,655,051 1,365,845 1,274,362 1,354,647 1,517,927 191,808 (3)
Growth in Tax- Free Spending 13% 21% 10% - 6% 4% 8% 2%
REAL ESTATE
Value of Real Estate Transactions ($ Million) 6,958 9,479 8,841 9,175 8,708 8,952 8,006 885 (3)
Number of Real Estate Sales Transactions 83,465 94,202 82,984 74,569 69,198 70,721 63,386 5,165 (3)
Construction Permits (000 sqm) 11,509 15,187 13,980 12,362 10,527 11,164 10,294 2,678 (4)
Cement Delivery (000 tons) 4,897 5,227 5,550 5,309 5,831 5,517 5,043
TRANSPORTATION
Beirut Port: Freight Activity (000 Tons) 5,769 6,469 6,677 7,225 8,268 8,281 7,240 2,174 (4)
Beirut Airport: Number of Passengers (million) 4.74 5.55 5.65 5.96 6.26 6.57 8.22 2.08 (6)
FOREIGN TRADE
Imports ($ Million) 16,242 17,964 20,158 21,280 21,228 20,494 18,069 4,622 (4)
Exports ($ Million) 3,484 4,253 4,265 4,483 3,936 3,313 2,952 639 (4)
Trade Balance ($ Million) (12,758) (13,711) (15,893) (16,797) (17,292) (17,181) (15,117) (3,983) (4)
BALANCE OF PAYMENTS
Net Foreign Assets at the Financial Sector ($ Million) 7,899 3,325 (1,996) (1,537) (1,127) (1,407) (3,354) (356) (3)
Foreign Assets ($ Billion) 28.30 30.85 32.24 35.74 35.29 37.86 37.09 36.03 (6)
PUBLIC FINANCE
Government Expenditures ($ Million) 11,388 11,336 11,675 13,321 13,640 13,952 13,528
Government Revenues ($ Million) 8,428 8,414 9,333 9,396 9,420 10,879 9,576
Budget Primary Defic it / Surplus ($ Million) 3,380 1,203 1,662 (110) (240) 1,307 724
Total Defic it ($ Million) (2,960) (2,894) (2,342) (3,925) (4,220) (3,073) (3,952)
Defic it / GDP Ratio 8.42% 7.61% 5.84% 8.90% 8.87% 6.14% 7.26%
Debt Service / GDP Ratio 11.49% 10.85% 9.99% 8.21% 7.96% 8.75% 8.60%
Net Public Debt ($ Billion) 44.11 45.01 46.35 49.12 53.18 57.30 61.54 62.60 (4)
Gross Public Debt/GDP Ratio 145.57% 138.39% 133.89% 130.80% 133.36% 133.05% 132.40%
MONETARY AGGREGATES & INFLATION
M4 ($ Billion) 87.08 97.31 103.50 110.00 117.41 124.53 131.17 132.23 (5)
(M2- M1) ($ Billion) 31.14 35.66 35.82 39.32 40.56 43.27 46.25 46.89 (5)
Monetization Level (M2/GDP Ratio) 97.35% 103.46% 99.32% 103.14% 102.75% 102.34%
Change in CPI (%) 4.20% 6.19% 4.27% 4.68% 2.05% - 1.66% - 3.40% - 3.57% (4)
BANKING SYSTEM
Number of Commercial Banks 53 54 54 54 56 55 54 (1)
Number of Branches 885 912 948 962 985 1,020 1,033 (1)
Total Assets ($ Million) 115,250 128,925 140,576 151,883 164,821 175,697 185,989 187,659 (4)
Total Deposits ($ Million) 96,821 108,601 117,703 127,657 139,166 147,637 154,951 155,908 (4)
Loans to the Private Sector ($ Million) 28,374 34,929 39,375 43,452 47,381 50,899 54,224 55,054 (4)
Customer Loans/ Deposits 29.31% 32.16% 33.45% 34.04% 34.05% 34.48% 34.99% 35.31% (4)
Dollarization Rate 64.46% 63.24% 65.92% 64.82% 66.10% 65.71% 64.88% 64.81% (4)
Net Profit - After Tax ($ Million) 1,429 1,838 1,743 1,620
Exchange Rate (LBP to USD) 1,507.50 1,507.50 1,507.50 1,507.50 1,507.50 1,507.50 1,507.50 1,507.50
* Figures Reflect IM F Estimates
(1) As at End o f September, 2015, (2 ) As at End o f January, 2016, (3 ) As at End o f February, 2016, (4) As at End of M arch, 2016, (5 ) As at April 28, 2016, (6 ) As at End of April, 2016
Recap of Lebanon's Major Indicators
LEBANON’S RATINGS
Weekly Market Watch
SOURCE: S&P, MOODY’S, FITCH, CAPITAL INTELLIGENCE, CREDIT LIBANAIS ECONOMIC RESEARCH UNIT 15
Rated Banks
Long Term Foreign Currency
Financial Strength
Outlook Long Term Foreign Currency
Outlook Long Term IDR
Outlook Long-Term Counterparty Credit Rating
Short-Term Counterparty Credit Rating
Outlook
Bank Audi B2 E+ Negative B Stable B Stable B- C Negative
BLOM Bank B2 E+ Negative B Stable - - B- - Negative
Credit Libanais - - - B Stable - - - - -
Byblos Bank B2 E+ Negative B Stable B Stable - - -
BBAC - - - B Stable - - - - -
Fransabank - - - B Stable - - - - -
BankMed - - - - - - - B- C Negative
Lebanese Banks' Latest Ratings
Capital Intelligence Moody's Investors Service Fitch Ratings
Sources: M oody's Investors Service, Capital Intelligence, Fitch Ratings, S&P Ratings
S&P Ratings
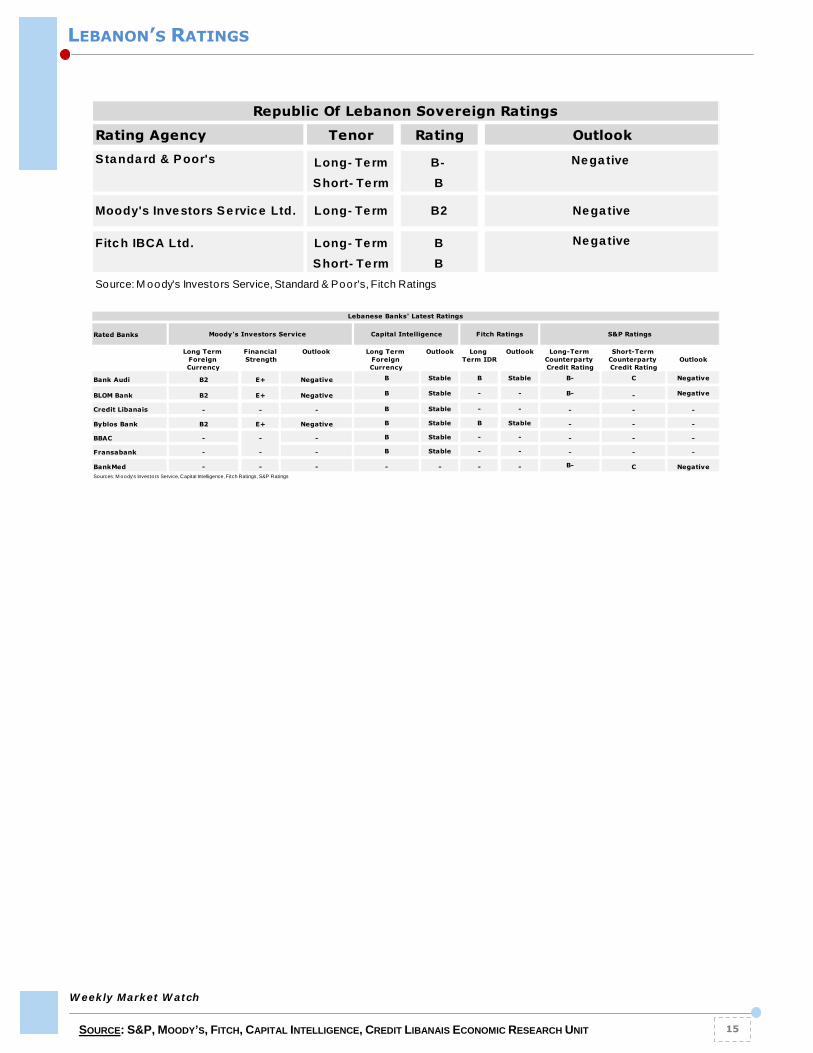
Rating Agency Tenor Rating
Long- Te rm B-
Short- Te rm B
Moody's Inve stors Se rvic e Ltd. Long- Te rm B2
Fitc h IBCA Ltd. Long- Te rm B
Short- Te rm B
Source: M oody's Investors Service, Standard & Poor's, Fitch Ratings
Republic Of Lebanon Sovereign Ratings
Outlook
Standa rd & Poor's Ne ga tive
Ne ga tive
Ne ga tive

CONTACTS
RESEARCH
Fadlo I. Choueiri, CFA
961-1-608 000 EXT: 1280 Jad Abi Haidar [email protected] 961-1-608 000 EXT. 1283
Joelle Samaha [email protected] 961-1-608 000 EXT. 1281 Joanna Gergi [email protected] 961-1-608 000 EXT. 1284
Mayda Zaarour [email protected] 961-1-608 000 EXT. 1282
MONEY MARKETS DESK
Robert Araman
961-1-608 000 EXT. 0760
This document is being furnished to you solely for your information and may not be reproduced or redistributed to any other person. This document does not constitute an offer or invitation to subscribe to or purchase any security, and neither this document nor anything contained herein shall form the basis of any contract or commitment whatsoever. Reasonable care has been taken to ensure that the facts stated herein are accurate and the estimates, opinions and expectations contained herein are fair and reliable.
Weekly Market Watch
ECONOMIC RESEARCH UNIT - ADLIEH, BEIRUT LEBANON - TEL: 01-608000 FAX: 01-608231 16