Embed Size (px)
Citation preview
Fadlo Choueiri, CFA Patrick Karawani +961-1-608000 Ext: 1280 +961-1-608000 Ext: 1282 [email protected] [email protected]
Credit Libanais SAL Economic Research Unit January 2015
OIL & GAS SECTOR: A NEW ECONOMIC PILLAR FOR LEBANON
Credit Libanais Economic Research Unit
JANUARY 2015
OIL & GAS SECTOR: A NEW ECONOMIC PILLAR FOR LEBANON
Credit Libanais Economic Research Unit
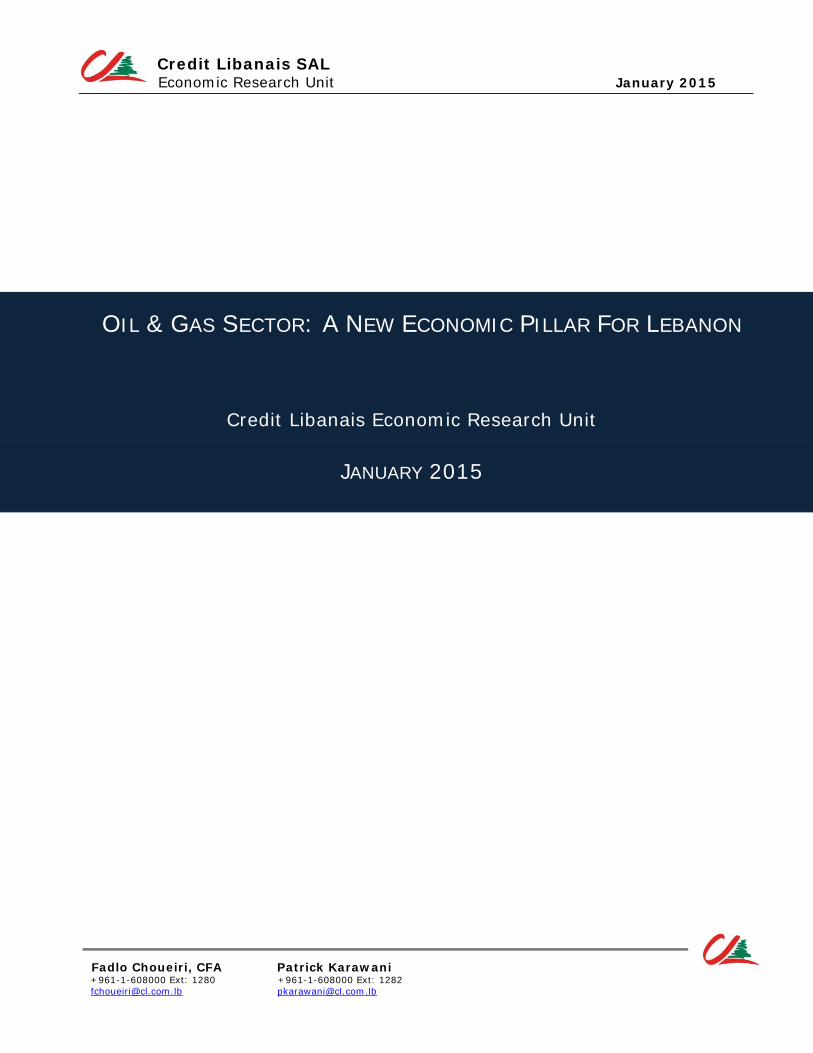
Executive Summary In the midst of the raging waters clawing the Arab world and the murky horizons smudging Lebanon’s future political and economic picture, a new gem has shined within the Middle Eastern seas, opening the page for a new era of economic prosperity. Discoveries of black gold have, in fact, enkindled the flame of hope to a country that has been suffering of ailing public finances for quite some time, fetching promises of healing Lebanon’s economic woes, from current account deficit to budget deficit, while paving the way towards a blossoming economic journey. This research report strives to quantify the potential repercussions of Lebanon’s oil & gas reserves on major macroeconomic indicators under the umbrella of the scenario and set of hypothesis adopted. Oil reserves under the scenario adopted were based on the mid value of the estimated interval of 440 million barrels to 675 million barrels of oil reserves conveyed by Beicip Franlab, the French company which conducted the seismic surveys, while gas reserves figures centered upon the interval of 12 trillion to 25 trillion cubic feet unveiled by Spectrum, the British company which surveyed the Lebanese coast. It is worth noting that a production horizon of 20 years was adopted in the following paper, mimicking the estimates relayed to the press by the secretary-general of the World Energy Council. In this context, we project the value of oil production to stand at $3.05 billion in the first year of extraction (2020), with gas production value estimated at $4.96 billion. The total oil & gas output value is thus estimated at $8.01 billion in the first year of production, lifting as such the extrapolated nominal GDP figure to $77.60 billion in the year 2020, from an estimated $69.59 billion reading in the absence of oil & gas discoveries. In parallel, our research publication projects Lebanon’s current account balance to turn into a surplus during the hydrocarbon production period, appreciating from $0.42 billion in the year 2020 to $2.87 billion in the year 2039. These figures compare to estimated current account deficits of $4.39 billion by end of year 2020 and $8.12 billion in the year 2039 when excluding hydrocarbon production. On the public finance front, our research report expects the budget deficit to shed 5.64 percentage points in the first year of hydrocarbon extraction and settle at 4.36% of nominal GDP under the scenario adopted. The budget deficit has a tendency to increase gradually afterwards and reach 5.65% of GDP in the last year of production (2039), owing to the faster pace of growth in non-oil deficit when compared to the growth in oil & gas receipts.
O
IL &
GAS S
ECTO
R:
A N
EW E
CO
NO
MIC
PIL
LAR F
OR L
EBAN
ON –
JAN
UARY
2015
N atural Gas 2
($ 163.91 billio n)
Go vernment T ake 3 ($ billio n)
Excluding Oil & Gas
P ro duct io n
Including Oil & Gas
P ro duct io n
Excluding Oil & Gas
P ro duct io n
Including Oil & Gas
P ro duct io n
2019 65.651 - - - - 10.00% 10.00% -4.19 -
2020 69.590 3.05 4.96 77.596 3.58 10.00% 4.36% -4.39 0.42
2021 73.765 3.18 5.37 82.316 3.82 10.00% 4.32% -4.58 0.55
2022 78.191 3.31 5.64 87.149 4.00 10.00% 4.38% -4.78 0.60
2023 82.883 3.46 5.90 92.243 4.18 10.00% 4.45% -4.97 0.64
2024 87.856 3.60 6.20 97.657 4.38 10.00% 4.51% -5.17 0.71
2025 93.127 3.74 6.45 103.316 4.55 10.00% 4.61% -5.37 0.75
(1) Oil reserves figures are based on data published by Beicip Franlab, and have also been published by B loomberg on the 6th o f February 2013 and by Clyde&Co LLP and Kabalan Law Firm in February 2013, and later by Naharnet on February 13, 2013
T he Implicat io ns o f Oil & Gas R eso urces o n Lebano n's Eco no my: Outco mes o f the Simulated Scenario
Year Oil 1
($ 89.89 billio n)
H ydro carbo n P ro duct io n
N o minal GD P including o il & gas ($ billio n)
N o minal GD P
Excluding Oil & Gas ($ billio n)
C urrent A cco unt B alance ($ billio n)
B udget D ef icit (% o f GD P )
(2) The vo lume of gas reserves was primarly uncovered to the press by Spectrum and published on the official website o f the Energy Information Administration (EIA), and published as well on the webpage of the renowned London-based consulting and law firm CM S Cameron M cKenna, and by The Daily Star newspaper on September 22, 2012, and on January 31, 2013, citing M r. David Rowlands, CEO of Spectrum. Said figures are in line with the figures revealed in the Lebanon Opportunities magazine, M ay 2013 issue(3) Government revenues are based on our hypothesis o f a 60% share of gross pro fits for the government, added royalty fees o f 4% for o il extraction and between 5% and 12% for gas extraction based on information published on the Lebanese Petro leum Administration’s official website, and a fixed corporate income tax rate o f 15%. It is also worth noting that we have adopted in our scenario a 60% gross profit margin on hydrocarbon extraction as uncovered by the M inistry o f Energy and Water.
OIL & GAS SECTOR: A NEW ECONOMIC PILLAR FOR LEBANON
Credit Libanais Economic Research Unit
IMPORTANT NOTICE
This economic research publication has been prepared by the economic research unit at Credit Libanais SAL on the basis of published information and other sources which are deemed reliable. It is intended for limited use only and its re-distribution without the prior written consent of Credit Libanais is strictly prohibited.
Credit Libanais does not make any warranty or representation, expressed or implied, as to the accuracy or completeness of the materials contained herein. Neither the information nor the opinions expressed herein constitute, or are to be construed as an offer or solicitation of an offer to buy or sell investments. Opinions and data expressed herein may be subject to change without prior notice.
OIL & GAS SECTOR: A NEW ECONOMIC PILLAR FOR LEBANON
Credit Libanais Economic Research Unit
TABLE OF CONTENTS
I- OVERVIEW ON THE LEBANESE ECONOMY AND DEPENDENCE ON OIL CONSUMPTION 1
II- THE DISCOVERY OF OIL & GAS RESERVES IN LEBANON 4
A. The Preliminary Stages of the Exploration 4
B. The Seismic Surveys 5
C. The Estimated Size of Lebanon’s Oil & Gas Reserves 6
D. Lebanon’s Oil & Gas Production Capacity 7
III- THE IMPLEMENTED MEASURES TO DATE 8
A. The Creation of the Petroleum Administration 8
B. The Issuance of the Offshore Petroleum Law & Related Regulations 8
C. The Bidding Process 9
D. The Production Cycle 12
IV- THE STRUCTURE OF THE PARTNERSHIP BETWEEN THE PUBLIC & THE PRIVATE SECTOR 13
A. Type of Partnership 13
1. Definitions 13
2. Partnership Structure 14
B. Revenues/Profits Sharing 14
C. Financing the Oil & Gas Production Process 15
V- ECONOMIC REPERCUSSIONS OF OIL & GAS PRODUCTION 16
A. Model Assumptions 16
B. Economic Growth 17
1. Direct Impact 17
2. Indirect Impact 19
a. Methodology and Variables 20
b. Regressions and Results 20
C. Public Finance 24
D. Balance of Payments 26
1. Current Account 26
2. Capital Account 28
E. Potential Negative Repercussions 29
1. Inflation 30
2. Exchange Rate 30
OIL & GAS SECTOR: A NEW ECONOMIC PILLAR FOR LEBANON
Credit Libanais Economic Research Unit
VI- OBSTACLES AND MEASURES 31
A. Political Obstacles and Risks 31
1. Borders 31
2. Political Factors 31
B. Economic Obstacles and Corrective Measures 32
1. Cost of Drilling and the Sector’s Profitability 32
2. Management of the Public Revenues 32
a. Sovereign Wealth Fund 32
b. Reduce Budget Deficit 33
c. Increase Public Expenditures 34
Appendix 35
OIL & GAS SECTOR: A NEW ECONOMIC PILLAR FOR LEBANON
Credit Libanais Economic Research Unit
SYNOPSIS OF TERMS “ADIA” Abu Dhabi Investment Authority
“BBO” Buy-Build -Operate
“BOO” Build-Own-Operate
“BOT” Build-Operate-Transfer
“CIA” Central Intelligence Agency
“EEZ” Exclusive Economic Zone
“EIA” Energy Information Administration
“EPA” Exploration and Production Agreement
“GDP” Gross Domestic Product
“IMF” International Monetary Fund
“LBP” The Lebanese Pound
“MOEW” Ministry of Energy and Water
“MP” Member of Parliament
“OPRL” Offshore Petroleum Resources Law
“PA” Petroleum Administration
“PAR” Petroleum Activities Regulations
“PGS” Petroleum Geo-Services
“PPP” Public-Private Partnership
“QHSE” Quality, Health, Safety, and
Environment
“QIA” Qatar Investment Authority
“U.N.” The United Nations
“$” The United States Dollar
“SPV” Special Purpose Vehicle
“TCF” Trillion Cubic Feet
“UNCLOS” United Nations Convention on Law
of the Sea
OIL & GAS SECTOR: A NEW ECONOMIC PILLAR FOR LEBANON
Credit Libanais Economic Research Unit
“US” United States of America
“UK” United Kingdom
“USD” United States Dollar
“USGS” U.S. Geological Survey
“VAR” Vector Auto Regression Estimates
“Y-O-Y” Year-on-Year
OIL & GAS SECTOR: A NEW ECONOMIC PILLAR FOR LEBANON
Credit Libanais Economic Research Unit Page 1
I. OVERVIEW ON THE LEBANESE ECONOMY AND DEPENDENCE ON OIL CONSUMPTION
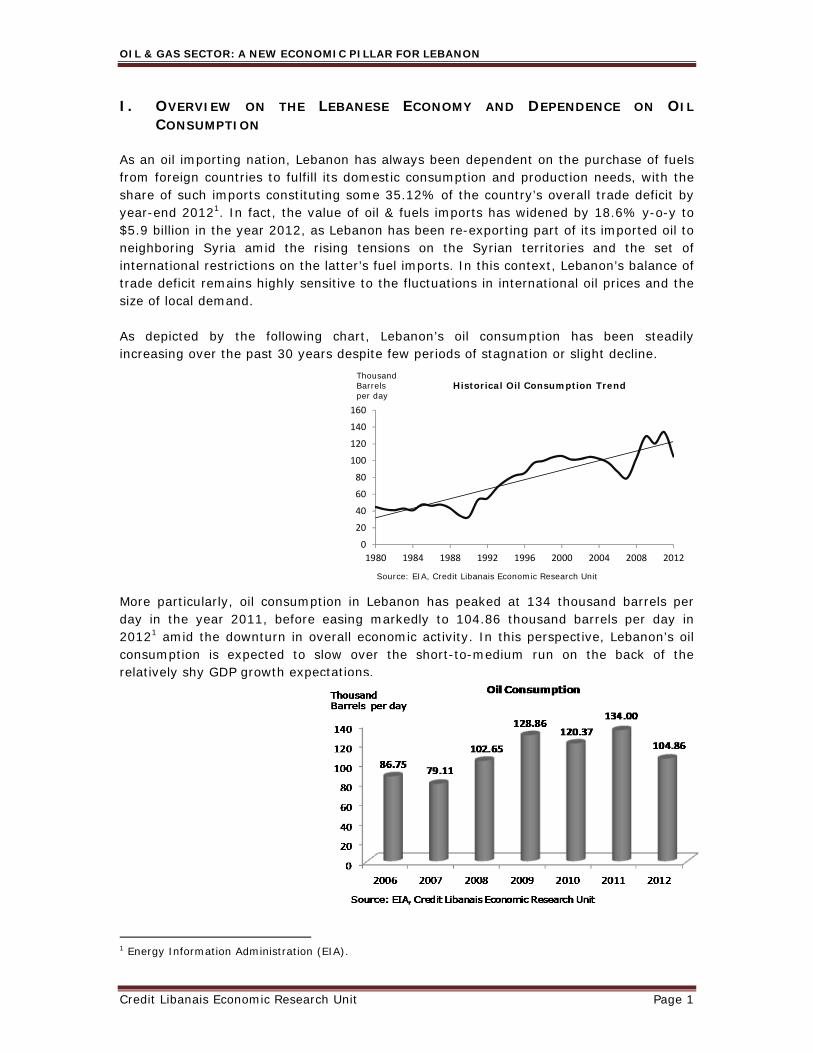
As an oil importing nation, Lebanon has always been dependent on the purchase of fuels from foreign countries to fulfill its domestic consumption and production needs, with the share of such imports constituting some 35.12% of the country’s overall trade deficit by year-end 20121. In fact, the value of oil & fuels imports has widened by 18.6% y-o-y to $5.9 billion in the year 2012, as Lebanon has been re-exporting part of its imported oil to neighboring Syria amid the rising tensions on the Syrian territories and the set of international restrictions on the latter’s fuel imports. In this context, Lebanon’s balance of trade deficit remains highly sensitive to the fluctuations in international oil prices and the size of local demand. As depicted by the following chart, Lebanon’s oil consumption has been steadily increasing over the past 30 years despite few periods of stagnation or slight decline.
More particularly, oil consumption in Lebanon has peaked at 134 thousand barrels per day in the year 2011, before easing markedly to 104.86 thousand barrels per day in 20121 amid the downturn in overall economic activity. In this perspective, Lebanon’s oil consumption is expected to slow over the short-to-medium run on the back of the relatively shy GDP growth expectations.
1 Energy Information Administration (EIA).
0
20
40
60
80
100
120
140
160
1980 1984 1988 1992 1996 2000 2004 2008 2012
Historical Oil Consumption TrendThousand Barrelsper day
Source: EIA, Credit Libanais Economic Research Unit
OIL & GAS SECTOR: A NEW ECONOMIC PILLAR FOR LEBANON
Credit Libanais Economic Research Unit Page 2
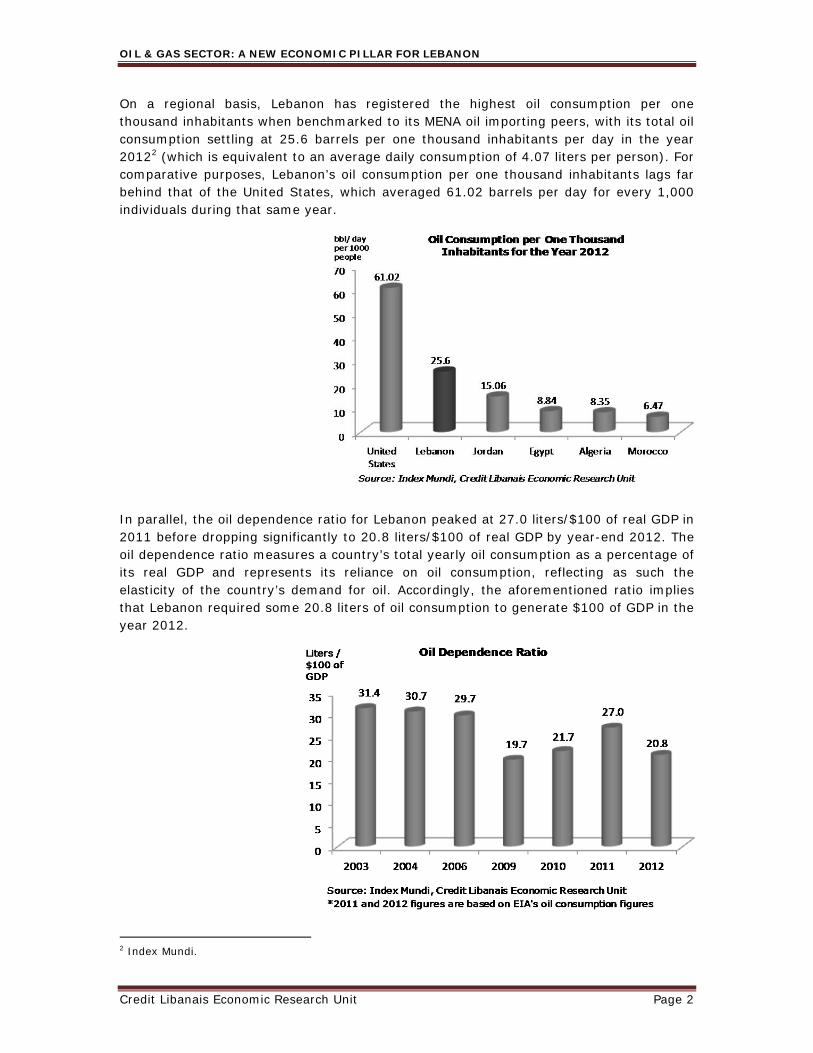
On a regional basis, Lebanon has registered the highest oil consumption per one thousand inhabitants when benchmarked to its MENA oil importing peers, with its total oil consumption settling at 25.6 barrels per one thousand inhabitants per day in the year 20122 (which is equivalent to an average daily consumption of 4.07 liters per person). For comparative purposes, Lebanon’s oil consumption per one thousand inhabitants lags far behind that of the United States, which averaged 61.02 barrels per day for every 1,000 individuals during that same year.
In parallel, the oil dependence ratio for Lebanon peaked at 27.0 liters/$100 of real GDP in 2011 before dropping significantly to 20.8 liters/$100 of real GDP by year-end 2012. The oil dependence ratio measures a country’s total yearly oil consumption as a percentage of its real GDP and represents its reliance on oil consumption, reflecting as such the elasticity of the country’s demand for oil. Accordingly, the aforementioned ratio implies that Lebanon required some 20.8 liters of oil consumption to generate $100 of GDP in the year 2012.
2 Index Mundi.
OIL & GAS SECTOR: A NEW ECONOMIC PILLAR FOR LEBANON
Credit Libanais Economic Research Unit Page 3
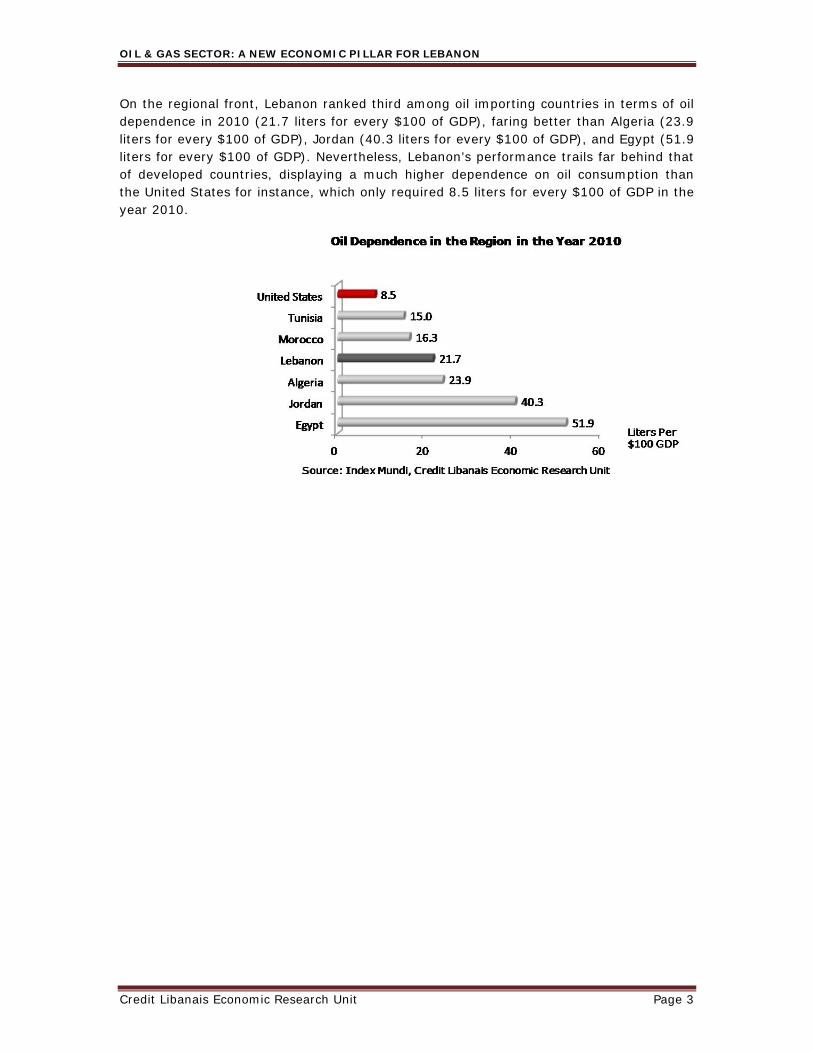
On the regional front, Lebanon ranked third among oil importing countries in terms of oil dependence in 2010 (21.7 liters for every $100 of GDP), faring better than Algeria (23.9 liters for every $100 of GDP), Jordan (40.3 liters for every $100 of GDP), and Egypt (51.9 liters for every $100 of GDP). Nevertheless, Lebanon’s performance trails far behind that of developed countries, displaying a much higher dependence on oil consumption than the United States for instance, which only required 8.5 liters for every $100 of GDP in the year 2010.
OIL & GAS SECTOR: A NEW ECONOMIC PILLAR FOR LEBANON
Credit Libanais Economic Research Unit Page 4
II. THE DISCOVERY OF OIL & GAS RESERVES IN LEBANON
A. THE PRELIMINARY STAGES OF THE EXPLORATION
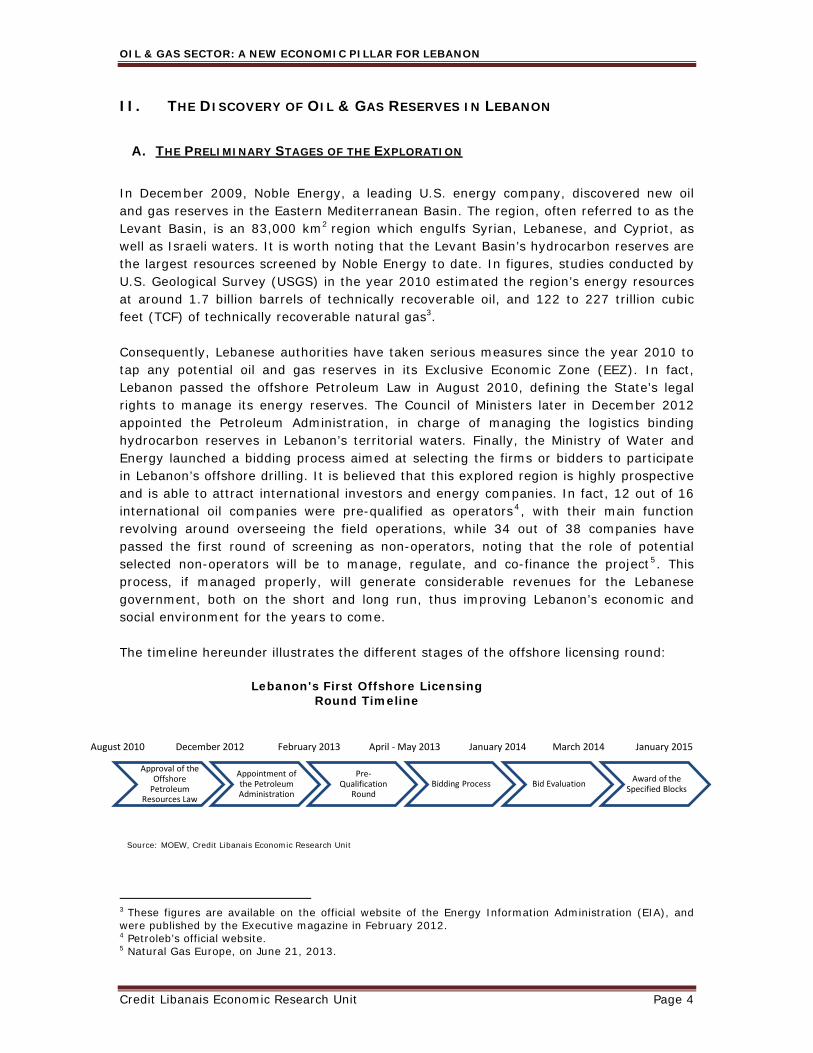
In December 2009, Noble Energy, a leading U.S. energy company, discovered new oil and gas reserves in the Eastern Mediterranean Basin. The region, often referred to as the Levant Basin, is an 83,000 km2 region which engulfs Syrian, Lebanese, and Cypriot, as well as Israeli waters. It is worth noting that the Levant Basin’s hydrocarbon reserves are the largest resources screened by Noble Energy to date. In figures, studies conducted by U.S. Geological Survey (USGS) in the year 2010 estimated the region’s energy resources at around 1.7 billion barrels of technically recoverable oil, and 122 to 227 trillion cubic feet (TCF) of technically recoverable natural gas3. Consequently, Lebanese authorities have taken serious measures since the year 2010 to tap any potential oil and gas reserves in its Exclusive Economic Zone (EEZ). In fact, Lebanon passed the offshore Petroleum Law in August 2010, defining the State’s legal rights to manage its energy reserves. The Council of Ministers later in December 2012 appointed the Petroleum Administration, in charge of managing the logistics binding hydrocarbon reserves in Lebanon’s territorial waters. Finally, the Ministry of Water and Energy launched a bidding process aimed at selecting the firms or bidders to participate in Lebanon’s offshore drilling. It is believed that this explored region is highly prospective and is able to attract international investors and energy companies. In fact, 12 out of 16 international oil companies were pre-qualified as operators4, with their main function revolving around overseeing the field operations, while 34 out of 38 companies have passed the first round of screening as non-operators, noting that the role of potential selected non-operators will be to manage, regulate, and co-finance the project5. This process, if managed properly, will generate considerable revenues for the Lebanese government, both on the short and long run, thus improving Lebanon’s economic and social environment for the years to come. The timeline hereunder illustrates the different stages of the offshore licensing round:
3 These figures are available on the official website of the Energy Information Administration (EIA), and were published by the Executive magazine in February 2012. 4 Petroleb’s official website. 5 Natural Gas Europe, on June 21, 2013.
Appointment of the Petroleum Administration
Approval of the Offshore Petroleum
Resources Law
Pre‐Qualification
RoundBidding Process Bid Evaluation
Award of the Specified Blocks
August 2010 December 2012 February 2013 April ‐May 2013 January 2014 March 2014 January 2015
Lebanon's First Offshore Licensing Round Timeline
Source: MOEW, Credit Libanais Economic Research Unit
OIL & GAS SECTOR: A NEW ECONOMIC PILLAR FOR LEBANON
Credit Libanais Economic Research Unit Page 5
It is worth noting, however, that this timeframe is tentative and the date concerning the award of the blocks may be subject to further delays given the current government void and the lack of consensus on the prerogatives of the caretaker government.
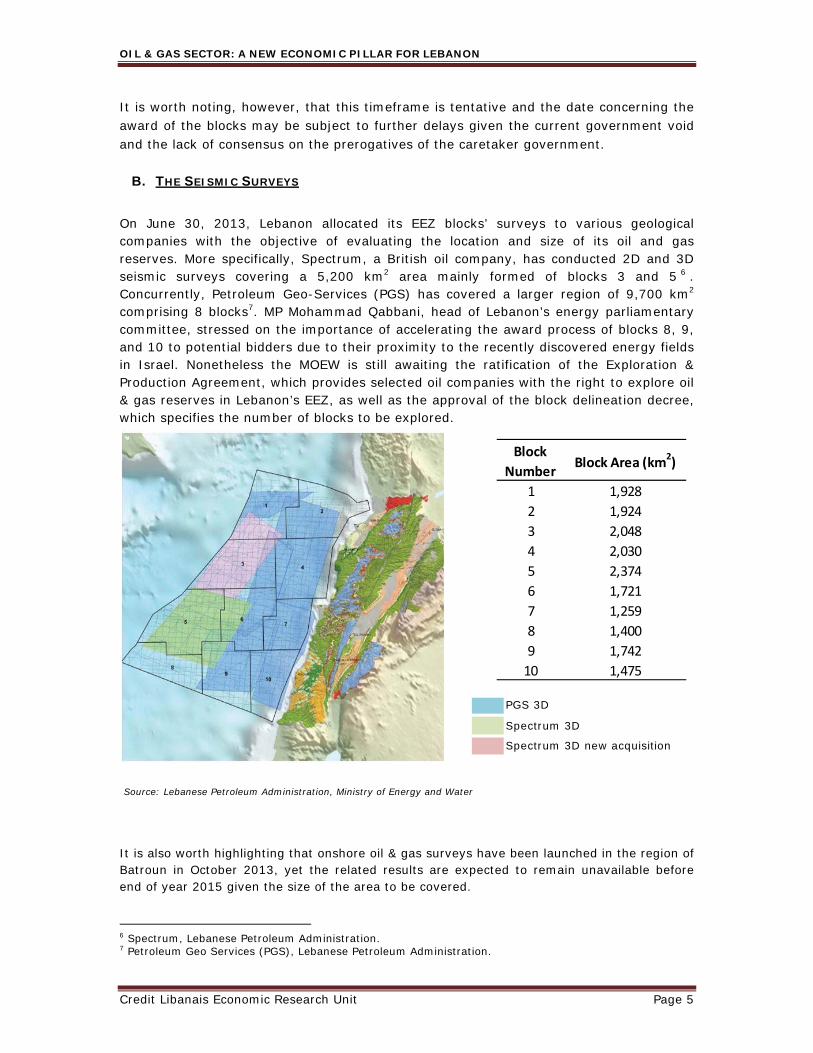
B. THE SEISMIC SURVEYS
On June 30, 2013, Lebanon allocated its EEZ blocks’ surveys to various geological companies with the objective of evaluating the location and size of its oil and gas reserves. More specifically, Spectrum, a British oil company, has conducted 2D and 3D seismic surveys covering a 5,200 km2 area mainly formed of blocks 3 and 5 6 . Concurrently, Petroleum Geo-Services (PGS) has covered a larger region of 9,700 km2 comprising 8 blocks7. MP Mohammad Qabbani, head of Lebanon’s energy parliamentary committee, stressed on the importance of accelerating the award process of blocks 8, 9, and 10 to potential bidders due to their proximity to the recently discovered energy fields in Israel. Nonetheless the MOEW is still awaiting the ratification of the Exploration & Production Agreement, which provides selected oil companies with the right to explore oil & gas reserves in Lebanon’s EEZ, as well as the approval of the block delineation decree, which specifies the number of blocks to be explored.
It is also worth highlighting that onshore oil & gas surveys have been launched in the region of Batroun in October 2013, yet the related results are expected to remain unavailable before end of year 2015 given the size of the area to be covered. 6 Spectrum, Lebanese Petroleum Administration. 7 Petroleum Geo Services (PGS), Lebanese Petroleum Administration.
Source: Lebanese Petroleum Administration, Ministry of Energy and Water
PGS 3D
Spectrum 3D
Spectrum 3D new acquisition
Block
NumberBlock Area (km
2)
1 1,928
2 1,924
3 2,048
4 2,030
5 2,374
6 1,721
7 1,259
8 1,400
9 1,742
10 1,475
OIL & GAS SECTOR: A NEW ECONOMIC PILLAR FOR LEBANON
Credit Libanais Economic Research Unit Page 6
In this context, a contract has been recently signed between the Ministry of Energy and Water and the U.S.-based firm “NEOS”, represented by its General Manager Mr. Frank Jreij, to conduct an airborne onshore oil survey over the Lebanese territories. The $7.8 million project, named Cedar Oil, will see the U.S. firm survey some 6,000 square kilometers over the northern part of Lebanon. It is worth noting that international oil companies showed no interest in the project and refused to fund the onshore survey8. Mr. Jreij clarified that the first stage will span over two months, while the data acquisition process would take some seven months, with the whole project spanning over a period of eighteen months.
C. THE ESTIMATED SIZE OF LEBANON’S OIL AND GAS RESERVES
An Exclusive Economic Zone (EEZ), as defined by the 1982 United Nations Convention on the Law of the Sea (UNCLOS)9, is the region adjacent to the territorial waters, in which the state has the right to exercise any sort of activity regarding the natural resources comprised in that region, i.e. exploring and managing said resources. Lebanon’s EEZ is a 22,730 km2 region bordering Syrian, Israeli, and Cypriot waters. Accordingly, Lebanon’s EEZ constitutes an integral part of the Levant Basin, and therefore engulfs considerable amounts of technically recoverable oil and gas. Having passed the Offshore Petroleum Law, the State is now entitled to all natural resources in its territorial and offshore waters. According to the estimates of the British oil company –Spectrum-, Lebanese waters contain between 12 and 25 trillion cubic feet (TCF) of technically recoverable gas10. Beicip Franlab, concurrently, estimated Lebanon’s oil reserves to range between 440 and 675 million barrels of oil11. Our estimates of the value of Lebanon’s hydrocarbon production, under the umbrella of the analyzed scenario, are based on the price forecast interval published by the Energy Information Administration (EIA)12, the statistical and analytical agency within the US Department of Energy. It is worth noting that the sharp drop in oil prices in the last quarter of 2014 was not accounted for in our model given that production will not kick-in before the year 2020, and that this downturn is likely to be only temporary. Accordingly, and based on EIA’s forecasts of natural gas prices, which range between $4.96 billion per TCF in the year 2020 and $12.04 billion per TCF in the year 2039, the total estimated value of Lebanon’s gas reserves is $163.91 billion. Similarly and when applying the EIA’s forecast interval concerning the evolution of international oil prices, which range between $109.37 per barrel in the year 2020 and $224.62 per barrel in the year 2039, Lebanon’s oil reserves are estimated at around $90 billion under our adopted scenario.
8 As unveiled by the Executive Magazine issue No. 184, November 2014. 9 United Nation’s Convention on the Law of the Sea’s report, 1982. 10 The figures initially issued by Spectrum are available on the Energy Information Administration’s website, and were published by CMS Cameron McKenna law firm on September 26, 2011, and by The Daily Star on the 22nd of September 2012, and the 31st of January 2013, citing Mr. David Rowlands, CEO of Spectrum. Said figures are in line with the figures revealed in the May 2013 issue of Lebanon Opportunities magazine. 11 These estimates were published by Bloomberg, on the 6th of February, 2013, by Clyde&Co LLP and Kabalan Law Firm in February 2013, and by Naharnet, on February 13, 2013. 12 EIA price forecast interval for oil and gas is annexed on page 35.
OIL & GAS SECTOR: A NEW ECONOMIC PILLAR FOR LEBANON
Credit Libanais Economic Research Unit Page 7
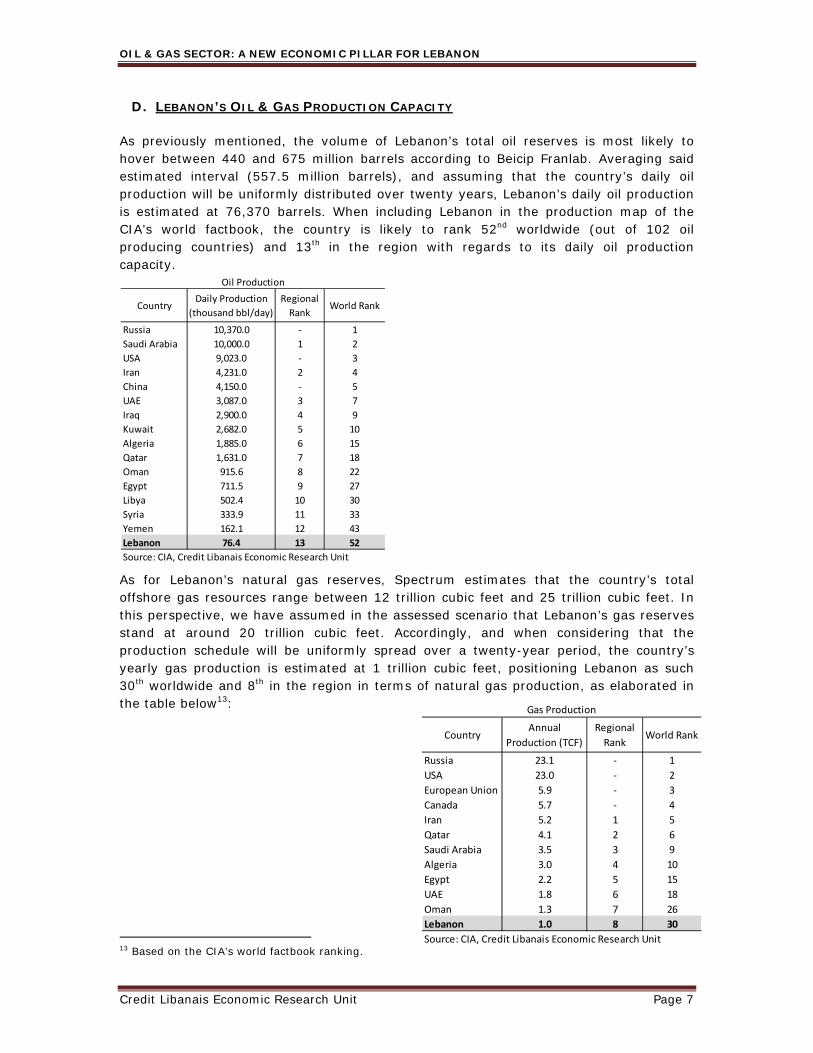
D. LEBANON’S OIL & GAS PRODUCTION CAPACITY
As previously mentioned, the volume of Lebanon’s total oil reserves is most likely to hover between 440 and 675 million barrels according to Beicip Franlab. Averaging said estimated interval (557.5 million barrels), and assuming that the country’s daily oil production will be uniformly distributed over twenty years, Lebanon’s daily oil production is estimated at 76,370 barrels. When including Lebanon in the production map of the CIA’s world factbook, the country is likely to rank 52nd worldwide (out of 102 oil producing countries) and 13th in the region with regards to its daily oil production capacity.
As for Lebanon’s natural gas reserves, Spectrum estimates that the country’s total offshore gas resources range between 12 trillion cubic feet and 25 trillion cubic feet. In this perspective, we have assumed in the assessed scenario that Lebanon’s gas reserves stand at around 20 trillion cubic feet. Accordingly, and when considering that the production schedule will be uniformly spread over a twenty-year period, the country’s yearly gas production is estimated at 1 trillion cubic feet, positioning Lebanon as such 30th worldwide and 8th in the region in terms of natural gas production, as elaborated in the table below13:
13 Based on the CIA’s world factbook ranking.
CountryDaily Production
(thousand bbl/day)
Regional
RankWorld Rank
Russia 10,370.0 ‐ 1
Saudi Arabia 10,000.0 1 2
USA 9,023.0 ‐ 3
Iran 4,231.0 2 4
China 4,150.0 ‐ 5
UAE 3,087.0 3 7
Iraq 2,900.0 4 9
Kuwait 2,682.0 5 10
Algeria 1,885.0 6 15
Qatar 1,631.0 7 18
Oman 915.6 8 22
Egypt 711.5 9 27
Libya 502.4 10 30
Syria 333.9 11 33
Yemen 162.1 12 43
Lebanon 76.4 13 52
Source: CIA, Credit Libanais Economic Research Unit
Oil Production
CountryAnnual
Production (TCF)
Regional
RankWorld Rank
Russia 23.1 ‐ 1
USA 23.0 ‐ 2
European Union 5.9 ‐ 3
Canada 5.7 ‐ 4
Iran 5.2 1 5
Qatar 4.1 2 6
Saudi Arabia 3.5 3 9
Algeria 3.0 4 10
Egypt 2.2 5 15
UAE 1.8 6 18
Oman 1.3 7 26
Lebanon 1.0 8 30
Source: CIA, Credit Libanais Economic Research Unit
Gas Production
OIL & GAS SECTOR: A NEW ECONOMIC PILLAR FOR LEBANON
Credit Libanais Economic Research Unit Page 8
III. THE IMPLEMENTED MEASURES TO DATE
A. THE CREATION OF THE PETROLEUM ADMINISTRATION
The Petroleum Administration (PA) was officially formed on December 4, 2012 by the Ministerial Decree No. 9438 under the umbrella of the Offshore Petroleum Law No. 132 of 2010 14 . The Petroleum Administration comprises six members appointed by the government, and is currently composed of Mr. Assem Abou Ibrahim (President of the PA), Mr. Wissam Chbat, Mr. Gaby Daaboul, Mr. Nasser Hoteit, Mr. Walid Nasser, and Mr. Wissam Al-Zahabi, each chairing the PA for a period of one year. It is worth highlighting that the Lebanese Ministry of Energy & Water exercises a tutelage authority vis-à-vis the Petroleum Administration, with the latter remaining an independent body. On the operational front, the PA comprises six departments, namely the “Strategic Planning Department”, the “Technical and Engineering Department”, the “Geology and Geophysics Department”, the “Legal Affairs Department”, the “Economic and Financial Department”, and the “Quality, Health, Safety, and Environment Department”, each of which is headed by one of the aforementioned PA members. The Petroleum Administration’s main responsibilities revolve around tailoring a regulatory framework that governs the country’s oil & gas sector, and tackling all petroleum-related issues, from the licensing phase of concerned firms to the drilling and oil production phases. In details, the PA’s responsibilities include drafting reports and in-depth studies that promote Lebanon’s potential petroleum resources, reporting to the Ministry of Energy & Water the evaluation results pertaining to the qualifications and capabilities of all bidders that are interested in acquiring petroleum rights, and preparing the bidding invitations and the specifications, relevant permits, and agreements related to the Offshore Petroleum Law. In parallel, the PA shall support the Minister of Energy & Water in the negotiation of the terms of the exploration and production agreements with the concerned companies, and submit result reports to the Minister for support during the final decision phases at the Council of Ministers. The PA shall also “manage, follow-up, supervise, and monitor” all petroleum activities in Lebanon, in addition to ensuring the proper implementation of the licenses and agreements, and submitting quarterly result reports to the Minister of Energy & Water for approval. Moreover, the PA is responsible for managing all data regarding petroleum activities in the country, handling and managing the petroleum register, as well as evaluating proposed plans pertaining to field development, petroleum transportation, decommissioning, and removal of facilities.
B. THE ISSUANCE OF THE OFFSHORE PETROLEUM LAW & RELATED REGULATIONS
The Lebanese Parliament has approved on August 17, 2010 the Offshore Petroleum Resources Law (OPRL) – Law 132 24/8/2010 -, which embodies ten chapters and 77 articles, governing all petroleum activities within the territorial waters of the Republic of Lebanon (ROL), and the waters of the Exclusive Economic Zone (EEZ) in connection with hydrocarbons subject to ROL jurisdiction. Said law regulates the reconnaissance, the exclusive petroleum rights, and the exploration and production agreements between the 14 The Lebanese Petroleum Administration’s official website.
OIL & GAS SECTOR: A NEW ECONOMIC PILLAR FOR LEBANON
Credit Libanais Economic Research Unit Page 9
State of Lebanon and right-holders. In addition, the OPRL tackles all issues related to health, safety, and environment, including emergency readiness, and sheds the light on the necessary provisions when carrying on petroleum activities. The OPRL also grants the Lebanese State the right to embark on or participate in petroleum activities, and stipulates that a sovereign wealth fund shall be created to manage income generated by oil & gas reserves. On the other hand, the Petroleum Activities Regulations (PAR), which includes 165 articles, constitutes the application decrees for the OPRL, covering numerous articles already stipulated in the latter, while providing the necessary regulations to be implemented following the effective execution of petroleum activities. This includes the legal representation of the right-holder, the management system, the general duties of the operator and the right-holder, the strategic environmental assessment, the exploration and production rights, the petroleum production and transportation, the cessation of petroleum activities and decommissioning, only to name a few.
C. THE BIDDING PROCESS
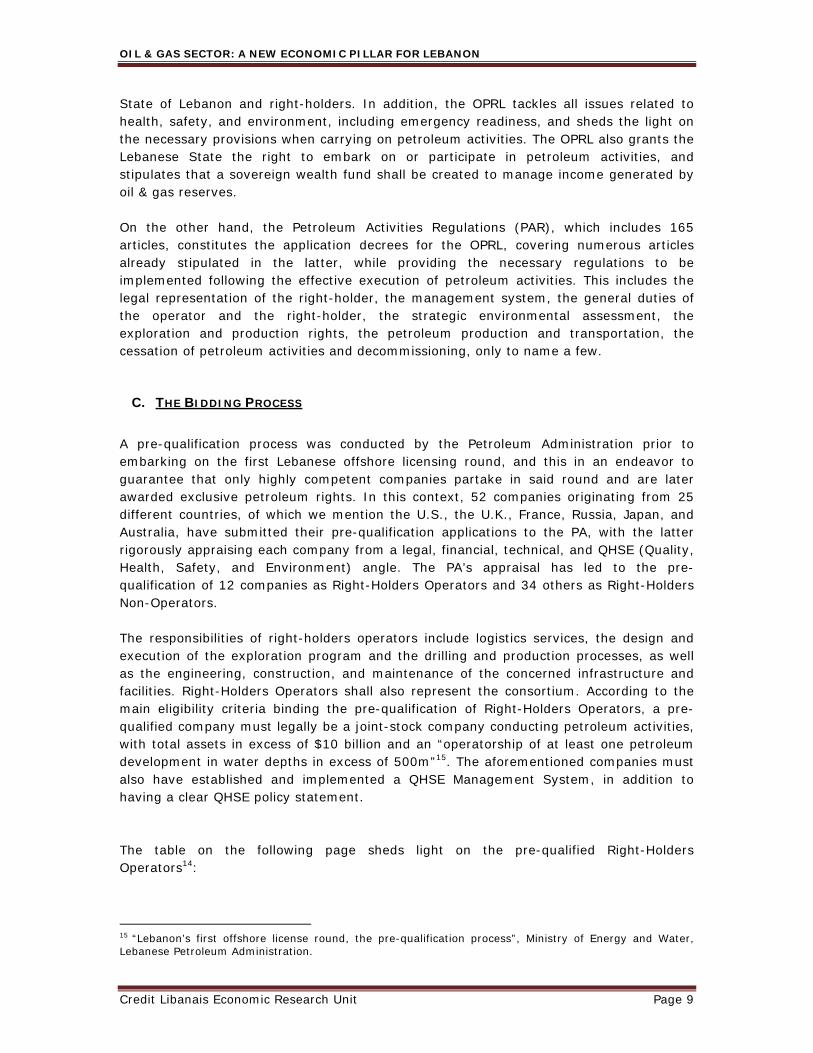
A pre-qualification process was conducted by the Petroleum Administration prior to embarking on the first Lebanese offshore licensing round, and this in an endeavor to guarantee that only highly competent companies partake in said round and are later awarded exclusive petroleum rights. In this context, 52 companies originating from 25 different countries, of which we mention the U.S., the U.K., France, Russia, Japan, and Australia, have submitted their pre-qualification applications to the PA, with the latter rigorously appraising each company from a legal, financial, technical, and QHSE (Quality, Health, Safety, and Environment) angle. The PA’s appraisal has led to the pre-qualification of 12 companies as Right-Holders Operators and 34 others as Right-Holders Non-Operators. The responsibilities of right-holders operators include logistics services, the design and execution of the exploration program and the drilling and production processes, as well as the engineering, construction, and maintenance of the concerned infrastructure and facilities. Right-Holders Operators shall also represent the consortium. According to the main eligibility criteria binding the pre-qualification of Right-Holders Operators, a pre-qualified company must legally be a joint-stock company conducting petroleum activities, with total assets in excess of $10 billion and an “operatorship of at least one petroleum development in water depths in excess of 500m”15. The aforementioned companies must also have established and implemented a QHSE Management System, in addition to having a clear QHSE policy statement. The table on the following page sheds light on the pre-qualified Right-Holders Operators14:
15 “Lebanon’s first offshore license round, the pre-qualification process”, Ministry of Energy and Water, Lebanese Petroleum Administration.
OIL & GAS SECTOR: A NEW ECONOMIC PILLAR FOR LEBANON
Credit Libanais Economic Research Unit Page 10
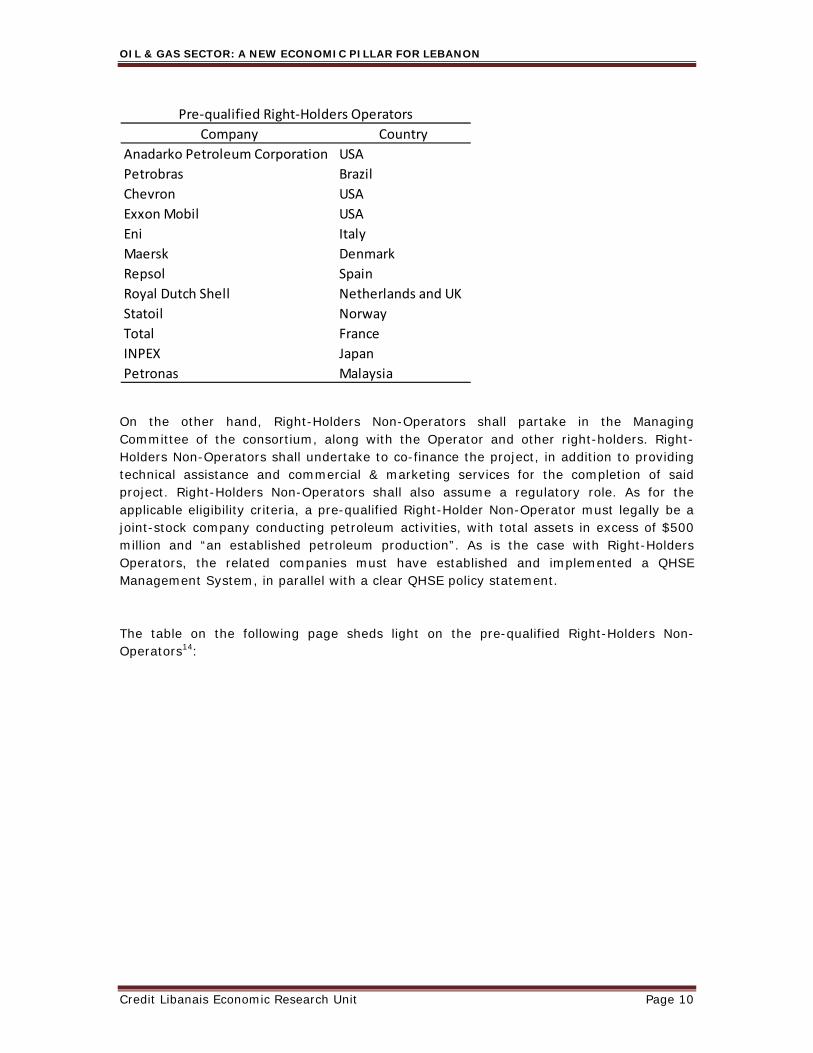
On the other hand, Right-Holders Non-Operators shall partake in the Managing Committee of the consortium, along with the Operator and other right-holders. Right-Holders Non-Operators shall undertake to co-finance the project, in addition to providing technical assistance and commercial & marketing services for the completion of said project. Right-Holders Non-Operators shall also assume a regulatory role. As for the applicable eligibility criteria, a pre-qualified Right-Holder Non-Operator must legally be a joint-stock company conducting petroleum activities, with total assets in excess of $500 million and “an established petroleum production”. As is the case with Right-Holders Operators, the related companies must have established and implemented a QHSE Management System, in parallel with a clear QHSE policy statement. The table on the following page sheds light on the pre-qualified Right-Holders Non-Operators14:
Company Country
Anadarko Petroleum Corporation USA
Petrobras Brazil
Chevron USA
Exxon Mobil USA
Eni Italy
Maersk Denmark
Repsol Spain
Royal Dutch Shell Netherlands and UK
Statoil Norway
Total France
INPEX Japan
Petronas Malaysia
Pre‐qualified Right‐Holders Operators
OIL & GAS SECTOR: A NEW ECONOMIC PILLAR FOR LEBANON
Credit Libanais Economic Research Unit Page 11
There must be, at all times, three right-holders including an operator, all of which shall enjoy the right to explore oil & gas during a five year exploration phase, spread over a first period of three years and a second period of two years. The exploration phase can be prolonged by a maximum of 10 years conditional upon the consent of the Council of Ministers.
Company Country
Suncor Energy Inc. Canada
Geopark Holding Limited/Petroleb Bermuda/Lebanon
Marathon Oil Netherlands One B.V. USA
Santos Limited Australia
OMV Aktiengesellschaft Austria
INA‐Industrija Nafte d.d. Croatia
GDF Suez Exploration and Production International S.A. France
MOL Hungarian Oil and Gas Company Plc Hungary
Edison International Spa Italy
Petroceltic International Plc Ireland
Cairn Energy Plc UK
Dana Petroleum E&E Limited UK
Genel Energy Plc UK
Heritage Oil Plc UK
SOCO International Plc UK
JAPEX ‐ Japan Petroleum Exploration Co. Ltd. Japan
JX Nippon Oil & Gas Exploration Corporation Japan
Mitsui E&P Middle East B.V. Japan
Cairn India Limited India
ONGC Videsh Limited India
KNOC ‐ Korean National Oil Corporation Korea
Korea Gas Corporation Korea
Kuwait Foreign Petroleum Exploration Company K.S.C. Kuwait
CC Energy Limited Lebanon
Lukoil Overseas Lebanon B.V. Russia
OAO Novatek / GBP Global Resources B.V. Russia
Roseneft Oil Company Russia
PTT Exploration and Production (LXV) N.V. Thailand
TPAO ‐ Turkiye Petrolleri Anonim Ortakligi Turkey
Crescent Petroleum Company International Limited UAE
Crescent Petroleum Company International Limited / Apex Gas Ltd. UAE / Lebanon
Dana Gas PJSC UAE
Dragon Oil Holdings Ltd. UAE
Mubadala Petroleum UAE
Pre‐qualified Right‐Holders Non‐Operators
OIL & GAS SECTOR: A NEW ECONOMIC PILLAR FOR LEBANON
Credit Libanais Economic Research Unit Page 12
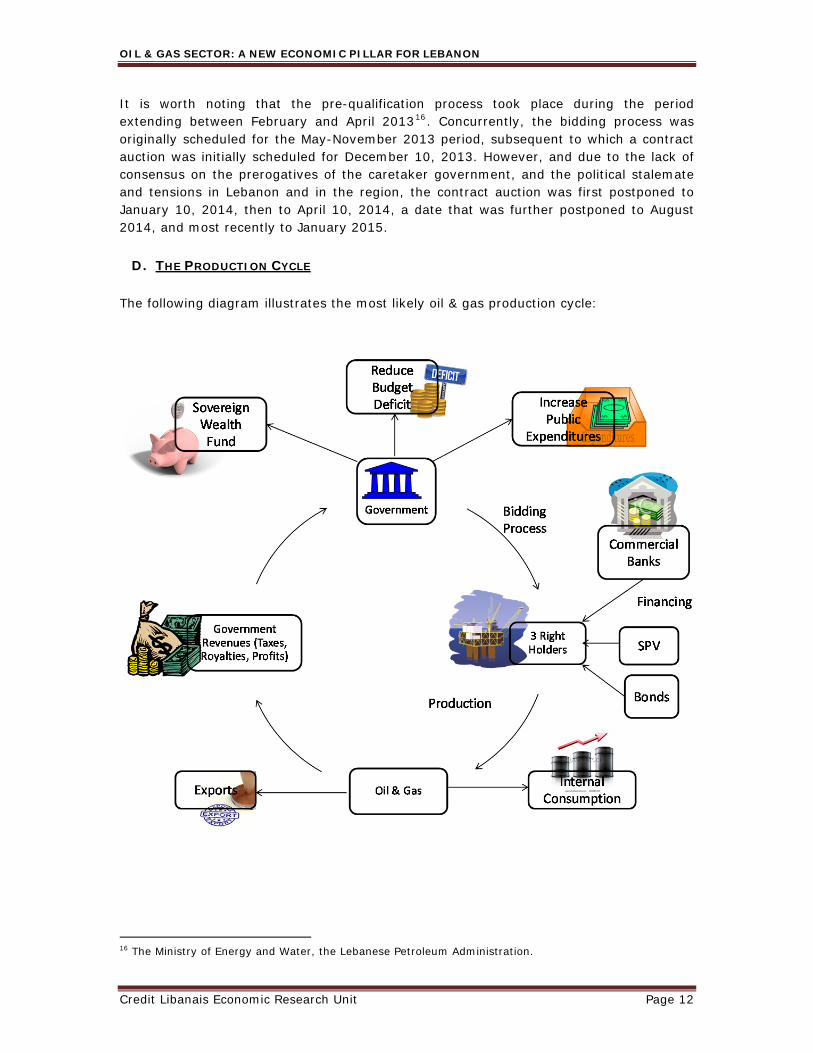
It is worth noting that the pre-qualification process took place during the period extending between February and April 201316. Concurrently, the bidding process was originally scheduled for the May-November 2013 period, subsequent to which a contract auction was initially scheduled for December 10, 2013. However, and due to the lack of consensus on the prerogatives of the caretaker government, and the political stalemate and tensions in Lebanon and in the region, the contract auction was first postponed to January 10, 2014, then to April 10, 2014, a date that was further postponed to August 2014, and most recently to January 2015.
D. THE PRODUCTION CYCLE
The following diagram illustrates the most likely oil & gas production cycle:
16 The Ministry of Energy and Water, the Lebanese Petroleum Administration.
OIL & GAS SECTOR: A NEW ECONOMIC PILLAR FOR LEBANON
Credit Libanais Economic Research Unit Page 13
IV. THE STRUCTURE OF THE PARTNERSHIP BETWEEN THE PUBLIC & THE PRIVATE SECTOR
A. TYPE OF PARTNERSHIP
The partnership structure between the Lebanese government and the companies assigned to extract Lebanon’s energy resources is crucial to assess the type and value of public revenues emanating from the related activities. Said partnership can be wrapped under different forms as elaborated in the section below:
1. Definitions
a. Build-Own-Operate (BOO): The private company is in charge of financing, designing, building, and operating the public entity’s project, while claiming ownership. Therefore, the private company owns the project and bears the commercial risk of operating the facility. There is no transfer of the entity’s ownership to the public sector. b. Buy-Build-Operate (BBO): The private company builds and operates the public sector’s entity after gaining ownership of that entity. In this context, the private company takes into charge rehabilitating or expanding it, and improving the way it is operated.
c. Build-Operate-Transfer (BOT): The private company assumes the responsibility of financing, designing, building, and operating the public entity’s project for a fixed period of time (with no ownership), and transfers it back to the public sector. The private entity thus bears the commercial risk of operating the facility. The transfer of ownership takes place at a preset price, or at the then-prevailing market price. d. Concession Agreement: The government concedes to the private company the right to produce and sell the concerned goods against the payment of taxes and royalties. The operating costs can either be carried by the private company, or be shared with the government. e. Production Sharing Contract: A contract is penned between the government and the private company which assigns a percentage of total production in addition to tax revenues to the government. Royalty fees are also applied in some cases. On the other hand, a production sharing contract agreement usually encloses a recovery scheme for the operating costs borne by the company.
OIL & GAS SECTOR: A NEW ECONOMIC PILLAR FOR LEBANON
Credit Libanais Economic Research Unit Page 14
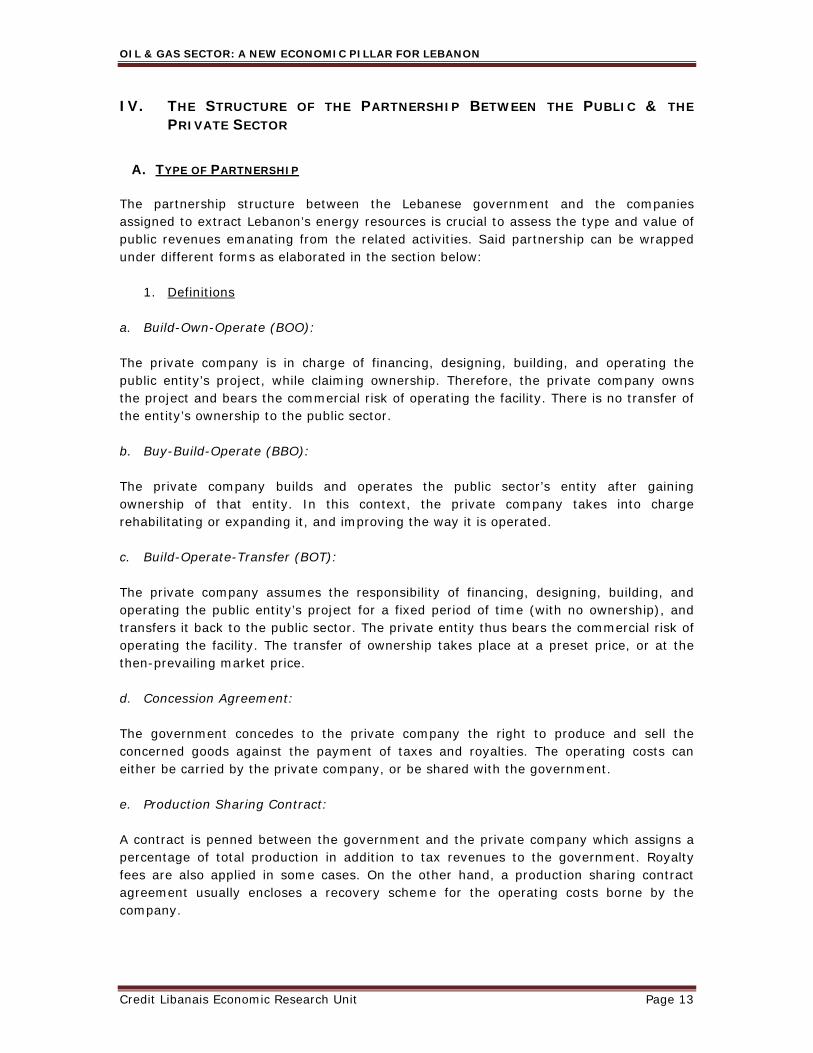
2. Partnership Structure The Partnership agreement between the government and the concerned oil companies can be tailored under a wide set of terms and conditions, ranging from a complete property transfer to a simple management agreement. Said agreement should match a set of criteria to maximize the country’s benefits from oil and gas production without hindering the related companies’ profitability. Concurrently, the legal framework for the exploitation of Lebanon’s energy resources should assure to the country a fair proportion of its resources, and encourage efficient production by oil companies. According to the LPA, the production agreement between the government and the operating companies could be a “hybrid” structure, mixing characteristics of concession agreements and profit sharing contracts. Hence, the partnership agreement is most likely to be structured as follows:
The Lebanese government will be entitled a royalty fee on total oil extraction before the production is split into profit oil and cost oil. The government will then be assigned a share of profit oil and a corporate income tax paid by the mandated oil company(ies). The details of the distribution of revenues between the government and the operating company(ies) are further elaborated in the following section.
Corporate
Income tax
(3)
Source: Lebanese Petroleum Adminis tration, American Univers i ty of Beirut
Contractor
Share of
Profit Oil
Government
Share of
Profit Oil
(2)
Total
Government
Take
(1)+(2)+(3)
Royalty
(1)
Cost
Recovery
Oil
Total Oil
Produced
Profit Oil
OIL & GAS SECTOR: A NEW ECONOMIC PILLAR FOR LEBANON
Credit Libanais Economic Research Unit Page 15
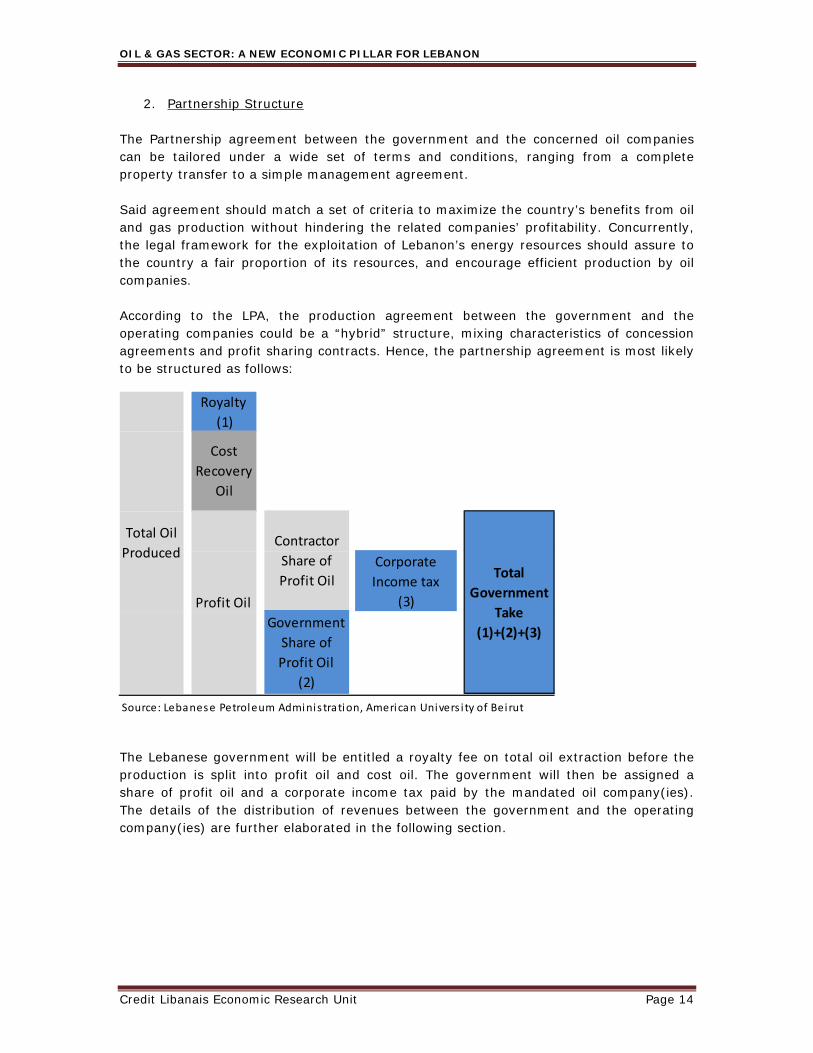
B. REVENUES/PROFIT SHARING
The Lebanese government and the right-holders will follow a profit-sharing scheme where the share of the state was assumed to be 60% of gross profits from hydrocarbon production under our assessed scenario. In addition, the companies’ activities will be subject to a corporate income tax which was assumed fixed at 15% of profits in this scenario (without accounting for the 10% foreign branch remittance rate). The right-holders will also be subject to annual royalties to be paid to the Lebanese government, at a rate of 4% on natural gas production and 5% to 12% (depending on average daily production) on total oil production according to the LPA. The offshore petroleum resources law no.132 stipulates as well that an area fee of $350 per km2 in the first year of production and $400 per km2 in the second and all subsequent years will be charged on the right-holders. The following table sketches the possible remuneration scheme to the Lebanese government from oil and gas production17:
C. FINANCING THE OIL & GAS PRODUCTION PROCESS
A multitude of financing schemes can be envisaged for the production of oil and gas, depending on the type of partnership inked between the government and the companies involved. Some of the possible options are further elaborated below:
1. Bank Loans:
The operating companies may opt to finance their activities through bank loans granted either by Lebanese banks or by foreign banks. In fact, the high liquidity of the Lebanese banking sector allows it to participate in the financing of oil & gas activities through conventional bank loans, syndicated loans, or any other form of lending. However, and given the long-term nature of the loans to finance oil & gas companies compared to the relatively short-term nature of customer deposits, banks are likely to face an asset-liability mismatch from the participation in the financing of hydrocarbon production.
2. Bonds:
The selected oil companies may also resort to bond issuances, granting as such the public and private sectors the opportunity to directly participate in the financing of oil & gas production.
17 The details on the royalty fees are available on the Petroleum Administration’s official website.
Corporate Tax Royalties Share of Profits
Oil Production 15% 4% 60%
Natural Gas Production 15%Between 5%
and 12%60%
OIL & GAS SECTOR: A NEW ECONOMIC PILLAR FOR LEBANON
Credit Libanais Economic Research Unit Page 16
3. Special Purpose Vehicles (SPV): Special purpose vehicles could similarly be utilized as an alternative to finance oil & gas production through the issuance of securities on behalf of the originating companies under the close supervision of investment banks.
4. Public Sector:
Depending on the type of partnership, the public sector could also contribute to the financing of oil & gas production through a cost sharing agreement. The companies would then use one of the aforementioned methods to finance a proportion of the investment costs.
V. ECONOMIC REPERCUSSIONS OF OIL & GAS PRODUCTION
A. MODEL ASSUMPTIONS
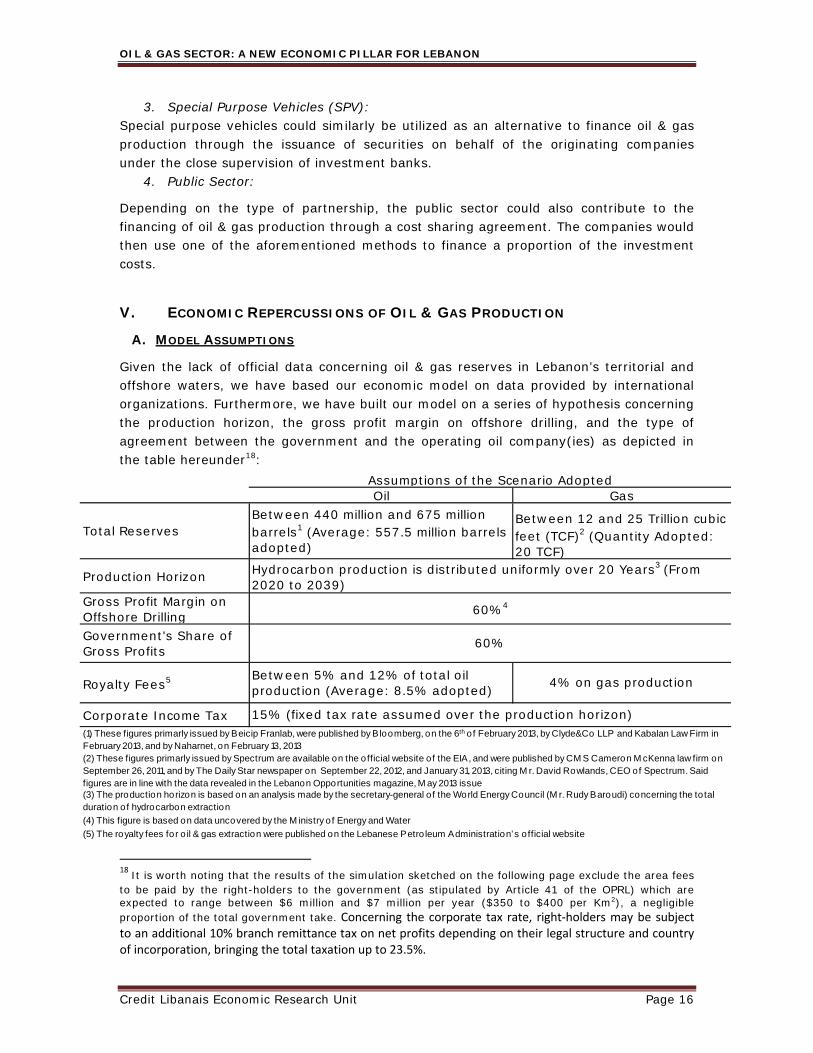
Given the lack of official data concerning oil & gas reserves in Lebanon’s territorial and offshore waters, we have based our economic model on data provided by international organizations. Furthermore, we have built our model on a series of hypothesis concerning the production horizon, the gross profit margin on offshore drilling, and the type of agreement between the government and the operating oil company(ies) as depicted in the table hereunder18:
18 It is worth noting that the results of the simulation sketched on the following page exclude the area fees to be paid by the right-holders to the government (as stipulated by Article 41 of the OPRL) which are expected to range between $6 million and $7 million per year ($350 to $400 per Km2), a negligible proportion of the total government take. Concerning the corporate tax rate, right‐holders may be subject to an additional 10% branch remittance tax on net profits depending on their legal structure and country of incorporation, bringing the total taxation up to 23.5%.
Total Reserves
Production Horizon
Gross Profit Margin on Offshore Drilling Government's Share of Gross Profits
Royalty Fees5
Corporate Income Tax
(2) These figures primarly issued by Spectrum are available on the official website o f the EIA, and were published by CM S Cameron M cKenna law firm on September 26, 2011, and by The Daily Star newspaper on September 22, 2012, and January 31, 2013, citing M r. David Rowlands, CEO of Spectrum. Said figures are in line with the data revealed in the Lebanon Opportunities magazine, M ay 2013 issue(3) The production horizon is based on an analysis made by the secretary-general o f the World Energy Council (M r. Rudy Baroudi) concerning the to tal duration of hydrocarbon extraction
(4) This figure is based on data uncovered by the M inistry o f Energy and Water
(5) The royalty fees for o il & gas extraction were published on the Lebanese Petro leum Administration’s o fficial website
Assumptions of the Scenario AdoptedOil Gas
Between 440 million and 675 million barrels1 (Average: 557.5 million barrels adopted)
Between 12 and 25 Trillion cubic feet (TCF)2 (Quantity Adopted: 20 TCF)
(1) These figures primarly issued by Beicip Franlab, were published by Bloomberg, on the 6th o f February 2013, by Clyde&Co LLP and Kabalan Law Firm in February 2013, and by Naharnet, on February 13, 2013
Hydrocarbon production is distributed uniformly over 20 Years3 (From 2020 to 2039)
60%4
60%
15% (fixed tax rate assumed over the production horizon)
Between 5% and 12% of total oil production (Average: 8.5% adopted) 4% on gas production
OIL & GAS SECTOR: A NEW ECONOMIC PILLAR FOR LEBANON
Credit Libanais Economic Research Unit Page 17
It is also worth highlighting that the former Minister of energy and water, Mr. Gebran Bassil, stated during the Lebanese International Oil & Gas summit that took place on the 4th and 5th of December 2013, that the contracts concerning oil & gas extraction comprise a clause that ensures that 80% of the employed workforce in oil & gas production will be Lebanese nationals.
B. ECONOMIC GROWTH
1. Direct Impact
The following section aims at quantifying the impact of oil & gas production on Lebanon’s nominal GDP. For this purpose, GDP forecasts for the years 2014 to 2019 are based on IMF figures19. As far as GDP forecasts for the 2020-2039 period are concerned, we have projected the Lebanese nominal GDP by applying a static nominal GDP growth rate of 6%20 (2-3% real GDP growth and 3-4% inflation rate). Our model also relies on the assumption that the country will embark on its hydrocarbon production journey by the year 2020 21 , a tentative date that is highly conditional upon the country’s political situation. Accordingly, the scenario adopted is based on a production horizon extending between the years 2020 and 2039, bearing in mind that the results are bound by uncertainty given the lack of official data released by the government on the exact volume of hydrocarbon reserves in Lebanon’s territorial and offshore waters.
Our production scenario centers upon the average of the expected oil reserves interval, namely 557.5 million barrels, and on natural gas reserves of 20 trillion cubic feet. In this perspective, and when spreading the hydrocarbon production uniformly over a production horizon of twenty years, oil production is expected to average 76,370 barrels per day22, or the equivalent of 27,875 thousand barrels per year. Natural gas production, on the other hand, will average 1 trillion cubic feet per annum if distributed uniformly over the production horizon.
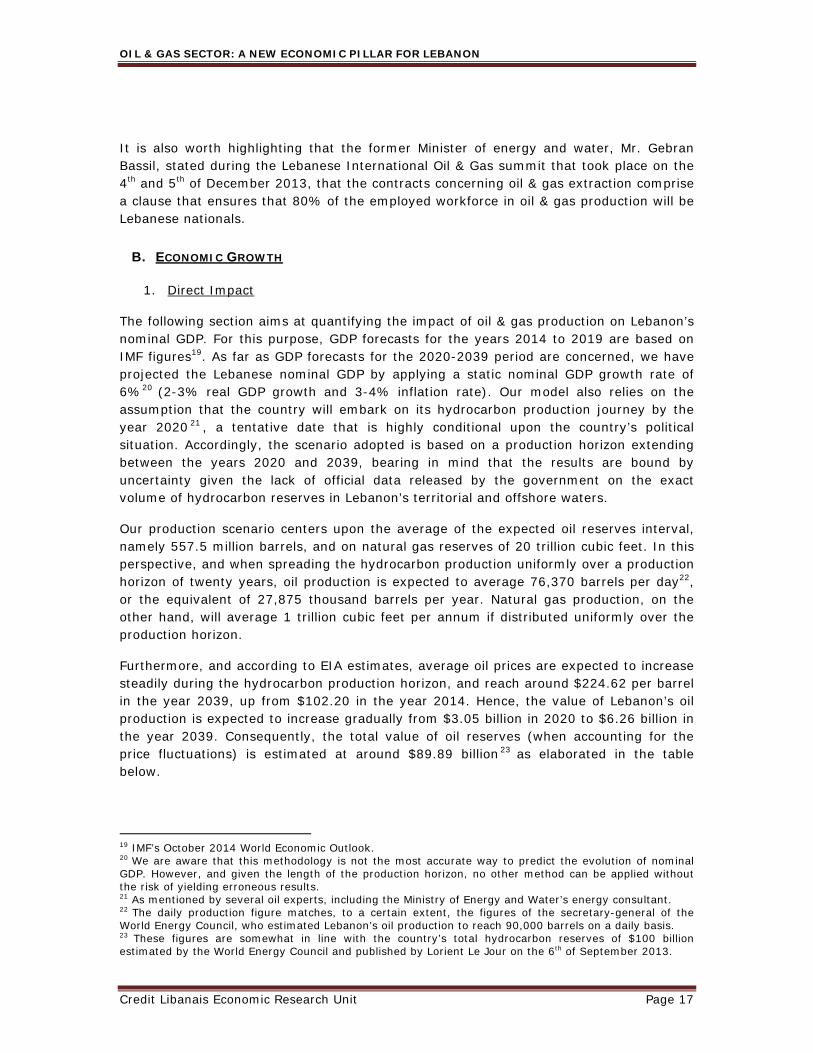
Furthermore, and according to EIA estimates, average oil prices are expected to increase steadily during the hydrocarbon production horizon, and reach around $224.62 per barrel in the year 2039, up from $102.20 in the year 2014. Hence, the value of Lebanon’s oil production is expected to increase gradually from $3.05 billion in 2020 to $6.26 billion in the year 2039. Consequently, the total value of oil reserves (when accounting for the price fluctuations) is estimated at around $89.89 billion23 as elaborated in the table below.
19 IMF’s October 2014 World Economic Outlook. 20 We are aware that this methodology is not the most accurate way to predict the evolution of nominal GDP. However, and given the length of the production horizon, no other method can be applied without the risk of yielding erroneous results. 21 As mentioned by several oil experts, including the Ministry of Energy and Water’s energy consultant. 22 The daily production figure matches, to a certain extent, the figures of the secretary-general of the World Energy Council, who estimated Lebanon’s oil production to reach 90,000 barrels on a daily basis. 23 These figures are somewhat in line with the country’s total hydrocarbon reserves of $100 billion estimated by the World Energy Council and published by Lorient Le Jour on the 6th of September 2013.
OIL & GAS SECTOR: A NEW ECONOMIC PILLAR FOR LEBANON
Credit Libanais Economic Research Unit Page 18
In parallel, the EIA projected the international natural gas prices to increase from $3.86 billion/TCF in 2014 to $4.96 billion/TCF in 2020 and $12.04 billion/TCF in 2039. Accordingly, Lebanon’s offshore natural gas reserves are valued at around $163.91 billion allocated over a yearly production ranging between $4.96 billion in 2020 and $12.04 billion in 2039 as detailed in the table below. Overall, we estimate total hydrocarbon resources at around $253.8 billion, representing 534.35% of the country’s projected nominal GDP for the year 2014.
As a result, the yearly oil and gas production is expected to boost Lebanon’s nominal GDP by $12.69 billion per annum on average over the aforementioned period. More specifically, hydrocarbon production will lift Lebanon’s nominal GDP by $8.01 billion during the first year of extraction (2020)24. This positive impact on GDP is then expected to rise steadily and reach $18.30 billion during the last year of extraction (2039). The table herein portrays the relationship between oil and gas production and Lebanon’s nominal GDP.
24 Given the lack of data concerning the geographical origin of intermediary consumption for oil & gas production, we have assumed in the following paper that the total sub-activities related to this sector will take place in Lebanon, allowing us to integrate the total hydrocarbon production in Lebanon’s GDP.
YearNominal GDP ($ billion)
Volume (Thousands of barrels /
year)
Oil prices Forecast
($ / Barrel)1
Value ($ billion)
Volume (Trillion
Cubic Feet / year)
Natural Gas prices Forecast
($ billion / TCF)1
Value ($ billion)
Nominal GDP
Including Oil & Gas ($ billion)
Difference between Nominal GDP
Including Oil & Gas and Nominal GDP
w/o Oil & Gas2014 47.497 ‐ 102.20 - ‐ 3.86 - 47.497 -2015 50.815 ‐ 101.95 - ‐ 3.93 - 50.815 -2016 54.461 ‐ 99.57 - ‐ 4.41 - 54.461 -2017 57.986 ‐ 99.30 - ‐ 4.76 - 57.986 -2018 61.699 ‐ 101.54 - ‐ 5.27 - 61.699 -2019 65.651 ‐ 105.21 - ‐ 5.19 - 65.651 -2020 69.590 27,875 109.37 3.05 1 4.96 4.96 77.596 11.50%2021 73.765 27,875 114.03 3.18 1 5.37 5.37 82.316 11.59%2022 78.191 27,875 118.88 3.31 1 5.64 5.64 87.149 11.46%2023 82.883 27,875 124.06 3.46 1 5.90 5.90 92.243 11.29%2024 87.856 27,875 129.20 3.60 1 6.20 6.20 97.657 11.16%2025 93.127 27,875 134.25 3.74 1 6.45 6.45 103.316 10.94%2026 98.715 27,875 138.99 3.87 1 6.72 6.72 109.307 10.73%2027 104.638 27,875 144.52 4.03 1 7.00 7.00 115.663 10.54%2028 110.916 27,875 149.64 4.17 1 7.26 7.26 122.347 10.31%2029 117.571 27,875 155.05 4.32 1 7.63 7.63 129.526 10.17%2030 124.625 27,875 160.19 4.47 1 8.12 8.12 137.214 10.10%2031 132.103 27,875 166.21 4.63 1 8.47 8.47 145.205 9.92%2032 140.029 27,875 172.81 4.82 1 8.91 8.91 153.751 9.80%2033 148.431 27,875 179.55 5.00 1 9.41 9.41 162.847 9.71%2034 157.336 27,875 186.31 5.19 1 9.83 9.83 172.358 9.55%2035 166.777 27,875 193.27 5.39 1 10.31 10.31 182.478 9.41%2036 176.783 27,875 200.22 5.58 1 10.93 10.93 193.295 9.34%2037 187.390 27,875 207.87 5.79 1 11.23 11.23 204.417 9.09%2038 198.634 27,875 215.55 6.01 1 11.53 11.53 216.172 8.83%2039 210.552 27,875 224.62 6.26 1 12.04 12.04 228.856 8.69%
557,500 - 89.89 20 - 163.91 - -
Source: IMF, EIA, Credit Libanais Economic Research Unit
The Implications of Lebanon's Oil & Gas Resources on Nominal GDP: Outcomes of the Adopted Scenario
Oil ($89.89 billion)
1 EIA Estimates
Total
Natural Gas ($163.91 billion)
OIL & GAS SECTOR: A NEW ECONOMIC PILLAR FOR LEBANON
Credit Libanais Economic Research Unit Page 19
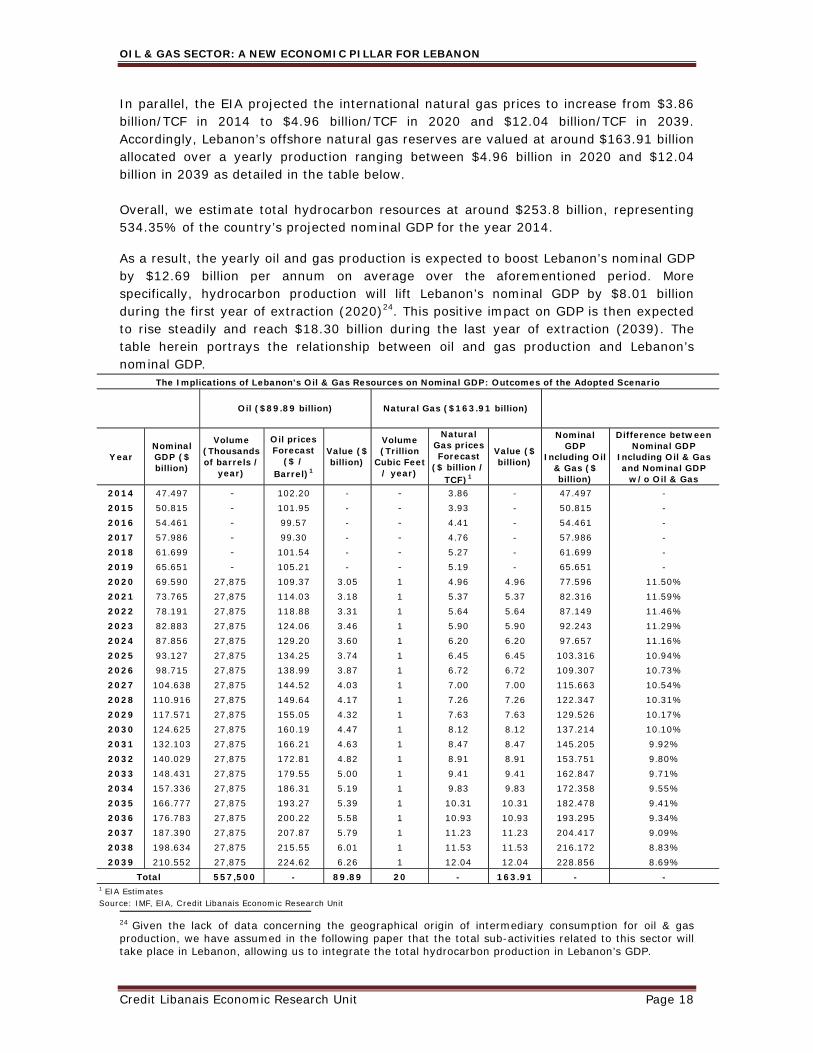
According to our estimates, as soon as oil & gas production kicks in, Lebanon’s GDP is expected to move to a higher growth path, as depicted by the following chart:
During the first year of production, the impact would be a nominal increment on GDP estimates of 11.50% compared to the nominal GDP excluding oil & gas production. This gap is expected to narrow to 8.69% twenty years after oil production starts.
2. Indirect Impact
Apart from the impact of hydrocarbon production on Lebanon’s GDP, its exploitation is likely to trigger a drop in domestic oil prices in the absence of shipping costs, custom duties and other applicable taxes, the thing which will possibly reflect positively on the country’s GDP growth rates. It is worth noting that international oil prices constitute around 71% of domestic oil prices with government taxes accounting for 23%, and shipping costs representing 1% of domestic oil prices as portrayed in the following table25:
In fact, and as previously mentioned, Lebanon’s economy is highly reliant on oil consumption, which is used as an input in most economic sectors. Accordingly, a drop in
25 Ministry of Energy and Water.
% of Domestic
Prices
International Oil Prices 70.86%
Taxes 22.43%
Wholesalers' Margin 0.89%
Transportation Fees 1.07%
Retail Margin 4.76%
Domestic Prices 100.00%
Breakdown of Domestic Oil Prices
Source: MOEW, Credi t Libanais Economic Research Unit
507090110130150170190210230
2020 2024 2028 2032 2036 2040
Nominal GDP (Excluding Oil & Gas Production)Nominal GDP (Including Oil & Gas Production)
$ billion Nominal GDP Excluding Oil & Gas v/s Nominal GDP Including Oil &
Gas
Period
Source: Credit Libanais Economic Research Unit
OIL & GAS SECTOR: A NEW ECONOMIC PILLAR FOR LEBANON
Credit Libanais Economic Research Unit Page 20
domestic oil prices (reflected in the cost of electricity in $/Kwh) is likely to reduce production costs and, in turn, increase the country’s output.
a. Methodology and Variables
In order to quantify the impact of oil prices (indirect impact) on GDP growth in Lebanon, we used the Vector Auto Regression estimates (VAR) methodology, which allows us to determine the equations explaining all endogenous variables as a function of their own lags and the lags of the other chosen endogenous variables.
Accordingly, the equations of the VAR model are computed as follows:
⋯ ⋯
⋯ ⋯
Where X and Y are the variables of the VAR model, and and the residuals.
Furthermore, the lag structure of our VAR model was determined using both Schwarz information criterion (SC) and Akaike information criterion (AIC). After applying the optimal lag structure of our VAR model, we were able to write the related equations and estimate the correlation between the variation in oil prices and GDP growth.
The two variables26 in our models are:
Lebanon’s Real GDP growth rates Fluctuations in international oil prices
b. Regressions and Results
In an attempt to estimate the relationship between oil prices and real GDP growth in Lebanon, we have built a VAR model covering real GDP growth rates over the 1994-2012 period and growth in international oil prices over the same period. It is worth noting that international oil prices are used as a proxy for domestic oil prices. In fact, no reliable data is available on the historical evolution of domestic oil prices.
Published research articles pinpoint to an inverse relationship between oil prices and economic growth. More specifically, this leads us to presume that a drop in oil prices is likely to trigger a contraction in production costs, and in turn lift aggregate output. Hence, the following section aims at quantifying the impact of a change in oil prices on real GDP growth in Lebanon by measuring the elasticity of economic growth to oil price fluctuations.
26 To avoid risks of fallacious regressions, we have performed an augmented Dickey-Fuller unit root test on the variables to check if they are covariance stationary. Neither real GDP growth nor international oil prices were stationary, and were thus differenced one time. The following regressions were performed using the stationary series.
OIL & GAS SECTOR: A NEW ECONOMIC PILLAR FOR LEBANON
Credit Libanais Economic Research Unit Page 21
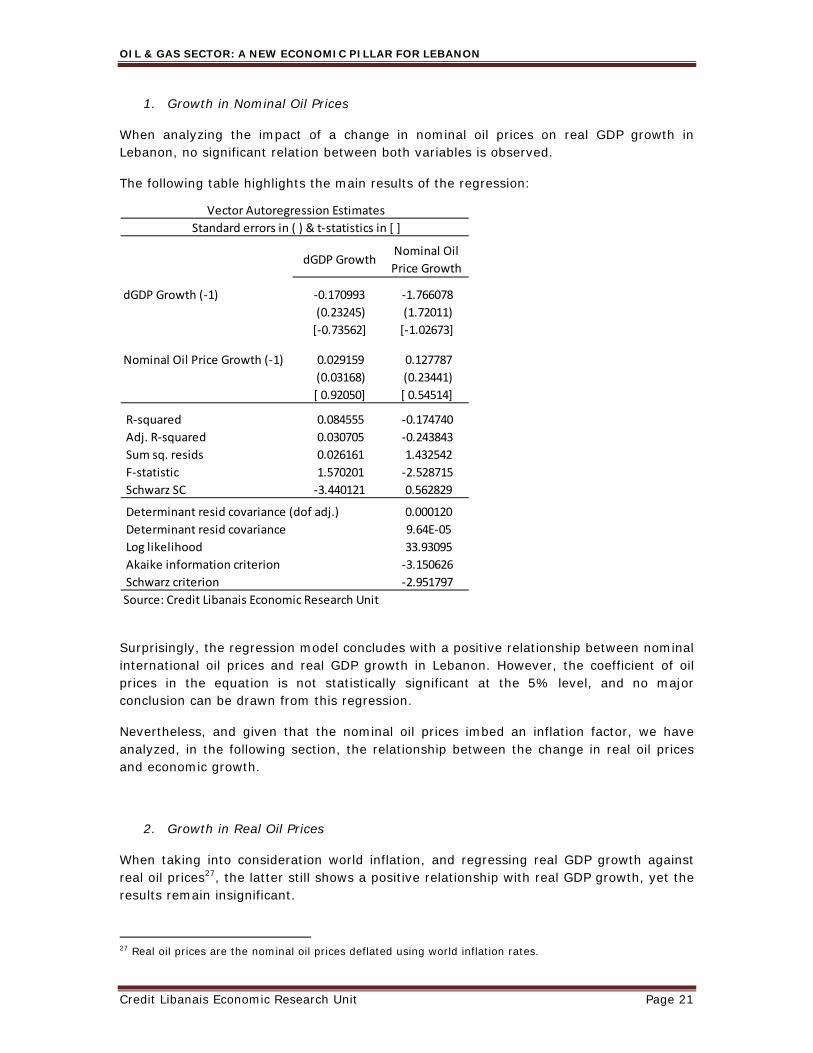
1. Growth in Nominal Oil Prices
When analyzing the impact of a change in nominal oil prices on real GDP growth in Lebanon, no significant relation between both variables is observed.
The following table highlights the main results of the regression:
Surprisingly, the regression model concludes with a positive relationship between nominal international oil prices and real GDP growth in Lebanon. However, the coefficient of oil prices in the equation is not statistically significant at the 5% level, and no major conclusion can be drawn from this regression.
Nevertheless, and given that the nominal oil prices imbed an inflation factor, we have analyzed, in the following section, the relationship between the change in real oil prices and economic growth.
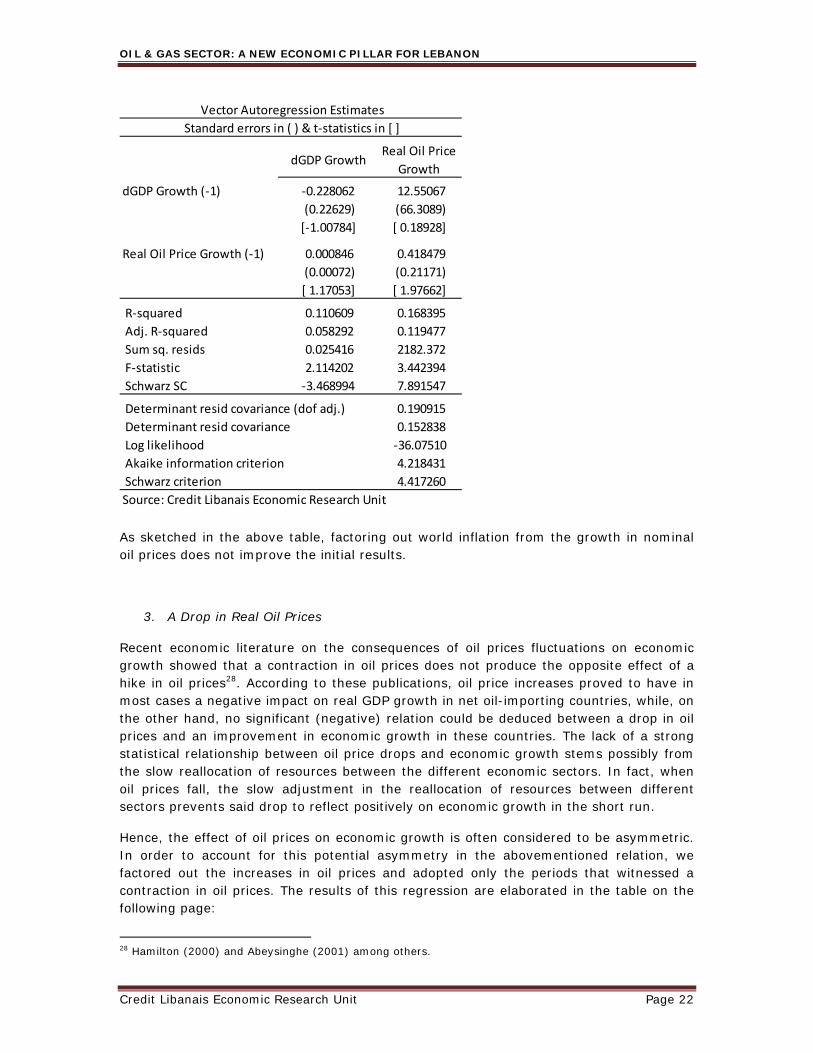
2. Growth in Real Oil Prices
When taking into consideration world inflation, and regressing real GDP growth against real oil prices27, the latter still shows a positive relationship with real GDP growth, yet the results remain insignificant.
27 Real oil prices are the nominal oil prices deflated using world inflation rates.
dGDP GrowthNominal Oil
Price Growth
dGDP Growth (‐1) ‐0.170993 ‐1.766078
(0.23245) (1.72011)
[‐0.73562] [‐1.02673]
Nominal Oil Price Growth (‐1) 0.029159 0.127787
(0.03168) (0.23441)
[ 0.92050] [ 0.54514]
R‐squared 0.084555 ‐0.174740
Adj. R‐squared 0.030705 ‐0.243843
Sum sq. resids 0.026161 1.432542
F‐statistic 1.570201 ‐2.528715
Schwarz SC ‐3.440121 0.562829
Determinant resid covariance (dof adj.) 0.000120
Determinant resid covariance 9.64E‐05
Log likelihood 33.93095
Akaike information criterion ‐3.150626
Schwarz criterion ‐2.951797
Vector Autoregression Estimates
Standard errors in ( ) & t‐statistics in [ ]
Source: Credit Libanais Economic Research Unit
OIL & GAS SECTOR: A NEW ECONOMIC PILLAR FOR LEBANON
Credit Libanais Economic Research Unit Page 22
dGDP GrowthReal Oil Price
Growth
dGDP Growth (‐1) ‐0.228062 12.55067
(0.22629) (66.3089)
[‐1.00784] [ 0.18928]
Real Oil Price Growth (‐1) 0.000846 0.418479
(0.00072) (0.21171)
[ 1.17053] [ 1.97662]
R‐squared 0.110609 0.168395
Adj. R‐squared 0.058292 0.119477
Sum sq. resids 0.025416 2182.372
F‐statistic 2.114202 3.442394
Schwarz SC ‐3.468994 7.891547
Determinant resid covariance (dof adj.) 0.190915
Determinant resid covariance 0.152838
Log likelihood ‐36.07510
Akaike information criterion 4.218431
Schwarz criterion 4.417260
Vector Autoregression Estimates
Standard errors in ( ) & t‐statistics in [ ]
Source: Credit Libanais Economic Research Unit
As sketched in the above table, factoring out world inflation from the growth in nominal oil prices does not improve the initial results.
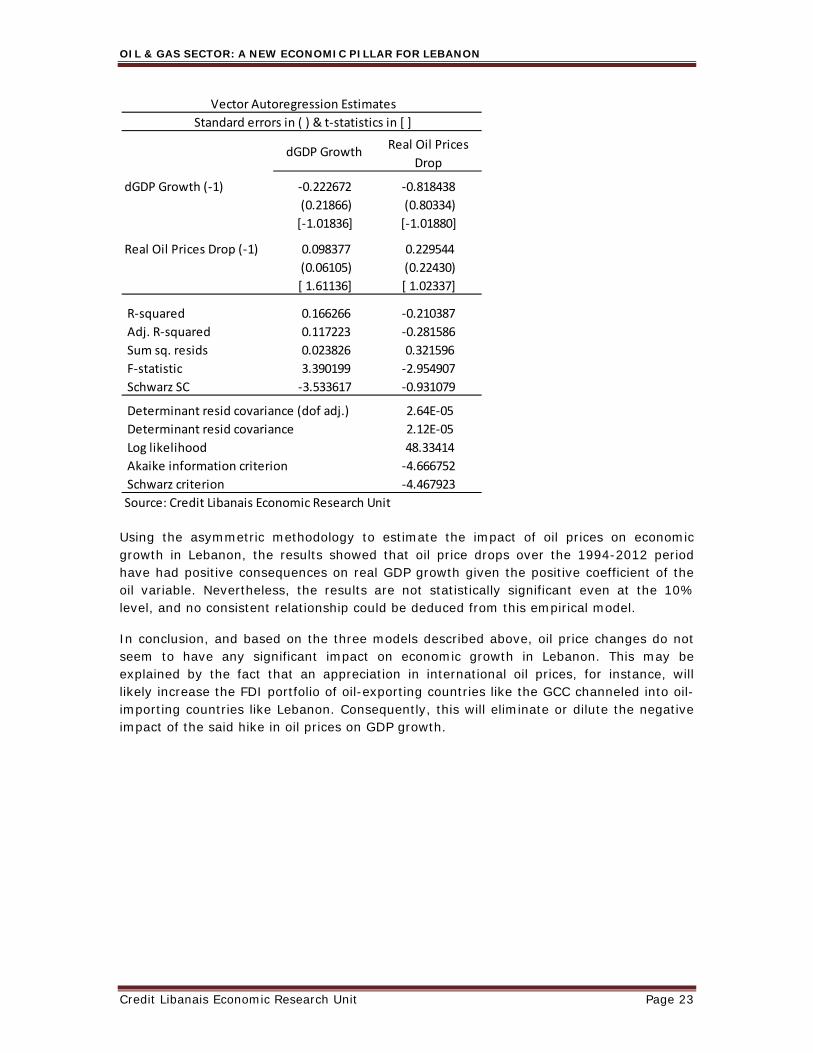
3. A Drop in Real Oil Prices
Recent economic literature on the consequences of oil prices fluctuations on economic growth showed that a contraction in oil prices does not produce the opposite effect of a hike in oil prices28. According to these publications, oil price increases proved to have in most cases a negative impact on real GDP growth in net oil-importing countries, while, on the other hand, no significant (negative) relation could be deduced between a drop in oil prices and an improvement in economic growth in these countries. The lack of a strong statistical relationship between oil price drops and economic growth stems possibly from the slow reallocation of resources between the different economic sectors. In fact, when oil prices fall, the slow adjustment in the reallocation of resources between different sectors prevents said drop to reflect positively on economic growth in the short run.
Hence, the effect of oil prices on economic growth is often considered to be asymmetric. In order to account for this potential asymmetry in the abovementioned relation, we factored out the increases in oil prices and adopted only the periods that witnessed a contraction in oil prices. The results of this regression are elaborated in the table on the following page:
28 Hamilton (2000) and Abeysinghe (2001) among others.
OIL & GAS SECTOR: A NEW ECONOMIC PILLAR FOR LEBANON
Credit Libanais Economic Research Unit Page 23
Using the asymmetric methodology to estimate the impact of oil prices on economic growth in Lebanon, the results showed that oil price drops over the 1994-2012 period have had positive consequences on real GDP growth given the positive coefficient of the oil variable. Nevertheless, the results are not statistically significant even at the 10% level, and no consistent relationship could be deduced from this empirical model.
In conclusion, and based on the three models described above, oil price changes do not seem to have any significant impact on economic growth in Lebanon. This may be explained by the fact that an appreciation in international oil prices, for instance, will likely increase the FDI portfolio of oil-exporting countries like the GCC channeled into oil-importing countries like Lebanon. Consequently, this will eliminate or dilute the negative impact of the said hike in oil prices on GDP growth.
dGDP GrowthReal Oil Prices
Drop
dGDP Growth (‐1) ‐0.222672 ‐0.818438
(0.21866) (0.80334)
[‐1.01836] [‐1.01880]
Real Oil Prices Drop (‐1) 0.098377 0.229544
(0.06105) (0.22430)
[ 1.61136] [ 1.02337]
R‐squared 0.166266 ‐0.210387
Adj. R‐squared 0.117223 ‐0.281586
Sum sq. resids 0.023826 0.321596
F‐statistic 3.390199 ‐2.954907
Schwarz SC ‐3.533617 ‐0.931079
Determinant resid covariance (dof adj.) 2.64E‐05
Determinant resid covariance 2.12E‐05
Log likelihood 48.33414
Akaike information criterion ‐4.666752
Schwarz criterion ‐4.467923
Vector Autoregression Estimates
Standard errors in ( ) & t‐statistics in [ ]
Source: Credit Libanais Economic Research Unit
OIL & GAS SECTOR: A NEW ECONOMIC PILLAR FOR LEBANON
Credit Libanais Economic Research Unit Page 24
C. PUBLIC FINANCE
The Lebanese government already benefits from revenues from hydrocarbon consumption. In fact, the government levies a 20% tax on oil consumption 29 which generates roughly $800 million on a yearly basis. The section hereunder aims at projecting the additional public revenues that could be generated from oil and gas production.
We assume that the government’s revenues from the exploitation of oil and gas will mainly stem from a 15% corporate income tax, a 60% profit share on hydrocarbon production, a royalty fee of 4% on gas production, and royalty fees ranging between 5% and 12% on oil production30 (average of 8.5% adopted).
It is worth noting, in this perspective, that the results on the following page are based on a 60% gross profit margin from offshore oil drilling, bearing in mind that the profitability assumptions of oil & gas extraction in Lebanese territorial and offshore waters are highly dependent on the location and depth of Lebanese hydrocarbon resources.
The table on the following page sketches the repercussions of oil and gas extraction on Lebanon’s budget deficit over the 2020-2039 period. In an attempt to estimate future budget deficit figures when excluding oil & gas extraction, we have assumed a flat deficit to nominal GDP ratio of 10% over the forecast horizon, being the arithmetic mean of the said ratio over the past 10 years.
29 Ministry of Energy and Water. 30 The royalty fees for oil & gas extraction were published on the Lebanese Petroleum Administration’s official website.
OIL & GAS SECTOR: A NEW ECONOMIC PILLAR FOR LEBANON
Credit Libanais Economic Research Unit Page 25
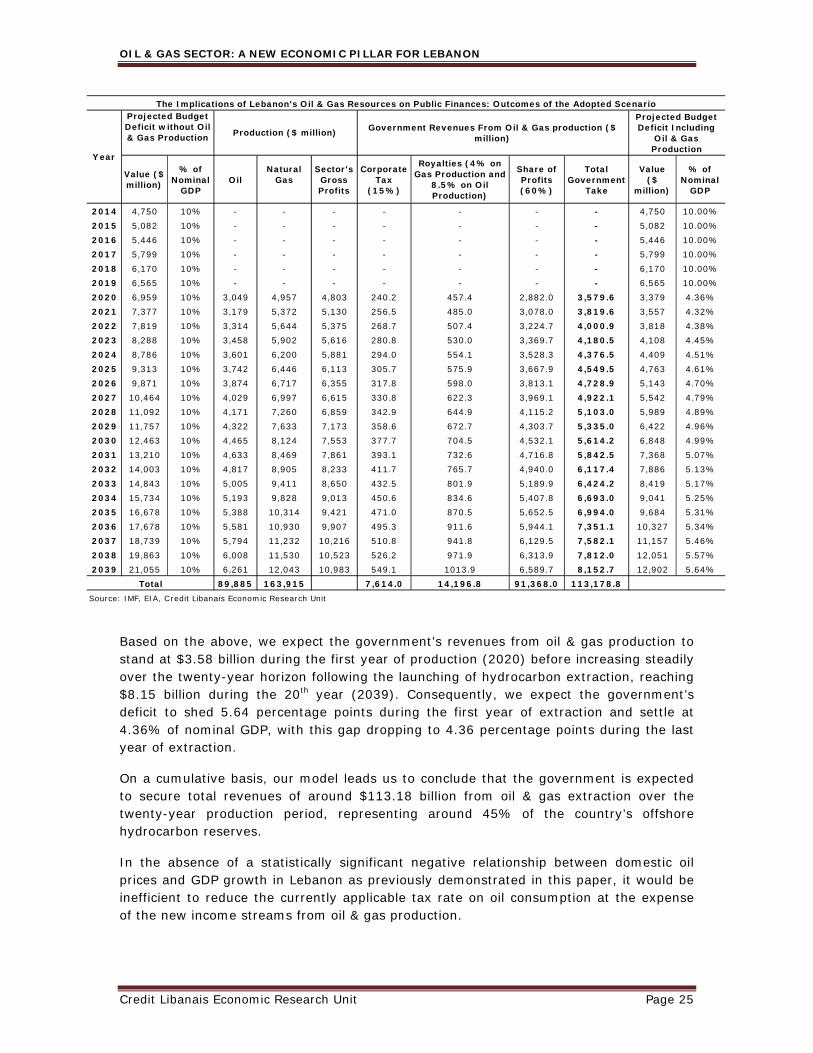
Based on the above, we expect the government’s revenues from oil & gas production to stand at $3.58 billion during the first year of production (2020) before increasing steadily over the twenty-year horizon following the launching of hydrocarbon extraction, reaching $8.15 billion during the 20th year (2039). Consequently, we expect the government’s deficit to shed 5.64 percentage points during the first year of extraction and settle at 4.36% of nominal GDP, with this gap dropping to 4.36 percentage points during the last year of extraction.
On a cumulative basis, our model leads us to conclude that the government is expected to secure total revenues of around $113.18 billion from oil & gas extraction over the twenty-year production period, representing around 45% of the country’s offshore hydrocarbon reserves.
In the absence of a statistically significant negative relationship between domestic oil prices and GDP growth in Lebanon as previously demonstrated in this paper, it would be inefficient to reduce the currently applicable tax rate on oil consumption at the expense of the new income streams from oil & gas production.
Value ($ million)
% of Nominal
GDPOil
Natural Gas
Sector's Gross Profits
Corporate Tax
(15%)
Royalties (4% on Gas Production and
8.5% on Oil Production)
Share of Profits (60%)
Total Government
Take
Value ($
million)
% of Nominal
GDP
2014 4,750 10% - - - - - - - 4,750 10.00%2015 5,082 10% - - - - - - - 5,082 10.00%2016 5,446 10% - - - - - - - 5,446 10.00%2017 5,799 10% - - - - - - - 5,799 10.00%2018 6,170 10% - - - - - - - 6,170 10.00%2019 6,565 10% - - - - - - - 6,565 10.00%2020 6,959 10% 3,049 4,957 4,803 240.2 457.4 2,882.0 3,579.6 3,379 4.36%2021 7,377 10% 3,179 5,372 5,130 256.5 485.0 3,078.0 3,819.6 3,557 4.32%2022 7,819 10% 3,314 5,644 5,375 268.7 507.4 3,224.7 4,000.9 3,818 4.38%2023 8,288 10% 3,458 5,902 5,616 280.8 530.0 3,369.7 4,180.5 4,108 4.45%2024 8,786 10% 3,601 6,200 5,881 294.0 554.1 3,528.3 4,376.5 4,409 4.51%2025 9,313 10% 3,742 6,446 6,113 305.7 575.9 3,667.9 4,549.5 4,763 4.61%2026 9,871 10% 3,874 6,717 6,355 317.8 598.0 3,813.1 4,728.9 5,143 4.70%2027 10,464 10% 4,029 6,997 6,615 330.8 622.3 3,969.1 4,922.1 5,542 4.79%2028 11,092 10% 4,171 7,260 6,859 342.9 644.9 4,115.2 5,103.0 5,989 4.89%2029 11,757 10% 4,322 7,633 7,173 358.6 672.7 4,303.7 5,335.0 6,422 4.96%2030 12,463 10% 4,465 8,124 7,553 377.7 704.5 4,532.1 5,614.2 6,848 4.99%2031 13,210 10% 4,633 8,469 7,861 393.1 732.6 4,716.8 5,842.5 7,368 5.07%2032 14,003 10% 4,817 8,905 8,233 411.7 765.7 4,940.0 6,117.4 7,886 5.13%2033 14,843 10% 5,005 9,411 8,650 432.5 801.9 5,189.9 6,424.2 8,419 5.17%2034 15,734 10% 5,193 9,828 9,013 450.6 834.6 5,407.8 6,693.0 9,041 5.25%2035 16,678 10% 5,388 10,314 9,421 471.0 870.5 5,652.5 6,994.0 9,684 5.31%2036 17,678 10% 5,581 10,930 9,907 495.3 911.6 5,944.1 7,351.1 10,327 5.34%2037 18,739 10% 5,794 11,232 10,216 510.8 941.8 6,129.5 7,582.1 11,157 5.46%2038 19,863 10% 6,008 11,530 10,523 526.2 971.9 6,313.9 7,812.0 12,051 5.57%2039 21,055 10% 6,261 12,043 10,983 549.1 1013.9 6,589.7 8,152.7 12,902 5.64%
89,885 163,915 7,614.0 14,196.8 91,368.0 113,178.8Source: IMF, EIA, Credit Libanais Economic Research Unit
Total
Projected Budget Deficit without Oil & Gas Production
Projected Budget Deficit Including
Oil & Gas Production
The Implications of Lebanon's Oil & Gas Resources on Public Finances: Outcomes of the Adopted Scenario
Government Revenues From Oil & Gas production ($ million)
Year
Production ($ million)
OIL & GAS SECTOR: A NEW ECONOMIC PILLAR FOR LEBANON
Credit Libanais Economic Research Unit Page 26
More specifically, the current tax scheme on oil & gas consumption in Lebanon generates some $800 million in income to the government, representing 22.35% of the expected $3.58 billion of additional annual public revenues during the first year of oil & gas production.
D. BALANCE OF PAYMENTS 1. Current Account
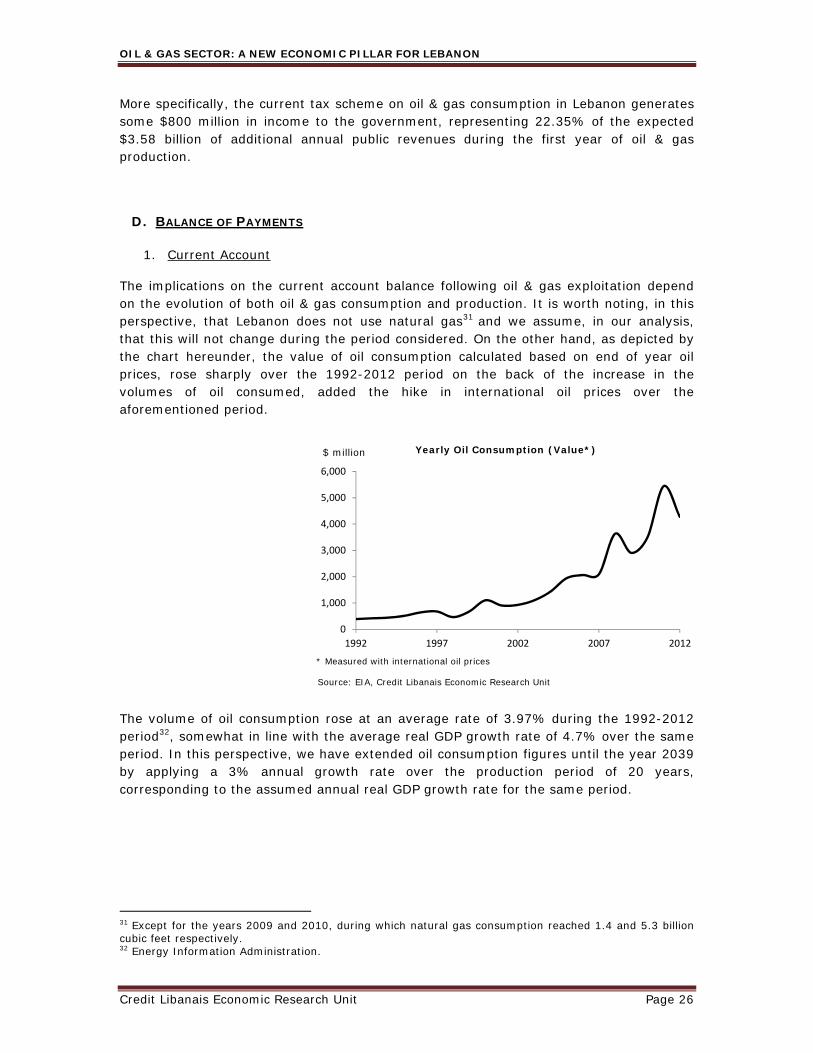
The implications on the current account balance following oil & gas exploitation depend on the evolution of both oil & gas consumption and production. It is worth noting, in this perspective, that Lebanon does not use natural gas31 and we assume, in our analysis, that this will not change during the period considered. On the other hand, as depicted by the chart hereunder, the value of oil consumption calculated based on end of year oil prices, rose sharply over the 1992-2012 period on the back of the increase in the volumes of oil consumed, added the hike in international oil prices over the aforementioned period.
The volume of oil consumption rose at an average rate of 3.97% during the 1992-2012 period32, somewhat in line with the average real GDP growth rate of 4.7% over the same period. In this perspective, we have extended oil consumption figures until the year 2039 by applying a 3% annual growth rate over the production period of 20 years, corresponding to the assumed annual real GDP growth rate for the same period.
31 Except for the years 2009 and 2010, during which natural gas consumption reached 1.4 and 5.3 billion cubic feet respectively. 32 Energy Information Administration.
0
1,000
2,000
3,000
4,000
5,000
6,000
1992 1997 2002 2007 2012
Yearly Oil Consumption (Value*)$ million
Source: EIA, Credit Libanais Economic Research Unit
* Measured with international oil prices
OIL & GAS SECTOR: A NEW ECONOMIC PILLAR FOR LEBANON
Credit Libanais Economic Research Unit Page 27
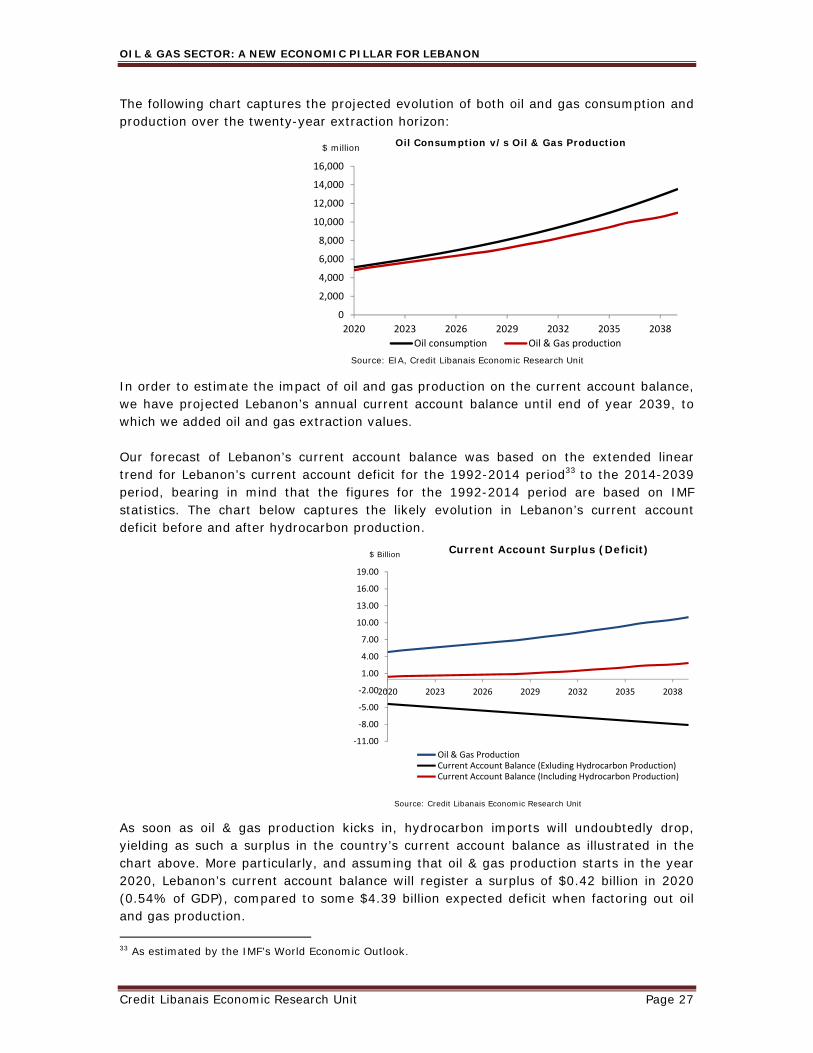
The following chart captures the projected evolution of both oil and gas consumption and production over the twenty-year extraction horizon:
In order to estimate the impact of oil and gas production on the current account balance, we have projected Lebanon’s annual current account balance until end of year 2039, to which we added oil and gas extraction values. Our forecast of Lebanon’s current account balance was based on the extended linear trend for Lebanon’s current account deficit for the 1992-2014 period33 to the 2014-2039 period, bearing in mind that the figures for the 1992-2014 period are based on IMF statistics. The chart below captures the likely evolution in Lebanon’s current account deficit before and after hydrocarbon production. As soon as oil & gas production kicks in, hydrocarbon imports will undoubtedly drop, yielding as such a surplus in the country’s current account balance as illustrated in the chart above. More particularly, and assuming that oil & gas production starts in the year 2020, Lebanon’s current account balance will register a surplus of $0.42 billion in 2020 (0.54% of GDP), compared to some $4.39 billion expected deficit when factoring out oil and gas production. 33 As estimated by the IMF’s World Economic Outlook.
0
2,000
4,000
6,000
8,000
10,000
12,000
14,000
16,000
2020 2023 2026 2029 2032 2035 2038
Oil Consumption v/s Oil & Gas Production
Oil consumption Oil & Gas production
$ million
Source: EIA, Credit Libanais Economic Research Unit
‐11.00
‐8.00
‐5.00
‐2.00
1.00
4.00
7.00
10.00
13.00
16.00
19.00
2020 2023 2026 2029 2032 2035 2038
Oil & Gas ProductionCurrent Account Balance (Exluding Hydrocarbon Production)Current Account Balance (Including Hydrocarbon Production)
Source: Credit Libanais Economic Research Unit
Current Account Surplus (Deficit)$ Billion
OIL & GAS SECTOR: A NEW ECONOMIC PILLAR FOR LEBANON
Credit Libanais Economic Research Unit Page 28
On the long run, we project Lebanon’s current account surplus to rise progressively and reach $2.87 billion as at year-end 2039 (1.25% of GDP).
2. Capital Account
The exploitation of oil and gas reserves will require relatively significant investments from oil and gas companies, thus generating important FDI inflows to Lebanon. However, no data is available on the total size of the investments (machinery and equipment) required to launch the drilling and extraction process. Hence, estimating the FDI inflows directly related to oil and gas production may not be possible at this stage.
In parallel, and given that the capital account is the counterpart of the current account, the likely contraction in the current account deficit as demonstrated in the previous section will unquestionably reduce the capital outflows from the country. The previous section, which describes the change in Lebanon’s current account deficit before and after embarking on oil & gas production, shows some $4.80 billion improvement in the country’s current account balance during the first year of production. We expect this gap to increase steadily over the twenty-year period following the launching of oil & gas production and reach $10.98 billion by the year 2039.
YearValue
($ Billion)
% of Nominal
GDP
Oil Production
($ billion)
Natural Gas
Production
($ billion)
Profit Oil (60%
of Hydrocarbon
Production)
Value
($ Billion)
% of Nominal
GDP
2020 ‐4.39 ‐6.30% 3.05 4.96 4.80 0.42 0.54%
2021 ‐4.58 ‐6.21% 3.18 5.37 5.13 0.55 0.67%
2022 ‐4.78 ‐6.11% 3.31 5.64 5.37 0.60 0.68%
2023 ‐4.97 ‐6.00% 3.46 5.90 5.62 0.64 0.70%
2024 ‐5.17 ‐5.89% 3.60 6.20 5.88 0.71 0.73%
2025 ‐5.37 ‐5.76% 3.74 6.45 6.11 0.75 0.72%
2026 ‐5.56 ‐5.64% 3.87 6.72 6.36 0.79 0.72%
2027 ‐5.76 ‐5.50% 4.03 7.00 6.62 0.86 0.74%
2028 ‐5.96 ‐5.37% 4.17 7.26 6.86 0.90 0.74%
2029 ‐6.15 ‐5.23% 4.32 7.63 7.17 1.02 0.79%
2030 ‐6.35 ‐5.09% 4.47 8.12 7.55 1.20 0.88%
2031 ‐6.55 ‐4.95% 4.63 8.47 7.86 1.32 0.91%
2032 ‐6.74 ‐4.81% 4.82 8.91 8.23 1.49 0.97%
2033 ‐6.94 ‐4.67% 5.00 9.41 8.65 1.71 1.05%
2034 ‐7.13 ‐4.53% 5.19 9.83 9.01 1.88 1.09%
2035 ‐7.33 ‐4.40% 5.39 10.31 9.42 2.09 1.15%
2036 ‐7.53 ‐4.26% 5.58 10.93 9.91 2.38 1.23%
2037 ‐7.72 ‐4.12% 5.79 11.23 10.22 2.49 1.22%
2038 ‐7.92 ‐3.99% 6.01 11.53 10.52 2.60 1.20%
2039 ‐8.12 ‐3.85% 6.26 12.04 10.98 2.87 1.25%
The Implications of Lebanon's Oil & Gas Resources on the Country's Current Account Deficit Based on the
Adopted Scenario
Projected Current
Account Surplus (Deficit)
Without Oil & Gas
Projected Current Account
Surplus (Deficit) Including Oil
& Gas Production
Source: IMF, Credi t Libana is Economic Research Unit
OIL & GAS SECTOR: A NEW ECONOMIC PILLAR FOR LEBANON
Credit Libanais Economic Research Unit Page 29
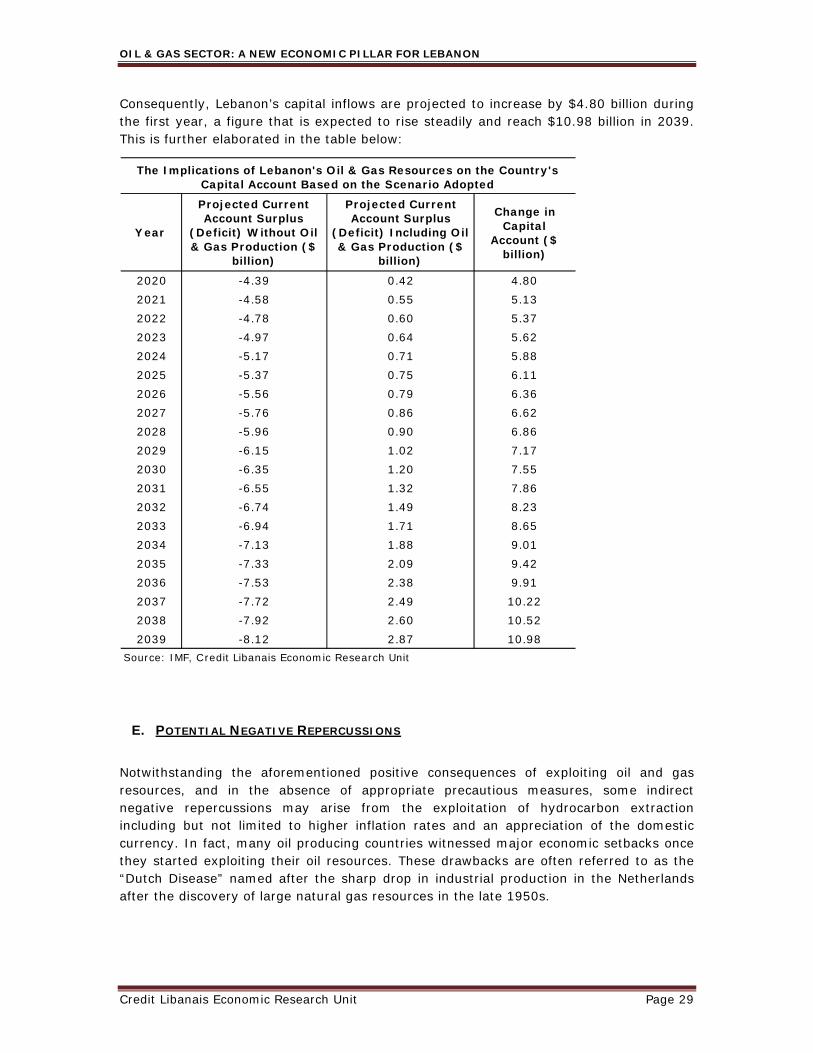
Consequently, Lebanon’s capital inflows are projected to increase by $4.80 billion during the first year, a figure that is expected to rise steadily and reach $10.98 billion in 2039. This is further elaborated in the table below:
E. POTENTIAL NEGATIVE REPERCUSSIONS
Notwithstanding the aforementioned positive consequences of exploiting oil and gas resources, and in the absence of appropriate precautious measures, some indirect negative repercussions may arise from the exploitation of hydrocarbon extraction including but not limited to higher inflation rates and an appreciation of the domestic currency. In fact, many oil producing countries witnessed major economic setbacks once they started exploiting their oil resources. These drawbacks are often referred to as the “Dutch Disease” named after the sharp drop in industrial production in the Netherlands after the discovery of large natural gas resources in the late 1950s.
Year
Change in Capital
Account ($ billion)
2020 -4.39 0.42 4.802021 -4.58 0.55 5.132022 -4.78 0.60 5.372023 -4.97 0.64 5.622024 -5.17 0.71 5.882025 -5.37 0.75 6.112026 -5.56 0.79 6.362027 -5.76 0.86 6.622028 -5.96 0.90 6.862029 -6.15 1.02 7.172030 -6.35 1.20 7.552031 -6.55 1.32 7.862032 -6.74 1.49 8.232033 -6.94 1.71 8.652034 -7.13 1.88 9.012035 -7.33 2.09 9.422036 -7.53 2.38 9.912037 -7.72 2.49 10.222038 -7.92 2.60 10.522039 -8.12 2.87 10.98
Projected Current Account Surplus
(Deficit) Without Oil & Gas Production ($
billion)
Projected Current Account Surplus
(Deficit) Including Oil & Gas Production ($
billion)
The Implications of Lebanon's Oil & Gas Resources on the Country's Capital Account Based on the Scenario Adopted
Source: IMF, Credit Libanais Economic Research Unit
OIL & GAS SECTOR: A NEW ECONOMIC PILLAR FOR LEBANON
Credit Libanais Economic Research Unit Page 30
More particularly, the Dutch disease describes the negative relationship between oil & gas extraction and other national production through the appreciation of the national currency which makes domestic production expensive in the exports market.
1. Inflation
Oil and gas production is expected to reflect positively on Lebanon’s current account balance, which, in turn, will generate capital inflows, hence increasing money in circulation in the economy. The sudden improvement in Lebanon’s current account balance is likely to bring upon the same effect of an expansionary monetary policy, namely, an increase in the country’s inflation rate triggered by the increase in money in circulation.
In parallel, the country’s oil and gas production will certainly boost public revenues through royalties, tax revenues, and share of profits. In the event this extra public income translates into higher public spending, inflation rate could further increase propelled by the growth in internal demand.
This possible increase in inflation rate may, in turn, reduce the country’s external competitiveness and hamper industrial and agricultural exports, and consequently backfire on GDP growth.
2. Exchange Rate
As previously mentioned, the exploitation of oil and gas resources will increase the country’s exports, causing an appreciation of the domestic currency. Consequently, the prices of local goods are expected to increase relatively to foreign goods, which will severely hinder Lebanese exports, and reflect negatively on the exports of other sectors.
However, given BDL’s exchange rate policy and the peg of the Lebanese pound to the US Dollar, capital inflows are likely to be counterbalanced by an increase in the supply of Lebanese pounds, in order to avoid the appreciation of the national currency.
Nonetheless, if this process in accomplished through BDL buying bonds or other securities to increase the supply of the Lebanese pound in the market (to avoid excessive appreciation of the national currency) money in circulation will undoubtedly increase and trigger a further rise in the inflation rate.
On the other hand, if BDL buys US Dollars in order to increase the supply of Lebanese pounds in an attempt to counter the appreciation of the domestic currency, this will facilitate maintaining the peg of the USD/LBP exchange rate without affecting the level of money in circulation in the country, hence escaping the previously mentioned hike in the inflation rate.
OIL & GAS SECTOR: A NEW ECONOMIC PILLAR FOR LEBANON
Credit Libanais Economic Research Unit Page 31
VI. OBSTACLES AND MEASURES
A. POLITICAL OBSTACLES AND RISKS 1. Borders
As previously mentioned, the bulk of oil & gas reserves in the Levant basin belongs to Lebanon, Cyprus and Israel, the thing which led to conflicts between said countries concerning the delineation of several economic zones. More particularly, an 874 square kilometers disputed maritime area is currently claimed by both Lebanon and Israel, the thing which prevents both countries from exploiting the potential energy resources of this area.
2. Political Factors
Fraser Institute, an independent non-partisan research and educational organization based in Canada, assesses each jurisdiction’s barriers to investment in the petroleum industry, the former enclosing the jurisdiction’s “high tax rates, costly regulatory schemes, uncertainty over environmental regulations and the interpretation and administration of regulations governing the petroleum industry, and security threats”. Concerning the methodology approach, the lower a jurisdiction’s score, the more attractive its investment environment is, hence the higher its ranking.
The survey assigned Lebanon a score of 52.22 in the year 2013, positioning the country 88th in the world and 9th regionally. When accounting for some of the petroleum industry’s investment barriers in Lebanon, the survey highlighted that around 19% of interviewed executives and managers deemed the country’s political stability as “mild deterrent to investment”, while more than 30% believed said stability to be a “strong deterrent to investment”. Moreover, other factors that were judged by surveyed executives and managers to be “mild deterrents to investment” in the upstream oil and gas industry in Lebanon include the country’s environmental regulations (around 21% of respondents), the cost of regulatory compliance (around 26% of respondents) and the trade barriers (around 28% of respondents).
It is worth highlighting, in this perspective, that the ongoing conflict in neighboring Syria and the regional deadlock since the onset of the Arab Spring casted their shadows on Lebanon’s political stability and curbed the country’s economic growth.
Another constraint factor revolves around the sequential delays in the contract auction amid the internal bickering surrounding the passing of the previously mentioned petroleum laws, the thing which prompted some previously-interested companies to reconsider investing in the country and even withdrawing from the bidding process.
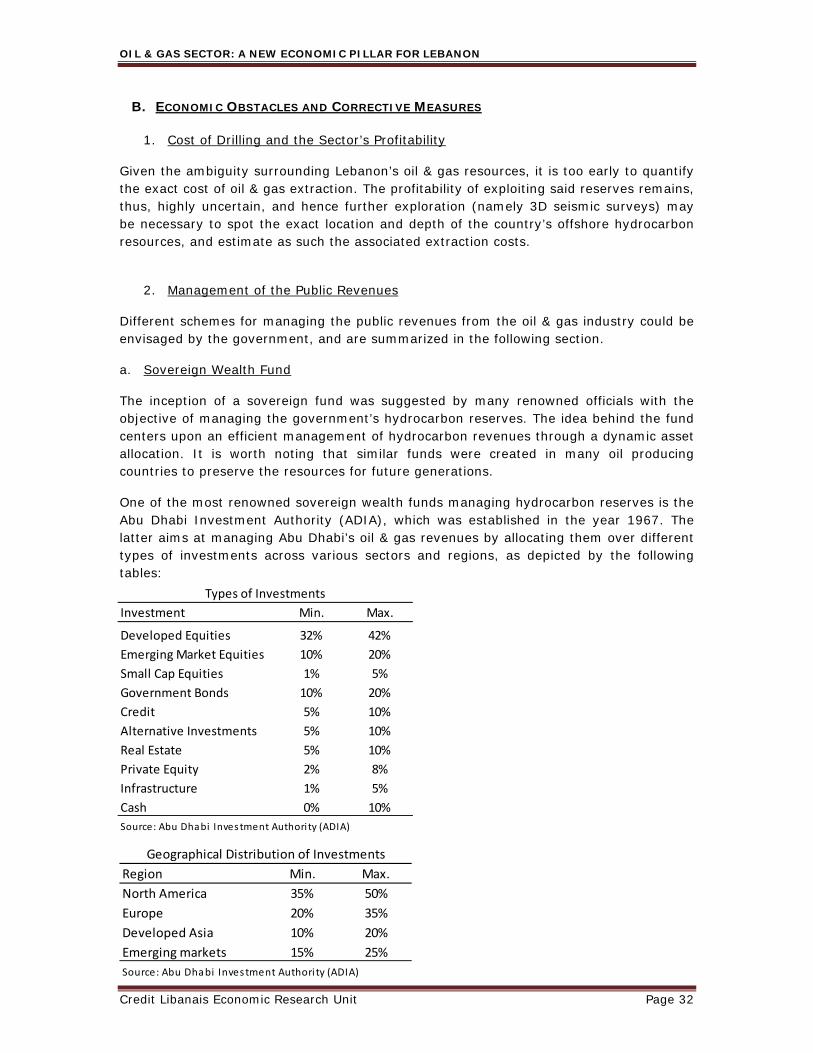
OIL & GAS SECTOR: A NEW ECONOMIC PILLAR FOR LEBANON
Credit Libanais Economic Research Unit Page 32
B. ECONOMIC OBSTACLES AND CORRECTIVE MEASURES 1. Cost of Drilling and the Sector’s Profitability
Given the ambiguity surrounding Lebanon’s oil & gas resources, it is too early to quantify the exact cost of oil & gas extraction. The profitability of exploiting said reserves remains, thus, highly uncertain, and hence further exploration (namely 3D seismic surveys) may be necessary to spot the exact location and depth of the country’s offshore hydrocarbon resources, and estimate as such the associated extraction costs.
2. Management of the Public Revenues
Different schemes for managing the public revenues from the oil & gas industry could be envisaged by the government, and are summarized in the following section.
a. Sovereign Wealth Fund
The inception of a sovereign fund was suggested by many renowned officials with the objective of managing the government’s hydrocarbon reserves. The idea behind the fund centers upon an efficient management of hydrocarbon revenues through a dynamic asset allocation. It is worth noting that similar funds were created in many oil producing countries to preserve the resources for future generations.
One of the most renowned sovereign wealth funds managing hydrocarbon reserves is the Abu Dhabi Investment Authority (ADIA), which was established in the year 1967. The latter aims at managing Abu Dhabi’s oil & gas revenues by allocating them over different types of investments across various sectors and regions, as depicted by the following tables:
Region Min. Max.
North America 35% 50%
Europe 20% 35%
Developed Asia 10% 20%
Emerging markets 15% 25%
Geographical Distribution of Investments
Source: Abu Dhabi Investment Authori ty (ADIA)
Investment Min. Max.
Developed Equities 32% 42%
Emerging Market Equities 10% 20%
Small Cap Equities 1% 5%
Government Bonds 10% 20%
Credit 5% 10%
Alternative Investments 5% 10%
Real Estate 5% 10%
Private Equity 2% 8%
Infrastructure 1% 5%
Cash 0% 10%
Types of Investments
Source: Abu Dhabi Investment Authori ty (ADIA)
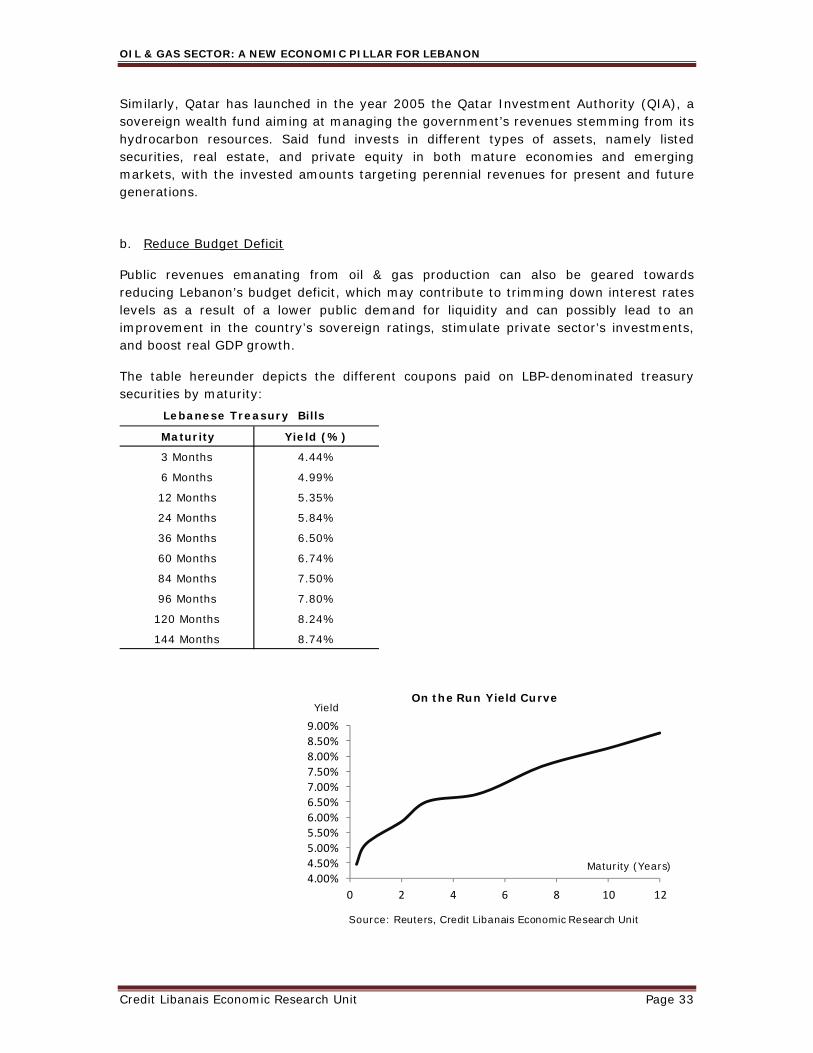
OIL & GAS SECTOR: A NEW ECONOMIC PILLAR FOR LEBANON
Credit Libanais Economic Research Unit Page 33
Similarly, Qatar has launched in the year 2005 the Qatar Investment Authority (QIA), a sovereign wealth fund aiming at managing the government’s revenues stemming from its hydrocarbon resources. Said fund invests in different types of assets, namely listed securities, real estate, and private equity in both mature economies and emerging markets, with the invested amounts targeting perennial revenues for present and future generations.
b. Reduce Budget Deficit
Public revenues emanating from oil & gas production can also be geared towards reducing Lebanon’s budget deficit, which may contribute to trimming down interest rates levels as a result of a lower public demand for liquidity and can possibly lead to an improvement in the country’s sovereign ratings, stimulate private sector’s investments, and boost real GDP growth.
The table hereunder depicts the different coupons paid on LBP-denominated treasury securities by maturity:
4.00%4.50%5.00%
5.50%6.00%6.50%7.00%7.50%
8.00%8.50%9.00%
0 2 4 6 8 10 12
On the Run Yield CurveYield
Maturity (Years)
Source: Reuters, Credit Libanais Economic Research Unit
Maturity Yield (%)
3 Months 4.44%
6 Months 4.99%
12 Months 5.35%
24 Months 5.84%
36 Months 6.50%
60 Months 6.74%
84 Months 7.50%
96 Months 7.80%
120 Months 8.24%
144 Months 8.74%
Lebanese Treasury Bills
OIL & GAS SECTOR: A NEW ECONOMIC PILLAR FOR LEBANON
Credit Libanais Economic Research Unit Page 34
In the event interest rates paid on sovereign debt are higher than the expected yield (between 5% and 7% depending on the concentration of the subscriptions) generated by the sovereign fund, public revenues from oil and gas production should instead be allocated towards reducing the budget deficit.
c. Increase Public Expenditures
The government could similarly opt to employ the revenues generated from oil & gas production to increase its expenditures and boost aggregate demand, either through redistribution policies or through public infrastructure expenses. This alternative could, however, result in an increase in the country’s inflation rate, shore up interest rate levels, hamper private investment and slow economic growth on the long run.
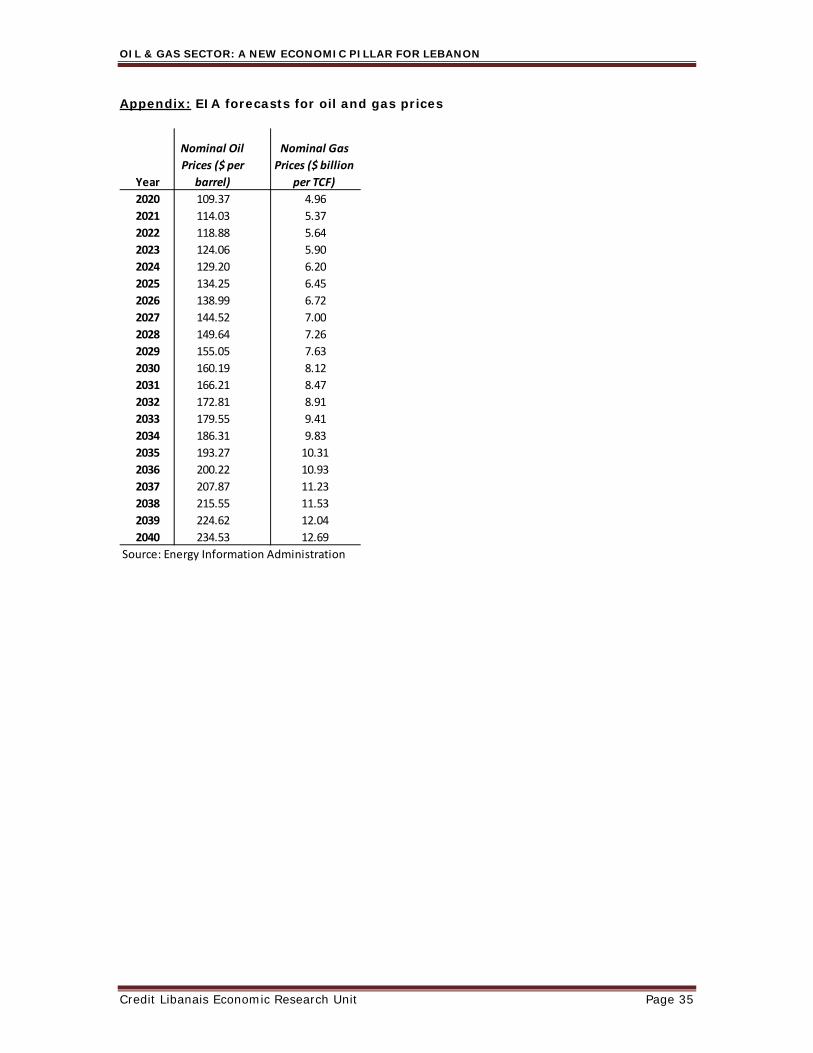
OIL & GAS SECTOR: A NEW ECONOMIC PILLAR FOR LEBANON
Credit Libanais Economic Research Unit Page 35
Appendix: EIA forecasts for oil and gas prices
Year
Nominal Oil
Prices ($ per
barrel)
Nominal Gas
Prices ($ billion
per TCF)
2020 109.37 4.96
2021 114.03 5.37
2022 118.88 5.64
2023 124.06 5.90
2024 129.20 6.20
2025 134.25 6.45
2026 138.99 6.72
2027 144.52 7.00
2028 149.64 7.26
2029 155.05 7.63
2030 160.19 8.12
2031 166.21 8.47
2032 172.81 8.91
2033 179.55 9.41
2034 186.31 9.83
2035 193.27 10.31
2036 200.22 10.93
2037 207.87 11.23
2038 215.55 11.53
2039 224.62 12.04
2040 234.53 12.69
Source: Energy Information Administration
OIL & GAS SECTOR: A NEW ECONOMIC PILLAR FOR LEBANON
Credit Libanais Economic Research Unit Page 36
Credit Libanais SAL
Economic Research Unit Credit Libanais Tower – Adlieh Tel: +961-1-608000 Fax: +961-1-608000 Ext: 1285 [email protected] Contacts: Fadlo I. Choueiri, CFA [email protected] Tel: +961-1-608000 EXT: 1280 Jad Abi Haidar [email protected] Tel: +961-1-608000 EXT: 1283 Joelle Samaha [email protected] Tel: +961-1-608000 EXT: 1281 Patrick Karawani [email protected] Tel: +961-1-608000 EXT: 1282 Joanna Gergi [email protected] Tel: +961-1-608000 EXT: 1284
CONTACTS