Embed Size (px)
Citation preview

Week 48 results of AMBER: A Phase 3, randomised, double-blind trial in antiretroviral treatment-naïve HIV-1-infected adults to evaluate the efficacy and safety of the once-daily, single-tablet regimen of darunavir/cobicistat/emtricitabine/tenofovir alafenamide (D/C/F/TAF) versus darunavir/cobicistat plus emtricitabine/tenofovir disoproxil fumarate
Joseph Eron1, Chloe Orkin2, Joel Gallant3, Jean-Michel Molina4, Eugenia Negredo5, Andrea Antinori6, Anthony Mills7, Jacques Reynes8, Erika Van Landuyt9, Erkki Lathouwers9, Veerle Hufkens9, John Jezorwski9, Magda Opsomer9, on behalf of the AMBER study group1The University of North Carolina School of Medicine, Chapel Hill, NC; 2Barts Health NHS Trust, London, UK; 3Southwest CARE Center, Santa Fe, New Mexico, USA; 4Department of Infectious Diseases, St-Louis Hospital, University of Paris Diderot, Paris, France; 5Germans Trias i PujolUniversity Hospital, Badalona, Spain; 6National Institute for Infectious Diseases, L. SpallanzaniIRCCS, Rome, Italy; 7Southern California Men's Medical Group, Los Angeles, CA, USA; 8Montpellier University Hospital, Montpellier, France; 9Janssen Pharmaceutica NV, Beerse, Belgium
Gallant C, et al. EACS 2017. Abstract PS8/2

*121 sites in USA, Canada, Belgium, France, Germany, Italy, Poland, Russia, Spain, UK†Lower limit of 95% CI of stratified Mantel-Haenszel difference between D/C/F/TAF and control >–10%
AMBER: Phase 3, Randomised, Double-blind, International,* Multicentre Trial
Primary objective: Assess non-inferiority of D/C/F/TAF vs D/C + F/TDF by proportion of patients with VL <50 c/mL at 48 weeks (NI margin 10%; FDA-Snapshot algorithm)†
Randomisation stratified by screening VL !/>100,000 c/mL and CD4+ </" 200 cells/mm3
2
AMBER (NCT02431247)
Treatment-naïve adults (N=725)
! Screening plasma VL "1,000 c/mL
! CD4+ >50 cells/mm3
! Genotypic susceptibility to DRV, FTC and TFV
! HBV/HCV negative
1:1
Baseline Week 48Primary endpoint
1:1
Baseline Week 96
!"#"$"%&$
Week 96
!'()*+,)*-./012+314+.105637+ 8'**,'9+205637+
!"#"$"%&$
:-.;*+,32405637+
Week 48
!"#"$"%&$
!"#"$"%&$!"#$%&'()*"+,-"!".,/+."01$&234
!"#"$"%&$!"#0<0$"%!$0!"#$%&'()*"+,-,.,/5."01$&234"

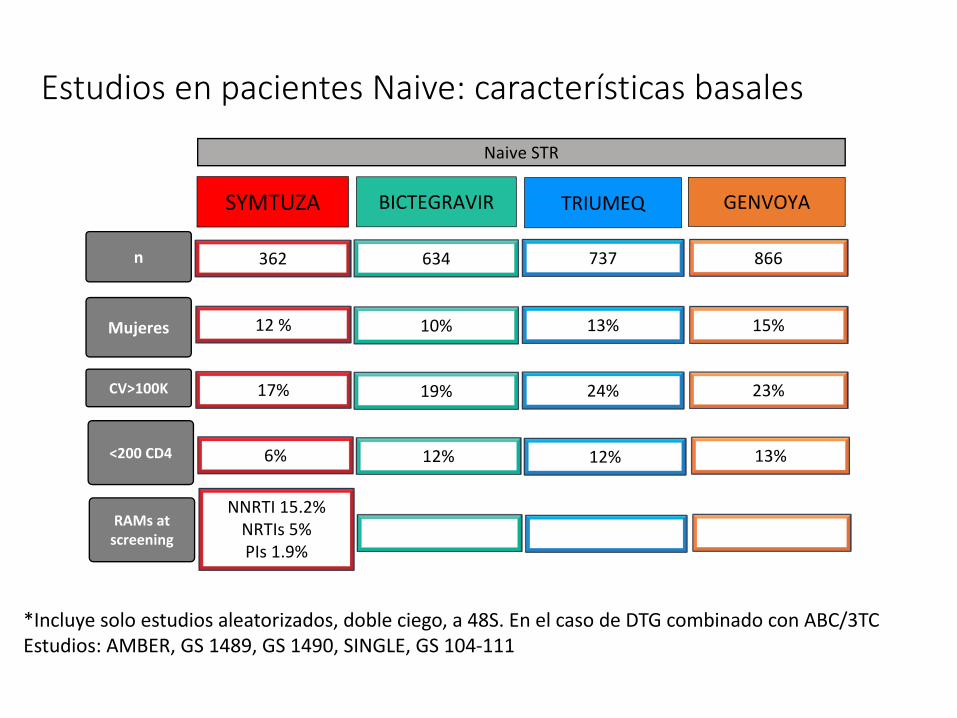
Baseline CharacteristicsD/C/F/TAF
N=362ControlN=363
TotalN=725
Median (IQR) age, years 34 (27–42) 34 (27–42) 34 (27–42)
Male, n (%) 318 (87.8) 322 (88.7) 640 (88.3)
Race, n (%)White 300 (82.9) 300 (82.6) 600 (82.8)Black/African-American 40 (11.0) 40 (11.0) 80 (11.0)Other races 22 (6.1) 23 (6.3) 45 (6.2)
Median (IQR) log10 VL, c/mL 4.4 (4.0–4.8) 4.6 (4.2–4.9) 4.5 (4.1–4.9)VL !100,000 c/mL, n (%) 60 (16.6) 70 (19.3) 130 (17.9)Median (IQR) CD4+ count, cells/mm3 461.5 (342–617) 440.0 (325–594) 453.0 (333–601)CD4+ count <200 cells/mm3 22 (6.1) 29 (8.0) 51 (7.0)Median (IQR) eGFRcr, mL/min (Cockcroft-Gault) 119 (105–135) 118 (103–138) 119 (104–136.5)
Genotype at screening N=361 N=362 N=723
!1 NNRTI RAMs 55 (15.2) 63 (17.4) 118 (16.3)!1 NRTI RAMs 18 (5.0) 16 (4.4) 34 (4.7)!1 primary PI RAMs 7 (1.9) 8 (2.2) 15 (2.1)
3
IQR, inter-quartile range

91.4%
4.4%(n=16)
4.1%(n=15)
88.4%
3.3%(n=12)
8.3%(n=30)
0
20
40
60
80
100
Virologicresponse (VL<50 c/mL)
VL !50 c/mL No virologic data
Prop
ortio
n of
pat
ient
s (%
) D/C/F/TAF (N=362)Control (N=363)
2.7
-10 -8 -6 -4 -2 0 2 4 6 8 10
Virologic Outcome at Week 48 (FDA Snapshot; VL<50 c/mL) (ITT)
-1.6 7.1
D/C/F/TAF non-inferior to control Lower bound 95% CI >–10%
Favours control FavoursD/C/F/TAF
Percentage point difference
Stratified difference (95% CI) (D/C/F/TAF–control)
†p<0·0001
†p-value for non-inferiority at 10% NI margin
(n=331) (n=321)
4

Virologic Outcome Categories at Week 48 (FDA Snapshot; <50 c/mL) (ITT)
5
Outcomes, n (%)
D/C/F/TAFN=362
ControlN=363
Virologic response (VL <50 c/mL) 331 (91.4%) 321 (88.4%)
VL !50 c/mL 16 (4.4%) 12 (3.3%)
Last VL in week 48 window !50 c/mL 9 (2.5%) 9 (2.5%)
Discontinued for efficacy reasons 1 (0.3%)* 0
Discontinued due to other reasons("efficacy/AE/death) and last available VL !50 c/mL† 6 (1.7%) 3 (0.8%)
No VL data in week 48 window 15 (4.1%) 30 (8.3%)
Discontinued due to AE 8 (2.2%) 16 (4.4%)
Discontinued due to other reasons and last available VL <50 c/mL (or missing)¶ 4 (1.1%) 9 (2.5%)
Missing data during window but on study drug 3 (0.8%) 5 (1.4%)
*Patient reached a virologic endpoint (investigator’s assessment: withdrawal decision at week 36 with VL 168 c/mL; last VL on-treatment 31 c/mL)†Lost to follow-up (4 vs 2 patients), patient withdrew (1 vs 1), other reasons (1 vs 0)¶Lost to follow-up (0 vs 3), physician decision (2 vs 0), patient withdrew (1 vs 5), other reasons (1 vs 1)

Virologic responseDifference (95% CI)D/C/F/TAF
n/N (%)Control
n/N (%)
Age (years)
!50 299/326 (91·7) 293/331 (88·5) 3·2 (-1·4; 8·0)>50 32/36 (88·9) 28/32 (87·5) 1·4 (-15·5; 19·8)
Gender
Female 39/44 (88·6) 32/41 (78·0) 10·6 (-5·8; 28·0)Male 292/318 (91·8) 289/322 (89·8) 2·1 (-2·5; 6·7)
Race
White 276/300 (92·0) 267/300 (89·0) 3 (-1·8; 7·9)Black/African American 34/40 (85·0) 34/40 (85·0) 0 (-16·9; 16·9)Other 21/22 (95.5) 20/23 (87.0) 8.5 (-11.4; 29.2)
Baseline CD4+, cells/mm3
<200 16/22 (72·7) 25/29 (86·2) -13·5 (-37·8; 9·6)"200 315/340 (92·6) 296/334 (88·6) 4 (-0·4; 8·6)
Baseline VL, c/mL!100 000 278/303 (91·7) 265/293 (90·4) 1·3 (-3·4; 6·1)>100 000 53/59 (89·8) 56/70 (80·0) 9·8 (-3·3; 22·5)
-12 0 12or : 95% CI limit beyond x-axis range
Virologic Outcome by Subgroups at Week 48 (FDA Snapshot; <50 c/mL) (ITT)
Favours control FavoursD/C/F/TAF
Difference (95% CI) (D/C/F/TAF–control)
6

Resistance Analysis Through 48 Weeks
D/C/F/TAFN=362
ControlN=363
Virologic failures with paired screening andendpoint genotypes*, n 7 2
Patients developing mutations (IAS 2015) post-baseline, n
DRV RAMs 0 0
Primary PI RAMs 0 0
NRTI RAMs 1(M184I/V)† 0
NNRTI RAMs 0 0
*Post-baseline genotyping/phenotyping performed for patients who met the criteria for protocol-defined virologic failure (virologic non-response, virologic rebound, and/or viraemic at final timepoint) and who had VL !400 c/mL at failure (unconfirmed or confirmed failure) or at later time points
†Patient had K103N at screening, indicating transmitted NNRTI (efavirenz/nevirapine) resistance, and developed M184I/V, conferring resistance to FTC and 3TC
7

Incidence, n (%) D/C/F/TAFN=362
ControlN=363
≥1 AE, any grade 312 (86.2) 307 (84.6)≥1 grade 3–4 AE 19 (5.2) 22 (6.1)≥1 serious AE 17 (4.7) 21 (5.8)≥1 AE leading to permanent discontinuation 7 (1.9) 16 (4.4)
Deaths 0 0AEs at least possibly related to study drug
Any 126 (34.8) 151 (41.6)Most common (≥5% either arm)Diarrhoea† 31 (8.6) 40 (11.0)Rash 22 (6.1) 14 (3.9)Nausea 20 (5.5) 36 (9.9)
Adverse Events Through Week 48
8
• No grade 3 or 4 laboratory abnormalities occurred in ≥5% of patients in either treatment arm
†Most cases were mild: Grade 1: 24 (6.6%) vs 32 (8.8%); Grade 2: 7 (1.9%) vs 8 (2.2%)
No D/C/F/TAF discontinuations due to bone, renal, or CNS AEsCNS, central nervous
system

9

10

Mean Changes in eGFR Through 48 Weeks
aBased on serum levels and CKD-EPI formula*p value for difference estimated using ANCOVA, including treatment as a factor and baseline eGFR as a covariate
! Results are consistent with the known effect of cobicistat on inhibition of tubular secretion of creatinine
11
Estimated GFR based on Serum Creatininea
Estimated GFR based on Serum Cystatin Ca
Mea
n (S
E) c
hang
e fr
om b
asel
ine
in e
GFR
(mL/
min
/1.7
3m2 )
"#$
"%
"&
'
&
%
' & % #$ #( $' $& $% )$ )( &' && &%
*+,-./0--123
456575*87./9:)&'3 6;<=>;?./9:))'3
p<0.0001*
"#$
"%
"&
'
&
%
' & % #$ #( $' $& $% )$ )( &' && &%
*+,-./0--123
456575*87./9:))@3 6;<=>;?./9:)$A3
p=0.001*
2 2

!"# !"$
%&"'
%$"'%(
%#
%$
%&
!
&
$
! $( ()
*+,-./0--123
456575*87./9:;<3 6=>?@=A./9:)B3
D/C/F/TAF Control D/C/F/TAF Control
!3% decrease 27.1% 41.2% 12.5% 44.7%!3% increase 12.5% 4.7% 12.5% 2.4%
Mean % Changes in BMD Through 48 Weeks (DEXA Sub-study)
Hip
*p value for difference estimated using ANCOVA, including treatment as a factor and baseline BMD as a covariate
12
Mea
n (S
E) %
cha
nge
from
bas
elin
e in
BM
D
P<0.0001* p<0.0001*
%&"# %!"'
%#"( %$"(%(
%#
%$
%&
!
&
$
! $( ()
*+,-./0--123
456575*87./9:;<3 6=>?@=A./9:)B3
Spine
p<0.0001*p=0.004*

! Through Week 48, D/C/F/TAF resulted in:
" High virologic suppression in treatment-naïve patients (91.4%; FDA Snapshot) that was non-inferior to DRV/C + F/TDF (88.4%)
" No development of DRV, primary PI or TDF/TAF RAMs
! One patient developed M184I/V (D/C/F/TAF arm)
" Few serious AEs, grade 3/4 AEs, or AE-related discontinuations
" No discontinuations due to bone, renal, or CNS AEs
" Bone, renal and lipid safety consistent with known profiles of TAF and cobicistat
D/C/F/TAF combines the efficacy and high genetic barrier to resistance of DRV with the safety advantages of TAF for
treatment-naïve, HIV-1-infected patients
AMBER Week 48 Analysis: Conclusions
13
!"#!
$%&'()*+,%*-./'01+
23456 -'*
)(2,7.+
"!8 9!9 :""
"#$%&%'
'*%0/(;
<=> <!> <?><#@>
()*+,,- <A> #8> #!><9>
./,,0(12 <#> <#> <!>">
!"#$%&'"()*(+,-&)*#)"(.,&/)0(-,1,-#)12"#&-,"(3,",4)"
34"' 560'7&%%!8!9
22*'%@<?B#>2*'%C ?>D%C <BA>
E%FGHIJ6@CKHK@6CLIM4KC@3H63LKN4O3MKCP@MKQH6@G46RKP@3@8:-B@(F@6H@G3CK@M6@S')@GKTQ4F3MK@GKF@+$&U!'&(CLIM4KCV@+/$(*P@)-@<8:AP@)-@<8A=P@-%2)W(P@)-@<=8X<<<

!"#$%&'"()*(+,-&)*#)"(.,&/)0(!1&-,-&,
!"#$%!"#$%&&
&'()*+,-.',/01)23-
45678 /),
+*4.90-
:!%;<!=#$%<< :>#!%;<!?%< !=%
'(
),'21*@
"<%;<$% =#A%;<A% $%$#$%
)*+,+-./0* BCD?$ BC>?> >C:DD"C?D=
E'FGHIJ8<KLHL<8KMIN6LK<5H85MLO6P5NLKQ<NLRH8<G68SLQ<5<$:/#<*F<8H<G5KL<N8<T)+<GLUR6F5NL<GLF<-&(C?)(*KMIN6LKV<-1&*,Q<+/<"$:!Q<+/<"$!BQ</'4+W*Q<+/<"B$X"""
)*+,+-./0*-1 -2,34.5*/-
B B AB

!"# $% !"#$%&'" %&("#$)" !&*"%&*"
!"#$%&'"()*(+,-&)*#)"(.,&/)0(1'2)3,4&2&%,%
+,-./0123,1456.782
9:;<= 4.1
0/93>52
$&'(()*+'
.1,76/?
%%&'"#$%)&@" A"#$%(" %@"B&'"
,'-#+' @&B"#$%!&)" )"#$))&*" %A"A&A"
./++0$&#*(1+(# C&A" C"#$'&(" %C"!&'"
2+'1'3)+ %%&A"#$%)&A" ("#$%(&@" '"(&("
D,EFGHI=$JKGK$=JLHM;KJ$:G=:LKN;O:MKJP$MKQG=$F;=RKP$:$CB4&$/E$=G$F:JK$M=$S.0$FKTQ;E:MK$FKE$2+-U(.-/JLHM;KJV$26+/1P$04$%CB*P$04$%C*!P$4,90W/P$04$%!CX%%%

INSTIINSTI-INSTI-containingcontaining singlesingle-single-tablettablet regimenregimen size
!"#$ %&'()*("+,(-.//!"#$ %&'()*("+,(-.//

Methods
! Phase 1, randomised, open-label, crossover study of D/C/F/TAF (800/150/200/10 mg) – Enrolled 30 healthy adults,
18-55 years of age– A single D/C/F/TAF dose
was administered within 30 minutes after a standard breakfast
! Tablet preparation:– Swallowed whole
(reference)– Split with a tablet cutter
(both halves swallowed)– Crushed using a mortar
and pestle, mixed with applesauce
D, darunavir; C, cobicistat; F, emtricitabine; TAF, tenofovir alafenamide
Brown K, et al. EACS 2017. Number PS8/3
Whole tablet
Session 1
Split tablet
Session 2
Crushed tablet
Session 3
!7 day washout
!7 day washout
Sequence 1
(n = 5)
Sequence 2
(n = 5)
Sequence 3
(n = 5)
Sequence 4
(n = 5)
Sequence 5
(n = 5)
Sequence 6
(n = 5)
Whole tablet
Whole tablet
Whole tablet
Split tablet
Split tablet
Crushed tablet
Split tablet
Crushed tablet
Crushed tablet
Crushed tablet
Whole tablet
Split tablet
Crushed tablet
Split tablet
Whole tablet
Study design: 6-sequence, 3-period, 3-treatment, Williams design, crossover study
18

0
200
400
600
800
1.000
1.200
1.400
0 4 8 12 16 20 24
Results: Plasma Concentration Over Time
Brown K, et al. EACS 2017. Number PS8/3
SD, standard deviation.
0
2.000
4.000
6.000
8.000
10.000
12.000
0 4 8 12 16 20 24Time (h)
Mea
n (S
D)
plas
ma
conc
entr
atio
n, n
g/m
LDarunavir
Time (h)
Mea
n (S
D)
plas
ma
conc
entr
atio
n, n
g/m
L
Cobicistat
0
500
1.000
1.500
2.000
0 4 8 12 16 20 24Time (h)
Mea
n (S
D)
plas
ma
conc
entr
atio
n, n
g/m
L
Emtricitabine
0
25
50
75
100
125
150
175
0 2 4 6 8Time (h)
Mea
n (S
D)
plas
ma
conc
entr
atio
n, n
g/m
L
Tenofovir alafenamide
Whole tablet Split tablet Crushed tablet
8


![Overview of Stata estimation commands · [U] 27 Overview of Stata estimation commands3 27.3 Continuous outcomes 27.3.1 ANOVA and ANCOVA ANOVA and ANCOVA fit general linear models](https://img.pdfslide.us/doc/110x75/5e84977f61452326865f32a4/overview-of-stata-estimation-commands-u-27-overview-of-stata-estimation-commands3.jpg)