Embed Size (px)
Citation preview
Webinar Benchmarks Report2018

Executive Statement
Businesses today can scale their communications easier than ever before. Marketing automation, programmatic advertising, town hall meetings, social networks, and so on, make creating and distributing information as simple as pushing a button. But, blasting out more content in more channels doesn’t mean anyone is listening, or that they care.
So, how do you stop interrupting and start engaging?
At ON24, we believe true engagement goes beyond the superficial click and forms a human connection. That starts with dynamic, data-rich webinars, delivered both live and on demand, through interactive features like polling, chatting, surveying, and more. And, finally, turning those connections into insights that you can act on and share seamlessly across your operations.
To give better insight into how business can use webinars to deepen engagement, we’ve analyzed all webinar data on our platform in 2017 for the annual ON24 Webinar Benchmarks Report.
executive summary
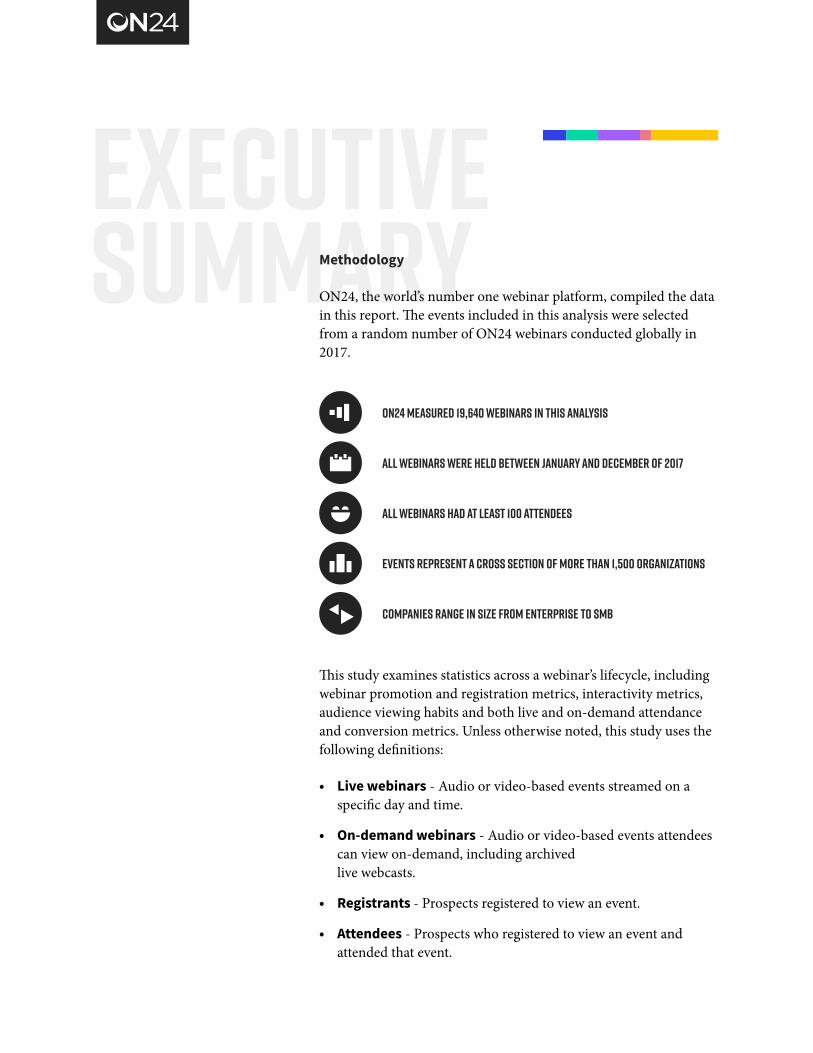
ON24 measured 19,640 webinars in this analysis
All webinars had at least 100 attendees
All webinars were held between January and December of 2017
Events represent a cross section of more than 1,500 organizations
Companies range in size from Enterprise to SMB
This study examines statistics across a webinar’s lifecycle, including webinar promotion and registration metrics, interactivity metrics, audience viewing habits and both live and on-demand attendance and conversion metrics. Unless otherwise noted, this study uses the following definitions:
• Live webinars - Audio or video-based events streamed on a specific day and time.
• On-demand webinars - Audio or video-based events attendees can view on-demand, including archived live webcasts.
• Registrants - Prospects registered to view an event.
• Attendees - Prospects who registered to view an event and attended that event.
executive summaryMethodology
ON24, the world’s number one webinar platform, compiled the data in this report. The events included in this analysis were selected from a random number of ON24 webinars conducted globally in 2017.

pre- webinar benchmarks
Promotional cycle
Webinars are a powerful way to reach hundreds and thousands of prospects, clients, and employees at a personal level. But to get that audience, companies will need to promote their events early, often and right up to the day of a webinar. Promotional efforts should start at least two weeks before a webinar to drive registrants, if not earlier.
In fact, nearly half of all registrants (47 percent) registered for a webinar eight days before an event or earlier. And early registrants account for a lot — our study found nearly a quarter of all registrants (24 percent) enroll in a webinar 15 days before the event took place, a three-point increase over 2016.
Still, the majority of registrants (53 percent) sign up either a week before (30 percent) or the day of the event (23 percent).

pre- webinar benchmarks
Best Days to Send Promotional Emails
As in previous benchmarks, promotional emails perform best during mid-week. The majority of respondents (67 percent), according to our study, register through email on Tuesday, Wednesday and Thursday (21, 23 and 22 percent, respectively).
It’s easy to understand why these days are the most effective —on Monday or Friday, employees are either getting warmed up for the working week or are preparing for the weekend.
Businesses must provide both early and late registrants equal consideration. A lengthy promotional cycle, one which ramps up in intensity as the event date grows nearer, is the best approach. Marketing teams must have the foundations in place to send promotional emails and social media to provide more opportunities for potential registrants to connect and convert into attendees.
Longer promotional campaigns translate to more registrants.
day of 1-7 days before 8-14 days before 15+ days before
The middle of the week — Tuesday, Wednesday and Thursday — are the best days for promotional emails.
WednesdayMonday ThursdayTuesday Friday Saturday/Sunday
23%
21% 23% 22% 12%
30% 23% 24%
5%16%
pre- webinar benchmarks
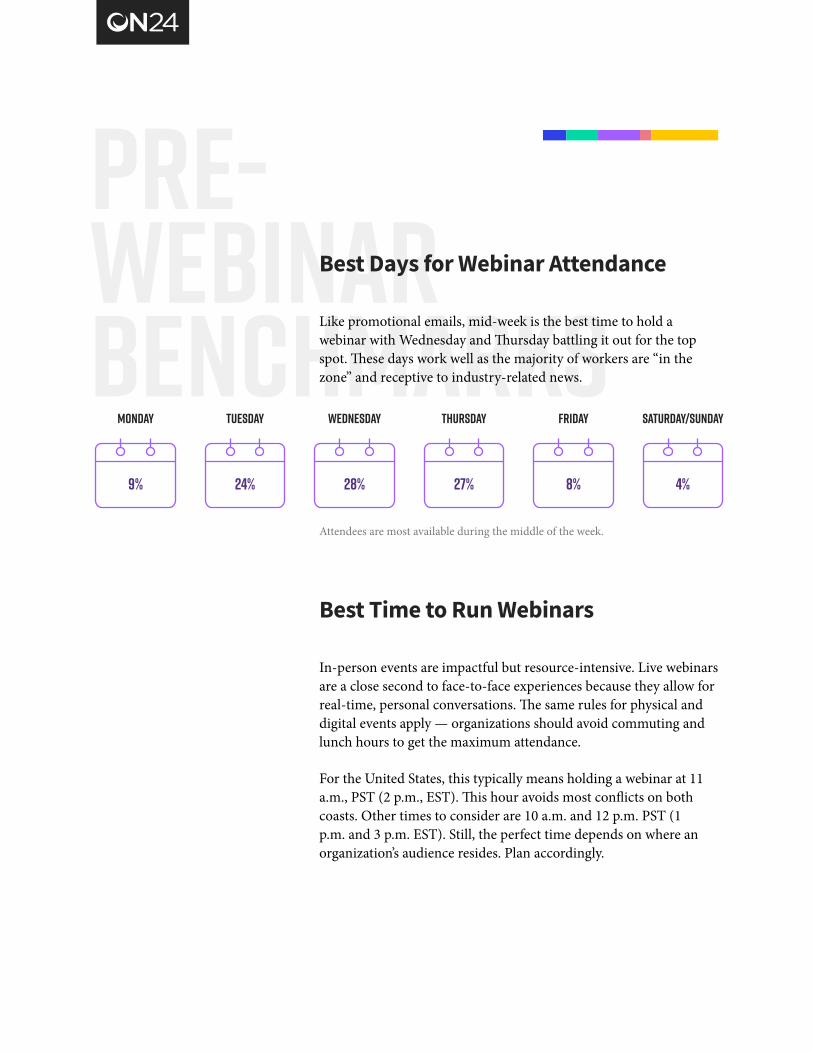
Best Days for Webinar Attendance
Like promotional emails, mid-week is the best time to hold a webinar with Wednesday and Thursday battling it out for the top spot. These days work well as the majority of workers are “in the zone” and receptive to industry-related news.
Attendees are most available during the middle of the week.
WednesdayMonday ThursdayTuesday Friday Saturday/Sunday
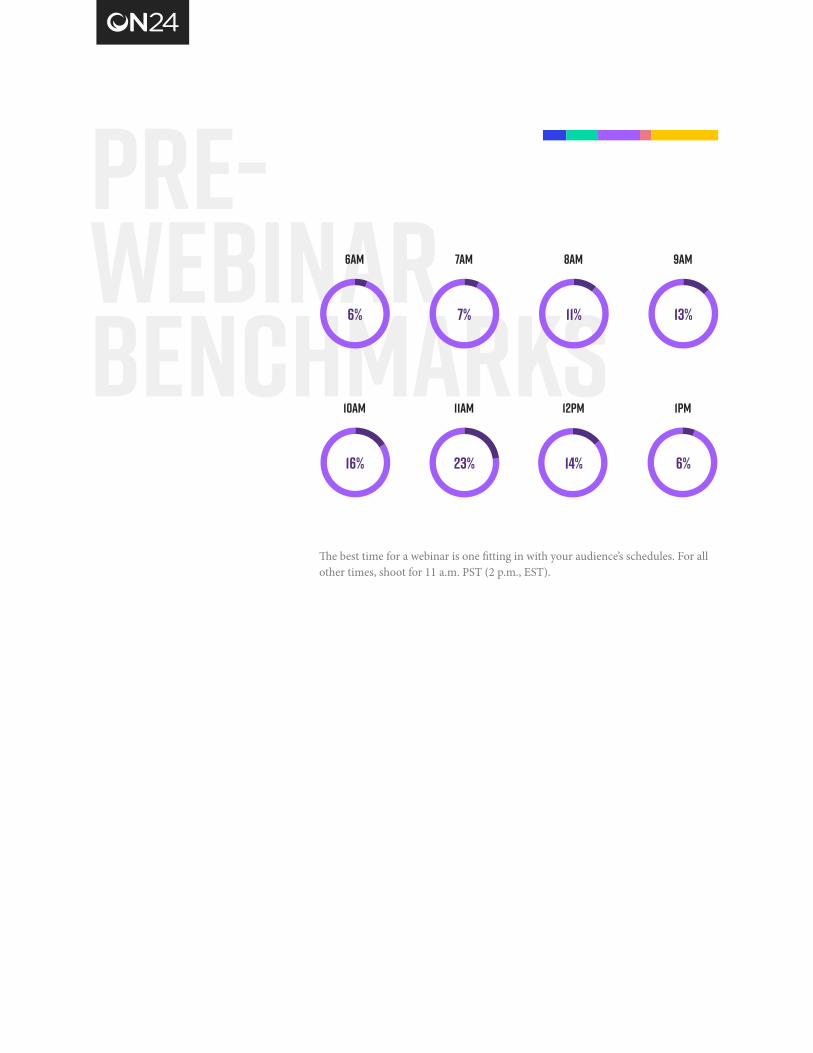
Best Time to Run Webinars
In-person events are impactful but resource-intensive. Live webinars are a close second to face-to-face experiences because they allow for real-time, personal conversations. The same rules for physical and digital events apply — organizations should avoid commuting and lunch hours to get the maximum attendance.
For the United States, this typically means holding a webinar at 11 a.m., PST (2 p.m., EST). This hour avoids most conflicts on both coasts. Other times to consider are 10 a.m. and 12 p.m. PST (1 p.m. and 3 p.m. EST). Still, the perfect time depends on where an organization’s audience resides. Plan accordingly.
24% 28% 27% 8% 4%9%
pre- webinar benchmarks
The best time for a webinar is one fitting in with your audience’s schedules. For all other times, shoot for 11 a.m. PST (2 p.m., EST).
8am6am 9am7am
10am 11am 12pm 1pm
7%
23%
11%
14%
13%
6%
6%
16%
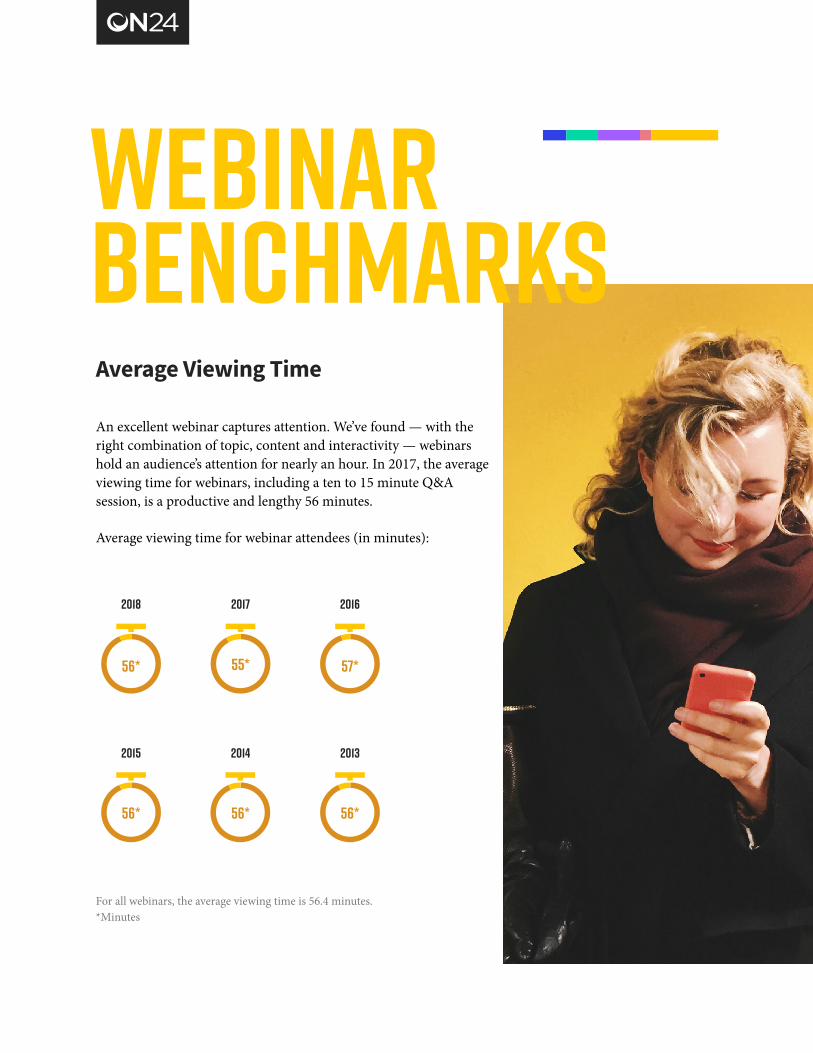
Average Viewing Time
An excellent webinar captures attention. We’ve found — with the right combination of topic, content and interactivity — webinars hold an audience’s attention for nearly an hour. In 2017, the average viewing time for webinars, including a ten to 15 minute Q&A session, is a productive and lengthy 56 minutes.
Average viewing time for webinar attendees (in minutes):
2018
2014
2017
2013
2016
2015
For all webinars, the average viewing time is 56.4 minutes. *Minutes
55*
56*
57*
56*
56*
56*
webinar benchmarks
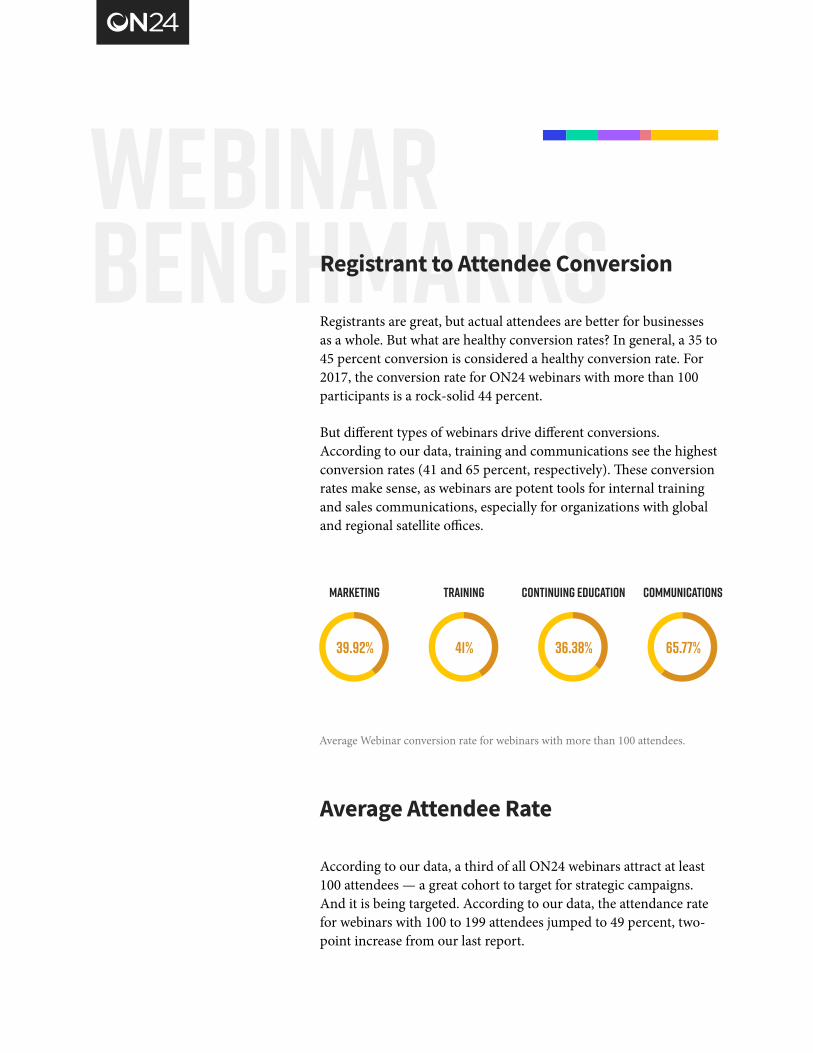
webinar benchmarksRegistrant to Attendee Conversion
Registrants are great, but actual attendees are better for businesses as a whole. But what are healthy conversion rates? In general, a 35 to 45 percent conversion is considered a healthy conversion rate. For 2017, the conversion rate for ON24 webinars with more than 100 participants is a rock-solid 44 percent.
But different types of webinars drive different conversions. According to our data, training and communications see the highest conversion rates (41 and 65 percent, respectively). These conversion rates make sense, as webinars are potent tools for internal training and sales communications, especially for organizations with global and regional satellite offices.
Average Attendee Rate
According to our data, a third of all ON24 webinars attract at least 100 attendees — a great cohort to target for strategic campaigns. And it is being targeted. According to our data, the attendance rate for webinars with 100 to 199 attendees jumped to 49 percent, two-point increase from our last report.
Continuing EducationMarketing CommunicationsTraining
Average Webinar conversion rate for webinars with more than 100 attendees.
41% 36.38% 65.77%39.92%
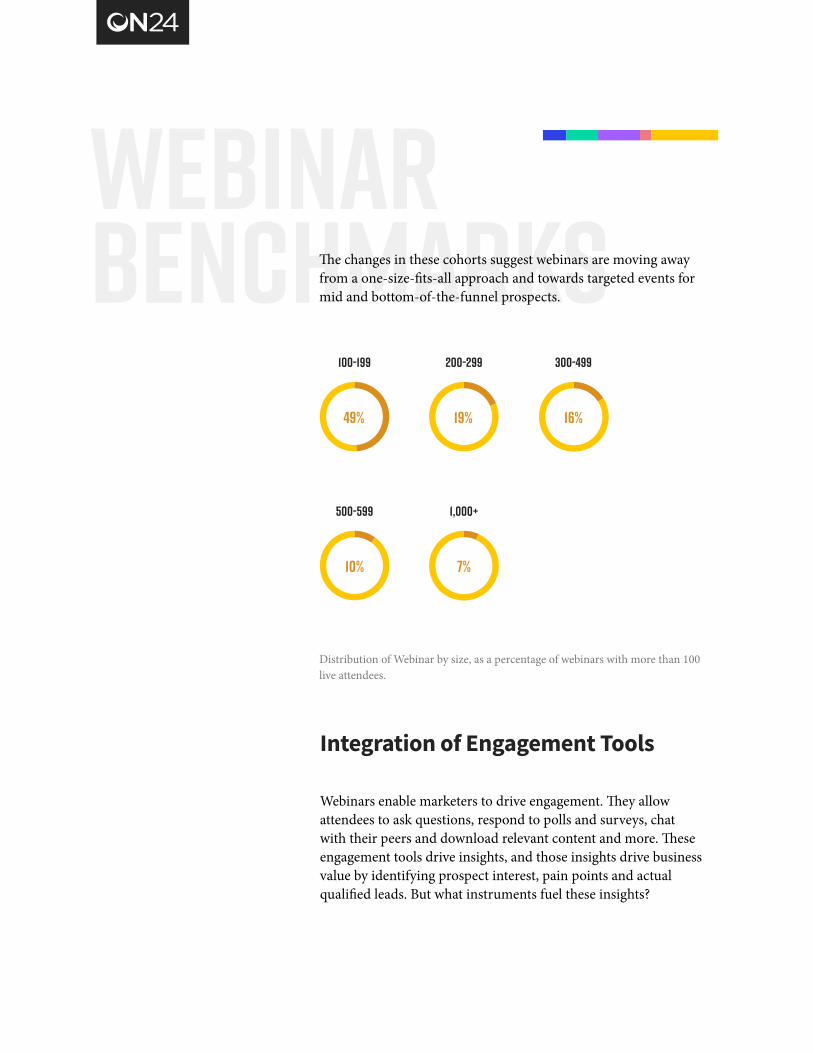
webinar benchmarksThe changes in these cohorts suggest webinars are moving away
from a one-size-fits-all approach and towards targeted events for mid and bottom-of-the-funnel prospects.
Distribution of Webinar by size, as a percentage of webinars with more than 100 live attendees.
300-499100-199
500-599
200-299
1,000+
Integration of Engagement Tools
Webinars enable marketers to drive engagement. They allow attendees to ask questions, respond to polls and surveys, chat with their peers and download relevant content and more. These engagement tools drive insights, and those insights drive business value by identifying prospect interest, pain points and actual qualified leads. But what instruments fuel these insights?
7%10%
16%19%49%
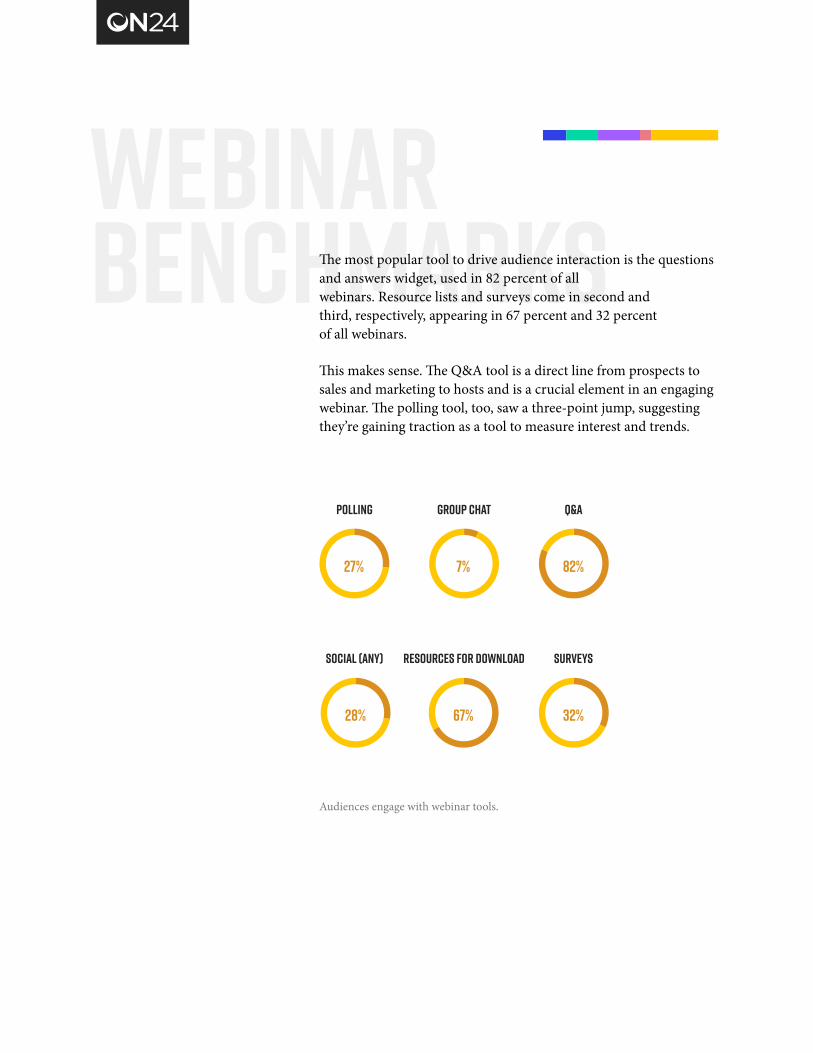
webinar benchmarksThe most popular tool to drive audience interaction is the questions
and answers widget, used in 82 percent of all webinars. Resource lists and surveys come in second and third, respectively, appearing in 67 percent and 32 percent of all webinars.
This makes sense. The Q&A tool is a direct line from prospects to sales and marketing to hosts and is a crucial element in an engaging webinar. The polling tool, too, saw a three-point jump, suggesting they’re gaining traction as a tool to measure interest and trends.
Q&A
Surveys
Polling
Social (any)
Group chat
Resources for Download
Audiences engage with webinar tools.
28% 32%67%
82%7%27%

webinar benchmarksIntegration of Video
A good visual can capture attention for a moment, but a good video can capture attention for hours. And in this year’s report, videos are booming.
Roughly 22 percent of all webinars in 2017 featured some type of video, a 4 percent jump from 2016. This suggests practitioners are becoming more comfortable with video technologies. It also suggests they’re becoming more comfortable with appearing in front of, potentially, thousands of attendees. For ON24 webinars, videos include:
• Studio produced
• Webcam presentations
• Integrated video clips
• Streaming and screen sharing
We expect this number to continue climbing as new streaming technologies make their way into the market, as audiences come to expect a live video experience and as webinar hosts grow more comfortable with video, in general.
On-demand Viewing
Webinars aren’t one-off events. They can engage over an extended period thanks to on-demand viewing. These on-demand webinars provide additional opportunities to extend content life, engage attendees and convert a prospect into a client. In fact, on-demand viewing is an increasingly popular choice among attendees, with 35 percent of all webinar views coming from on-demand only audiences.
There are a few reasons why this may be the case. First, attendees may prefer on-demand for its convenience factor, especially for those whose prior priorities and commitments prevent them
Post- Webinar Benchmarks
post-webinar benchmarks
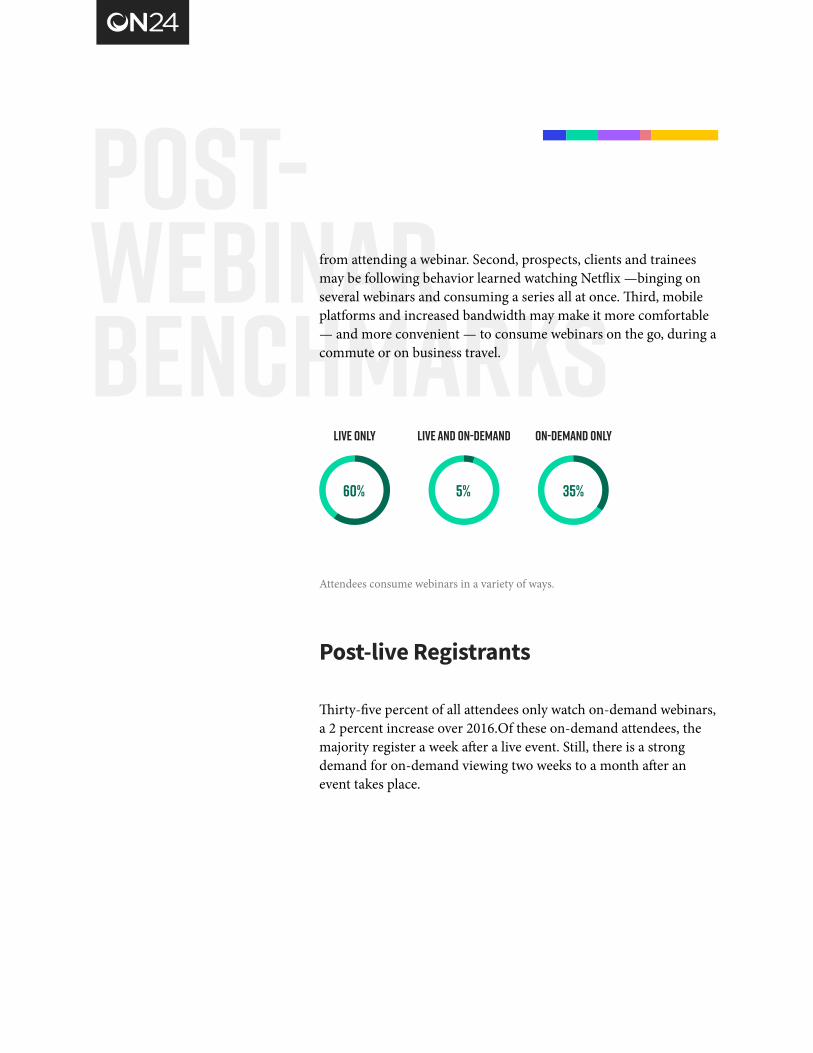
from attending a webinar. Second, prospects, clients and trainees may be following behavior learned watching Netflix —binging on several webinars and consuming a series all at once. Third, mobile platforms and increased bandwidth may make it more comfortable — and more convenient — to consume webinars on the go, during a commute or on business travel.
On-demand onlyLive only Live and On-demand
Attendees consume webinars in a variety of ways.
Post-live Registrants
Thirty-five percent of all attendees only watch on-demand webinars, a 2 percent increase over 2016.Of these on-demand attendees, the majority register a week after a live event. Still, there is a strong demand for on-demand viewing two weeks to a month after an event takes place.
35%5%60%

post-webinar benchmarks
600000
400000
200000
0
wk1 wk2 wk3 wk4 wk5 wk6 wk7 wk8 wk9 wk10
On-demand Viewing Time
On-demand viewing times continue to grow year-over-year. This year, the average viewing time has increased from 42 minutes to 44 minutes, reflecting the popularity of on-demand content.
20162018 20152017
Average Webinar conversion rate for webinars with more than 100 attendees. *Minutes
42* 34* 29*44*
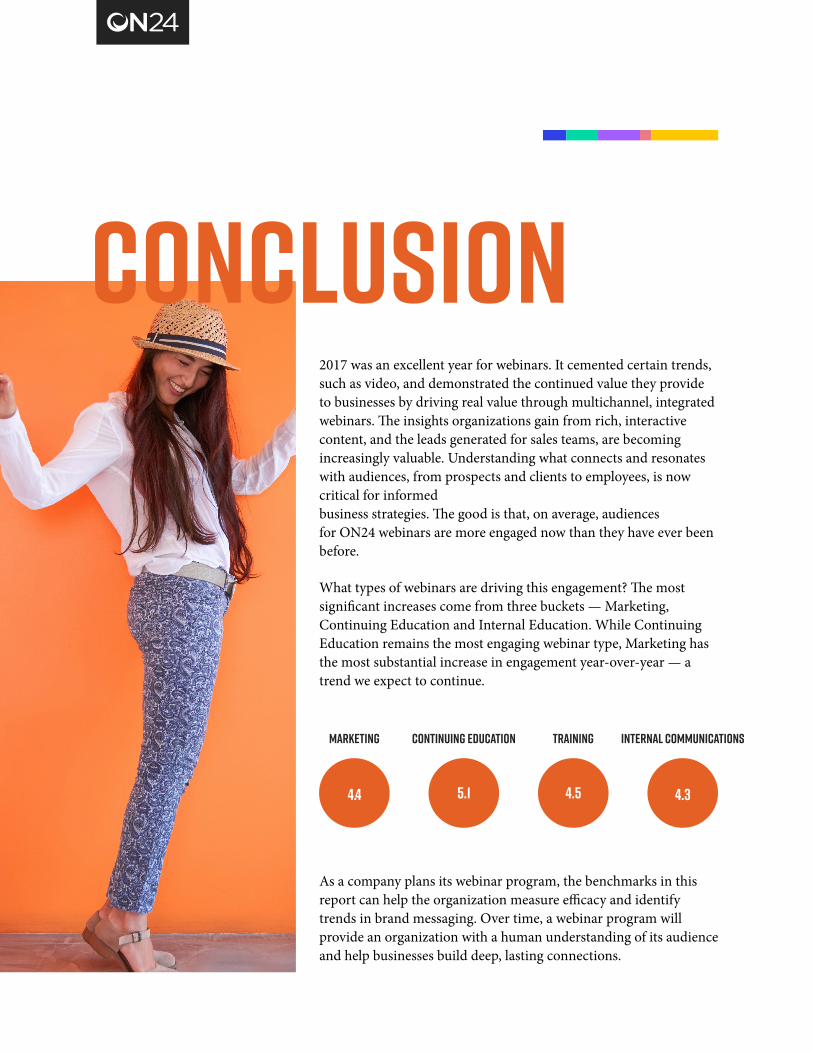
2017 was an excellent year for webinars. It cemented certain trends, such as video, and demonstrated the continued value they provide to businesses by driving real value through multichannel, integrated webinars. The insights organizations gain from rich, interactive content, and the leads generated for sales teams, are becoming increasingly valuable. Understanding what connects and resonates with audiences, from prospects and clients to employees, is now critical for informed business strategies. The good is that, on average, audiences for ON24 webinars are more engaged now than they have ever been before.
What types of webinars are driving this engagement? The most significant increases come from three buckets — Marketing, Continuing Education and Internal Education. While Continuing Education remains the most engaging webinar type, Marketing has the most substantial increase in engagement year-over-year — a trend we expect to continue.
As a company plans its webinar program, the benchmarks in this report can help the organization measure efficacy and identify trends in brand messaging. Over time, a webinar program will provide an organization with a human understanding of its audience and help businesses build deep, lasting connections.
Marketing Continuing Education Training Internal Communications
4.5 4.34.4 5.1
Conclusion


![Benchmarks - May, 2011 | Benchmarks Onlineit.unt.edu/sites/default/files/benchmarks-05-2011.pdf · Benchmarks - May, 2011 | Benchmarks Online 4/28/16, 9:13:42 AM] By Patrick McLoud,](https://img.pdfslide.us/doc/110x75/5fe545814aa19825752e7bae/benchmarks-may-2011-benchmarks-benchmarks-may-2011-benchmarks-online-42816.jpg)
![Benchmarks - June, 2013 | Benchmarks Onlineit.unt.edu/sites/default/files/benchmarks-06-2013.pdf · Benchmarks - June, 2013 | Benchmarks Online 4/26/16, 8:52:25 AM] Skip to content](https://img.pdfslide.us/doc/110x75/5f9d6dd4a6e586755376b37d/benchmarks-june-2013-benchmarks-benchmarks-june-2013-benchmarks-online.jpg)