Embed Size (px)
Citation preview
Introduction and Background Information
The energy needed to power transportation infrastructure is expected to increase 50% in
the next 25 years, while the amount of fuel we use for transportation is expected to increase two-
fold in that same amount of time (http://www.eia.doe.gov/oiaf). Not only are current energy
resources becoming more expensive to acquire, but they are also a main contributor to
greenhouse gases. New, efficient forms of transportation need to be developed to decrease
dependence on non-renewable resources and their negative environmental impacts. The ASME
Human Powered Vehicle Competition (HPVC) encourages students to design vehicles that use
human power as their means of propulsion and overcome the comfort, aerodynamic, and cargo
hauling deficiencies of more traditional bicycles. The competition requires that students
conceptualize, design, and build human powered vehicles using engineering principles and
standard design processes. The design processes and subsequent analysis of developed systems
are the focus of this report.
Mission Statement
It is the 2010 PSU HPV team mission to design a competitive, innovative, and intuitive
human-powered vehicle. This recumbent tricycle with detachable aerodynamic faring will be
capable of winning the 2010 HPVC West and gaining the attention of the local bicycling
community.
Final PDS Summary
Product design specifications (PDS) for the vehicle were established to help focus the
design. In our team’s case a majority of the PDS consisted of established requirements for the
ASME competition. The completed vehicle will compete in four separate races at the ASME
event: a drag race of approximately 600-800 meters, a 2.5 hour grand prix style speed endurance
race, a 2.5 hour utility endurance race to showcase the utilitarian features of the vehicles, and a
static judging event. Forty percent of the overall vehicle score is weighted on the static judging
based on written and oral design reports that provide a description of the design, analysis, testing,
safety, and practicality of the design.
1
Designs for the 2009/2010 human powered vehicle team are organized into five main
categories consisting of steering, frame, drive-train, the fairing, and safety systems. The
requirements for success at the competition were developed from a number of external and
internal customers. The external customers identified in the PDS are the ASME judges and
everyday commuters. The internal customer was PSU’s ASME HPV team, which is responsible
for funding the project as well as racing the vehicle in the competition. Interviews of previous
team members, as well as HPV enthusiasts, were conducted to highlight design problems with
previous prototypes and determine the necessary fixes. Three overarching themes of these
interviews were the importance of a stable steering system, a simplified straight line drive-train,
and a stiff frame. These three goals became the focus of our improvements to previous team’s
designs.
Performance criteria and constraints serve as goals and a means to quantify the results of
design decisions. Some of the highlights of the performance criteria are:
a top speed of 51.3 ft/s
a total weight of less than 40 pounds
less than 0.5 in frame deflection under normal riding conditions
Safety requirements of the vehicle were outlined by the competition judges in the ASME official
rules for the competition (ASME.org). Some of the highlights of this year’s rules state vehicles
must:
have a minimum turning radius of no more than 25 feet
be capable of stopping from 15 mph in 20 feet
have a rollover protection system (RPS) capable of taking a load of 600 lbs from the
top and 300 lbs from the side with no plastic deformation
utilize a safety harness
To verify that the design requirements are met, analysis and physical testing of the
prototype were completed. The results of these experiments and analysis are summarized in the
Final Designs and Evaluations section.
2
Top Level Design Alternatives
Because of the independence and complexity of the different systems in the vehicle, each
sub-component received their own decision matrices.
Frame Concept Selection
Initially, the team chose between a 2-wheeled or 3-wheeled recumbent. While 2-wheeled
designs allow for a greater speed potential, their low-speed instability coupled with their
unforgiving learning curve are not desirable traits of a utility vehicle. Although a trike has a
larger frontal area and greater weight, it has stability that is sought in a utility vehicle. After
reviewing the extremely curvy HPVC race course, it was determined that a trike would be the
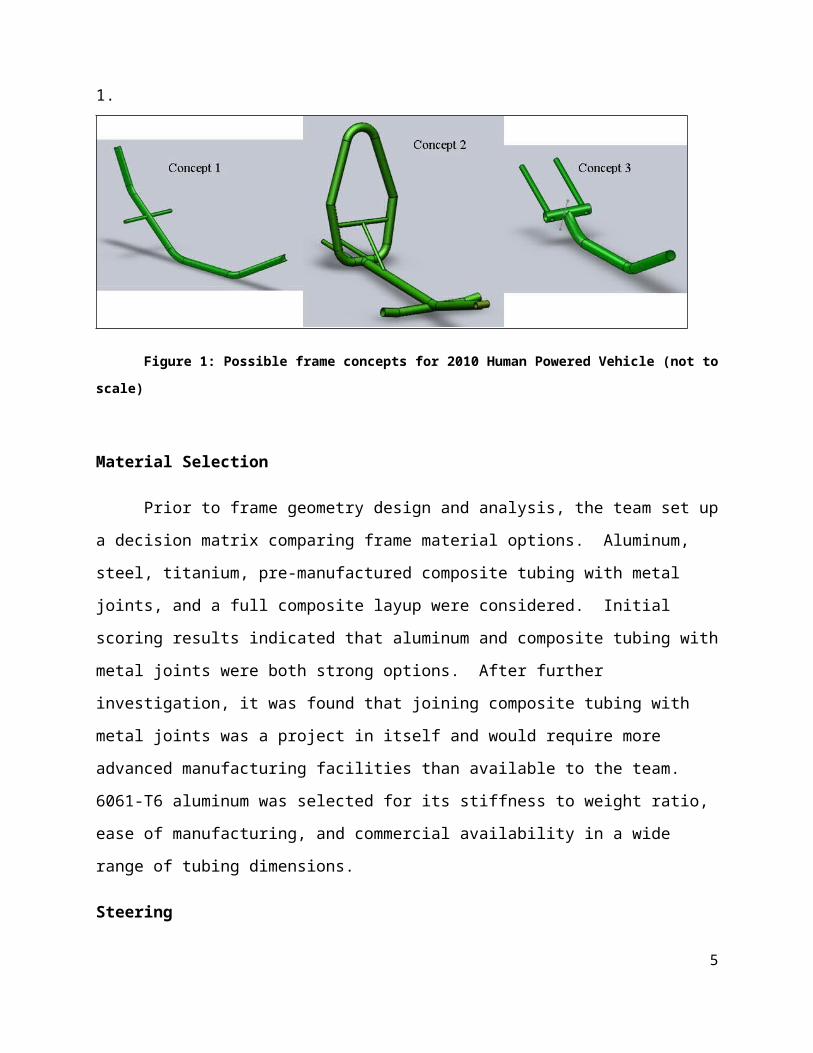
best suited vehicle. Figure 1 shows the three initial frame concepts. To keep manufacturing costs
down, it was decided that efforts would be made to minimize the number of welds and frame
components requiring machining. This manufacturing consideration led to the selection of
concept 1.
Figure 1: Possible frame concepts for 2010 Human Powered Vehicle (not to scale)
Material Selection
Prior to frame geometry design and analysis, the team set up a decision matrix comparing
frame material options. Aluminum, steel, titanium, pre-manufactured composite tubing with
metal joints, and a full composite layup were considered. Initial scoring results indicated that
aluminum and composite tubing with metal joints were both strong options. After further
investigation, it was found that joining composite tubing with metal joints was a project in itself 3
and would require more advanced manufacturing facilities than available to the team. 6061-T6
aluminum was selected for its stiffness to weight ratio, ease of manufacturing, and commercial
availability in a wide range of tubing dimensions.
Steering
Top level steering considerations consisted of direct steer at head tube, pivoting linkage
at center tube, dynamic camber, and leaning designs. The steering decision matrix in Appendix
A shows that the two top rated ideas were the dynamic camber and direct steer at the head tube.
The criteria that influenced these scores heavily were adjustability, Ackerman adaptability, and
safety. The two systems listed above were similar in scoring and the decision was made based
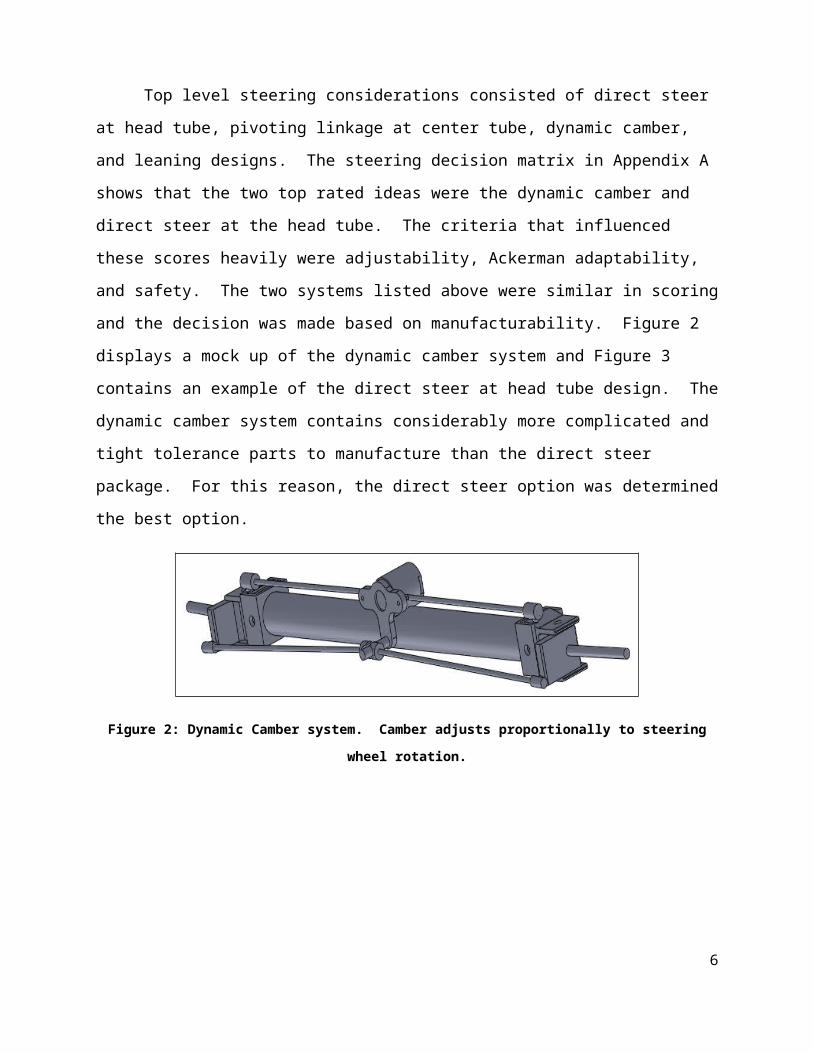
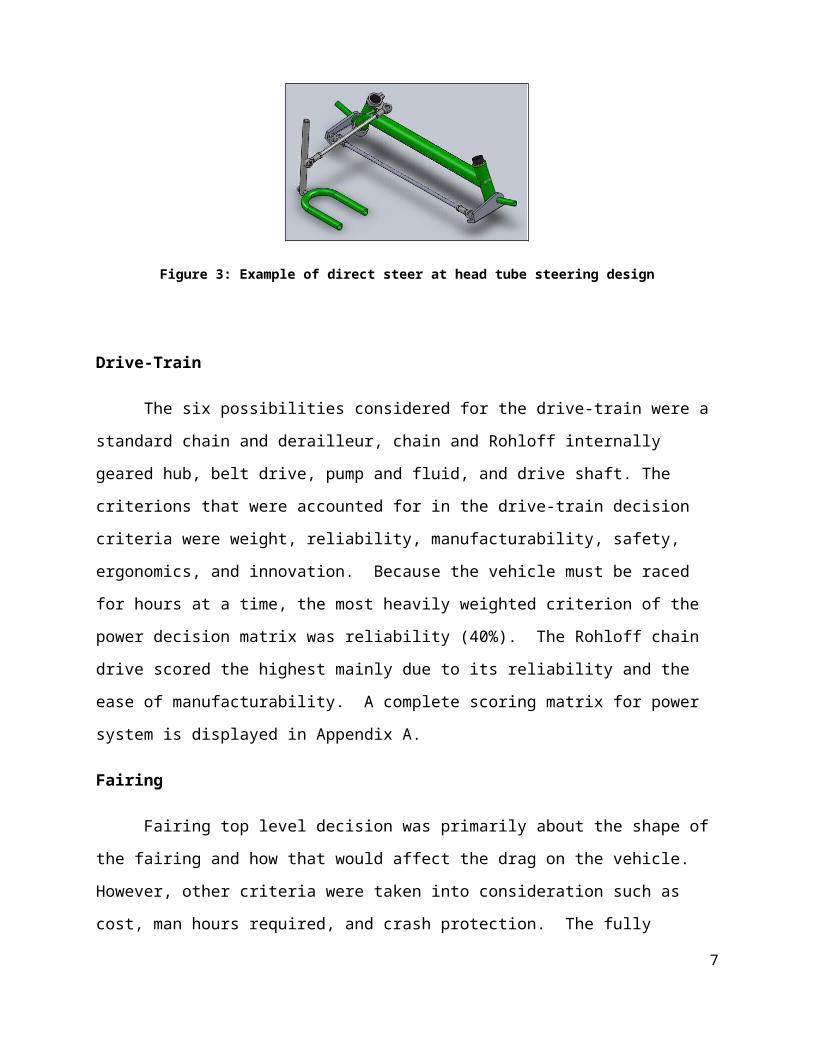
on manufacturability. Figure 2 displays a mock up of the dynamic camber system and Figure 3
contains an example of the direct steer at head tube design. The dynamic camber system
contains considerably more complicated and tight tolerance parts to manufacture than the direct
steer package. For this reason, the direct steer option was determined the best option.
Figure 2: Dynamic Camber system. Camber adjusts proportionally to steering wheel rotation.
Figure 3: Example of direct steer at head tube steering design
4
Drive-Train
The six possibilities considered for the drive-train were a standard chain and derailleur,
chain and Rohloff internally geared hub, belt drive, pump and fluid, and drive shaft. The
criterions that were accounted for in the drive-train decision criteria were weight, reliability,
manufacturability, safety, ergonomics, and innovation. Because the vehicle must be raced for
hours at a time, the most heavily weighted criterion of the power decision matrix was reliability
(40%). The Rohloff chain drive scored the highest mainly due to its reliability and the ease of
manufacturability. A complete scoring matrix for power system is displayed in Appendix A.
Fairing
Fairing top level decision was primarily about the shape of the fairing and how that
would affect the drag on the vehicle. However, other criteria were taken into consideration such
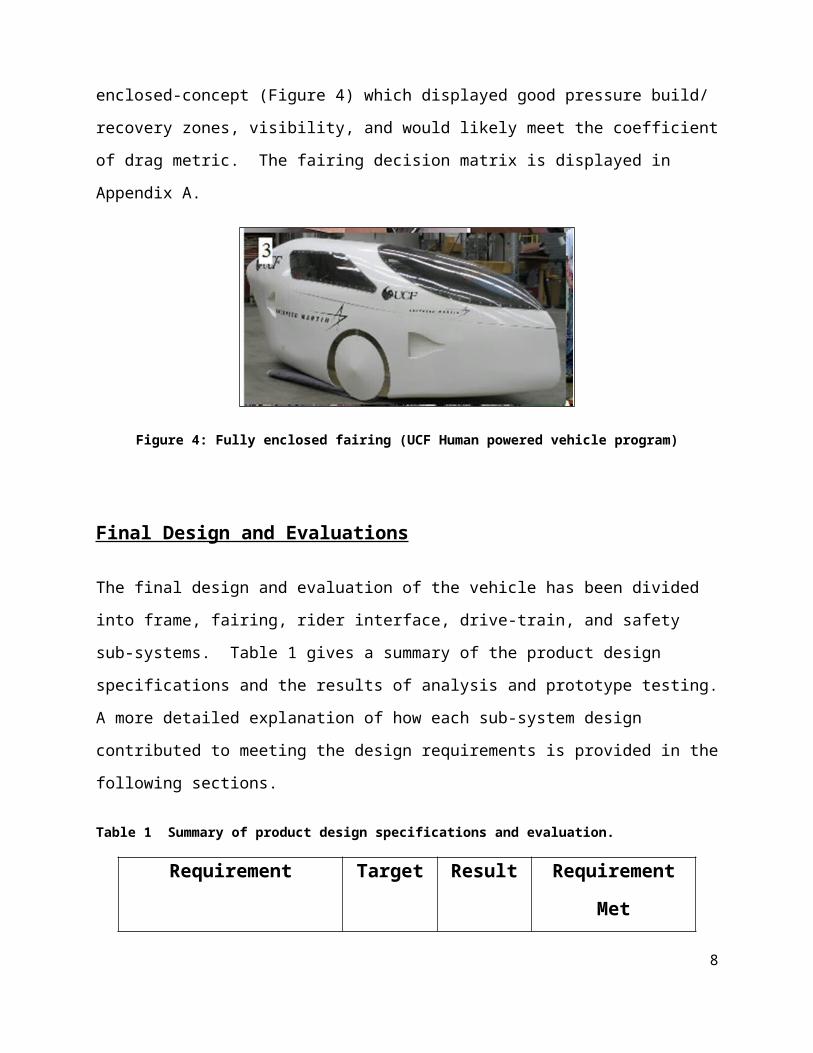
as cost, man hours required, and crash protection. The fully enclosed-concept (Figure 4) which
displayed good pressure build/ recovery zones, visibility, and would likely meet the coefficient
of drag metric. The fairing decision matrix is displayed in Appendix A.
Figure 4: Fully enclosed fairing (UCF Human powered vehicle program)
Final Design and Evaluations
The final design and evaluation of the vehicle has been divided into frame, fairing, rider
interface, drive-train, and safety sub-systems. Table 1 gives a summary of the product design
specifications and the results of analysis and prototype testing. A more detailed explanation of
5
how each sub-system design contributed to meeting the design requirements is provided in the
following sections.
Table 1 Summary of product design specifications and evaluation.
Requirement Target Result Requirement MetTop Speed >51.3 ft/s 44 ft/s No
Drag Race Time <60 s 40 s Yes
Weight (Total) <40 lbs 42 lbs No
Turning Radius <25 ft 15 ft Yes
Steering Accuracy 0 deg/100 ft 0 deg/100 ft Yes
Frame Deflection <0.5 in .47 Yes
Braking(From 15 MPH) <20 ft 6 ft Yes
Roll Bar Top Load Strength FoS ≥2 5.1 Yes
Roll Bar Side Load Strength FoS ≥1 47 Yes
Frame Strength FoS>1.5 3.0 Yes
Roll Bar Top Load Deformation <2 in .47 Yes
Roll Bar Side Load Deformation <1.5 in 0 in Yes
Vertical Visibility >60 deg 180 deg Yes
Horizontal Visibility >180 deg 360 deg Yes
Budget Limitations < $3113 $2973 Yes
Restraint System Yes Yes Yes
Free From Sharp Edges Yes Yes Yes
Frame
Overview
Frame design priorities included minimizing the rider’s frontal profile while maintaining
favorable biomechanical geometry, minimizing vehicle weight, and maximizing. The team
reviewed past PSU entries and found that the rider posture of the Vike-bike coupled with the
frame layout of the Vike-Trike I would form a solid foundation to begin designing from. Using
the Vike-Trike I and II as benchmarks, target design weight and general wheel dimensions were
6
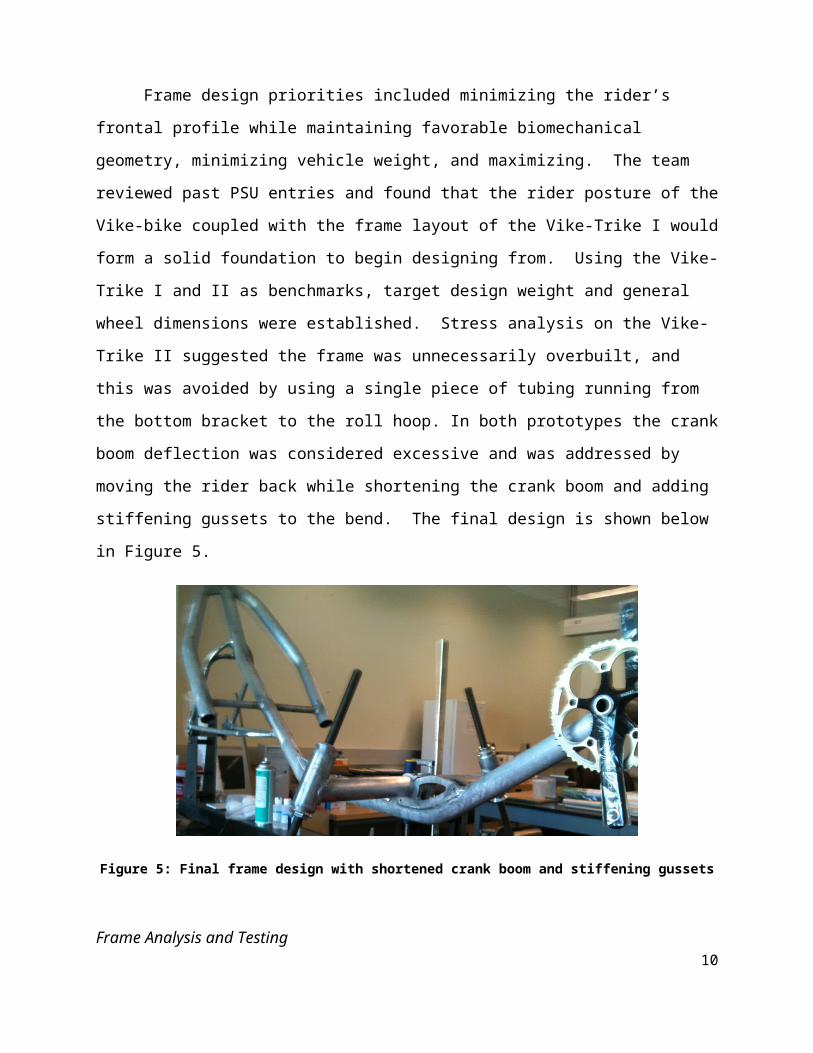
established. Stress analysis on the Vike-Trike II suggested the frame was unnecessarily
overbuilt, and this was avoided by using a single piece of tubing running from the bottom
bracket to the roll hoop. In both prototypes the crank boom deflection was considered excessive
and was addressed by moving the rider back while shortening the crank boom and adding
stiffening gussets to the bend. The final design is shown below in Figure 5.
Figure 5: Final frame design with shortened crank boom and stiffening gussets
Frame Analysis and Testing
Frame designs were initially modeled in SolidWorks and imported into an FEA program
(Abaqus) for stress and deflection analysis. This allowed the team to determine the optimum
tubing dimensions for various frame members to maximize the stiffness to weight ratio. To meet
our design requirements for frame deflection (< 0.5”) it was necessary to use heavier tubes, yet
this resulted in exceeding the weight requirement by two pounds. The other PDS metrics and
ASME HPVC standards for safety and deflection were met in all members of the frame. Detailed
analysis of the frame can be found in Appendix B.1.
To validate the FEA results, strain gages were applied to high stress locations of the
prototype and design stresses and safety factors verified. Loads were applied with a hydraulic
press while frame constraints were realized with the steel jig. Strain gage outputs were recorded
with a multi-channel gage reader before being converted to stress and strain data in a
spreadsheet. The strain gage testing results were consistent with the FEA findings.
7
Fairing
Overview
Entering the team’s HPV into the utility class this year meant a change in fairing needs
from prior years. This included easy entry/exit, access to cargo areas, and improved visibility. In
addition, the sprint event traditionally seen in HPV related events was replaced by a “drag”
event. The inclusion of four 90º turns, and no long straight-a-ways, shifted the design focus from
top speed to designing for cornering. While a full fairing offers the greatest reduction in
aerodynamic drag, its benefits drop significantly at speeds below 20 mph. Heat buildup within a
full fairing, limited visibility, ease of entry/exit, and greater weight were reasons why the team
decided to omit portions on the sides of the fairing.
Fairing Evaluation
When the time came to test run the fairing with the completed trike, other problems
became evident. Visibility was not ideal. While the rider could see clearly to the sides, they
could not see the road less than 5 feet in front of the vehicle. Also, the fairing connections were
not sufficiently stiff and large resonant vibrations began at speeds of 15 mph. This caused the
fairing to vibrate aggressively at the frame attachment points at high speeds and on bumpy roads.
After riding the actual race course with the fairing, it was found that the speed reached was not
high enough to justify a full fairing. HPVC rules require all vehicles to utilize some
aerodynamic improvement device, so a smaller, commercially-available front windscreen,
similar to the bubble shown in Figure 6, was used in its place. The advantages of this solution
included greater visibility, less weight, no heat build-up, and easier access for the rider.
8
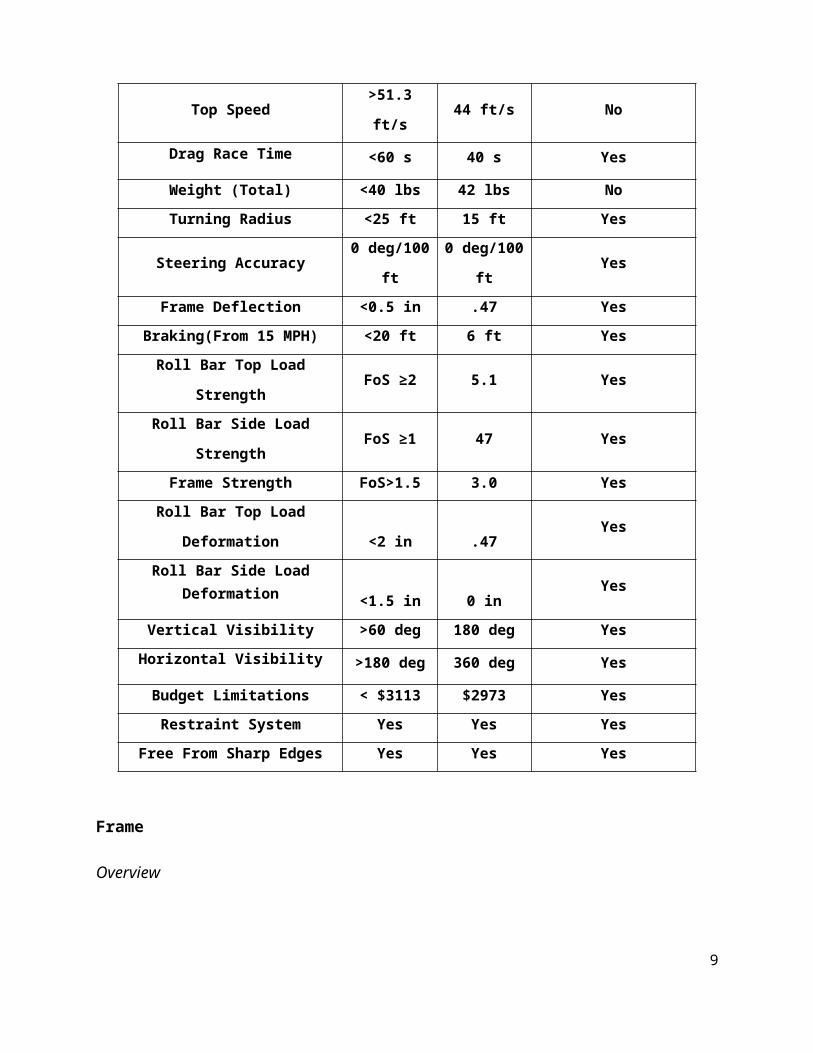
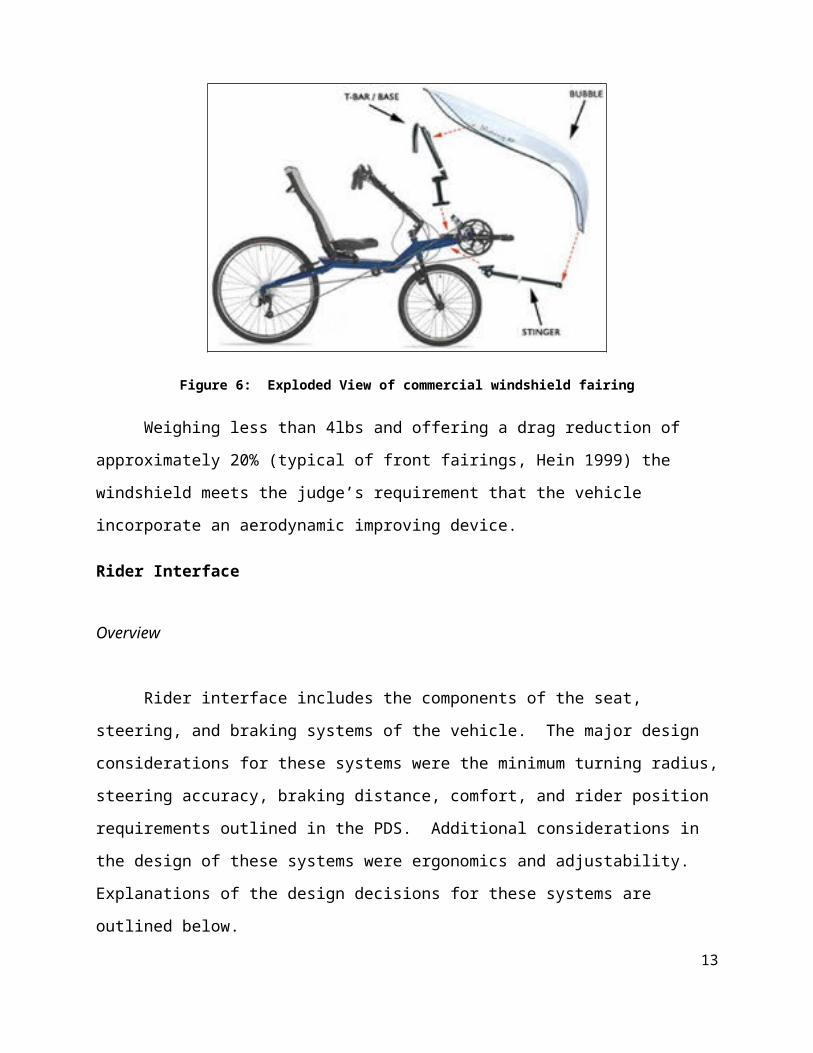
Figure 6: Exploded View of commercial windshield fairing
Weighing less than 4lbs and offering a drag reduction of approximately 20% (typical of
front fairings, Hein 1999) the windshield meets the judge’s requirement that the vehicle
incorporate an aerodynamic improving device.
Rider Interface
Overview
Rider interface includes the components of the seat, steering, and braking systems of the
vehicle. The major design considerations for these systems were the minimum turning radius,
steering accuracy, braking distance, comfort, and rider position requirements outlined in the
PDS. Additional considerations in the design of these systems were ergonomics and
adjustability. Explanations of the design decisions for these systems are outlined below.
Seat and Seat Adjustability
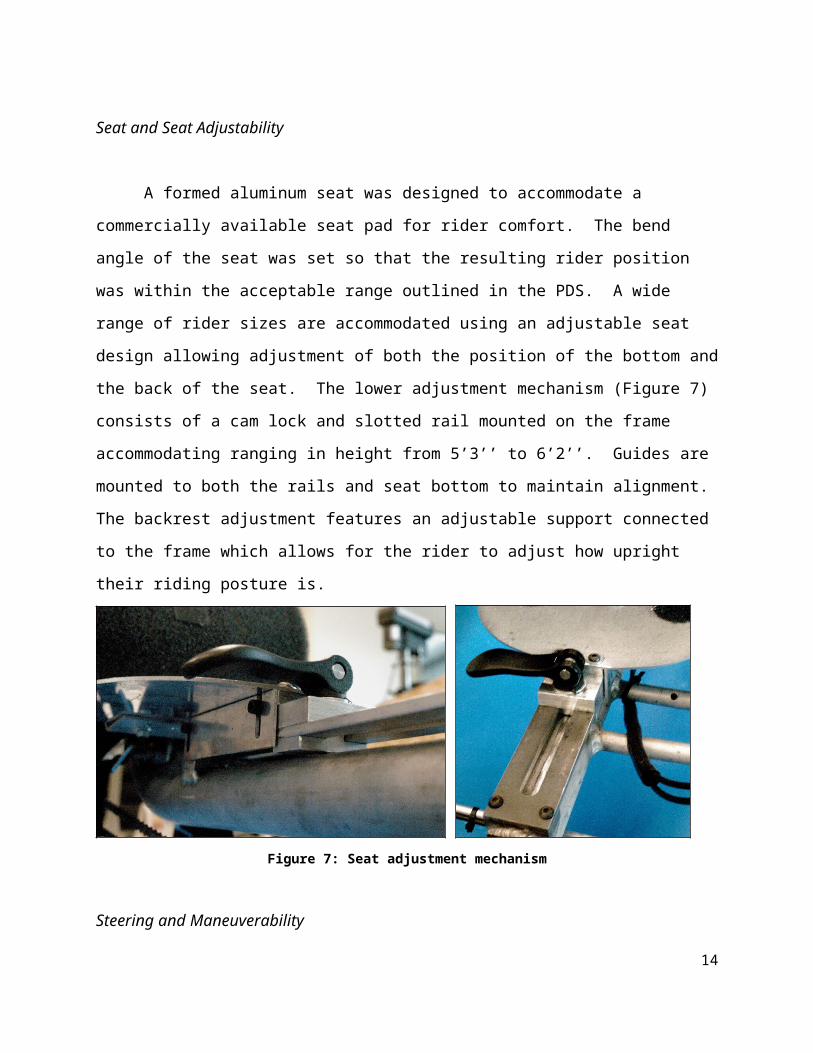
A formed aluminum seat was designed to accommodate a commercially available seat
pad for rider comfort. The bend angle of the seat was set so that the resulting rider position was
within the acceptable range outlined in the PDS. A wide range of rider sizes are accommodated
using an adjustable seat design allowing adjustment of both the position of the bottom and the
9
back of the seat. The lower adjustment mechanism (Figure 7) consists of a cam lock and slotted
rail mounted on the frame accommodating ranging in height from 5’3’’ to 6’2’’. Guides are
mounted to both the rails and seat bottom to maintain alignment. The backrest adjustment
features an adjustable support connected to the frame which allows for the rider to adjust how
upright their riding posture is.
Figure 7: Seat adjustment mechanism
Steering and Maneuverability
Steering angles were determined by examining the advantages and disadvantages of
different ranges of camber, caster, and toe angles on the straight-line stability and cornering
ability of the vehicle. The camber angle was set at 15 degrees to achieve cornering stability at
high speeds. A camber angle this high had the disadvantage of increased rolling resistance, but
this trade-off was determined acceptable. A clamp for the front crossbeam was designed to
allow adjustment of the caster angle. After extensive vehicle testing, a caster angle of negative
5 degrees was determined to be suitable for most riding conditions. Toe angle on the vehicle was
set using an adjustable tie rod between the control arms. An Ackermann steering linkage was
designed for the vehicle such that all three wheels turn about the same center of curvature, so
little cornering performance would have been gained by deviating from a toe angle of zero. The
adjustable tie-rod was used to maintain zero toe angle as the caster angle was adjusted.
Centerpoint steering was also incorporated in the steering design to minimize the effects of
braking and road noise on the steering system. Analysis used in the design of the Ackermann
linkage, caster clamp, and Centerpoint steering, are provided in Appendix B.5.
10
Braking
Avid Elixir R hydraulic disc brakes were mounted to the two front wheels. This model
was selected for their high stopping power, reliability, cost, adjustability, and cable routing
flexibility. The major design requirement and safety consideration was that the vehicle be
capable of stopping from a speed of 15 miles per hour in a distance less than 20 feet. This
requirement was met with the Elixir R brake configuration, with a stopping distance from 20
mph of six feet (determined in the safety check at the HPVC).
Vehicle Controls
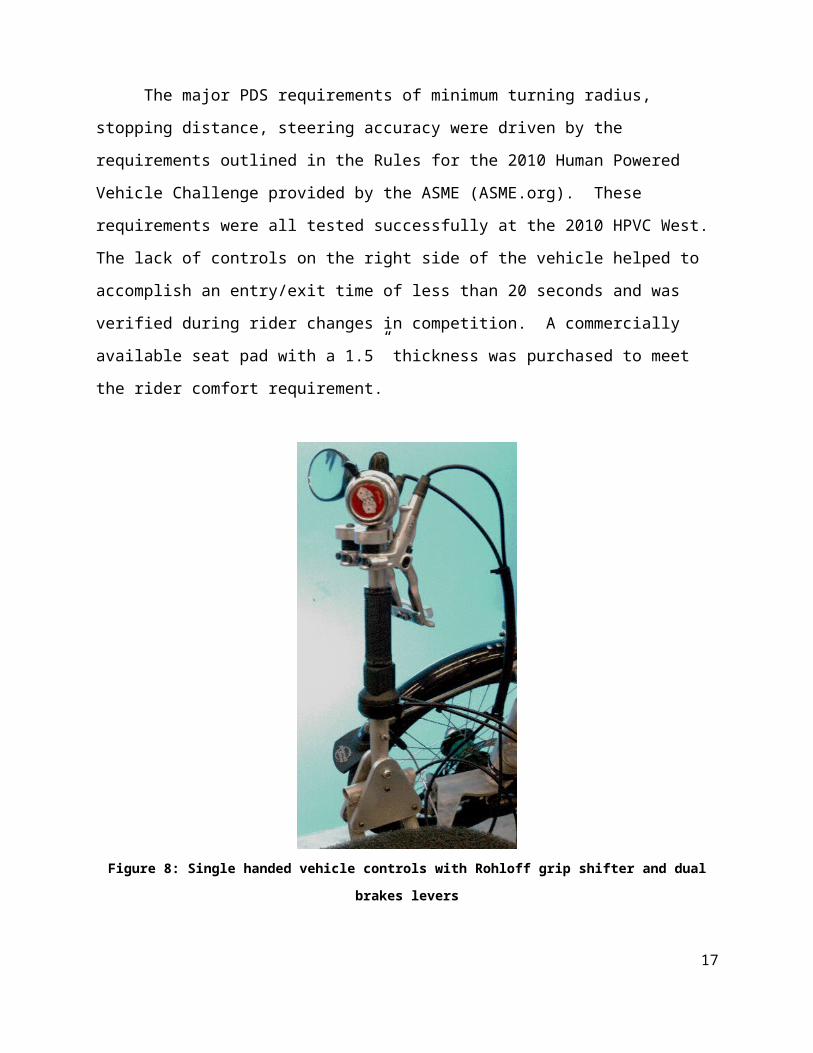
A single joystick style steering control, as shown below in Figure 8, was used due to its
light weight, ease of single handed operation, and simplicity. The joystick pivots front and back
relative to the rider so that the controls are not restricted by the rider’s body. The joystick is also
mounted on a cantilevered support from the vehicle’s frame to allow for ease of entry and exit on
the non-controls side of the vehicle. Brake levers are located side by side on a custom fabricated
mount so that both brakes can be applied at the same time. A Rohloff grip shifter was also
mounted to the joystick to allow efficient single handed operation of both the drive train and the
brakes.
Rider Interface Evaluation
The major PDS requirements of minimum turning radius, stopping distance, steering
accuracy were driven by the requirements outlined in the Rules for the 2010 Human Powered
Vehicle Challenge provided by the ASME (ASME.org). These requirements were all tested
successfully at the 2010 HPVC West. The lack of controls on the right side of the vehicle
helped to accomplish an entry/exit time of less than 20 seconds and was verified during rider
changes in competition. A commercially available seat pad with a 1.5” thickness was purchased
to meet the rider comfort requirement.
11
Figure 8: Single handed vehicle controls with Rohloff grip shifter and dual brakes levers
Drive-Train
Overview
Efficiency and reliability were the biggest considerations in building the drive-train. The
Rohloff hub allowed the team to meet these requirements by reducing the need for significant
maintenance, shifter adjustments, and chain tensioners. The Rohloff also adds practicality to the
drive-train by allowing the rider to shift gears while not pedaling, which allows for downshifting
while stopped at a red light or stop sign.
Evaluation
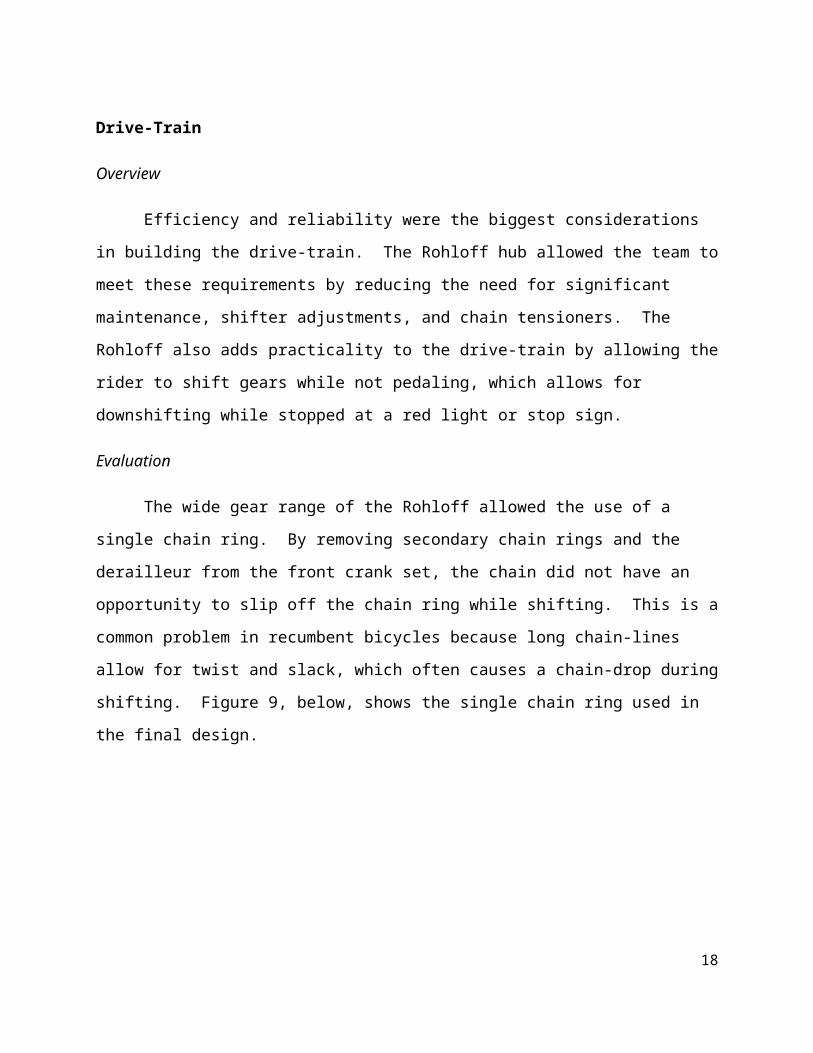
The wide gear range of the Rohloff allowed the use of a single chain ring. By removing
secondary chain rings and the derailleur from the front crank set, the chain did not have an
opportunity to slip off the chain ring while shifting. This is a common problem in recumbent
12
bicycles because long chain-lines allow for twist and slack, which often causes a chain-drop
during shifting. Figure 9, below, shows the single chain ring used in the final design.
Figure 9: Simplified chain line for chain retention
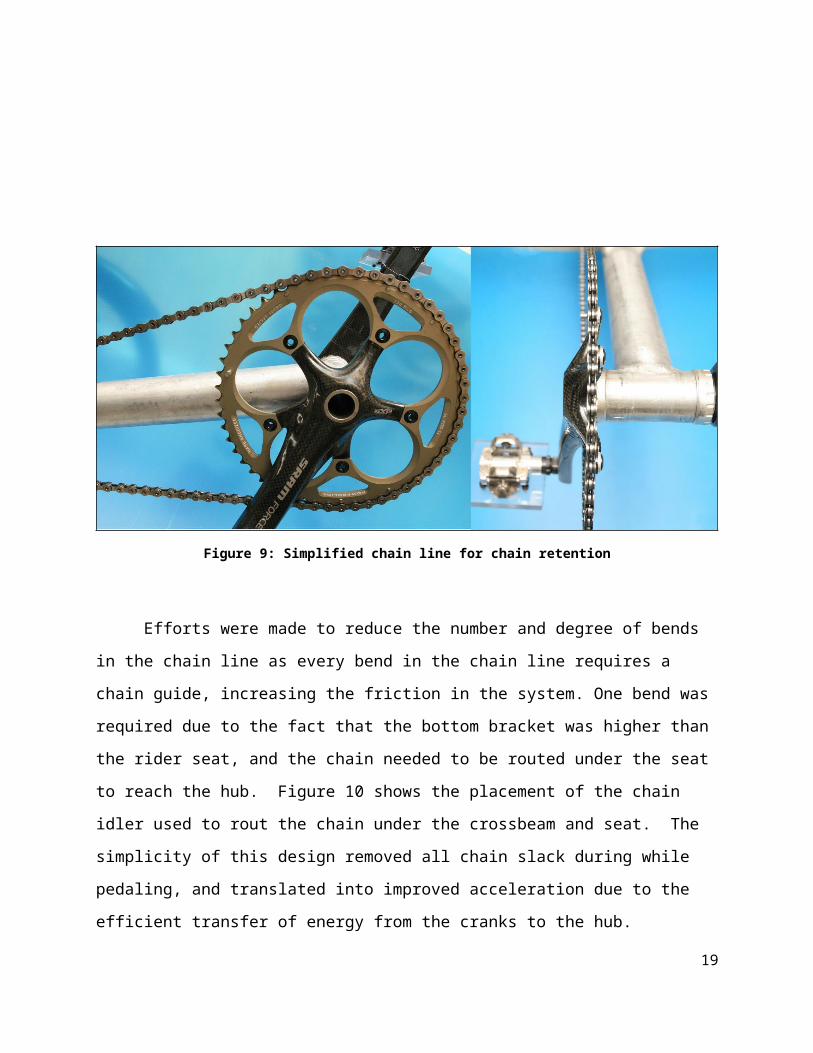
Efforts were made to reduce the number and degree of bends in the chain line as every
bend in the chain line requires a chain guide, increasing the friction in the system. One bend was
required due to the fact that the bottom bracket was higher than the rider seat, and the chain
needed to be routed under the seat to reach the hub. Figure 10 shows the placement of the chain
idler used to rout the chain under the crossbeam and seat. The simplicity of this design removed
all chain slack during while pedaling, and translated into improved acceleration due to the
efficient transfer of energy from the cranks to the hub.
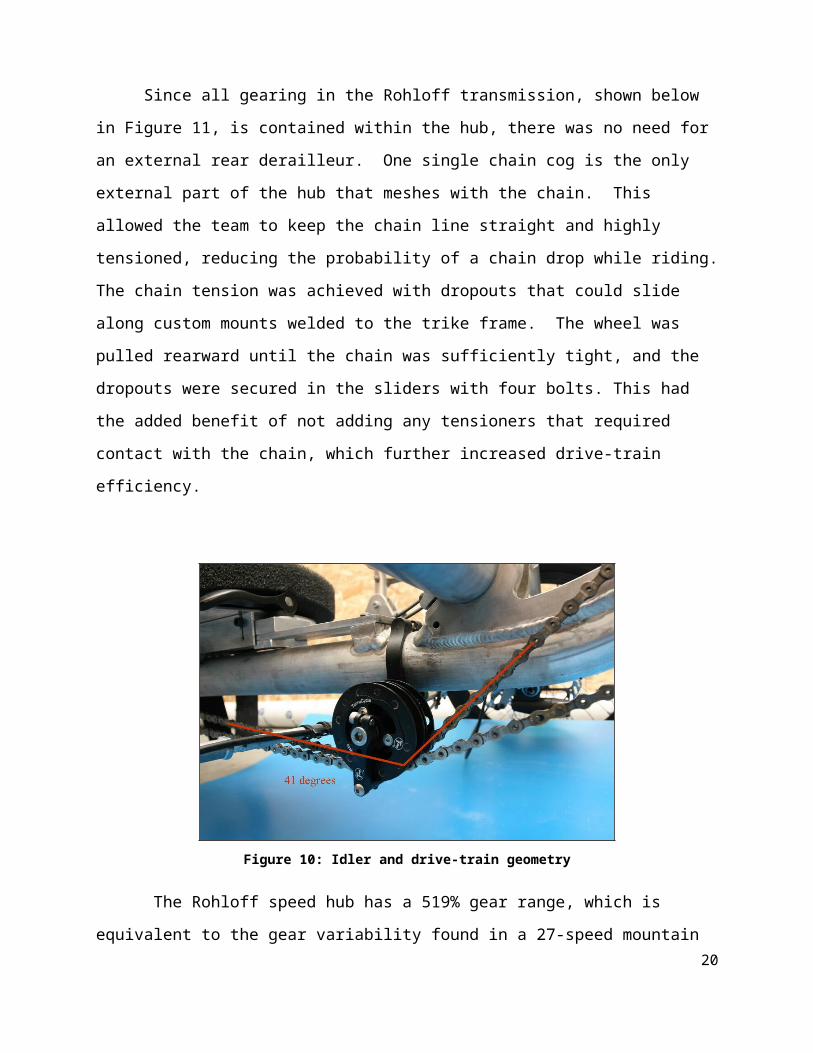
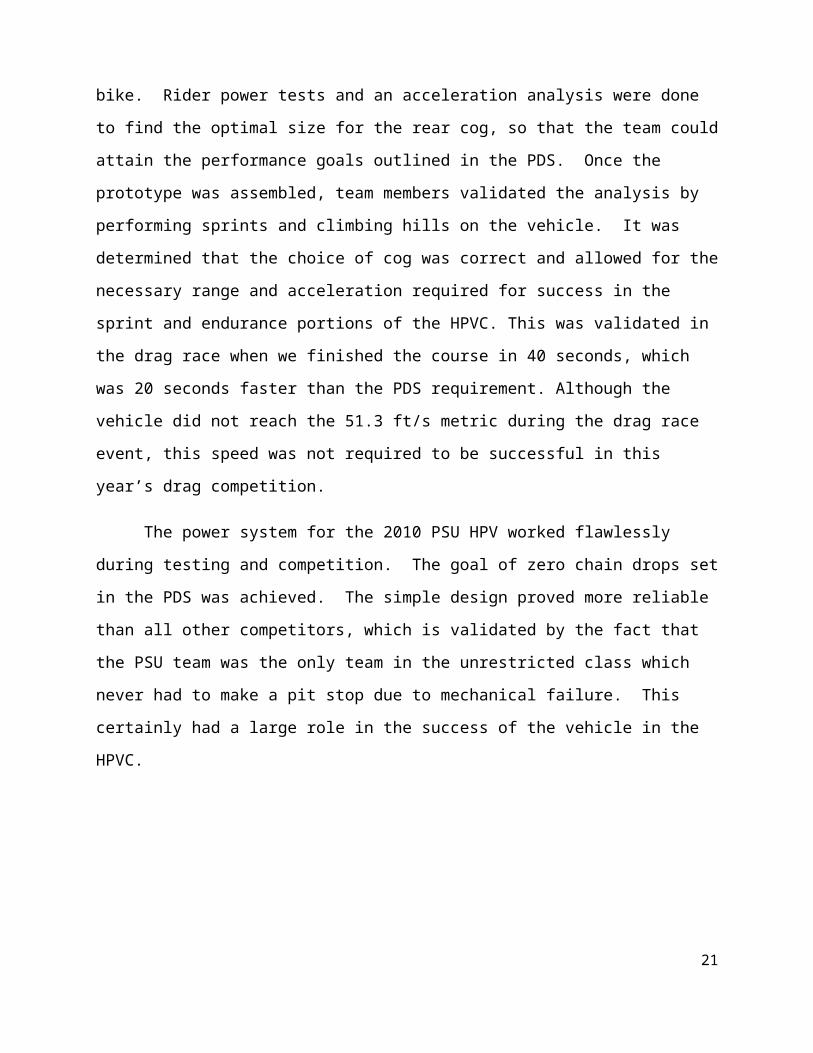
Since all gearing in the Rohloff transmission, shown below in Figure 11, is contained
within the hub, there was no need for an external rear derailleur. One single chain cog is the
only external part of the hub that meshes with the chain. This allowed the team to keep the chain 13
line straight and highly tensioned, reducing the probability of a chain drop while riding. The
chain tension was achieved with dropouts that could slide along custom mounts welded to the
trike frame. The wheel was pulled rearward until the chain was sufficiently tight, and the
dropouts were secured in the sliders with four bolts. This had the added benefit of not adding any
tensioners that required contact with the chain, which further increased drive-train efficiency.
Figure 10: Idler and drive-train geometry
The Rohloff speed hub has a 519% gear range, which is equivalent to the gear variability
found in a 27-speed mountain bike. Rider power tests and an acceleration analysis were done to
find the optimal size for the rear cog, so that the team could attain the performance goals outlined
in the PDS. Once the prototype was assembled, team members validated the analysis by
performing sprints and climbing hills on the vehicle. It was determined that the choice of cog
was correct and allowed for the necessary range and acceleration required for success in the
sprint and endurance portions of the HPVC. This was validated in the drag race when we
finished the course in 40 seconds, which was 20 seconds faster than the PDS requirement.
Although the vehicle did not reach the 51.3 ft/s metric during the drag race event, this speed was
not required to be successful in this year’s drag competition.
The power system for the 2010 PSU HPV worked flawlessly during testing and
competition. The goal of zero chain drops set in the PDS was achieved. The simple design
14
proved more reliable than all other competitors, which is validated by the fact that the PSU team
was the only team in the unrestricted class which never had to make a pit stop due to mechanical
failure. This certainly had a large role in the success of the vehicle in the HPVC.
Figure 11: Rohloff internally geared hub and sliding dropout chain tensioning system
Safety Systems
Overview
To insure for rider safety the vehicle utilized a roll-bar, rider restraint (safety harness),
and a fairing with good visibility. These systems add a degree of safety to human powered
transportation that cannot be attained with a traditional bicycle.
Roll-bar
The roll bar was built per the ASME safety guidelines as stated in roll bar requirements
(ASME.org). The roll bar was originally slated to be made out of 2” x .065” aluminum tubing
but due to manufacturing limitations, .120” wall tubing was utilized. The increase in wall
thickness increased the overall weight of the vehicle, but it enhanced the capability of the roll bar
significantly. The roll bar was tested using a hydraulic ram for loading and strain gauges for
deformation data. The vehicle was constrained during the test using the steel frame jig. Actual
deflection of the roll bar for the top load (600 lbs) was recorded at 0.47” with a maximum stress
of 7860 psi. The frame was rotated 90 degrees and a side load of 300 lbs was applied. The 15
deflection of the frame in this orientation was undetectable and the strain gage reported a
maximum stress of 850 psi. The factors of safety for the roll bar top and side loads were 5.1 and
47 respectively.
The roll-bar was dynamically loaded when one of the team riders hit road debris on the
race course and flipped the vehicle at about 30 mph. The rider received abrasions from her
instinctive reaction to stick her arms outside the roll-bar, but did not receive injuries to her head,
neck, torso, or other body parts. She was able to continue racing almost immediately after the
crash and for the following two days. The vehicle came out of the crash unscathed.
Rider Restraint
Rider restraint consisted of a 4 point safety harness attached to the frame at a point
underneath and behind the rider. To limit the movement of the seatbelt during riding, a point just
behind the rider’s neck was used as a routing point for the belts. Two holes were drilled in the
aluminum seat and zip ties were used to form a hoop that the belts were fed through. By
installing the hoop, the shoulder straps of the seat belt were not prone to falling off of the
shoulders of the rider.
Visibility
PDS requirements stated visibility needed to be 180 degrees horizontally and greater than
60 degrees vertically. As built, the carbon fiber fairing did not meet the PDS requirements.
However, the commercially available windscreen provided excellent visibility. The windscreen
was made with a clear polycarbonate that is completely transparent. The two mounting points
were arranged in a way that didn’t significantly hinder the rider’s view. Having a completely
clear fairing enabled riders to have very limited obstructions in their line of site and created a
safer overall riding experience.
Safety Systems Evaluation
The safety systems implemented on the 2010 HPV functioned to keep the rider safe in
environments commonly encountered during bicycling commuting. Physical loading in the lab
and during an actual rollover sufficiently proves this. These systems represent significant
16
improvements over traditional bicycles, and should be marketed as reasons why non-traditional
human powered transportation are practical commuting vehicles.
Future Design Considerations
This year’s trike performed outstandingly at the 2010 HPVC competition, the team has a
number of design recommendations for further improvements on the second prototype version.
These recommendations stem from observations during hundreds of hours spent building,
testing, and racing the vehicle.
The current wheelbase needs to be redesigned likely this will include shortening it The
long wheelbase of this year’s vehicle was the limiting factor in making extremely fast turns on
the trike. If part the vehicle is re-used in following years, much of this length could be taken
from the seat and chain stays without an intensive amount of work, and without the need to
completely rebuild the stays and dropouts. Shortening the wheelbase will also better distribute
the rider’s weight between the front and rear wheels. This prototype has a weight distribution
towards the front wheels, which is suited for hauling heavy loads on the cargo rack. In practice,
the cargo loads encountered during riding were not large enough to warrant this setup.
The steering geometry of this prototype was designed to be very adjustable. After hours
of dynamic testing, the team feels they have found the steering angles best suited for the HPVC.
That being said, these angles could change slightly as a result of a shortened wheelbase. The
camber of the front wheels is very aggressive and allows for extremely fast cornering. However,
riders noticed that while riding straight the tires were leaving marks on the concrete. This
indicates a high amount of tire friction with the road, which was more prevalent than calculations
suggested. By removing all but 5 degrees of camber, and increasing the caster and front wheels’
diameters, it should be possible to reduce tire-rolling resistance while keeping excellent
cornering stability. The caster should be set around +15 degrees, about 10 degrees higher than
current. The wheel diameter should be increased to an 18”. This will help decrease roll over
tendency in fast cornering, and will roll over road noise with less chatter than a 16” rim.
17
Additionally, increasing the wheel size will effectively increase the amount of suspension on the
front end, and will make for a more comfortable ride.
The prototype was made almost entirely out of Aluminum 6061, which made for a stiff
and light vehicle. There were a few custom components where aluminum quickly fatigued and
had to be replaced. Any steering tie-rod, joystick, or other heavily cycled steering component
should be made with steel. This should insure against fatigue failure during heavy or extended
use.
If this prototype is reused the strength of the braking needs to be adjusted. It has too
much braking power for any ordinary rider to feel comfortable with at high-speed. This could be
fixed by simply adjusting hydraulic fluid levels in the brake reservoirs. Some riders with smaller
hands mentioned that applying the brakes was cumbersome and uncomfortable. If the dual-lever
braking system is adopted in the future, a new brake bridge connecting the two levers should be
made with regards to ergonomics. It would be best to design a single brake lever that
simultaneously attaches to both hydraulic reservoirs.
The design and construction of even a simple fairing can take hundreds of man-hours.
Two team members need to be fully committed to this aspect of the vehicle. Significant CFD
analysis should be done on a range of fairing configurations. If the CFD system cannot
computationally handle the complexity of some configurations, use simplifications of those
shapes to get rough estimates of aerodynamic efficiencies. If CFD models under realistic riding
velocities do not indicate that a fairing will have sufficient power savings to offset its weight,
then a full fairing should not be manufactured.
In addition to aerodynamics, serious design considerations should be made with regard
to visibility, ease of entry, and mounting mechanisms. A cardboard mock-up for determining
general spatial concerns and ideal window placement would be useful. A design specification
for the fairing attachments should read, “The fairing will not utilize duct tape as a ‘latching
mechanism’ for any part of the fairing.” When building the fairing mold serious consideration
should be taken into mold strength. The vacuum pressure used during the setting of our carbon
fiber caused the male mold to collapse in places. For a professional looking fairing, the team
must create a female mold for the CF layup; even a perfectly-formed male mold won’t suffice.
CF formed with male molds will always have problems with the CF cloth forming wrinkles 18
during application of a vacuum pressure. Finally, manufacturing a fairing is only half the battle,
determining how to mount it to the vehicle frame in a way that doesn’t intrude on the rider or the
door will take hundreds of additional hours. Pay special attention to the stiffness of the
connections while riding on real roads. The team found that the insufficiently stiff fairing
succumbed to resonant frequencies at higher speeds. This can be very bothersome and also
dangerous.
Conclusion
The capstone team designed and prototyped a vehicle that meets the design requirements
established to successfully compete in the HPVC. This prototype incorporates many subsystems
that were thoroughly brainstormed, modeled, and analyzed to insure that they met the
requirements of the team and the ASME judges. Beyond meeting the PDS requirements, the
team has met its broader goals to win the HPVC and attract the attention of the local bicycling
community. This was accomplished by creating an elegantly simple trike that provides all the
systems needed in a utility vehicle without any gratuitous features. This simplicity led to an
extremely reliable vehicle that has not suffered any mechanical failures in the 60+ hours of use.
This reliability was a huge factor in the team taking 2nd in the 2010 HPVC West including 2nd
place in male and female sprint, 3rd place in design, 3rd place in utility endurance, and 1st place in
speed endurance.
19
Bibliography
Wilson, David, Papadopoulos, Jim, Whitt, Frank, & Arny, Rose. (2003). Forthcoming books. The MIT Press.
Reiser, P. 2001. Anaerobic Cycling Power Output with Variations in Recumbent Body Configuration, Colorado State University, Mechanical Engineering Department
American Society of Mechanical Engineers, 2010. Interpretation of event rules for Human powered vehicle competition. http://files.asme.org/asmeorg/Events/Contests/HPV/20735.pdf
Lee, Dai, & Suh, Nam. (2006). Axiomatic Design and Fabrication of Composite Structures. Oxford University Press, USA.
Introduction: Aerodynamics and Friction Losses, http://www.efluids.com/efluids/pages/bicycle.htm
Fairing Construction considerations http://www.recumbents.com/WISIL/wianecki/frank-n-liner/frank-n-liner2.htm
A Method for Optimizing the Weight and Drag Relation of Streamlined Bicycles, http://www.recumbents.com/WISIL/Hein/ME599_Report1.pdf
Peter Eland’s Steering Spreadsheets, http://www.eland.org.uk/steering.html
The Weight vs Wind Resistance Tradeoff. Hein, Nickolas. 1999
Human Powered Vehicle SPEEDS, http://www.adventuresofgreg.com/HPVlog/VehicleDrags.html
The Recumbent Bicycle and Human Powered Vehicle Information Center http://www.recumbents.com/WISIL/scale_project/streamliners.htm
20
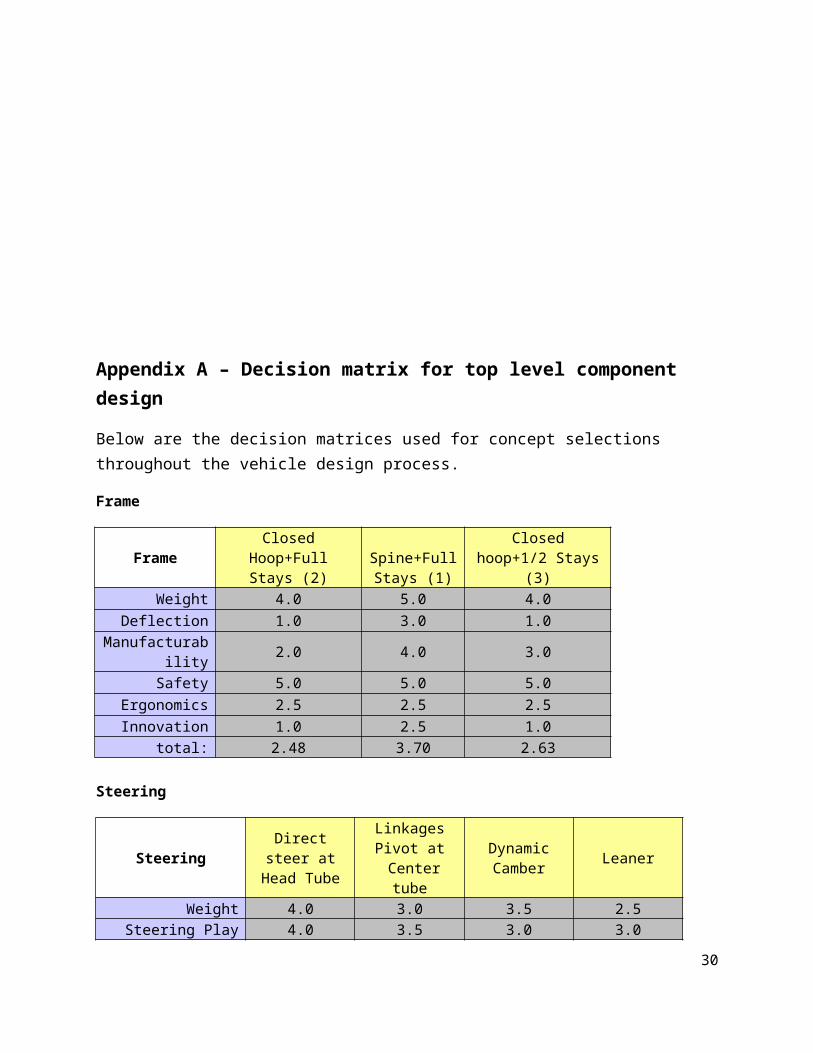
Appendix A – Decision matrix for top level component design
Below are the decision matrices used for concept selections throughout the vehicle design process.
Frame
Frame Closed Hoop+Full Stays (2)
Spine+Full Stays (1)
Closed hoop+1/2 Stays (3)
Weight 4.0 5.0 4.0Deflection 1.0 3.0 1.0
Manufacturability 2.0 4.0 3.0Safety 5.0 5.0 5.0
Ergonomics 2.5 2.5 2.5Innovation 1.0 2.5 1.0
total: 2.48 3.70 2.63
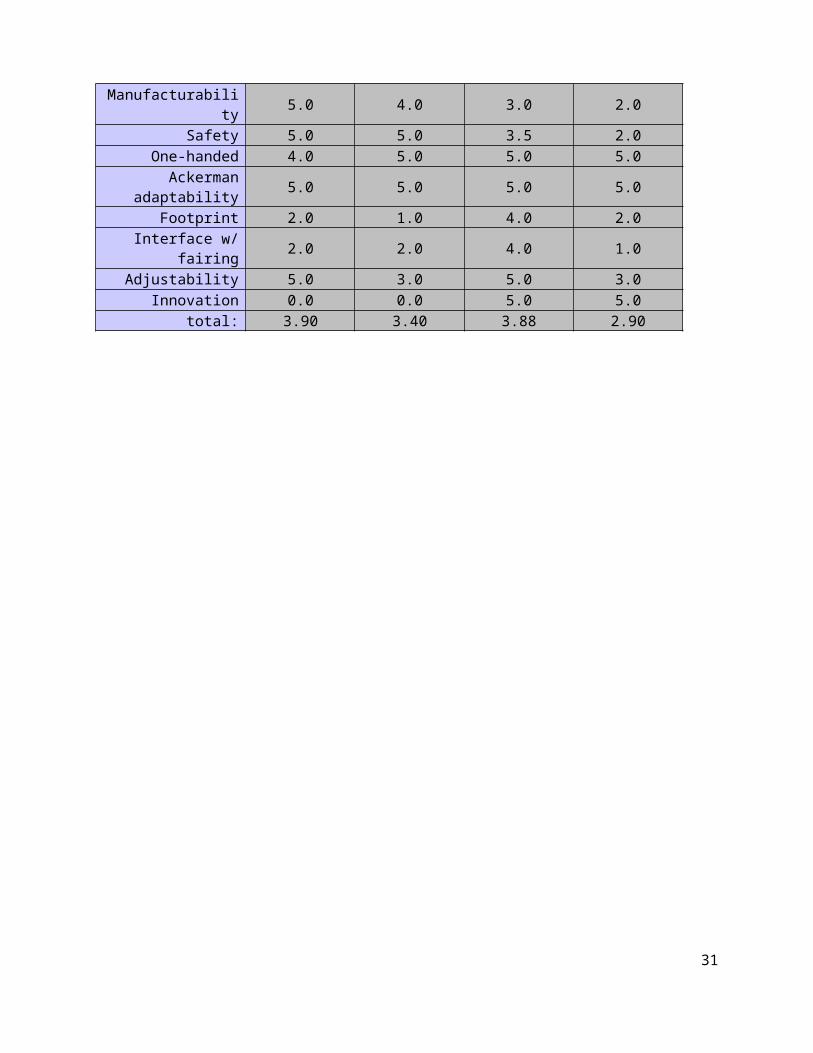
Steering
Steering Direct steer at Head Tube
Linkages Pivot at
Center tube
Dynamic Camber Leaner
Weight 4.0 3.0 3.5 2.5Steering Play 4.0 3.5 3.0 3.0
Manufacturability 5.0 4.0 3.0 2.0Safety 5.0 5.0 3.5 2.0
One-handed 4.0 5.0 5.0 5.0Ackerman adaptability 5.0 5.0 5.0 5.0
Footprint 2.0 1.0 4.0 2.0Interface w/ fairing 2.0 2.0 4.0 1.0
Adjustability 5.0 3.0 5.0 3.0Innovation 0.0 0.0 5.0 5.0
total: 3.90 3.40 3.88 2.90
21
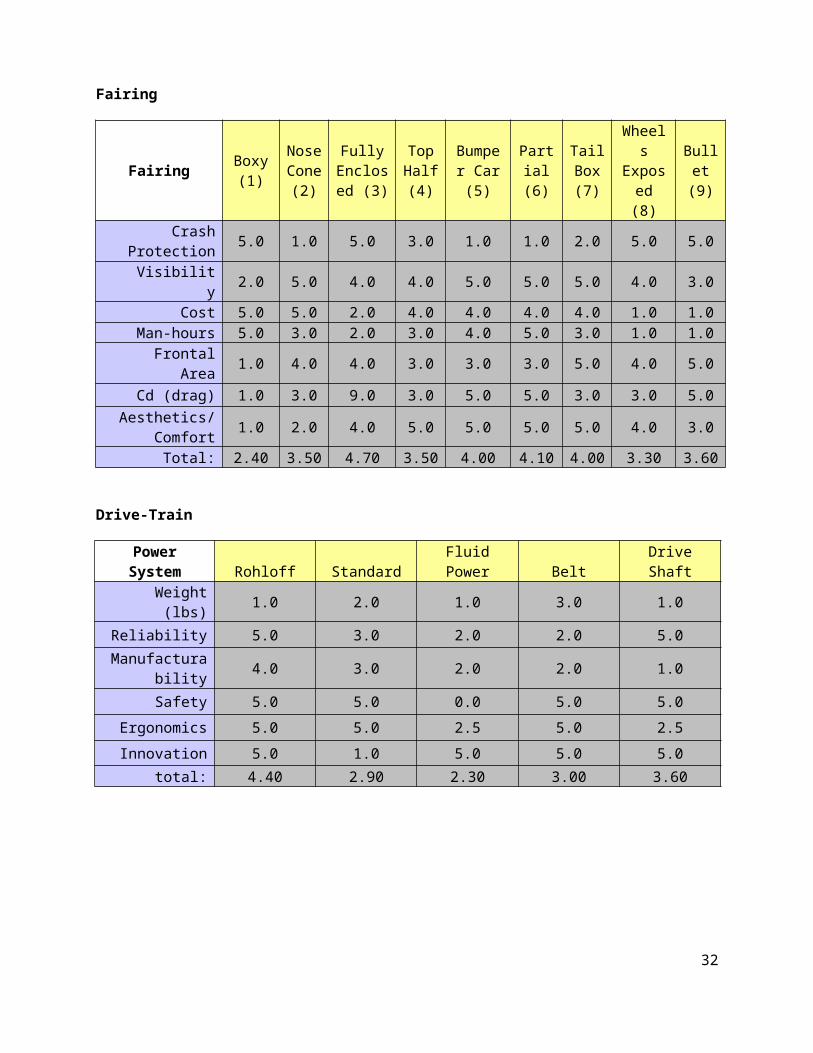
Fairing
Fairing Boxy (1)
Nose Cone (2)
Fully Enclose
d (3)
Top Half (4)
Bumper Car (5)
Partial (6)
Tail Box (7)
Wheels Expose
d (8)
Bullet (9)
Crash Protection 5.0 1.0 5.0 3.0 1.0 1.0 2.0 5.0 5.0 Visibility 2.0 5.0 4.0 4.0 5.0 5.0 5.0 4.0 3.0
Cost 5.0 5.0 2.0 4.0 4.0 4.0 4.0 1.0 1.0 Man-hours 5.0 3.0 2.0 3.0 4.0 5.0 3.0 1.0 1.0
Frontal Area 1.0 4.0 4.0 3.0 3.0 3.0 5.0 4.0 5.0 Cd (drag) 1.0 3.0 9.0 3.0 5.0 5.0 3.0 3.0 5.0Aesthetics/
Comfort 1.0 2.0 4.0 5.0 5.0 5.0 5.0 4.0 3.0
Total: 2.40 3.50 4.70 3.50 4.00 4.10 4.00 3.30 3.60
Drive-Train
Power System Rohloff Standard Fluid Power Belt Drive ShaftWeight (lbs) 1.0 2.0 1.0 3.0 1.0
Reliability 5.0 3.0 2.0 2.0 5.0Manufacturabilit
y 4.0 3.0 2.0 2.0 1.0
Safety 5.0 5.0 0.0 5.0 5.0
Ergonomics 5.0 5.0 2.5 5.0 2.5
Innovation 5.0 1.0 5.0 5.0 5.0total: 4.40 2.90 2.30 3.00 3.60
22
Appendix B. Vehicle Systems Analyses
Individual subsystems of the vehicle are covered in separate subsections. These analyses cover high level overviews of how analysis was conducted and sample calculations.
B.1 – FEA – RPS/SPS and Frame General FEA
Objective
Finite element analysis was used to determine the stresses and deflection in the frame under the loading conditions required in the 2009 HPVC rules; a 600lb load applied 12º from vertical to the top of the RPS and a 300lb load applied to the side. The frame and RPS were required to not yield or deflect more than 2.0in under the top loading or 1.5in for the side loading conditions.
Loading Case Definitions and Modeling
For all RPS simulations the frame was modeled using beam elements in Abaqus 6.9-2. In each series the node distribution was refined from 1in to 0.05in to confirm sufficient stress convergence. The initial top-loading simulation (Top1) was run with the rear axle constrained from moving in the principle x, y, and z-directions and the front wheels constrained from motion in the y-direction. The load was modeled as a concentrated force applied at the top of the RPS, with magnitude and orientation as described in the 2010 HPVC rules, shown in the top left of Figure B.1.1 below. These constraints and loading conditions represented a scenario which can be physically reproduced and physically verified with measurements and strain gages. A second series of models (Top2) more representative of an actual rollover were run where the load was applied as two 300lb concentrated loads at the ends of the seat-rail member and the top portion of the RPS and the end of the boom were constrained as shown in the top right of Figure B.1.1. While this alternate model represents the weight and momentum of the rider as the source of the 600lb load during a rollover at speed, it is uncertain whether it can be safely reproduced on the prototype vehicle frame. The side rollover protection loading was modeled as a concentrated force applied at the shoulder height of the roll hoop with the rear axles fully constrained from translating and the wheel on the side of impact constrained from translating in the z-direction. Symmetry was not used in any of the simulations in the interest of time as the highest number of nodes was well below the software limitations.
23
Figure B.1.1 RPS top and side loadings and constraints. Upper left Top1, upper right Top2, bottom left side, and bottom right the wireframe model with beam profiles rendered for reference.
Results
The peak stress of both top loading models and the side loading model are shown below in Figure B.1.2 and converged to well below the required limits. Peak stress encountered in the series Top1 was found to be in the center tubing where it joins to the upper-rear stays. More realistically, the model series Top2, showed the peak stress to be in the center tube of the seat rail section. Deflection in both models was well below the allowable 2 inches, converging to 0.36in in Top1 and 0.58 in Top2. While the deflection in the series exceeded the PDS specification of 0.5in it was decided that it was acceptable given the circumstances. The peak stress in the Side RPS simulation converged to less than 6ksi with a deflection of approximately 0.20in.
0 500 1000 1500 2000 25005
6
7
8
9
10
11
12
13
14
15
Top1Top2Side
Nodes
Stre
ss (k
si)
Figure B.1.2 Top and Side RPS models peak stress convergence plot.
Frame FEA
24
Objective
Finite element analysis was used to determine stresses and deflection of the vehicle frame under expected load conditions. The target metrics defined in the PDS required a minimum factor of safety of 1.5 and maximum deflection of 0.5”. Material was previously selected as 6061-T6 aluminum. Tubing diameter and wall thickness of frame members examined were restricted to commercially available dimensions to minimize material and manufacturing costs.
Load Case Definitions and Modeling
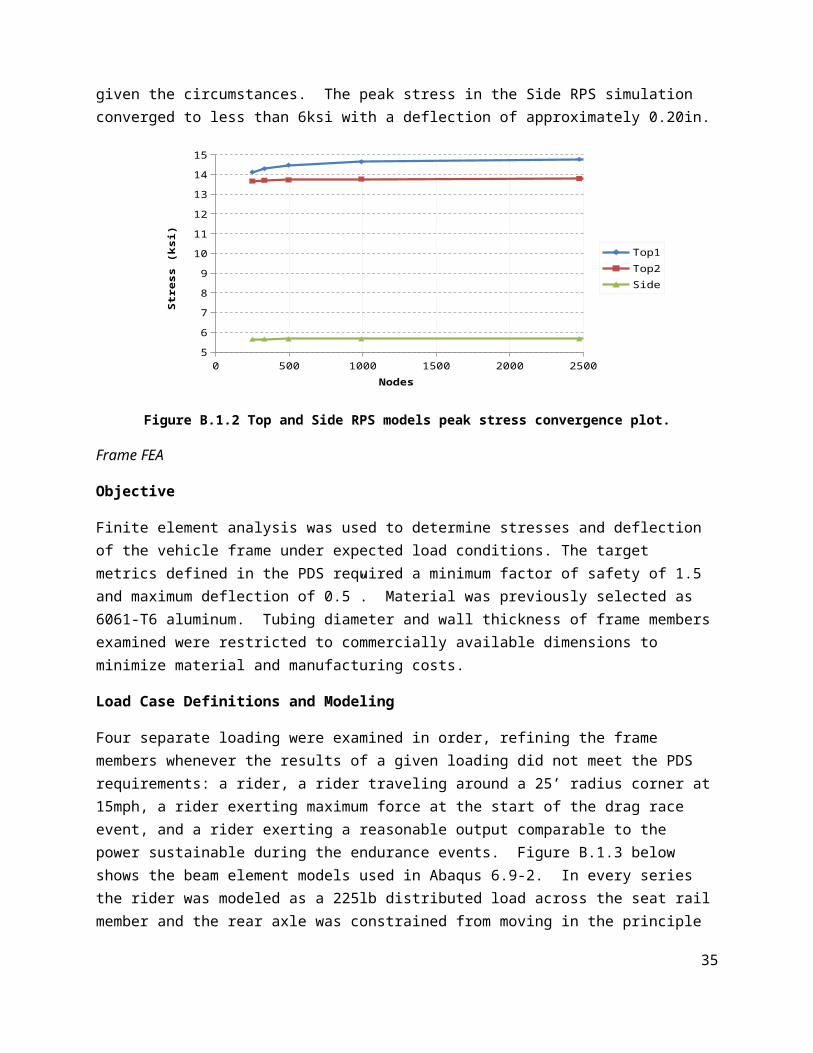
Four separate loading were examined in order, refining the frame members whenever the results of a given loading did not meet the PDS requirements: a rider, a rider traveling around a 25’ radius corner at 15mph, a rider exerting maximum force at the start of the drag race event, and a rider exerting a reasonable output comparable to the power sustainable during the endurance events. Figure B.1.3 below shows the beam element models used in Abaqus 6.9-2. In every series the rider was modeled as a 225lb distributed load across the seat rail member and the rear axle was constrained from moving in the principle x, y, and z-directions. The front wheels were constrained from motion in the y-direction unless specified otherwise. For the cornering model the distributed load representing the rider included a 135lb distributed load perpendicular to the frame and the outside front wheel was constrained, assuming that it would not scrub or leave the ground. The force exerted at the launch of the drag race was conservatively estimated at 750lb and applied as a concentrated force directed 15º up from horizontal at the boom. The model representing the continuous output used a -1680in-lb moment in the z-direction and a 1320in-lb moment in the y-direction, both applied at the end of the boom. While the rider-only and drag launch simulations presented opportunity for use of symmetry, the full model was used in the interest of time efficiency as the highest number of nodes was well below the software limitations.
Figure B.1.3 FEA loads and boundary constraints for FEA analyses
Results
25
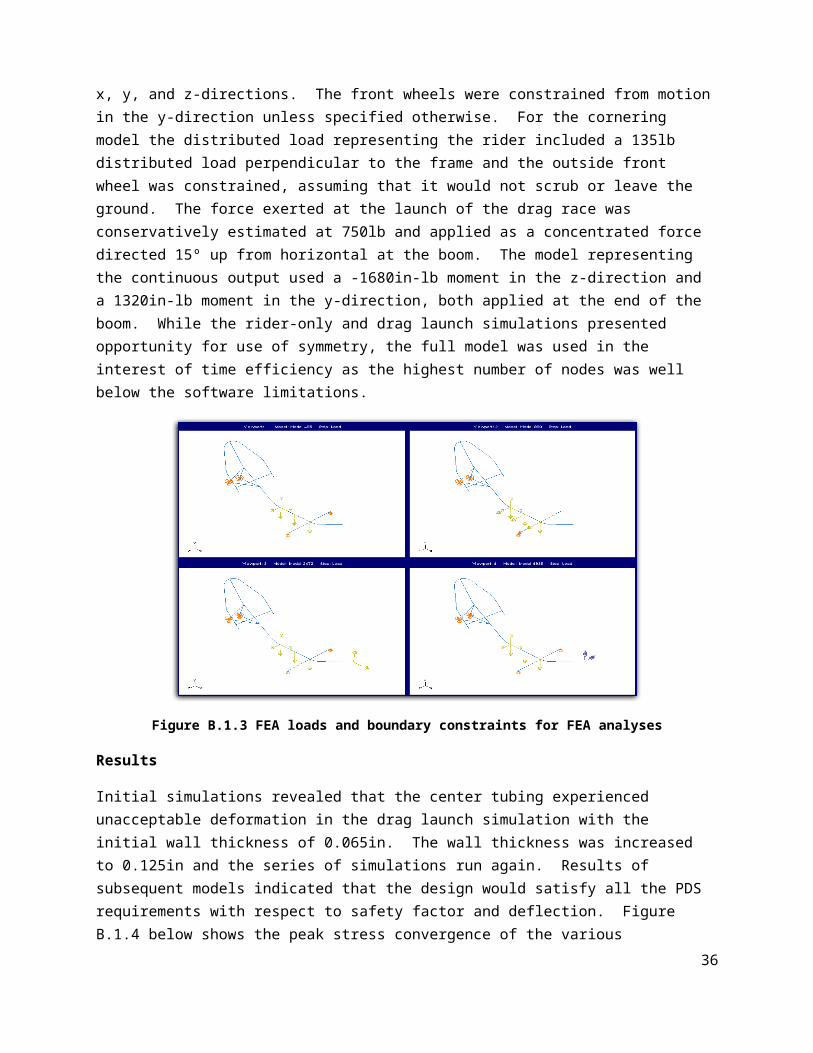
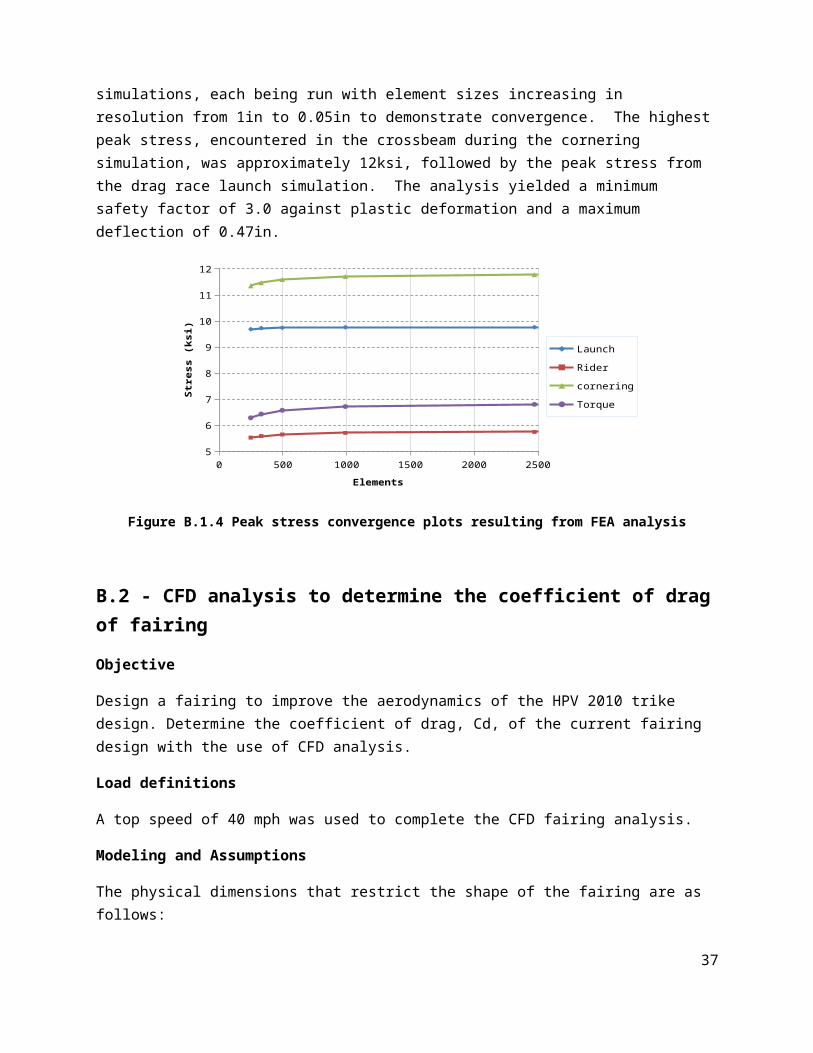
Initial simulations revealed that the center tubing experienced unacceptable deformation in the drag launch simulation with the initial wall thickness of 0.065in. The wall thickness was increased to 0.125in and the series of simulations run again. Results of subsequent models indicated that the design would satisfy all the PDS requirements with respect to safety factor and deflection. Figure B.1.4 below shows the peak stress convergence of the various simulations, each being run with element sizes increasing in resolution from 1in to 0.05in to demonstrate convergence. The highest peak stress, encountered in the crossbeam during the cornering simulation, was approximately 12ksi, followed by the peak stress from the drag race launch simulation. The analysis yielded a minimum safety factor of 3.0 against plastic deformation and a maximum deflection of 0.47in.
0 500 1000 1500 2000 25005
6
7
8
9
10
11
12
Launch
Rider
cornering
Torque
Elements
Stre
ss (k
si)
Figure B.1.4 Peak stress convergence plots resulting from FEA analysis
B.2 - CFD analysis to determine the coefficient of drag of fairing
Objective
Design a fairing to improve the aerodynamics of the HPV 2010 trike design. Determine the coefficient of drag, Cd, of the current fairing design with the use of CFD analysis.
Load definitions
A top speed of 40 mph was used to complete the CFD fairing analysis.
Modeling and Assumptions
The physical dimensions that restrict the shape of the fairing are as follows:
The width at the shoulders is 22 inches. The height of the toe-box (lowest point of heel to highest point of toe in a rider’s pedaling
motion) must be a minimum of 27 inches. The fairing must clear 2.5 inch speed bumps and be able to ascend slopes with 6 degree inclines
measured from horizontal. The roll bar height is 37 inches from the ground.
26
The length is restricted to 10 feet due to transport device to and from event.Figure B.2.1 displays the physical constraints.
.
Figure B.2.1 Top and side views of the possible fairing showing dimensional constraints.
ρ=1.15kg/m3 (density) η=2.0 E−5 Pa∗s (dynamic viscocity) V max=18 m /s Area=880 ¿2 (frontal area)
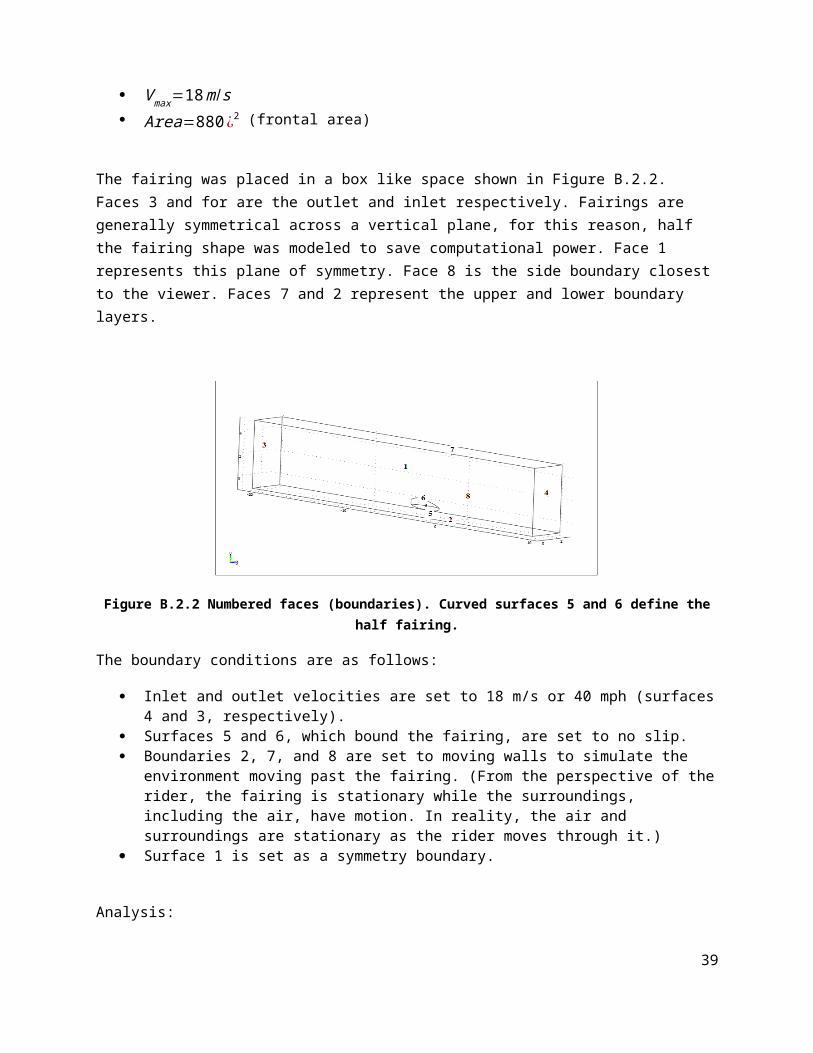
The fairing was placed in a box like space shown in Figure B.2.2. Faces 3 and for are the outlet and inlet respectively. Fairings are generally symmetrical across a vertical plane, for this reason, half the fairing shape was modeled to save computational power. Face 1 represents this plane of symmetry. Face 8 is the side boundary closest to the viewer. Faces 7 and 2 represent the upper and lower boundary layers.
27
Figure B.2.2 Numbered faces (boundaries). Curved surfaces 5 and 6 define the half fairing.
The boundary conditions are as follows:
Inlet and outlet velocities are set to 18 m/s or 40 mph (surfaces 4 and 3, respectively). Surfaces 5 and 6, which bound the fairing, are set to no slip. Boundaries 2, 7, and 8 are set to moving walls to simulate the environment moving past the
fairing. (From the perspective of the rider, the fairing is stationary while the surroundings, including the air, have motion. In reality, the air and surroundings are stationary as the rider moves through it.)
Surface 1 is set as a symmetry boundary.
Analysis:
Domain Convergence: To be sure the flow domain was large enough and no edge effects could affect results, domains of different sizes were tested until Cd values were had no greater difference than +/- .02. The starting domain is 3 meters wide, 6 meters high and 30 meters long. From this domain the (half) width is varied from 1 meter to 4.5 meters, the height varied from 3 meters to 8 meters, and the length varied from 15 to 35 meters. It was determined that a domain size of 3m x 6m x 30m was sufficient to analyze the fairing. Due to the variability of the meshing algorithm as domain size changes, there exists some variability in the results. From the figure, it can be seen that the total spread in Cd value is approximately +/- 0.02, which displayed a sufficient level of accuracy has been reached.
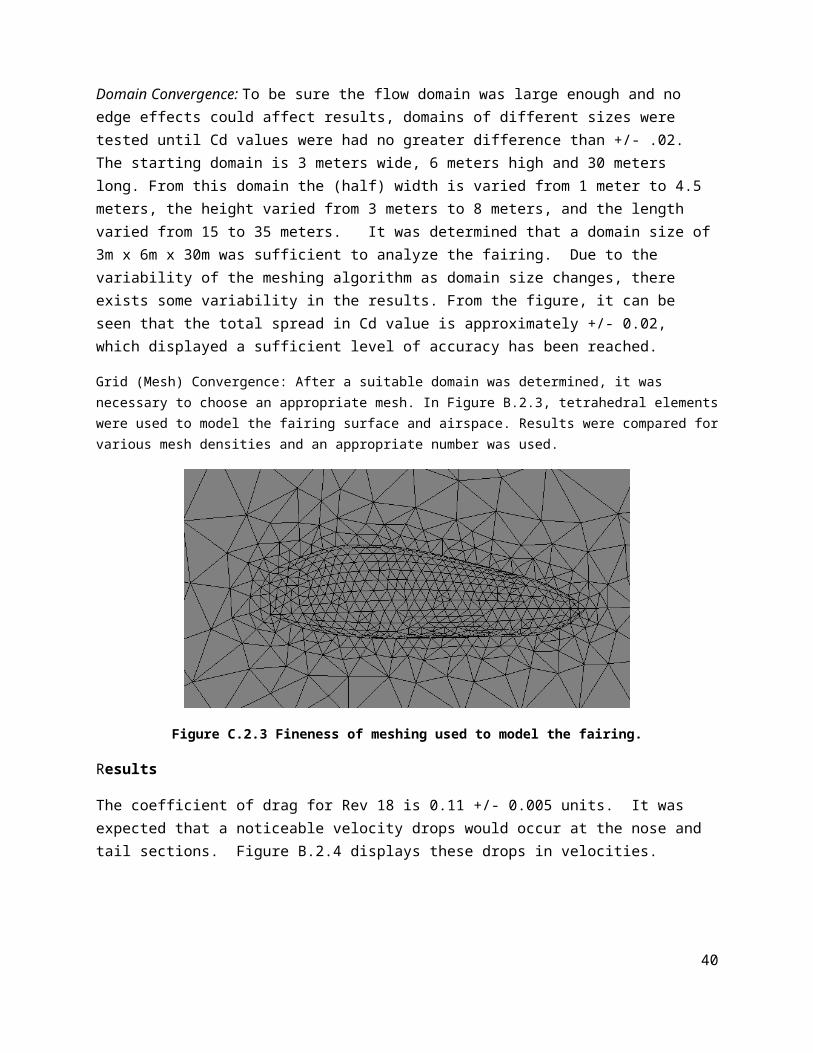
Grid (Mesh) Convergence: After a suitable domain was determined, it was necessary to choose an appropriate mesh. In Figure B.2.3, tetrahedral elements were used to model the fairing surface and airspace. Results were compared for various mesh densities and an appropriate number was used.
28
Figure C.2.3 Fineness of meshing used to model the fairing.
Results
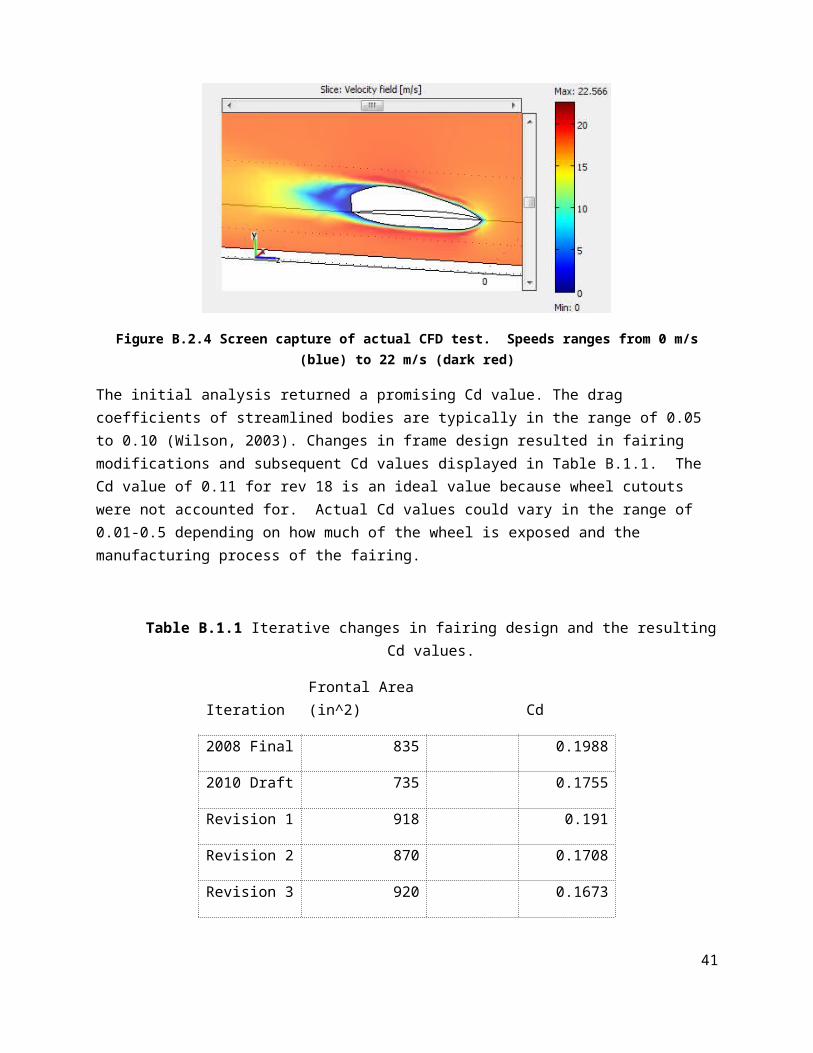
The coefficient of drag for Rev 18 is 0.11 +/- 0.005 units. It was expected that a noticeable velocity drops would occur at the nose and tail sections. Figure B.2.4 displays these drops in velocities.
Figure B.2.4 Screen capture of actual CFD test. Speeds ranges from 0 m/s (blue) to 22 m/s (dark red)
The initial analysis returned a promising Cd value. The drag coefficients of streamlined bodies are typically in the range of 0.05 to 0.10 (Wilson, 2003). Changes in frame design resulted in fairing modifications and subsequent Cd values displayed in Table B.1.1. The Cd value of 0.11 for rev 18 is an ideal value because wheel cutouts were not accounted for. Actual Cd values could vary in the range of 0.01-0.5 depending on how much of the wheel is exposed and the manufacturing process of the fairing.
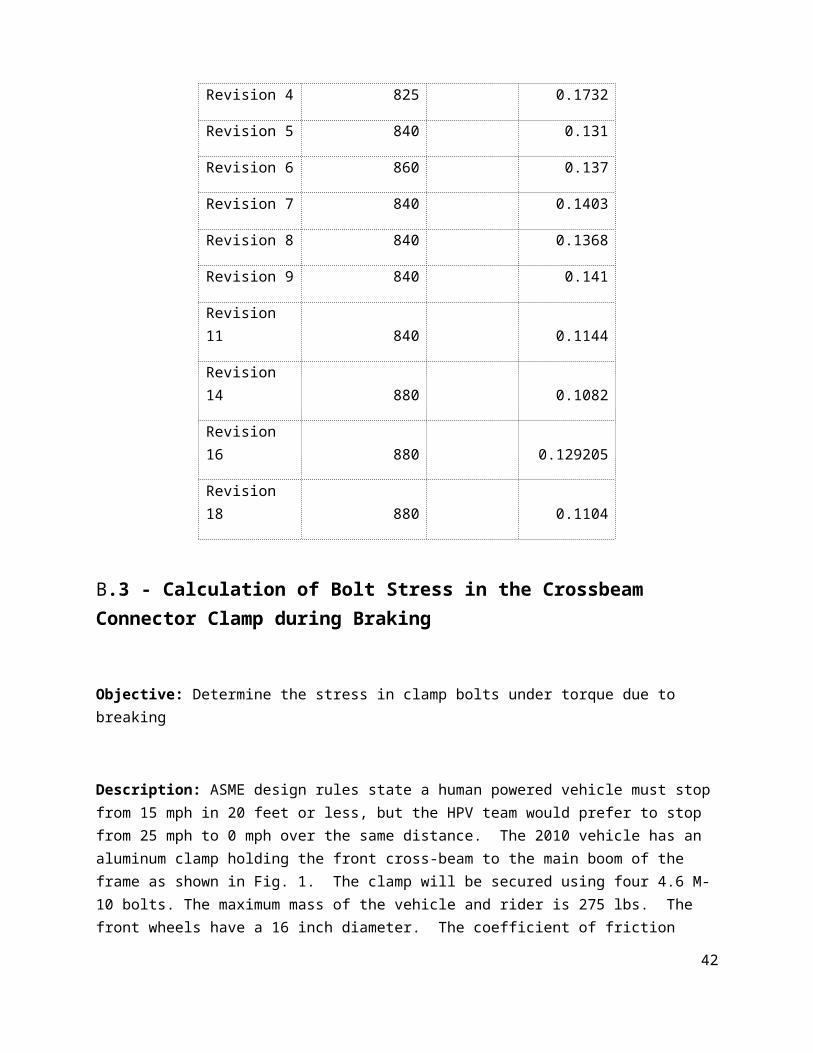
Table B.1.1 Iterative changes in fairing design and the resulting Cd values.
Iteration Frontal Area Cd
29
(in^2)
2008 Final 835 0.1988
2010 Draft 735 0.1755
Revision 1 918 0.191
Revision 2 870 0.1708
Revision 3 920 0.1673
Revision 4 825 0.1732
Revision 5 840 0.131
Revision 6 860 0.137
Revision 7 840 0.1403
Revision 8 840 0.1368
Revision 9 840 0.141
Revision 11 840 0.1144
Revision 14 880 0.1082
Revision 16 880 0.129205
Revision 18 880 0.1104
B.3 - Calculation of Bolt Stress in the Crossbeam Connector Clamp during Braking
Objective: Determine the stress in clamp bolts under torque due to breaking
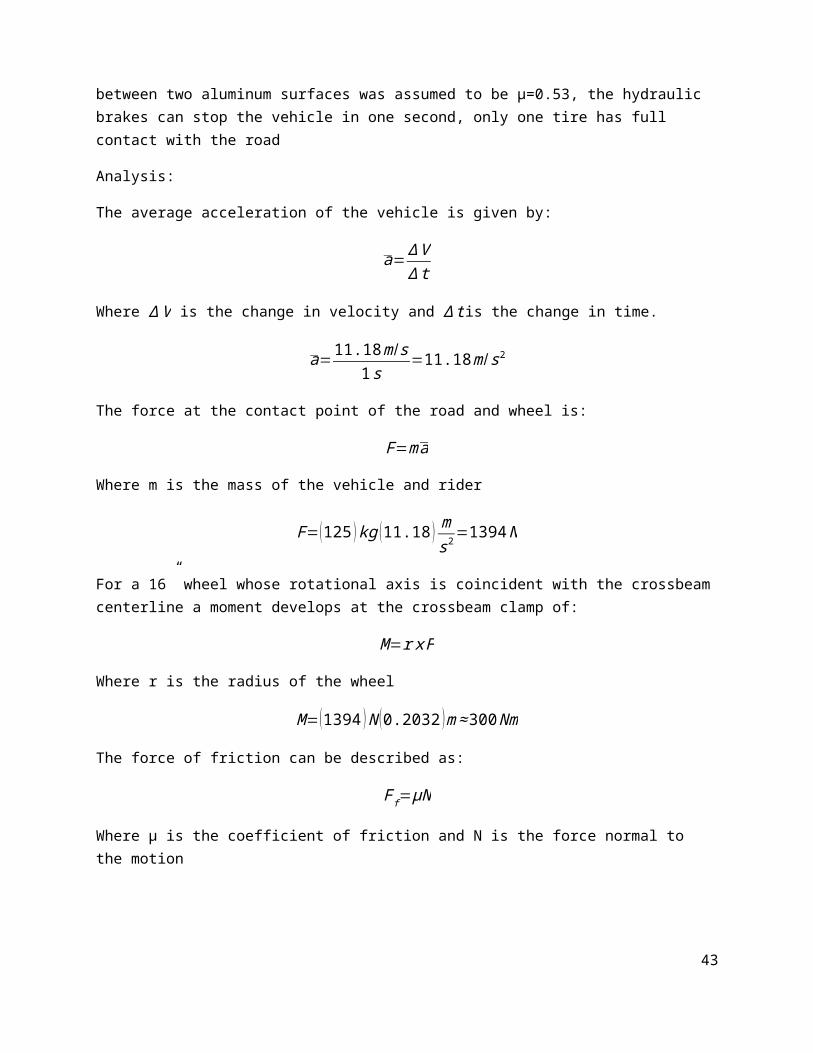
Description: ASME design rules state a human powered vehicle must stop from 15 mph in 20 feet or less, but the HPV team would prefer to stop from 25 mph to 0 mph over the same distance. The 2010 vehicle has an aluminum clamp holding the front cross-beam to the main boom of the frame as shown in Fig. 1. The clamp will be secured using four 4.6 M-10 bolts. The maximum mass of the vehicle and rider is 275 lbs. The front wheels have a 16 inch diameter. The coefficient of friction between two aluminum surfaces was assumed to be μ=0.53, the hydraulic brakes can stop the vehicle in one second, only one tire has full contact with the road
30
Analysis:
The average acceleration of the vehicle is given by:
a=∆ V∆ t
Where ∆ V is the change in velocity and ∆ t is the change in time.
a=11.18m /s1 s
=11.18m /s2
The force at the contact point of the road and wheel is:
F=m a
Where m is the mass of the vehicle and rider
F=(125 ) kg (11.18 ) ms2 =1394 N
For a 16” wheel whose rotational axis is coincident with the crossbeam centerline a moment develops at the crossbeam clamp of:
M=r x F
Where r is the radius of the wheel
M=(1394 ) N (0.2032 ) m≈ 300 Nm
The force of friction can be described as:
F f =μN
Where μ is the coefficient of friction and N is the force normal to the motion
For a circular clamp, the normal force between the clamp and crossbeam surfaces can be related to the tension of the four M-10 bolts holding the clamp together. Using these relations and the equation for frictional force:
F i=M
Nμ π D
Where F i is the force per bolt due to the braking moment, M is the braking moment at the clamp, N is the number of bolts, μ is the coefficient of friction between the two surfaces, and D is the diameter of the crossbeam tubing.
31
F i=(300 ) Nm
4 (0.53 ) π (0.0508 ) m=886.7 N
The proof strength of a grade 4.6 bolt is 225 MPa and the tensile area ( At ) of an M10 bolt is 58m m2.
The stress in a single bolt is:
σ i=F i
A t= 900 N
58 mm2 =16 MPa
The factor of safety is then:
F . O . S .=σ s
σ i=225 MPa
16 MPa=14
Results
Although this is a very high factor of safety, the team believes that this aspect of the vehicle should be overbuilt for the following reason: bolts will be loaded in shear, the dynamic stresses from the road inputs aren’t easily quantified, and the number and magnitude of fatigue cycles these bolts will endure is not readily obtained. M8 bolts are another possibility if weight savings on gusset materials becomes an issue.
B.4 – Steering Geometry, Center Point King pin analysis
Objective: Human powered vehicles with two wheels in the front often steer poorly due to road roughness or uneven braking forces. Steering geometry that minimizes the effect of road roughness and uneven braking forces on wheel direction is highly desirable.
Analysis:
In an ideal steering set-up the front wheel’s steering axis would intersect the tire’s point of contact with the road. In this configuration any forces from road roughness will be in line with the steering axis and not create a torque. This ideal set-up is not easily attained with human powered vehicles because wheels are typically small and made of spokes. This is not conducive to having a kingpin axis in the middle of a wheel. To fix this problem many trike manufacturers incline the kingpin axis as shown in Figure B.4.1.
32
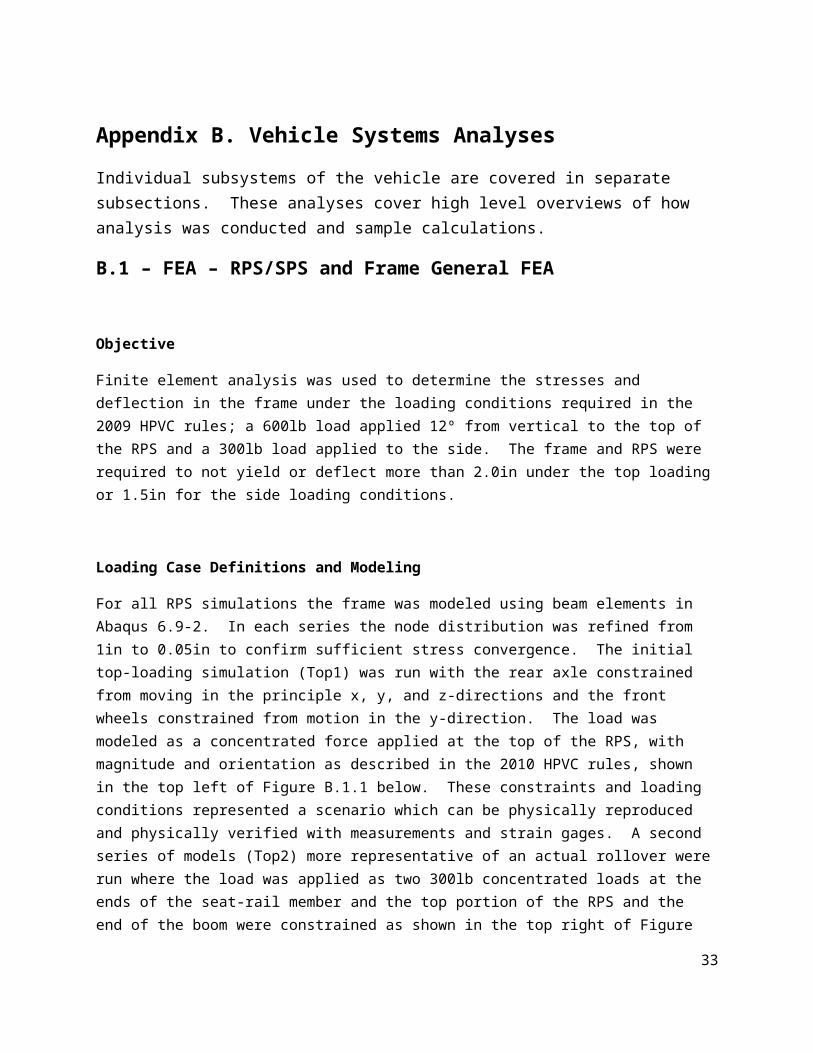
Figure B.4.1 the red line in the figure represents the rotational axis of the kingpin. The red line should intersect the point of contact between the tire and ground. This represents perfect center point steering.
(http://www.eland.org.uk/steering.html)
There is some disadvantage to inclining the kingpin axis too far. Peter Eland’s website suggests that this angle should not exceed 15 degrees. When this angle becomes large, the dynamics of the steering are such that the front-end of the vehicle must be lifted during steering. This creates a steering system that can be relatively insensitive to driver inputs and feel “heavy”.
Solution:
The team has decided that perfect center point steering is unachievable and undesirable with kingpin inclinations < 15 degrees. The team believes that having the kingpin axis intersect the ground just inside of the tire will create the best steering dynamics. It will cause the rider to “feel” the road without allowing it to seriously affect the steering. It will also allow riders some amount of brake steer for high-performance cornering. And unlike the Vike Trike II, riders will not have to lift the weight of the trike in their steering motion. These considerations will create a steering system that is responsive, doesn’t deviate due to road forces, and can still utilize high-performance techniques like brake steering.
Appendix B.5 – Steering Geometry, Linkage Analysis
Objective
The objective of this analysis is to determine the ideal steering geometry to minimize scrubbing while turning. An Ackermann trapezoidal four bar linkage is used as a basis. A minimum turning radius of 25 feet is indicated in the competition rules. Figure B.5.1 shows the parts of the steering assembly to be analyzed.
33
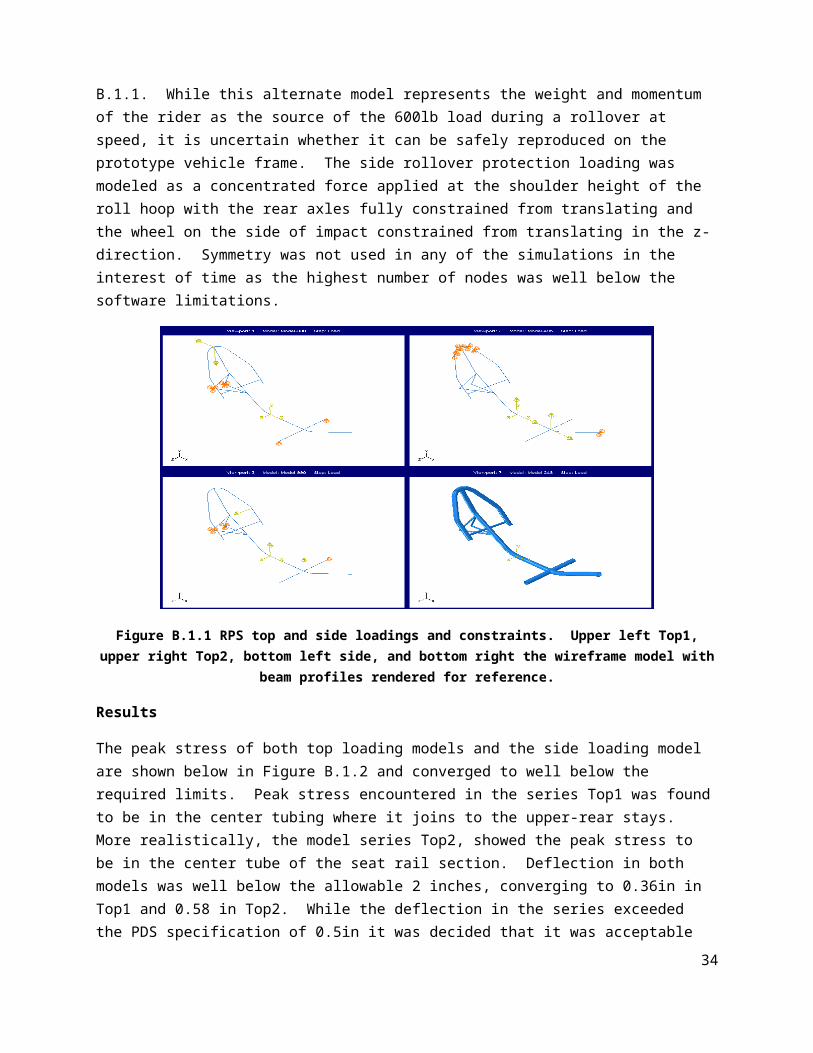
Figure B.5.1 This figure represents one of the final steering designs before linkage analysis was complete
Given:Wheel base: 50.4inchesKingpin width at steering arm: 27.24 inches
Track width: 35.54 inches Minimum turning radius: 25 feet
Find:The steering arm geometry that minimizes scrub for a 25 foot radius turn.
Assumptions:
Tire slip is negligible. Small camber and kingpin inclination angles are negligible to the Ackermann steering.
Solution:
A simple approximation to Ackermann steering can be achieved by moving the point of attachment for the tie-rod to the steering arm in toward the frame such that the attachment point is coincident with a line drawn between the center of the steer tube and the center of the rear axle.
Initial steering arm angle Φsa for iteration
Φsa=tan−1¿) =75 deg
The angular displacement necessary for ideal Ackermann steering for the inside and outside wheel are calculated as δi and δo, respectively. The turn radius is defined by the path of the center of the fixed steering cross tube. For a 25 foot turn radius, the ideal angular displacement for Ackermann steering of each wheel is as follows.
δ i=¿ tan−1( w heel base
turnr adius− track widt h2
) = tan−1¿¿ = 10.1deg
δ o=¿ tan−1( w h eel base
turnradius+ track widt h2
) = tan−1¿¿ = 9.0 deg
34
A steering arm length is set at 6.5 inches for spatial consideration due to the adjustable caster of the vehicle. A graphical solution is used by iterating the steering arm angle, setting the outer angular displacement to the ideal Ackermann displacement for a 25 foot turn of 9.0 degrees, and measuring the inner angular displacement. A steering arm angle of 75 degrees is used an initial value to begin iteration from the above approximation. The measured inner angular displacement is then compared to the theoretical angular displacement of the inner wheel under ideal Ackermann steering. Figure B.5.2 shows an example of the graphical model for a 62 degree steering arm angle iteration.
Figure B.5.2 Steering analysis represented geometrically.
The length of the tie-rod can now be determined with the steering arm geometry known.
L=27.26∈−2¿
Answer: Steering Arm Length = 6.5 in, Steering Arm Angle = 62 deg, Tie Rod Length = 21.2in
Conclusion
The result of this analysis is the steering arm geometry and tie-rod length that provides minimized scrubbing in corners by turning the inside wheel at a smaller radius than the outside wheel. The center of curvature for all three wheels should be at the center point of the radius the vehicle is turning about. The analysis indicates geometry of a steering arm length of 6.5 inches, steering arm angle of 62 degrees, and tie-rod length 21.2 inches provides the appropriate geometry to achieve this, and this geometry will be incorporated into the steering design for the vehicle.
B.6 - Speed and acceleration analysis
Objective: Determine the top speed, average acceleration, and position of rider after elapsed time. Display results graphically.
Given: Mechanical constraints of system:
Gear ratio = 39/16
35
Rohloff hub ratio = (1.464, 1.265, 1.093, 0.944, 0.816, 0.705, 0.609, 0.526, 0.455, 0.393, 0.339, 0.293, 0.253, 0.219)
Rear wheel diameter = 2.02 ft Rider power = 250 watts Coefficient of drag = 0.16 Frontal Area = 6 sq ft Rider and vehicle weight = 200 lbs
Assumptions
Rider output is constant amount, (valid with the use of gears) As rider approaches expected top RPM, rate of increase of RPM decreases Top rpm = 90 Assumed time per gear in between gear changes = 7 seconds Rider tires a percentage of initial power output depending on elapsed time
Solution
Sample calculation at 78.75 rpm and a power output from rider of 250 watts
Horsepower conversion:
Hp=Watt∗0.00134( H pWatt )=250∗0.00134=0.34 Hp (1)
Torque at crank:
Torquecrank (ft lb )=(Hp)33000(RPM )2 π
=(0.34 )33000
(78.75 )2π=22.34 ft lb (2)
Torque at rear wheel through gear ratios and hub ratios:
Torque rear ( ft lb )=Cog∗Hub ratioC h ainring
=(16 ) 1.464
39=13.42 ft lb (3)
Force at rear wheel contact with wheel:
Forcerear ( lb )=Torquerear ( ft lb )∗2w h eel diameter (ft )
=13.42∗22.02
=13.29 lb (4)
Equations 5-8 iterate until drag velocity and actual velocity are equal. This ensured that drag forces were accounted for.
Total force acting on the system results in acceleration:
Forcetotal ,i=force rear, i−forcedrag ,i=13.29 lb−0.156 lb=13.13 lb (5)
Acceleration:
36
a fts2 =
Forcetotal∗32.2total weigh t (lb)
=13.13lb∗32.2( ft
s2 )
200 lb=2.11( ft
s2 ) (6)
Velocity:
Veli+1( fts )=Veli+(a( ft
s2 )∆ t (s))=(10.24 ) 2.11∗0.7=11.72 lb (7)
Drag force based on calculated velocity:
forcedrag=12
ρ v2 A f =12
(0.00237 )∗(11.722 )∗(6 )=0.156lb (8)
0 10 20 30 40 50 60 70 800.00
500.00
1000.00
1500.00
2000.00
2500.00
3000.00
PSU ModelPoly-nomial (PSU Model)Min dis-tanceMax dis-tance
Time (s)
posi
tion
(ft)
Figure B.6.1 Vehicle position as a function of time. Mechanical constraints as stated in the given category.
37
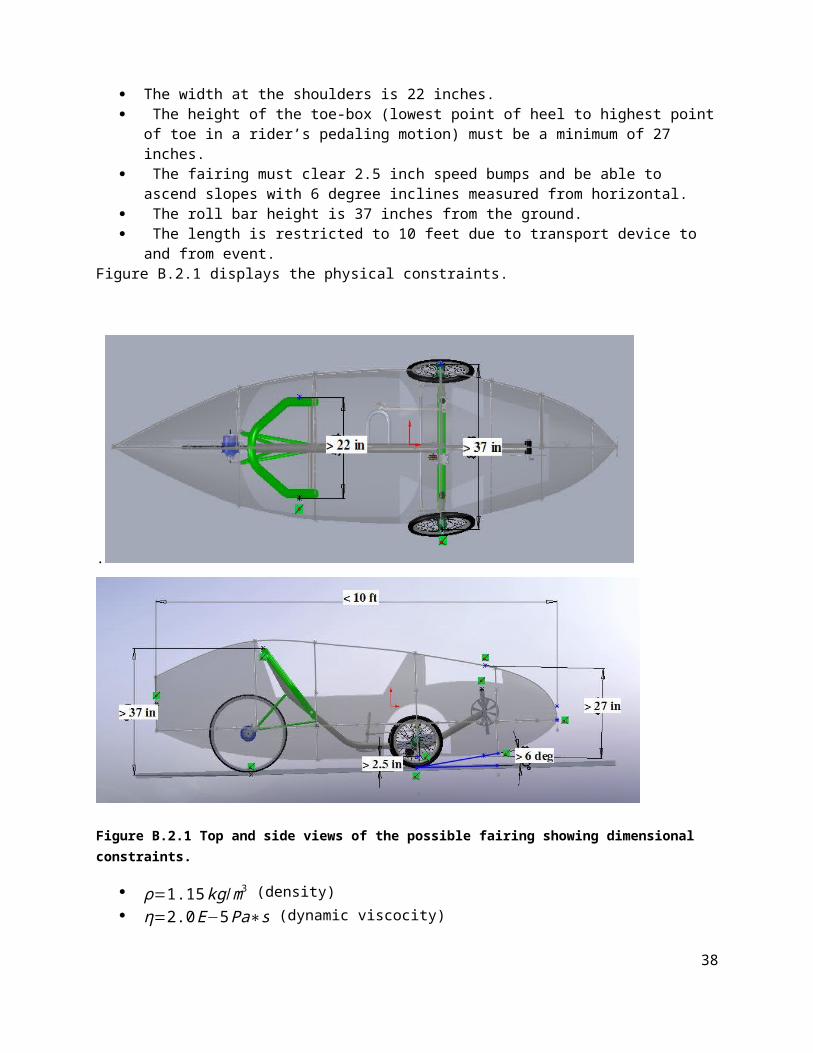
Table B.6.1 Sample data from speed and acceleration analysis.
Torque rear wheel (ft-lb)
Force at rear wheel (lb)
Total Force (lb)
Drag force (lb)
Acceleration (ft/s^s)
Velocity (drag-ft/s
)
Velocity (ft/s)
Velocity (mph)
(Gear 1)46.83 46.37 46.34 0.031 7.46 5.22 5.22 3.56
20.81 20.61 20.54 0.065 3.31 7.54 7.54 5.14
13.88 13.74 13.65 0.094 2.20 9.08 9.08 6.19
11.89 11.78 11.65 0.123 1.88 10.39 10.39 7.08
11.10 10.99 10.84 0.153 1.74 11.61 11.61 7.92
10.74 10.64 10.45 0.186 1.68 12.79 12.79 8.72
10.57 10.47 10.25 0.221 1.65 13.94 13.94 9.51
10.49 10.39 10.13 0.259 1.63 15.08 15.08 10.28
10.45 10.34 10.05 0.299 1.62 16.22 16.22 11.06
9.86 9.76 9.42 0.340 1.52 17.28 17.28 11.78
(Gear 2) 16.19 16.03 15.61 0.412 2.51 19.04 19.04 12.98
11.13 11.02 10.55 0.465 1.70 20.23 20.23 13.79
9.74 9.65 9.13 0.514 1.47 21.26 21.26 14.49
9.22 9.13 8.57 0.562 1.38 22.22 22.22 15.15
9.00 8.91 8.30 0.610 1.34 23.16 23.16 15.79
8.52 8.43 7.78 0.657 1.25 24.03 24.03 16.39
(Gear 3) 13.98 13.85 13.11 0.740 2.11 25.51 25.51 17.39
9.61 9.52 8.72 0.799 1.40 26.49 26.49 18.06
8.42 8.34 7.48 0.850 1.21 27.34 27.34 18.64
7.97 7.89 6.99 0.900 1.13 28.13 28.13 19.18
7.78 7.70 6.75 0.949 1.09 28.89 28.89 19.69
7.36 7.29 6.29 0.996 1.01 29.60 29.60 20.18
Red = iterative columns
38
Appendix C - Product Design Specifications
The following product design specifications were used as targets to help focus the design and set design priorities.
Priorities: High = Medium = Low = Priority Requirement Customer Metric Target Target Basis Verification
Performance Top speed ASME team ft/s >51.3 Numerical Model Physical testing Drag race Time ASME team s <60 Competition research Drag Race Weight (total) ASME team lbs <40 Acceleration Physical testing Aerodynamic Device ASME team Pass/fail pass 2010 HPVC rules Design Analysis Turning Radius ASME ft <25 2010 HPVC rules Physical testing Steering Accuracy ASME degrees/100 ft 0 2010 HPVC rules Physical testing Frame Deflection ASME team in <0.5 Efficiency Design Analysis Braking ASME ft, stopping from 15mph <20 2010 HPVC rules Physical testing Drive Train Geo. ASME team degrees <25 Efficiency Design Analysis
Safety Visibility (horizontal) ASME degrees >180 2010 HPVC rules Design analysis RPS top load* ASME PSI/in <Yield/2 2010 HPVC rules Design analysis RPS side load* ASME PSI/in <Yield/1 2010 HPVC rules Design analysis Free from sharp edges ASME Pass/fail pass 2010 HPVC rules Physical testing Restraint Harness ASME pass/fail pass 2010 HPVC rules Physical testing Frame Strength ASME team Factor of Safety >1.5 Student Engineers Design analysis Visibility (vertical) ASME degrees >60 2010 HPVC rules Design analysis Steering Limiters ASME team Pass/fail pass Controllability Physical testing
Cost Budget Limitations ASME team dollar <3113 PSU available dollars Accounting
39
Ergonomics Entry and Exit ASME team s <20 Competition Physical Testing Temperature ASME team ˚C Ambient +5˚ Rider preference Design analysis Rider Position ASME team degrees 135+/-5 Efficiency Physical Testing Rider Comfort (padding) ASME team in >1 Rider preference Physical Testing
Documents PDS PSU ME Dept deadline 8-Feb Class syllabus Submittal Progress Report PSU ME Dept deadline 8-Mar Class syllabus Submittal Final Report PSU ME Dept deadline June Class syllabus Submittal 2010 HPVC Report ASME deadline 19-Mar 2010 HPVC rules Submittal
Materials Structure ASME team yes/no yes Ease of use Design analysis Drive train ASME team yes/no yes Ease of use Design analysis Aesthetics ASME team points 10 Competition Judges
Maintenance Reliability ASME team chain drops 0 Competition Physical testing Life in Service ASME team years 1 HPV Market Design analysis Tool Requirements ASME team common bike tool sizes 100% Ease of use Market requirements Replacement Components ASME team Bike parts, percentage 100% Commercial Market Retail
40
Appendix D – Bill of Materials
Component Cost ($) Quantity General DescriptionFrame 115 1 misc Aluminum tube (see drawings)Seat 100 1 Custom seat
Rear Wheel 23.95 1 1 pc Alex DA22 rims 650cCrank/BB 250.95 1 SRAM Force crank 172.5mm arms 53-39
Pedals 100 2 Shimano SPD style pedals Brakes 231.96 2 Avid Elixir R rear brakes, 160mm rotor
Cam Handle 25.4 1 Quick release cam handle, seat hardwareBall Joint (Steering) 119.2 2 High Misalignment Ball Joint Rod End Rh, 3/8"-24
MaleBall Joint (Steering) 40.88 2 Stainless Steel Metric Ball Joint Rod End M5 X 0.8
Rh Male Shank,BB Shell NA 1 1 pc already existed - 6061 Alum
Chain 156.75 3 SRAM PC-991 HOLLOW PIN 9SP CHAINSpokes 166.38 3 Spokes for 2 front wheels and 1 rear wheel
Brass nipples 24.22 1 100 pc box of black brass nipplesHubs 340 2 Chris king 20mm downhill hubs
Headset 43.96 2 FSA pig headset 1 1/8" Headset Spacers 19.96 2 Sette Carbon spacers (multi pack)Rear Dropouts 39 2 Rear dropouts compatible with the Rohloff hub
Steering Support/Handle 99.79 1 Misc aluminum parts steering (see drawings)Stays and Head Tube 273.37 1 Aluminum plate and 2" solid stock bar, 6061
Coventry Cycles 76 1 Misc items: seat supports, seat pad, pinsIdler/Idler Clamp 45.05 1 Front chain Idler and clamp
20 mm Axles 40 2 20 mm Marzochii thru axle Tires, Tubes, and Rim
tape 104.48 1 General bike components1/4-20 Hex Head
Nuts/Bolts NA 1 1 box fasteners5/16-32 Hex Head
Nuts/Bolts NA 1 1 box fastenersm5 x .8 Hex Head
Nuts/Bolts NA 1 1 box fastenersm6 x 1.0 Hex Head
Nuts/Bolts NA 1 1 box fastenersWindwrap GX Faring 224 1 Wind wrap fairing + hardware
Total Cost 2660.3
Custom ComponentsRear Panier Rack 100 1 Custom TCB Rack
Front Cross Tube Clamp NA 2 See DrawingsRear Stay Suppot NA 2 See drawings
Seat Support NA 1 See DrawingsControl Arms NA 2 See drawings
Joystick NA 1 1 x .065 6061 Aluminum 1.5ft
41
Brake Mount NA 1 See DrawingsRear Hub Sliders NA 2 See Drawings
Appendix E – Assembly and Part Drawings
This appendix provides some sample drawings of vehicle components as well as the bill of materials from the final design.
42