Embed Size (px)
Citation preview
Kosovo: A Future of Green Transport and Clean Air
Abbreviations
AC Air ConditioningADB Asian Development BankASI Avoid – Shift - ImproveBAU Business as UsualBC Black CarbonBEB Battery Electric BusBRT Bus Rapid TransitCAPEX Capital ExpenditureCNG Compressed Natural GasEBRD European Bank for Reconstruction and DevelopmentEOBD European On-Board Diagnostic SystemEU European UnionEV Electric VehicleFCEV Fuel Cell Electric VehicleGDP Gross Domestic ProductGHG Greenhouse GasGWP Global Warming PotentialHDV Heavy Duty VehicleIEA International Energy AgencyIM Inspection/MaintenanceIPCC Inter-Governmental Panel on Climate ChangeLNG Liquefied Natural GasLPG Liquefied Petroleum GasMOF ministry of FinanceNCV Net Calorific ValueNMT Non-Motorized TransportOBD On-Board DiagnosticsOPEX Operational ExpenditurePHEV Plug-in Hybrid Electric VehiclePM Particulate MatterPRC People’s Republic of ChinaSOC State of ChargeSUMP Sustainable Urban Mobility PlanTCO Total Cost of OwnershipTTW Tank-to-WheelULEZ Ultra-Low Emissions ZoneUNFCCC United Nations Framework on Climate Change ConventionWTT Well-to-TankWTW Well-to-Wheel
Final report
2
Acknowledgments
This report was prepared by Jing Xiong, Senior Transport Specialist, for the Technical Assistance (TA) for the Smart Urban Transport Solutions. The World Bank team includes Simon Ellis, Program Leader for Western Balkans, Rhedon Begolli, Senior Energy Specialist, and Yin Qiu, Transport Consultant. The report consolidates the findings and recommendations carried out by Jurg Grutter at Grutter Consulting.
The team would like to acknowledge the timely and valuable support, guidance and advice received from Marco Mantovanelli, Country Manager of Kosovo, and Karla Gonzalez Carvajal, Practice Manage of Europe Transport. Special thanks go to peer reviewers Arturo Ardila Gomez, Lead Transport Economist, Klas Sander, Senior Environmental Economist, and Richard Martin Humphreys, Lead Transport Economist. The team also received support from Diego Garrido Martin, Senior Operations Officer, Mjellma Rrecaj, Program Assistant, and Andoria Indah Purwaningtyas, Program Assistant.
Most importantly, the team would also like to acknowledge the support and contributions from our counterparts in Kosovo: Ministry of Infrastructure and Transport, Ministry of Environment and Spatial Planning, Ministry of Finance, City of Pristina, Pristina bus company Trafiku Urban, the homologation center Eurolab, and Kosovo Electricity Distribution and Supply Company. Finally, the team would like to thank partnership with the European Bank for Reconstruction and Development (EBRD), and International Motor Vehicle Inspection Committee (CITA).
Final report
3
Executive Summary
1. The objective of the report is to support the Government of Kosovo and City of Pristina to develop strategies to reduce emissions and pollutions from the transportation sector. Policies assessed include (i) low-emitting buses, aiming to introduce different options for bus renewals, (ii) vehicle taxes, aiming to influence private vehicle purchasing and renewal decisions, and (iii) in-service vehicle emission inspection, aiming to better manage the existing vehicle fleet. These three areas were chosen to meet government’s requests and fill knowledge gaps, and not to overlap with interventions included in the recently completed EBRD report: Sustainable Urban Mobility Plan (SUMP). The SUMP is comprehensive, analyzing strategies related to improve public transportation, reduce congestion from traffic management, encourage alternative modes of travel e.g. biking and walking, and promote mixed land use planning etc.
2. In 2018, around 340,000 vehicles were registered in Kosovo. The annual average vehicle growth rate is 8.5 percent for the last 6 years. The study estimates that transport is responsible for 1.1 MtCO2 or 10 percent of total Greenhouse Gas (GHG) emissions of the country. The study also estimates that the economic cost of NOx and PM2.5 emissions from vehicles for 2018 is 46 million Euro, of which 15 percent are due to NOx and 85 percent due to PM2.5 emissions. Whilst pollution levels from vehicles will decrease due to gradual introduction of more modern vehicles, the decrease is slow due to usage of old vehicles with an average age of 19 years and the very high share of diesel cars. GHG emissions will likely grow almost in-line with economic growth under a Business as Usual (BAU) scenario.
Low-Emission Buses
3. From an environmental perspective, the study concludes that hybrid buses are currently the optimal solution for Kosovo as they reduce energy usage, emissions and noise by around 25 percent compared to Euro VI diesel units. With the current very high carbon grid factor of Kosovo (1.34 kgCO2/kWh), electric buses result in increased GHG emissions. If electricity produced in Kosovo becomes cleaner, with a carbon factor of at least 30% lower, then electric buses would be the best solution concerning GHG emissions. Regarding local pollutants, electric bus has zero combustion emissions for NOx and PM2.5, while non-combustion related PM2.5 emissions from brake, tire and particle re-suspension should not be ignored.
4. Fast-charged Battery Electric Buses (BEBs) are the option with the lowest total cost of ownership for Pristina. Although their investment is around double of a diesel unit, they can recover this investment due to much lower energy costs. This is due to the prevailing very low electricity prices. With the modernization of the grid it is expected that electricity prices will increase in the near future. Fast-charged BEBs could support up to double the current electricity price before being costlier than diesel buses. However, the electric grid is currently not in a condition to take on high loads which are required with high-powered chargers of 300-400kW for fast-charged BEBs. Therefore, in the short-term hybrid units are more appropriate. Once the grid is stabilized and the carbon grid factor drops electric buses would be the financially and environmentally most attractive option.
5. The largest pollution impact would result from replacing old and small units with large new buses if service quality levels are maintained. One new large diesel Euro VI bus reduces emissions by over 95 percent of PM2.5 and NOx and around 40 percent of GHG compared to operating the same routes
Final report
4
with small diesel units. The largest impact is therefore clearly on replacing the current small units with larger modern buses.
Fiscal Instruments for Promoting Low-Emission Cars
6. The average age of cars in service in Kosovo is nineteen years, ten more years than on average in Western European countries. The average age of imported vehicles in 2018 was 6-7 years with 90 percent of imported vehicles being diesel units. Age is a very relevant criteria especially for diesel cars as older diesel vehicles (Euro 4 and 5) are very dirty and emit far more than Euro 6 units. Gasoline vehicles have overall far lower emissions than diesel units and their emission levels degrade less over time.
7. Old diesel cars have dropped in price as people in Western Europe are switching from these vehicles due to existing or looming driving bans on diesel vehicles. This results in high exports of old
dirty cars to Eastern Europe including Kosovo. In Germany, the largest supplier of used cars to Kosovo, it is expected that 9 million out of 15 million registered diesel cars do not meet the Euro 6 standard and will thus be affected by driving bans.
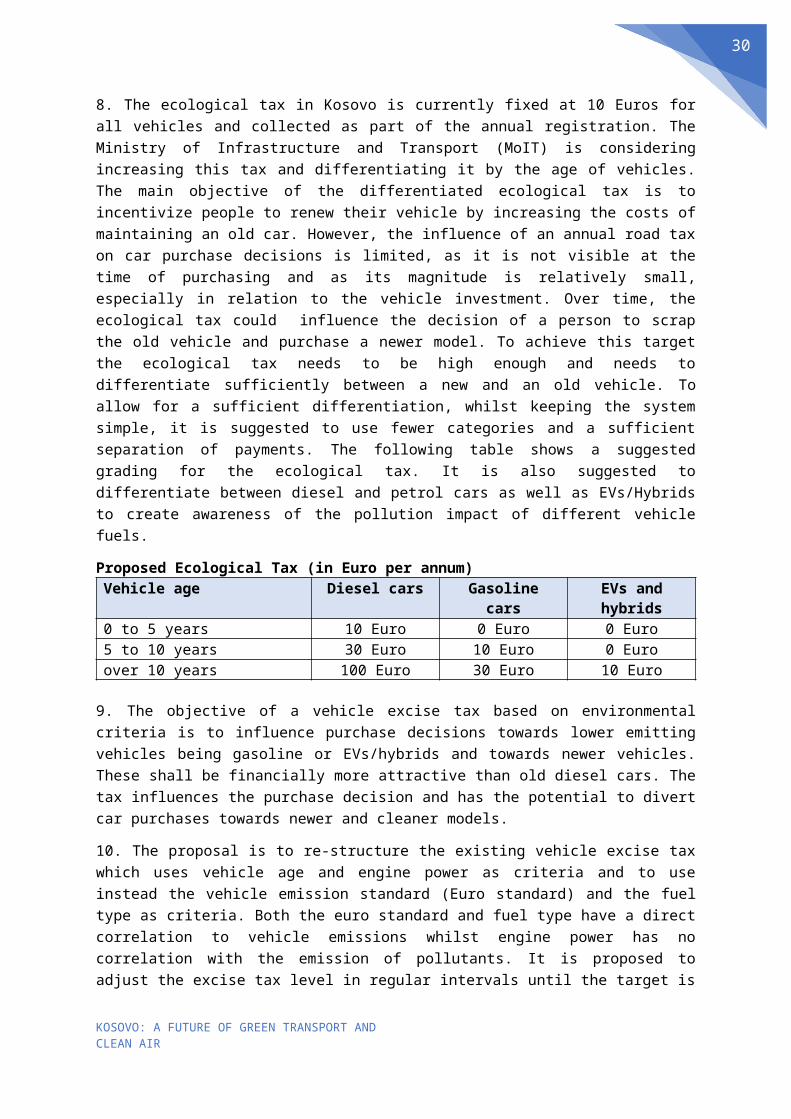
8. The ecological tax in Kosovo is currently fixed at 10 Euros for all vehicles and collected as part of the annual registration. The Ministry of Infrastructure and Transport (MoIT) is considering increasing this tax and differentiating it by the age of vehicles. The main objective of the differentiated ecological tax is to incentivize people to renew their vehicle by increasing the costs of maintaining an old car. However, the influence of an annual road tax on car purchase decisions is limited, as it is not visible at the time of purchasing and as its magnitude is relatively small, especially in relation to the vehicle investment. Over time, the ecological tax could influence the decision of a person to scrap the old vehicle and purchase a newer model. To achieve this target the ecological tax needs to be high enough and needs to differentiate sufficiently between a new and an old vehicle. To allow for a sufficient differentiation, whilst keeping the system simple, it is suggested to use fewer categories and a sufficient separation of payments. The following table shows a suggested grading for the ecological tax. It is also suggested to differentiate between diesel and petrol cars as well as EVs/Hybrids to create awareness of the pollution impact of different vehicle fuels.
Proposed Ecological Tax (in Euro per annum)Vehicle age Diesel cars Gasoline cars EVs and hybrids0 to 5 years 10 Euro 0 Euro 0 Euro5 to 10 years 30 Euro 10 Euro 0 Euroover 10 years 100 Euro 30 Euro 10 Euro
9. The objective of a vehicle excise tax based on environmental criteria is to influence purchase decisions towards lower emitting vehicles being gasoline or EVs/hybrids and towards newer vehicles. These shall be financially more attractive than old diesel cars. The tax influences the purchase decision and has the potential to divert car purchases towards newer and cleaner models.
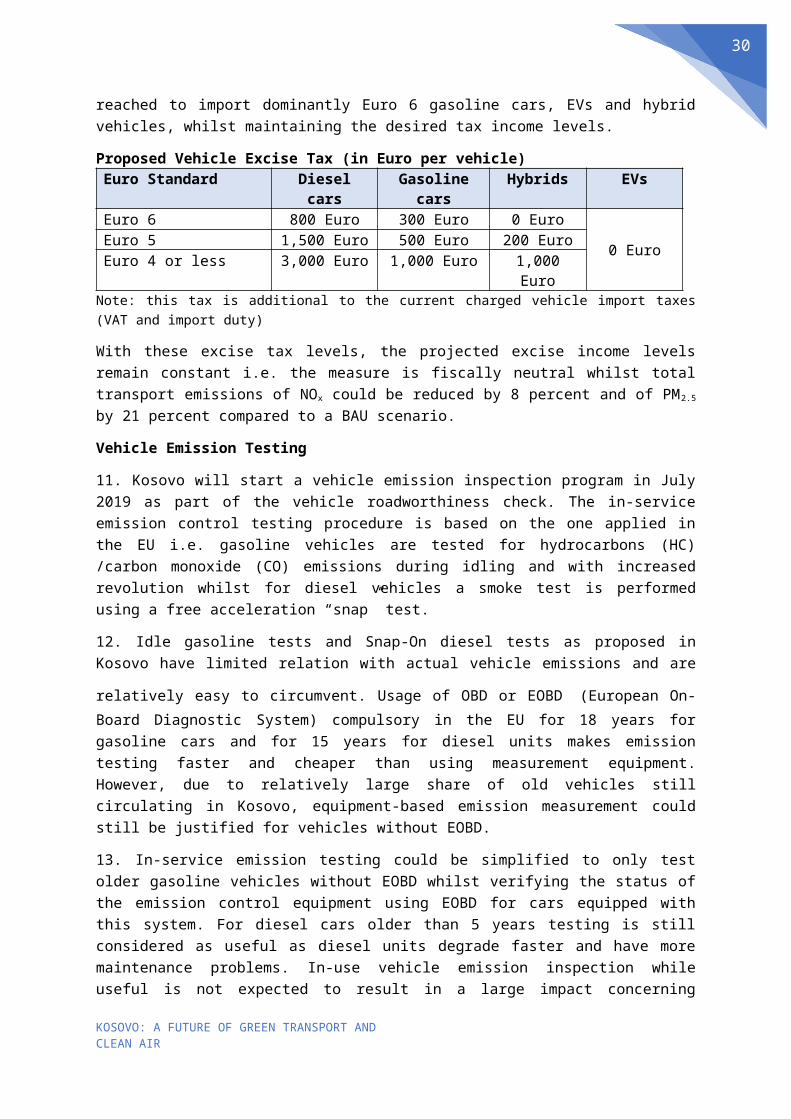
10. The proposal is to re-structure the existing vehicle excise tax which uses vehicle age and engine power as criteria and to use instead the vehicle emission standard (Euro standard) and the fuel type as criteria. Both the euro standard and fuel type have a direct correlation to vehicle emissions whilst engine power has no correlation with the emission of pollutants. It is proposed to adjust the excise tax level in regular intervals until the target is reached to import dominantly Euro 6 gasoline cars, EVs and hybrid vehicles, whilst maintaining the desired tax income levels.
Proposed Vehicle Excise Tax (in Euro per vehicle)
Final report
5
Euro Standard Diesel cars Gasoline cars Hybrids EVsEuro 6 800 Euro 300 Euro 0 Euro
0 EuroEuro 5 1,500 Euro 500 Euro 200 EuroEuro 4 or less 3,000 Euro 1,000 Euro 1,000 Euro
Note: this tax is additional to the current charged vehicle import taxes (VAT and import duty)
With these excise tax levels, the projected excise income levels remain constant i.e. the measure is fiscally neutral whilst total transport emissions of NOx could be reduced by 8 percent and of PM2.5 by 21 percent compared to a BAU scenario.
Vehicle Emission Testing
11. Kosovo will start a vehicle emission inspection program in July 2019 as part of the vehicle roadworthiness check. The in-service emission control testing procedure is based on the one applied in the EU i.e. gasoline vehicles are tested for hydrocarbons (HC) /carbon monoxide (CO) emissions during idling and with increased revolution whilst for diesel vehicles a smoke test is performed using a free acceleration “snap” test.
12. Idle gasoline tests and Snap-On diesel tests as proposed in Kosovo have limited relation with
actual vehicle emissions and are relatively easy to circumvent. Usage of OBD or EOBD (European On-Board Diagnostic System) compulsory in the EU for 18 years for gasoline cars and for 15 years for diesel units makes emission testing faster and cheaper than using measurement equipment. However, due to relatively large share of old vehicles still circulating in Kosovo, equipment-based emission measurement could still be justified for vehicles without EOBD.
13. In-service emission testing could be simplified to only test older gasoline vehicles without EOBD whilst verifying the status of the emission control equipment using EOBD for cars equipped with this system. For diesel cars older than 5 years testing is still considered as useful as diesel units degrade faster and have more maintenance problems. In-use vehicle emission inspection while useful is not expected to result in a large impact concerning emissions as the emission standard to which the vehicle was registered defines its emission level. The focus for reducing vehicle emissions thus should be on the emission standard (type approval standard) of new/imported vehicles, where the emission level of vehicles is defined. This is especially important in light of the very long usage of vehicles in Kosovo.
Final Remarks
14. If the government of Kosovo decides to adopt policy recommendations from this study, particularly related to the restructuring of vehicle tax and vehicle emission inspection, it is highly recommended that a communication plan be developed for the public and stakeholders to explain reasoning behind the changes and their potential impacts. At the same time, government should offer better public transport system and encourage non-motorized modes of travel, to maintain or improve citizen’s level of mobility (i.e. efficiency, cleanness, affordability and equity). It should also be noted that behaviour change, e.g. from purchasing old luxury diesel cars to newer gasoline standard cars is a gradual process and needs not only financial incentives but also a good package of comprehensive measures.
Final report
6
1. Introduction
The Western Balkans is home to the most polluting power plants in Europe, and its transport and energy infrastructure require updates. Not surprisingly, countries such as Kosovo, are suffering from severe urban air pollution and traffic congestion as a result of high dependence on fossil fuels in the energy matrix, inefficient transport system and aging vehicle fleets. These substantially harm public health, productivity and efficiency in urban mobility.
Kosovo is implementing the EU enacted Stabilisation Tracking Mechanism programme, aiming to gradually integrate its national policies on legal, economic and social matters with the EU. On 6 February 2018, the European Commission published its expansion plan to cover up to six Western Balkan countries including Kosovo with potential accession as members of the EU after 2025. This is relevant for vehicle emissions as it entails implementation of EU vehicle emission and fuel standards.
The development objective of this project is to support the government of Kosovo and City of Pristina to develop strategies to reduce emissions and pollutions from transport perspective, such as modernization and better management of public and private vehicle fleets, and to scope for components and activities to be considered as part of potential Develop Policy Financing or Investment Project Financing by the World Bank.
The layout of the report includes the following sections:
Chapter 2 realizes a rapid assessment of vehicle pollution for Kosovo including vehicle emission trends.
Chapter 3 list in a summarized manner major instruments to reduce transportation emissions.
Based on the problem and solution description policies are selected which are assessed in further detail to curb vehicle emissions in Kosovo. These policies or interventions were selected based on on-going plans and activities and interest from the Government. They include usage of low-emission buses (chapter 4), fiscal instruments to promote low-emitting vehicles (chapter 5) and implementation of in-service vehicle emission testing.
2. Rapid Assessment of Vehicle Emissions in Kosovo
In 2018 around 340,000 vehicles were registered in Kosovo.
Table 1: Registered Vehicles in Kosovo, 2018 Vehicle category number of
units%
gasoline%
dieselAverage Euro
standardMedian
yearPassenger cars (M1) 285,5301 23% 76% 3 2000Motorcycles 1,890 100% 0% n.a. 2007Small/medium buses (M2) 730 1% 99% II 2000Standard/large buses (M3) 1,830 0% 100% II 1997Light Commercial Vehicles < 3.5t (N1) 42,930 3% 97% II/III 2001Medium trucks 3.5-12t (N2) 4,720 0% 100% II 1995Large trucks > 12t (N3) 7,990 0% 100% III 1999
Source: Motor Vehicle Information Management System
1 2,400 cars are gasoline/LPG (<1% of fleet)
Final report
7
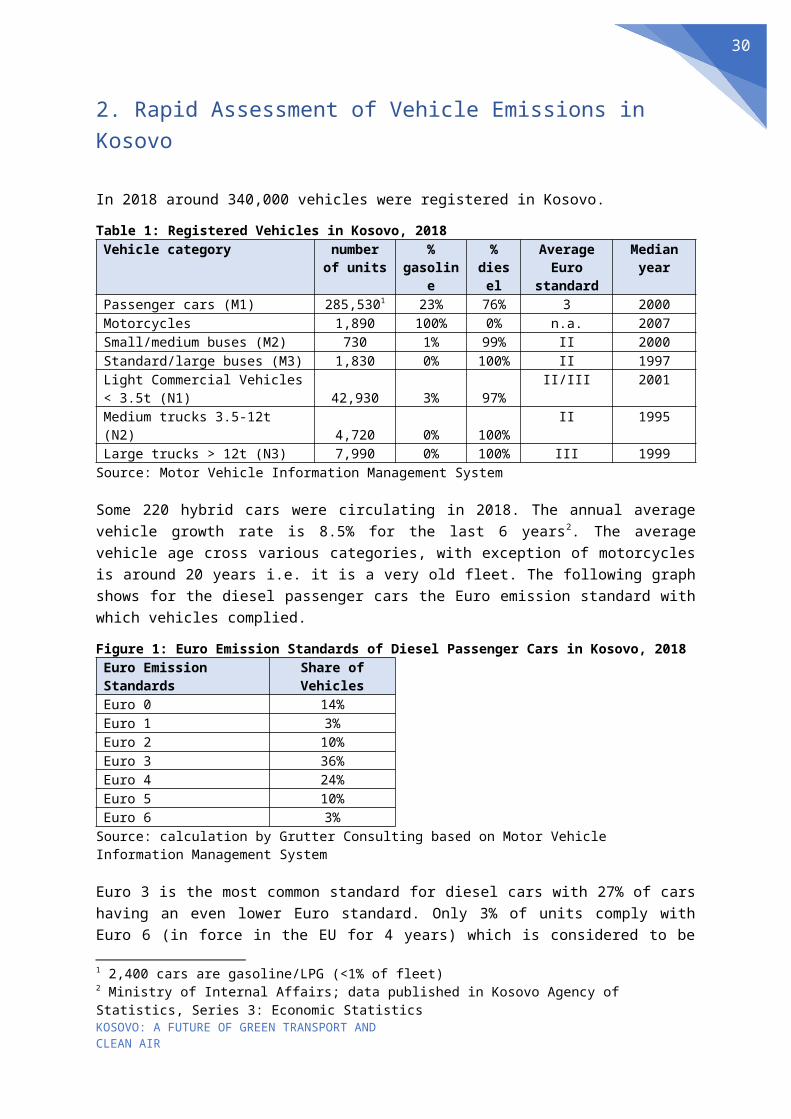
Some 220 hybrid cars were circulating in 2018. The annual average vehicle growth rate is 8.5% for the last 6 years2. The average vehicle age cross various categories, with exception of motorcycles is around 20 years i.e. it is a very old fleet. The following graph shows for the diesel passenger cars the Euro emission standard with which vehicles complied.
Figure 1: Euro Emission Standards of Diesel Passenger Cars in Kosovo, 2018Euro Emission Standards Share of VehiclesEuro 0 14%Euro 1 3%Euro 2 10%Euro 3 36%Euro 4 24%Euro 5 10%Euro 6 3%
Source: calculation by Grutter Consulting based on Motor Vehicle Information Management System
Euro 3 is the most common standard for diesel cars with 27% of cars having an even lower Euro standard. Only 3% of units comply with Euro 6 (in force in the EU for 4 years) which is considered to be relatively low emitting vehicle. Kosovo sells Euro 5 fuels and usage of Euro 6/VI vehicles is thus no issue.
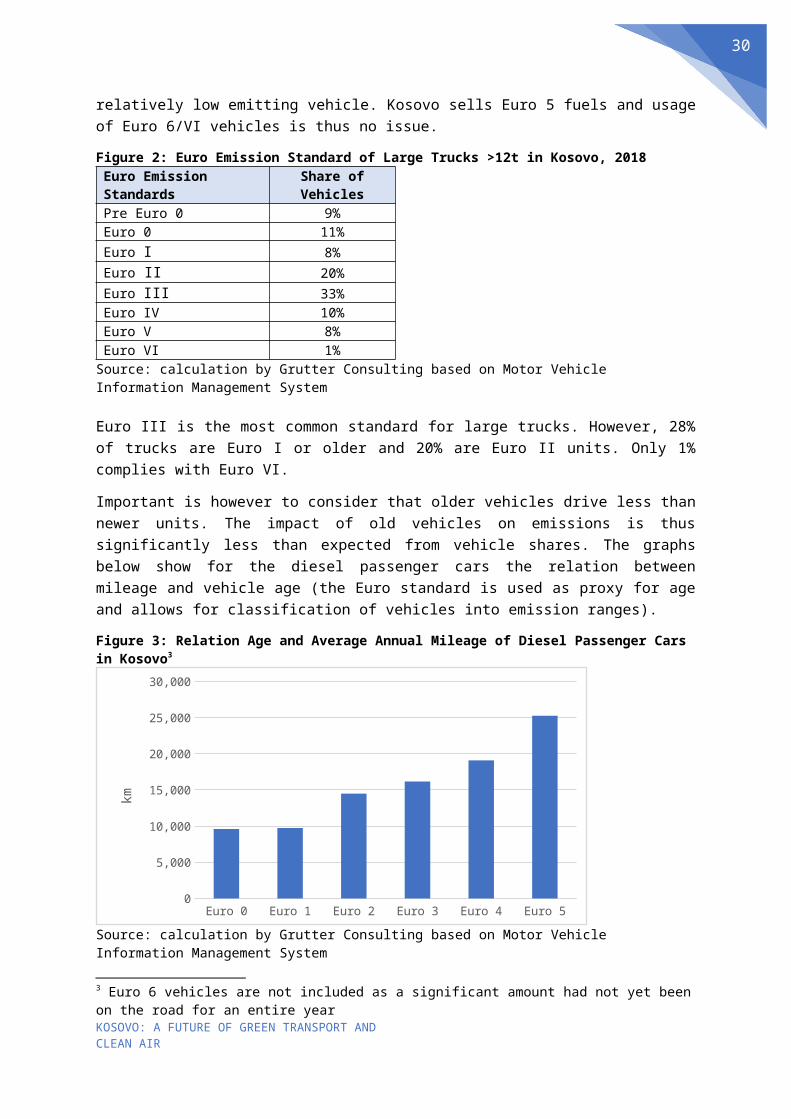
Figure 2: Euro Emission Standard of Large Trucks >12t in Kosovo, 2018Euro Emission Standards Share of VehiclesPre Euro 0 9%Euro 0 11%Euro I 8%Euro II 20%Euro III 33%Euro IV 10%Euro V 8%Euro VI 1%
Source: calculation by Grutter Consulting based on Motor Vehicle Information Management System
Euro III is the most common standard for large trucks. However, 28% of trucks are Euro I or older and 20% are Euro II units. Only 1% complies with Euro VI.
Important is however to consider that older vehicles drive less than newer units. The impact of old vehicles on emissions is thus significantly less than expected from vehicle shares. The graphs below show for the diesel passenger cars the relation between mileage and vehicle age (the Euro standard is used as proxy for age and allows for classification of vehicles into emission ranges).
Figure 3: Relation Age and Average Annual Mileage of Diesel Passenger Cars in Kosovo3
2 Ministry of Internal Affairs; data published in Kosovo Agency of Statistics, Series 3: Economic Statistics3 Euro 6 vehicles are not included as a significant amount had not yet been on the road for an entire year
Final report
8
Euro 0 Euro 1 Euro 2 Euro 3 Euro 4 Euro 50
5,000
10,000
15,000
20,000
25,000
30,000km
Source: calculation by Grutter Consulting based on Motor Vehicle Information Management System
A new diesel car with emission standard Euro 5 has on average a nearly 3 times higher mileage than an old Euro 0 vehicle. The trend of lower mileage with higher age is observed in all countries as new vehicles have lower operational costs, less breakdowns and maintenance problems and are more convenient for users.
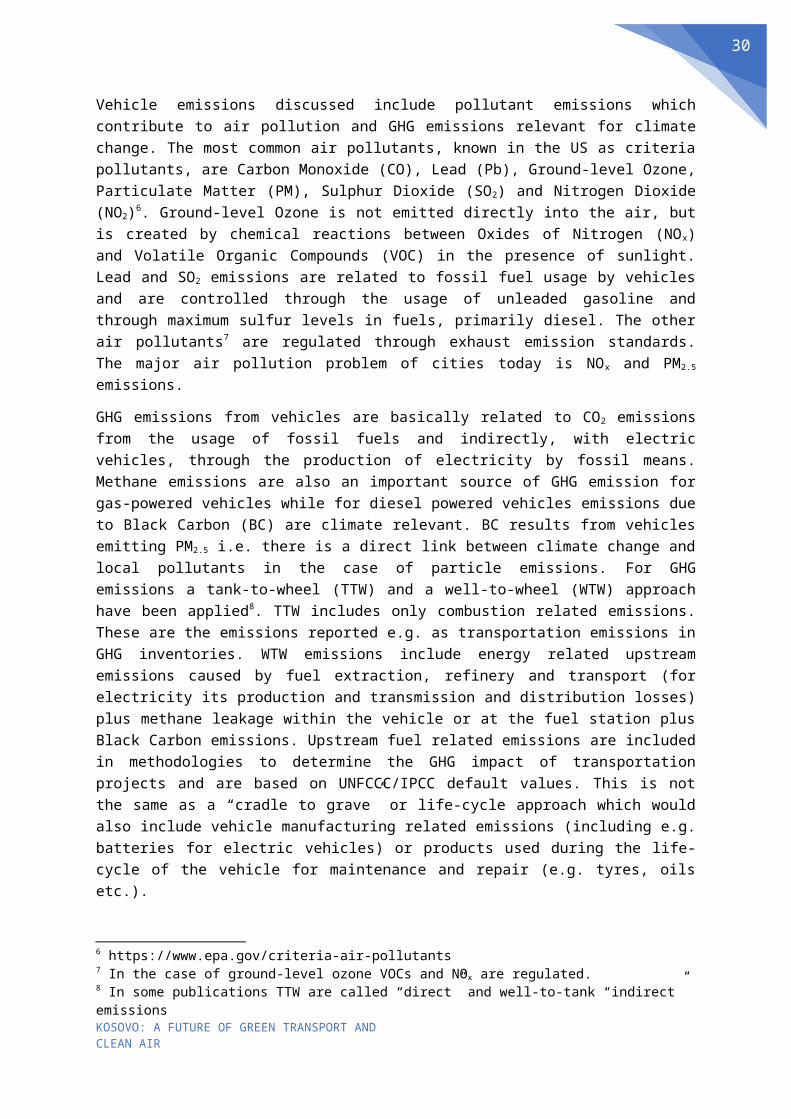
Figure 4: Relation Age and Average Annual Mileage of Large Trucks >12t in Kosovo4
Pre Euro O Euro 0 Euro I Euro II Euro III Euro IV Euro V0
10,000
20,000
30,000
40,000
50,000
60,000
km
Source: calculation by Grutter Consulting based on database vehicle inspection centre for year 2018
A new truck with emission standard Euro V has on average a 5x higher mileage i.e. drives five times the distance compared to an old pre-Euro truck.
Vehicle emissions are therefore significantly lower than expected if mileage per age is considered. It also shows clearly the limitations of vehicle scrapping programs. Replacing an old Euro 0 or Euro 1 passenger car will only result in emission reductions equivalent to the mileage of the old car used. The new car will be used much more and therefore absolute emissions could increase. Scrapping a Euro 0 diesel passenger car and replacing it with a Euro 6 unit of the same size would result, considering the mileage of vehicle categories, in a large decrease of PM2.5 but more than double NOx
and GHG emissions. Scrapping old trucks and replacing them with Euro VI units reduces PM 2.5 and
4 Euro 6 vehicles are not included as a significant amount had not yet been on the road for an entire year
Final report
9
NOx emissions but increases GHG emissions by factor 4 or more5. Scrapping programs thus need to be very carefully designed to not backfire.
Vehicle emissions discussed include pollutant emissions which contribute to air pollution and GHG emissions relevant for climate change. The most common air pollutants, known in the US as criteria pollutants, are Carbon Monoxide (CO), Lead (Pb), Ground-level Ozone, Particulate Matter (PM), Sulphur Dioxide (SO2) and Nitrogen Dioxide (NO2)6. Ground-level Ozone is not emitted directly into the air, but is created by chemical reactions between Oxides of Nitrogen (NO x) and Volatile Organic Compounds (VOC) in the presence of sunlight. Lead and SO2 emissions are related to fossil fuel usage by vehicles and are controlled through the usage of unleaded gasoline and through maximum sulfur levels in fuels, primarily diesel. The other air pollutants7 are regulated through exhaust emission standards. The major air pollution problem of cities today is NOx and PM2.5 emissions.
GHG emissions from vehicles are basically related to CO2 emissions from the usage of fossil fuels and indirectly, with electric vehicles, through the production of electricity by fossil means. Methane emissions are also an important source of GHG emission for gas-powered vehicles while for diesel powered vehicles emissions due to Black Carbon (BC) are climate relevant. BC results from vehicles emitting PM2.5 i.e. there is a direct link between climate change and local pollutants in the case of particle emissions. For GHG emissions a tank-to-wheel (TTW) and a well-to-wheel (WTW) approach have been applied8. TTW includes only combustion related emissions. These are the emissions reported e.g. as transportation emissions in GHG inventories. WTW emissions include energy related upstream emissions caused by fuel extraction, refinery and transport (for electricity its production and transmission and distribution losses) plus methane leakage within the vehicle or at the fuel station plus Black Carbon emissions. Upstream fuel related emissions are included in methodologies to determine the GHG impact of transportation projects and are based on UNFCCC/IPCC default values. This is not the same as a “cradle to grave” or life-cycle approach which would also include vehicle manufacturing related emissions (including e.g. batteries for electric vehicles) or products used during the life-cycle of the vehicle for maintenance and repair (e.g. tyres, oils etc.).
Based on the EU COPERT model (version 2018) the emissions of vehicles are calculated using a TIER 3 approach9. The modelling is based on the mileage per Euro standard for all vehicle categories using an average driving speed of 50km/h except for buses where an average speed of 25km/h was assumed and 50% load factor, 0% gradient for heavy-duty vehicles (HDVs). The following table shows the calculated vehicle emissions for 2018 of Kosovo.
Using this bottom up approach, this study estimates that road transport is responsible for nearly 1.1 MtCO2 in 2018. If assuming the total GHG emissions in 2018 is the same as in 2015 (last officially available year reported by the Ministry of Environment and Spatial Planning, 10 MtCO2 10), the road transport accounts for about 10% of total emissions in Kosovo in 2018. In comparison, the government of Kosovo estimated road transport emissions was at 0.97 MtCO2 in 2013. The World Bank Air Quality Management report estimated, based on the GAINS model, that transport accounts for about 3% of total 21 thousand tons of emissions of PM2.5 (GHG emission was not modelled) in Kosovo in 2015.
5 Even if taking into account black carbon emissions6 https://www.epa.gov/criteria-air-pollutants7 In the case of ground-level ozone VOCs and NOx are regulated.8 In some publications TTW are called “direct” and well-to-tank “indirect” emissions 9 EEA (2018) Air pollutant emission inventory guidebook10 Ministry of Environment and Spatial Planning (2018), Climate Change Strategy 2019-2038; Action Plan on Climate Change 2019-2021
Final report
10
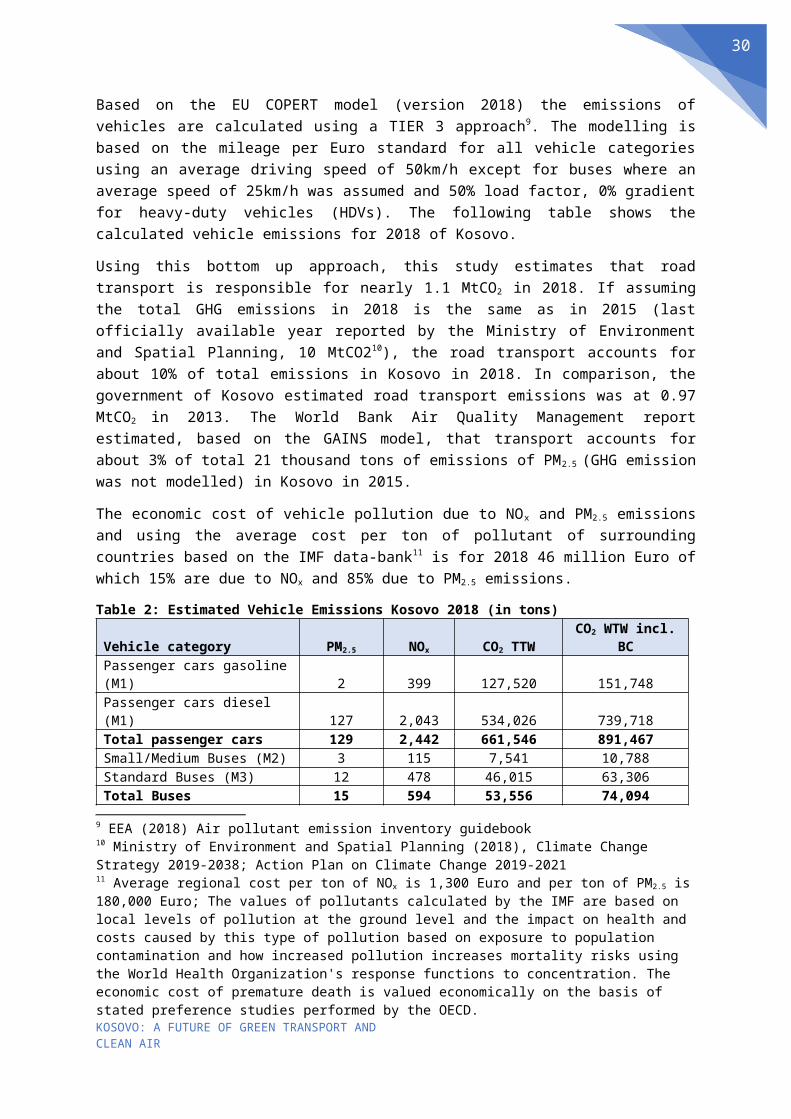
The economic cost of vehicle pollution due to NOx and PM2.5 emissions and using the average cost per ton of pollutant of surrounding countries based on the IMF data-bank11 is for 2018 46 million Euro of which 15% are due to NOx and 85% due to PM2.5 emissions.
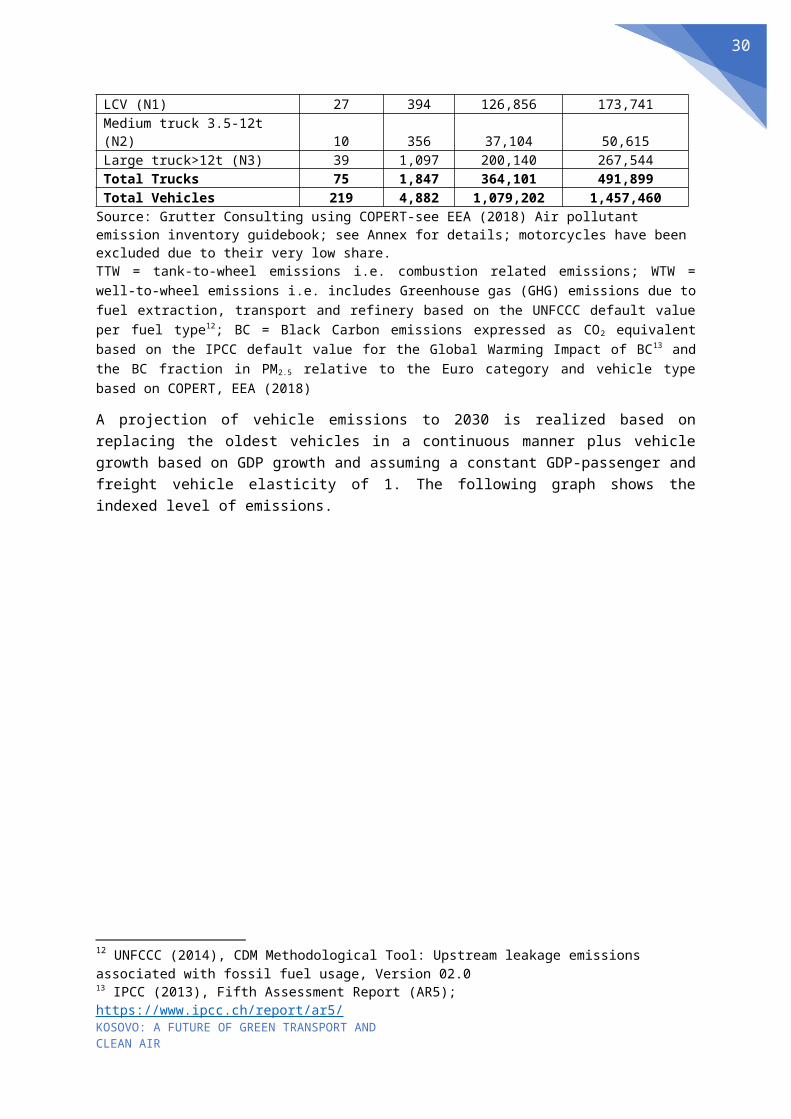
Table 2: Estimated Vehicle Emissions Kosovo 2018 (in tons)Vehicle category PM2.5 NOx CO2 TTW CO2 WTW incl. BCPassenger cars gasoline (M1) 2 399 127,520 151,748Passenger cars diesel (M1) 127 2,043 534,026 739,718Total passenger cars 129 2,442 661,546 891,467Small/Medium Buses (M2) 3 115 7,541 10,788Standard Buses (M3) 12 478 46,015 63,306Total Buses 15 594 53,556 74,094LCV (N1) 27 394 126,856 173,741Medium truck 3.5-12t (N2) 10 356 37,104 50,615Large truck>12t (N3) 39 1,097 200,140 267,544Total Trucks 75 1,847 364,101 491,899Total Vehicles 219 4,882 1,079,202 1,457,460
Source: Grutter Consulting using COPERT-see EEA (2018) Air pollutant emission inventory guidebook; see Annex for details; motorcycles have been excluded due to their very low share.TTW = tank-to-wheel emissions i.e. combustion related emissions; WTW = well-to-wheel emissions i.e. includes Greenhouse gas (GHG) emissions due to fuel extraction, transport and refinery based on the UNFCCC default value per fuel type12; BC = Black Carbon emissions expressed as CO2 equivalent based on the IPCC default value for the Global Warming Impact of BC13 and the BC fraction in PM2.5 relative to the Euro category and vehicle type based on COPERT, EEA (2018)
A projection of vehicle emissions to 2030 is realized based on replacing the oldest vehicles in a continuous manner plus vehicle growth based on GDP growth and assuming a constant GDP-passenger and freight vehicle elasticity of 1. The following graph shows the indexed level of emissions.
11 Average regional cost per ton of NOx is 1,300 Euro and per ton of PM2.5 is 180,000 Euro; The values of pollutants calculated by the IMF are based on local levels of pollution at the ground level and the impact on health and costs caused by this type of pollution based on exposure to population contamination and how increased pollution increases mortality risks using the World Health Organization's response functions to concentration. The economic cost of premature death is valued economically on the basis of stated preference studies performed by the OECD.12 UNFCCC (2014), CDM Methodological Tool: Upstream leakage emissions associated with fossil fuel usage, Version 02.013 IPCC (2013), Fifth Assessment Report (AR5); https://www.ipcc.ch/report/ar5/
Final report
11
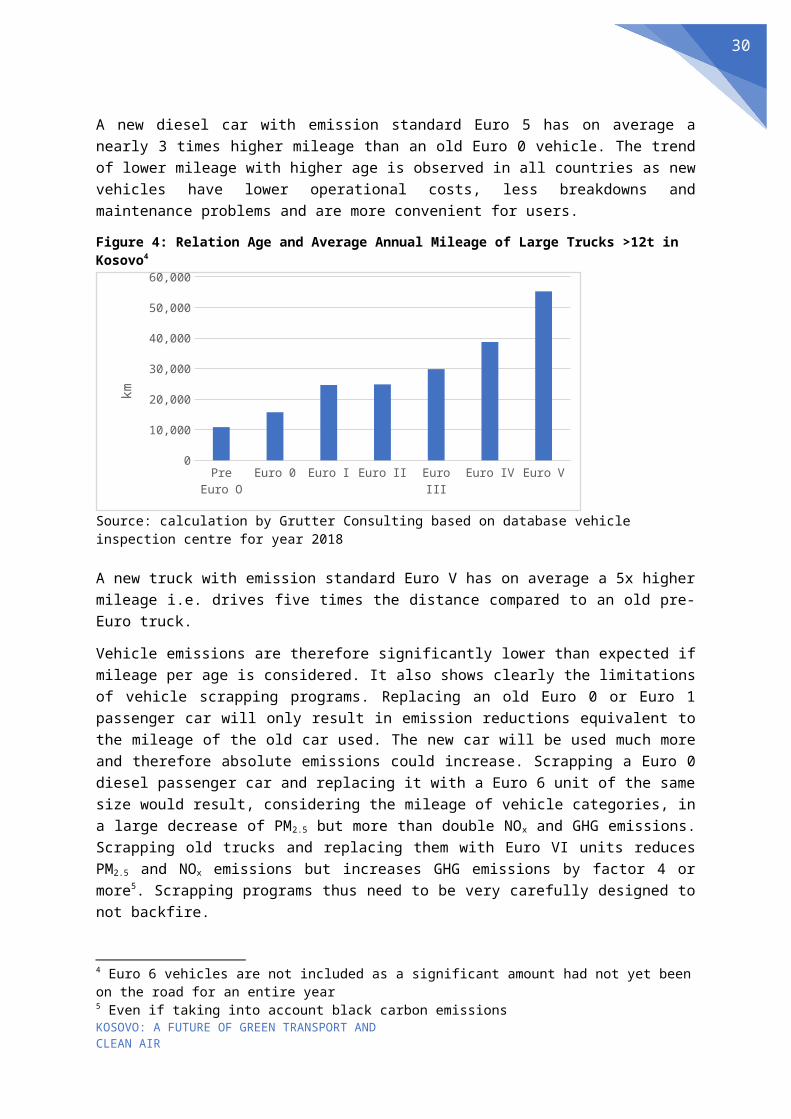
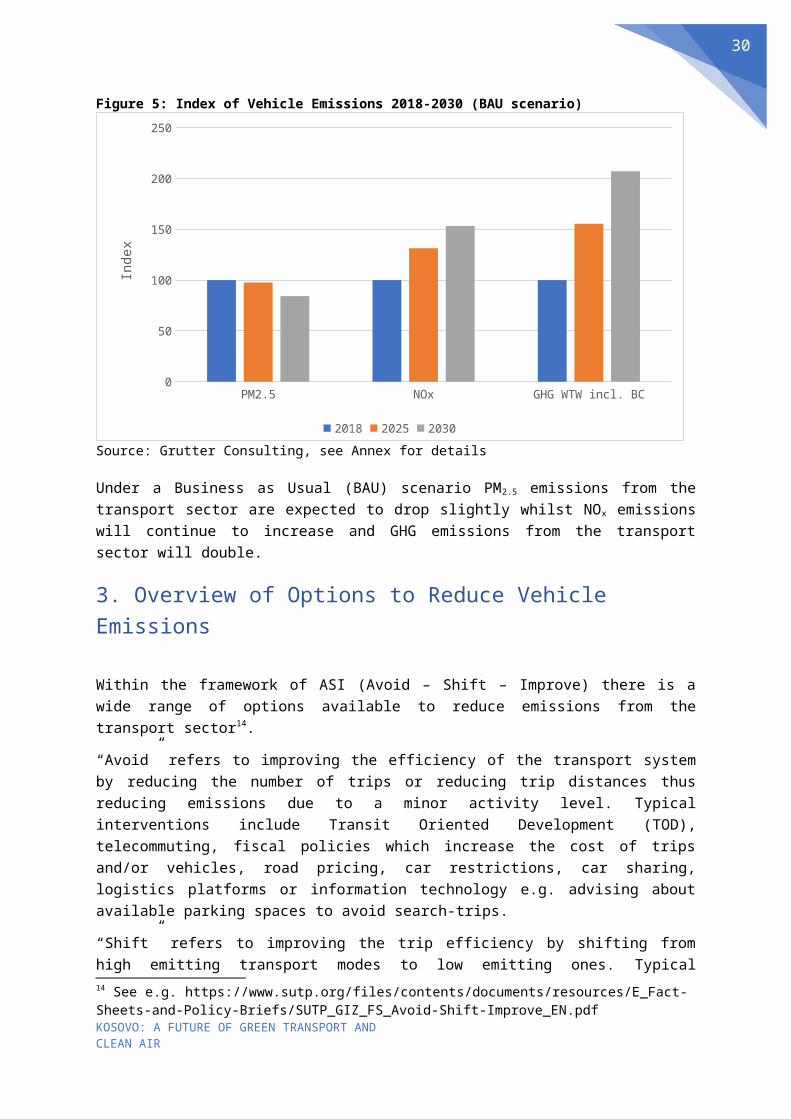
Figure 5: Index of Vehicle Emissions 2018-2030 (BAU scenario)
PM2.5 NOx GHG WTW incl. BC0
50
100
150
200
250
2018 2025 2030
Inde
x
Source: Grutter Consulting, see Annex for details
Under a Business as Usual (BAU) scenario PM2.5 emissions from the transport sector are expected to drop slightly whilst NOx emissions will continue to increase and GHG emissions from the transport sector will double.
3. Overview of Options to Reduce Vehicle Emissions
Within the framework of ASI (Avoid – Shift – Improve) there is a wide range of options available to reduce emissions from the transport sector14.
“Avoid” refers to improving the efficiency of the transport system by reducing the number of trips or reducing trip distances thus reducing emissions due to a minor activity level. Typical interventions include Transit Oriented Development (TOD), telecommuting, fiscal policies which increase the cost of trips and/or vehicles, road pricing, car restrictions, car sharing, logistics platforms or information technology e.g. advising about available parking spaces to avoid search-trips.
“Shift” refers to improving the trip efficiency by shifting from high emitting transport modes to low emitting ones. Typical interventions include fostering of public transport, promotion of Non-Motorized Transport (NMT), transit demand management, rail, shipping and pipeline investments, or fiscal policies such as a charging within a congestion zone thus shifting people to public transport and to NMT.
“Improve” refers to improving the vehicle efficiency reducing emissions per unit of output i.e. increasing the efficiency of the transport mode. Typical interventions include usage of larger trucks thereby reducing emissions per ton-kilometre, hybrid or electric vehicles, low-rolling resistance tyres, Eco Drive, fuel tax policies favouring low-polluting fuels, promotion of biofuels or vehicle emission standards including retrofit of vehicles e.g. with diesel-particle filters.
14 See e.g. https://www.sutp.org/files/contents/documents/resources/E_Fact-Sheets-and-Policy-Briefs/SUTP_GIZ_FS_Avoid-Shift-Improve_EN.pdf
Final report
12
The recently realized Sustainable Urban Mobility Plan (SUMP)15 for Pristina currently under discussion at the Assembly includes various activities which will reduce transport emissions such as a promoting public transport and Non-Motorized Transport (NMT). The modal share of public transport shall thereby be increased from 18% currently to 23% in 2030, whiles the cycling share would remain below 1%.
The main components or intervention areas of the SUMP are:
Establishment of an integrated public transport system, aiming to improve accessibility and connectivity, quality of bus services, new park and ride sites, improved information on public transport services and an integrated ticketing system. A new citywide bus network is proposed with some priority bus routes and the regulation and monitoring of taxi services shall improve.
In the area of NMT conditions for walking and cycling shall be improved, with the provision of safe, accessible and convenient routes. This includes new and improved cycle paths, a pedestrian network development and bike sharing systems.
A range of road network improvement measures to improve traffic flow and address congestion are proposed. Parking management and the development of a parking policy is also a measure included in the plan to introduce demand restraint measures. This includes increasing car park and on street parking charges, development of access restrictions in the city centre, Park & Ride facilities and reducing the availability of long stay parking in the city centre.
Traffic management and road safety measures include the development of a speed management plan, improved junction capacity and safety measures, city access restrictions, and some city logistics measures.
Total investment for short term measures is projected at 70 million Euro in SUMP. In 2019 the City of Pristina is investing 7 million Euro in the implementation focusing on bike lanes, parking regulations and awareness improvement. The EBRD is currently financing a TA for structuring an integrated ticketing and tariff system for public transport. The City is keen on finding finance for assisting in the implementation of the SUMP.
Other areas where Kosovo is planning or implementing concrete policies to reduce transportation emissions are basically within the area of “Improve” in the ASI framework i.e. pursue an improved vehicle efficiency:
Low-emitting buses: 51 Euro VI diesel buses have already been imported with support of the EBRD. Potential exist to replace also other public transport buses. The potential usage of low-emitting buses is assessed in the section 4 of this report.
Tax policies which favour low-emitting passenger vehicles. An initial proposal has been realized for a «green vehicle tax». The potential of such a tax and possible restructuring options is discussed in the section 5 of this report.
Vehicle in-service emission testing integrated in the roadworthiness test. The potential of such testing is discussed in the section 6 of this report.
15 Mott MacDonald (2018), Pristina Sustainable Urban Mobility Plan
Final report
13
4. Low Emitting Buses4.1. Overview Alternative Bus Technologies
Alternative bus technologies discussed are gaseous fuel powered buses, hybrid and plug-in hybrid buses, battery electric buses (slow and fast charged as well as opportunity charged units) and fuel cell / hydrogen powered buses. The following figure shows the trend of new registered alternative fuel buses in the European Union. Compressed Natural Gas (CNG) buses dominated the alternative fuel bus market until 2015 but since then electric units are the leaders with 55% of all alternative fuel buses sold in the EU in the year 2018.
Figure 6: Alternative Fuel New Bus Registrations EU (2008-2018)
Source: https://www.eafo.eu/vehicles-and-fleet/m2-m3# CNG = Compressed Natural Gas; LNG = Liquefied Natural Gas; LPG = Liquefied Petroleum Gas; BEB = Battery Electric Bus; PHEV = Plug-in Hybrid Electric Vehicle; FCEV = Fuel Cell Electric Vehicle
4.2. Gas BusesGas buses use Compressed Natural Gas (CNG), Liquefied Natural Gas (LNG) or Liquefied Petroleum Gas (LPG). Another alternative is the usage of biogas as fuel using as bus a CNG unit.
CNG buses are the most popular of the three versions of gas buses. The technology became popular in many cities basically due to having lower emissions than diesel buses before introduction of the emission standard Euro VI. Compared to Euro VI diesel buses, CNG units have however no longer this advantage and therefore several cities have recently switched again back from CNG to diesel units (e.g. the city of Basel in Switzerland, Bremen in Germany or Helsinki in Finland). This is reflected also in the sales figures of CNG buses in Europe which indicate a strong drop of sales since 2016. CNG buses tend to have higher GHG emissions than diesel Euro VI units if methane slip is included due to around 20% higher energy consumption16. Some countries opt to use CNG due to large gas reserves and therefore low CNG prices making the operation of CNG buses less costly than of diesel units.
16 See e.g. ADB, 2018
Final report
14
Kosovo has no natural gas reserves or pipelines passing the country. Usage of CNG buses is therefore not a practical alternative for Kosovo and not further considered.
LNG buses are used primarily in China and to a lesser extent in the USA. LNG engines are equal to CNG ones, with the only difference being gas storage and gas delivery system to the engine. The biggest advantage of LNG versus CNG buses is that they need a smaller, lighter tank to reach the same operating range as LNG has a higher energy density per volume unit. Otherwise LNG buses have characteristics comparable to CNG units. There are however important differences in the upstream emissions17 of CNG and LNG with LNG buses having higher GHG emissions than CNG or diesel units. LNG buses could theoretically be used in Kosovo as LNG can be transported by truck or rail. However, special fueling stations are required and importing LNG just for few buses makes limited economic sense. This option is therefore not further considered for Kosovo.
LPG buses are no longer used in large commercial bus fleets. Only few cities, including Vienna in Austria, or Guangzhou in PR China, had large fleets of LPG buses. Vienna as well as Guangzhou are replacing LPG buses with other fuel-type buses due to very high energy consumption of buses and lack of manufacturers. This technology option has basically disappeared from the bus market and is thus not further considered.
Biogas buses have been used in various cities and countries and most recently the Green Climate Fund approved a project for usage of biogas buses for the BRT Karachi, Pakistan. Technology-wise biogas buses are CNG units using biogas. Biogas used has the same propensities including energy value as compressed natural gas (“gas sweeting” to >90% methane content) as this is required by the engine producers. Biogas buses have the same pollution emissions as CNG units but have 0-GHG emissions due to usage of biogas. This could be an option for Pristina but would depend on the availability and cost of biogas e.g. from landfills, from waste-food processing units, from farms, or from waste-water treatment plants.
4.3. Hybrid Buses
Types of hybrids include basically series and parallel hybrids as well as “mild” hybrids that use systems such as flywheels to recover braking energy. Fuel efficiency gains in hybrids are basically due to regenerative braking, shutting off the internal combustion engine during idling, and having two sources of onboard power, allowing the engine to operate at near peak efficiency more often. Reduced energy usage results in a proportional reduction of GHG emissions and of local pollutants. In terms of noise emissions, when leaving the bus stop, hybrid buses have approximately 3 decibels less noise compared to a diesel bus.18 Multiple cities in the PR China have been operating thousands of diesel-hybrids as well as gas-hybrids for many years. Large hybrid bus fleets are also operating e.g. in London, New York or Bogota.
Plug-in hybrids have a larger battery than standard hybrids and these can also be charged from an external power source. The key feature of plug-in hybrids is that they have the ability to run in an all-electric mode part of the time. The distance the bus can run on electric mode depends upon the characteristics of the route, the charging frequency, and the energy systems configuration. Plug-in hybrids can potentially reduce emissions by 40-60% and if used within opportunity charge systems even more. In practice however most plug-in hybrid bus fleets operated in the PR China are not re-charged during the day due to having a small battery on-board and the high operational
17 Upstream emissions to which this report refers are extraction, refinery and transport of fuels18 Faltenbacher, 2011
Final report
15
complexity19. If not operated correctly plug-in hybrids thus cost far more than conventional hybrids but offer no additional benefits. This option is therefore not recommended for Kosovo and not further discussed.
4.4. Electric Buses
Electric bus technologies are conventional trolleybuses, hybrid trolleybuses with batteries and an autonomous drive-range without catenary, and three types of Battery Electric Buses (BEBs):
Slow charged BEBs with large battery sets which are charged during the night. Batteries of such buses cannot be fast charged i.e. the battery pack should be sufficient to operate the entire day without re-charging.
Fast charged BEBs can be re-charged from 20-80% of state of charge (SOC) of batteries within 30 minutes or less. Batteries on such buses can receive high-powered charges. Buses are typically charged during the night and once or twice during the day depending on usage.
Opportunity charged BEBs: this is a system of fast or ultra-fast charging of buses either at intermediate bus-stops on the route or at the end of the route. Basically, these are fast charged BEBs with less batteries and with intermediate charging during rest-stops when finishing a turn-around.
Trolleybuses are not considered for Pristina due to lack of catenaries. Establishing overhead wiring is very costly and not a recommended strategy as alternative BEB technologies exist which do not rely on such a costly infrastructure.
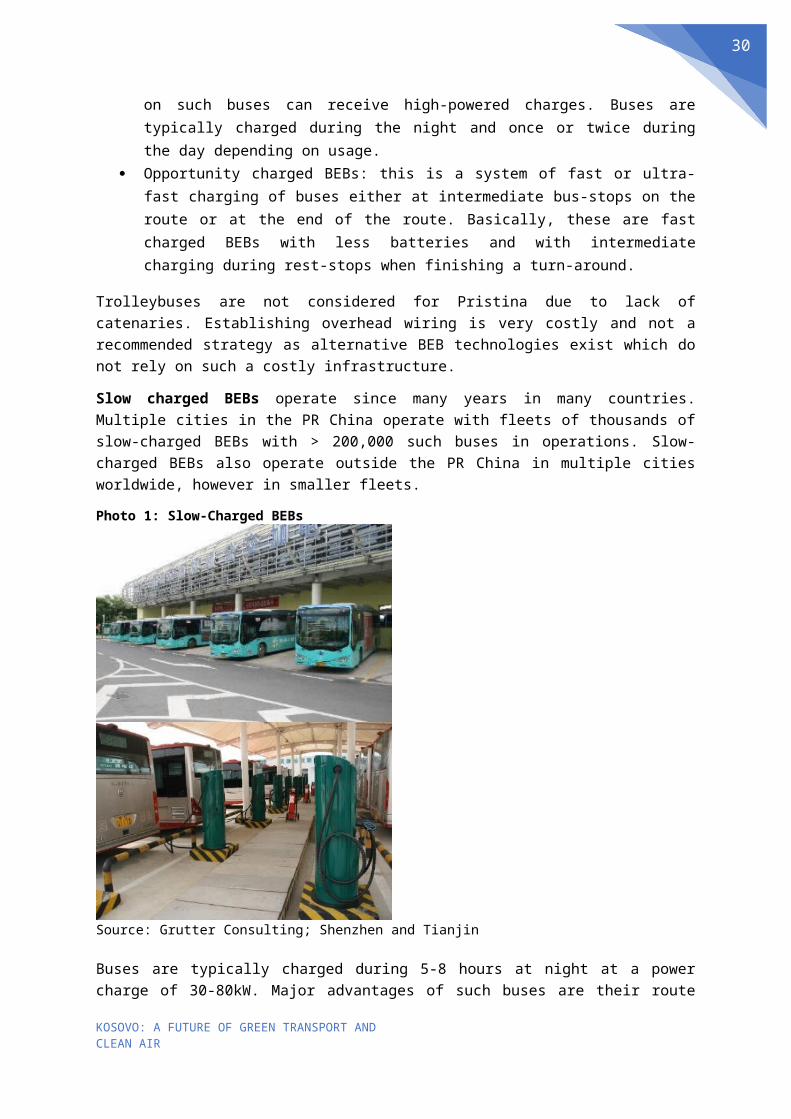
Slow charged BEBs operate since many years in many countries. Multiple cities in the PR China operate with fleets of thousands of slow-charged BEBs with > 200,000 such buses in operations. Slow-charged BEBs also operate outside the PR China in multiple cities worldwide, however in smaller fleets.
Photo 1: Slow-Charged BEBs
Source: Grutter Consulting; Shenzhen and Tianjin
Buses are typically charged during 5-8 hours at night at a power charge of 30-80kW. Major advantages of such buses are their route flexibility, their simple operations and low investment in relatively simple chargers which also do not require lots of additional space as buses are charged at the bus-depot. For the power grid the advantage is that electricity is consumed during the off-peak period at night. The major disadvantages of slow-charged BEBs are a high bus investment cost, a high bus weight due to having a large quantity of batteries on-board, a higher tyre usage of such 19 ADB, 2018
Final report
16
units (due primarily to increased bus weight) and the risk of not being able to comply with the required range and thus not being fully operational. Bus electricity consumption will vary with usage of heating and AC and also depends on traffic conditions, the load factor and the driver. Over the years the battery diminishes its energy retention capacity i.e. the SOC of batteries is originally 100% and then drops to around 80% within 8 years20. This means that the driving range with a full battery will drop slowly. Operators can circumvent this problem by using new units on longer routes and older BEBs for shorter ones. Based on a driving range of around 200km per day, a summer electricity consumption of 1.4kWh/km, a 10-20% SOC reserve ratio and 80% SOC in year 8 a 12m slow-charged BEB should be equipped with a battery set of approximatively 400kWh increasing the bus weight by around 4 tons. To enable full charging during a 6-hour period at night chargers of minimum 60kW are required.
Fast-charged BEBs can be charged with a high power e.g. 300-400kW thus enabling a quick re-charging. 100km of additional range can be charged in 30 minutes or less. This enables the bus to be operated without major range anxiety i.e. if required another partial charge of 15-30 minutes is made during the day. The major advantage of fast-charged BEBs are a smaller battery set thus reducing the bus price tag and weight whilst having flexibility of operations. The disadvantage is the cost of chargers (however only 1 charger is required for 6-10 buses) and locating the charger (e.g. at bus depots or at public sites). Fast charged BEBs have become the most popular BEBs in the PR China as well as in Europe. With daily distances driven of around 200km a fast-charged BEB could be equipped with around 200kWh of batteries with 1 to maximum 2 re-charges of 20-30minutes per day using 300kW chargers. In harsher conditions (longer routes, hotter weather, older bus) 2 re-charges would be required and otherwise one would be sufficient. During the night the bus is charged slowly to 100% whilst during the day the re-charge is typically from 20-80% (the last 20% of charging requires more time).
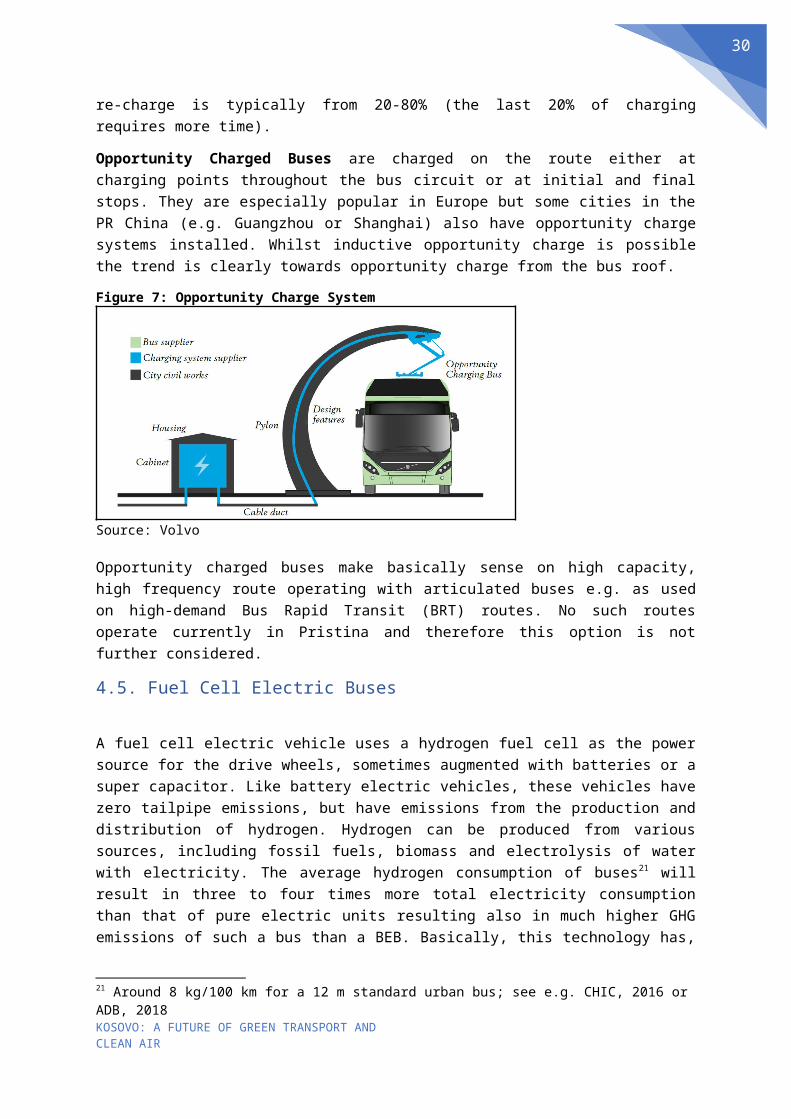
Opportunity Charged Buses are charged on the route either at charging points throughout the bus circuit or at initial and final stops. They are especially popular in Europe but some cities in the PR China (e.g. Guangzhou or Shanghai) also have opportunity charge systems installed. Whilst inductive opportunity charge is possible the trend is clearly towards opportunity charge from the bus roof.
Figure 7: Opportunity Charge System
Source: Volvo
Opportunity charged buses make basically sense on high capacity, high frequency route operating with articulated buses e.g. as used on high-demand Bus Rapid Transit (BRT) routes. No such routes operate currently in Pristina and therefore this option is not further considered.
20 Electric bus manufacturers from the PR China guarantee 80% SOC for 8 years.
Final report
17
4.5. Fuel Cell Electric Buses
A fuel cell electric vehicle uses a hydrogen fuel cell as the power source for the drive wheels, sometimes augmented with batteries or a super capacitor. Like battery electric vehicles, these vehicles have zero tailpipe emissions, but have emissions from the production and distribution of hydrogen. Hydrogen can be produced from various sources, including fossil fuels, biomass and electrolysis of water with electricity. The average hydrogen consumption of buses21 will result in three to four times more total electricity consumption than that of pure electric units resulting also in much higher GHG emissions of such a bus than a BEB. Basically, this technology has, at least for buses, lost out against BEBs and is not further considered.
4.6. Comparison of Bus Technologies
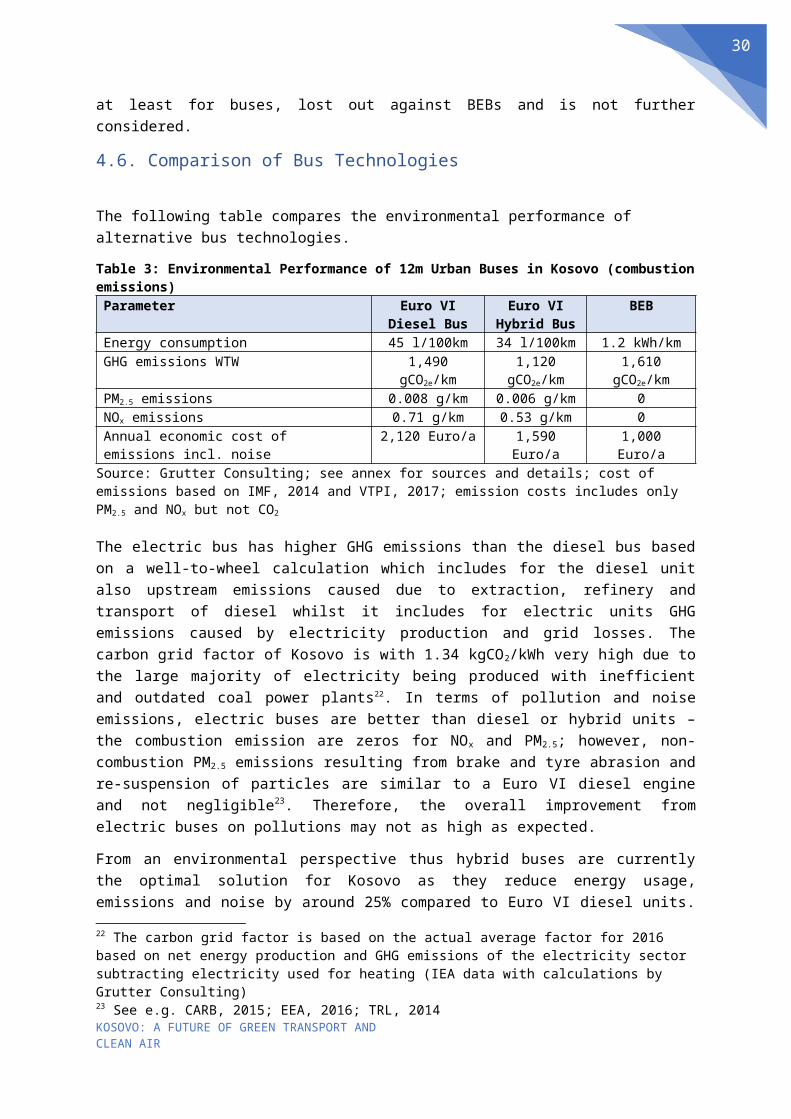
The following table compares the environmental performance of alternative bus technologies.
Table 3: Environmental Performance of 12m Urban Buses in Kosovo (combustion emissions)Parameter Euro VI Diesel
BusEuro VI Hybrid
BusBEB
Energy consumption 45 l/100km 34 l/100km 1.2 kWh/kmGHG emissions WTW 1,490 gCO2e/km 1,120 gCO2e/km 1,610 gCO2e/kmPM2.5 emissions 0.008 g/km 0.006 g/km 0NOx emissions 0.71 g/km 0.53 g/km 0Annual economic cost of emissions incl. noise 2,120 Euro/a 1,590 Euro/a 1,000 Euro/a
Source: Grutter Consulting; see annex for sources and details; cost of emissions based on IMF, 2014 and VTPI, 2017; emission costs includes only PM2.5 and NOx but not CO2
The electric bus has higher GHG emissions than the diesel bus based on a well-to-wheel calculation which includes for the diesel unit also upstream emissions caused due to extraction, refinery and transport of diesel whilst it includes for electric units GHG emissions caused by electricity production and grid losses. The carbon grid factor of Kosovo is with 1.34 kgCO2/kWh very high due to the large majority of electricity being produced with inefficient and outdated coal power plants 22. In terms of pollution and noise emissions, electric buses are better than diesel or hybrid units – the combustion emission are zeros for NOx and PM2.5; however, non-combustion PM2.5 emissions resulting from brake and tyre abrasion and re-suspension of particles are similar to a Euro VI diesel engine and not negligible23. Therefore, the overall improvement from electric buses on pollutions may not as high as expected.
From an environmental perspective thus hybrid buses are currently the optimal solution for Kosovo as they reduce energy usage, emissions and noise by around 25% compared to Euro VI diesel units. With the current very high carbon grid factor electric buses result in increased GHG emissions whilst only having a marginal difference on local pollutants. The grid factor would need to drop by 10% for electric buses to have the same GHG emission level as diesel buses and by 30% to achieve the same emission level as hybrid buses.
The following table compares the financial performance of alternative bus technologies.
21 Around 8 kg/100 km for a 12 m standard urban bus; see e.g. CHIC, 2016 or ADB, 201822 The carbon grid factor is based on the actual average factor for 2016 based on net energy production and GHG emissions of the electricity sector subtracting electricity used for heating (IEA data with calculations by Grutter Consulting)23 See e.g. CARB, 2015; EEA, 2016; TRL, 2014
Final report
18
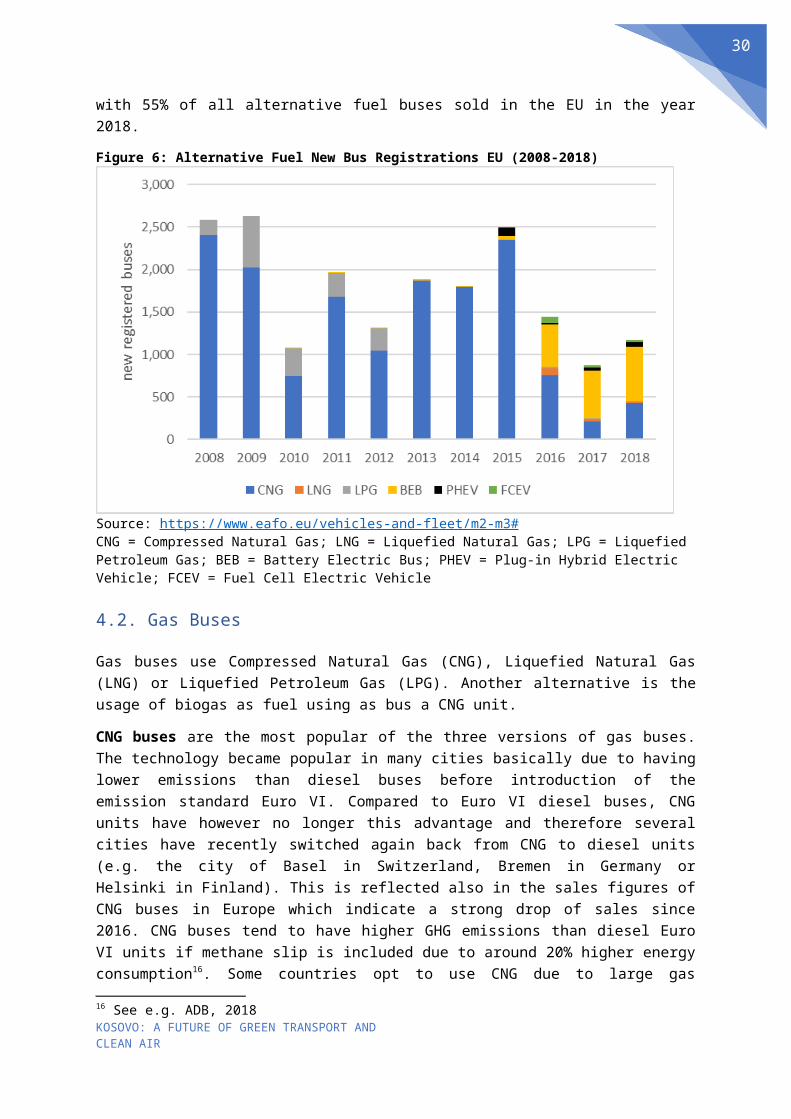
Table 4: Financial Performance of 12m Urban Buses in Pristina (all values in Euro)Parameter Euro VI Diesel
BusEuro VI Hybrid
BusSlow Charged
BEBFast Charged
BEBCAPEX bus24 130,000 175,000 320,000 260,000CAPEX infrastructure for bus25 0 0 8,000 15,000Replacement cost battery in year 8
0 0 58,000 29,000
Energy cost per annum26 25,400 19,100 5,100 6,300Maintenance cost bus per annum27
7,500 7,500 6,000 6,000
Maintenance cost infrastructure per annum
0 0 160 300
OPEX per annum28 32,900 26,600 11,300 12,600TCO per km29 0.50 0.49 0.49 0.43
Source: Grutter Consulting; see annex for sources and details; based on lifespan of 20 years and 50,000km/a;CAPEX = Capital Expenditure; OPEX = Operational Expenditure; TCO = Total Cost of Ownership
Slow and fast charged BEBs have different CAPEX and OPEX costs. Slow charged BEBs have a higher bus investment cost due to having more batteries on-board whilst the charger investment is lower as only a slow-charger is required whilst fast-charged BEBs require a slow charger and a fast charger 30. Battery replacement costs are different between the two bus types due to different sizes of battery packs. Electricity costs are also different as slow-charged buses only consume electricity at night with a relatively low power demand whilst fast charged buses have a higher electricity price as they also consume electricity during peak periods and incur in a higher demand charge.
Fast-charged BEBs are the option with the lowest cost for Pristina. Although their investment is around double of a diesel unit, they can recover this investment due to much lower energy costs. This is due to the very low electricity prices. With the modernization of the grid it is expected that electricity prices will increase strongly in the near future. Even if electricity prices would double, electric buses would still be financially more attractive than diesel units.
4.7. Conclusions and Recommendations
The largest pollution impact would result from replacing old and small buses with large new units (see following figure) under the condition that bus service quality for users does not decline 31 (e.g. no significant decline of frequencies).
24 Based on basic 12m urban bus with AC and low-entry using as comparison primarily Chinese brands such as Yutong, Foton, BYD, Zhongtong and Jinlong which dominate the electric bus market; European manufacturers will have in all bus technologies higher prices with relative price differences between technologies remaining similar to the data presented25 Infrastructure investment per bus for tanking or charging the bus; diesel or hybrid buses use normal fuel stations i.e. the diesel price already incorporates the investment in a petrol station26 Different energy costs for slow and fast-charged BEB due to different electricity prices as charging time and power demand is different for the two bus types27 Only engine maintenance; does not include tires, bodywork repairs etc. which are comparable over different bus technologies28 Includes also maintenance cost of chargers for electric buses29 Includes replacement cost of batteries year 8 and 16 for electric buses 30 6 buses share one fast-charger31 If bus service would decline then a mode shift towards private means of transport would occur which would result in higher emissions.
Final report
19
Figure 8: Relation of Emissions Small Euro II to large Euro VI Diesel Bus
GHG emissions (WTW) PM2.5 emissions NOx emissions0
20
40
60
80
100
120
2 small buses Standard Euro VI bus
Inde
x
Source: based on 2 Euro II mid buses (<15t, 8m) buses replaced with 1 large Euro VI bus (15-18t, 12m); based on COPERT, 2018, Tier 3 with 18km/h speed, 50% load factor and 0% gradient; GHG includes WTW and Black Carbon emissions
One new large diesel Euro VI bus reduces over 95% of PM2.5 and NOx emissions and around 40% of GHG compared to operating with the current medium sized diesel units. Annually per new bus some 4,000 Euro of pollution costs could be avoided. The large impact is therefore clearly on replacing the current small and medium sized units with larger modern buses as longs as service quality levels remain at certain level.
Fast-charged electric buses have a lower TCO than diesel or hybrid units. They also have less local pollution, whilst having currently higher GHG emissions. The main problem currently is that the electric grid is not in conditions to take on high loads which are required with high-powered chargers of 300-400kW for fast-charged BEBs. However, the electric sector in Kosovo is undergoing rapid changes with the oldest power plant being shut down, others being refurbished and new renewable power coming on-line. Also grid losses shall be reduced drastically in the near future whilst the grid is being stabilized. However, the cost of producing electricity will increase which presumably will lead to increasing electricity prices. With a stable grid, fast-charged BEBs would be the technology of choice as pollution levels could be lowered (with a strongly decreasing carbon grid factor this would not go at the expense of increasing GHG emissions) whilst TCOs are, even with increasing electricity prices, potentially lower than those of diesel buses. In the short-term (next 2-3 years) hybrid or diesel units are however, basically due to the instability of the grid i.e. technical reasons, more appropriate. As soon as the gird is more stable electric buses are however considered the best choice in environmental and financial terms.
Summarized hybrid buses are considered to be currently the optimal solution for Kosovo. Once the grid is stabilized and the carbon grid factor drops electric buses would the financially and environmentally most attractive option.
Final report
20
5. Tax Policies Promoting Low Emission Passenger Cars5.1. Current Status
Currently passenger cars of less than 3.5t pay annually a road tax of 90 Euro and an additional ecological flat tax of 10 Euro32. The MOIT is currently proposing an update to this law differentiating the ecological tax based on the age of the vehicle with a range of 0 Euro for new vehicles and a maximum of 75 Euro per annum for very old vehicles and various brackets in-between 33. No differentiation is made between gasoline and diesel vehicles.
Vehicle import duties and excise taxes represent one of the major income sources for the government. Any change of tax structures thus needs to be at minimum fiscally neutral or fiscally positive. Reducing import duties for new or low-emission vehicles thus needs to be compensated with higher duties for other vehicles. Any change of tax structure needs to be approved by the Ministry of Finance but can be proposed by the Ministry of Infrastructure and Transport. Kosovo is a member of the Central European Free Trade Agreement (CEFTA) and the World Customs Organization. Next to VAT and import duty, vehicles are also subject to an additional excise tax.
Kosovo has very unstable requirements for imported vehicles: before 2011, the age limit of second-hand vehicles was 8 years; between 2011 and 2015, the age limit was 13 years; between 2015 and 2018, there was no limit; and after 2018 the age limit is 10 years.
The following graph shows the average age of imported vehicles to Kosovo. 2018 the average age of imported vehicles dropped compared to previous years as a maximum age limit of 10 years was introduced for the import of used vehicles. This age restriction is again under discussion at the Parliament..
Figure 9: Average Age of Imported Cars Kosovo
2014 2015 2016 2017 20180
2
4
6
8
10
12
14
age gasoline cars age diesel cars
aver
age
age
in y
ears
Source: MOF, customs authority
32 Law No 04/L-117 on Road and Ecological Tax for Vehicles, Annex B and C33 The proposal starts with a tax rate of 10 Euro for vehicle 1-5 years old, 25 Euro for vehicles aged 6-10 years and then an additional 10 Euro for every additional 5 years i.e. the maximum tax of 75 Euro is paid for vehicles older than 30 years
Final report
21
Nearly 90% of vehicles imported are diesel cars. This share has been slightly increasing in the last 5 years (see following figure). Average diesel cars have slightly larger engines and higher value (on average 2,000cc in 2018 against 1,400cc for gasoline units) thus also paying on average a higher tax. Vehicles are sourced primarily from Europe, especially Germany.
Figure 10: Number of Imported Cars Kosovo
2014 2015 2016 2017 20180
5,000
10,000
15,000
20,000
25,000
30,000
35,000
Gasoline cars Diesel cars
nu. o
f im
port
ed ca
rs
Source: MOF, customs authority34
5.2. Impact on Emissions
The following table shows the introduction of vehicle emission standards for date of first registration35 in the EU thus indicating what type of vehicles are introduced in Kosovo.
Table 5: Vehicle Emission Standards for Passenger Cars EU (petrol and diesel)Standard Date of 1st RegistrationEuro 3 01/2001Euro 4 01/2006Euro 5 01/2011Euro 6 09/2015
Source: https://www.dieselnet.com/standards/eu/ld.php
Vehicles imported to Kosovo are therefore currently on average Euro 4 and 5 units. The following graph compares NOx and PM2.5 of gasoline and diesel cars for Euro 4, 5 and 6 vehicle emission standards using the European Union emission model COPERT 36.
34 Imports dropped in 2018 relative to 2017 as a new maximum age limit was introduced in 2018 and therefore many persons imported still old used cars end 201735 First registration date is the date of entry into service; this date is one year after the emission standard is applied to new type approvals36 Euro 6 is differentiated for up to 2016, 2017-2019 and from 2020 onwards due to changes of emission regulations and vehicle testing procedures.
Final report
22
Figure 11: Emission Factors Diesel and Gasoline Passenger Cars
Euro 4 Euro 5 Euro 6 Euro 6 from 2018
0
0.1
0.2
0.3
0.4
0.5
0.6
NOx
gasoline diesel
g/km
Euro 4 Euro 5 Euro 6 Euro 6 from 2018
0
0.005
0.01
0.015
0.02
0.025
0.03
PM2.5
gasoline diesel
g/km
Source: calculation based on COPERT, 2018, Tier 3 method, using a speed of 50k/h; medium sized car
Two conclusions can be reached from these figures:
Age is a very relevant criteria for diesel cars, but not so much for gasoline units. Older diesel vehicles (Euro 4 and 5) are very dirty and emit far more than Euro 6 units.
The fuel type is a very relevant criteria for emissions. Gasoline vehicles have overall less emissions than diesel units.
By introducing measures which favour younger vehicles the average imported vehicle would be Euro 5 or 6 instead of Euro 4. Based on the average number of vehicles imported annually in Kosovo, importing Euro 6 instead of Euro 4 diesel cars37, would result by 2025 in a reduction of 82 tons of NOx
and 16 tons of PM2.5.
By introducing measures which favour gasoline versus diesel passenger cars in 2025 nearly 800 tons of NOx and 46 tons of PM2.5 emissions could be avoided (assuming no more import of diesel passenger cars). This represents a reduction compared to the BAU scenario for 2025 of 13% of NO x
and 21% of PM2.5 emissions.
For diesel cars, actual emission values especially of the critical pollutants PM2.5 and NOx are in practice significantly higher than reported values38 due to following factors:
Car manufacturers, not only since VW, do not necessarily comply with standards, and may circumvent the system. The trustworthiness of tests is therefore very limited, even if results are reported by 3rd parties as car manufacturers apply political pressure on weak environmental authorities.
Reports from ICCT as well as others show that under actual driving conditions vehicle emissions are still significantly higher, also of Euro 6 vehicles, than the type-approval values. Average on-road NOx emissions of Euro 6 diesel passenger cars have been reported to be factor 7 higher than type-approval figures with some vehicles emitting factor 25 higher values than reported ones39. Latter is not surprising as for the type approval test normalized
37 Estimated share of 30% of all imported diesel cars based on average age of imported diesel cars in Kosovo.38 See e.g. https://www.trueinitiative.org/39 ICCT, 2016a, Figure 1; see also https://www.theguardian.com/environment/2018/jun/06/impossible-to-
Final report
23
conditions are used with vehicles being conditioned and adjusted in a manner which is very much different from actual road usage (e.g. components are eliminated from the car, no AC is used, special wheels, tyres and fuels are used etc.). The type approval certification also does not capture real-world operating conditions of engines concerning torque and speed. Even with the expected introduction of the RDE (Real Driving Emissions) standard differences of factor 4 are still expected.
With low ambient temperatures emission control devices work with a far lower effectiveness. German investigators found that many car manufacturers have legally installed software which shuts off exhaust treatment systems in cold weather to reduce the risk of condensation building up in catalytic converters. Cold weather has been defined by some producers as temperatures below 190C i.e. most of the time the emission control equipment is shut off40. This reduces the need for expensive urea used as additive for eliminating NOx from exhaust fumes but results in skyrocketing NOx emissions41.
In cold start conditions pollution control devices work far less effectively. This is a prevalent condition in urban areas where driving distances are short and engines operate primarily at cold driving conditions. Cold engine emissions for PM2.5 are e.g. more than factor 3 higher compared to engines operating at high temperatures42.
Controlling and enforcing adequate vehicle maintenance and vehicle inspection programs is far more complex and costly for diesel than for gasoline engines. The snap-on test used for diesel engines has limited reliability and depends basically on how the test is performed. Controls are very easily circumvented and on-road controls are costly and complex. Therefore, inspection programs with diesel vehicles sometime fail.
Vehicle degradation results in significantly higher PM2.5 and NOx emissions of diesel passenger cars and light duty vehicles43. Real world emissions can therefore be factor 4 times or higher with an increasing vehicle age.
cheat-emissions-tests-show-almost-all-new-diesels-still-dirty40 http://www.srf.ch/sendungen/kassensturz-espresso/auto-schweiz-nimmt-im-kassensturz-stellung-zur-diesel-luege41 Walsh, 201742 EEA, 201843 Borken-Kleefeld, 2015
Final report
24
Maintenance of diesel engines is far more critical and complex than of gasoline ones. This results often in far higher actual emissions than if the vehicle would be maintained well. The required emission control devices including Diesel Particle Filters (DPFs) for Euro 6 require regular specialized maintenance. For NO2 reduction most vehicles use an additive. If the DPF is not maintained properly or if the additive is not added to the engine, latter will continue to work and deliver power but the emissions will skyrocket reaching Euro 2 levels. Therefore, actual emissions of Euro 6 vehicles, if badly maintained, can be comparable to Euro 2 engines. Even with a strict enforcement and control system, random roadside checks performed in Santiago have shown that emission control equipment of diesel engines is often not working properly44.
Gasoline vehicles on the other hand show little deterioration of emission control equipment. Whilst anecdotal reference does exist of eliminating pollution control equipment, this is not estimated to be done widespread as this can cause serious engine malfunction, high fuel consumption and power loss, all of which is not in interest of the vehicle owner. Deterioration rates of petrol car emission levels derived from more than 110,000 records collected over the past thirteen years from on-road emission remote sensing in Zürich/Switzerland show that deterioration rates for gasoline vehicles are much lower than assumed so far with no evidence of high emitters45. The deterioration of the emission control systems takes place gradually over the observed lifetime of up to twenty years. No significantly higher frequency or elevated levels of high emission events was found over time, thus ruling out an increased share of vehicles with dysfunctional emission control equipment. The durability of emission controls has much improved in the last 4 decades and even vehicles over 20 years of age rarely have broken emission controls i.e. it can be assumed that the large majority of gasoline cars work without having excessive pollution levels.
Even with best available diesel technologies, the real-world performance of diesel engines results in high PM2.5 and NOx emissions creating air pollution and health problems. This fact is increasingly being recognized worldwide:
A senior EU civil servant has called the EUs diesel-vehicle emissions policy an almost complete failure. He also stated that absolute NOx emissions of diesel vehicles under real driving conditions have hardly changed despite all regulations46.
The government’s Chief Medical Officer of the UK Dame Sally Davies has called for a phase out of diesel vehicles as these cause tens of thousands of deaths each year47.
Oslo banned due to serious air pollution all diesel vehicles on municipal roads during a time of January 2017. This was due to very high levels of smog caused by NO x emissions. The ban was only levied on diesel vehicles and on all Euro categories. Multiple other cities in Europe have issued similar bans for diesel vehicles.
London introduced in April 2019 the Ultra-Low Emissions Zone (ULEZ). All diesel vehicles except Euro 6 units have to pay daily GBP 12.50 to enter the zone, in addition to the congestion zone48.
44 Grütter, 201545 Borken-Kleefeld, 201546 Walsh, 201747 http://www.telegraph.co.uk/news/2016/12/30/diesel-cars-should-phased-stop-pollution-deaths-says-chief-medical/48 https://www.bbc.co.uk/news/uk-england-london-47815117
Final report
25
The National Green Tribunal in India has issued an order in July 2016 to ban more than 10-year-old diesel vehicles in Delhi49.
The Swiss Investment Bank UBS has made the claim that diesel cars will disappear from the global market by 2025 due to pollution problems50.
The US, the largest car market in the world, has less than 3% diesel passenger cars and SUVs51. PR China does not use diesel engines for passenger cars. Bolivia, a country landlocked and with a small vehicle number and in a more precarious economic situation than Kosovo only allows diesel vehicles with engines larger than 4 litres52. Brazil, banned diesel cars in the 70ies 53. It is therefore obvious that there is no technical requirement for using diesel vehicles especially for passenger cars.
Old diesel cars have dropped in prices as people in western Europe are not willing to purchase anymore such vehicles due to existing or looming driving bans. This results in massive exports of old
dirty cars to Eastern Europe including Kosovo54. In Germany, the largest supplier of used cars to Kosovo, it is expected that 9 out of 15 million registered diesel cars do not meet the Euro 6 standard and will thus be affected by driving bans55.
5.3. Proposed Instruments5.3.1. Ecological Tax56
The main objective of the ecological tax is to incentivize people to renew their vehicle by increasing the costs of maintaining an old car. The influence of an annual road tax on car purchase decisions is limited as it is not a visible tax at the time of purchasing the vehicle and as its magnitude is relatively small, especially in relation to the vehicle investment. The ecological tax could potentially influence the decision of a person to scrap the old vehicle. To achieve this target the ecological tax needs to be high enough and needs to differentiate sufficiently between a new and an old vehicle. To allow for a sufficient differentiation whilst keeping the system simple it is suggested to use fewer categories and relate it to the fuel type used to create awareness of the pollution impact of different vehicle models and fuels. The criteria vehicle age instead of Euro vehicle emission standard (which would be more adequate from an environmental perspective) is taken due to simplicity and communicative reasons as people are better aware of the age of their vehicle than an abstract Euro standard. Age brackets proposed are related to the Euro vehicle emission standards (see table 5). The following table shows a suggested grading for the ecological tax.
49 http://indianexpress.com/article/india/india-news-india/ngt-directs-delhi-govt-to-ban-10-yr-old-diesel-vehicles/50 http://www.ibtimes.co.uk/electric-cars-vw-scandal-will-cause-diesel-sales-almost-disappear-159607751 http://www.bbc.co.uk/news/world-us-canada-3432959652 Bolivia produces petrol and gas but must import diesel; this has resulted in diesel prices being equivalent or higher than petrol prices and sometimes limited availability of diesel; customers therefore prefer buying gasoline or CNG vehicles.53 http://www.theicct.org/blogs/staff/brazil-not-ready-for-diesel-cars; the policy is currently under revision due to pressure of the car industry and associated companies operating in Brazil including Bosch “famous” for its active and critical participation in “Dieselgate” see ICCT, 2016b54 See e.g. https://www.independent.co.uk/news/world/politics/diesel-cars-europe-germany-poland-air-pollution-dieselgate-motoring-a8591641.html55 https://www.independent.co.uk/news/business/news/germany-diesel-ban-what-cities-petrol-cars-air-pollution-emissions-a8230861.html56 The terms “ecological tax” and “road tax” are used in accordance with the legislation of Kosovo
Final report
26
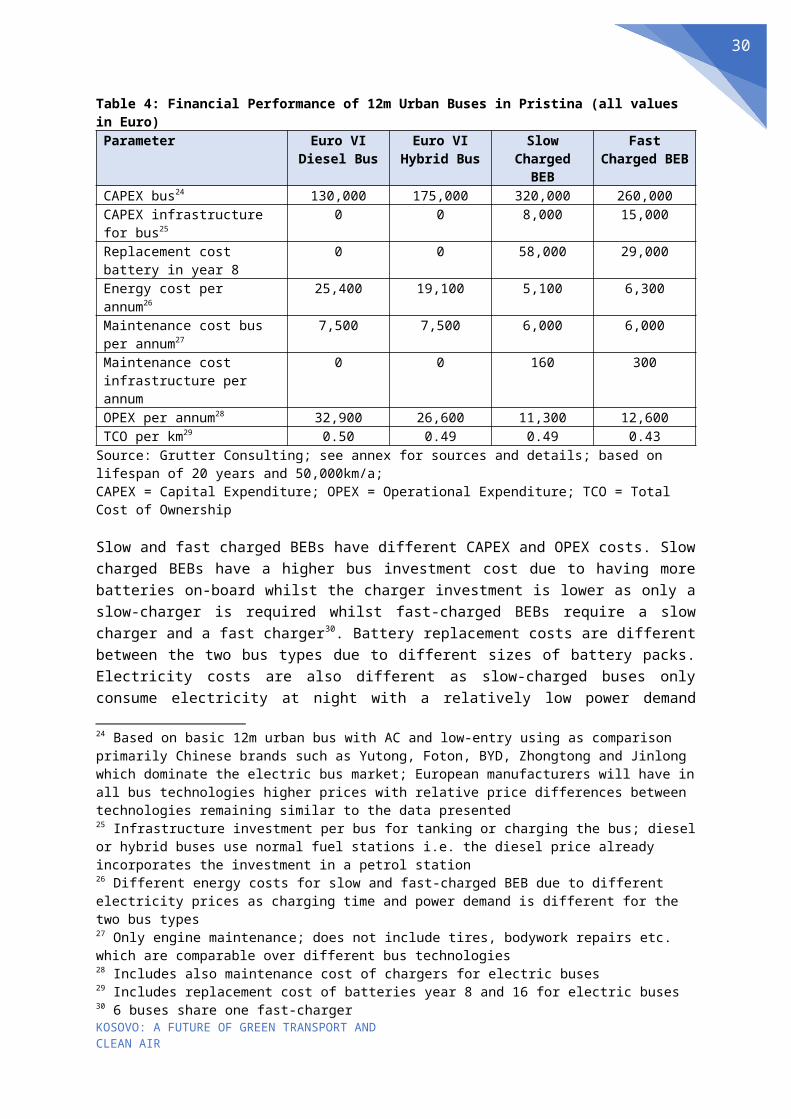
Table 6: Alternative A: Proposed Ecological Tax (in Euro per annum)57
Vehicle age Diesel cars Gasoline cars EVs and hybrids0 to 5 years58 10 Euro 0 Euro 0 Euro5 to 10 years59 30 Euro 10 Euro 0 Euroover 10 years60 100 Euro 30 Euro 10 Euro
The logic for the age groups is derived from over 10 year-old vehicles being basically Euro 4 units which are, especially in the case of diesel cars, highly polluting. If vehicles are less than 10 years old they are primarily Euro 5 units and if they have less than 5 years they are basically Euro 6 vehicles. The logic for differentiating diesel from gasoline vehicles is based on the much lower PM 2.5 and NOx
emission values of gasoline cars. The same argument holds true for reducing the tax level for EVs and hybrids. These pollute less than gasoline cars and warrant thus a reduced tax level. The tax levels chosen are moderate for cars less than 10 years old with a significant increase after 10 years. This jump is justified with the emission levels and shall give an incentive to renovate the vehicle fleet and to import newer units. Gasoline vehicles pay around 1/3 rd of diesel units and EVs and hybrids 1/3rd of gasoline units. Alternatively, also 4 brackets could be used:
Table 7: Alternative B: Proposed Ecological Tax (in Euro per annum)Vehicle age Diesel cars Gasoline cars EVs and hybrids0 to 5 years61 10 Euro 0 Euro 0 Euro5 to 10 years62 30 Euro 10 Euro 0 Euro10 to 15 years63 60 Euro 20 Euro 10 Euroover 15 years64 100 Euro 35 Euro 15 Euro
5.3.2. Vehicle Excise Tax
The current structure of the vehicle excise tax is linked to the vehicle age, fuel used and the engine power. Next to the excise tax an import tax and VAT is also paid. The following table shows average tax levels paid per vehicle in the last 5 years.
Table 8: Importation of Vehicles and Tax Levels, Kosovo, 2014-2018Parameter Gasoline cars Diesel cars
2014 2015 2016 2017 2018 2014 2015 2016 2017 20181. No. of vehicles imported 2,938 2,83
5 3,835 6,164 2,460 14,798 16,371 22,71
7 31,391 18,165
2. Average age in years 9.39 10.0
6 10.17 11.95 5.4 8.95 9.03 9.62 10.92 6.98
3. Average cc 1,605 1,603 1,497 1,614 1,39
6 2,006 1,991 1,964 1,988 1,990
4. Average vehicle value in Euros 3,590 3,73
6 3,655 3,515 7,371 5,577 6,046 5,977 5,566 9,040
5. Average tax paid (sum of the 3 taxes) in Euros
1,870 1,908 1,876 1,875 2,10
3 2,365 2,437 2,493 2,448 2,898
Source: MOF, customs authority57 The absolute levels of the ecological tax are based on the levels proposed by MOIT58 Corresponds basically to Euro 6 vehicle59 Corresponds basically to Euro 5 vehicle60 Corresponds to Euro 4 or earlier emission standard61 Corresponds basically to Euro 6 vehicle62 Corresponds basically to Euro 5 vehicle63 Corresponds basically to Euro 4 vehicle64 Corresponds to Euro 3 or earlier vehicle emission standard
Final report
27
Three aspects are thereby of special interest:
Imported diesel cars are on average older and have a lager engine than gasoline units; The tax paid per diesel car is higher than the average tax paid for a gasoline unit (due to the
vehicle being older and having a larger engine); The average total tax paid has increased for diesel cars, by 22% in the last 5 years.
As shown in the previous chapter the vehicle age is not a very good proxy for vehicle emissions. Whilst emission degradation due to age exists it is less than originally assumed, except for very old cars (>15 years). More relevant is the Euro category of the vehicle (any imported vehicle has a clear declaration of the Euro standard). A Euro 4 vehicle from the year 2006 will not pollute significantly more than a Euro 4 vehicle from 2010. The engine power is also not related directly to emissions of pollutants and is therefore not a very good criteria for the environmental performance of a vehicle. The fuel type used is far more relevant with significant differences between gasoline and diesel units.
The objective of a vehicle excise tax based on environmental criteria is to influence purchase decisions towards lower emitting vehicles being gasoline or EVs/hybrids and towards newer vehicles. These shall be financially more attractive than old diesel cars. The tax influences the purchase decision as it directly results in a higher purchase cost of the vehicle. It therefore has the potential to divert car purchases towards newer and cleaner models.
The proposal is to re-structure the existing vehicle excise tax which currently uses as criteria vehicle age and engine power and escalates depending on the age of the vehicle and the engine power and to use criteria which have a direct correlation to vehicle emissions. The existing excise tax65 shall thus be adapted to account for the environmental impact of the vehicle.
The criteria proposed for the excise tax are therefore the Euro emission standard of the vehicle and fuel type / engine technology used. Both criteria have a direct correlation to vehicle emissions and are simple to control. At the same time new low-emission technologies including hybrid and electric vehicles can be promoted. Hybrid cars reduce emissions and fuel consumption by 20-35% which justifies their promotion. Especially for taxis this would be a useful investment. Old hybrid cars shall not be promoted as their batteries have finished their useful life-span and would need to be replaced. Fostering EVs is justified due to 0-combustion emissions. Also used EVs shall be exempt66.
Establishing ex-ante a “correct” tax level is virtually impossible as the impact depends on factors such as cost of 2nd hand vehicles per fuel type and age category, preferences of clients, price elasticity for 2nd hand cars or substitution elasticity between petrol and gasoline vehicles. The approach proposed is therefore to adjust the excise tax level in regular intervals e.g. every 2 years until the target is reached to basically import dominantly Euro 6 gasoline cars, EVs and hybrid vehicles, whilst maintaining the desired tax income levels67. The higher the share of gasoline or hybrid vehicles becomes, the more the tax level of also these vehicles must be increased (always maintaining the relative difference to the more polluting diesel units) to avoid erosion of tax income. The following table proposes a structure for the excise tax on vehicles based on ecological criteria.
65 The current base excise tax for vehicles is 500 Euro and increase relative to vehicle age and relative to engine power66 Norway is having an increasing number of used EVs67 The average excise tax for gasoline cars paid in 2018 is around 400 Euro (VAT plus custom duty around 1,700 Euro) and 800 Euro for diesel cars (VAT plus customs duty around 2,100 Euro)
Final report
28
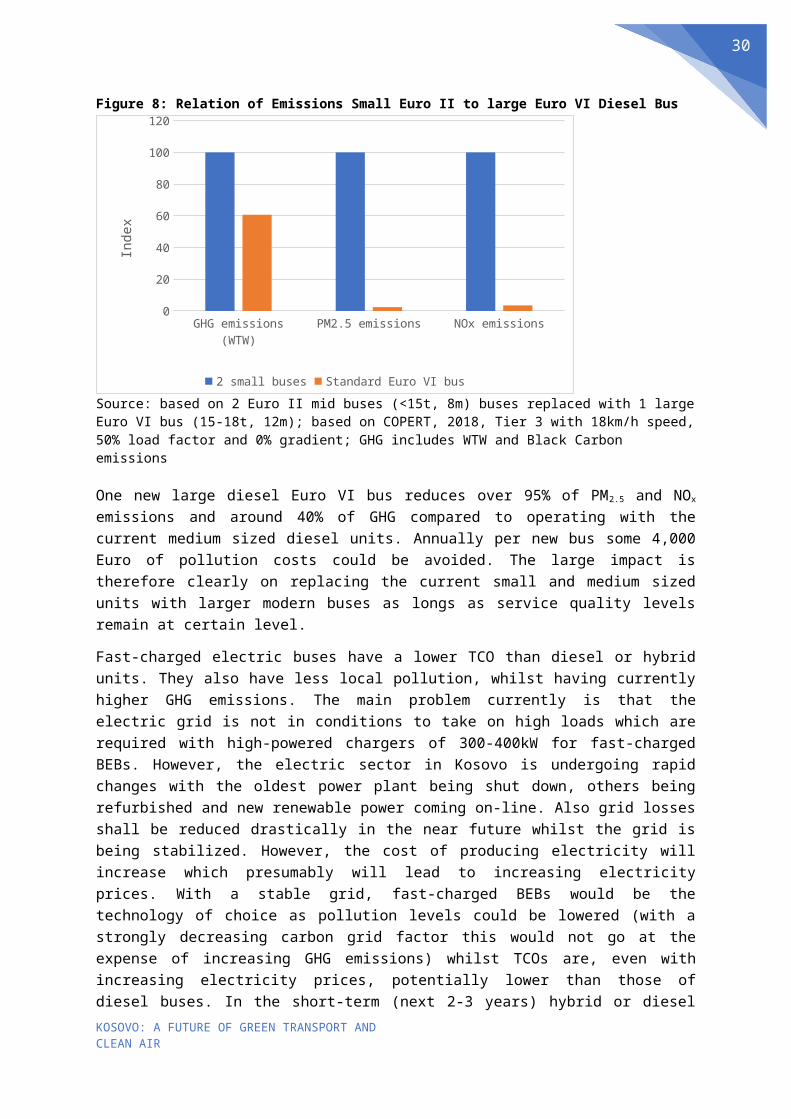
Table 9: Proposed Vehicle Excise Tax (in Euro per vehicle)Euro Standard Diesel cars Gasoline cars Hybrids EVsEuro 6 800 Euro 300 Euro 0 Euro
0 EuroEuro 5 1,500 Euro 500 Euro 200 EuroEuro 4 or less 3,000 Euro 1,000 Euro 1,000 Euro
Note: this tax is additional to the current charged vehicle import taxes
The projected average vehicle to be imported is Euro 5 (based on the average age of imported vehicles in 2018). The average excise tax level for diesel cars was in 2018 around 800 Euro and for gasoline units 400 Euro i.e. a difference of 400 Euro. It is proposed to increase the level for diesel vehicles which would result in less imports of diesel units but a higher level of import of gasoline units. Shifts will also result in the average vehicle value (higher for gasoline cars) which result in changes of VAT and import duty income. The Euro 5 excise tax levels have thus been calculated to achieve a comparable total excise tax income based on 70% gasoline and 30% diesel car imports instead of the 2018 share of 90% diesel cars. Also, a minimum tax difference of 1,000 Euro shall be between the categories to incentivize a move away from diesel vehicles. The following table shows the modelled result of applying the new ecological criteria versus the current criteria. As can be seen the change of criteria is expected to be fiscally neutral.
Table 10: Modelled Financial Result Excise Tax Old/New Criteria for 2018Parameter Current Criteria Ecological CriteriaShare diesel cars 88% 30%Share gasoline cars 12% 65%Share Hybrids 0% 5%Share EVs 0% 0%Income Excise Tax 15.9 million Euro 16.2 million Euro
Source: Grutter Consulting based on vehicle data 2018; 0% EV is assumed as Kosovo to the moment has no EV promotion strategy with EV targets.
The expected environmental impact of such a change is modelled and shown in the following table.
Table 11: Modelled Environmental Impact by 2025 Excise Tax Old/New CriteriaParameter ResultNumber of vehicles affected cumulative by 2025 147,000 passenger carsReduced NOx emissions with New Excise Tax Model 483 tonsReduction NOx levels against BAU transport emissions 2025 8%Reduction PM2.5 emissions with New Excise Tax Model 45 tonsReduction PM2.5 levels against BAU transport emissions 2025 21%
Source: calculation by Grutter Consulting; baseline case Euro 4 vehicle with 88% vehicles diesel (as valid 2018); new case Euro 5 vehicles with 30% diesel units; modelling based on COPERT model, 2018, Tier 3, average speed 50km/h
1/5 of total PM2.5 transport emissions can be reduced and 8% of total NOx emissions.
Fiscal instruments such as adjusting the excise tax could be complemented with non-fiscal instruments which induce residents to use less vehicles and to purchase lower polluting units. One of the most effective instruments in this area is driving restrictions of highly polluting cars. Multiple cities worldwide have started to ban e.g. diesel vehicles or vehicles which do not comply with a minimum emission standard from circulating in urban areas either completely, or during certain times or, as in London, charging a special pollution fee. This results effectively in people favouring cars which are less polluting when purchasing a new vehicle.
Final report
29
5.4. Conclusions and Recommendations
The ecological tax and especially the vehicle excise tax are important instruments which can be used to foster purchase of cleaner vehicles. Concerning the ecological tax, the recommendation is to create only 4 age-classes but differentiate between gasoline, diesel and hybrid/electric cars. Age classes are based on the introduction of Euro standards in the EU. Absolute levels for the ecological tax are in accordance with initial proposals of the government of Kosovo. For the vehicle excise tax, the recommendation is to have as criteria the Euro category of vehicles and the fuel type used differentiating between diesel, gasoline and hybrid/electric vehicles. Absolute levels of excise tax income per vehicle imported are kept constant i.e. the measure is fiscally neutral.
For both taxes the proposed structure is fiscal neutral i.e. the same tax revenue shall be generated as currently per average vehicle. Lower polluting vehicles are taxed less than higher polluting ones but the overall vehicle taxation is the same i.e. there is no subsidy of private cars but people purchasing a low emitting car pay less and people favouring polluting vehicles pay more. The tax levels could be adjusted annually or every two years to reflect changes in consumer preference. The recommended change of tax structure has no negative social repercussions as the average tax paid per vehicle is kept constant i.e. people shall be nudged towards purchasing a gasoline car instead of a diesel unit i.e. they might have a loss of perceived value as their preference could be for a more prestigious and slightly larger diesel car – but at cost of polluting more and thereby harming the health of other people.
6. In-Service Emission Inspection of Vehicles6.1. Assessment of In-Service Emission Inspection Systems Kosovo is rolling out a vehicle emission inspection program as part of the vehicle roadworthiness check in July 2019. The in-service emission control testing procedure is thereby based on the one applied in the EU i.e. gasoline vehicles are tested for CO/HC emissions during idling and with increased revolution (but not on dynamometer using e.g. the IM240 procedure) whilst for diesel vehicles a smoke test is performed using a free acceleration “snap” test68.
Emission controls of in-use vehicles is a policy made to ensure that vehicles remain compliant (within normal degradation levels) with original emission standards for which they were certified. They shall ensure that maintenance is made appropriately and shall identify high emitters to oblige latter to realize the corresponding repairs. Inspection/Maintenance (IM) policies have been enforced in many countries in the past with mixed results. The core elements of more successful programs are:
A comprehensive public awareness program is required to make people aware of benefits of implementing such a program;
Roadside apprehension or remote sensing programs for vehicles which have slipped through the system are important;
Effective enforcement with controls to prevent corruption are required; Quality assurance, covert auditing and quality control are important; The car service industry must have the know-how and equipment to make adequate
repairs; Frequency of controls must be related to vehicle age and usage; It must be ensured that all vehicles participate.
68 See for procedures as used in the EU e.g. DVSA, 2017
Final report
30
The following table lists the main inspection system procedures used.
Table 12: Vehicle Emission Inspection ApproachesVehicle category
Approach Countries applied (examples)
Advantages Disadvantages
Gasoline vehicles
idle and increased revolution test for CO and HC69
EU, China in > 80% of Provinces, India, Korea (rural areas), Japan etc.
Simple, low-cost, fast; can identify partially outlayers & malfunction of catalyst; for CO, reasonable correlation with type-approval test (not for HC); typical cost per vehicle <5 USD; error of commission low i.e. few vehicles fail test which are in fact performing well70
Cannot measure NOx emissions and potential fault of oxygen sensor; No good correlation of HC idle values with loaded type-approval values; only gross approximation of actual emission levels; errors of omissions are significant i.e. vehicles pass test which should not pass it
Loaded test (acceleration simulation mode e.g. IM240)
Korea (urban areas), Mexico, 20% of Chinese Provinces, parts of USA
Good correlation with type-approval test i.e. low error of omission & commission; reflects emission status well
Costly; takes more time; requires trained staff; typical cost per vehicle > 15 USD
Diesel vehicles
Snap idle acceleration (metered smoke test)
EU, Korea, India, China, USA
Low cost with typically < 5-10 USD/vehicle; simple and fast test;
Can result in engine damage; unreliable if not performed well i.e. test results are sensitive to test conduction; correlation with type-approval not good; can be circumvented easily
Loaded test with dynamometer or free-rollers using engine brake
Singapore, Chile71Results are more reliable than with snap acceleration
expensive and difficult to perform; can result in accidents (free roller with engine brakes); typical cost > 50 USD for HDVs and > 25 USD for light vehicles
Sources: authors compilation; see also ICCT, 2015 and ICCT 2013; CAA, 2016
The idle test as well as the snap acceleration tests are the most widely used and are useful as crude indicators for serious engine malfunctions. High smoke emissions are caused often by poor maintenance or by deliberate engine tampering to coax more power out of a diesel engine beyond its rated capacity resulting in over-fuelling and excess smoke emissions.
The reason why inspection systems have been established is the underlying hypothesis that:
Appropriate maintenance is required to maintain the emission system which will otherwise degrade rapidly;
A significant share of vehicles has a malfunction of their system thereby resulting in very high emissions;
69 Control check with the Lambda value70 This was basically an issue in the late 80ies but has been resolved in the meanwhile through vehicle adaptations71 Commercial vehicles; only Santiago; partial load with dynamometer
Final report
31
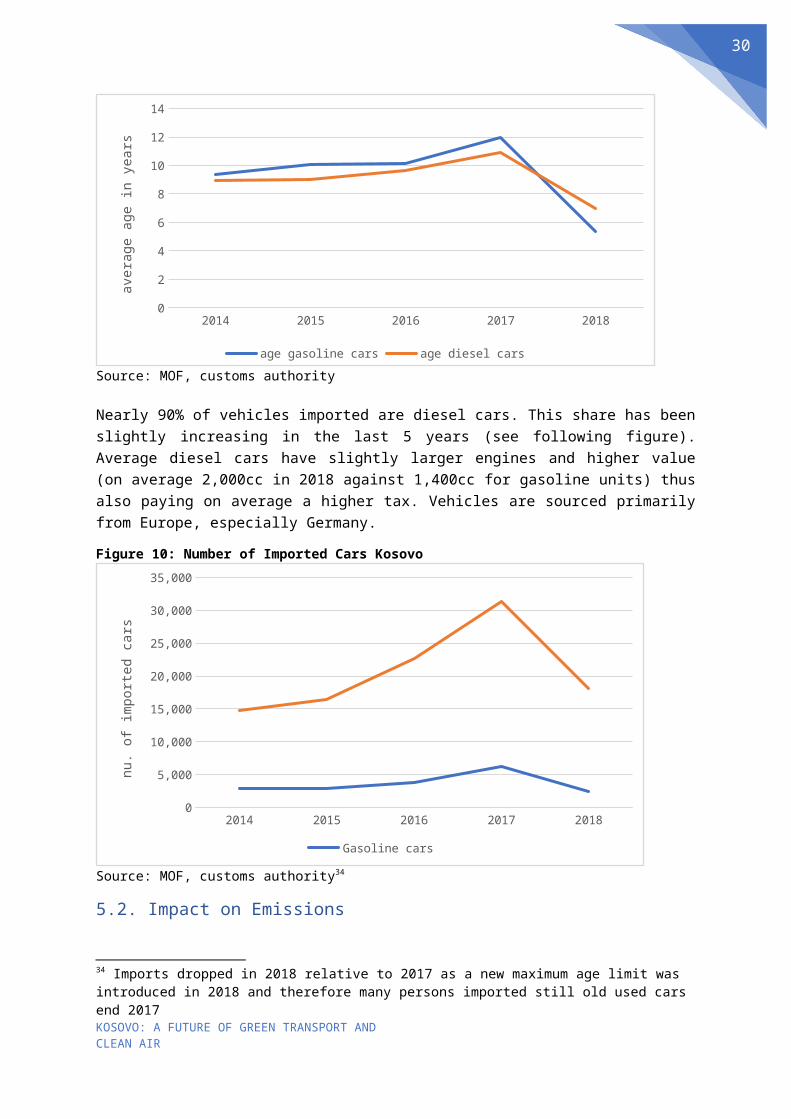
Inspection systems can identify vehicles which have problems and owners will repair their vehicles or scrap them.
Deterioration of Vehicles and Resultant Emission Increase
In the time of carburetted vehicles this was a common and well know problem. The fuel/air mixture would not be optimal, either caused intentionally or by degradation and a simple maintenance and adjustment could reduce emissions significantly. However, vehicles today are to an overwhelming majority of electronic injection and control. The air/fuel mixture is thereby electronically controlled. Degradation would thus occur if systems malfunction. Therefore, it is important to know what the average degradation factor is. The COPERT model used by the EU standard uses deterioration factors which are based on a very small sample of Euro 3 and 4 vehicles with limited high mileage ranges and on laboratory tests. Deterioration rates derived from more than 110,000 records collected over the past thirteen years from on-road emission remote sensing in Zürich/Switzerland however show that deterioration rates for gasoline vehicles are much lower than assumed so far with no evidence of high emitters72. Degradation will probably be even less of a problem in the future as Euro 6 standards ask for longer periods of guaranteed emission performance and durability of emission control parts of vehicles thus reducing degradation and reducing the share of high emitters. The deterioration of the emission control systems takes place gradually over the observed lifetime of up to twenty years. No significantly higher frequency or elevated levels of high emission events was found over time, thus ruling out an increased share of vehicles with dysfunctional emission control equipment. This means that the potential impact of inspection programs is limited and continuously decreasing with new vehicle technologies. The durability of emission controls has much improved since Euro 1 technologies. Deterioration is still an issue; however, simple idle tests do not prove to be effective for a better tuning of the emission control system. Given that vehicles with broken emission controls seem to be very rare, idle tests might also not be necessary in finding those cars. Well-managed on-board diagnostics (OBD) perform equally well.
Inspection Systems and Identification of High Emitters
The error of omissions should be as low as possible to avoid high emitting vehicles to pass the test. The error of omissions however not only depends on the test procedure but also on the test execution and the potential of manipulation. Following points need to be observed:
Idle gasoline tests have a relatively high error level of omission due to the test itself; Snap-on diesel tests have a regular level of error of omission due to the test itself but a high
level of error of omissions due to incorrect test application. This is a very common problem and can be due to lack of training and know-how or be intentional;
Inspection systems are prone to be circumvented. Persons which have a vehicle in bad shape and do not want to invest large amounts of money to repair their vehicle have a motivation to try to get a certificate with any means. Practices observed in many countries include intentional wrong measurement procedures (especially in diesel vehicles), adjustment of vehicles only for control purposes (especially diesel vehicles), registering of wrong data (from emission equipment or usage of vehicles in good conditions whilst registering for the control a different vehicle), fake pass certificates, usage of fuel additives (especially for diesel vehicles), etc. Some of the fraud possibilities can be reduced through more intense controls of inspection centres e.g. through direct data transmission, digital recording, web-based
72 Borken-Kleefeld, 2015
Final report
32
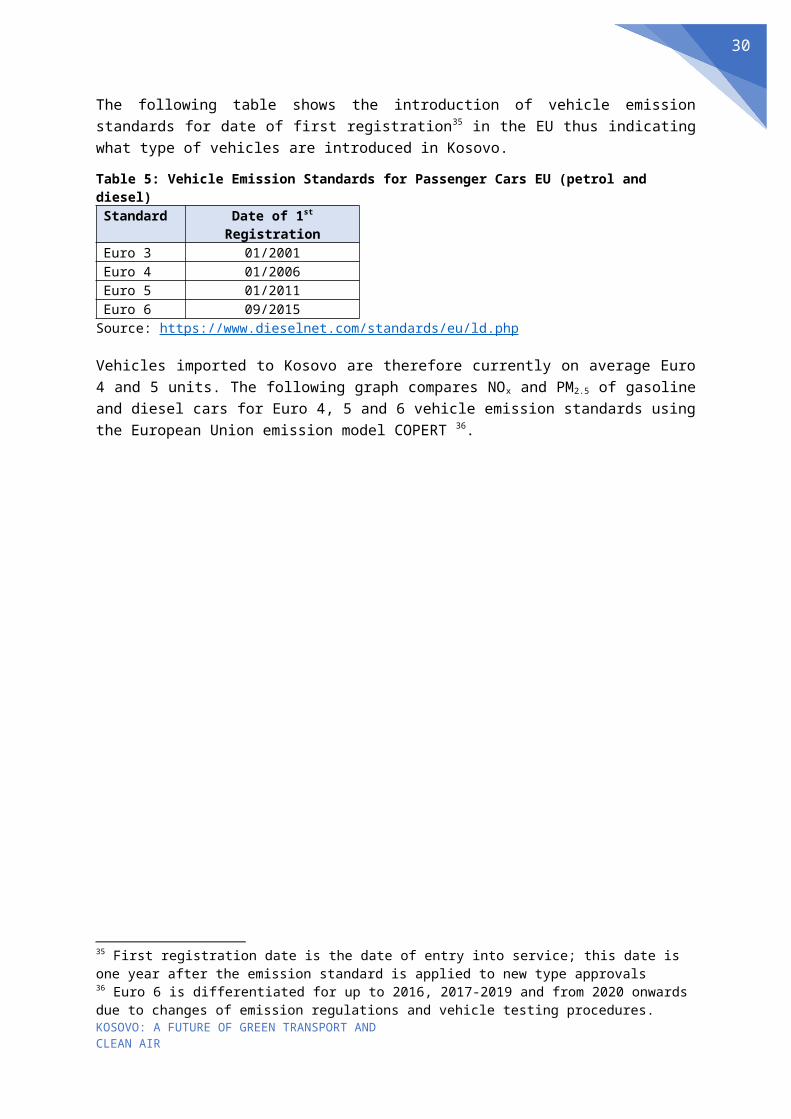
real-time transmission of inspections, usage of covert auditing etc. However, all these controls are expensive, and can be circumvented again as the experience has shown e.g. in Mexico City73. Other aspects cannot be controlled easily e.g. preparing the vehicle only for inspection purposes e.g. adjusting diesel engines with a lower fuel intake-ratio to reduce smoke and “re-adjusting” the same engine again after inspection to allow for more power. Appropriate controls require on-road measurements or remote sensing. Former are very costly, require trained staff and equipment and a certain frequency. Virtually no country has implemented this on a wide scale. Costa Rica realized this quite intensively during some years in the nineties with support from a Swiss clean air project but results were mixed and the program was downscaled. Remote sensing is used in more countries but basically in a monitoring context and not to identify and track high emitters.
Usefulness of Emission Inspections
Vehicle inspection systems especially for old vehicles and for diesel units which degrade quicker and which have more maintenance issues are still useful. For gasoline cars their impact is limited and measurements could be replaced with reading the data from the EOBD (the same holds true for Euro V and VI diesel cars). The international trend concerning IM is to reduce emission inspection based on testing and to rely more on OBD74 or EOBD (European On-Board Diagnostic System equivalent to OBD II of the US). The large majority of vehicles circulating in Kosovo have OBD II or EOBD as only vehicles older than 15 years (diesel units) and older than 18 years (gasoline) do not have such a system installed. OBD systems record malfunctions of the emission control system, report it on the dashboard and register the date of the malfunction. EOBD readings can be combined with a roadworthiness test. Switzerland since 2013 as well as California also since 2013 have e.g. eliminated regular in-service emission inspection of vehicles which are equipped with OBD/EOBD75.
6.2. Conclusions
Following conclusions are reached:
Idle gasoline tests and Snap-On diesel tests as proposed for Kosovo are in line with EU regulations.
Measurement of gasoline cars could be replaced, except for very old units (e.g. >15 years) with EOBD readings which are more reliable and faster to check. For very old cars the idle test is OK to check quickly if the emission control system is still in place.
For diesel vehicles new units (<5 years) could be checked with EOBD only whilst for older units a cross-check with the snap-on test is useful as diesel vehicles degrade quicker. However, it is important to have control procedures in place to ensure that testing is done adequately and to reduce wrong measurements.
The overall impact of an in-use vehicle emission inspection is limited as degradation of vehicles is not that significant and as controls can be circumvented relatively easily. In-use controls cannot improve the original vehicle emission standard i.e. a Euro 3 vehicle will at best remain at that level. The focus 73 In Mexico City software of digital-cameras was e.g. hacked to transmit images of different cars than those inspected. 74 On-Board Diagnostics System75 All vehicles produced in the US are compliant with OBD II since 1996; all gasoline vehicles category M (passenger cars) in the EU require to have EOBD installed since 2011 and all diesel units since 2004 (Directive 98/69/EC of 13/10/1998)
Final report
33
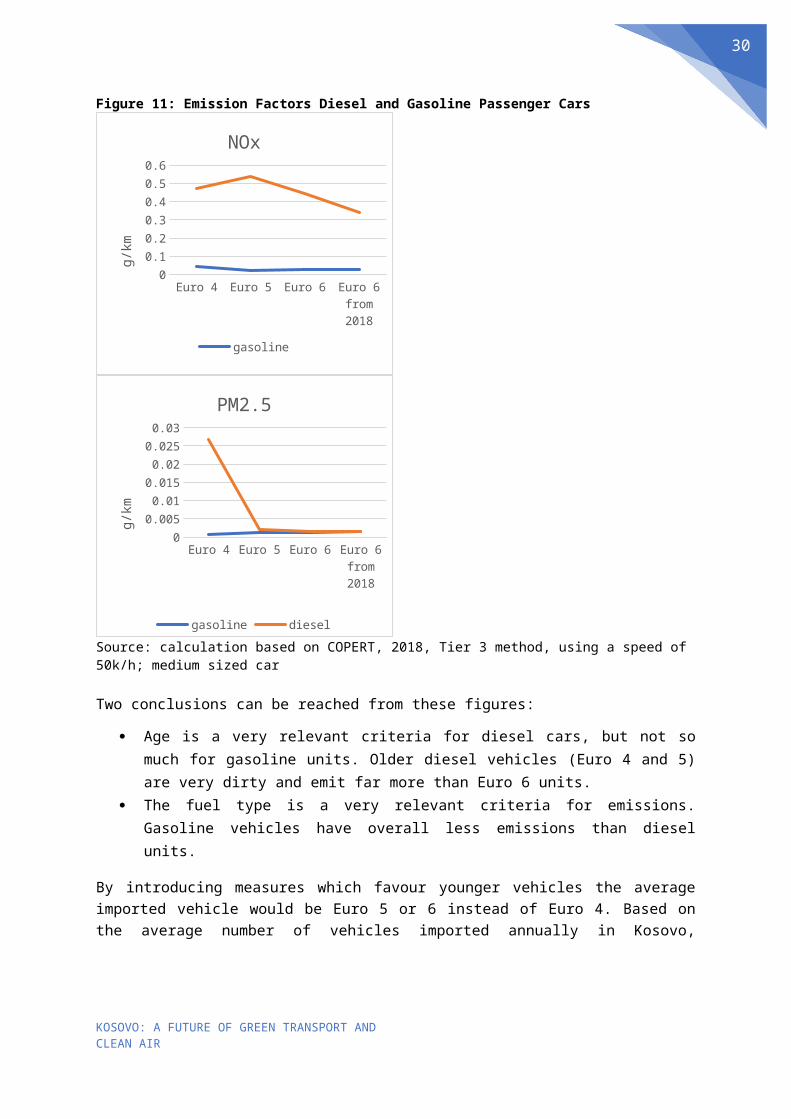
for reducing vehicle emissions therefore needs to be on the emission standard (type approval standard) of new/imported vehicles. This is the point where the emission level of vehicles is defined.
References
ADB (2018), Low-Carbon Buses in the People’s Republic of China
Borken-Kleefeld J. et. al. (2015), New emission deterioration rates for gasoline cars – results from long-term measurements, Atmospheric Environment, Vol. 101, 01/2015, 58-64
CAA (2016), Vehicle Inspection and Maintenance in Asia: Status and Challenges
CARB (2015), EMFAC2014 Volume III – Technical Documentation
CHIC (2016), London hydrogen buses and the CHIC project
DVSA (2017), In Service Exhaust Emission Standards for Road Vehicles, 19th ed.
EEA (2018), Air pollutant emission inventory guidebook Version 2016 update December 2018
EEA (2016), Road vehicle tyre and brake wear
Faltenbacher M. et. al. (2011), Abschlussbericht Plattform Innovative Antriebe Bus (Auftraggeber Bundesministerium fur Verkehr, Bau und Stadtentwicklung)
Grütter J. (2015), CALAC evaluation report
ICCT (2016a), A technical summary of Euro 6/VI vehicle emission standards
ICCT (2016b), Environmental Risks of Diesel Passenger Vehicles in Brazil
ICCT (2015), Cost and Benefits of Motor Vehicle Emission Control Programs in China
ICCT (2013), Overview of India’s Vehicle Emissions and Control Program
IEA (2005), Energy Statistics Manual
IMF (2014), Getting Prices Right
IPCC (2013), Fifth Assessment Report (AR5); https://www.ipcc.ch/report/ar5/
IPCC (2006), IPCC Guidelines for National Greenhouse Gas Inventories
Kosovo Agency of Statistics (2018), Series 3: Economic Statistics
Ministry of Environment and Spatial Planning (2018), Climate Change Strategy 2019-2038; Action Plan on Climate Change 2019-2021
MM (2018), Pristina Sustainable Urban Mobility Plan
Pinner et.al. (2016), lethal and illegal: London’s air pollution crisis
TRL (2014), Briefing paper on non-exhaust particulate emissions from road transport
VTPI (2017), Transportation Cost and Benefit Analysis II – Noise Costs
UNFCCC (2014), CDM Methodological Tool: Upstream leakage emissions associated with fossil fuel usage, Version 02.0
Final report
34
WHO (2006), WHO Air quality guidelines for particulate matter, ozone, nitrogen dioxide and sulfur dioxide
Walsh M. (2017), Car Lines
Final report
35
Annex
Defaults
General ParametersParameter Value UnitNCV of diesel 43 MJ/kgCO2 emission factor of diesel 74.1 gCO2/MJDensity of diesel 0.844 kg/lWell-to-tank mark-up factor diesel 23%NCV of gasoline 44.3 MJ/kgCO2 emission factor of gasoline 69.3 gCO2/MJDensity of gasoline 0.741 kg/lWell-to-tank mark-up factor gasoline 19%GWP100 of BC 900SO2 emissions per liter of diesel 10 ppm 0.017 gSO2/l
Black Carbon Share in PM2.5
Diesel passenger car and LCV conventional 55%Diesel passenger car and LCV Euro 1 70%Diesel passenger car and LCV Euro 2 80%Diesel passenger car and LCV Euro 3 85%Diesel passenger car and LCV Euro 4 87%Diesel passenger car and LCV Euro 5 10%Diesel passenger car and LCV Euro 6 10%HDV conventional 50%HDV Euro I 65%HDV Euro II 65%HDV Euro III 70%HDV Euro IV 75%HDV Euro V 15%HDV Euro VI 15%Copert, 2018, table 3-91
Based on molecular weight of S against SO2 with 50ppm sulfur diesel (Euro 4 diesel)
IPCC, 2006, table 1.4IEA, 2005UNFCCC, 2014, Table 3Bond, 2013; see also IPCC, 2013, Table 8.A.6
IPCC, 2006, table 1.2
SourceIPCC, 2006, table 1.2IPCC, 2006, table 1.4IEA, 2005UNFCCC, 2014, Table 3
Vehicle Registration Kosovo 2018
source: vehicle test centre
Passenger cars (M1)
nu. of cars Share Mileage nu. of cars Share Mileage nu. of cars Share MileageEuro 0 18,939 29% 7,682 30,363 14% 9,616 1,103 46%Euro 1 5,033 8% 9,066 6,269 3% 9,751 318 13%Euro 2 12,858 20% 11,494 21,926 10% 14,492 408 17%Euro 3 14,406 22% 16,359 77,532 36% 16,169 382 16%Euro 4 9,926 15% 14,773 51,348 24% 19,088 168 7%Euro 5 2,465 4% 15,695 22,748 10% 25,271 20 1%Euro 6 1,705 3% 6,431 7,606 3% 17,142 2 0%Total 65,332 11,829 217,792 16,575 2,401 11,235Median yearEuro 6 mileage not reliable as less than 12 monthstotal mileage refers to average of all vehicles
gasoline diesel LPG totalCars 65,332 217,792 2,401 285,525Share 23% 76% 1%Median Euro standard Euro 2 Euro 3 Euro 2
Number of hybrids 226
LPG cars
1993
gasoline cars diesel carsEuro standard
2000 2000
Final report
36
Buses, 2018
Small/medium M2 units Share MileageEuro 0 56 8% 16,641Euro I 54 7% 18,497Euro II 200 27% 20,873Euro III 264 36% 23,102Euro IV 86 12% 31,506Euro V 53 7% 22,142Euro VI 21 3% 10,478Total 734 100% 22,217Median yearMedian Euro standardonly 10 gasoline vehicles
Standard buses M3 units Share MileageEuro 0 294 16% 16,130Euro I 287 16% 19,667Euro II 704 38% 26,938Euro III 394 22% 29,879Euro IV 72 4% 28,225Euro V 48 3% 27,122Euro VI 30 2% 27,898Total 1,829 24,616Median yearMedian Euro standardonly 1 gasoline unit
2000
1997
Euro 2
Euro 2
Final report
37
Trucks, 2018
LCV N1 units Share MileageEuro 0 5,568 13% 9,219Euro I 4,628 11% 11,431Euro II 11,057 26% 12,894Euro III 12,436 29% 16,158Euro IV 6,763 16% 21,988Euro V 2,016 5% 29,269Euro VI 460 1% 11,178Total 42,928 100% 15,403Median yearMedian Euro standardgasoline units: 1,351 or 3%
Medium trucks 3.5-12t N2 units Share MileageEuro 0 1,756 37% 11,936Euro I 569 12% 12,785Euro II 876 19% 17,268Euro III 907 19% 21,603Euro IV 262 6% 27,961Euro V 246 5% 21,208Euro VI 104 2% 6,534Total 4,720 16,284Median yearMedian Euro standardonly 2 gasoline units
Large trucks>12t N3 units Share MileagePre Euro O 716 9% 10,875Euro 0 891 11% 15,719Euro I 660 8% 24,659Euro II 1,600 20% 24,865Euro III 2,649 33% 29,845Euro IV 748 9% 38,745Euro V 619 8% 55,264Euro VI 105 1% 44,926Total 7,988 27,465Median yearMedian Euro standardonly 1 gasoline unit
Euro III
2001Euro II/III
1995Euro II
1999
Final report
38
Emissions 2018(all figures in tons; WTW incl. BC)
Vehicle category PM2.5 NOx GHG TTW GHG WTWPassenger cars gasoline 2 399 127,520 151,748Passenger cars diesel 127 2,043 534,026 739,718Total passenger cars 129 2,442 661,546 891,467Small/Medium Buses 3 115 7,541 10,788Standard Buses 12 478 46,015 63,306Total Buses 15 594 53,556 74,094LCV 27 394 126,856 173,741Medium truck 3.5-12t 10 356 37,104 50,615Large truck>12t 39 1,097 200,140 267,544Total Trucks 75 1,847 364,101 491,899Total Vehicles 219 4,882 1,079,202 1,457,460
Emissions 2025Vehicle category PM2.5 NOx GHG TTW GHG WTWPassenger cars gasoline 2 244 196,074 233,328Passenger cars diesel 123 2,948 801,807 1,070,710Total passenger cars 125 3,193 997,881 1,304,038Small/Medium Buses 3 139 11,975 16,155Standard Buses 11 545 62,060 82,553Total Buses 14 684 74,036 98,708LCV 27 592 208,712 275,341Medium truck 3.5-12t 8 400 97,688 124,256Large truck>12t 41 1,551 359,568 463,867Total Trucks 76 2,542 665,968 863,464Total Vehicles 214 6,419 1,737,885 2,266,209
Emissions 2030Vehicle category PM2.5 NOx GHG TTW GHG WTWPassenger cars gasoline 2 85 258,526 307,646Passenger cars diesel 102 3,834 1,065,361 1,383,415Total passenger cars 105 3,919 1,323,887 1,691,060Small/Medium Buses 2 150 15,169 19,919Standard Buses 10 573 76,369 99,411Total Buses 12 723 91,537 119,330LCV 24 787 290,011 373,375Medium truck 3.5-12t 7 408 196,591 244,922Large truck>12t 37 1,646 464,866 590,970Total Trucks 68 2,841 951,468 1,209,268Total Vehicles 185 7,483 2,366,892 3,019,658
Speed cars: 50k/h; speed buses: 25km/h; 0% gradient, 50% load; trucks 50km/h, 50% load, 0% gradient; medium truck defined as 7.5-12t truck; large truck defined as rigid>32t truck
Final report
39
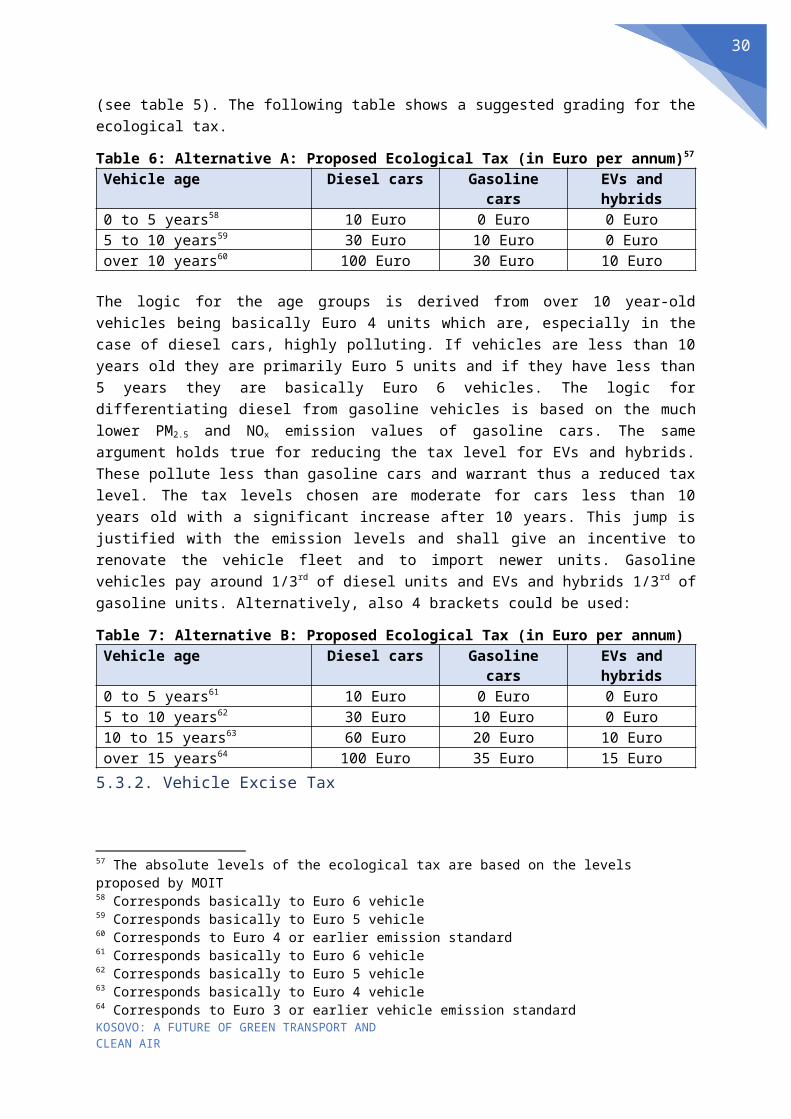
2014 2015 2016 2017 2018 2014 2015 2016 2017 20181. Nu. of vehicles imported 2,938 2,835 3,835 6,164 2,460 14,798 16,371 22,717 31,391 18,1652. Average age in years 9.39 10.06 10.17 11.95 5.4 8.95 9.03 9.62 10.92 6.983. Average cc 1,605 1,603 1,497 1,614 1,396 2,006 1,991 1,964 1,988 1,9904. Average vehicle value 3,590 3,736 3,655 3,515 7,371 5,577 6,046 5,977 5,566 9,0405. Average tax paid (sum of the 3 taxes) 1,870 1,908 1,876 1,875 2,103 2,365 2,437 2,493 2,448 2,898Source: MOF, Customs authority
ParameterGasoline cars Diesel cars
General Parameters Buses
Parameter Value UnitNCV of diesel 43 MJ/kgCO2 emission factor of diesel 74.1 gCO2/MJDensity of diesel 0.844 kg/lWell-to-tank mark-up factor diesel 23%Annual distance driven bus 50,000 kmLifespan bus 20 years
Carbon grid factor Kosovo 1.34 kgCO2/kWh
Energy savings hybrid bus 25%PM2.5 Euro VI diesel bus 0.0084 g/kmNOx Euro VI diesel bus 0.71 g/kmFuel consumption diesel bus 45 l/100kmElectricity consumption BEB 1.2 kWh/kmMedian East European countries NOx pollution cost 1,300 Euro/tMedian East European countries PM2.5 pollution cost 180,000 Euro/tEconomic cost noise pollution of diesel standard bus 0.040 Euro/kmDiesel price 1.13 Euro/l
Electricity price slow charged BEB 0.09 Euro/kWh
Electricity price fast charged BEB 0.11 Euro/kWh
GWP100 of BC 900BC fraction Euro II HDVs 65%
1 million km lifetimeBased on actual average factor 2016 based on net energy production and GHG emissions electricity sector subtracting heating; calculation Grutter Consulting with data from IEAAverage worldwide; database Grutter Consulting; see also ADB, 2018
Bond, 2013; see also IPCC, 2013, Table 8.A.6EEA, 2016, tabla 3-117
SourceIPCC, 2006, table 1.2IPCC, 2006, table 1.4IEA, 2005UNFCCC, 2014, Table 3
Average industrial tariff group 1, 2, 3; night tariff 60% and day tariff 40%; plus power charge 300 kW with 24,000 kWh consumption
Bus operator Pristina
EEA, 2018 using COPERT model, Tier 3, 50% load, 0% gradient, 14km/h speed (data from bus operator)
April 2019, petrol stationsAverage industrial tariff group 1, 2, 3; night tariff 100% plus power charge 60 kW with 6,000 kWh consumption
Includes AC/heating usage; ADB, 2018; based on average of PR ChinaIMF, 2014 databaseIMF, 2014 databasebased on general non-country specific estimate VTPI, 2017
Environmental Comparison
Parameter Diesel Hybrid Slow-charged BEB Fast-charged BEBGHG emission in g per km (WTW) 1,488 1,116 1,608 1,608PM2.5 emission in g per km 0.008 0.006 0.00 0.00NOx emission in g per km 0.710 0.533 0.00 0.00Annual GHG emission in tons 74 56 80 80Annual PM2.5 emission in kg 0.4 0.3 0.0 0.0Annual NOx emission in kg 35.5 26.6 0.0 0.0Cost of pollution and noise (excl. GHG) in Euro per annum 2,122 1,591 1,000 1,000
Final report
40
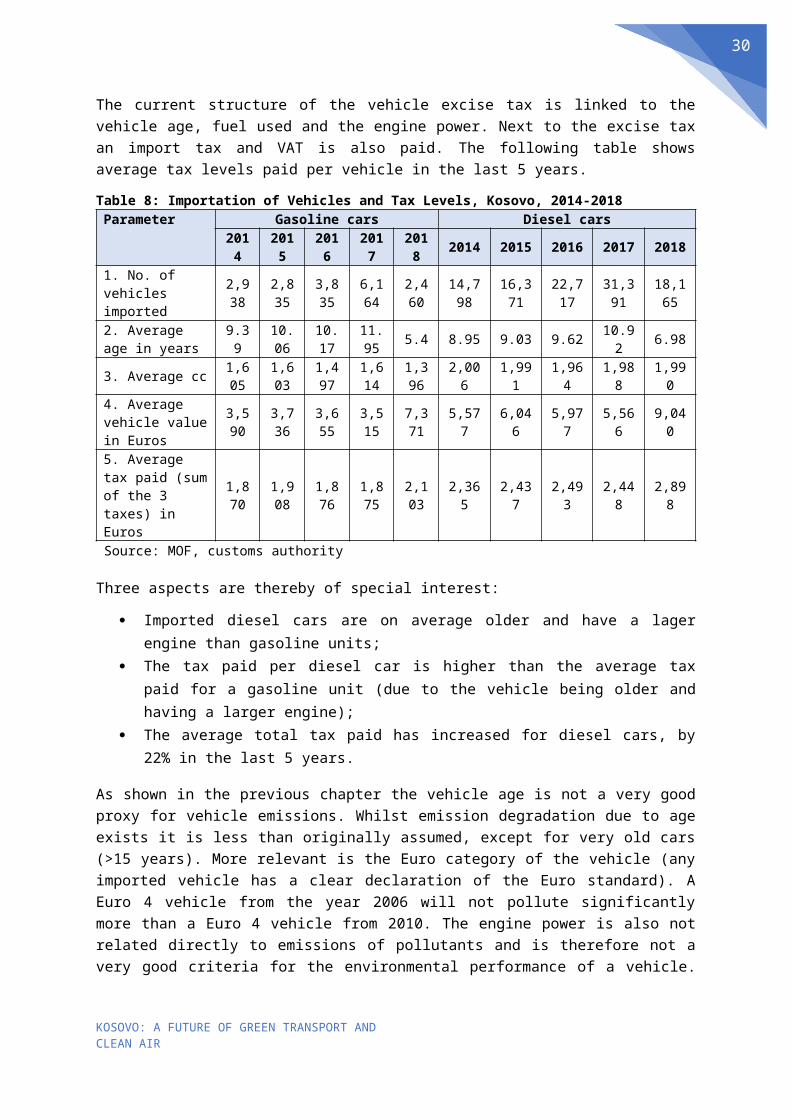
Finance Comparisonall in Euro
Parameter Diesel Hybrid Slow-charged BEB Fast-charged BEBCAPEX bus 130,000 175,500 320,000 260,000CAPEX infrastructure per bus unit 0 0 8,000 15,000Replacement cost battery 0 0 58,000 29,000Energy cost per annum 25,425 19,069 5,134 6,344Maintenance cost bus engine per km 0.15 0.15 0.12 0.12Maintenance cost bus engine annum 7,500 7,500 6,000 6,000Maintenance infrastructure 0 0 160 300Total annual OPEX 32,925 26,569 11,294 12,644TCO per km 0.50 0.49 0.49 0.43
7. All buses 12m with AC, low-floor entry8. Bus prices based on standard Euro VI bus; ADB database; hybrid bus + 35%; BEBs based on database Grutter Consulting; see also ADB, 2018
1. Slow charged BEB with 400kWh battery and 1 charger of 60kW per bus (cost USD 10,000 for charger incl. installation) 2. Fast-charged BEB with 200 kWH of battery and 1 60kW charger per 2 buses and 1 300kW charger per 8 buses (Charger cost 100,000 Usd incl. installation)
4. Replacement cost battery at 50% of price today in 8 years. Today 350 USD/kWh5. Maintenance cost of infrastructure 2% of CAPEX 6. Discount rate: 6%
3. Diesel and hybrid Euro VI unit
Comparison Euro II small bus with Euro VI standard bus
Base 1 large bus replaces 2 small units
Parameter medium Euro II bus 2 small buses Standard Euro VI bus Reduction large Euro VI busGHG emission in g per km (WTW) 1,227 2,453 1,488 39%PM2.5 emission in g per km 0.17 0.35 0.01 98%NOx emission in g per km 10.01 20.02 0.71 96%Annual GHG emission in tons 61 123 74 39%Annual PM2.5 emission in kg 8.7 17.43 0.4 98%Annual NOx emission in kg 500 1,001 36 96%Economic cost of emissions 2,219 4,438 122 97%
based on 18km/h, 0% gradient, 50% load factor; COPERT, 2018, Tier 3
Indexed 2 small buses Standard Euro VI busGHG emissions (WTW) 100 61PM2.5 emissions 100 2NOx emissions 100 4
Final report
41