Embed Size (px)
Citation preview
WEATHER & CLIMATE WEEKInstructor: Matt Letts ([email protected], UHall C850)Office Hours: Tuesday 13h30 – 15h00
INTRODUCTION TO GEOGRAPHY
SESSION GOALS:•Geography majorsLearn about the fundamentals ofmeteorology to prepare you for Weather & Climate 2015
•Non Geography majorsUnderstand the atmosphere aroundyou and interpret a surface weathermap
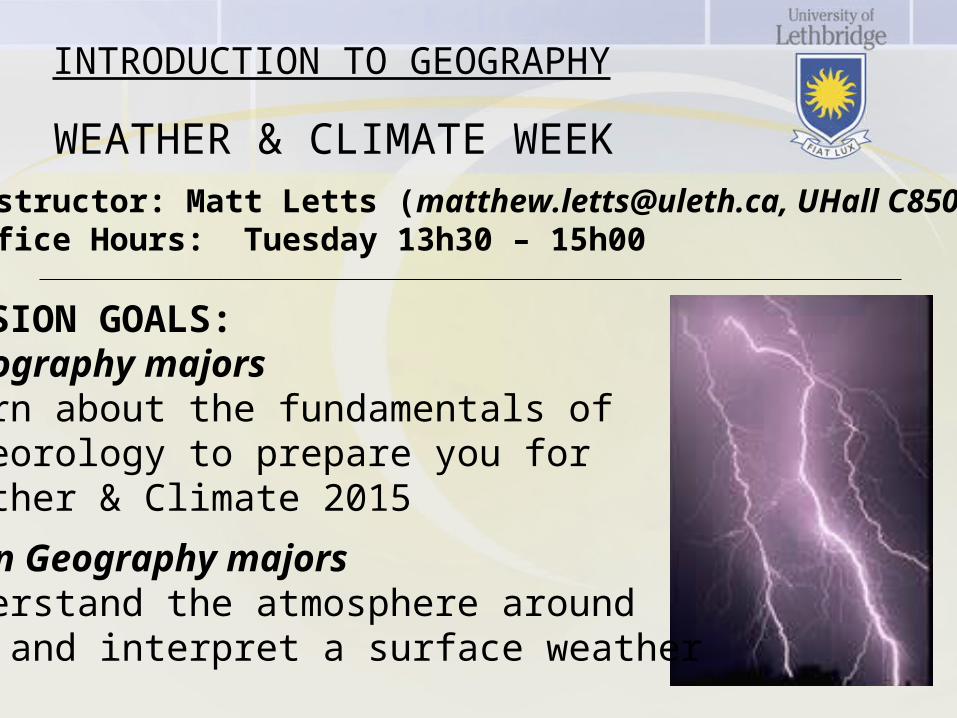
WEATHER & CLIMATEWEEK CONTENTS
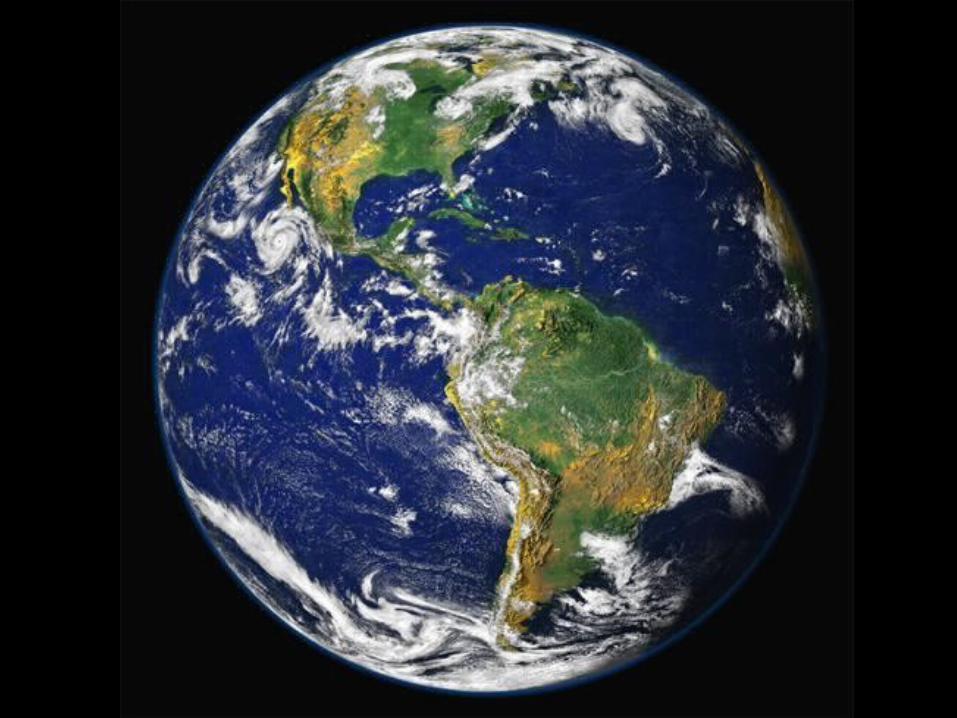
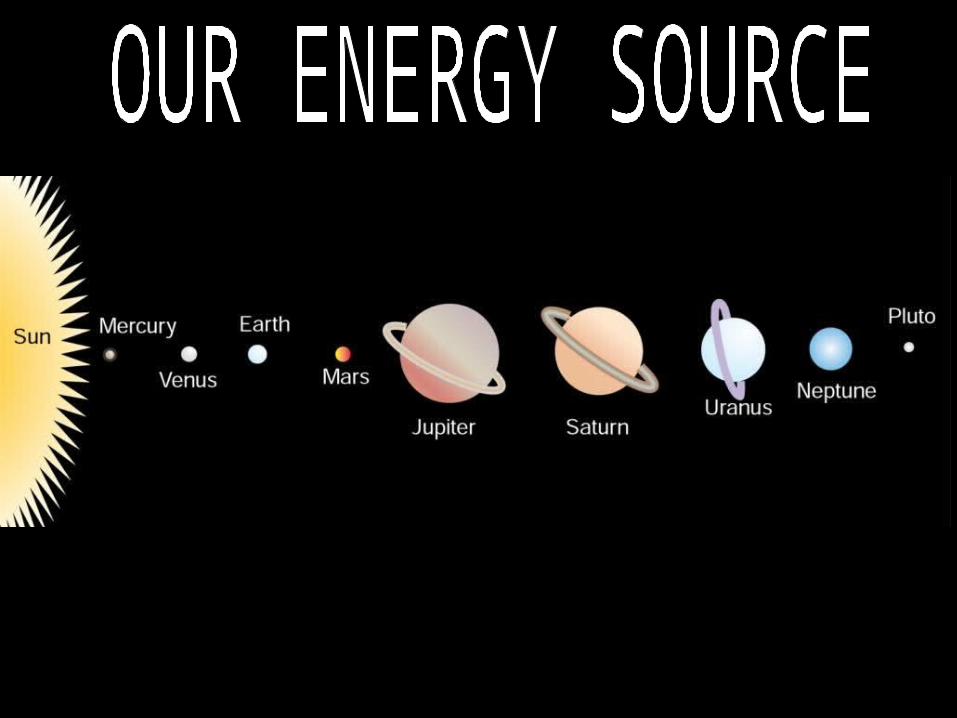
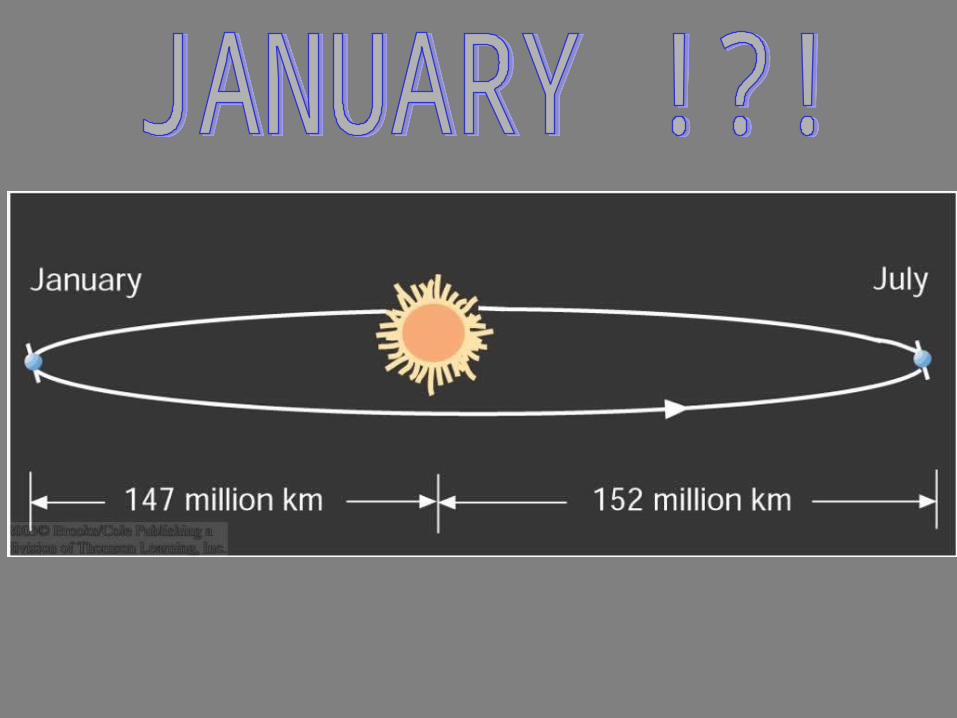
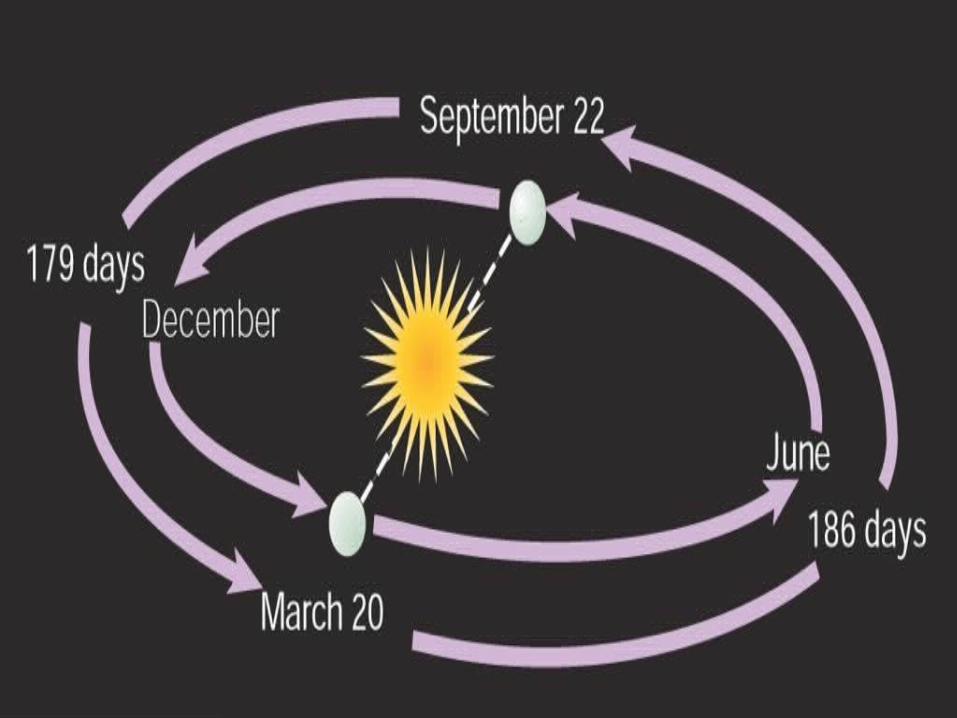
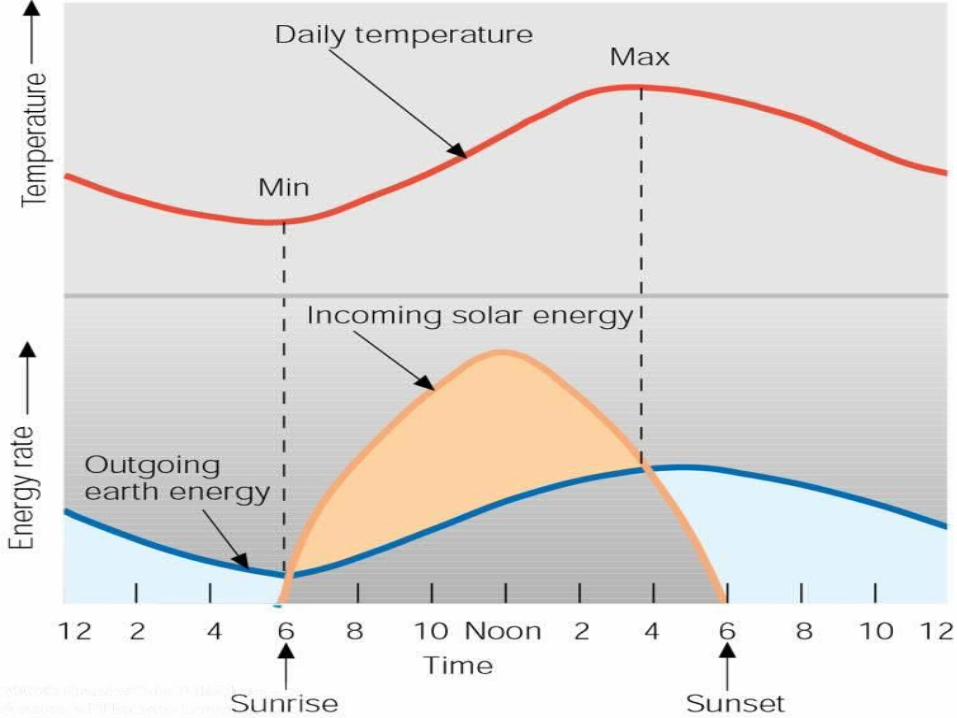
1. Our Energy Source- The Sun- Radiation Emission- What Causes Seasons?- Earth’s Radiation Balance
2. Weather vs. Climate- Weather & Climate Defined (p. 233)- Why Study Weather?
3. Atmospheric Circulation- Air Pressure is Everywhere (p. 271-273)- Forces Acting to Create Wind (p. 274-281)- Global Atmospheric Circulation (p. 281-290)
WEATHER & CLIMATEWEEK CONTENTS
4. The Importance of Water Vapour- Specific & Relative Humidity- Vapour Pressure
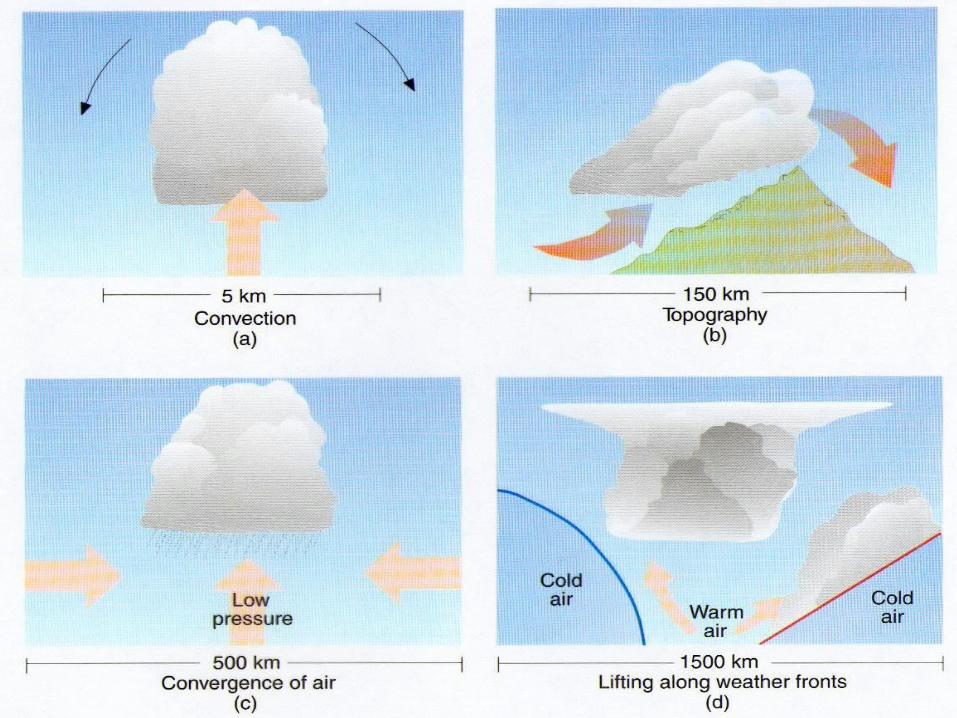
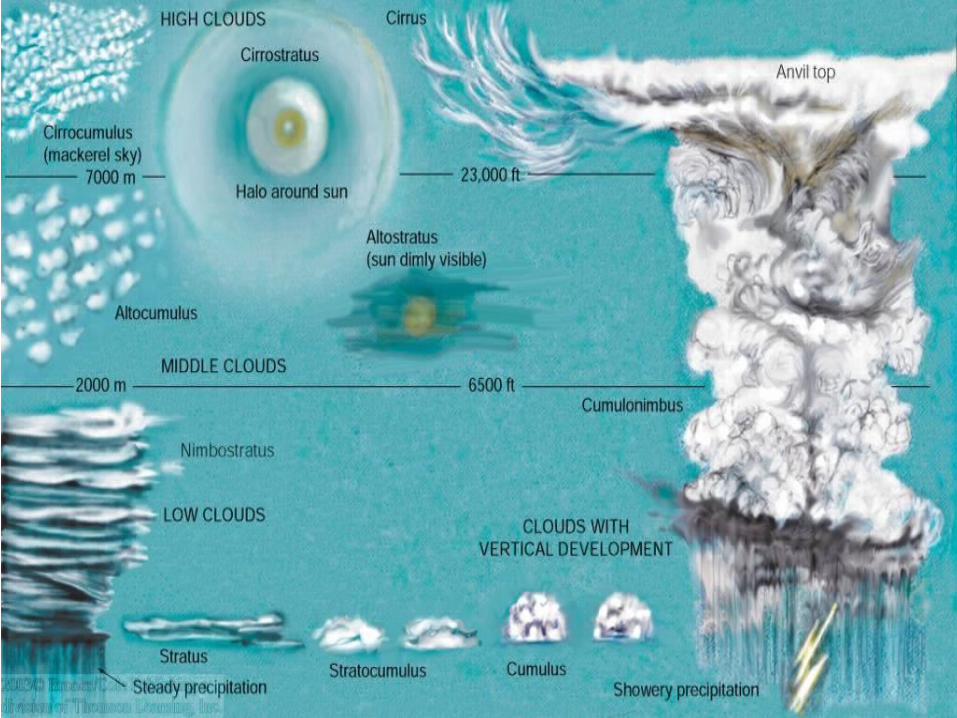
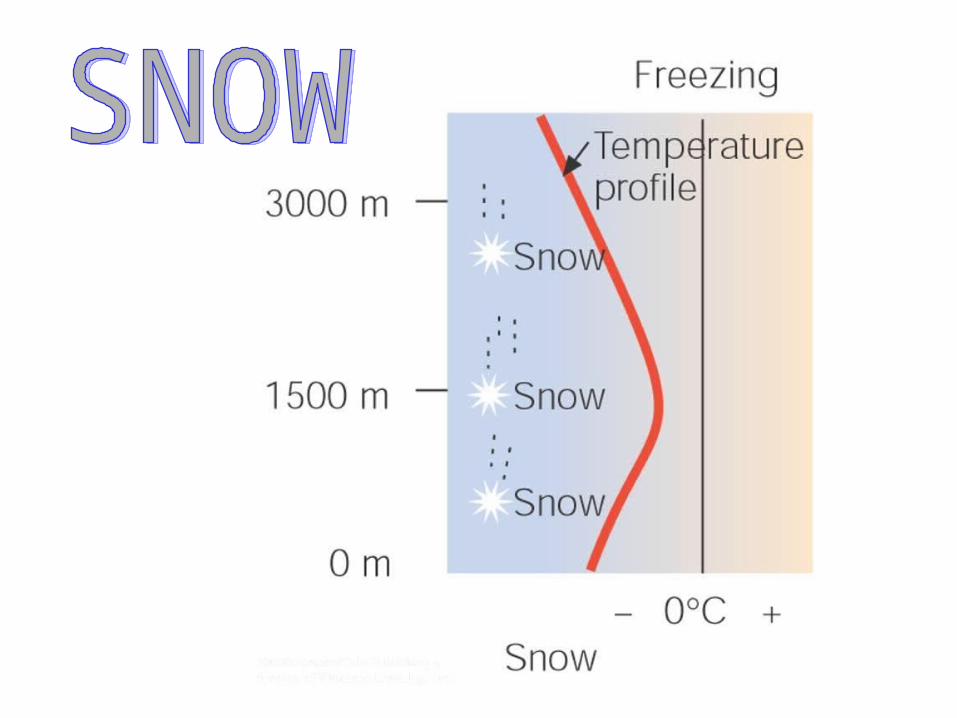
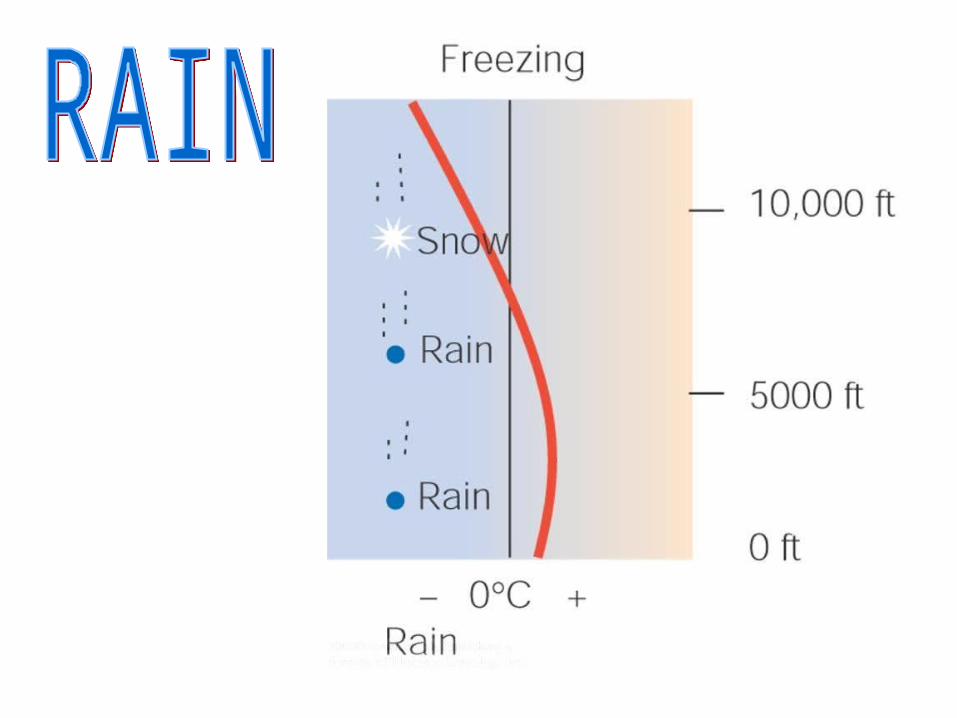
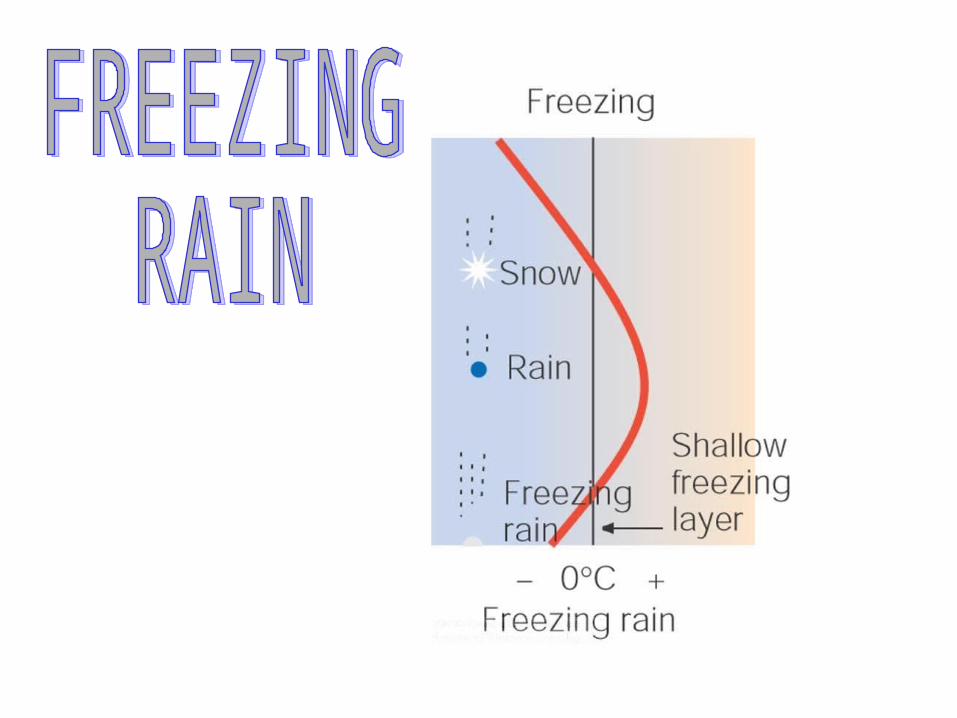
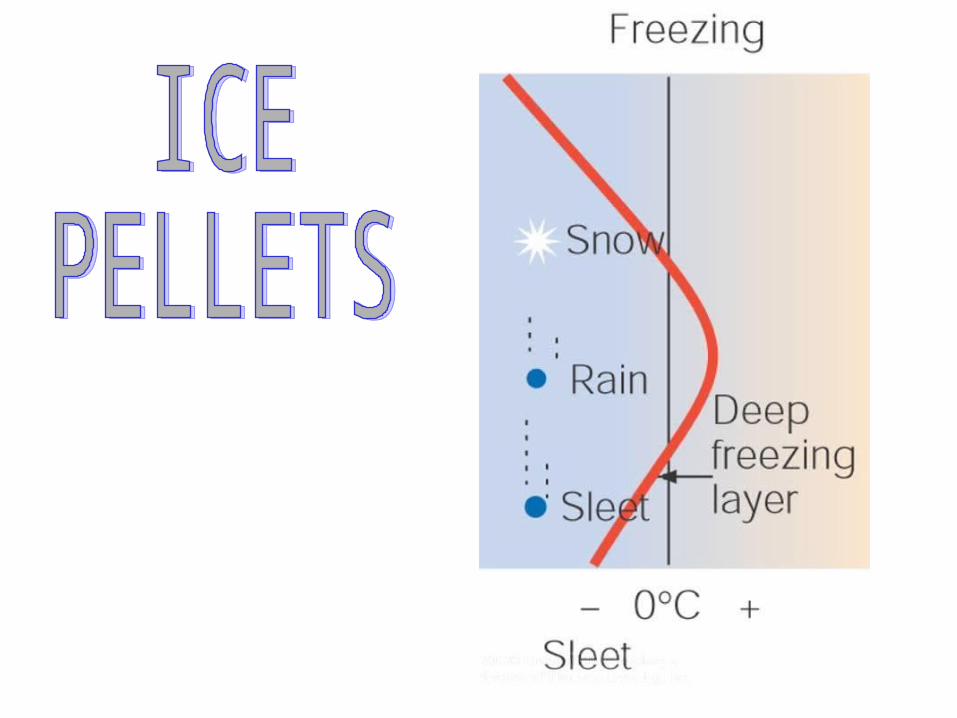
5. Instability and Cloud Formation- Causes of Instability (p. 238)- Causes of Precipitation (p. 237-243)
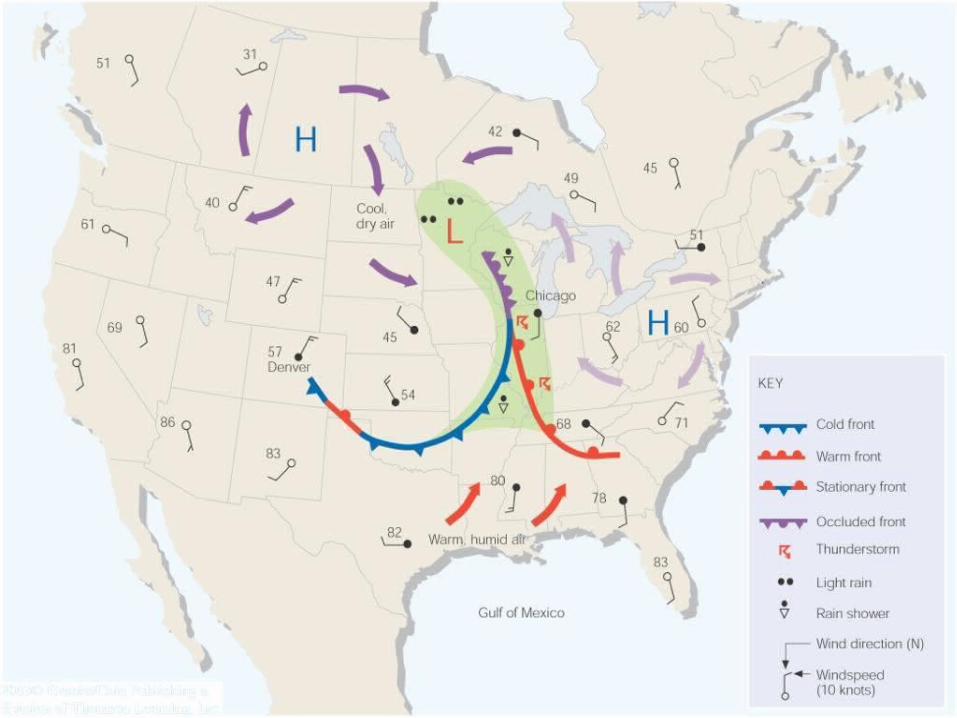
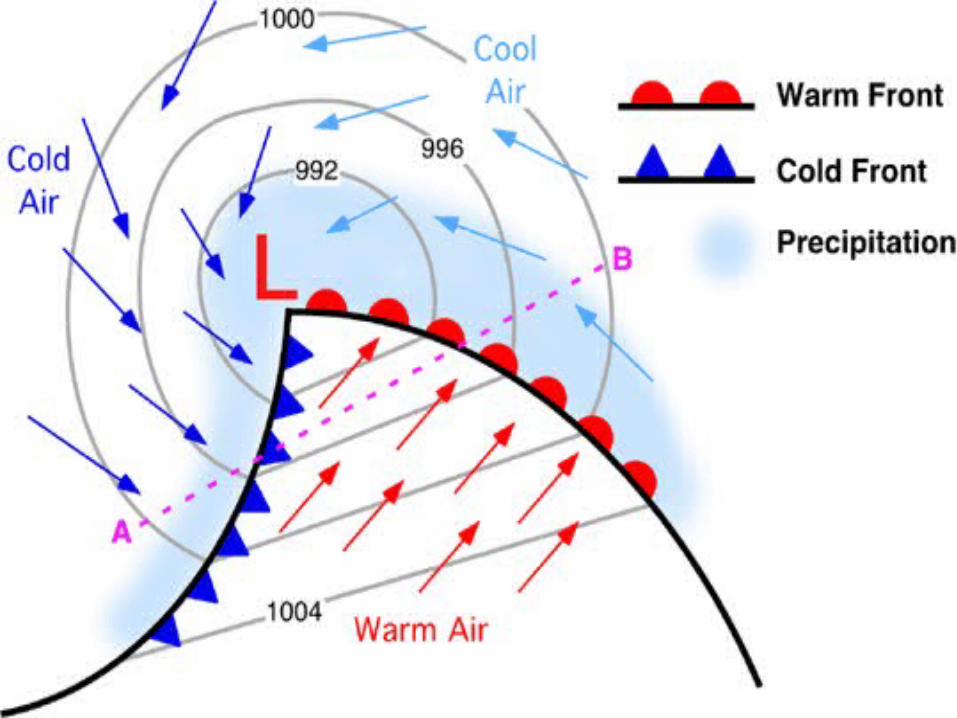
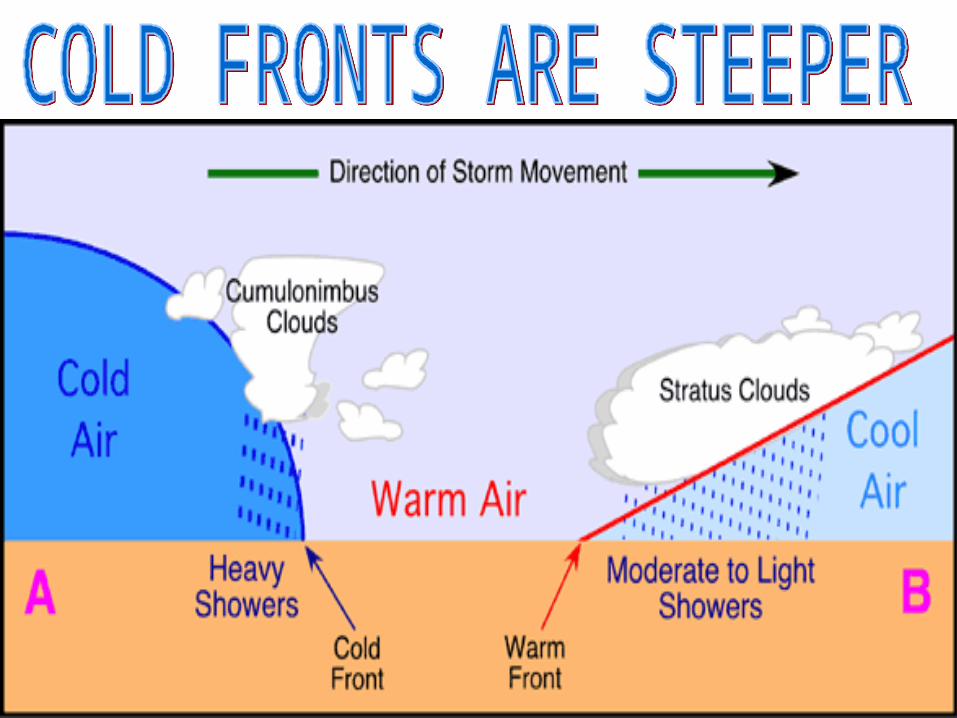
6. Analysis of Surface Weather Maps- Understanding Weather Symbols (p. 244)- The Mid-latitude Cyclone (p. 243-256)
Optional Reading:http://www.physicalgeography.net/fundamentals/chapter7.html
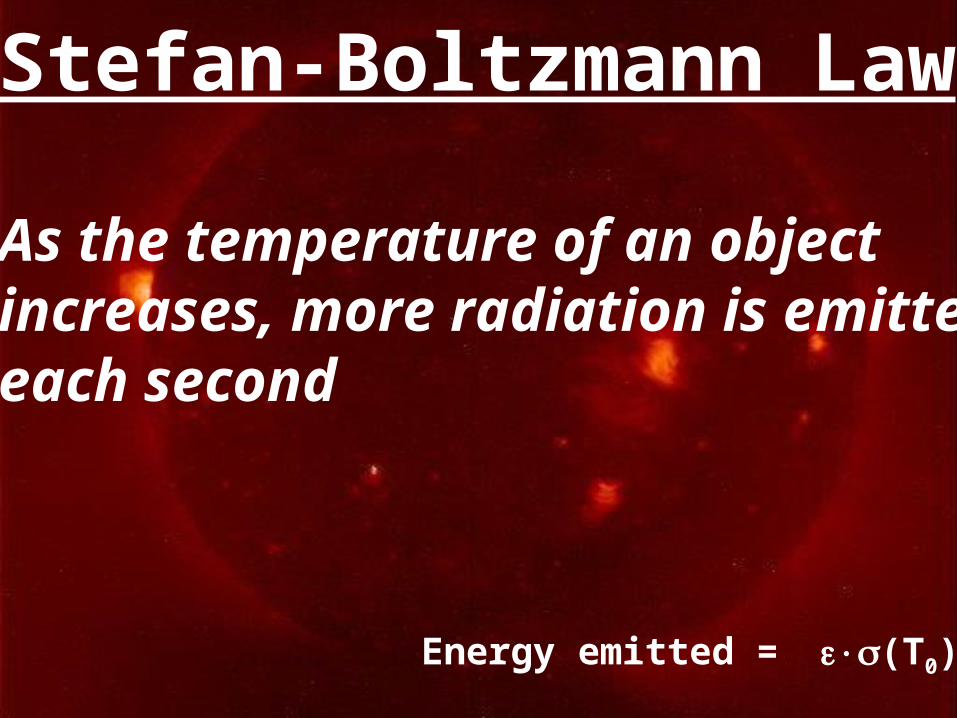
Stefan-Boltzmann Law
As the temperature of an object increases, more radiation is emitted each second
Energy emitted = (T0)4
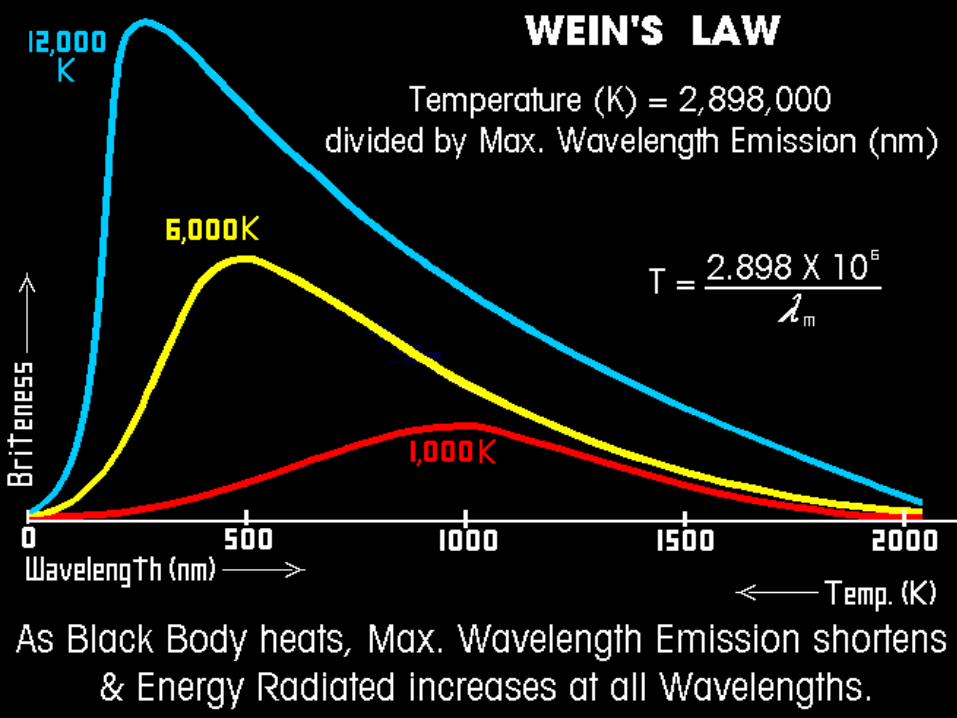
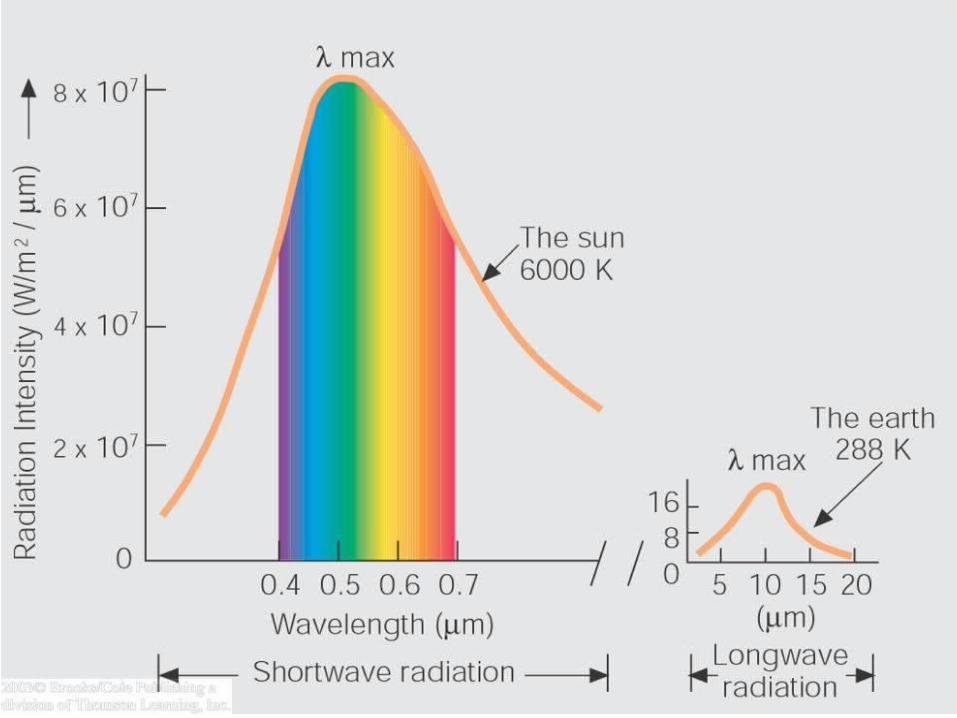
Wien’s Displacement Law
As the temperature of a body increases, so does the proportion of shorter wavelengths
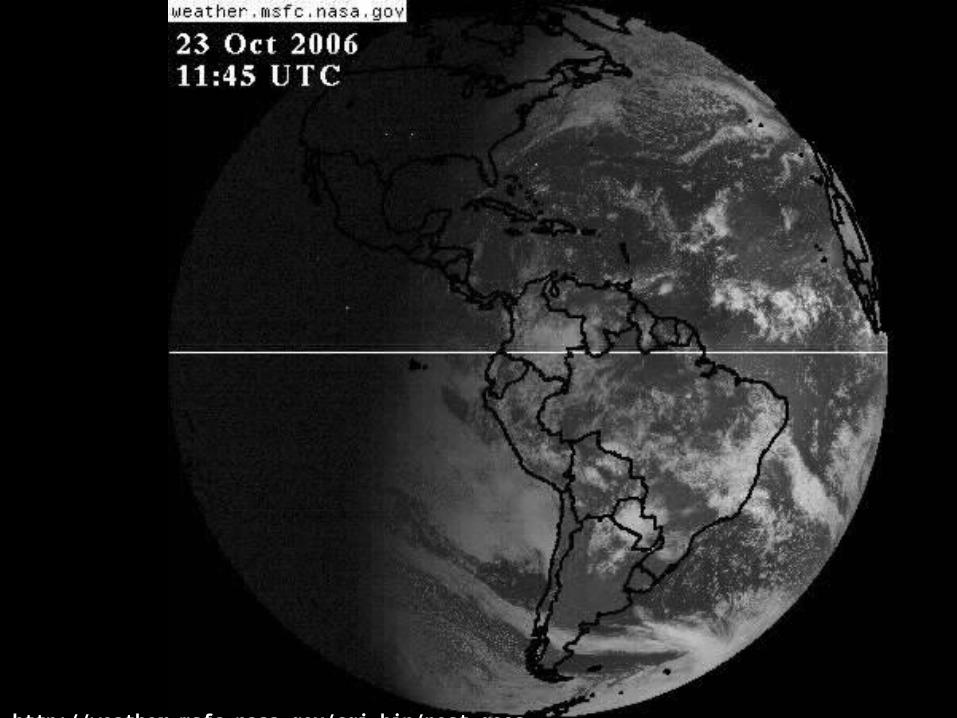
See: http://weather.msfc.nasa.gov/cgi-bin/post-goes
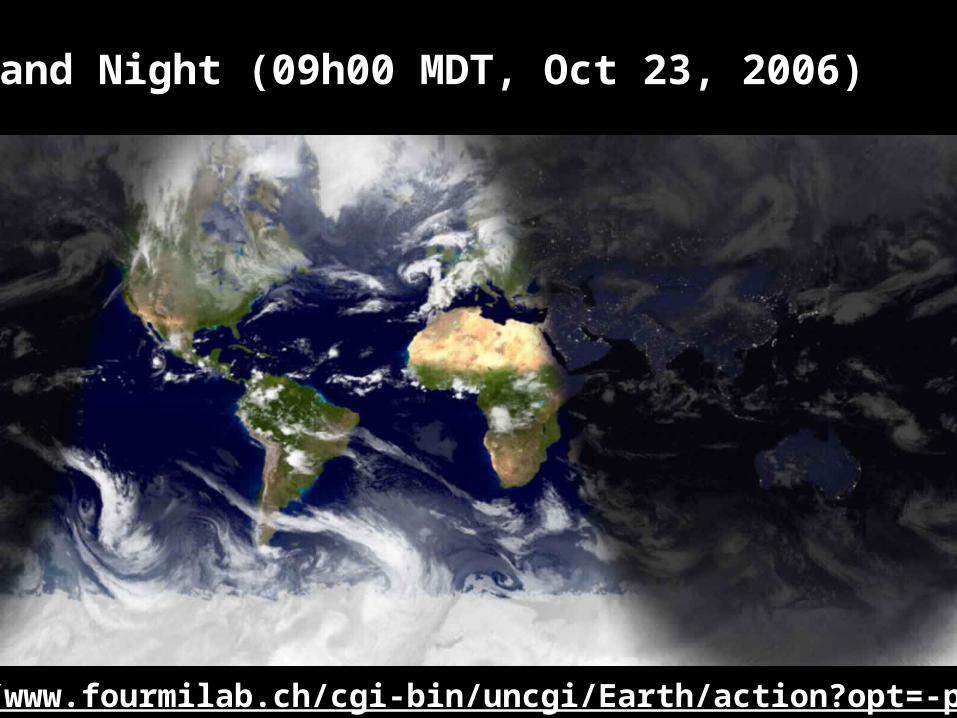
Day and Night (09h00 MDT, Oct 23, 2006)
http://www.fourmilab.ch/cgi-bin/uncgi/Earth/action?opt=-p
Source: NOAA
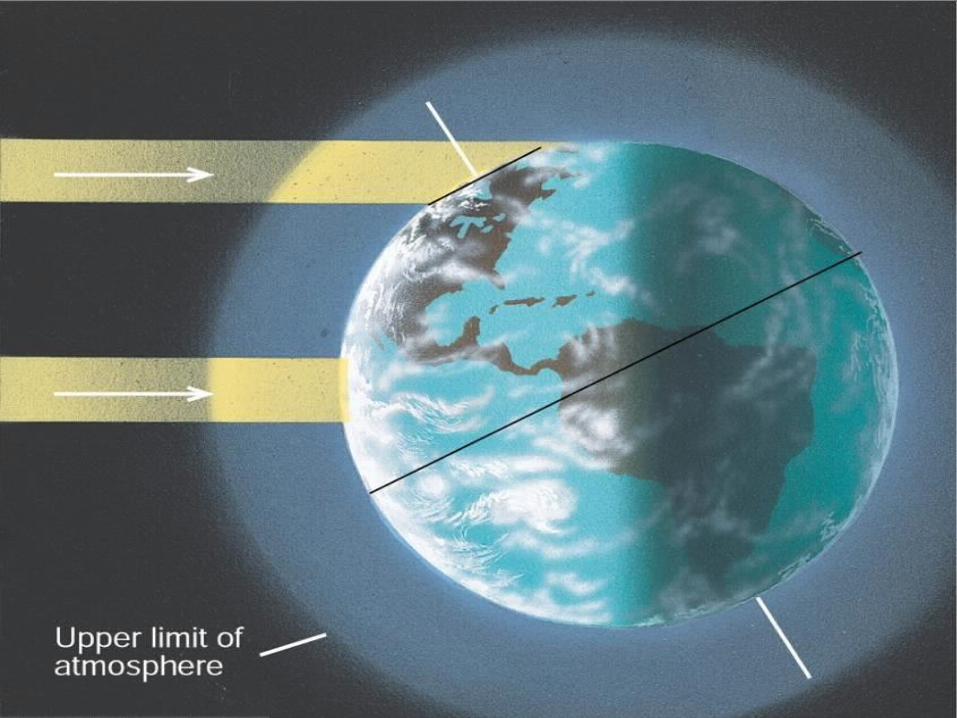
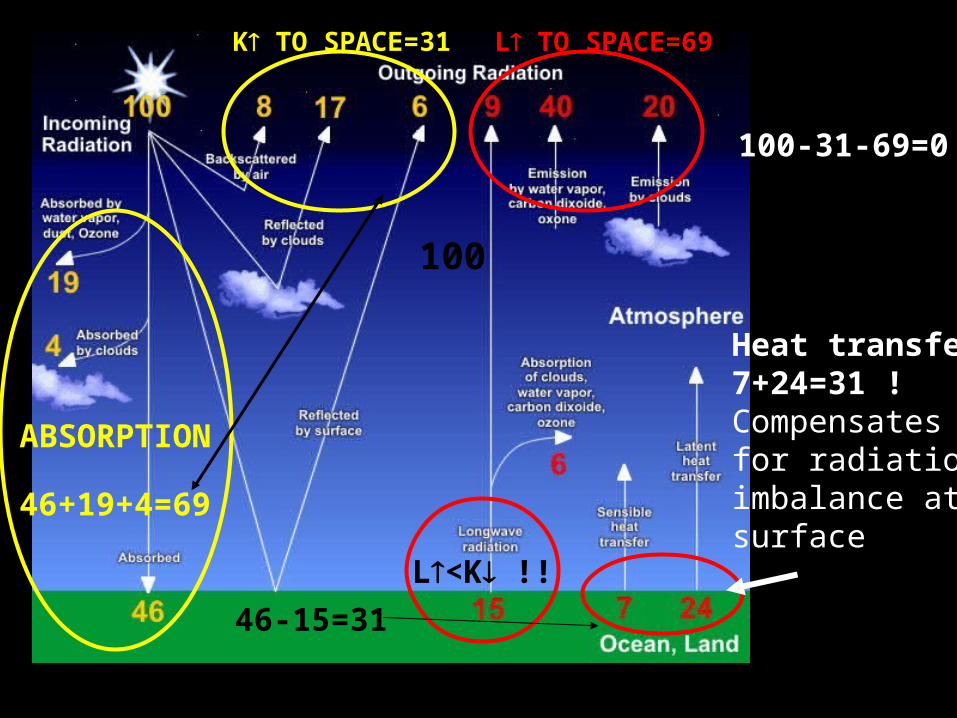
ABSORPTION
K TO SPACE=31
L<K !!
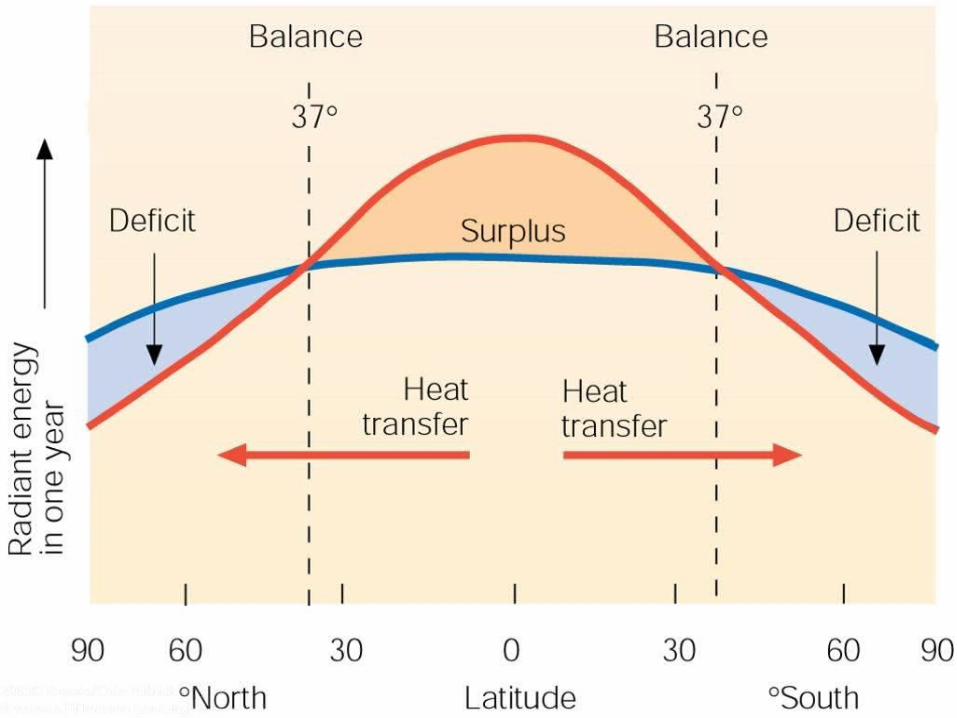
Heat transfer7+24=31 !Compensatesfor radiationimbalance atsurface
L
46+19+4=69
L TO SPACE=69
100
46-15=31
100-31-69=0
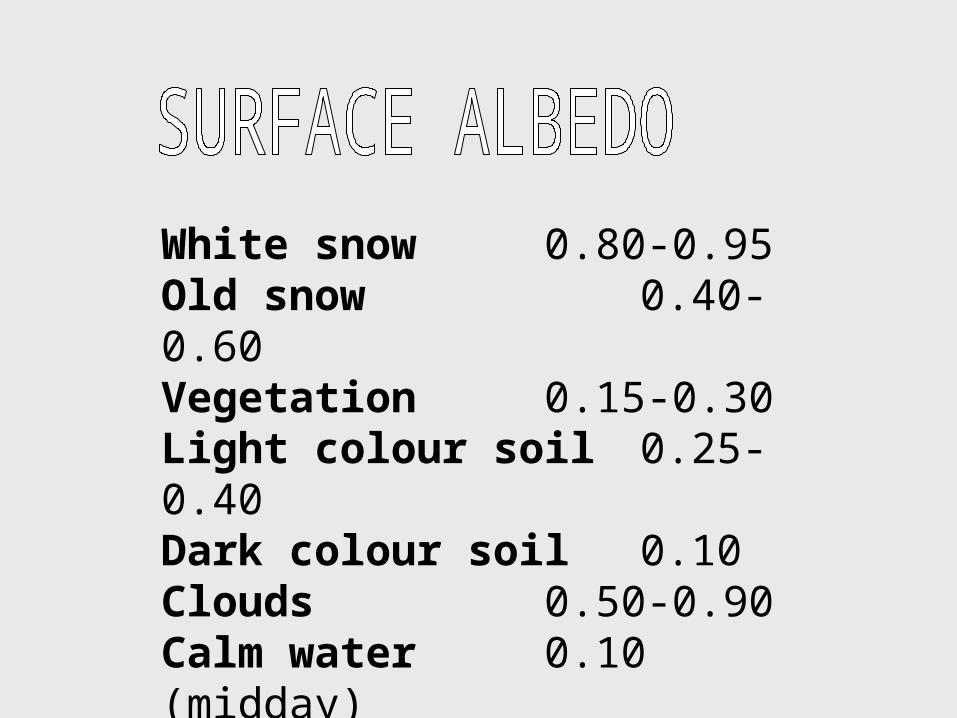
White snow 0.80-0.95Old snow 0.40-0.60Vegetation 0.15-0.30Light colour soil 0.25-0.40Dark colour soil 0.10Clouds 0.50-0.90Calm water 0.10 (midday)


0
5
10
15
20
25
30
35
40
45
SW Facing
NW Facing
NE Facing
SE Facing
7.5
cm A
ir T
emp
erat
ure
(C
)
Aug 18 Aug 19 Aug 21 Aug 22, 2005Aug 20
7.5 cm Air Temperatures at Lakeview Ridge, WLNP

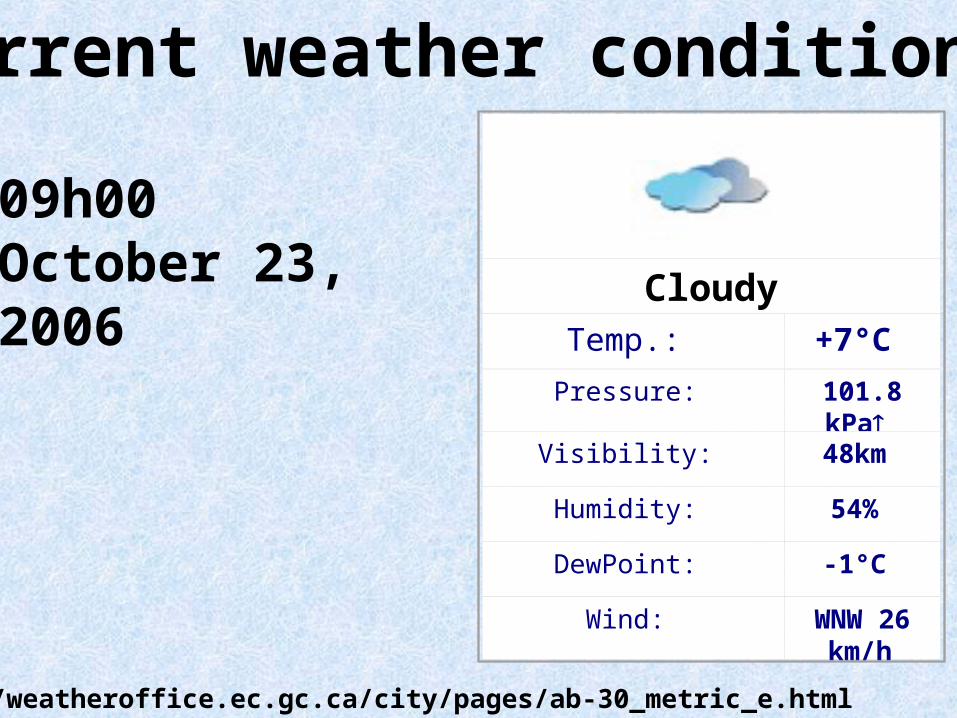
Current weather conditions
CloudyTemp.: +7°C
Pressure: 101.8kPa
Visibility: 48km
Humidity: 54%
DewPoint: -1°C
Wind: WNW 26km/h
09h00October 23, 2006
http://weatheroffice.ec.gc.ca/city/pages/ab-30_metric_e.html
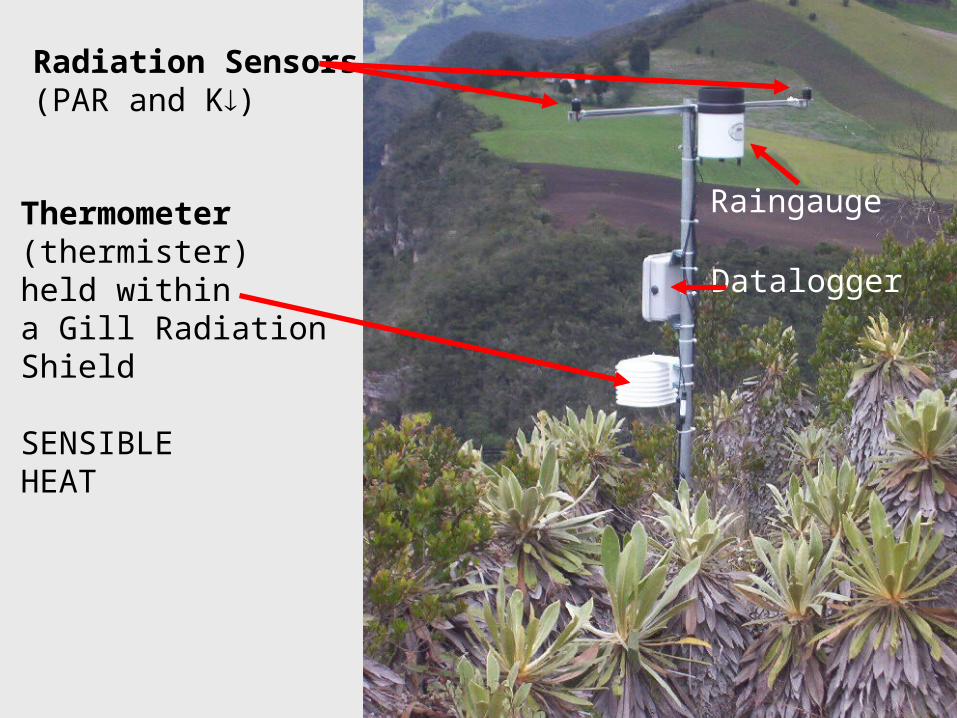
Thermometer(thermister)held withina Gill RadiationShield
SENSIBLEHEAT
Radiation Sensors(PAR and K)
Raingauge
Datalogger
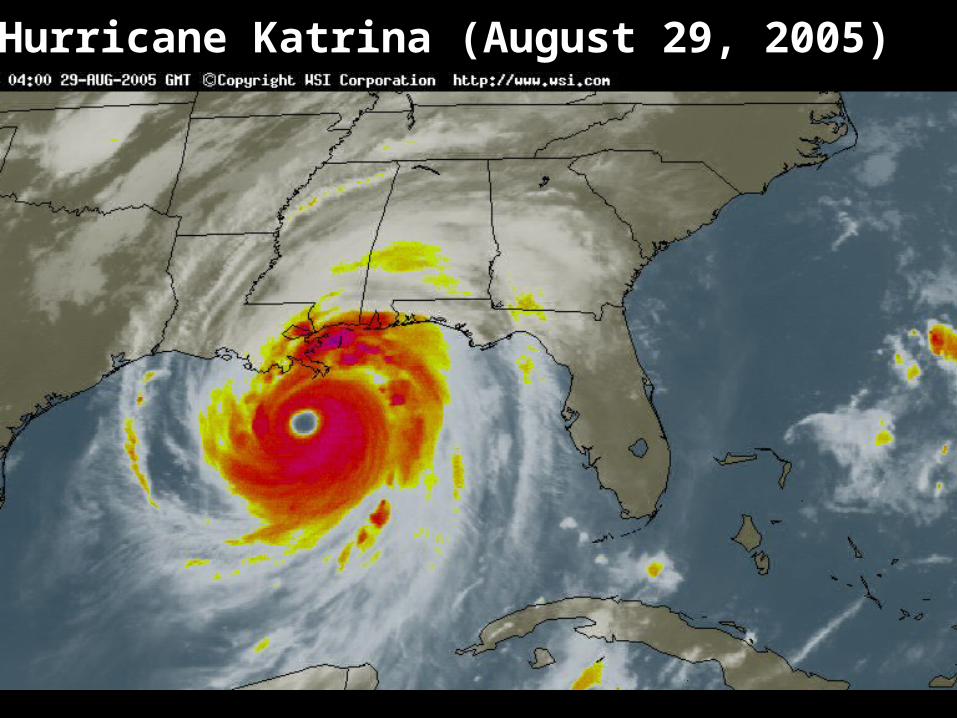
Hurricane Katrina (August 29, 2005)
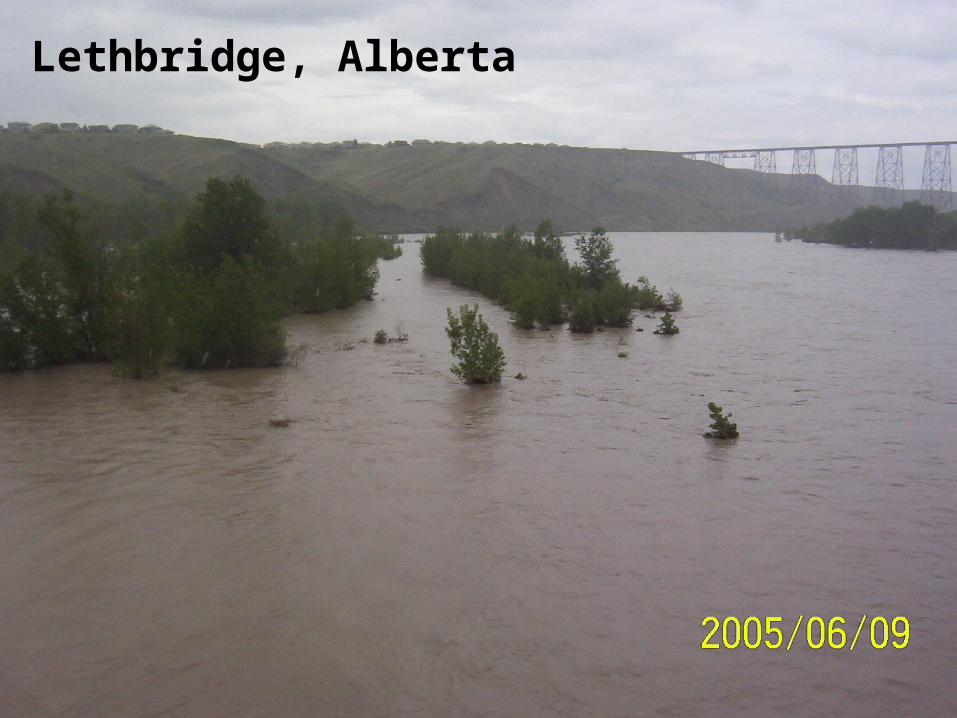
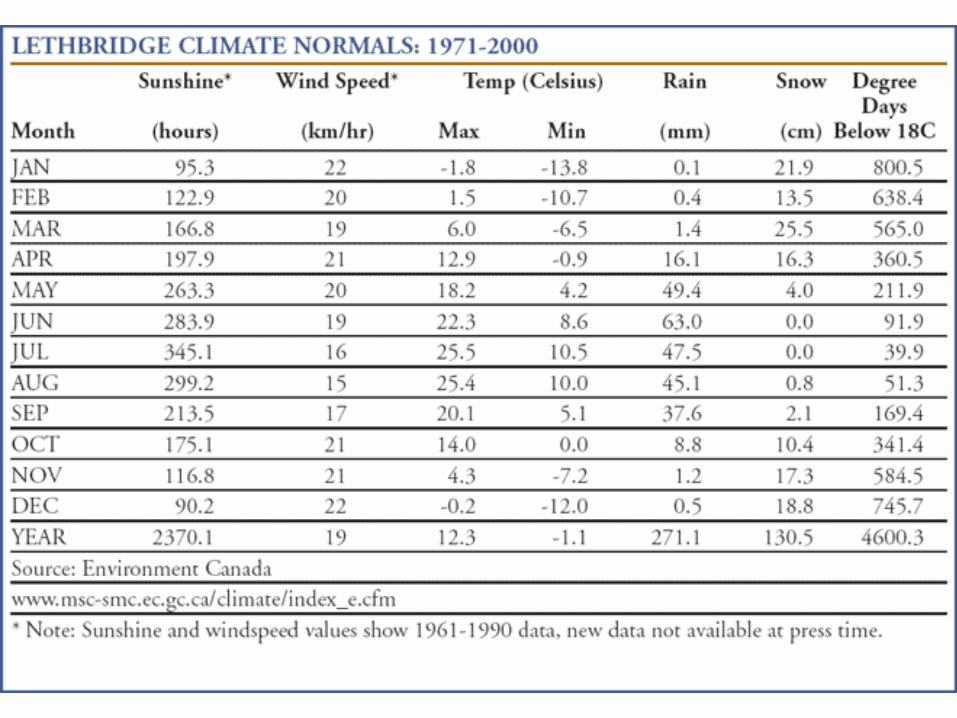
Lethbridge, Alberta
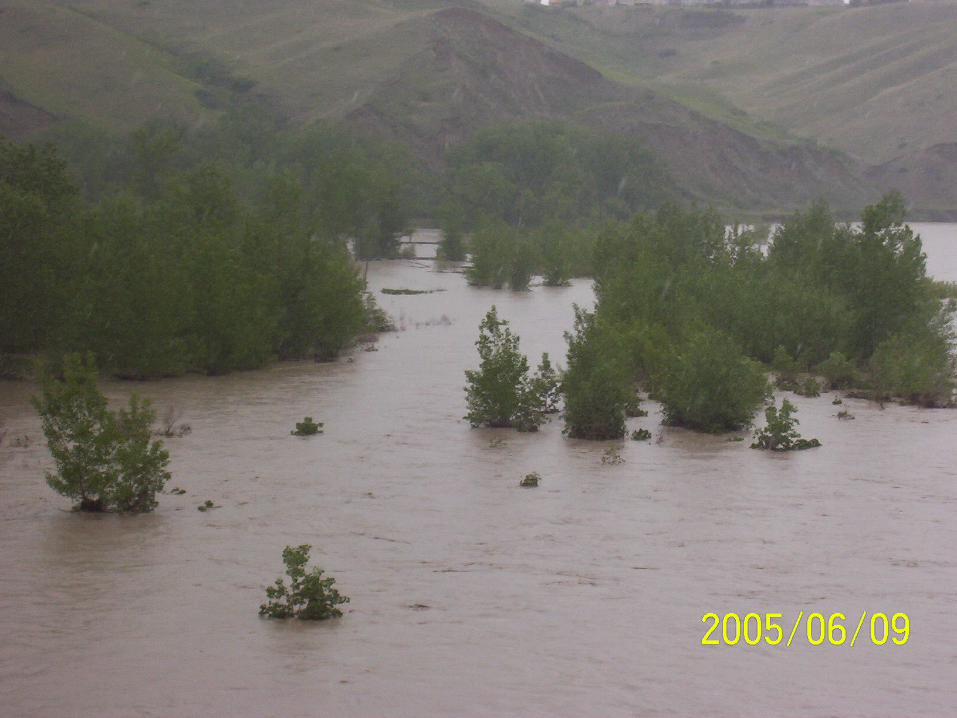
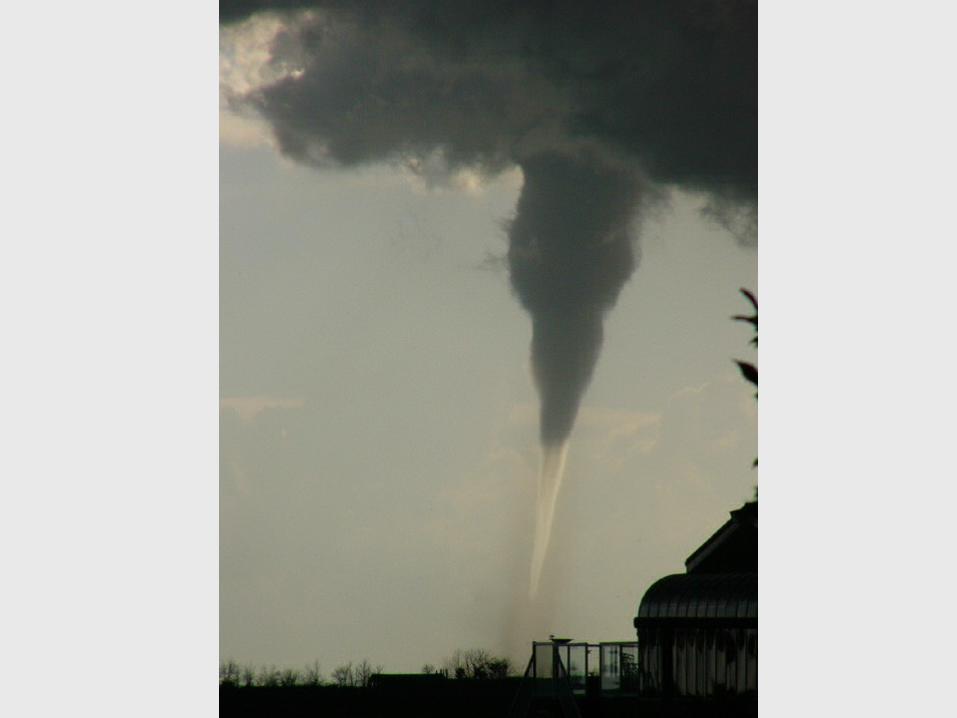
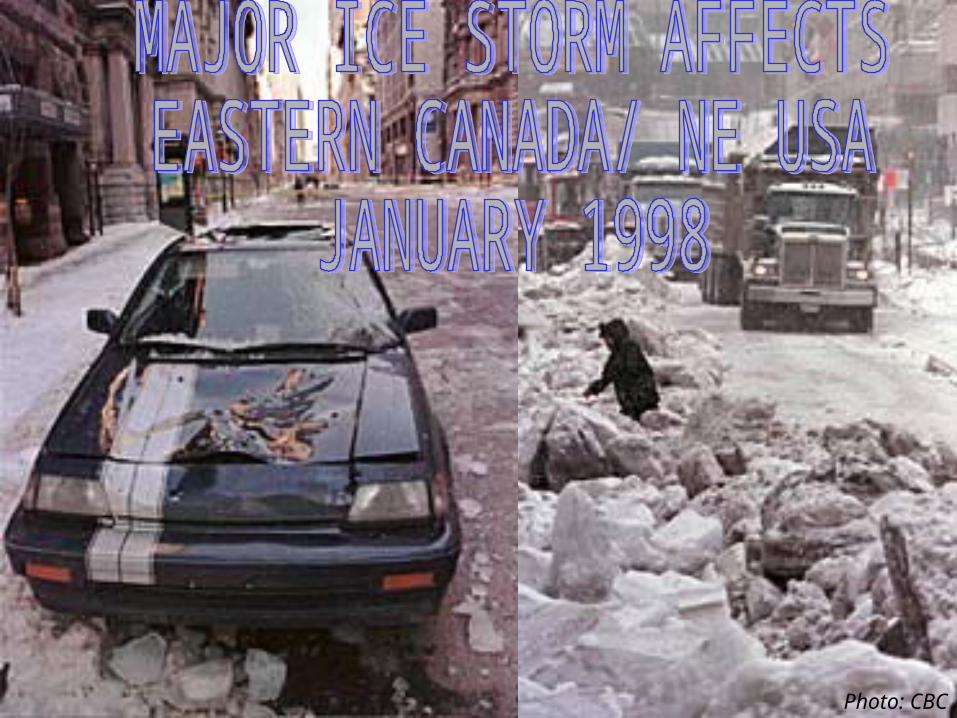
Photo: CBC

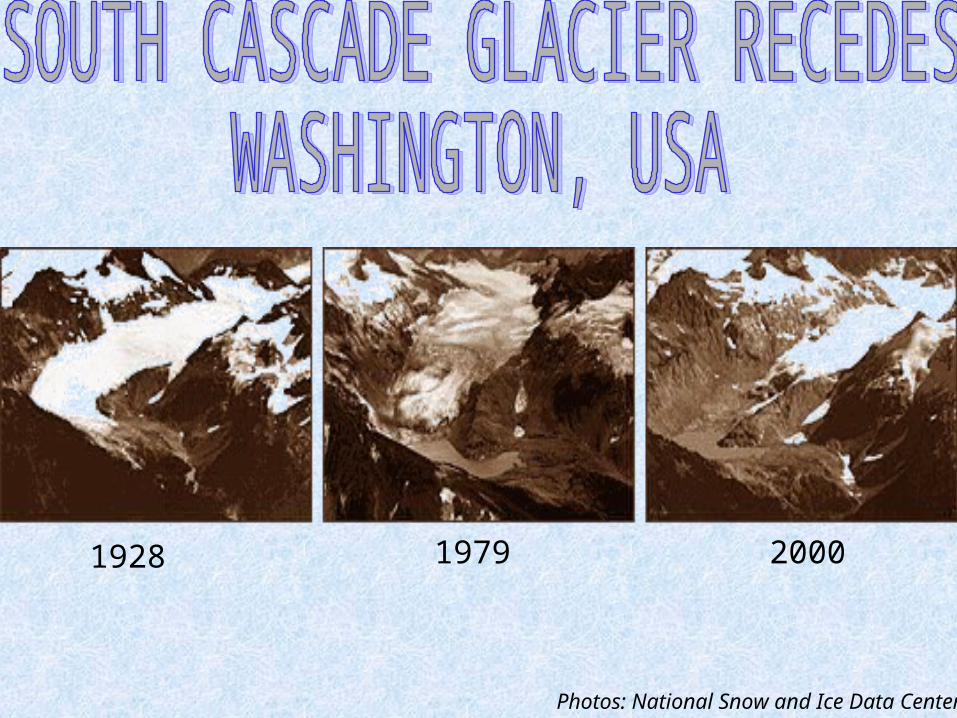
Photos: National Snow and Ice Data Center
1928 1979 2000
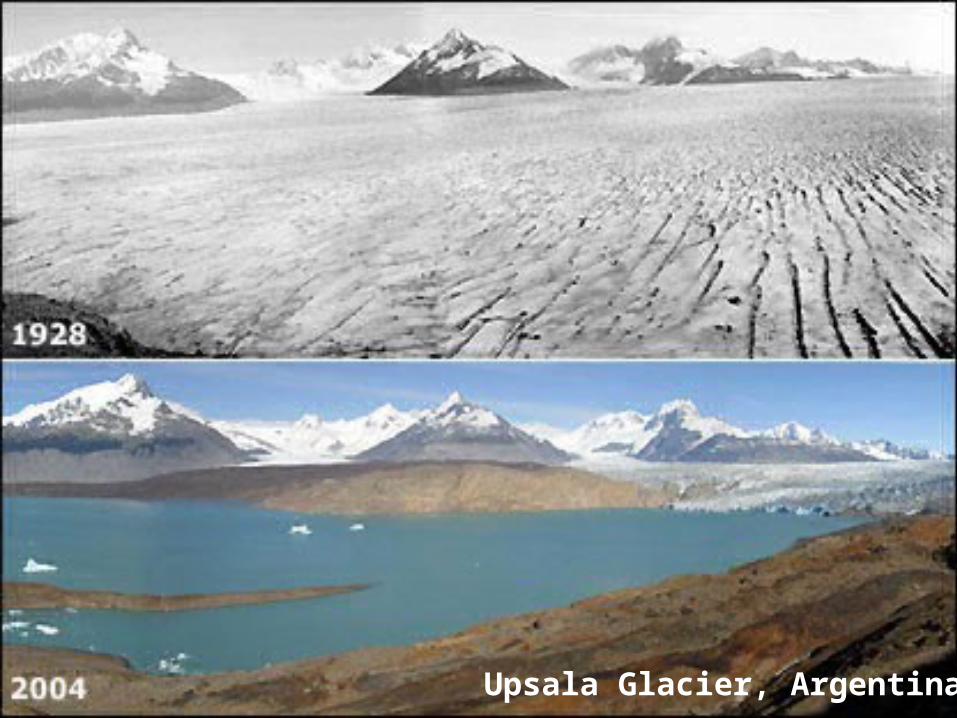
Upsala Glacier, Argentina
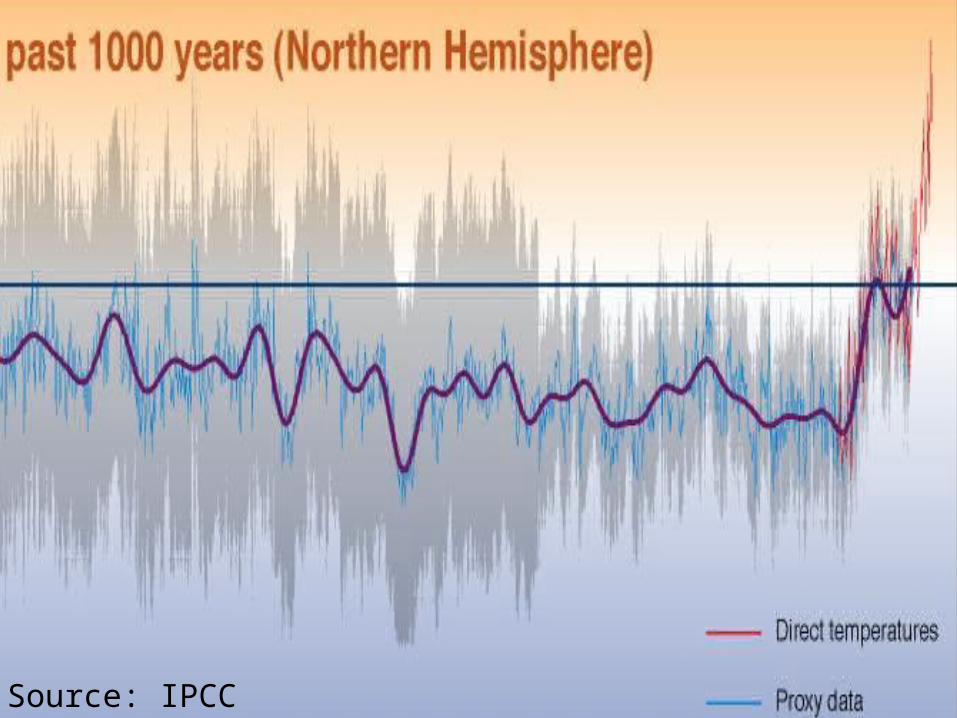
Source: IPCC
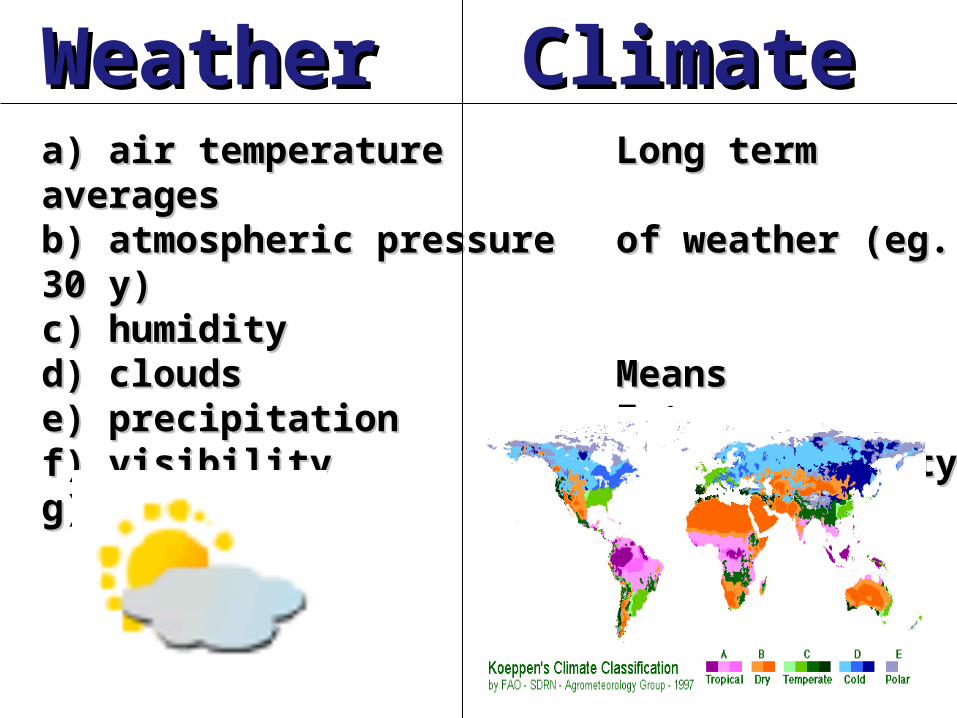
WeatherWeather ClimateClimatea) air temperature a) air temperature Long term averagesLong term averagesb) atmospheric pressure b) atmospheric pressure of weather (eg. 30 y)of weather (eg. 30 y)c) humidity c) humidity d) clouds d) clouds MeansMeanse) precipitation e) precipitation ExtremesExtremesf) visibilityf) visibility VariabilityVariabilityg) windg) wind
0
20
40
60
80
100
120
140
160
180
200
J F M A M J J A S O N D
Month
Pre
cip
itat
ion
(m
m)
-10
-5
0
5
10
15
20
25
Tem
per
atu
re (
deg
rees
C)
Precip
Temp
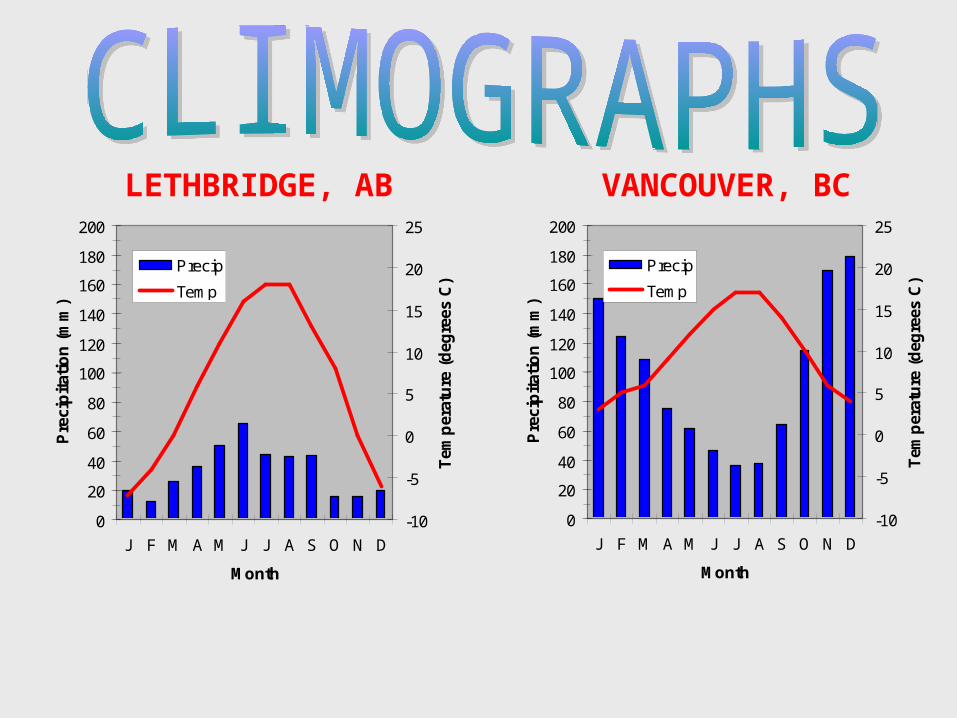
LETHBRIDGE, AB VANCOUVER, BC
0
20
40
60
80
100
120
140
160
180
200
J F M A M J J A S O N D
Month
Pre
cip
itat
ion
(m
m)
-10
-5
0
5
10
15
20
25
Tem
per
atu
re (
deg
rees
C)
Precip
Temp
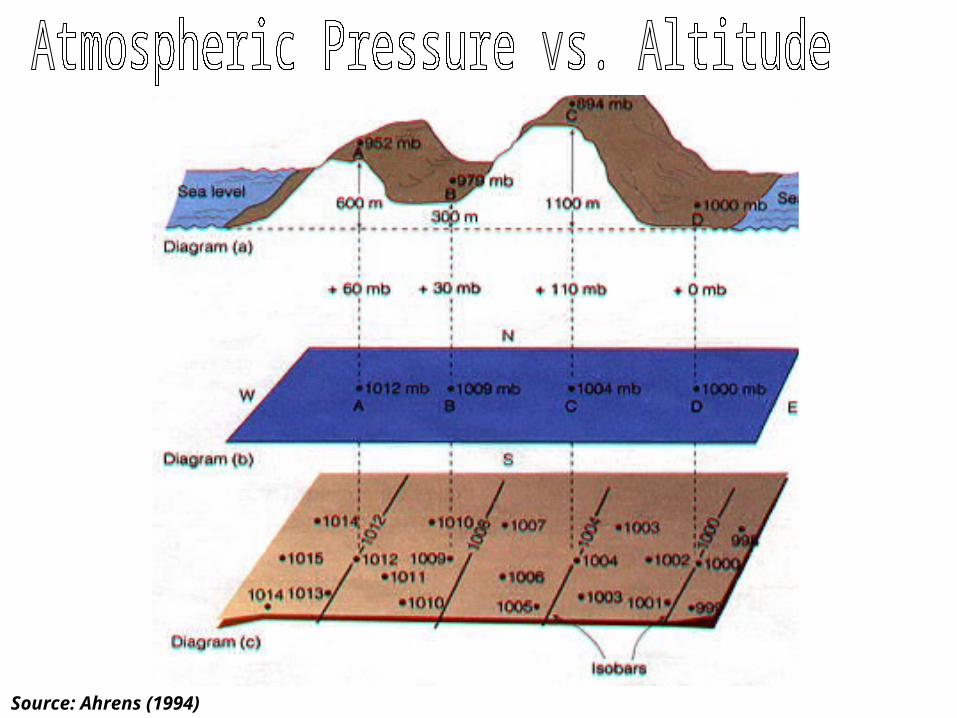
Source: Ahrens (1994)
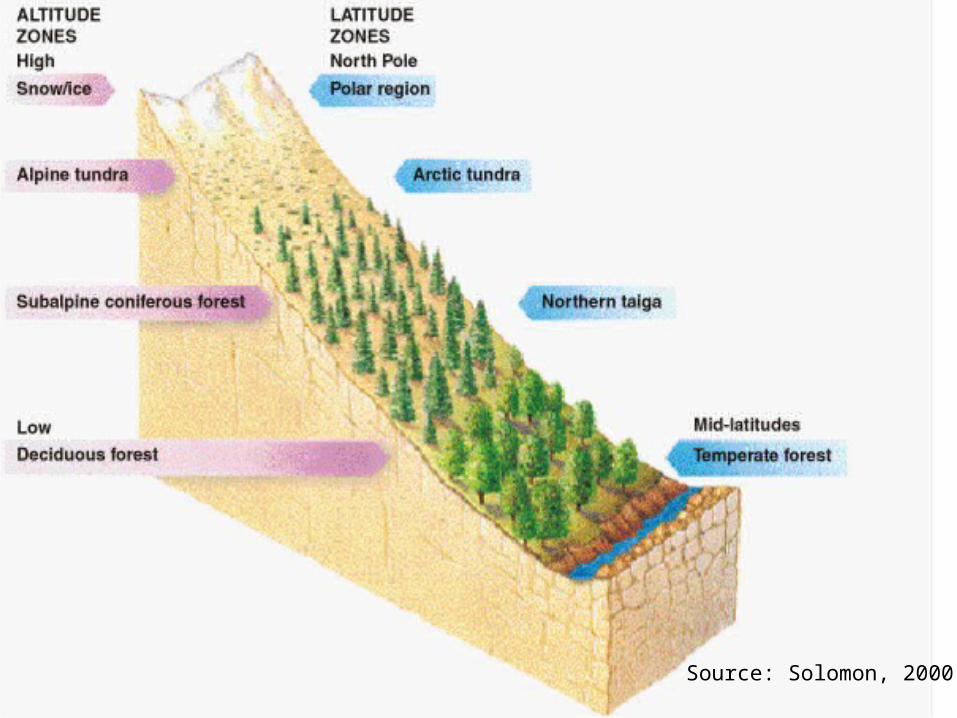
Source: Solomon, 2000
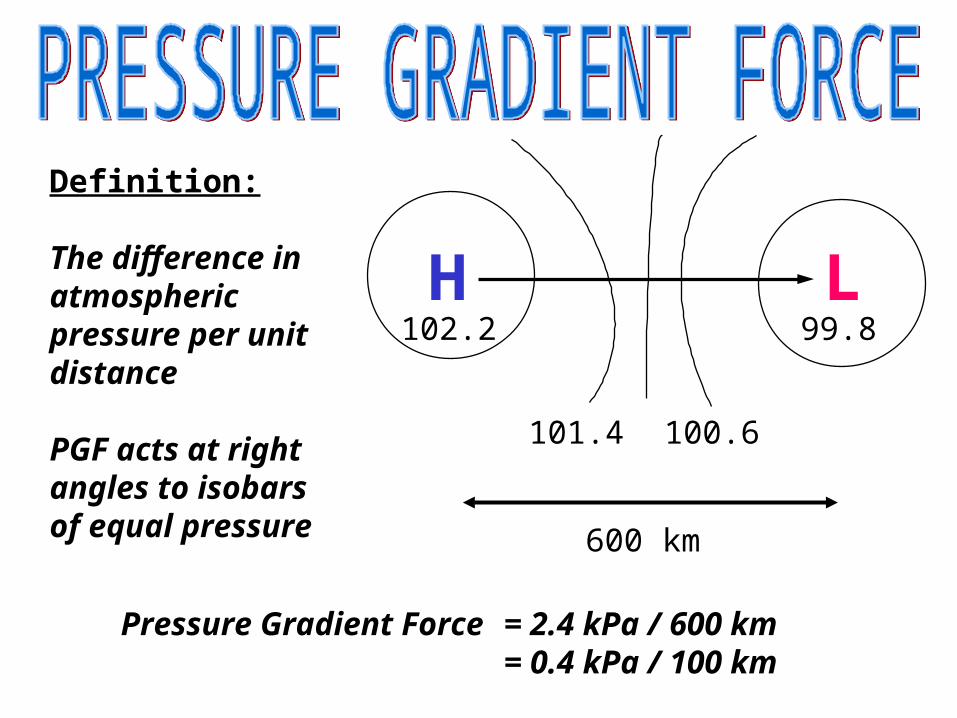
H L102.2 99.8
101.4 100.6
600 km
Pressure Gradient Force = 2.4 kPa / 600 km= 0.4 kPa / 100 km
Definition:
The difference inatmosphericpressure per unitdistance
PGF acts at rightangles to isobarsof equal pressure
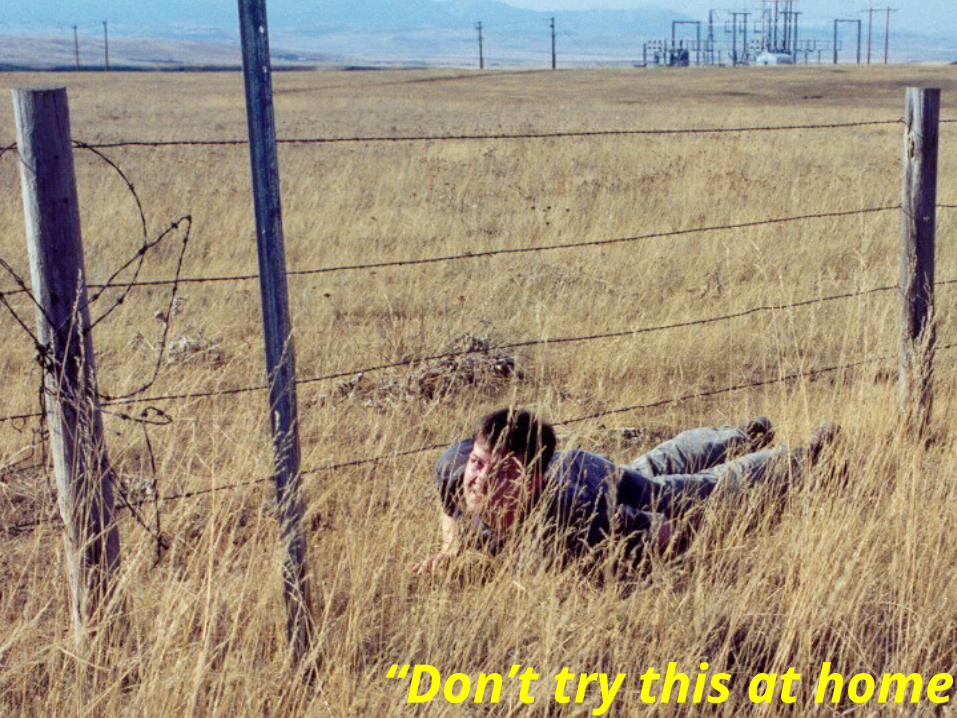
“Don’t try this at home”
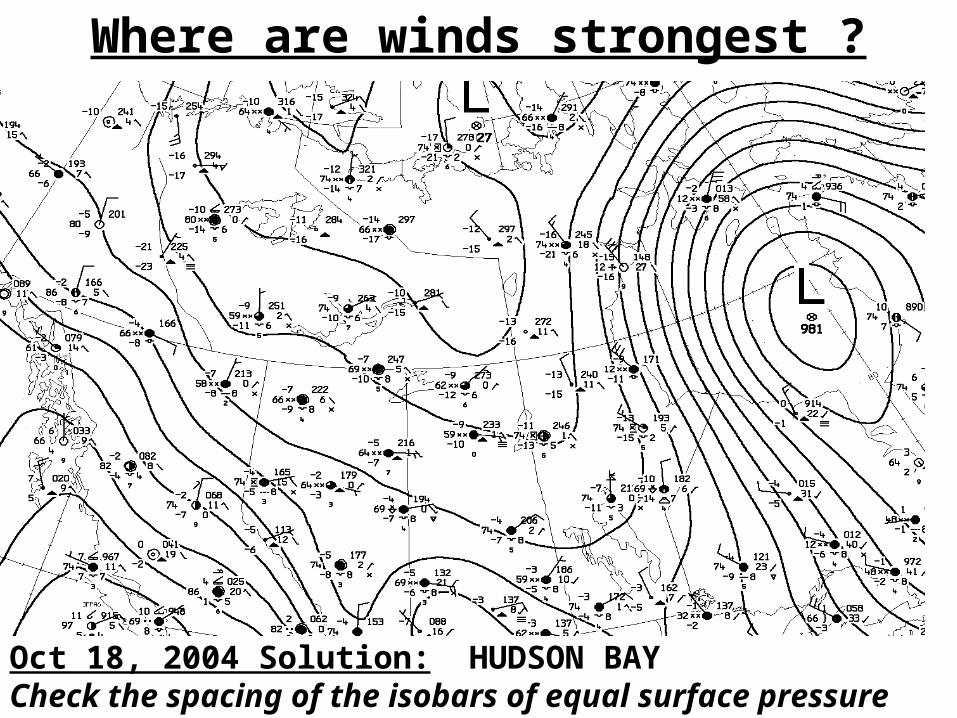
Where are winds strongest ?
Oct 18, 2004 Solution: HUDSON BAYCheck the spacing of the isobars of equal surface pressure
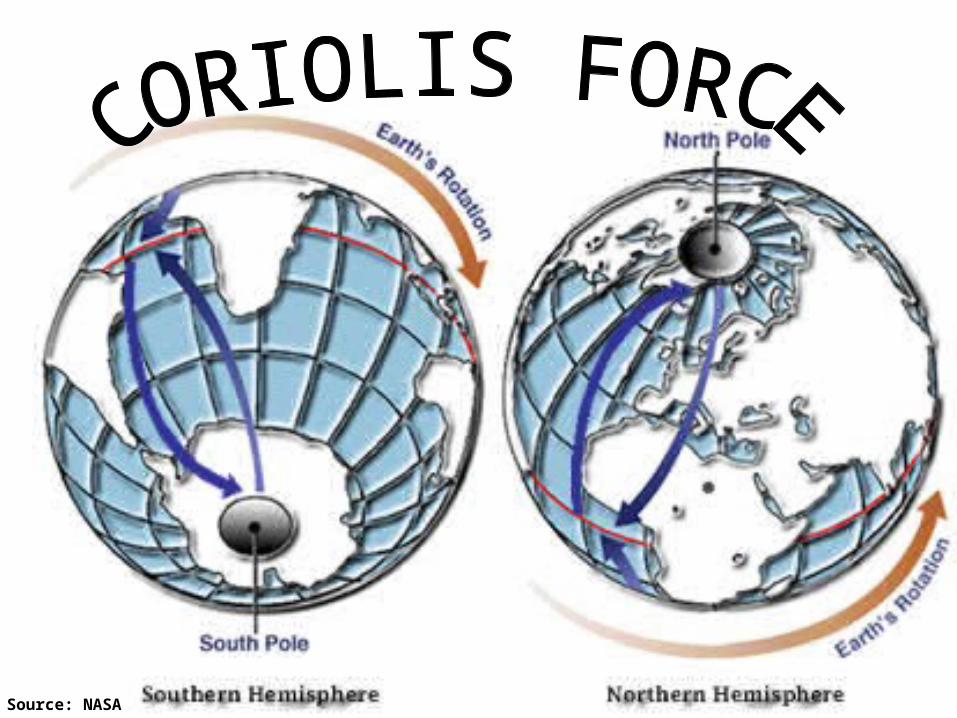
Source: NASA
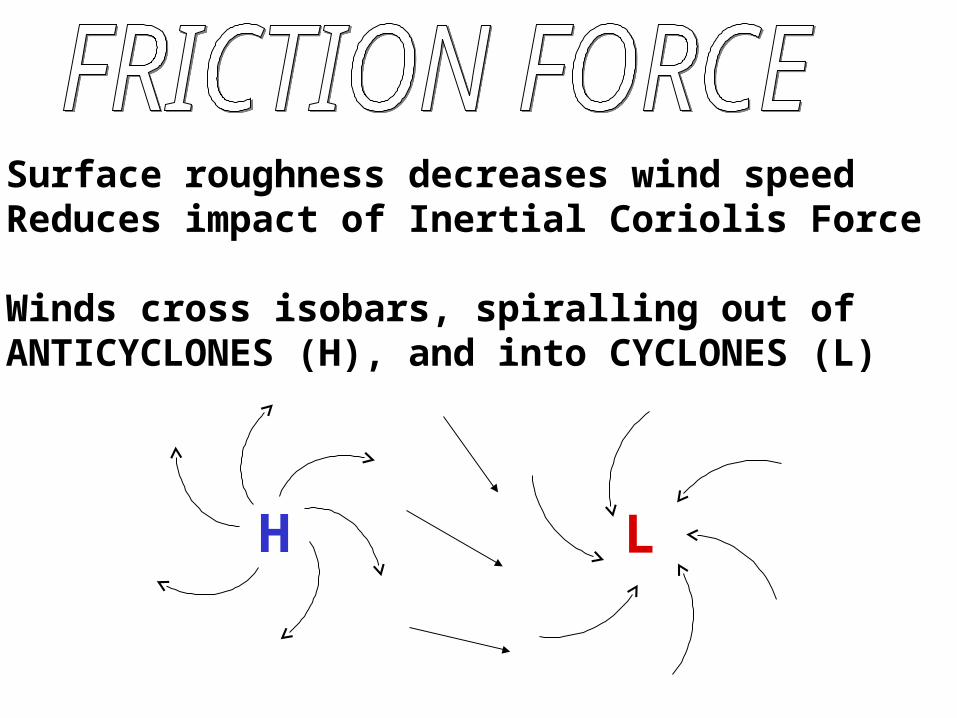
Surface roughness decreases wind speedReduces impact of Inertial Coriolis Force
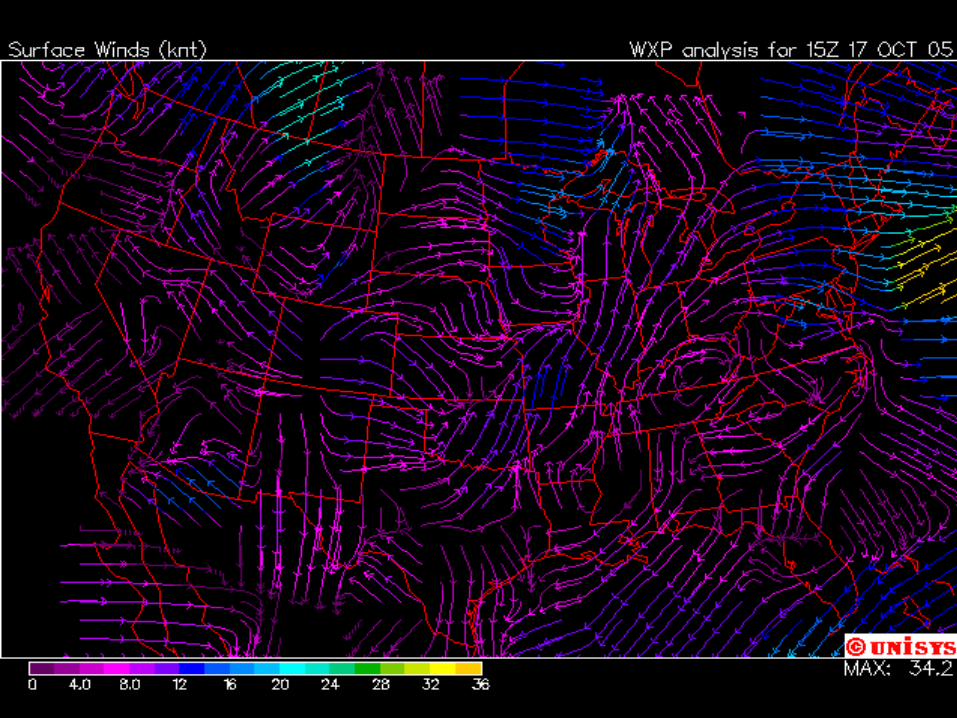
Winds cross isobars, spiralling out ofANTICYCLONES (H), and into CYCLONES (L)
H L
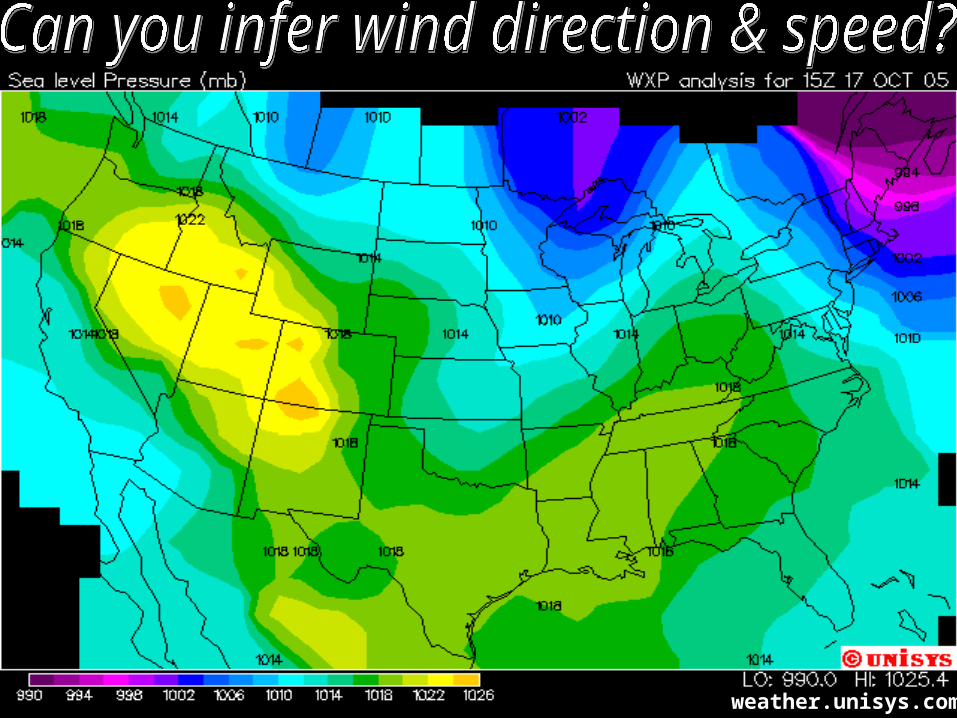
weather.unisys.com
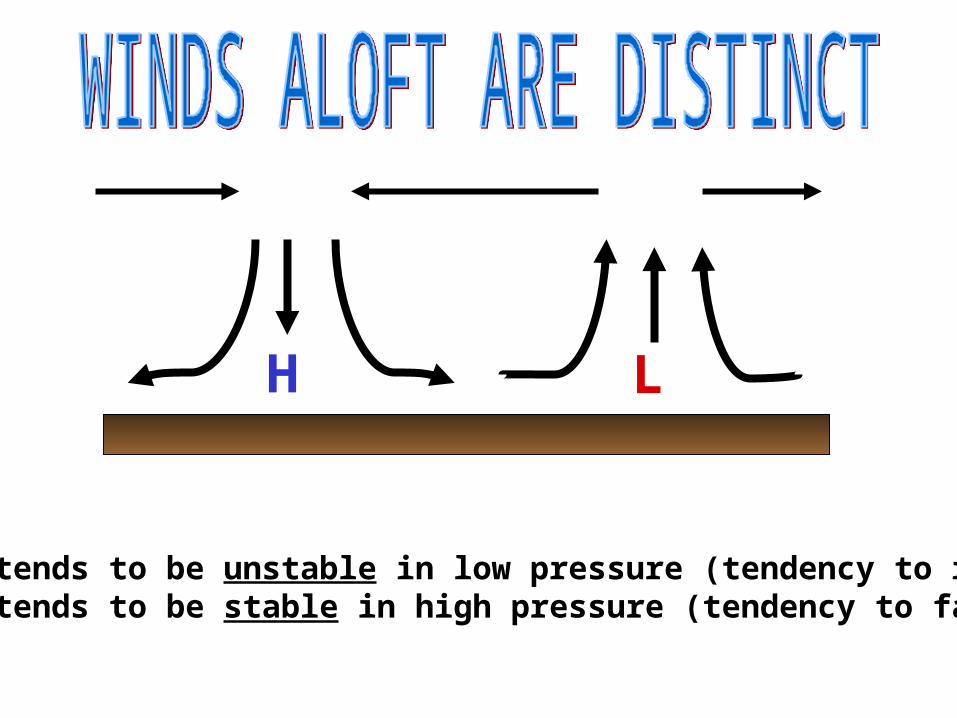
H L
Air tends to be unstable in low pressure (tendency to rise)Air tends to be stable in high pressure (tendency to fall)
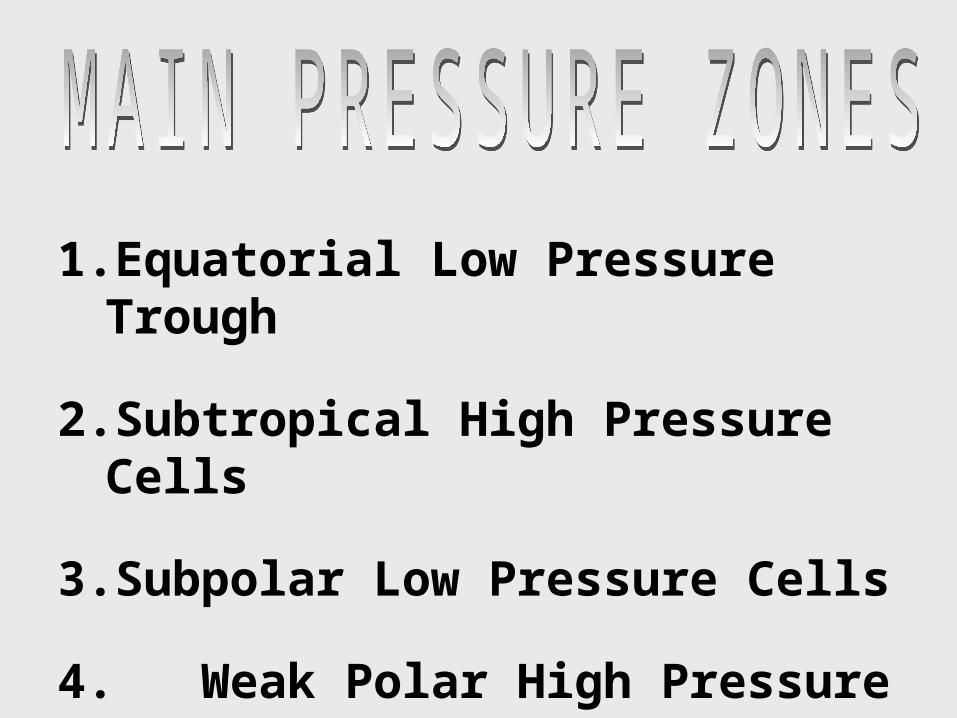
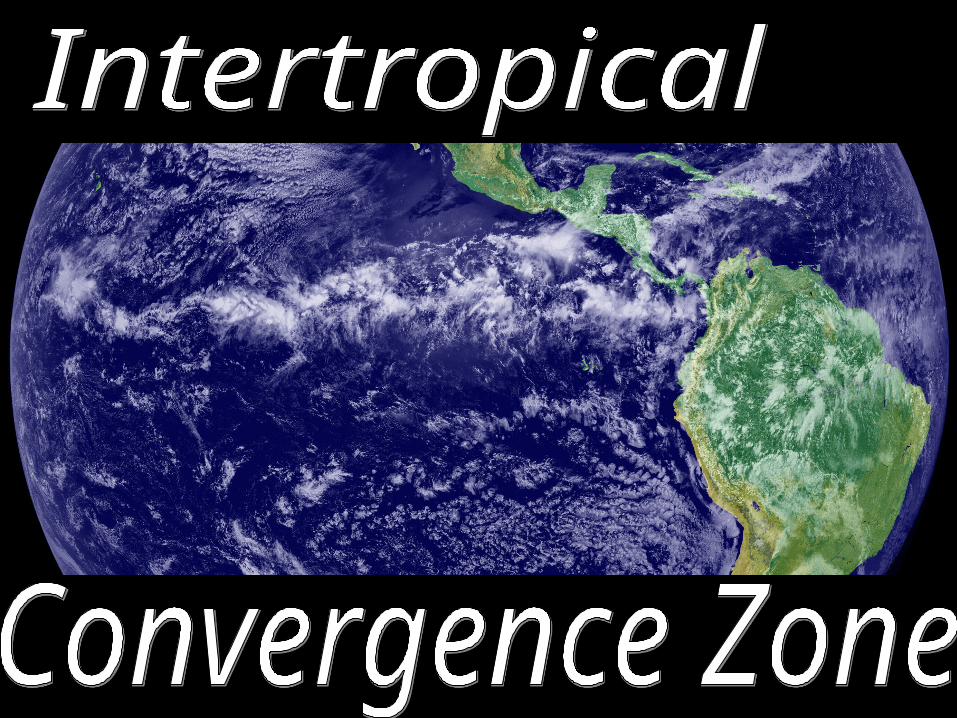
1. Equatorial Low Pressure Trough
2. Subtropical High Pressure Cells
3. Subpolar Low Pressure Cells
4. Weak Polar High Pressure Cells
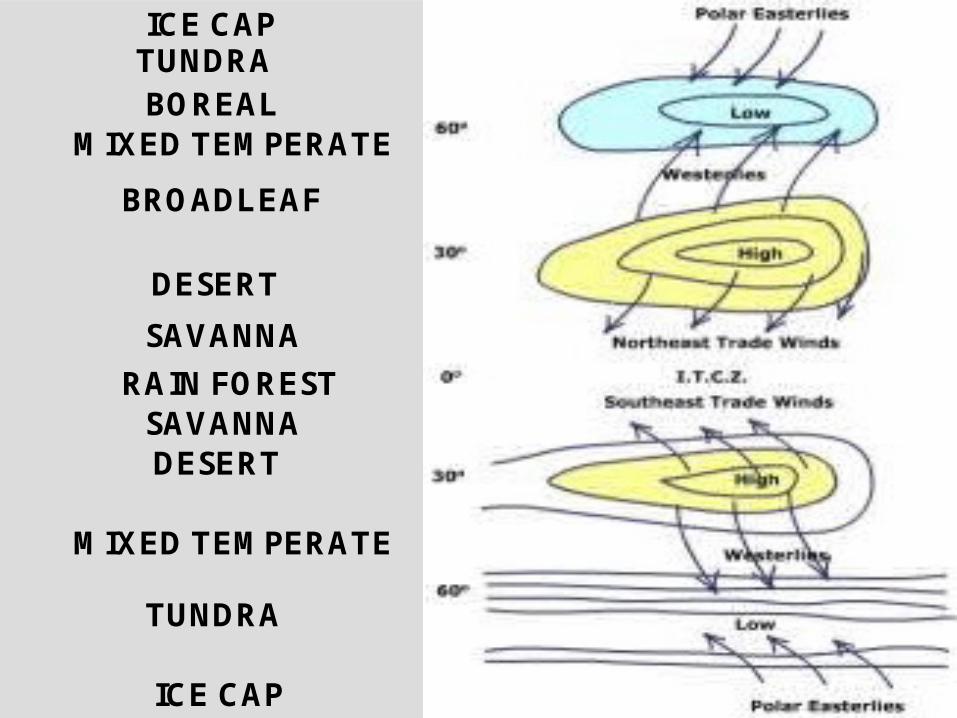
RAIN FOREST
SAVANNA
SAVANNA
DESERT
DESERT
BROADLEAF
BOREALTUNDRAICE CAP
ICE CAP
TUNDRA
MIXED TEMPERATE
MIXED TEMPERATE

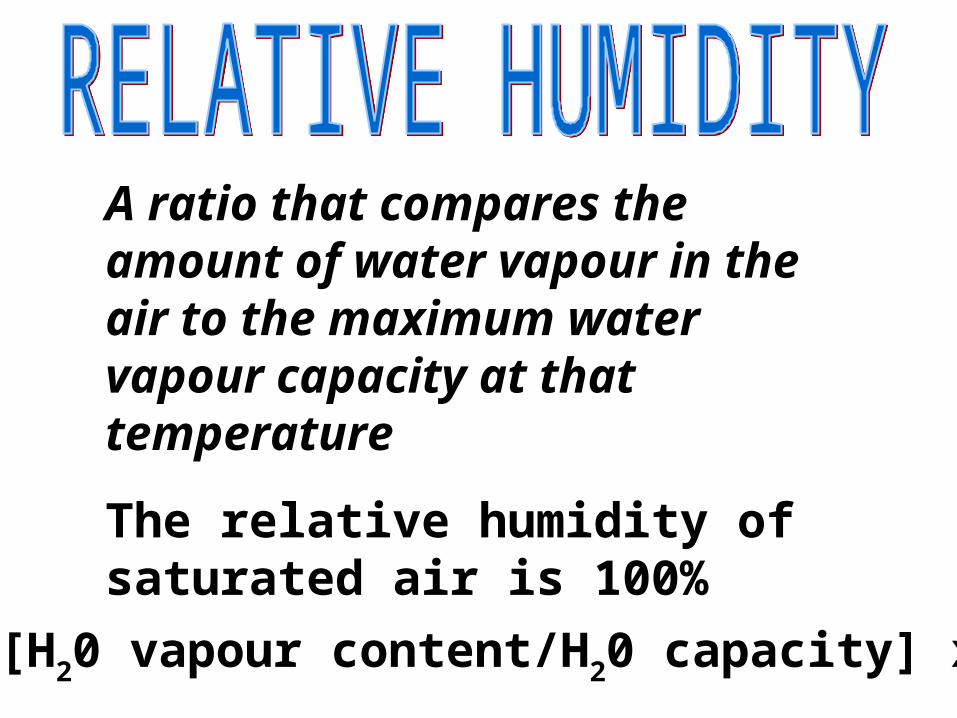
A ratio that compares the amount of water vapour in the air to the maximum water vapour capacity at that temperature
The relative humidity of saturated air is 100%
RH = [H20 vapour content/H20 capacity] x 100
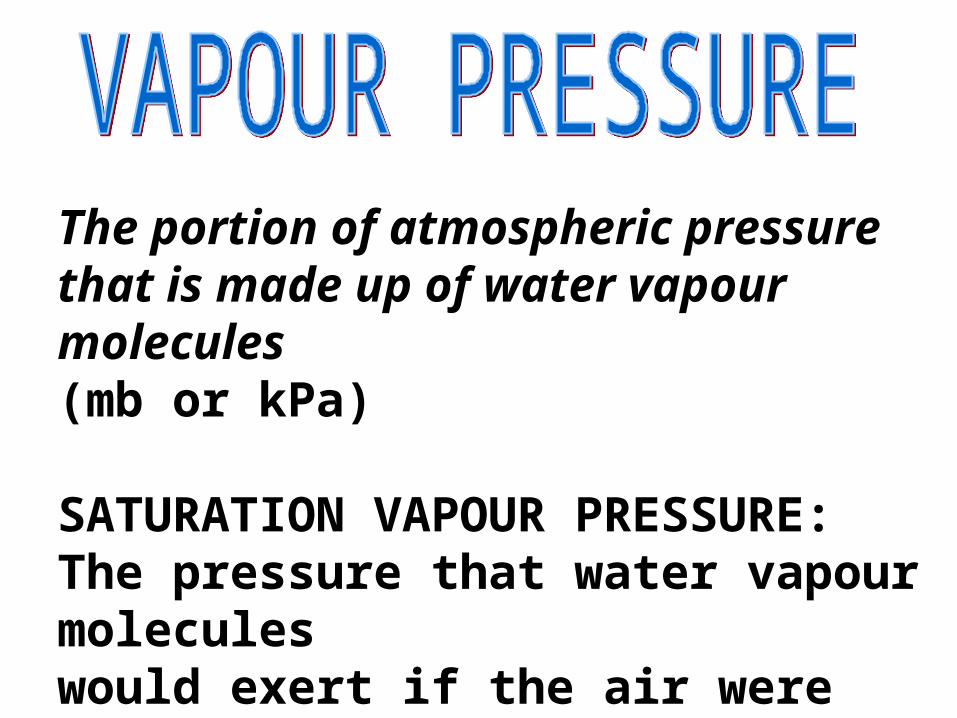
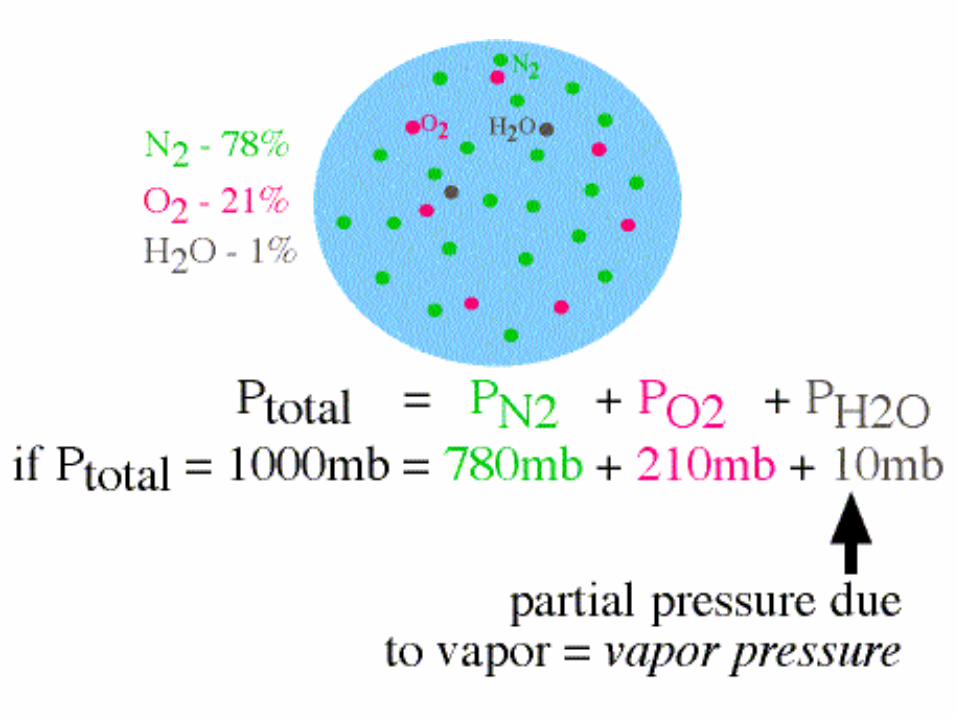
The portion of atmospheric pressure that is made up of water vapour molecules (mb or kPa)
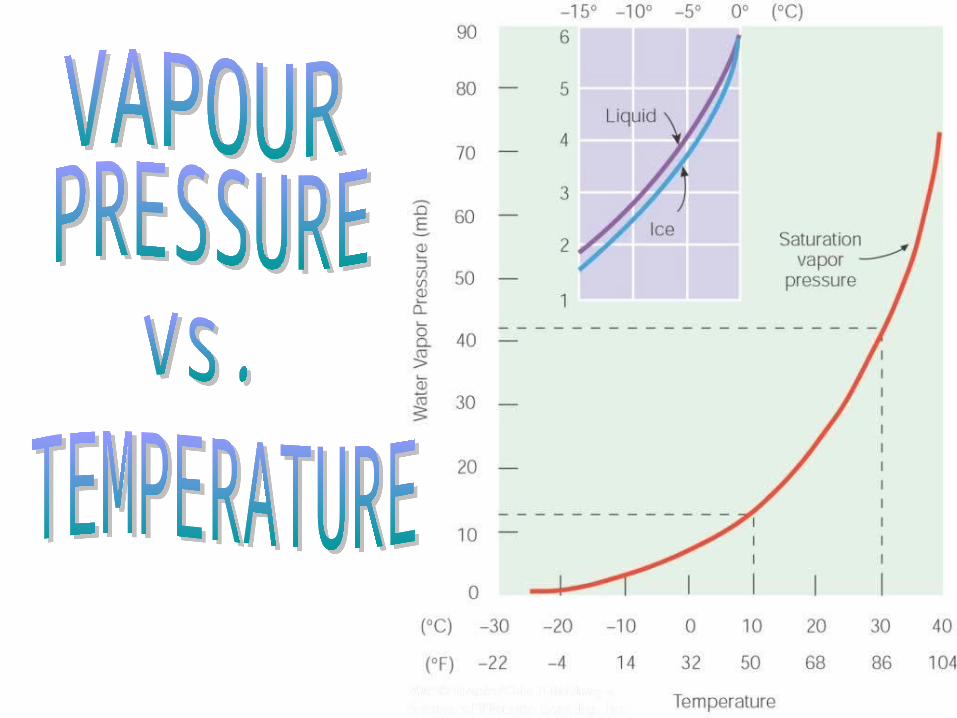
SATURATION VAPOUR PRESSURE:The pressure that water vapour moleculeswould exert if the air were saturated(at a given temperature)
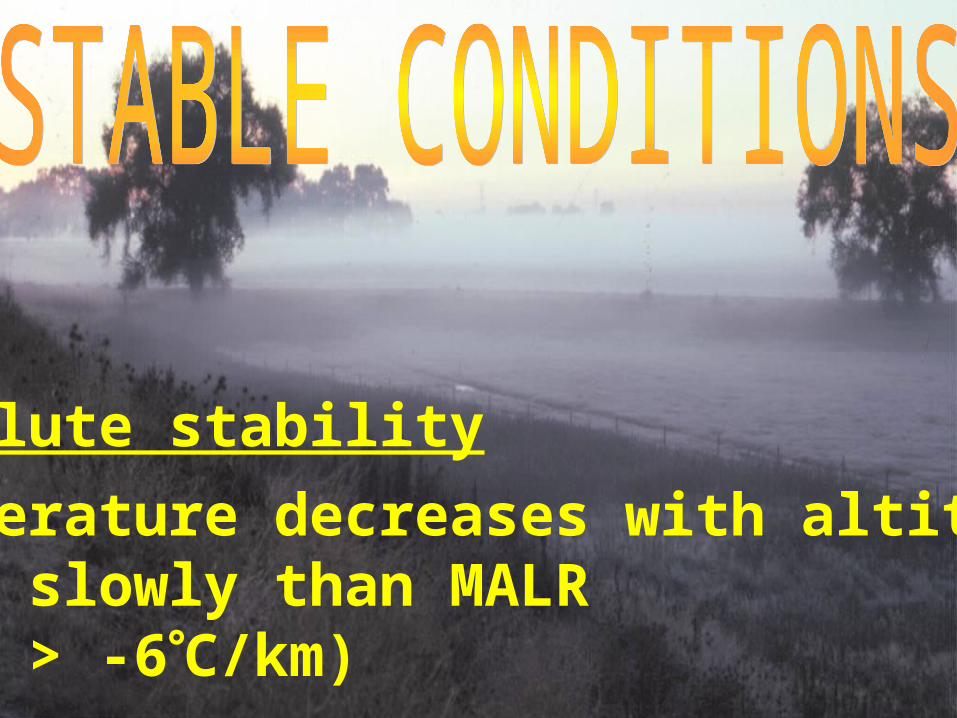
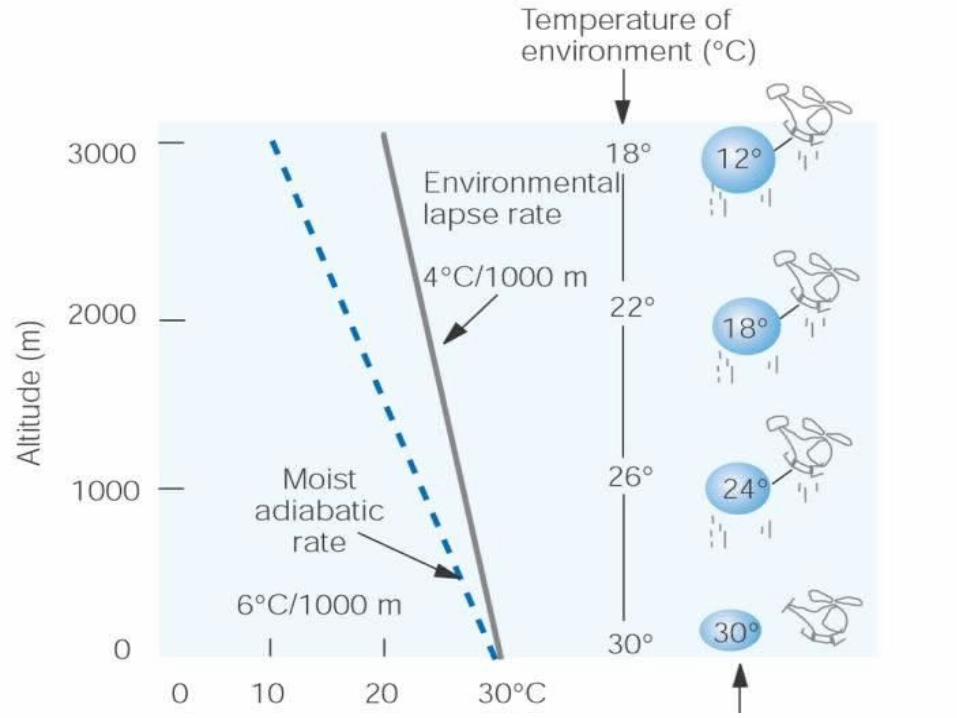
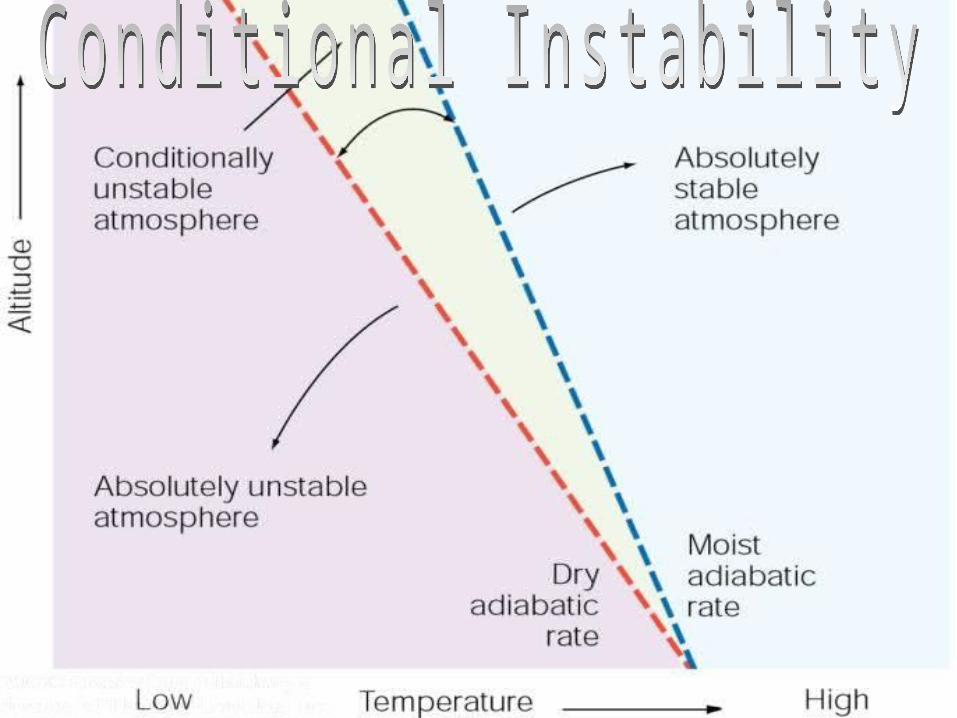
Absolute stability
Temperature decreases with altitudemore slowly than MALR (ELR > -6C/km)
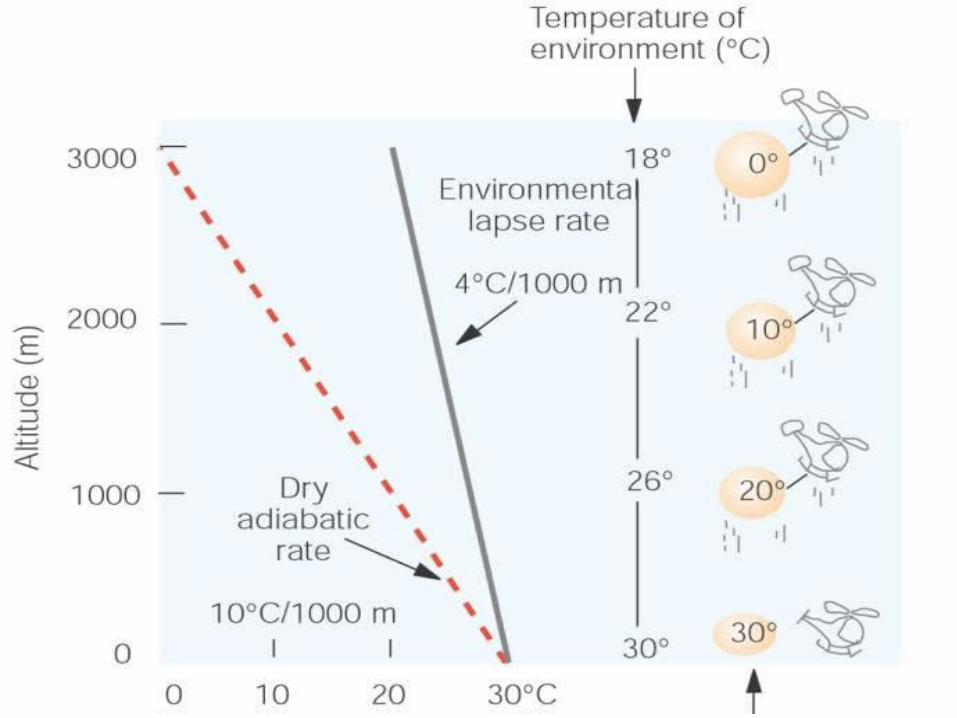
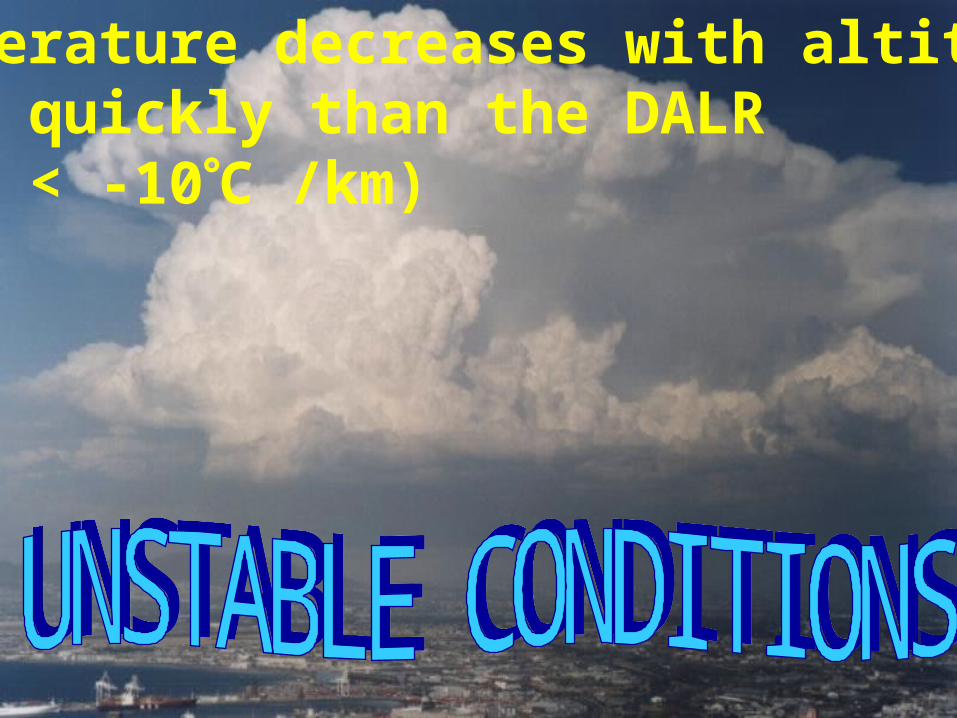
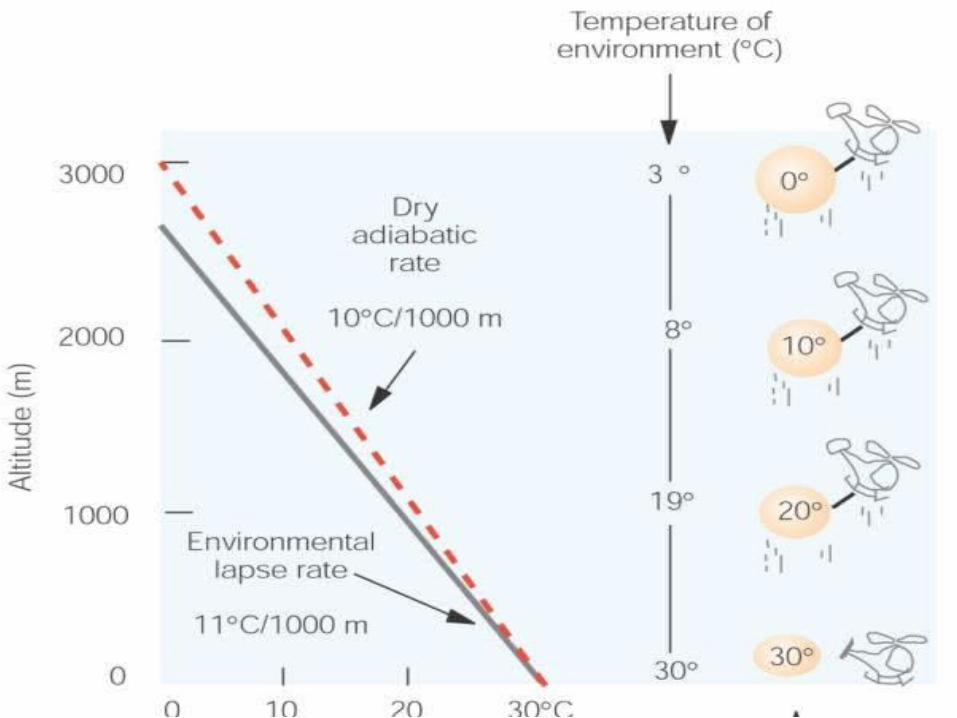
Temperature decreases with altitudemore quickly than the DALR(ELR < -10C /km)
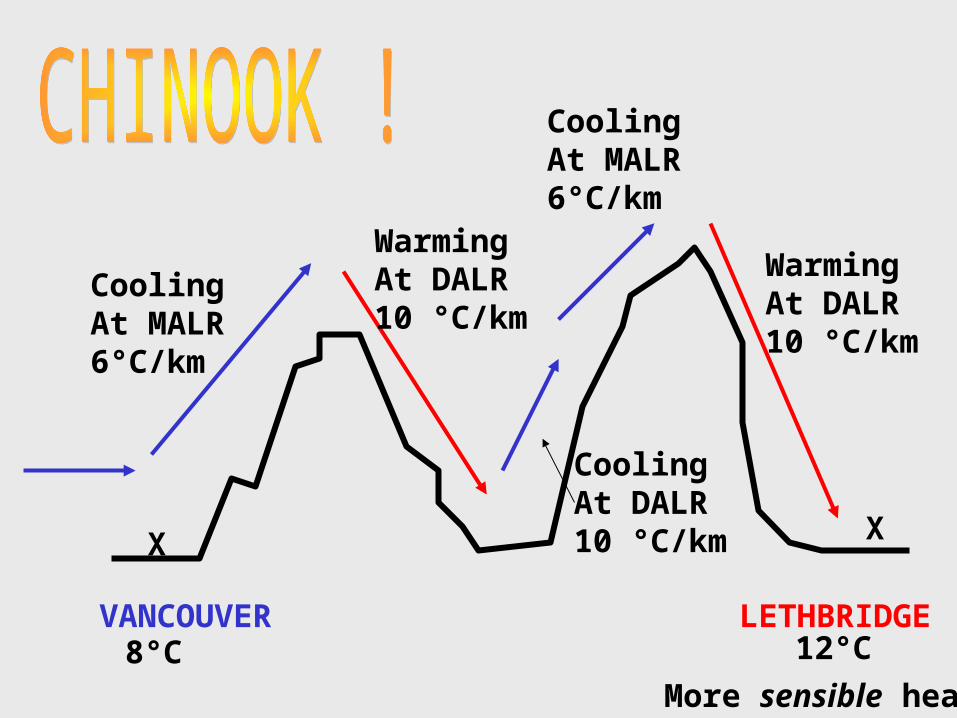
VANCOUVER LETHBRIDGE8°C 12°C
X X
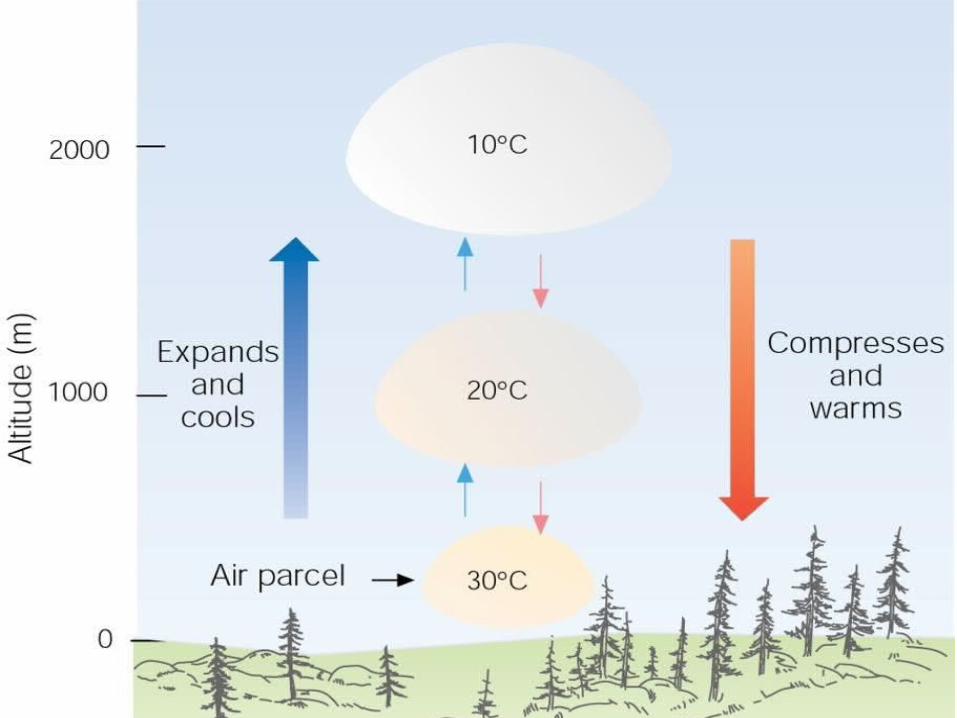
CoolingAt MALR6°C/km
WarmingAt DALR10 °C/km
CoolingAt DALR10 °C/km
CoolingAt MALR6°C/km
WarmingAt DALR10 °C/km
More sensible heat
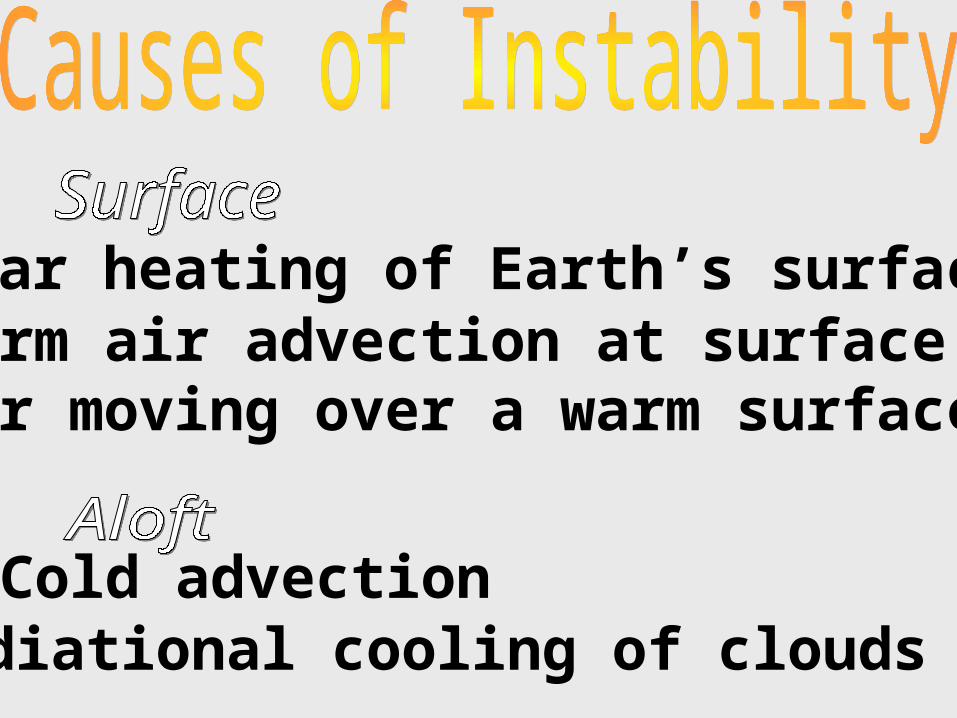
Cold advectionRadiational cooling of clouds
Solar heating of Earth’s surfaceWarm air advection at surfaceAir moving over a warm surface

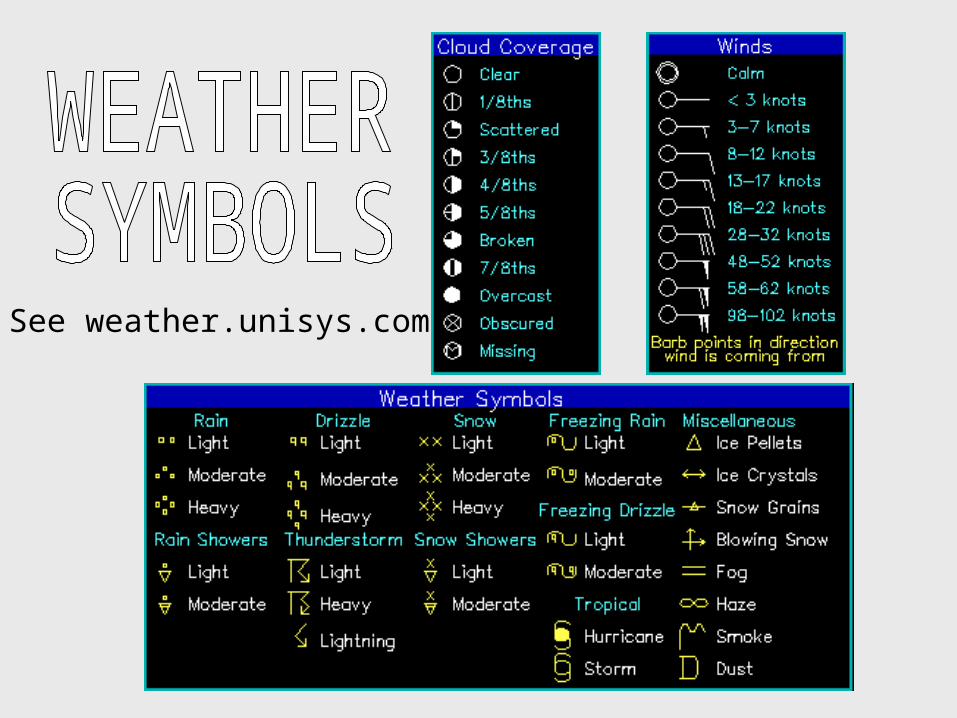
See weather.unisys.com
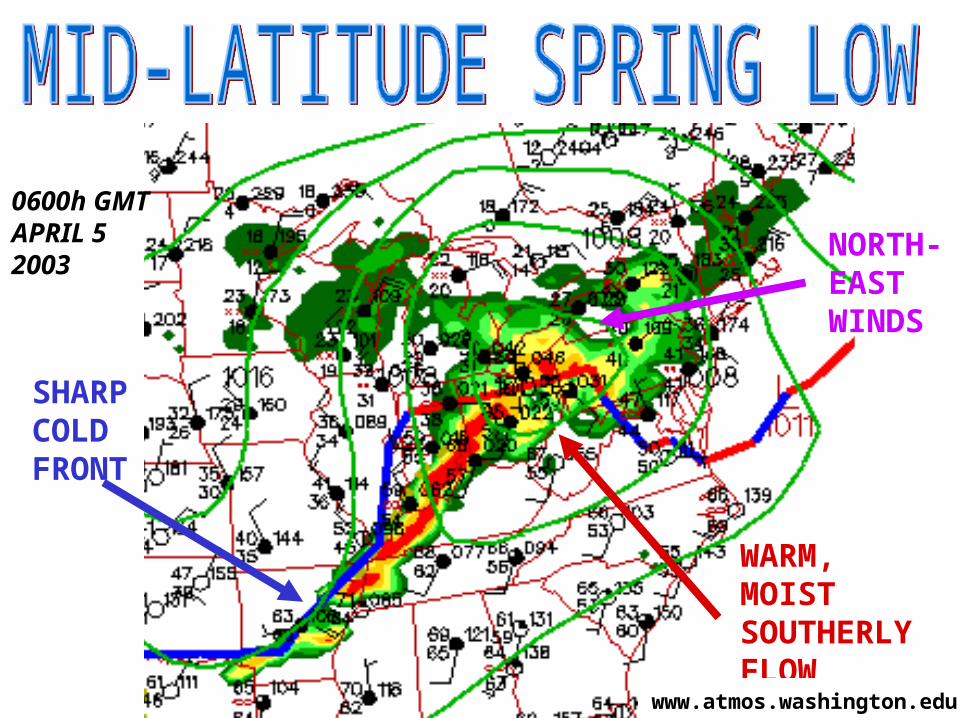
SHARPCOLDFRONT
WARM,MOISTSOUTHERLYFLOW
NORTH-EASTWINDS
www.atmos.washington.edu
0600h GMTAPRIL 52003
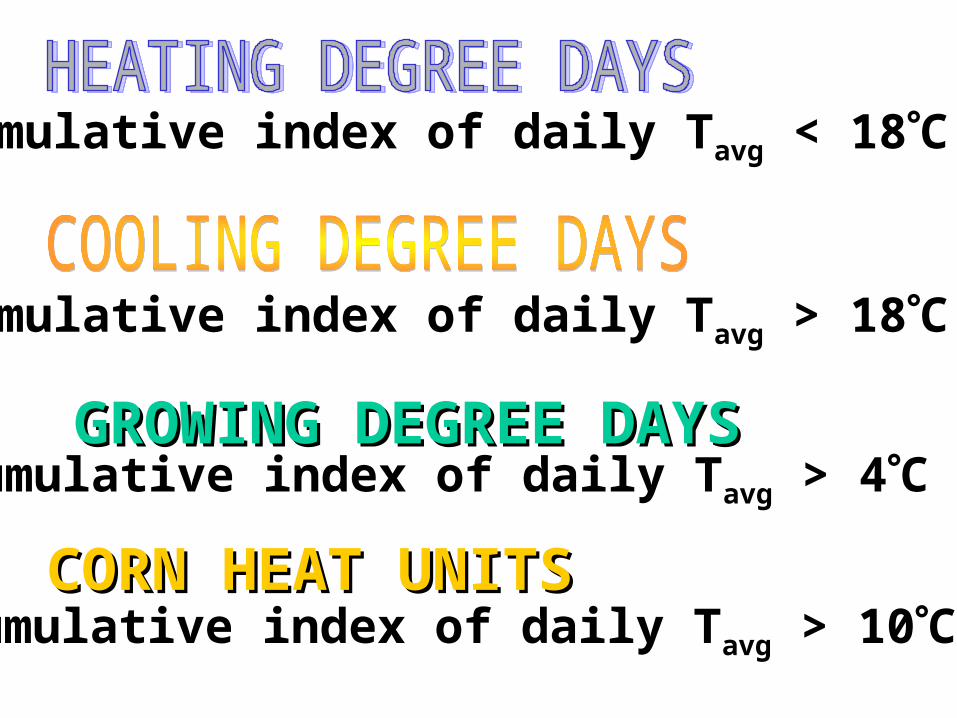
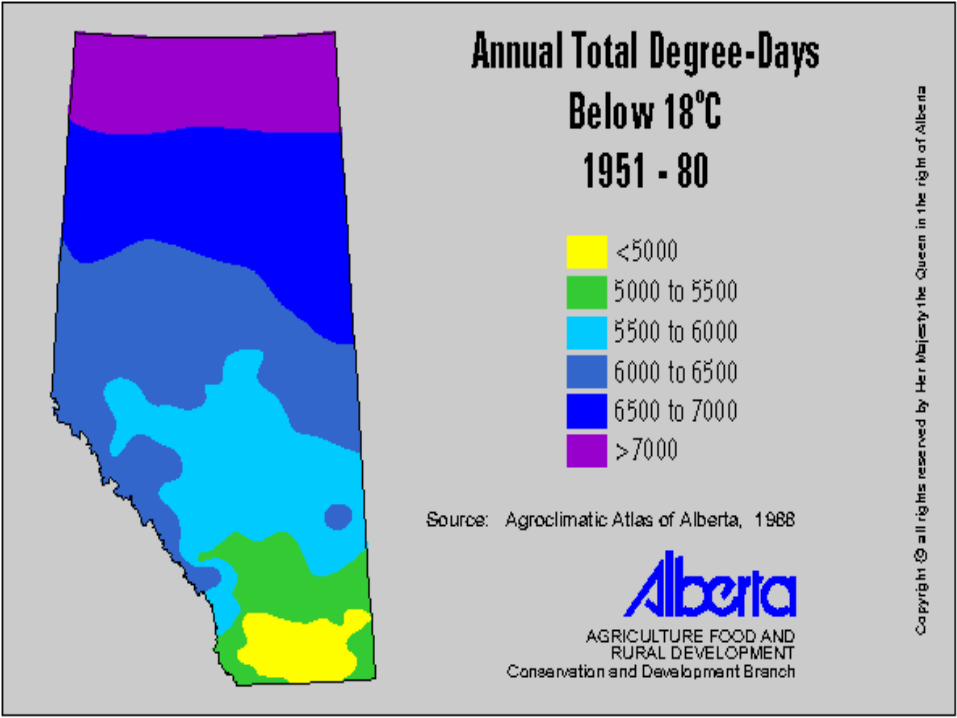
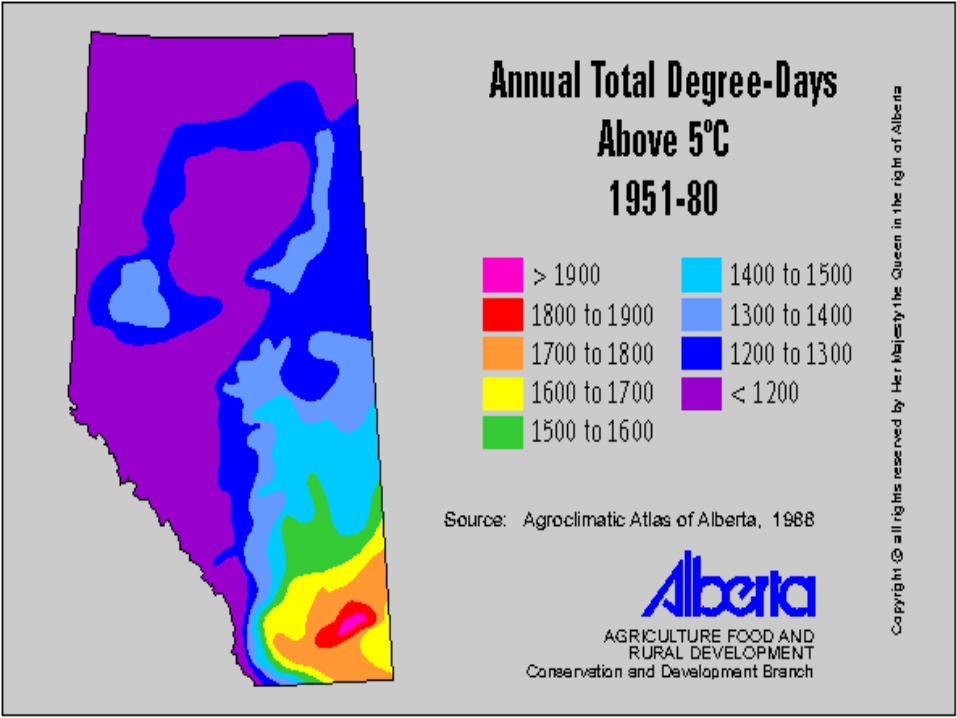
GROWING DEGREE DAYSGROWING DEGREE DAYS
CORN HEAT UNITSCORN HEAT UNITS
Cumulative index of daily Tavg < 18C
Cumulative index of daily Tavg > 18C
Cumulative index of daily Tavg > 4C
Cumulative index of daily Tavg > 10C