Embed Size (px)
Citation preview
Wealth Management Outlook 2nd Quarter 2018
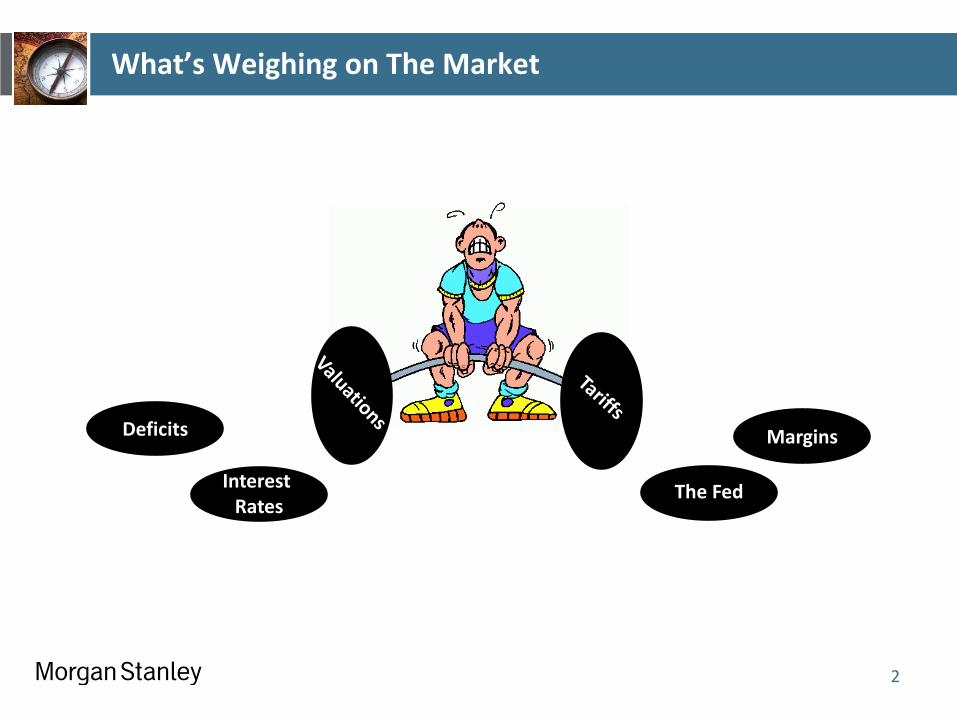
What’s Weighing on The Market
2
Deficits
Interest Rates
The Fed
Margins
Executive Summary
Market Performance
The Return of Volatility
What Might Be Causing This?
Fixed Income As An Asset Class
3
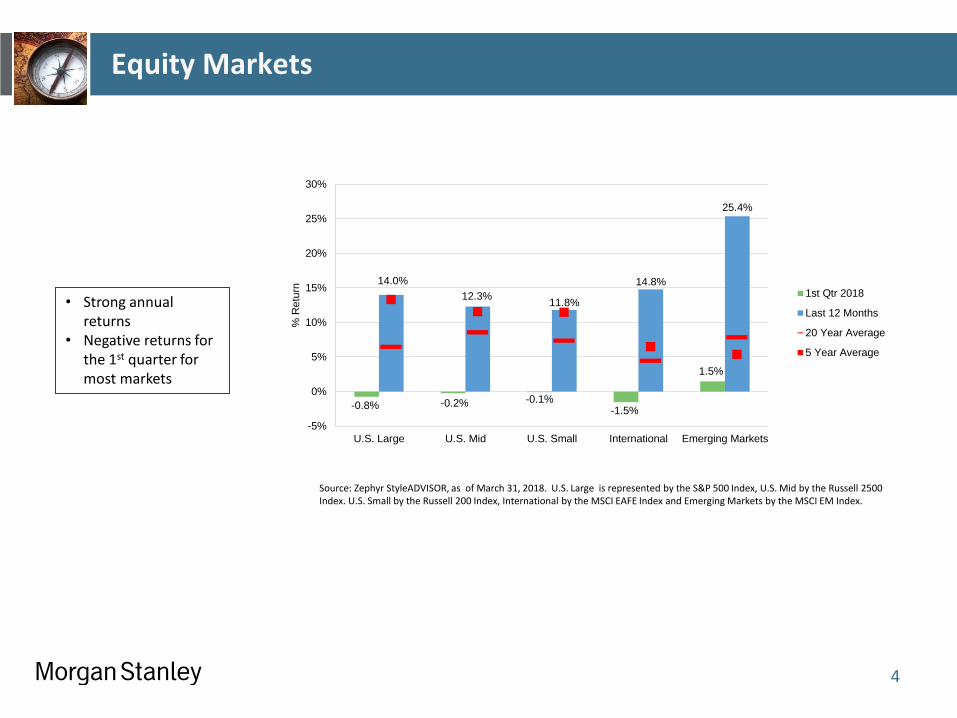
Equity Markets
Source: Zephyr StyleADVISOR, as of March 31, 2018. U.S. Large is represented by the S&P 500 Index, U.S. Mid by the Russell 2500 Index. U.S. Small by the Russell 200 Index, International by the MSCI EAFE Index and Emerging Markets by the MSCI EM Index.
• Strong annual returns
• Negative returns for the 1st quarter for most markets
4
-0.8% -0.2% -0.1% -1.5%
1.5%
14.0%
12.3% 11.8%
14.8%
25.4%
-5%
0%
5%
10%
15%
20%
25%
30%
U.S. Large U.S. Mid U.S. Small International Emerging Markets
% R
etu
rn
1st Qtr 2018
Last 12 Months
20 Year Average
5 Year Average
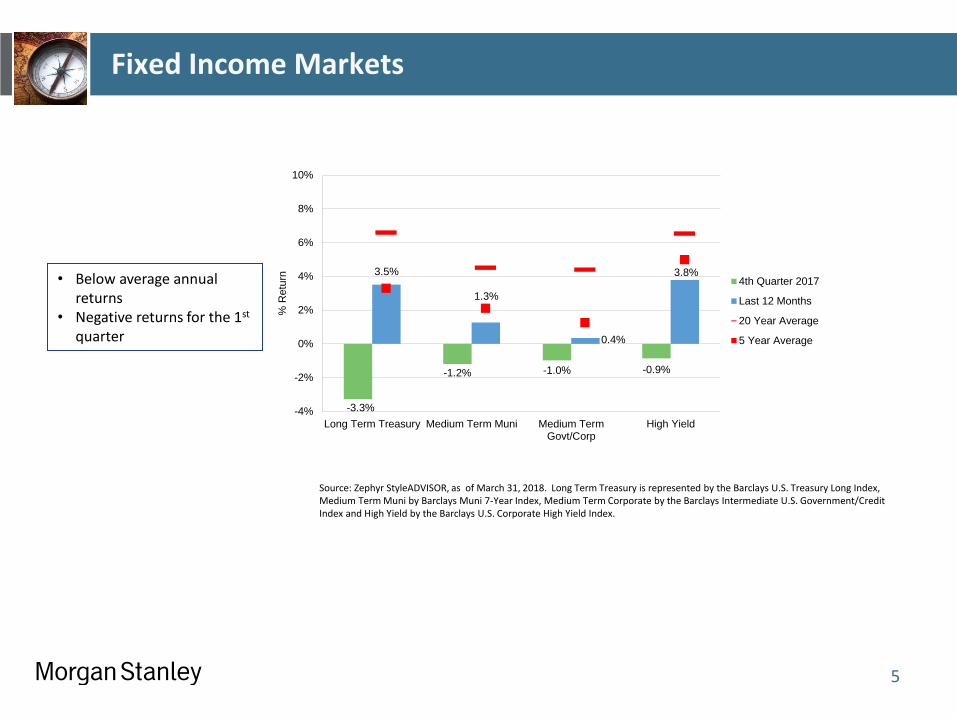
Fixed Income Markets
Source: Zephyr StyleADVISOR, as of March 31, 2018. Long Term Treasury is represented by the Barclays U.S. Treasury Long Index, Medium Term Muni by Barclays Muni 7-Year Index, Medium Term Corporate by the Barclays Intermediate U.S. Government/Credit Index and High Yield by the Barclays U.S. Corporate High Yield Index.
• Below average annual returns
• Negative returns for the 1st quarter
5
-3.3%
-1.2% -1.0% -0.9%
3.5%
1.3%
0.4%
3.8%
-4%
-2%
0%
2%
4%
6%
8%
10%
Long Term Treasury Medium Term Muni Medium TermGovt/Corp
High Yield
% R
etu
rn
4th Quarter 2017
Last 12 Months
20 Year Average
5 Year Average
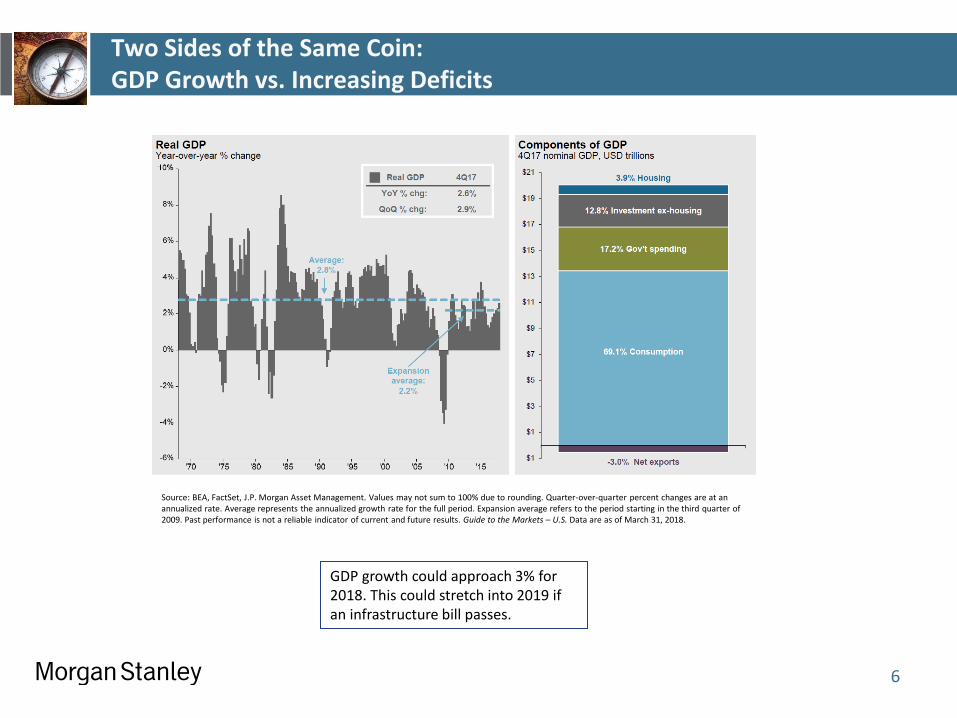
Two Sides of the Same Coin: GDP Growth vs. Increasing Deficits
6
GDP growth could approach 3% for 2018. This could stretch into 2019 if an infrastructure bill passes.
Source: BEA, FactSet, J.P. Morgan Asset Management. Values may not sum to 100% due to rounding. Quarter-over-quarter percent changes are at an annualized rate. Average represents the annualized growth rate for the full period. Expansion average refers to the period starting in the third quarter of 2009. Past performance is not a reliable indicator of current and future results. Guide to the Markets – U.S. Data are as of March 31, 2018.
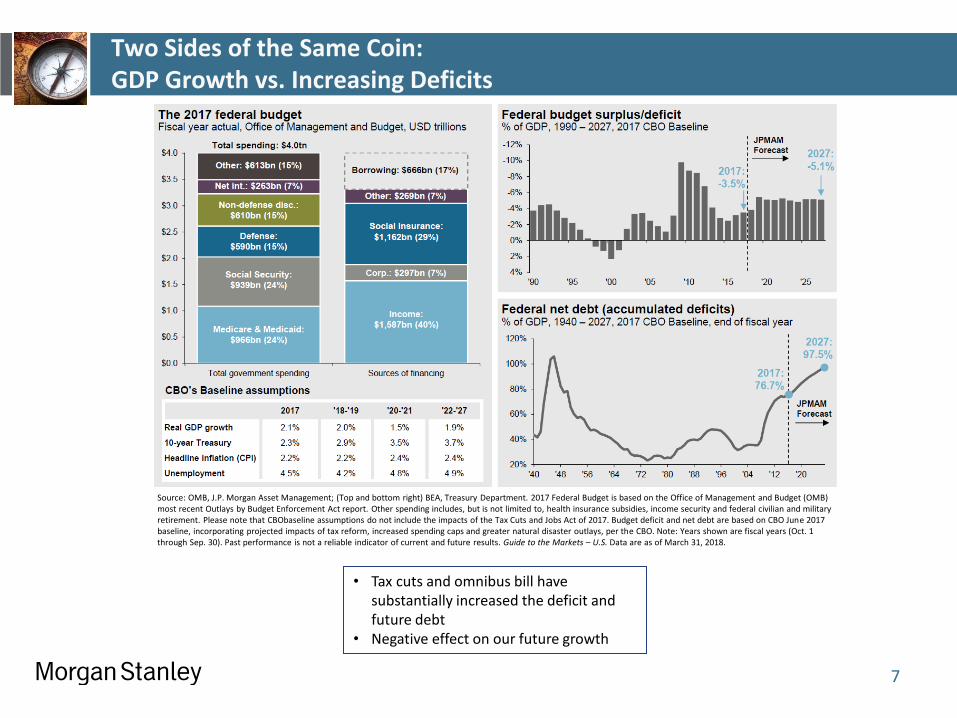
Two Sides of the Same Coin: GDP Growth vs. Increasing Deficits
7
• Tax cuts and omnibus bill have substantially increased the deficit and future debt
• Negative effect on our future growth
Source: OMB, J.P. Morgan Asset Management; (Top and bottom right) BEA, Treasury Department. 2017 Federal Budget is based on the Office of Management and Budget (OMB) most recent Outlays by Budget Enforcement Act report. Other spending includes, but is not limited to, health insurance subsidies, income security and federal civilian and military retirement. Please note that CBObaseline assumptions do not include the impacts of the Tax Cuts and Jobs Act of 2017. Budget deficit and net debt are based on CBO June 2017 baseline, incorporating projected impacts of tax reform, increased spending caps and greater natural disaster outlays, per the CBO. Note: Years shown are fiscal years (Oct. 1 through Sep. 30). Past performance is not a reliable indicator of current and future results. Guide to the Markets – U.S. Data are as of March 31, 2018.
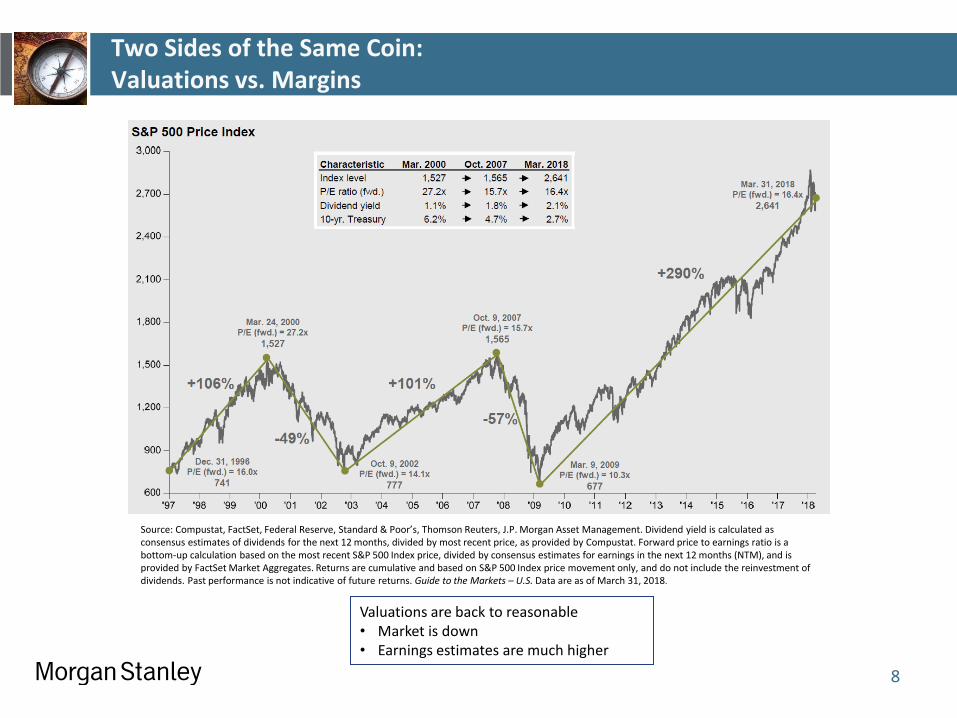
Two Sides of the Same Coin: Valuations vs. Margins
8
Valuations are back to reasonable • Market is down • Earnings estimates are much higher
Source: Compustat, FactSet, Federal Reserve, Standard & Poor’s, Thomson Reuters, J.P. Morgan Asset Management. Dividend yield is calculated as consensus estimates of dividends for the next 12 months, divided by most recent price, as provided by Compustat. Forward price to earnings ratio is a bottom-up calculation based on the most recent S&P 500 Index price, divided by consensus estimates for earnings in the next 12 months (NTM), and is provided by FactSet Market Aggregates. Returns are cumulative and based on S&P 500 Index price movement only, and do not include the reinvestment of dividends. Past performance is not indicative of future returns. Guide to the Markets – U.S. Data are as of March 31, 2018.
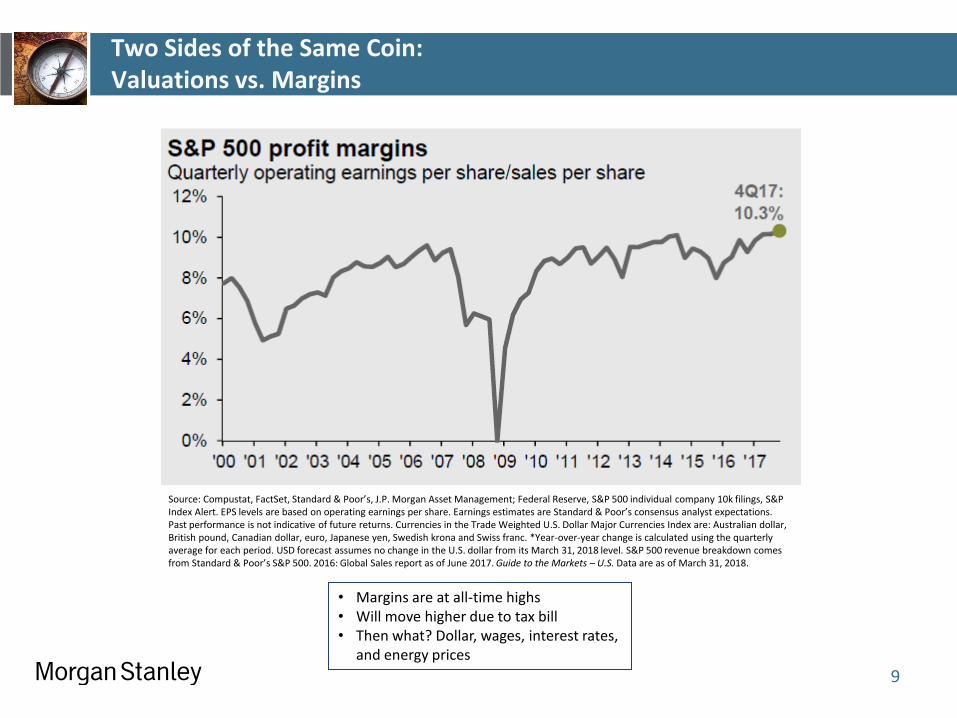
Two Sides of the Same Coin: Valuations vs. Margins
9
• Margins are at all-time highs • Will move higher due to tax bill • Then what? Dollar, wages, interest rates,
and energy prices
Source: Compustat, FactSet, Standard & Poor’s, J.P. Morgan Asset Management; Federal Reserve, S&P 500 individual company 10k filings, S&P Index Alert. EPS levels are based on operating earnings per share. Earnings estimates are Standard & Poor’s consensus analyst expectations. Past performance is not indicative of future returns. Currencies in the Trade Weighted U.S. Dollar Major Currencies Index are: Australian dollar, British pound, Canadian dollar, euro, Japanese yen, Swedish krona and Swiss franc. *Year-over-year change is calculated using the quarterly average for each period. USD forecast assumes no change in the U.S. dollar from its March 31, 2018 level. S&P 500 revenue breakdown comes from Standard & Poor’s S&P 500. 2016: Global Sales report as of June 2017. Guide to the Markets – U.S. Data are as of March 31, 2018.
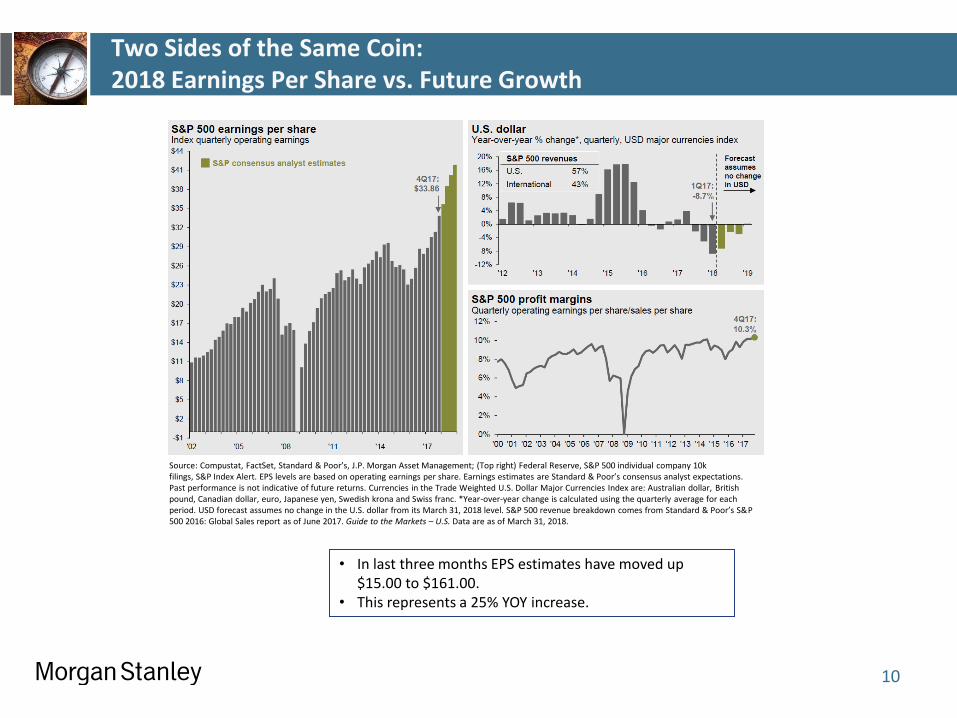
Two Sides of the Same Coin: 2018 Earnings Per Share vs. Future Growth
10
• In last three months EPS estimates have moved up $15.00 to $161.00.
• This represents a 25% YOY increase.
Source: Compustat, FactSet, Standard & Poor’s, J.P. Morgan Asset Management; (Top right) Federal Reserve, S&P 500 individual company 10k filings, S&P Index Alert. EPS levels are based on operating earnings per share. Earnings estimates are Standard & Poor’s consensus analyst expectations. Past performance is not indicative of future returns. Currencies in the Trade Weighted U.S. Dollar Major Currencies Index are: Australian dollar, British pound, Canadian dollar, euro, Japanese yen, Swedish krona and Swiss franc. *Year-over-year change is calculated using the quarterly average for each period. USD forecast assumes no change in the U.S. dollar from its March 31, 2018 level. S&P 500 revenue breakdown comes from Standard & Poor’s S&P 500 2016: Global Sales report as of June 2017. Guide to the Markets – U.S. Data are as of March 31, 2018.
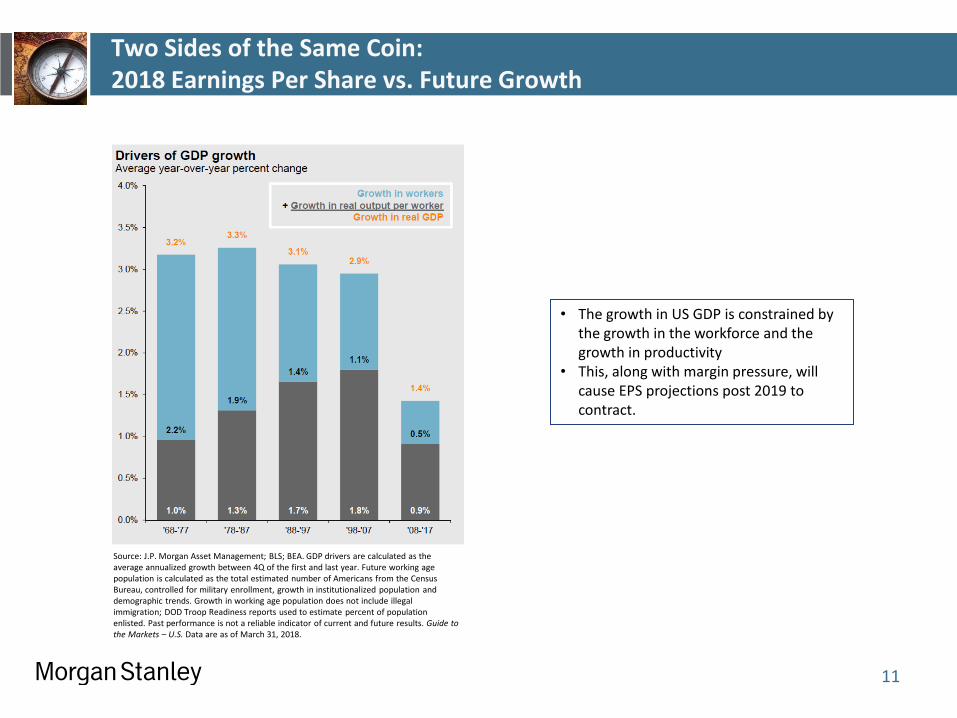
Two Sides of the Same Coin: 2018 Earnings Per Share vs. Future Growth
11
• The growth in US GDP is constrained by the growth in the workforce and the growth in productivity
• This, along with margin pressure, will cause EPS projections post 2019 to contract.
Source: J.P. Morgan Asset Management; BLS; BEA. GDP drivers are calculated as the average annualized growth between 4Q of the first and last year. Future working age population is calculated as the total estimated number of Americans from the Census Bureau, controlled for military enrollment, growth in institutionalized population and demographic trends. Growth in working age population does not include illegal immigration; DOD Troop Readiness reports used to estimate percent of population enlisted. Past performance is not a reliable indicator of current and future results. Guide to the Markets – U.S. Data are as of March 31, 2018.
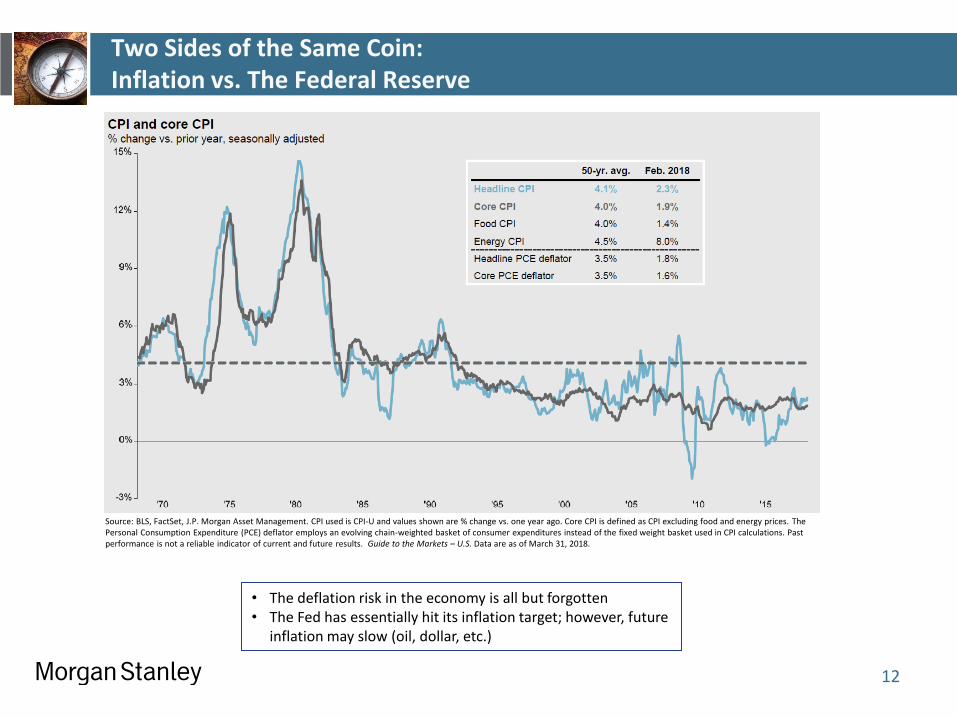
Two Sides of the Same Coin: Inflation vs. The Federal Reserve
12
• The deflation risk in the economy is all but forgotten • The Fed has essentially hit its inflation target; however, future
inflation may slow (oil, dollar, etc.)
Source: BLS, FactSet, J.P. Morgan Asset Management. CPI used is CPI-U and values shown are % change vs. one year ago. Core CPI is defined as CPI excluding food and energy prices. The Personal Consumption Expenditure (PCE) deflator employs an evolving chain-weighted basket of consumer expenditures instead of the fixed weight basket used in CPI calculations. Past performance is not a reliable indicator of current and future results. Guide to the Markets – U.S. Data are as of March 31, 2018.
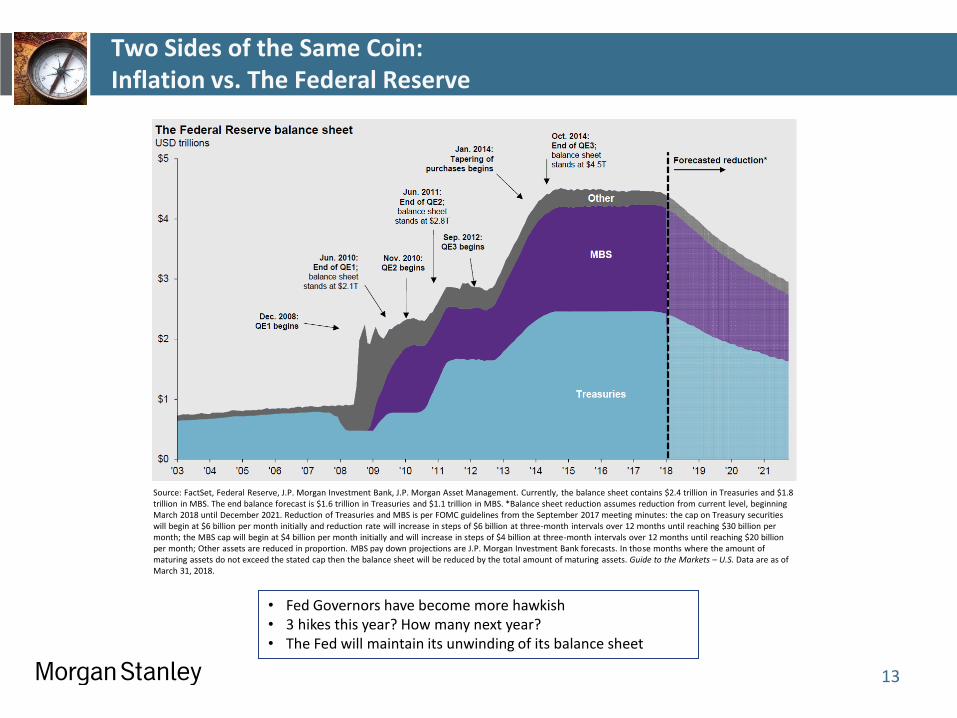
Two Sides of the Same Coin: Inflation vs. The Federal Reserve
13
• Fed Governors have become more hawkish • 3 hikes this year? How many next year? • The Fed will maintain its unwinding of its balance sheet
Source: FactSet, Federal Reserve, J.P. Morgan Investment Bank, J.P. Morgan Asset Management. Currently, the balance sheet contains $2.4 trillion in Treasuries and $1.8 trillion in MBS. The end balance forecast is $1.6 trillion in Treasuries and $1.1 trillion in MBS. *Balance sheet reduction assumes reduction from current level, beginning March 2018 until December 2021. Reduction of Treasuries and MBS is per FOMC guidelines from the September 2017 meeting minutes: the cap on Treasury securities will begin at $6 billion per month initially and reduction rate will increase in steps of $6 billion at three-month intervals over 12 months until reaching $30 billion per month; the MBS cap will begin at $4 billion per month initially and will increase in steps of $4 billion at three-month intervals over 12 months until reaching $20 billion per month; Other assets are reduced in proportion. MBS pay down projections are J.P. Morgan Investment Bank forecasts. In those months where the amount of maturing assets do not exceed the stated cap then the balance sheet will be reduced by the total amount of maturing assets. Guide to the Markets – U.S. Data are as of March 31, 2018.
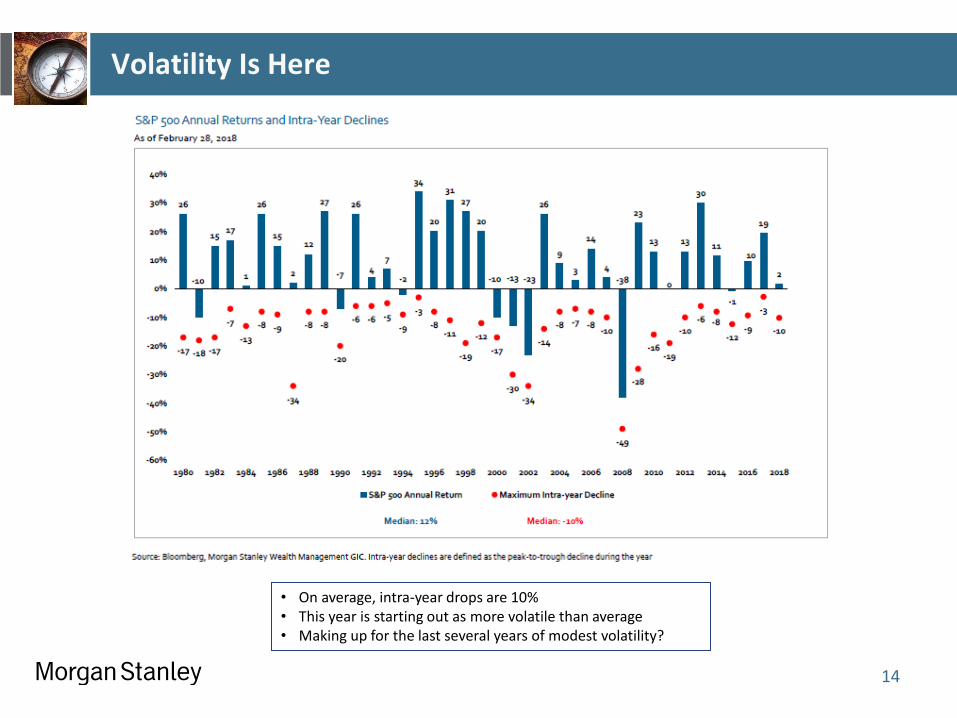
Volatility Is Here
14
• On average, intra-year drops are 10% • This year is starting out as more volatile than average • Making up for the last several years of modest volatility?
Tariffs and The Markets
15
• POTUS has little effect on long term markets • However, in the short run the bully pulpit can be powerful • Is tariff talk a negotiating tactic or the precursor to a trade war?
Source: whitehouse.gov
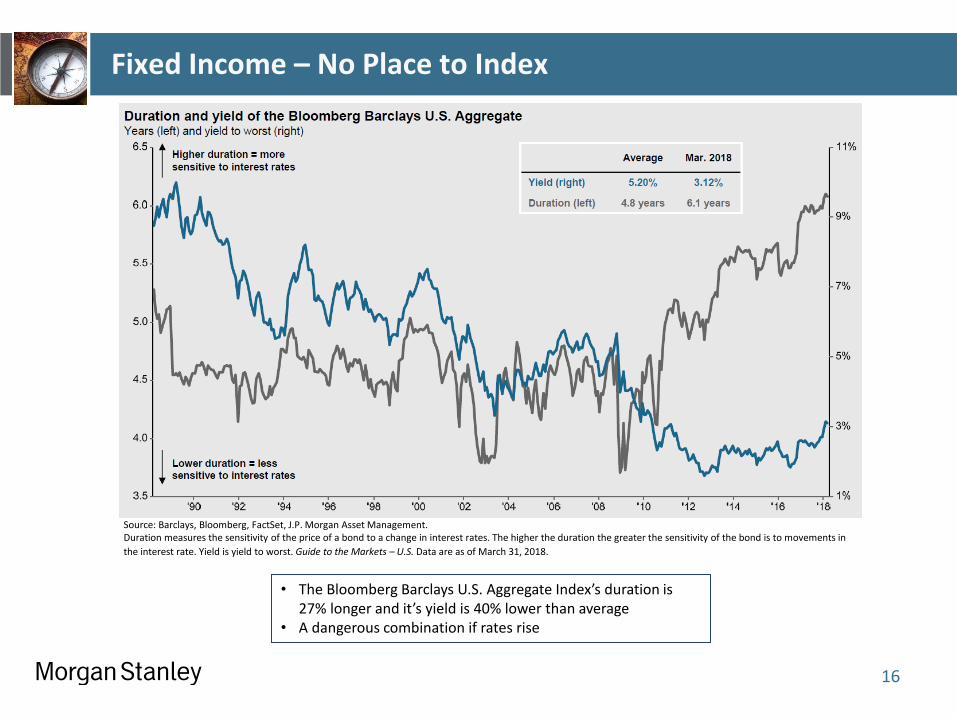
Fixed Income – No Place to Index
16
Source: Barclays, Bloomberg, FactSet, J.P. Morgan Asset Management. Duration measures the sensitivity of the price of a bond to a change in interest rates. The higher the duration the greater the sensitivity of the bond is to movements in
the interest rate. Yield is yield to worst. Guide to the Markets – U.S. Data are as of March 31, 2018.
• The Bloomberg Barclays U.S. Aggregate Index’s duration is 27% longer and it’s yield is 40% lower than average
• A dangerous combination if rates rise
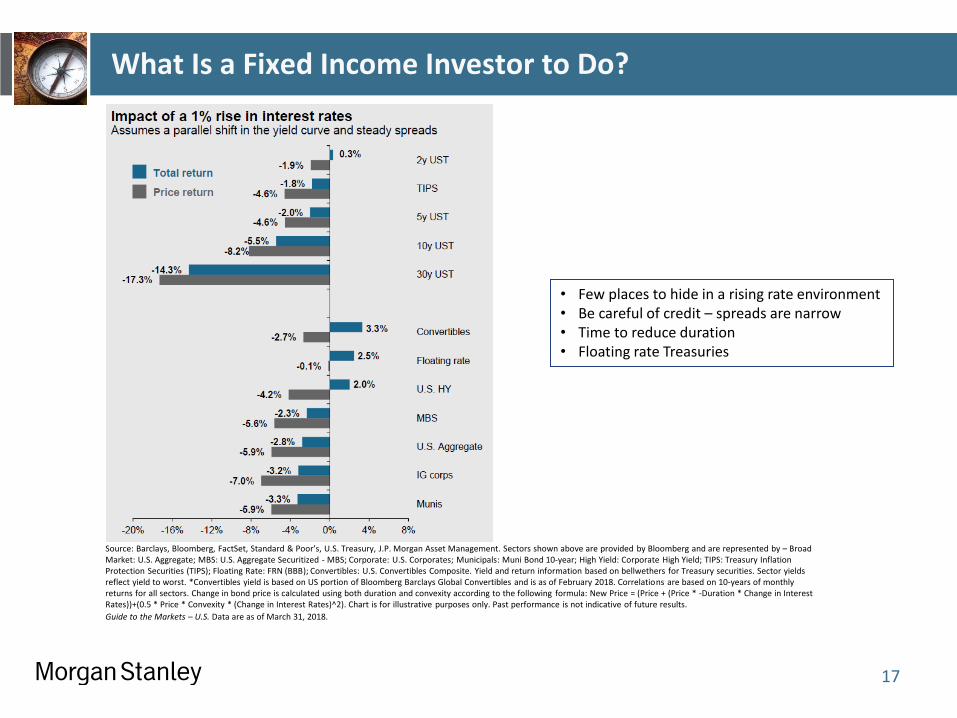
What Is a Fixed Income Investor to Do?
17
Source: Barclays, Bloomberg, FactSet, Standard & Poor’s, U.S. Treasury, J.P. Morgan Asset Management. Sectors shown above are provided by Bloomberg and are represented by – Broad Market: U.S. Aggregate; MBS: U.S. Aggregate Securitized - MBS; Corporate: U.S. Corporates; Municipals: Muni Bond 10-year; High Yield: Corporate High Yield; TIPS: Treasury Inflation Protection Securities (TIPS); Floating Rate: FRN (BBB); Convertibles: U.S. Convertibles Composite. Yield and return information based on bellwethers for Treasury securities. Sector yields reflect yield to worst. *Convertibles yield is based on US portion of Bloomberg Barclays Global Convertibles and is as of February 2018. Correlations are based on 10-years of monthly returns for all sectors. Change in bond price is calculated using both duration and convexity according to the following formula: New Price = (Price + (Price * -Duration * Change in Interest Rates))+(0.5 * Price * Convexity * (Change in Interest Rates)^2). Chart is for illustrative purposes only. Past performance is not indicative of future results.
Guide to the Markets – U.S. Data are as of March 31, 2018.
• Few places to hide in a rising rate environment • Be careful of credit – spreads are narrow • Time to reduce duration • Floating rate Treasuries
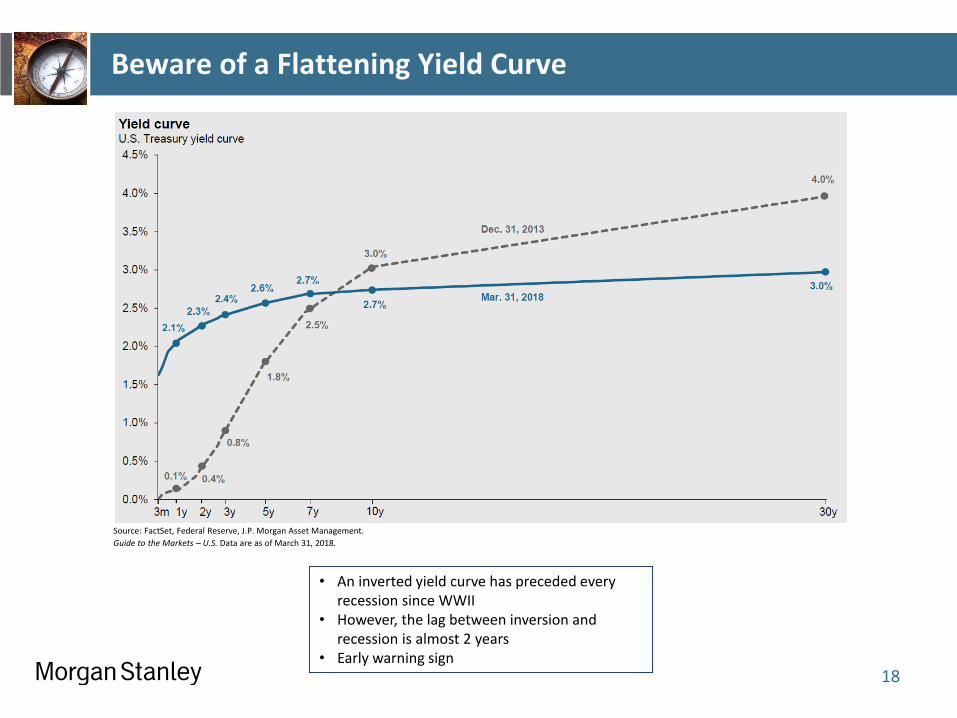
Beware of a Flattening Yield Curve
18
Source: FactSet, Federal Reserve, J.P. Morgan Asset Management.
Guide to the Markets – U.S. Data are as of March 31, 2018.
• An inverted yield curve has preceded every recession since WWII
• However, the lag between inversion and recession is almost 2 years
• Early warning sign
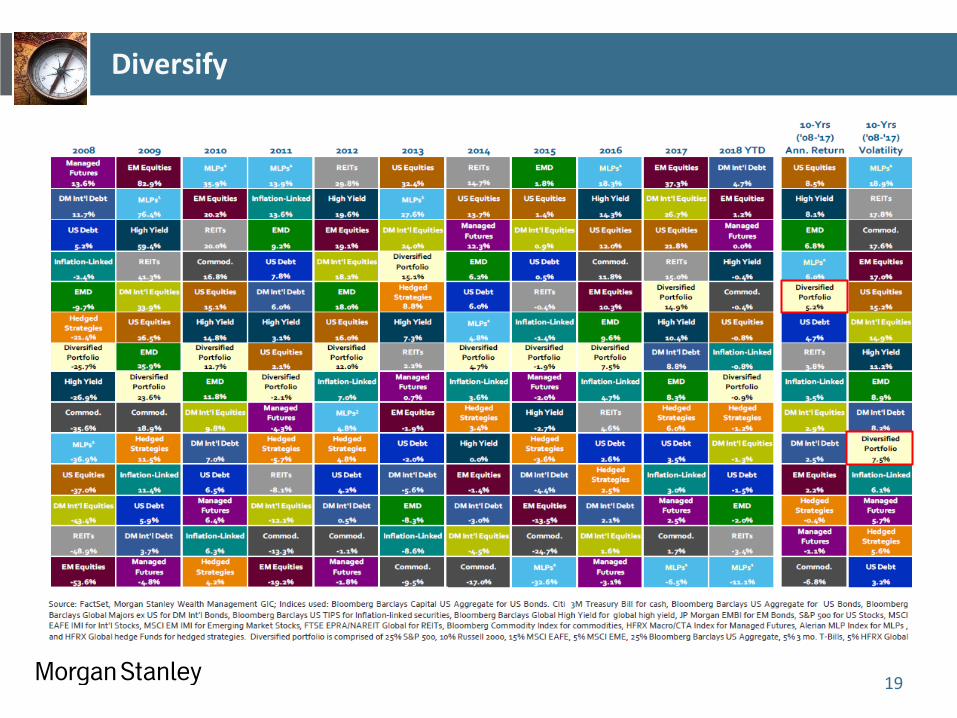
Diversify
19
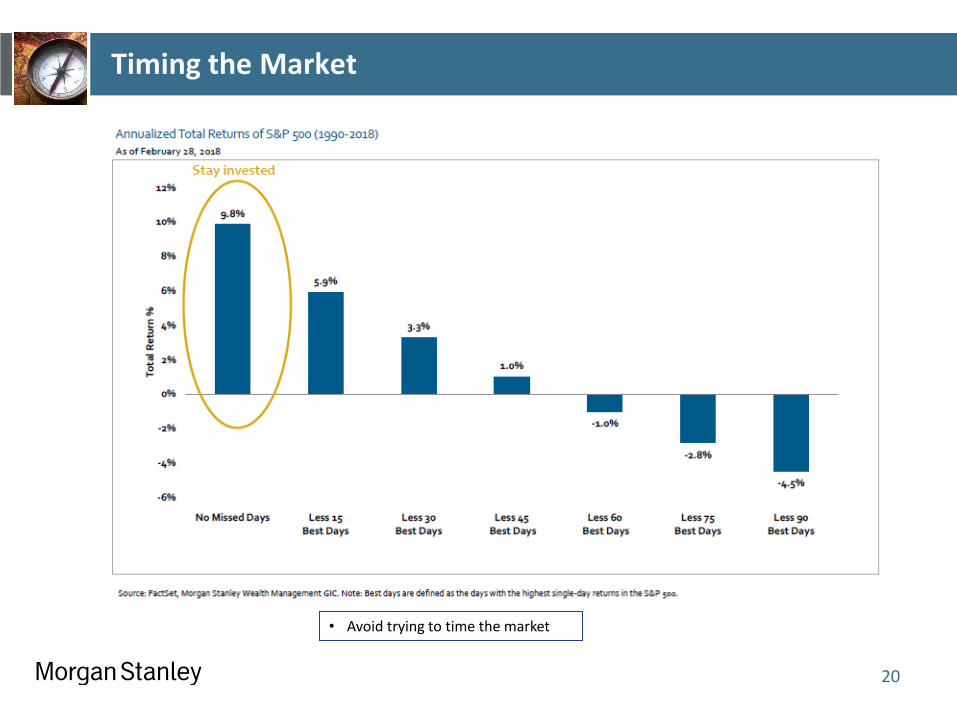
Timing the Market
20
• Avoid trying to time the market
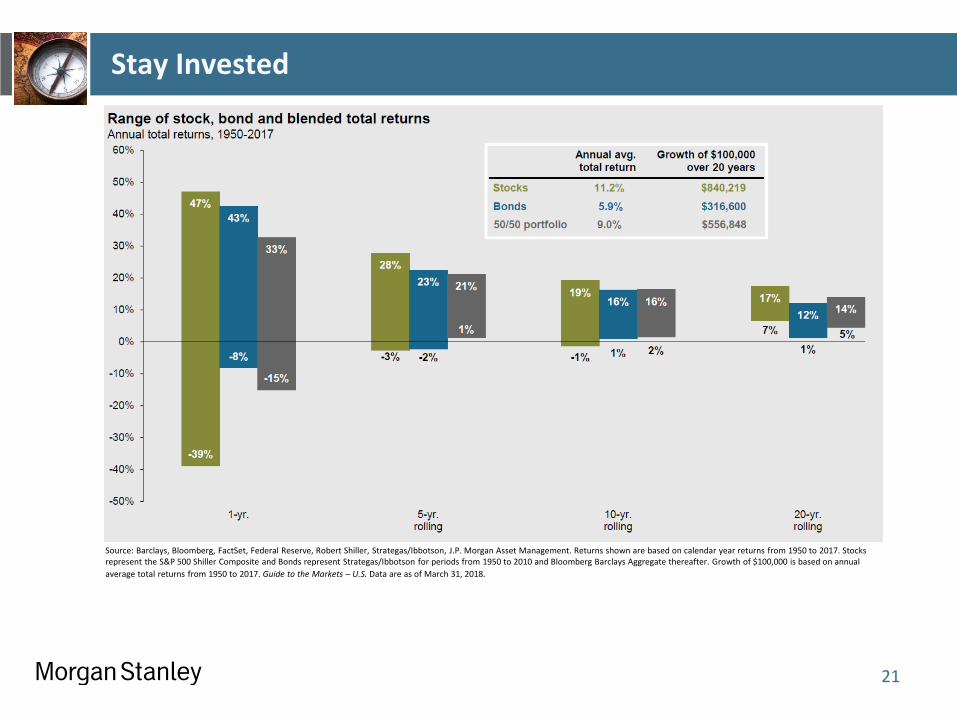
Stay Invested
21
Source: Barclays, Bloomberg, FactSet, Federal Reserve, Robert Shiller, Strategas/Ibbotson, J.P. Morgan Asset Management. Returns shown are based on calendar year returns from 1950 to 2017. Stocks represent the S&P 500 Shiller Composite and Bonds represent Strategas/Ibbotson for periods from 1950 to 2010 and Bloomberg Barclays Aggregate thereafter. Growth of $100,000 is based on annual
average total returns from 1950 to 2017. Guide to the Markets – U.S. Data are as of March 31, 2018.
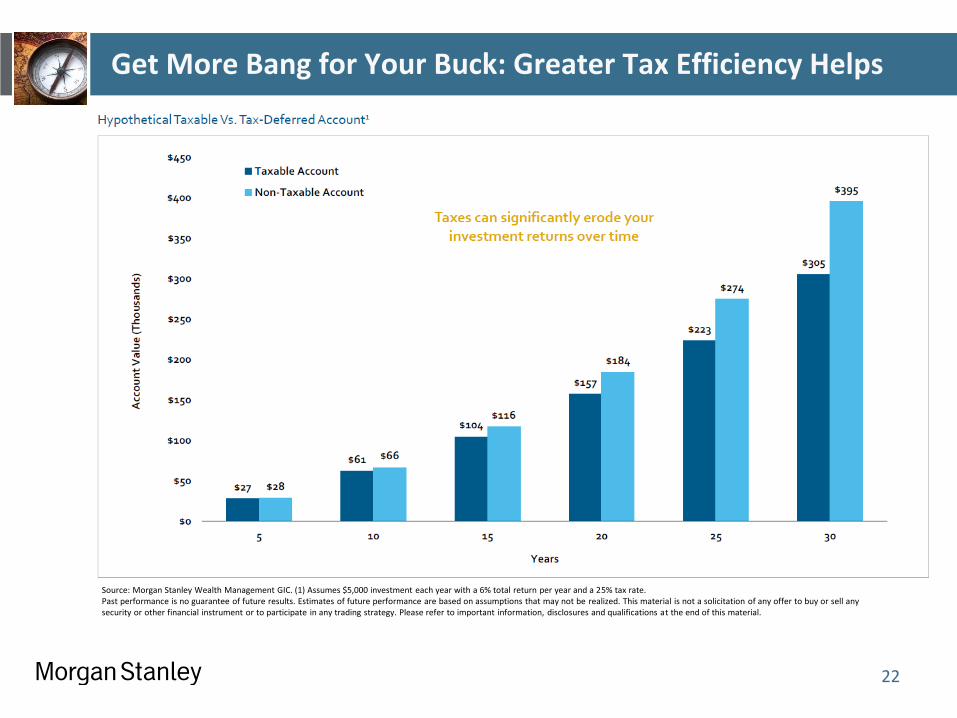
Get More Bang for Your Buck: Greater Tax Efficiency Helps
22
Source: Morgan Stanley Wealth Management GIC. (1) Assumes $5,000 investment each year with a 6% total return per year and a 25% tax rate. Past performance is no guarantee of future results. Estimates of future performance are based on assumptions that may not be realized. This material is not a solicitation of any offer to buy or sell any security or other financial instrument or to participate in any trading strategy. Please refer to important information, disclosures and qualifications at the end of this material.
Conclusions
Know what you own
Validate and embrace your asset allocation
Understand the “typical” downside of our chosen asset allocation
Examine your debt/margin position
Stay invested
23
Sources
24
J.P. Morgan Asset Management
Morgan Stanley – Applied Equity Advisors
Morgan Stanley Global Investment Committee
Index Definitions
25
J.P. Morgan Asset Management Disclosures
26
This document is intended solely to report on various investment views held by J.P. Morgan Asset Management. Opinions, estimates, forecasts and statements of financial market trends that are based on current market conditions constitute our judgment and are subject to change without notice. We believe the information provided here is reliable but should not be assumed to be accurate or complete. The views and strategies described may not be suitable for all investors. References to specific securities, asset classes and financial markets are for illustrative purposes only and are not intended to be, and should not be interpreted as, recommendations. Past performance is no guarantee of future results. Please note that investments in foreign markets are subject to special currency, political and economic risks.
The price of equity securities may rise or fall because of changes in the broad market or changes in a company’s financial condition, sometimes rapidly or unpredictably. These price movements may result from factors affecting individual companies, sectors or industries selected for the Fund’s portfolio or the securities market as a whole, such as changes in economic or political conditions. Equity securities are subject to “stock market risk,” meaning that stock prices in general (or in particular, the prices of the types of securities in which a fund invests) may decline over short or extended periods of time. When the value of a fund’s securities goes down, an investment in a fund decreases in value. The Fund may invest in derivatives, which may be riskier than other types of investments because they may be more sensitive to changes in economic or market conditions than other types of investments and could result in losses that significantly exceed the Fund’s original investment. Many derivatives create leverage, thereby causing the Fund to be more volatile than it would be if it had not used derivatives.
The S&P 500 Index is a capitalization-weighted index that measures the performance of 500 large-capitalization domestic stocks representing all major industries. All indexes are unmanaged and an individual cannot invest directly in an index. Index returns do not include fees or expenses.
J.P. Morgan Asset Management is the marketing name for the asset management businesses of JPMorgan Chase & Co. Those businesses include, but are not limited to, J.P. Morgan Investment Management Inc., Security Capital Research & Management Incorporated and J.P. Morgan Alternative Asset Management, Inc.
© JPMorgan Chase & Co., 2016
Important Morgan Stanley Disclosures
27
Indexes are not available for direct investment. Index returns consist of income and capital appreciation (or depreciation) and do not take into account fees, taxes, or other charges. Such fees and charges would reduce performance. Past performance is no guarantee of future results.
Although the statements of fact and data in this report have been obtained from, and are based upon, sources the firm believes reliable, we do not guarantee their accuracy, and any such information may be incomplete or condensed. All opinions included in this report constitute the firm’s judgment as of the date of this report and are subject to change without notice. This report is for informational purposes only and is not intended as an offer or solicitation with respect to the purchase or sale of any security.
Diversification does not guarantee a profit or protect against loss. Different asset classes present different risks. Some, but not all, of those risks are outlined below.
In general, fixed income and equities investments (domestic or foreign) face certain asset class specific risks, which could include, but are not limited to: market risk, credit risk, inflation risk, currency risk, default risk, interest rate risk and political risk. There are also additional risks and traits attributable to asset classes represented in certain indices.
Asset classes based on international investments have additional risks associated with international investing, including foreign economic, political, monetary and/or legal factors, changing currency exchange rates, foreign taxes and differences in financial and accounting standards. International investing may not be for everyone. These risks may be magnified in emerging markets.
With respect to real estate investments, property values can fall due to environmental, economic or other reasons, and change in interest rates can negatively impact the performance of real estate companies.
Bonds are affected by a number of risks, including fluctuations in interest rates, credit risk and prepayment risk. In general, as prevailing interest rates rise, fixed income securities prices will fall. Bonds face credit risk if a decline in an issuer's credit rating, or creditworthiness, causes a bond's price to decline. High yield bonds are subject to additional risks such as increased risk of default and greater volatility because of the lower credit quality of the issues. Finally, bonds can be subject to prepayment risk. When interest rates fall, an issuer may choose to borrow money at a lower interest rate, while paying off its previously issued bonds. As a consequence, underlying bonds will lose the interest payments from the investment and will be forced to reinvest in a market where prevailing interest rates are lower than when the initial investment was made. Depending on your state of residency, some bonds may be exempt from state and local taxes; however, interest may be subject to the federal alternative minimum tax.
Morgan Stanley Smith Barney and its affiliates do not provide tax or legal advice. To the extent that this material or any attachment concerns tax matters, it is not intended to be used and cannot be used by a taxpayer for the purpose of avoiding penalties that may be imposed by law. Any such taxpayer should seek advice based on the taxpayer's particular circumstances from an independent tax advisor.
Indexes are not available for direct investment. Index returns consist of income and capital appreciation (or depreciation) and do not take into account fees, taxes or other charges. Such fees and charges would reduce performance. © 2017 Morgan Stanley Smith Barney LLC. Member SIPC. Consulting Group and Portfolio Management Group are businesses of Morgan Stanley Smith Barney LLC.
CRC #2094056 4/2018