Embed Size (px)
Citation preview
8/3/2019 Market Outlook 4th November 2011
http://slidepdf.com/reader/full/market-outlook-4th-november-2011 1/11
Please refer to important disclosures at the end of this report Sebi Registration No: INB 010996539 1
Market OutlookIndia Research
November 4, 2011
Dealer’s Diary
Indian markets are expected to open in the green tracking positive cues fromthe Asian markets in opening trade and the rally in US and European stocks.US markets rallied for a second day on Thursday as Greece backed away from a proposed referendum. US markets would be eyeing the monthly non-farm payroll and unemployment data due for release today. The EuropeanCentral Bank provided a happy surprise to investors with a 25bp interest ratecut, a sign of a more aggressive approach to confront weak growth in theregion. The market had expected rates to remain unchanged.
Investors responded positively as Greek PM George Papandreou, underpressure from world leaders, climbed down from his proposal of areferendum on the country's bailout package, providing ruling andopposition parties strike a deal to resolve the country's political crisis.European leaders said earlier they were prepared for Greece to leave theeuro zone to preserve their 12-year-old single currency if Athens did notdecide quickly to implement a bailout programme, threatening the likes ofItaly and Spain, and even France.
Markets Today The trend deciding level for the day is 17,429 / 5,250 levels. If NIFTY tradesabove this level during the first half-an-hour of trade then we may witness afurther rally up to 17,580 – 17,678 / 5,298 – 5,329 levels. However, if NIFTYtrades below 17,429 / 5,250 levels for the first half-an-hour of trade then it may correct up to 17,331– 17,180 / 5,218 – 5,170 levels.
Indices S2 S1 R1 R2
SENSEX 17,180 17,331 17,580 17,678
NIFTY 5,170 5,218 5,298 5,329
News Analysis
Petrol price hiked by `1.8/liter
TRAI proposes easier M&A norms for telecom players
L&T bags order worth `875cr in Oman
2QFY2012 Result Reviews – SAIL, Gujarat Gas, Ashok Leyland, TVS Motor,
Vesuvius India, Goodyear India
2QFY2012 Result Previews – ONGC, Bharti Airtel, Nestle, GSK
Pharmaceuticals, GSK Consumer, Marico, NCCRefer detailed news analysis on the following page
Net Inflows (November 2, 2011)
` cr Purch Sales Net MTD YTD
FII 1,643 1,449 194 228 743
MFs 342 391 (49) (442) 4,693
FII Derivatives (November 3, 2011)
` cr Purch Sales Net Open Interest
Index Futures 1,537 1,971 (434) 14,505
Stock Futures 1,480 1,545 (65) 29,037
Gainers / Losers
Gainers Losers
Company Price (`) chg (%) Company Price (`) chg (%)
Power Finance 165 5.7 Indiabulls Fin 152 (5.0)
Sun TV Network 273 5.7 SAIL 109 (3.1)
PTC India 74 5.0 Educomp Sol 265 (2.9)
JSW Steel 668 4.8 Mcleod Russel 239 (2.8)
REC 194 4.7 Manappuram Fin. 59 (2.4)
Domestic Indices Chg (%) (Pts) (Close)
BSE Sensex 0.1 17.1 17,482
Nifty 0.1 7.3 5,266MID CAP (0.0) (2.6) 6,251
SMALL CAP 0.0 (0.3) 6,932
BSE HC 0.0 (0.2) 6,138
BSE PSU 0.6 43.8 7,558
BANKEX (0.1) (5.7) 11,233
AUTO (0.4) (36.3) 9,212
METAL (0.4) (40.8) 11,652
OIL & GAS 1.1 97.1 9,055
BSE IT (0.7) (42.0) 5,732
Global Indices Chg (%) (Pts) (Close)
Dow Jones 1.8 208.4 12,045
NASDAQ 2.2 58.0 2,698
FTSE 1.1 61.5 5,546
Nikkei (2.2) (195.1) 8,640
Hang Seng (2.5) (491.2) 19,243
Straits Times (0.9) (24.7) 2,810
Shanghai Com 0.2 4.0 2,508
Indian ADRs Chg (%) (Pts) (Close)
Infosys 0.3 0.2 $58.8
Wipro 1.5 0.2 $10.3
ICICI Bank (0.6) (0.2) $35.9
HDFC Bank (0.2) (0.1) $32.0
Advances / Declines BSE NSE
Advances 1,329
Declines 1,460 737
Unchanged 141 87
Volumes (` cr)
BSE 2,202
NSE 9,881
8/3/2019 Market Outlook 4th November 2011
http://slidepdf.com/reader/full/market-outlook-4th-november-2011 2/11
Market Outlook | India Research
November 4, 2011 2
Petrol price hiked by `1.8/liter
Oil marketing companies (OMCs) have hiked petrol prices by approximately
` 1.8/liter from November 4, 2011, as firm crude oil prices coupled with
depreciating rupee were resulting in higher under-recoveries (revenue losses) on
the sale of petrol. However, revenue losses on account of selling petrol at lower
prices formed insignificant proportion of the total under-recoveries. During
1HFY2012, oil retailers reported total under-recoveries of ` 64,900cr mainly on
account of selling diesel, kerosene and LPG cylinder at subsidized rates. As on
November 1, 2011, OMCs were losing ` 9.3/liter on diesel, ` 26.9/liter on
kerosene and ` 260.5 on every domestic LPG cylinder. Factoring in the recent
rupee depreciation, the hike in petrol prices is expected to have a insignificant
impact on overall under-recoveries. Hence, we continue to maintain our under-
recoveries estimates of ` 100,450cr for FY2012, which is primarily on account of
selling diesel, LPG cylinder and kerosene at subsidized prices. We maintain ourBuy ratings on ONGC and GAIL with target prices of `326 and `499, respectively.
TRAI proposes easier M&A norms for telecom players
TRAI has recommended that mobile phone companies could merge their
operations if the combined market share of the new entity is less than 60%, a
substantial increase over the current 40% ceiling. This move is expected to promote
consolidation in the crowded and ultra-competitive 14-player telecom market. By
this, many telecom operators can get their way out from financial difficulties. TRAI
had also earlier said that the combined entity could retain only 14.4MHz spectrum
after merging and had to return the rest to the government, but in the new plan it
has now allowed the combined entity to hold up to 25% of the total available
airwaves in that region. TRAI continues to maintain its recommendation of
charging a one-time pan-India fee of ` 4,572cr for every unit of airwaves telecom
operators hold beyond the contracted limit. Overall, we remain Neutral on the
telecom sector with Bharti Airtel being our preferred pick.
L&T bags orders worth `875cr in Oman
Larsen & Toubro (L&T) Oman, a subsidiary of L&T, has bagged two orders worth
` 875cr in the urban infrastructure segment. Orders are from Muscat municipality
and Ministry of Transport and Communication, Sultanate of Oman, for
construction of two roads. The expected execution period for the two projects is 24
and 41 months. With these orders, the outstanding order book stands at
~ ` 1,44,689cr (3.3x FY2011 revenue), which provides good revenue visibility.
At the CMP of ` 1,381, the stock is trading at 18.7x FY2013E earnings and 2.9x
FY2013E P/BV, on a standalone basis. We have used the SOTP methodology to
value the company to capture all its business initiatives and investments/stakes in
different businesses. Ascribing separate values to its parent business on a P/E basis
and investments in subsidiaries on P/E, P/BV and mcap basis, our target price
works out to ` 1,714, which provides 24.2% upside from current levels.
We recommend a Buy rating on the stock.
8/3/2019 Market Outlook 4th November 2011
http://slidepdf.com/reader/full/market-outlook-4th-november-2011 3/11
Market Outlook | India Research
November 4, 2011 3
Result Reviews
SAIL
SAIL reported slightly better-than-expected profitability (excluding exceptional items
related to forex loss) for 2QFY2012. Net sales grew by 2.2% yoy to ` 10,837cr
(slightly below our estimate of ` 11,135cr) mainly due to increased realization
(+8.7% yoy to ` 38,023/tonne), partially offset by the decrease in sales volumes
(down 5.9% yoy to 2.9mn tonnes). Despite increased realization, EBITDA dipped
by 13.9 % yoy to ` 1,327cr and EBITDA margin contracted by 230bp yoy to 12.2%
(higher than our estimate of 11.6%) mainly on account of increases in power and
staff costs. Power costs grew by 28.2% yoy to ` 1,124cr, while staff costs grew by
16.5% yoy to ` 1,981cr. EBITDA/tonne stood at ` 4,657 in 2QFY2012, compared
to ` 5,090 in 2QFY2011. The company reported an exceptional item related to
forex loss of ` 509cr in 2QFY2012, compared to forex gain of ` 153cr in2QFY2011. Hence, net profit decreased by 54.6% yoy to ` 495cr. However,
excluding exceptional items, adjusted net profit grew by 7.0% yoy to ` 1,003cr
(above our estimate of ` 836cr) in 2QFY2012. We maintain our Buy view on the
stock; our target price is under review.
Gujarat Gas
Gujarat Gas reported its 3QCY2011 results. The company’s top line increased by
29.1% yoy to ` 644cr mainly on account of higher realization. Average sales
realization stood at ` 19.7/scm (+24.7% yoy and +3.4% qoq), led by hike in
selling prices of the industrial retail and CNG segments. Natural gas volume sold
grew by 3.5% yoy to 326mmscm during the quarter. The company’s cost of goods
sold increased by 28.8% yoy to ` 490cr on account of higher proportion of
expensive RLNG sales coupled with INR depreciation against the USD. Hence,
EBITDA grew by 30.4% yoy (in-line with growth in net sales) to ` 118cr. Other
income grew by 100.9% yoy to ` 10cr. Consequently, the company’s net profit
grew by 41.7% yoy to ` 80cr. We maintain our Neutral view on the stock.
Ashok Leyland
Ashok Leyland (AL) reported better-than-expected results for 2QFY2012 on
account of above expectation operating margin performance.
AL reported 14% yoy growth in its top line to ` 3,095cr, driven by an 18.7% yoy
increase in average net realization. Volume performance, however, was subdued
during the quarter, reporting a 3.9% yoy decline. Average net realization improved
to ` 130,970 on account of price increases to mitigate raw-material cost pressures
and emission norm changes. On a sequential basis, revenue jumped strongly by
24% as volumes increased by 22.6%. On the operating front, EBITDA margin
came in at 10.7%, down 58bp yoy; however it was ahead of our estimates of
9.4%. Sequentially, operating margin expanded by 128bp from 9.4%, largely due
to improved operating leverage, better product mix and a decline in other
expenditure. Raw-material cost was more or less stable on a yoy and qoq basis. As
8/3/2019 Market Outlook 4th November 2011
http://slidepdf.com/reader/full/market-outlook-4th-november-2011 4/11
Market Outlook | India Research
November 4, 2011 4
a result, operating profit grew by 8.1% yoy (40.8% qoq). Net profit, however,
declined by 7.8% yoy to ` 154cr mainly due to higher interest and depreciation
expense. Sequentially, net profit grew substantially by 78.6% on account of
improved operating performance, higher other income and lower tax-rate. Thestock rating is currently under review.
TVS Motor
TVS Motor’s (TVSL) 2QFY2012 operating results were ahead of our estimates,
driven largely by better-than-expected margin performance. TVSL registered strong
23.2% yoy (14.1% qoq) growth in its top-line to ` 1,992cr, in-line with our
estimates, led by healthy 15.1% yoy (12.7% qoq) growth in total volumes and
strong 6.7% yoy (1.5% qoq) growth in net average realization. The scooters
segment continued to drive total volume growth, posting a 26.6% yoy (34% qoq)
growth. The motorcycle segment witnessed a healthy 14.2% yoy (11% qoq)
increase in volumes. EBITDA margin came in 46bp ahead of our estimates at
6.9%, witnessing an expansion of 29bp yoy (24bp qoq). EBITDA margin expansion
was aided by improvement in net average realization and a 120bp yoy savings in
other expenditure. However, high raw-material cost (raw-material to sales ratio at
75.5% vs. 73.7% in 2QFY2011 and 76.4% in 1QFY2012) restricted further
expansion in margins. Led by strong operating performance and decline in interest
cost, net profit posted better-than-expected growth of 39.7% yoy (30.1% qoq) to
` 77cr.
At ` 66, TVSL is trading at 10.8x FY2013E earnings. We retain our Accumulate
rating on the stock with a target price of `74.
Vesuvius India (VIL) - 3QCY2011
VIL reported topline growth by 22% yoy to ` 138cr in 3QCY2011 from ` 114cr in
3QCY2010 while margins contracted by 175bps due to increase in other
expenses. PAT grew by 12% to ` 14.5cr as compared to ` 13cr in same quarter last
year, whereas on a qoq basis, it remained flat. We maintain our Buy rating on the
stock with a target price to `448 based on a target PE of 14x its CY2012E
earnings.
Goodyear India – 3QCY2011
Goodyear India’s revenue grew by 16% yoy to ` 395cr in 3QCY2011 from ` 341cr
in 3QCY2010. OPM for the quarter contracted by 358bp yoy to 7.1% in
3QCY2011 (9.3% in 3QCY2010) due to increased raw-material cost; whereas on
a qoq basis, OPM increased marginally by 62bp from 6.5% in 2QCY2011 due to
stable rubber prices. PAT for the quarter dipped by 16% yoy to ` 16cr as compared
to ` 19cr in 3QCY2010 on account of higher depreciation and interest costs.
We have revised our target price downwards to `367, based on target PE of 8x its
CY2012E earnings with a Buy rating on the stock.
8/3/2019 Market Outlook 4th November 2011
http://slidepdf.com/reader/full/market-outlook-4th-november-2011 5/11
Market Outlook | India Research
November 4, 2011 5
Result Previews
ONGC
ONGC is slated to announce its 2QFY2012 results. We expect the company’s top
line to grow by 24.7% yoy to ` 22,991cr mainly on account of higher realization.
ONGC's subsidy amount for 2QFY2012 would be significantly lower than
1QFY2012 due to (1) price increases on diesel, kerosene and LPG and (2) excise
tax reduction on diesel and customs duty cuts on crude oil, diesel and gasoline
implemented by the government during June 2011. On the operating front,
EBITDA margin is expected to decline by 495bp yoy to 55.0%. The bottom line is
expected to grow by 14.3% yoy to ` 6,161cr. We maintain our Buy view on the
stock with a target price of `326.
Bharti Airtel
Bharti Airtel is slated to announce its 2QFY2012 results. We expect the company to
record revenue of ` 17,091cr with merely 0.6% qoq growth due to seasonality in
2Q. This is expected primarily on the back of growth in qoq flat ARPM at
` 0.43/min and 3.0% qoq decline in MOU to 432. Also, we expect Zain’s mobile
business revenue to grow by 7.4% qoq to ` 4,703cr, with EBITDA margin of 27.2%.
Consolidated EBITDA margin of the company is expected to decline by 88bp qoq
to 32.7%. PAT is expected at ` 1,308cr. We maintain our Accumulate rating on the
stock with a target price of `430.
Nestle – 3QCY2011
Nestle is expected to announce its 3QCY2011 results. For the quarter, we expect
the company to post modest 17.8% yoy growth in its top line to ` 1,928cr, aided by
steady growth across categories. Earnings for the quarter are expected to register
healthy 20.4% yoy growth to ` 263cr, aided by margin expansion of 84bp to
20.5%. We maintain our Neutral view on the stock.
GSK Pharmaceuticals – 3QCY2011
GSK Pharmaceuticals is expected to announce its 3QCY2011 results. For the
quarter, we expect the company to post modest 7.8% yoy growth in its top line to
` 627cr, aided by steady growth across categories. Earnings for the quarter are
expected to register healthy 2.7% yoy growth to ` 162cr, aided by margin dip of
350bp to 32.4%. We maintain our Neutral rating on the stock.
GSK Consumer – 3QCY2011
GSK Consumer is slated to announce its 3QCY2011 numbers. For the quarter, we
expect GSK Consumer to post healthy top-line growth of 20% yoy to ` 735cr,
driven by growth in its core brands. The bottom line is expected to register modest
8/3/2019 Market Outlook 4th November 2011
http://slidepdf.com/reader/full/market-outlook-4th-november-2011 6/11
Market Outlook | India Research
November 4, 2011 6
growth of 14.3% yoy to ` 90, aided by top-line growth and margin contraction of
32bp to 15.2%. We maintain our Neutral view on the stock.
Marico
Marico is expected to announce its 2QFY2012 results. For the quarter, we expect
Marico to report healthy 26.3% yoy growth in its consolidated top line to ` 984cr,
driven by steady growth in its core brands, Parachute and Saffola. Marico’s
earnings for the quarter are expected to remain flat owing to a 90bp yoy operating
margin contraction due to high raw-material costs. We maintain our Neutral
recommendation on the stock.
Nagarjuna Construction Company
We expect subdued performance from Nagarjuna Construction (NCC) for this
quarter. On the top-line front, NCC is expected to post modest yoy growth of 5.0%
to ` 1,261cr. EBITDA margin is expected to be flat at ~10.3% for the quarter.
However, the blow is expected on the earnings front, as we expect the company to
post a decline of 35.1% on a yoy basis to ` 29.8cr ( ` 46.0cr) for the quarter. This
would be primarily on account of burgeoning interest cost (yoy jump of ~79.4%),
led by elongated working capital cycle. We maintain our Buy rating on the stock
with a target price of `82.
8/3/2019 Market Outlook 4th November 2011
http://slidepdf.com/reader/full/market-outlook-4th-november-2011 7/11
Market Outlook | India Research
November 4, 2011 7
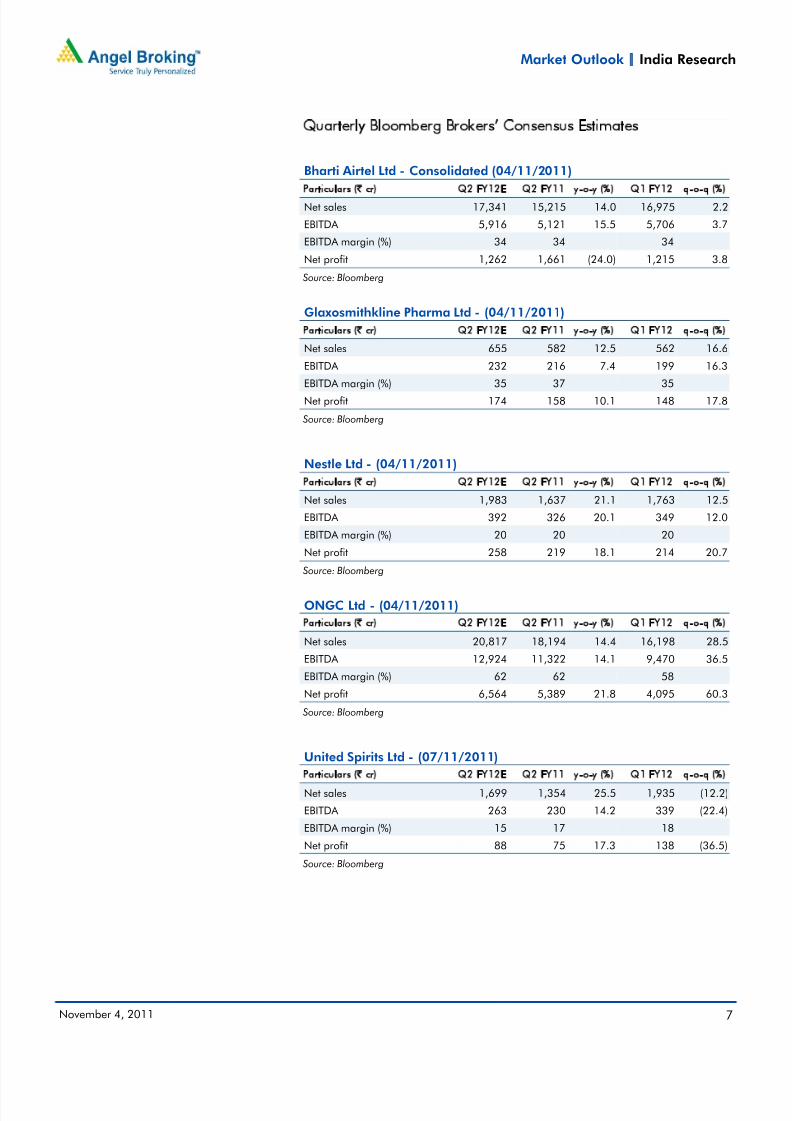
Quarterly Bloomberg Brokers’ Consensus Estimates
Bharti Airtel Ltd - Consolidated (04/11/2011)
Particulars (` cr) Q2 FY12E Q2 FY11 y-o-y (%) Q1 FY12 q-o-q (%)
Net sales 17,341 15,215 14.0 16,975 2.2
EBITDA 5,916 5,121 15.5 5,706 3.7
EBITDA margin (%) 34 34 34
Net profit 1,262 1,661 (24.0) 1,215 3.8
Source: Bloomberg
Glaxosmithkline Pharma Ltd - (04/11/2011)
Particulars (` cr) Q2 FY12E Q2 FY11 y-o-y (%) Q1 FY12 q-o-q (%)
Net sales 655 582 12.5 562 16.6
EBITDA 232 216 7.4 199 16.3EBITDA margin (%) 35 37 35
Net profit 174 158 10.1 148 17.8
Source: Bloomberg
Nestle Ltd - (04/11/2011)
Particulars (` cr) Q2 FY12E Q2 FY11 y-o-y (%) Q1 FY12 q-o-q (%)
Net sales 1,983 1,637 21.1 1,763 12.5
EBITDA 392 326 20.1 349 12.0
EBITDA margin (%) 20 20 20
Net profit 258 219 18.1 214 20.7 Source: Bloomberg
ONGC Ltd - (04/11/2011)
Particulars (` cr) Q2 FY12E Q2 FY11 y-o-y (%) Q1 FY12 q-o-q (%)
Net sales 20,817 18,194 14.4 16,198 28.5
EBITDA 12,924 11,322 14.1 9,470 36.5
EBITDA margin (%) 62 62 58
Net profit 6,564 5,389 21.8 4,095 60.3
Source: Bloomberg
United Spirits Ltd - (07/11/2011)
Particulars (` cr) Q2 FY12E Q2 FY11 y-o-y (%) Q1 FY12 q-o-q (%)
Net sales 1,699 1,354 25.5 1,935 (12.2)
EBITDA 263 230 14.2 339 (22.4)
EBITDA margin (%) 15 17 18
Net profit 88 75 17.3 138 (36.5)
Source: Bloomberg
8/3/2019 Market Outlook 4th November 2011
http://slidepdf.com/reader/full/market-outlook-4th-november-2011 8/11
Market Outlook | India Research
November 4, 2011 8
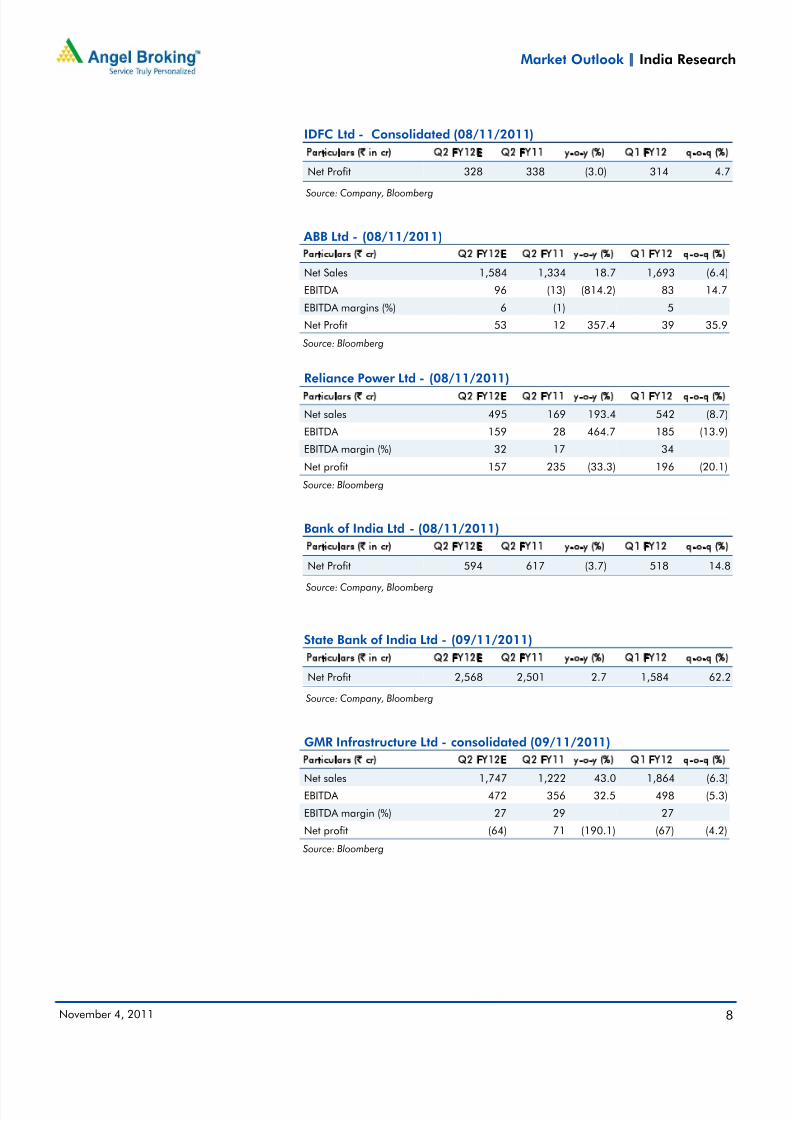
IDFC Ltd - Consolidated (08/11/2011)
Particulars (` in cr) Q2 FY12E Q2 FY11 y-o-y (%) Q1 FY12 q-o-q (%)
Net Profit 328 338 (3.0) 314 4.7
Source: Company, Bloomberg
ABB Ltd - (08/11/2011)
Particulars (` cr) Q2 FY12E Q2 FY11 y-o-y (%) Q1 FY12 q-o-q (%)
Net Sales 1,584 1,334 18.7 1,693 (6.4)
EBITDA 96 (13) (814.2) 83 14.7
EBITDA margins (%) 6 (1) 5
Net Profit 53 12 357.4 39 35.9
Source: Bloomberg
Reliance Power Ltd - (08/11/2011)
Particulars (` cr) Q2 FY12E Q2 FY11 y-o-y (%) Q1 FY12 q-o-q (%)
Net sales 495 169 193.4 542 (8.7)
EBITDA 159 28 464.7 185 (13.9)
EBITDA margin (%) 32 17 34
Net profit 157 235 (33.3) 196 (20.1)
Source: Bloomberg
Bank of India Ltd - (08/11/2011)
Particulars (` in cr) Q2 FY12E Q2 FY11 y-o-y (%) Q1 FY12 q-o-q (%)
Net Profit 594 617 (3.7) 518 14.8
Source: Company, Bloomberg
State Bank of India Ltd - (09/11/2011)
Particulars (` in cr) Q2 FY12E Q2 FY11 y-o-y (%) Q1 FY12 q-o-q (%)
Net Profit 2,568 2,501 2.7 1,584 62.2
Source: Company, Bloomberg
GMR Infrastructure Ltd - consolidated (09/11/2011)Particulars (` cr) Q2 FY12E Q2 FY11 y-o-y (%) Q1 FY12 q-o-q (%)
Net sales 1,747 1,222 43.0 1,864 (6.3)
EBITDA 472 356 32.5 498 (5.3)
EBITDA margin (%) 27 29 27
Net profit (64) 71 (190.1) (67) (4.2)
Source: Bloomberg
8/3/2019 Market Outlook 4th November 2011
http://slidepdf.com/reader/full/market-outlook-4th-november-2011 9/11
Market Outlook | India Research
November 4, 2011 9
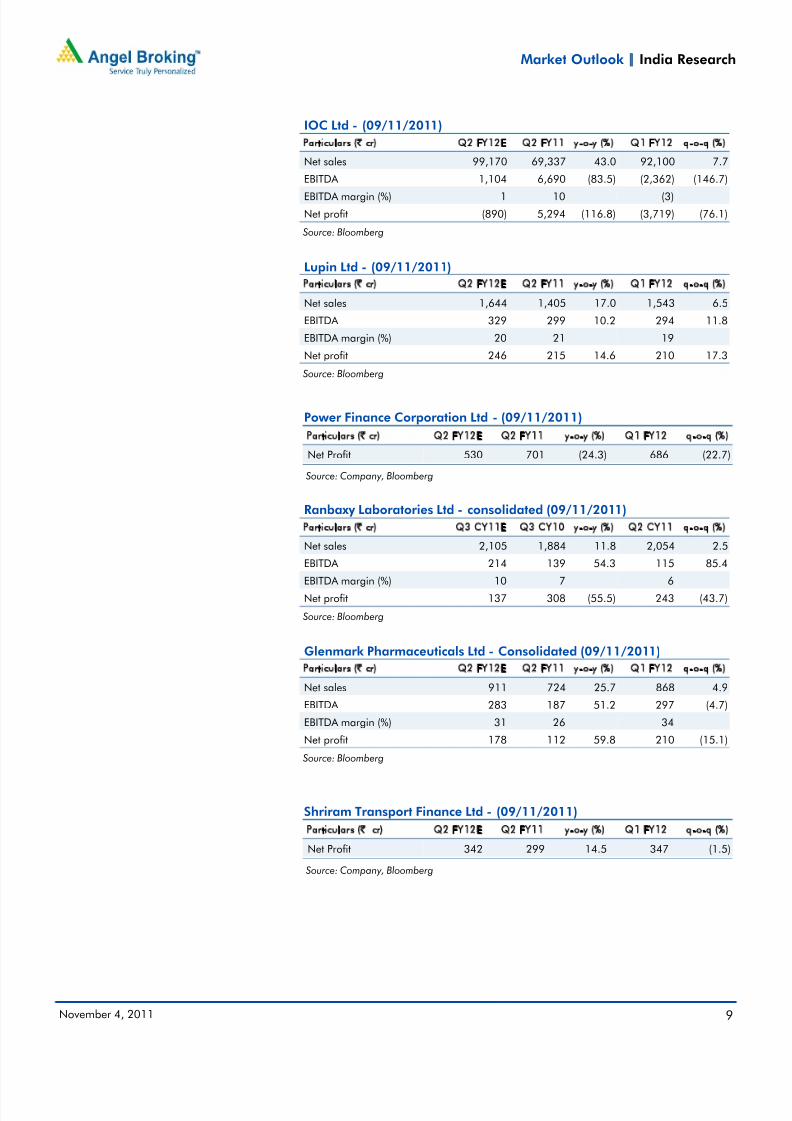
IOC Ltd - (09/11/2011)
Particulars (` cr) Q2 FY12E Q2 FY11 y-o-y (%) Q1 FY12 q-o-q (%)
Net sales 99,170 69,337 43.0 92,100 7.7
EBITDA 1,104 6,690 (83.5) (2,362) (146.7)
EBITDA margin (%) 1 10 (3)
Net profit (890) 5,294 (116.8) (3,719) (76.1)
Source: Bloomberg
Lupin Ltd - (09/11/2011)
Particulars (` cr) Q2 FY12E Q2 FY11 y-o-y (%) Q1 FY12 q-o-q (%)
Net sales 1,644 1,405 17.0 1,543 6.5
EBITDA 329 299 10.2 294 11.8
EBITDA margin (%) 20 21 19
Net profit 246 215 14.6 210 17.3
Source: Bloomberg
Power Finance Corporation Ltd - (09/11/2011)
Particulars (` cr) Q2 FY12E Q2 FY11 y-o-y (%) Q1 FY12 q-o-q (%)
Net Profit 530 701 (24.3) 686 (22.7)
Source: Company, Bloomberg
Ranbaxy Laboratories Ltd - consolidated (09/11/2011)
Particulars (` cr) Q3 CY11E Q3 CY10 y-o-y (%) Q2 CY11 q-o-q (%)
Net sales 2,105 1,884 11.8 2,054 2.5
EBITDA 214 139 54.3 115 85.4
EBITDA margin (%) 10 7 6
Net profit 137 308 (55.5) 243 (43.7)
Source: Bloomberg
Glenmark Pharmaceuticals Ltd - Consolidated (09/11/2011)
Particulars (` cr) Q2 FY12E Q2 FY11 y-o-y (%) Q1 FY12 q-o-q (%)
Net sales 911 724 25.7 868 4.9
EBITDA 283 187 51.2 297 (4.7)
EBITDA margin (%) 31 26 34
Net profit 178 112 59.8 210 (15.1) Source: Bloomberg
Shriram Transport Finance Ltd - (09/11/2011)
Particulars (` cr) Q2 FY12E Q2 FY11 y-o-y (%) Q1 FY12 q-o-q (%)
Net Profit 342 299 14.5 347 (1.5)
Source: Company, Bloomberg
8/3/2019 Market Outlook 4th November 2011
http://slidepdf.com/reader/full/market-outlook-4th-november-2011 10/11
Market Outlook | India Research
November 4, 2011 10
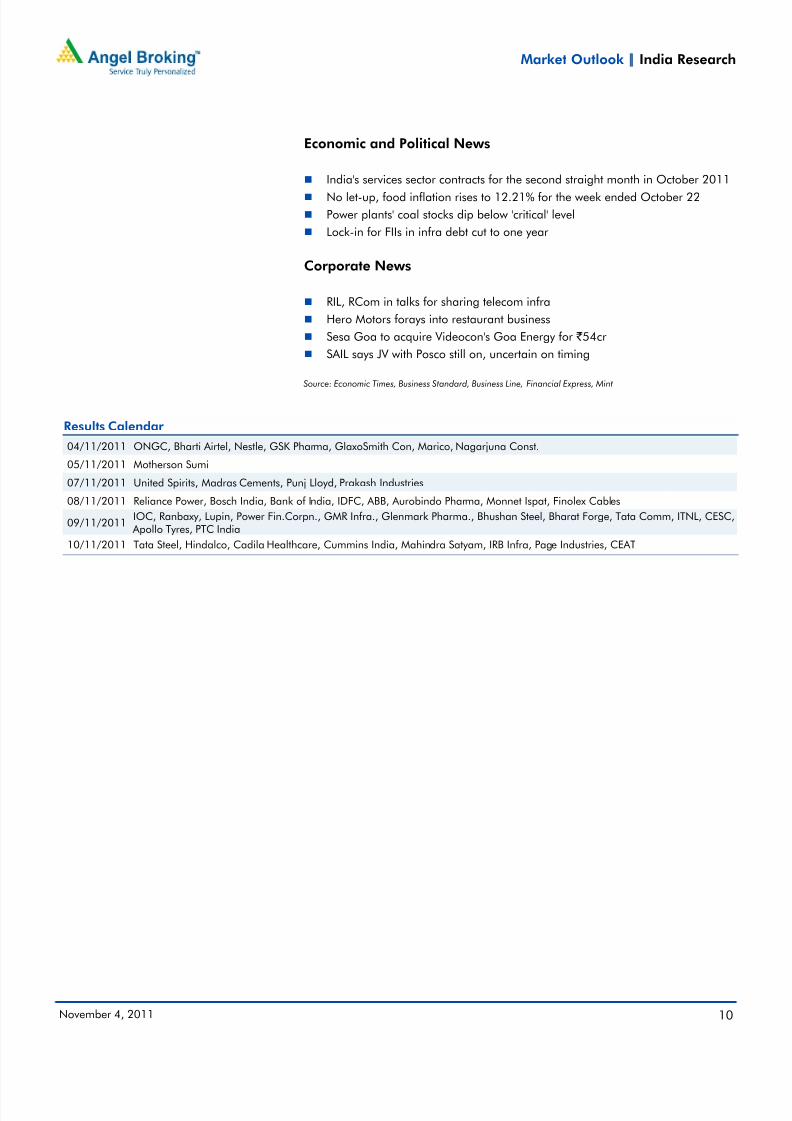
Economic and Political News
India's services sector contracts for the second straight month in October 2011 No let-up, food inflation rises to 12.21% for the week ended October 22
Power plants' coal stocks dip below 'critical' level
Lock-in for FIIs in infra debt cut to one year
Corporate News
RIL, RCom in talks for sharing telecom infra
Hero Motors forays into restaurant business
Sesa Goa to acquire Videocon's Goa Energy for ` 54cr
SAIL says JV with Posco still on, uncertain on timing
Source: Economic Times, Business Standard, Business Line, Financial Express, Mint
Results Calendar
04/11/2011 ONGC, Bharti Airtel, Nestle, GSK Pharma, GlaxoSmith Con, Marico, Nagarjuna Const.
05/11/2011 Motherson Sumi
07/11/2011 United Spirits, Madras Cements, Punj Lloyd, Prakash Industries
08/11/2011 Reliance Power, Bosch India, Bank of India, IDFC, ABB, Aurobindo Pharma, Monnet Ispat, Finolex Cables
09/11/2011IOC, Ranbaxy, Lupin, Power Fin.Corpn., GMR Infra., Glenmark Pharma., Bhushan Steel, Bharat Forge, Tata Comm, ITNL, CESC, Apollo Tyres, PTC India
10/11/2011 Tata Steel, Hindalco, Cadila Healthcare, Cummins India, Mahindra Satyam, IRB Infra, Page Industries, CEAT
8/3/2019 Market Outlook 4th November 2011
http://slidepdf.com/reader/full/market-outlook-4th-november-2011 11/11
Market Outlook | India Research
November 4, 2011 11
Research Team Tel: 022 - 39357800 E-mail: [email protected] Website: www.angelbroking.com
DISCLAIMER
This document is solely for the personal information of the recipient, and must not be singularly used as the basis of any investmentdecision. Nothing in this document should be construed as investment or financial advice. Each recipient of this document should make
such investigations as they deem necessary to arrive at an independent evaluation of an investment in the securities of the companies
referred to in this document (including the merits and risks involved), and should consult their own advisors to determine the merits and
risks of such an investment.
Angel Broking Limited, its affiliates, directors, its proprietary trading and investment businesses may, from time to time, make
investment decisions that are inconsistent with or contradictory to the recommendations expressed herein. The views contained in this
document are those of the analyst, and the company may or may not subscribe to all the views expressed within.
Reports based on technical and derivative analysis center on studying charts of a stock's price movement, outstanding positions and
trading volume, as opposed to focusing on a company's fundamentals and, as such, may not match with a report on a company's
fundamentals.
The information in this document has been printed on the basis of publicly available information, internal data and other reliablesources believed to be true, but we do not represent that it is accurate or complete and it should not be relied on as such, as thisdocument is for general guidance only. Angel Broking Limited or any of its affiliates/ group companies shall not be in any way responsible for any loss or damage that may arise to any person from any inadvertent error in the information contained in this report .
Angel Broking Limited has not independently verified all the information contained within this document. Accordingly, we cannot testify,nor make any representation or warranty, express or implied, to the accuracy, contents or data contained within this document. While Angel Broking Limited endeavours to update on a reasonable basis the information discussed in this material, there may be regulatory,compliance, or other reasons that prevent us from doing so.
This document is being supplied to you solely for your information, and its contents, information or data may not be reproduced,
redistributed or passed on, directly or indirectly.
Angel Broking Limited and its affiliates may seek to provide or have engaged in providing corporate finance, investment banking or
other advisory services in a merger or specific transaction to the companies referred to in this report, as on the date of this report or in
the past.
Neither Angel Broking Limited, nor its directors, employees or affiliates shall be liable for any loss or damage that may arise from or in
connection with the use of this information.
Note: Please refer to the important `Stock Holding Disclosure' report on the Angel website (Research Section). Also, please refer to thelatest update on respective stocks for the disclosure status in respect of those stocks. Angel Broking Limited and its affiliates may haveinvestment positions in the stocks recommended in this report.