Embed Size (px)
Citation preview
WATER QUALITY TRADING
Polluting Public Waterways for Private Gain
Food & Water Watch before people, and advocate for a democracy that improves people’s lives and protects our environment. We
envision a healthy future for our families and for generations to come, a world where all people have the wholesome food, clean water and sustainable energy they need to thrive. We believe this will happen when people become
and communities.
foodandwaterwatch.org.
Los Angeles, California 3000 S. Robertson BoulevardSuite 255Los Angeles, CA 90034(323) 843-8450
Oakland, California1814 Franklin StreetSuite 1100Oakland, CA 94612(510) 922-0720
Colorado1740 High StreetDenver, CO 80218(720) 449-7505
Florida1044 NE 15th AvenueFort Lauderdale, FL 33304(954) 372-1881
Illinois811 W. Evergreen AvenueSuite 401Chicago, IL 60642(773) 796-6088
Iowa505 Fifth AvenueSuite 818Des Moines, IA 50309(515) 344-4834
Maine142 High Street Suite 501-CPortland, ME 04101(207) 619-5845
Maryland3121 St. Paul StreetBaltimore, MD 21218(410) 394-7650
Michigan2727 Second AvenueSuite 136Detroit, MI 48201-2654(313) 486-1356
New Jersey100 Bayard StreetSuite 202New Brunswick, NJ 08901(732) 839-0860
New Mexico7804 Pan American East Freeway NE #2Albuquerque, NM 87109(505) 633-7366
New York68 Jay StreetSuite 713Brooklyn, NY 11201(718) 943-9085
North Carolina801 Gilbert StreetSuite 204Durham, NC 27701(919) 794-6380
Ohio103 William H. Taft RoadCincinnati, OH 45219(513) 394-6257
Oregon917 SW Oak StreetSuite 404Portland, OR 97205(971) 266-4528
Pennsylvania1501 Cherry StreetSecond FloorPhiladelphia, PA 19102(267) 428-1903
1616 P Street, NWSuite 300
Washington, DC 20036(202) 683-2500
About Food & Water Watch
Copyright © November 2015 by Food & Water Watch. All rights reserved.
This report can be viewed or downloaded at foodandwaterwatch.org.
Water Quality Trading: Polluting Public Waterways for Private Gain 1
Glossary . . . . . . . . . . . . . . . . . . . . . . . . . . . . . . . . . . . . . . . . . . . . . 2
Executive Summary . . . . . . . . . . . . . . . . . . . . . . . . . . . . . . . . . . . . . . . 3
Recommendations. . . . . . . . . . . . . . . . . . . . . . . . . . . . . . . . . . . . . . . . 4
Introduction . . . . . . . . . . . . . . . . . . . . . . . . . . . . . . . . . . . . . . . . . . . 5
Background on Water Pollution Control in the United States . . . . . . . . . . . . . . 6
Water Pollution Crisis: Declining U.S. Water Quality in the 1960s . . . . . . . . . . . . . . . 6
The Clean Water Act and Source-by-Source Controls:
40+ Years Controlling Point Source Pollution . . . . . . . . . . . . . . . . . . . . . . . . . 6
The Move to the Market in the Chesapeake Bay and the Ohio River Basin . . . . . . . . . . 7
The Theory of Water Pollution Trading . . . . . . . . . . . . . . . . . . . . . . . . . . 9
Point Source Control: Economic Cost Avoidance . . . . . . . . . . . . . . . . . . . . . . . . 9
Nonpoint Source Control: Agriculture and Voluntary Incentive Programs . . . . . . . . . . . 9
Water Pollution Trading Case Studies: Where Reality Contradicts Theory . . . . . . 9
Red Barn and the Pennsylvania Program . . . . . . . . . . . . . . . . . . . . . . . . . . . . 9
Alpine Cheese Company in Ohio . . . . . . . . . . . . . . . . . . . . . . . . . . . . . . 16
Summary and Recommendations . . . . . . . . . . . . . . . . . . . . . . . . . . . . . 22
Endnotes . . . . . . . . . . . . . . . . . . . . . . . . . . . . . . . . . . . . . . . . . . . . 25
TABLE OF CONTENTS
WATER QUALITY TRADINGPolluting Public Waterways for Private Gain

2 Food & Water Watch • foodandwaterwatch.org
Glossary
Best Management Practices (BMPs) – Best Management Practices are agency-mandated processes that can
avoid emissions or runoff to a body of water. Both point sources and non-point sources can implement BMPs to reduce
their impact on the environment. In point sources, these can include scheduling maintenance or procedures to discharge
the least amount of pollutants, when it will have the smallest impact on the environment. On farms, BMPs can include
changing how the farm operates to sequester the pollutants in the ground, or planting buffers between the farm and the
waterway to reduce the amount of pollution that runs off to the river or stream.
Best Available Technology (BAT/BATEA) – The CWA requires point sources to attain pollution discharge limits
that result from the “Best Available Technology Economically Achievable,” or BATEA. In practical terms, this means
that industries are supposed to do the best they can, using the most advanced technologies available, to reduce their
discharges of pollution to our waterways, while ensuring that chasing the last bit of reduction does not become cost
prohibitive.
Clean Water Act (CWA or the Act) – Landmark 1972 (amended in 1977 and 1987) law that sets limits on discharges
to America’s waterways. The stated goal of the CWA is zero discharges to waterways.
Concentrated Animal Feeding Operations (CAFOs) – A CAFO confines animals in areas with no vegetation
during the annual growing season. Most CAFOs are what we think of when we think of “factory farms.” While CAFOs
are theoretically controlled under the CWA, neither federal nor state environmental agencies actually provide the CWA
oversight that they do with other pollution sources, leaving many CAFOs without permits (see NPDES permit) and
largely unregulated.
National Pollutant Discharge Elimination System (NPDES) permit program – Under the CWA, the
NPDES permit program regulates point sources that discharge pollutants into waterways. All point sources of pollu-
tion are required to obtain a permit stating the limits of what will be discharged and setting up monitoring for their
discharges.
Nonpoint sources – Nonpoint sources pollute waterways through runoff caused by rainfall or snowmelt moving over
and through the ground to waterways. As the water moves, it picks up both natural and man-made pollutants. The pol-
lutants are then deposited into lakes, rivers, wetlands, coastal waters and ground waters. Traditionally, row crops are not
covered under the CWA, as they are considered nonpoint sources of pollution.
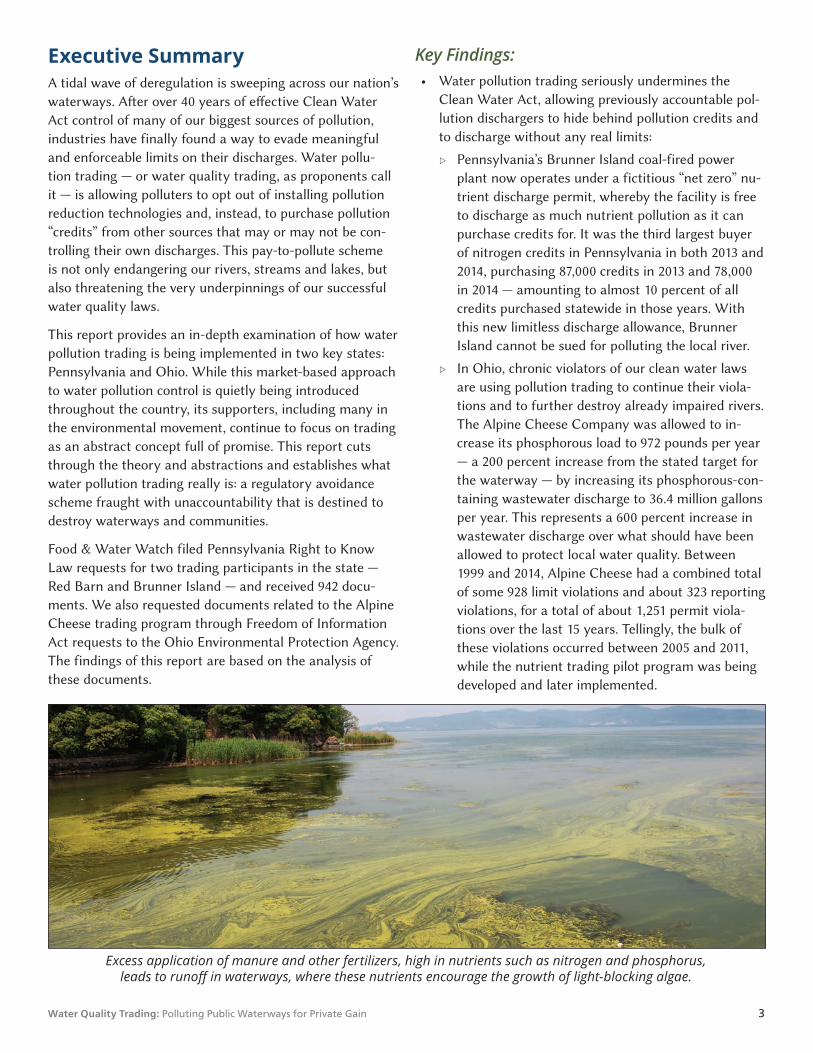
Nutrient pollution – While nutrients such as nitrogen and phosphorus contained in manure and other fertilizers
are helpful for crop growth, excess application leads to runoff into waterways. The nutrients encourage the growth of
algae, which blocks light, killing sea grasses below the surface. When the algae and the sea grasses die, their decomposi-
tion uses up the oxygen in the water, leading to hypoxia, or reduced oxygen levels — which, in turn, kills fish and other
aquatic animals. These “dead zones” appear in many bodies of water. The second largest dead zone in the world occurs
in the Gulf of Mexico every spring, due largely to nutrient pollution (see cover photo).
Point sources – Point source polluters discharge via man-made discrete conveyances, such as a pipe or man-made
ditch, that allows runoff to flow into surface water. Factories, power stations and municipal wastewater and runoff treat-
ment facilities fall under this category.
Total Maximum Daily Load – This is essentially a restriction on the amount of pollution that can flow into a water-
way or watershed. If a watershed cannot achieve meaningful progress in water quality, the U.S. Environmental Protection
Agency works with state agencies to set a total amount of pollution that the waterway can handle. Point sources then
are limited further in total discharges.
Water Pollution Control Act (WPCA) – Predecessor to the CWA, the WPCA was first passed in 1948 and
amended in 1965. There was no individual accountability for pollution, so there were no specific targets in even the most
polluted waterways.
Water Quality Trading: Polluting Public Waterways for Private Gain 3
Executive SummaryA tidal wave of deregulation is sweeping across our nation’s
waterways. After over 40 years of effective Clean Water
Act control of many of our biggest sources of pollution,
industries have finally found a way to evade meaningful
and enforceable limits on their discharges. Water pollu-
tion trading — or water quality trading, as proponents call
it — is allowing polluters to opt out of installing pollution
reduction technologies and, instead, to purchase pollution
“credits” from other sources that may or may not be con-
trolling their own discharges. This pay-to-pollute scheme
is not only endangering our rivers, streams and lakes, but
also threatening the very underpinnings of our successful
water quality laws.
This report provides an in-depth examination of how water
pollution trading is being implemented in two key states:
Pennsylvania and Ohio. While this market-based approach
to water pollution control is quietly being introduced
throughout the country, its supporters, including many in
the environmental movement, continue to focus on trading
as an abstract concept full of promise. This report cuts
through the theory and abstractions and establishes what
water pollution trading really is: a regulatory avoidance
scheme fraught with unaccountability that is destined to
destroy waterways and communities.
Food & Water Watch filed Pennsylvania Right to Know
Law requests for two trading participants in the state —
Red Barn and Brunner Island — and received 942 docu-
ments. We also requested documents related to the Alpine
Cheese trading program through Freedom of Information
Act requests to the Ohio Environmental Protection Agency.
The findings of this report are based on the analysis of
these documents.
Key Findings:• Water pollution trading seriously undermines the
Clean Water Act, allowing previously accountable pol-
lution dischargers to hide behind pollution credits and
to discharge without any real limits:
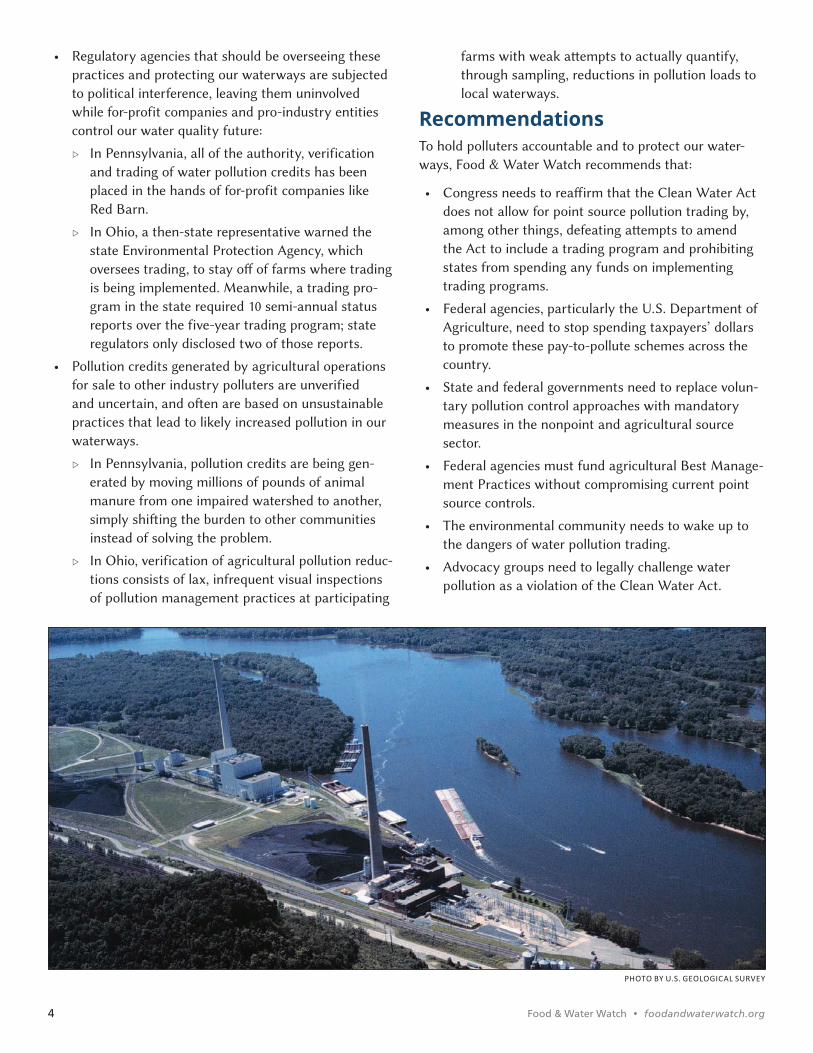
▷ Pennsylvania’s Brunner Island coal-fired power
plant now operates under a fictitious “net zero” nu-
trient discharge permit, whereby the facility is free
to discharge as much nutrient pollution as it can
purchase credits for. It was the third largest buyer
of nitrogen credits in Pennsylvania in both 2013 and
2014, purchasing 87,000 credits in 2013 and 78,000
in 2014 — amounting to almost 10 percent of all
credits purchased statewide in those years. With
this new limitless discharge allowance, Brunner
Island cannot be sued for polluting the local river.
▷ In Ohio, chronic violators of our clean water laws
are using pollution trading to continue their viola-
tions and to further destroy already impaired rivers.
The Alpine Cheese Company was allowed to in-
crease its phosphorous load to 972 pounds per year
— a 200 percent increase from the stated target for
the waterway — by increasing its phosphorous-con-
taining wastewater discharge to 36.4 million gallons
per year. This represents a 600 percent increase in
wastewater discharge over what should have been
allowed to protect local water quality. Between
1999 and 2014, Alpine Cheese had a combined total
of some 928 limit violations and about 323 reporting
violations, for a total of about 1,251 permit viola-
tions over the last 15 years. Tellingly, the bulk of
these violations occurred between 2005 and 2011,
while the nutrient trading pilot program was being
developed and later implemented.
Excess application of manure and other fertilizers, high in nutrients such as nitrogen and phosphorus,
4 Food & Water Watch • foodandwaterwatch.org
• Regulatory agencies that should be overseeing these
practices and protecting our waterways are subjected
to political interference, leaving them uninvolved
while for-profit companies and pro-industry entities
control our water quality future:
▷ In Pennsylvania, all of the authority, verification
and trading of water pollution credits has been
placed in the hands of for-profit companies like
Red Barn.
▷ In Ohio, a then-state representative warned the
state Environmental Protection Agency, which
oversees trading, to stay off of farms where trading
is being implemented. Meanwhile, a trading pro-
gram in the state required 10 semi-annual status
reports over the five-year trading program; state
regulators only disclosed two of those reports.
• Pollution credits generated by agricultural operations
for sale to other industry polluters are unverified
and uncertain, and often are based on unsustainable
practices that lead to likely increased pollution in our
waterways.
▷ In Pennsylvania, pollution credits are being gen-
erated by moving millions of pounds of animal
manure from one impaired watershed to another,
simply shifting the burden to other communities
instead of solving the problem.
▷ In Ohio, verification of agricultural pollution reduc-
tions consists of lax, infrequent visual inspections
of pollution management practices at participating
farms with weak attempts to actually quantify,
through sampling, reductions in pollution loads to
local waterways.
RecommendationsTo hold polluters accountable and to protect our water-
ways, Food & Water Watch recommends that:
• Congress needs to reaffirm that the Clean Water Act
does not allow for point source pollution trading by,
among other things, defeating attempts to amend
the Act to include a trading program and prohibiting
states from spending any funds on implementing
trading programs.
• Federal agencies, particularly the U.S. Department of
Agriculture, need to stop spending taxpayers’ dollars
to promote these pay-to-pollute schemes across the
country.
• State and federal governments need to replace volun-
tary pollution control approaches with mandatory
measures in the nonpoint and agricultural source
sector.
• Federal agencies must fund agricultural Best Manage-
ment Practices without compromising current point
source controls.
• The environmental community needs to wake up to
the dangers of water pollution trading.
• Advocacy groups need to legally challenge water
pollution as a violation of the Clean Water Act.
PHOTO BY U.S. GEOLOGICAL SURVEY

Water Quality Trading: Polluting Public Waterways for Private Gain 5
IntroductionClean water is not only the most vital natural resource on
Earth — it is also something that many people in the United
States take for granted, since clean drinking water is readily
available for most of our communities. However, as Toledo,
Ohio experienced in the summer of 2014, there are no
guarantees that clean water will always flow from our taps.
As industries continue to pollute and use their increasing
political influence to move away from the protective environ-
mental policies that we now have in place, clean water will
become even more scarce.1
Increasingly, corporations and governments that are charged
with protecting their citizens are pushing for deregulation
of pollution controls using market-based approaches.2 In
the United States, the marketplace is replacing our suite of
environmental laws, such as the Clean Water Act (CWA, or
Act). In the marketplace, pollution reduction is determined by
profitability and attained through the purchase of pollution
“credits” and offsets.3 To date, pollution trading has focused
mainly on air and climate problems, but we are witnessing
an increasing effort to undo the CWA by creating a market
for water pollution control. Regional water pollution trading
programs are taking off in the Chesapeake Bay watershed
and in the Ohio River Basin, currently covering nine states.4
Water pollution trading also is being contemplated, either in
active projects, pilot programs, regulations, policy or guid-
ance, in locations like Arkansas, Colorado, Connecticut, the
District of Columbia, Florida, Georgia, Idaho, Minnesota,
Montana, North Carolina, Oregon, Utah, Wisconsin, and
Washington.5
These pay-to-pollute schemes are being quietly implemented
with the active endorsement and funding of federal agencies
like the U.S. Department of Agriculture (USDA) and the
Environmental Protection Agency (EPA).6 And while polluting
industries are, as expected, actively pushing toward pollution
trading over regulation, the country’s environmental com-
munity has either openly embraced water pollution trading
or sits on the sidelines, unaware or unengaged.7
Water pollution trading — or water quality trading, as it is
called by proponents — is an overly complex and convoluted
system of pollution control that is inherently subject to
mismanagement, unaccountability and ineffectiveness,
yet trading adherents continue to issue reports that make
abstract promises, embracing make-believe ideals of account-
ability and verification.8 Just this year, the National Network
on Water Quality Trading (NNWQT)a put out a manual
detailing its views on what it called “successful” pollution
trading programs.9
The NNWQT report builds off a false foundation, stating
that pollution trading is “guided by the same goals as those
set out in the Clean Water Act.”10 However, pollution trading
is inherently antithetical to the goals of the CWA; while the
Act calls for the elimination of pollution from our waterways,
water pollution trading sanctions acceptable discharges of
pollution under a market scheme of credit swapping.
Even more disconcerting is the lack of polluter account-
ability built into water pollution trading. Individual polluter
accountability is the hallmark of success of the CWA and
its implementing regulations, while water pollution trading
is designed and implemented so that polluters can evade
responsibility for their discharges to our waterways. Some of
the members of the NNWQT know first-hand how pollution
trading destroys accountability and the rights of citizens to
protect their waterways — another cornerstone of the Act —
yet they still continue to promote the practice as the future of
water quality control.11
This report exposes the problems with water pollution
trading by looking closely at its implementation in both
Pennsylvania and Ohio. This investigation reveals that water
pollution trading is not a cost-effective fix to our ongoing
water quality problems, as proponents claim.12 Instead, it
is a broken system of inherently unaccountable and highly
questionable practices that will only pollute our waterways
and threaten our communities.
States Involved in Water Pollution Trading ProgramsArkansas
Colorado
Connecticut
Delaware
Florida
Georgia
Idaho
Indiana
Kentucky
Maryland
Minnesota
Montana
New York
North Carolina
Ohio
Oregon
Pennsylvania
Utah
Virginia
Washington
West Virginia
Wisconsin
a The NNWQT includes a number of industry, municipal and environmental groups. Although polluters trade pollution credits, proponents insist on euphemistically referring to the practice as Water Quality Trading. This report refers to the selling and purchasing of pollution credits more accurately as water pollution trading.
6 Food & Water Watch • foodandwaterwatch.org
Background on Water Pollution Control in the United StatesWater Pollution Crisis: Declining U.S. Water Quality in the 1960sBy the beginning of the second half of the twentieth
century, the increasing industrialization of the country
had taken a dramatic toll on U.S. rivers and lakes. This
water quality crisis is most often epitomized by the case
of the Cuyahoga River in Cleveland, Ohio. By the 1960s,
the stretch of river that ran through the city was so
polluted with industrial waste that Time magazine said
that it “oozes rather than flows.”13 The river also regularly
caught fire.14
Although the Cuyahoga is perhaps the most famous
example of declining U.S. water quality, it is certainly not
the only one. By the late 1960s, Lake Erie was officially
declared “dead” because of excess levels of nutrients,15
prompting Dr. Seuss to include the following passage in
the first printing of his 1971 book, The Lorax:
They’ll walk on their fins and get woefully weary
in search of some water that isn’t so smeary.
I hear things are just as bad up in Lake Erie.16
The United States in the 1960s was not without water
pollution laws. The Water Pollution Control Act of 1948
(WPCA) and its subsequent iterations all had minimal
protections for water quality, but their biggest downfall
was the lack of individual polluter accountability.17 For
example, while the 1965 WPCA Amendments provided for
ambient water quality monitoring, there was no attempt to
hold individual polluters responsible for their discharges.18
That meant that even when waterways were found to be
heavily polluted, there was no way to trace the problem
back to the source and to remedy the problem.
The Clean Water Act and Source-by-Source Controls: 40+ Years Controlling Point Source PollutionCongress responded to the emerging U.S. water quality
crisis by enacting a set of environmental laws and creating
the Environmental Protection Agency “to protect human
health and the environment.”19 Perhaps most important
among the new laws was the Clean Water Act, which was
enacted in 1972 “to restore and maintain the chemical,
physical, and biological integrity of the Nation’s waters.”20
The principal shift from earlier failed water pollution
laws was that the CWA implemented a source-by-source
accountability approach as part of its “national goal that
the discharge of pollutants into the navigable waters be
eliminated by 1985.”21
Point Sources of PollutionUnder the CWA, each industrial facility that discharged
pollutants into a waterway through a pipe or any other
kind of “discrete conveyance” was required to get a
discharge permit issued by the EPA or the state agency
authorized to administer the program.22 Importantly, these
“point source” polluters also were required to monitor
their discharges and to report the results to the EPA and
to any member of the public who wanted this informa-
tion.23 This fundamental shift in clean water protection
meant that when water quality problems were found,
sources could easily be identified and remedied.
CWA-permitted facilities were expected to install state-of-
the-art pollution reduction technologies to minimize their
discharges.24 For most industrial discharges, the standard
of reduction is known as Best Available Technology, or
BAT.25 These permits are to be reviewed and reissued
every five years to incorporate any new reduction tech-
nologies available, giving the Act its technology-driving
approach needed to eliminate discharges.26
Other important aspects of the 1972 CWA were trans-
parency and citizen empowerment. In recognition of
the fact that federal and state environmental agencies
would not always have the resources (or the will) to hold
polluters liable for violating the terms of their permits,
Congress wrote “citizen suit” provisions into many of our
modern environmental laws, including the CWA.27 These
provisions allow any person to obtain copies of permits,
discharge monitoring reports and all other records related
to point sources of pollution, and to bring permit violators
to court to seek injunctions against further violations.28
Although far from perfect, the CWA has proven to be a
tremendous success.29 In Lake Erie, catches of walleye,
the dominant fish species in the lake, grew from 112,000
in 1975 to 4.1 million in 1985.30 The largest polluters of
our waterways — coal-fired power plants, wastewater
treatment plants and manufacturing plants — now had
to adhere to science-based pollution reductions and,
when caught violating, had to immediately come into
compliance and pay fines. But the CWA did not succeed
in remedying all of our water quality problems. The EPA’s
latest water quality data show that over 580,000 miles of
U.S. rivers and streams and over 13 million acres of lakes
remain pollutant-impaired.31 Fifty-four percent of assessed
rivers and streams still suffer from excess pollution.32
Water Quality Trading: Polluting Public Waterways for Private Gain 7
Nonpoint Sources of PollutionThe biggest breakdown in CWA regulation has been with
sources of pollution that are not considered point sources
under the Act. These “nonpoint sources” include all of the
diffuse runoff that is not associated with discrete, point
source industrial pollution. Chief among these polluting
sources is the agricultural sector, which, despite more
than 40 years since the introduction of the CWA, remains
largely unregulated.b Ironically, it is this refusal to properly
regulate agricultural pollution that has, in part, spurred
the growth of water pollution trading as yet another in
a long line of attempts to get the industry to voluntarily
clean up its discharges.
The Move to the Market in the Chesapeake Bay and the Ohio River BasinIn recent decades, water pollution trading has been
introduced on a small scale in various states, typically to
address nutrient-impaired waterways.33 In recent years,
however, there has been a renewed push by industries
to replace the CWA source-by-source mandate with a
market-based approach that allows point source facilities
that do not want to pay to upgrade their pollution control
technology to purchase credits in lieu of upgrades.34 (See
“The Story of Water Pollution Trading” on pages 14-15.)
Some of the early attempts at water pollution trading,
such as Connecticut’s Long Island Sound nitrogen pro-
gram, involved placing a pollution cap on a number of
point source facilities within the same industry sector and
then allowing each facility some flexibility with permit
compliance as long as the aggregate cap limit was met.35
These types of point-to-point source programs, which are,
in effect, a Clean Water Act “bubble permit” approach,
have been replicated in Virginia’s wastewater treatment
industry and elsewhere.36
However, point-to-point source trading has not provided
industry with the wide-scale solution that they really
seek: a readily abundant and cheap way to avoid permit
compliance, which point-to-point source trading simply
cannot fulfill. Water pollution trading programs are
increasingly nonpoint-to-point source trading programs,
with industrial point sources looking to largely unregu-
lated nonpoint agricultural sources as low-cost credit
suppliers so that they can continue onsite discharges or
even exceed permit limits. The biggest nonpoint-to-point
source trading programs are being implemented in the
Chesapeake Bay watershed and the Ohio River Basin.37
Chesapeake Bay’s Total Maximum Daily Load“TMDLs” are the Total Maximum Daily Loads of pollut-
ants that can be discharged and still allow a water body
to meet water quality standards set by the states under
the Clean Water Act.38 These pollutants come from energy
facilities, factories, factory farms (also known as concen-
trated animal feeding operations, or CAFOs) and waste-
water treatment plants, as well as from harder-to-control
nonpoint sources such as many of the Bay’s agricultural
operations.39 In 1972, Congress required that TMDLs be
adopted for all water bodies if, after the application of
modern sewage and wastewater treatment technologies,
the waters continued to violate quality standards.40 The
Chesapeake Bay TMDL was formally adopted by the EPA
on December 29, 2010, after the Bay states, including
Delaware, Maryland, New York, Pennsylvania, Virginia,
West Virginia and the District of Columbia, avoided
adopting TMDLs for decades.41 The Bay TMDL focuses on
some of the biggest threats to the Bay watershed: nutri-
ents, namely nitrogen and phosphorus.42
In the simplest sense, the TMDL is a rationing plan. It
seeks to allocate pollution loads to waterways among
the many sources of pollution in the Bay. To implement
TMDLs, the EPA and the states must use their respective
authority to ratchet down or restrict pollutant discharges
through permits and other state regulatory programs.
According to the EPA, the Bay TMDL should restore water
quality in the Bay at some unspecified time after the year
2025.43
b Although crop operations are considered to be nonpoint sources under the Clean Water Act, concentrated animal feeding operations (CAFOs) are designated as point sources under the Act. However, the EPA and state agencies refuse to force CAFOs to adhere to the many protective provisions that other point sources must abide by. For example, CAFOs are not required to monitor and report their discharges of pollution.
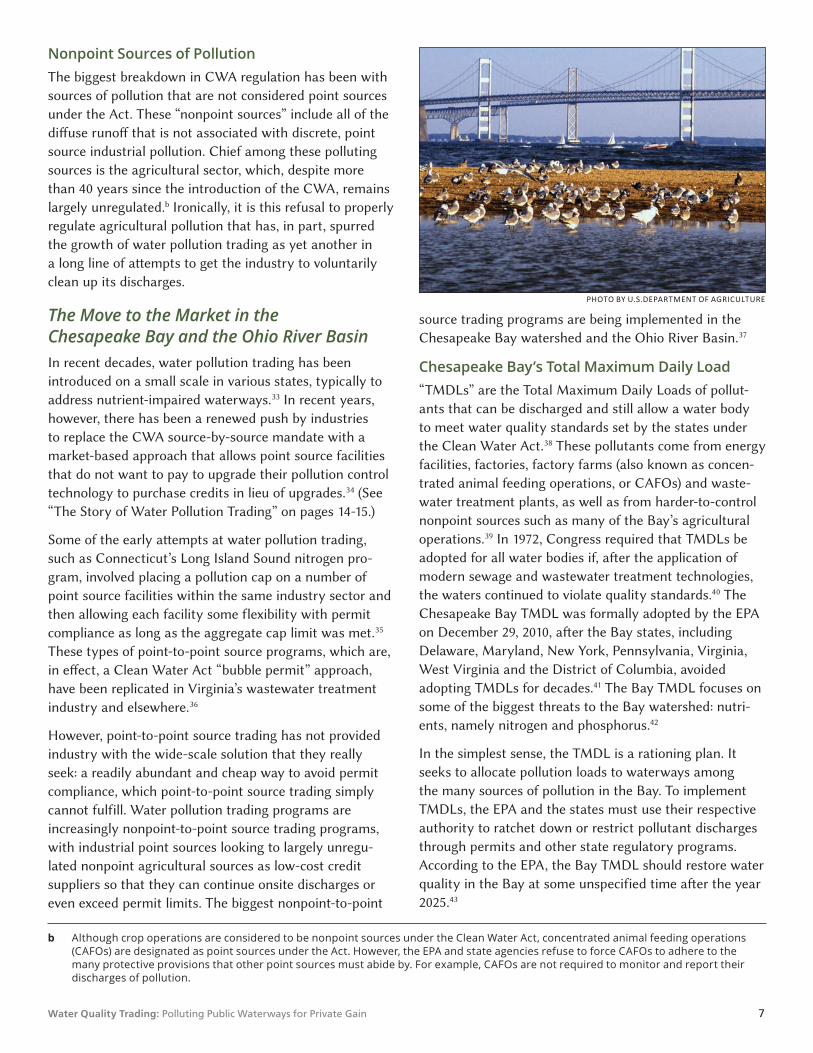
PHOTO BY U.S.DEPARTMENT OF AGRICULTURE
8 Food & Water Watch • foodandwaterwatch.org
One of the primary pollution problems facing the
Chesapeake Bay is nutrients from agricultural opera-
tions.44 Estimates from 2014 place agriculture’s contribu-
tions to Bay nitrogen and phosphorus loads at 42 percent
and 55 percent, respectively.45 For decades, the Bay states
and the federal government have plied the agricultural in-
dustry with taxpayer funds to implement voluntary prac-
tices, to little or no avail.46 Although cost-share programs,
manure storage sheds, cover crop initiatives and other
“Best Management Practices” have been implemented to
the tune of hundreds of millions of dollars, the health of
the Bay continues to decline.47
However, the failure of voluntary approaches in agri-
culture-related restoration efforts did not stop the EPA
from relying on yet another voluntary, incentive-based
approach in the TMDL.48 The EPA’s Bay cleanup plan
contemplates nutrient pollution trading as one of the main
components of Bay restoration, and, instead of taking on
any responsibility for overseeing and implementing this
untested practice, the EPA is allowing the Bay states to
come up with their own patchwork approach to pollution
trading.49
One such Bay state-implemented water pollution trading
program is in Pennsylvania (see page 9). Pennsylvania has
the longest running trading program of any Bay state. In
2014 alone, credits for more than 1.6 million pounds of
nitrogen and over 100,000 pounds of phosphorous were
generated from agriculture-related operations that went to
industrial point sources like wastewater treatment plants
and coal-fired power plants.50 This investigation of trading
in Pennsylvania relies on public documents regarding a
nutrient credit broker, Red Barn Trading Company, as well
as on other state agency documents. Our inquiry shows
a fundamentally broken and unaccountable system of
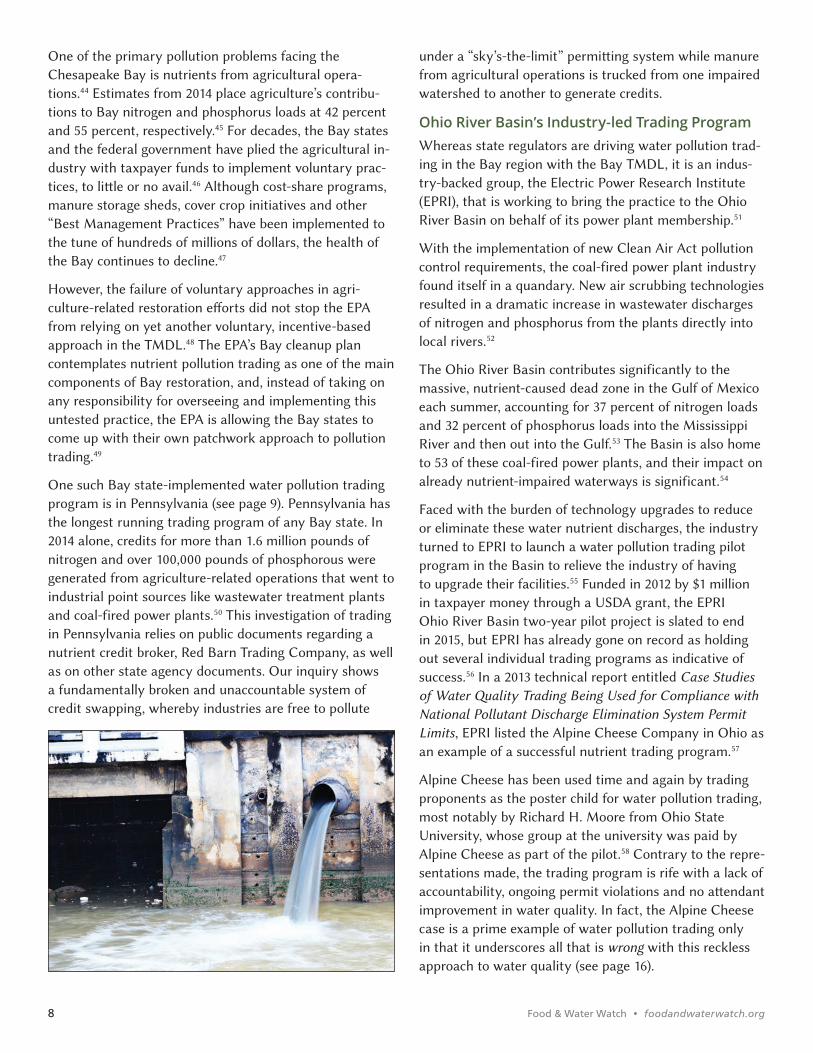
credit swapping, whereby industries are free to pollute
under a “sky’s-the-limit” permitting system while manure
from agricultural operations is trucked from one impaired
watershed to another to generate credits.
Ohio River Basin’s Industry-led Trading ProgramWhereas state regulators are driving water pollution trad-
ing in the Bay region with the Bay TMDL, it is an indus-
try-backed group, the Electric Power Research Institute
(EPRI), that is working to bring the practice to the Ohio
River Basin on behalf of its power plant membership.51
With the implementation of new Clean Air Act pollution
control requirements, the coal-fired power plant industry
found itself in a quandary. New air scrubbing technologies
resulted in a dramatic increase in wastewater discharges
of nitrogen and phosphorus from the plants directly into
local rivers.52
The Ohio River Basin contributes significantly to the
massive, nutrient-caused dead zone in the Gulf of Mexico
each summer, accounting for 37 percent of nitrogen loads
and 32 percent of phosphorus loads into the Mississippi
River and then out into the Gulf.53 The Basin is also home
to 53 of these coal-fired power plants, and their impact on
already nutrient-impaired waterways is significant.54
Faced with the burden of technology upgrades to reduce
or eliminate these water nutrient discharges, the industry
turned to EPRI to launch a water pollution trading pilot
program in the Basin to relieve the industry of having
to upgrade their facilities.55 Funded in 2012 by $1 million
in taxpayer money through a USDA grant, the EPRI
Ohio River Basin two-year pilot project is slated to end
in 2015, but EPRI has already gone on record as holding
out several individual trading programs as indicative of
success.56 In a 2013 technical report entitled Case Studies
of Water Quality Trading Being Used for Compliance with
National Pollutant Discharge Elimination System Permit
Limits, EPRI listed the Alpine Cheese Company in Ohio as
an example of a successful nutrient trading program.57
Alpine Cheese has been used time and again by trading
proponents as the poster child for water pollution trading,
most notably by Richard H. Moore from Ohio State
University, whose group at the university was paid by
Alpine Cheese as part of the pilot.58 Contrary to the repre-
sentations made, the trading program is rife with a lack of
accountability, ongoing permit violations and no attendant
improvement in water quality. In fact, the Alpine Cheese
case is a prime example of water pollution trading only
in that it underscores all that is wrong with this reckless
approach to water quality (see page 16).

Water Quality Trading: Polluting Public Waterways for Private Gain 9
The Theory of Water Pollution TradingSimply put, nonpoint-to-point source water pollution
trading rests on the belief that it is less costly to reduce
nutrient pollution from agricultural sources than it is from
industrial point sources like wastewater treatment plants.
Adherents of trading, by focusing their attention on
downstream receiving water bodies like the Chesapeake
Bay or the Gulf of Mexico, take the position that a pound
of upstream nutrient reduction is the same regardless
of the source, and that a grass buffer filter on a farm is
cheaper to install than a nutrient filter on a coal-fired
power plant.59 In addition to the point source cost-saving
benefit, trading proponents also highlight the nonpoint-to-
point source approach as one that will further incentivize
agriculture, the largest source of nutrient pollution in U.S.
waterways, to take steps to reduce their own loads (See
“The Story of Water Pollution Trading” on pages 14–15).60
Point Source Control: Economic Cost Avoidance The Clean Water Act generally requires industrial point
sources to attain pollution discharge limits that result from
the “Best Available Technology Economically Achievable,”
or BATEA.61 In practical terms, this means that industries
are supposed to do the best they can, using the most ad-
vanced technologies available, to reduce their discharges
of pollution to our waterways. The “economically achiev-
able” part means that at some point, further reductions
simply do not become cost-efficient, but the hope is that
further, affordable technological advances will make it
possible to one day attain the Act’s goal of eliminating
pollution from our waterways.
Trading theorists suggest that it is these last, incremental
reductions that industries should be able to meet through
the purchase of agricultural credits, allowing industry
to avoid additional reduction costs while still achieving
downstream load reductions.62 However, neither industry
nor government has the same view of the limited utility of
pollution credits. Instead, power plants are being permit-
ted to use credits to cover their entire discharge of nutri-
ent pollution into nutrient-impaired rivers — in the case
of Brunner Island in Pennsylvania, for as much as 87,000
pounds of nitrogen in some years.63 Also, the ability of
industrial point sources to use pollution credits is destroy-
ing the individual accountability framework of the CWA,
essentially returning us to the failed ambient water quality
approach that resulted in the 1960s water crisis.
Nonpoint Source Control: Agriculture and Voluntary Incentive ProgramsTrading supporters also claim that pollution trading cre-
ates financial incentives for industrial agriculture — the
largest source of nutrient pollution in many of our nation’s
waters — to clean up its mess.64 They say that trading rep-
resents the kind of out-of-the-box thinking that will help
restore our many impaired waterways.65 However, these
financial incentives have existed for decades in an ongoing
and failing effort to stop agricultural pollution.
The agricultural nutrient pollution problem does not
stem from a lack of voluntary and financial incentives.
Instead, it is a result of government’s steadfast refusal to
implement what has worked so well in the point source
sector: individual accountability, discharge limits, monitor-
ing and transparency. Yet, rather than bringing some of
these successful point source control mechanisms to the
agricultural sector, trading adherents are moving some of
the failed nonpoint source approaches over to point source
industries under the guise of water pollution trading.
Water Pollution Trading Case Studies: Where Reality Contradicts TheoryRed Barn and the Pennsylvania Program
Proponents who view water pollution trading as a way
to improve water quality are all in agreement that there
must be careful oversight of credit generating and pur-
chasing, with verification and accountability built into
trades. Yet oversight, verification and accountability are
all, to a large degree, undefined concepts. Our review
of Red Barn and the Pennsylvania program shows that
the ideal trading that supporters might envision is far
removed from the reality on the ground.
Pennsylvania is one of the biggest sources of nutrients to
the Chesapeake Bay, in part because of a long history of
ineffective regulation of agricultural operations. Starting
in 2005, the state implemented its water pollution trading
program as yet another incentive-based approach to agri-
cultural pollution. The application process for agricultural
credits includes steps for verifying the eligibility of a farm
to generate the credits, checking the Best Management
Practice (BMP) planned to generate the credits, a calcula-
tion of the amount of nutrient pollution avoided, and a
verification plan.66
10 Food & Water Watch • foodandwaterwatch.org
Because of the way that the Pennsylvania trading
regulations are structured, the state Department of
Environmental Protection (DEP) takes a virtually hands-
off approach to water pollution trading, leaving the
application and credit verification process largely in the
hands of pollution credit broker services that have cropped
up in the state. Red Barn Trading Company, located in
Lancaster, Pennsylvania, is one such company. In 2014,
Red Barn was the third largest source of verified nitrogen
credits in the state.67
Given the degree of control that for-profit companies like
Red Barn have over the credit trading program, Food &
Water Watch decided to look at all the ways that Red
Barn was working with farmers and state officials. We
also wanted to look at the records for the largest non-
municipal (and third largest overall) purchaser of credits,
PPL Energy, the operator of the Brunner Island Power
Plant. We filed Pennsylvania Right to Know Law requests
for both Red Barn and Brunner Island and received 942
documents, all of which we analyzed. All references in this
report to specific proposals, verification reports or sales in
Pennsylvania’s pollution trading scheme will refer either
to documents received from those requests or to public
documents.
The documents reveal that much of the trading process in
Pennsylvania is outsourced to Red Barn. All of the author-
ity, verification and trading, which should be under the
auspices of employees of state environmental protection
departments, has been placed in the hands of the com-
pany. Red Barn is a one-stop shop for farms that want to
sell pollution credits to other industries. Red Barn works
with farms to put together the application for credit-
generating to submit to the DEP.68 Those credit-generation
proposals are based on BMPs that Red Barn recommends
in Nutrient Management Plans that it creates for the
farm.
Once the DEP certifies the proposal, it is Red Barn,
not the state, that verifies that the credits are, in fact,
being generated by the BMPs that Red Barn included
in the farm’s Nutrient Management Plan.69 Red Barn
then sells those “verified” credits at an auction run by
the Pennsylvania Infrastructure Investment Authority
(PENNVEST) to buyers that need the credits to meet their
permit needs.70 Red Barn, through its contracts with farm-
ers and credit purchasers, is involved in every step — from
proposal to disposition — of selling water pollution credits.
The lack of agency oversight and the degree to which
companies like Red Barn control the trading process from
cradle to grave create significant potential for abuse.
Historically, pollution credit trading regimes, and espe-
cially those including offsets, have had difficulty detecting
and preventing fraud and abuse. For example, INTERPOL
looked at a variety of carbon cap-and-trade schemes, in-
cluding the European Union’s program, the world’s largest
such scheme, and found a variety of examples of current
and potential fraud.71 Likewise, the U.S. Renewable Fuels
Standard (RFS) trading program, perhaps more than any
other environmental trading scheme, has been vulnerable
to fraud and manipulation. As of November 2011, the EPA
believed that about 140 million renewable energy credits
(9 percent of the total market) had been fraudulently
generated and sold under the RFS program.72
Although our review of the Pennsylvania trading program
uncovered no direct evidence of fraud, the oversight by
regulatory agencies that trading proponents demand as an
integral component of water pollution trading is virtually
absent in the Pennsylvania program. Leaving private compa-
nies that profit from the sale of credits in charge of verifying
that those credits do, indeed, exist makes a mockery of the
concept of oversight and creates the potential for fraud.
Shifting Pollution From One Impaired Waterway to AnotherOne of the dominant BMPs that Red Barn and its client
farmers engage in to generate nutrient credits under the
Pennsylvania program is manure export, or shipping
manure from industrialized animal factory farms out
of the watershed to another location where it could be
used as fertilizer.73 This is especially attractive for poultry
manure, which is fairly dry and therefore amenable to
transportation.74
Not only does Red Barn like to take advantage of the
manure transport system, but poultry litter transport
also has been a favorite method of generating credits in
Pennsylvania. About 29 percent of all nitrogen credits
certified in the state in 2014 came from poultry manure
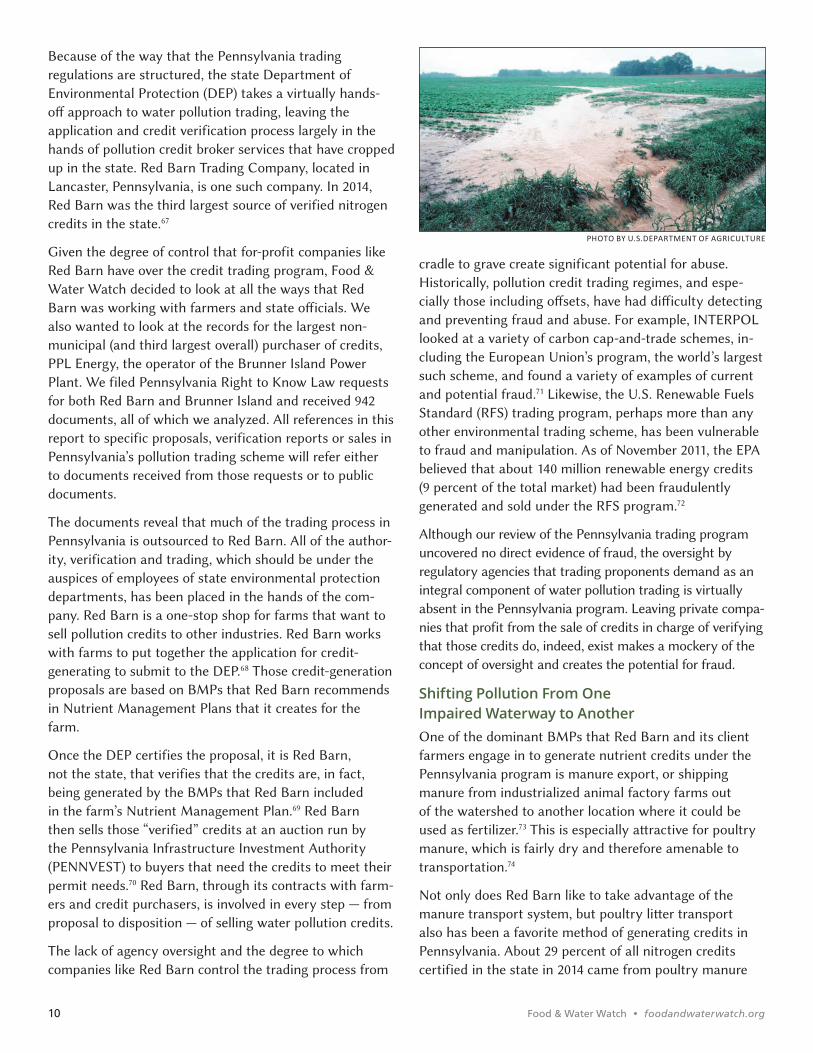
PHOTO BY U.S.DEPARTMENT OF AGRICULTURE
Water Quality Trading: Polluting Public Waterways for Private Gain 11
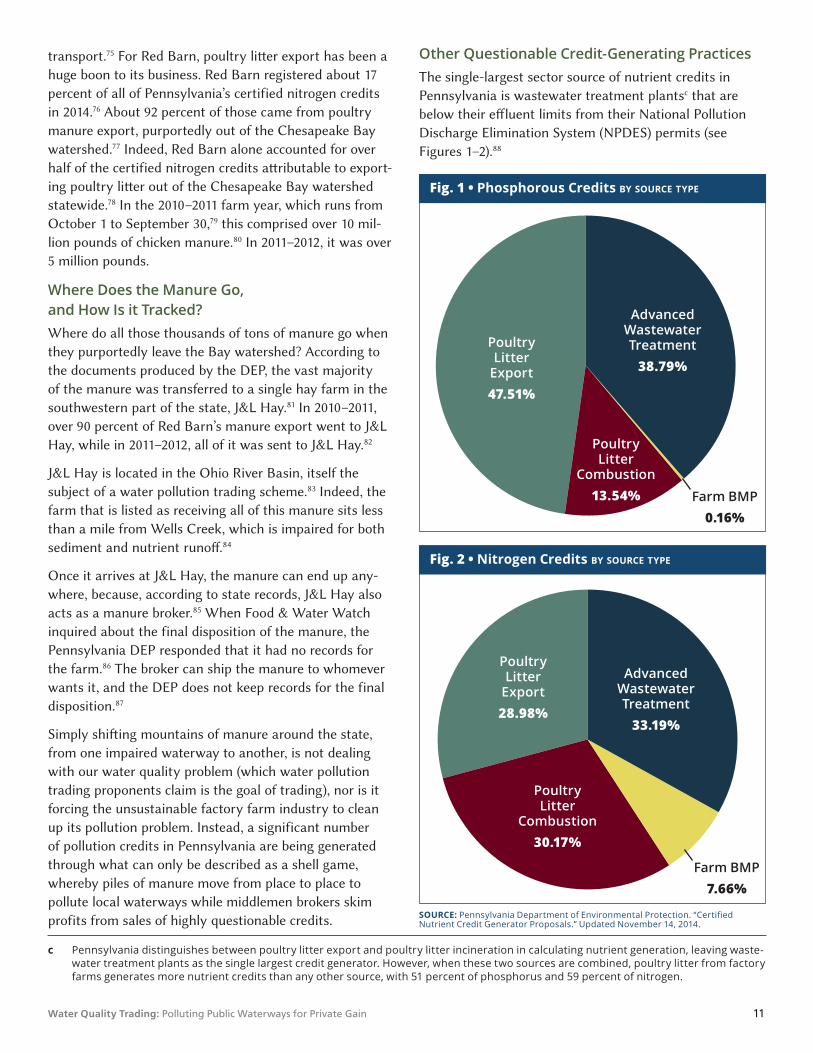
transport.75 For Red Barn, poultry litter export has been a
huge boon to its business. Red Barn registered about 17
percent of all of Pennsylvania’s certified nitrogen credits
in 2014.76 About 92 percent of those came from poultry
manure export, purportedly out of the Chesapeake Bay
watershed.77 Indeed, Red Barn alone accounted for over
half of the certified nitrogen credits attributable to export-
ing poultry litter out of the Chesapeake Bay watershed
statewide.78 In the 2010–2011 farm year, which runs from
October 1 to September 30,79 this comprised over 10 mil-
lion pounds of chicken manure.80 In 2011–2012, it was over
5 million pounds.
Where Does the Manure Go, and How Is it Tracked?Where do all those thousands of tons of manure go when
they purportedly leave the Bay watershed? According to
the documents produced by the DEP, the vast majority
of the manure was transferred to a single hay farm in the
southwestern part of the state, J&L Hay.81 In 2010–2011,
over 90 percent of Red Barn’s manure export went to J&L
Hay, while in 2011–2012, all of it was sent to J&L Hay.82
J&L Hay is located in the Ohio River Basin, itself the
subject of a water pollution trading scheme.83 Indeed, the
farm that is listed as receiving all of this manure sits less
than a mile from Wells Creek, which is impaired for both
sediment and nutrient runoff.84
Once it arrives at J&L Hay, the manure can end up any-
where, because, according to state records, J&L Hay also
acts as a manure broker.85 When Food & Water Watch
inquired about the final disposition of the manure, the
Pennsylvania DEP responded that it had no records for
the farm.86 The broker can ship the manure to whomever
wants it, and the DEP does not keep records for the final
disposition.87
Simply shifting mountains of manure around the state,
from one impaired waterway to another, is not dealing
with our water quality problem (which water pollution
trading proponents claim is the goal of trading), nor is it
forcing the unsustainable factory farm industry to clean
up its pollution problem. Instead, a significant number
of pollution credits in Pennsylvania are being generated
through what can only be described as a shell game,
whereby piles of manure move from place to place to
pollute local waterways while middlemen brokers skim
profits from sales of highly questionable credits.
Other Questionable Credit-Generating PracticesThe single-largest sector source of nutrient credits in
Pennsylvania is wastewater treatment plantsc that are
below their effluent limits from their National Pollution
Discharge Elimination System (NPDES) permits (see
Figures 1–2).88
c Pennsylvania distinguishes between poultry litter export and poultry litter incineration in calculating nutrient generation, leaving waste-water treatment plants as the single largest credit generator. However, when these two sources are combined, poultry litter from factory farms generates more nutrient credits than any other source, with 51 percent of phosphorus and 59 percent of nitrogen.
SOURCE: Nutrient Credit Generator Proposals.” Updated November 14, 2014.
Fig. 1 • Phosphorous Credits BY SOURCE TYPE
Fig. 2 • Nitrogen Credits BY SOURCE TYPE
Advanced Wastewater Treatment
38.79%
Poultry Litter
Export47.51%
Poultry Litter
Combustion13.54% Farm BMP
0.16%
Farm BMP7.66%
Advanced Wastewater Treatment
33.19%
Poultry Litter
Combustion30.17%
Poultry Litter
Export28.98%
12 Food & Water Watch • foodandwaterwatch.org
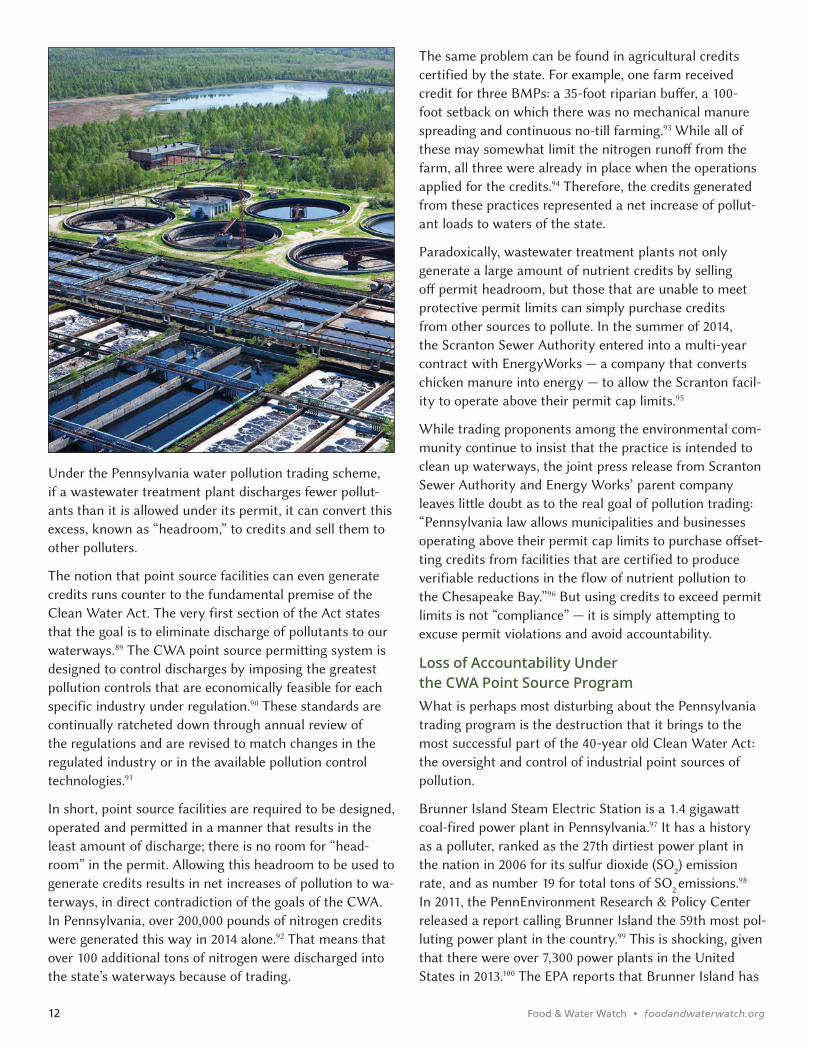
Under the Pennsylvania water pollution trading scheme,
if a wastewater treatment plant discharges fewer pollut-
ants than it is allowed under its permit, it can convert this
excess, known as “headroom,” to credits and sell them to
other polluters.
The notion that point source facilities can even generate
credits runs counter to the fundamental premise of the
Clean Water Act. The very first section of the Act states
that the goal is to eliminate discharge of pollutants to our
waterways.89 The CWA point source permitting system is
designed to control discharges by imposing the greatest
pollution controls that are economically feasible for each
specific industry under regulation.90 These standards are
continually ratcheted down through annual review of
the regulations and are revised to match changes in the
regulated industry or in the available pollution control
technologies.91
In short, point source facilities are required to be designed,
operated and permitted in a manner that results in the
least amount of discharge; there is no room for “head-
room” in the permit. Allowing this headroom to be used to
generate credits results in net increases of pollution to wa-
terways, in direct contradiction of the goals of the CWA.
In Pennsylvania, over 200,000 pounds of nitrogen credits
were generated this way in 2014 alone.92 That means that
over 100 additional tons of nitrogen were discharged into
the state’s waterways because of trading.
The same problem can be found in agricultural credits
certified by the state. For example, one farm received
credit for three BMPs: a 35-foot riparian buffer, a 100-
foot setback on which there was no mechanical manure
spreading and continuous no-till farming.93 While all of
these may somewhat limit the nitrogen runoff from the
farm, all three were already in place when the operations
applied for the credits.94 Therefore, the credits generated
from these practices represented a net increase of pollut-
ant loads to waters of the state.
Paradoxically, wastewater treatment plants not only
generate a large amount of nutrient credits by selling
off permit headroom, but those that are unable to meet
protective permit limits can simply purchase credits
from other sources to pollute. In the summer of 2014,
the Scranton Sewer Authority entered into a multi-year
contract with EnergyWorks — a company that converts
chicken manure into energy — to allow the Scranton facil-
ity to operate above their permit cap limits.95
While trading proponents among the environmental com-
munity continue to insist that the practice is intended to
clean up waterways, the joint press release from Scranton
Sewer Authority and Energy Works’ parent company
leaves little doubt as to the real goal of pollution trading:
“Pennsylvania law allows municipalities and businesses
operating above their permit cap limits to purchase offset-
ting credits from facilities that are certified to produce
verifiable reductions in the flow of nutrient pollution to
the Chesapeake Bay.”96 But using credits to exceed permit
limits is not “compliance” — it is simply attempting to
excuse permit violations and avoid accountability.
Loss of Accountability Under the CWA Point Source ProgramWhat is perhaps most disturbing about the Pennsylvania
trading program is the destruction that it brings to the
most successful part of the 40-year old Clean Water Act:
the oversight and control of industrial point sources of
pollution.
Brunner Island Steam Electric Station is a 1.4 gigawatt
coal-fired power plant in Pennsylvania.97 It has a history
as a polluter, ranked as the 27th dirtiest power plant in
the nation in 2006 for its sulfur dioxide (SO2) emission
rate, and as number 19 for total tons of SO2 emissions.98
In 2011, the PennEnvironment Research & Policy Center
released a report calling Brunner Island the 59th most pol-
luting power plant in the country.99 This is shocking, given
that there were over 7,300 power plants in the United
States in 2013.100 The EPA reports that Brunner Island has

Water Quality Trading: Polluting Public Waterways for Private Gain 13
been in noncompliance for nitrogen discharges two out of
the last three times it was tested, dating back to 2012.101
Thanks to water pollution trading, Brunner Island’s CWA
permit compliance problems for nitrogen discharges are
over. Before Pennsylvania engaged in water pollution
trading, facilities like Brunner Island were given a permit
to discharge pollutants within concrete, measured and
verified limits. Facilities could discharge 100 or 1,000 or
10,000 pounds of nitrogen per year, but they needed to
show, through regular end-of-the-pipe water sampling,
that they met the limit. Over time, as reduction technolo-
gies improved, permit limits were ratcheted down to
smaller amounts. That technology-driving, source-by-
source approach has brought many of our waterways
from the brink of disaster in the 1960s to relatively good
health today.
Water pollution trading has put an end to accountable
CWA permitting.
Brunner Island now operates under a fictitious “net zero”
nutrient discharge permit, free to discharge as much
nutrient pollution as it purchases credits for.102 And
Brunner Island has been taking full advantage of the
scheme. It was the third largest buyer of nitrogen credits
in Pennsylvania in both 2013 and 2014, purchasing 87,000
credits in 2013 and 78,000 in 2014.103 That amounts to
almost 10 percent of all credits purchased statewide each
year.104
Even some of trading’s proponents are frustrated in their
efforts to hold point source credit purchasers like Brunner
Island accountable. In 2012, the USDA gave a grant of just
over $700,000 to the Chesapeake Bay Foundation, a mem-
ber of the NNWQT, to help assess water pollution trading
in the Bay watershed, specifically in Pennsylvania and
Virginia.105 However, in October 2014, the Chesapeake Bay
Foundation filed a 60-day notice of intent under the CWA
to file suit against Brunner Island for its questionable use
of nutrient credits, some of which were purchased from
Red Barn.106 Such notices are a common enforcement
strategy under the Act that allows private citizens to sue
permittees that are alleged to be in violation of a permit.107
This has been a powerful tool for environmental activ-
ists, as it allows them to enforce the law even if state and
federal agencies cannot or will not.
In its notice letter, the Chesapeake Bay Foundation
pointed to the problems that Food & Water Watch has
been pointing to for years: that the agricultural credits
being purchased were not verified and that there is no
proof that the claimed credit-generating activities actually
took place.108 In sum, the Chesapeake Bay Foundation said
the Pennsylvania DEP failed to show that there is, through
trading, a net reduction in pollution.109
Unfortunately, despite the threat of litigation, no suit was
ever brought forward, even long after the expiration of
the 60-day notice period, nor could it. Brunner Island no
longer has permit limits that citizens can monitor and
enforce; it essentially operates under a nutrient discharge
allowance that is limited only by the number of credits
that the facility purchases. Unfortunately, our waterways
will bear the burden of this unaccountable approach;
water pollution trading means the end of the CWA as we
know it.
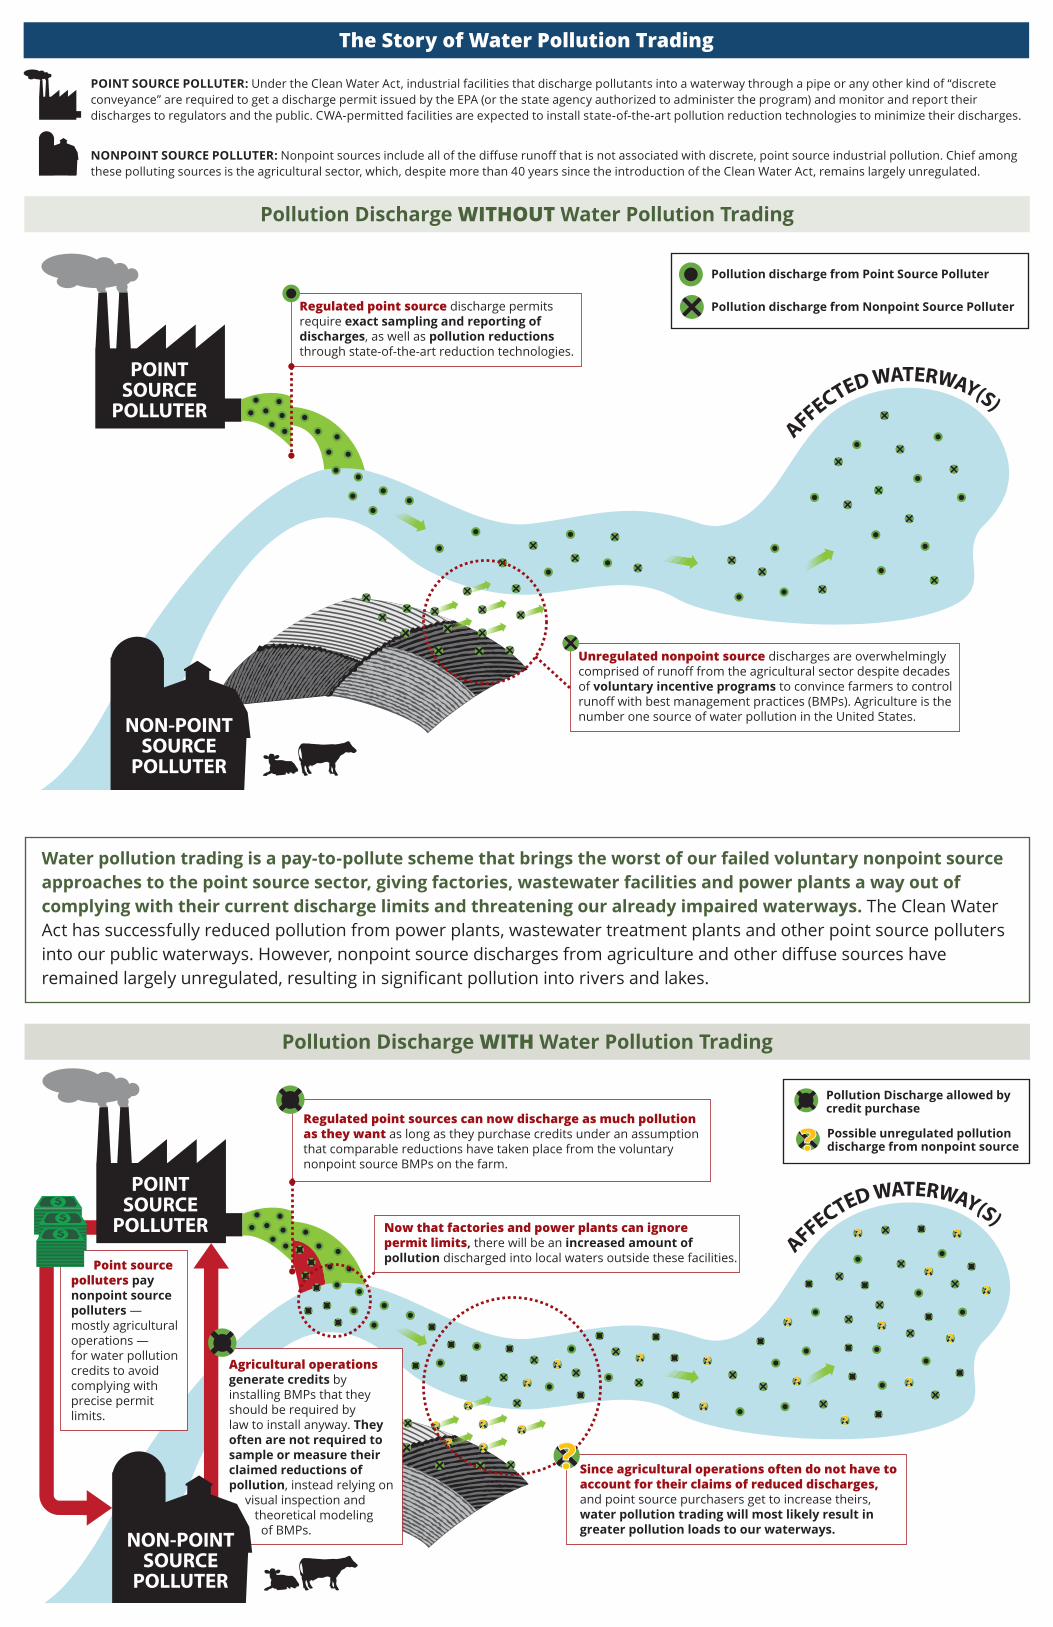
AFFECTED WATERWAY(S)POINT
SOURCEPOLLUTER
Point source polluters pay nonpoint source polluters — mostly agricultural operations — for water pollutioncredits to avoid complying with precise permit limits.
Agricultural operations generate credits
law to install anyway. They often are not required tosample or measure their claimed reductions of pollution, instead relying on visual inspection and theoretical modeling
NON-POINTSOURCE
POLLUTER
Regulated point sources can now discharge as much pollution as they want as long as they purchase credits under an assumption
Now that factories and power plants can ignore permit limits, increased amount of pollution discharged into local waters outside these facilities.
Since agricultural operations often do not have toaccount for their claims of reduced discharges, and point source purchasers get to increase theirs, water pollution trading will most likely result in greater pollution loads to our waterways.
Pollution Discharge WITH Water Pollution Trading
Pollution Discharge allowed by credit purchase
Possible unregulated pollution discharge from nonpoint source
Water pollution trading is a pay-to-pollute scheme that brings the worst of our failed voluntary nonpoint source approaches to the point source sector, giving factories, wastewater facilities and power plants a way out of complying with their current discharge limits and threatening our already impaired waterways. The Clean Water Act has successfully reduced pollution from power plants, wastewater treatment plants and other point source polluters
AFFECTED WATERWAY(S)POINT
SOURCEPOLLUTER
NON-POINTSOURCE
POLLUTER
Regulated point source discharge permitsrequire exact sampling and reporting ofdischarges, as well as pollution reductionsthrough state-of-the-art reduction technologies.
Unregulated nonpoint source discharges are overwhelmingly
of voluntary incentive programs to convince farmers to control
The Story of Water Pollution Trading
POINT SOURCE POLLUTER: conveyance” are required to get a discharge permit issued by the EPA (or the state agency authorized to administer the program) and monitor and report their discharges to regulators and the public. CWA-permitted facilities are expected to install state-of-the-art pollution reduction technologies to minimize their discharges.
Pollution Discharge WITHOUT Water Pollution Trading
NONPOINT SOURCE POLLUTER: these polluting sources is the agricultural sector, which, despite more than 40 years since the introduction of the Clean Water Act, remains largely unregulated.
Pollution discharge from Point Source Polluter
Pollution discharge from Nonpoint Source Polluter

16 Food & Water Watch • foodandwaterwatch.org
Alpine Cheese Company in OhioPennsylvania is not the only example of how water pollu-
tion trading is destroying the Clean Water Act and hand-
ing our waterways over to the highest pollution credit
bidders. Thanks to the Electric Power Research Institute
(EPRI), working on behalf of its power plant clients, a
broad, multi-state water pollution trading program is be-
ing implemented in the Ohio River Basin. States like Ohio
have followed Pennsylvania’s lead and have begun their
own state-based trading programs.
In 2005, planning of a water pollution trading pilot
program began when the Alpine Cheese Company of
Winesburg, Ohio — a point source polluter — wanted to
expand its operations.110 This expansion meant increased
amounts of wastewater discharge into local, impaired
waterways — primarily Middle Fork Sugar Creek and
other tributaries of Sugar Creek within the Tuscarawas
Watershed of the Ohio River Basin.111
Under a TMDL for Middle Fork Sugar Creek, Alpine
Cheese should have been allowed to discharge only 1.23
pounds per day of phosphorous, or 319 pounds each year,
via wastewater discharges of 1 milligram per liter (mg/l) of
phosphorous at a total wastewater volume of 0.02 million
gallons per day (MGD), or 5.2 million gallons per year.112
However, under its expansion and subsequent participation
in the trading program, Alpine Cheese was permitted to
increase its phosphorous discharge levels to 3.74 pounds of
phosphorous per day, or 972 pounds per year, via wastewa-
ter discharges of 3.2 mg/l at a total wastewater volume of
0.14 MGD, or 36.4 million gallons per year.113 This equates
to a 200 percent increase in pounds of phosphorous
released into waterways, or a 600 percent increase in
phosphorous-containing wastewater discharge over what
should have been allowed to protect local water quality.114
In order to comply with the TMDL limits, Alpine Cheese
was facing wastewater treatment upgrades at a projected
cost of about $1 million.115 Rather than pay for these
tried-and-true upgrades, however, the Alpine Cheese
Phosphorous Nutrient Trading Plan was created in 2005
as an alternative — a project estimated to cost about
$800,000.116 Unfortunately, the $200,000 in savings does
not reflect the continued costs to public waterways, such
as Sugar Creek, that remain impaired.
Car
togr
aphe
r: C
hris
toph
er B
ride,
ww
w.c
pbm
appi
ng.w
ordp
ress
.com
k Alpine Cheese
At-risk Streams
Ohio Counties
At-risk watershedsTuscarawas
Walhonding
Fig. 3 • OVERVIEW: Alpine Cheese Nutrient Trading Plan Area
k Alpine Cheese Company
At-Risk Streams
Ohio Counties
At-Risk Watersheds
Tuscarawas
Walhonding
0 50 10025 Miles
SOURCE:
CARTOGRAPHER: Christopher Bride •

Water Quality Trading: Polluting Public Waterways for Private Gain 17
The Alpine Cheese Phosphorous Nutrient Trading PlanFood & Water Watch requested documents related to
the Alpine Cheese trading program through Freedom of
Information Act requests (FOIAs) to the Ohio EPA. Based
on the documents received, the Alpine Cheese case looks
much less like the poster child that its proponents claim it
to be; instead it is a program that embraces extensive per-
mit noncompliance and violations, persistently impaired
waterways, lax monitoring and verification of BMPs, and
biosolids mismanagement, among other problems.
The Alpine Cheese trading program purportedly was
designed to result in reduced phosphorous discharges
into the Middle Fork Sugar Creek as well as the Indian
Trail and Walnut creeks and South Fork Sugar Creek
Headwaters. Instead of Alpine Cheese making phosphorus
reductions to meet Sugar Creek water quality require-
ments, the facility was given relaxed discharge standards
in a five-year NPDES permit, from 2007 to 2011.117 In
exchange for these relaxed standards, the facility paid 25
farms in the watershed to undertake some 90 BMPs in
order to make the needed nutrient discharge reductions.118
The trading program effectively allowed Alpine Cheese to
keep discharging pollution on-site, as well as to increase
discharges as part of its production expansion, rather than
complying with the appropriate NPDES permit limit. This
ultimately created an offsetting system to account for the
discharges that Alpine Cheese wanted to continue.
The initiative was a joint effort by the Alpine Cheese
Company, Ohio State University, Holmes County Soil
and Water Conservation District (SWCD) and the Ohio
Environmental Protection Agency.119 The SWCD was the
broker between the farms and farmers, and the Ohio
EPA.120 It also was responsible for verifying and monitor-
ing the BMPs to ensure that reductions were happening.121
The SWCD’s oversight role in the trading program was
necessitated, in part, because of political interference.
In 2005, U.S. Representative Bob Gibbs, then-Ohio
Representative of the 97th District, wrote a letter to the
Ohio EPA stating his objection to its intended level of
Walnut Cre
ek
South Fork Sugar C
ree
k
Middle Fo
rk Sugar Creek
Indian Trail Creek
Crabapple Creek
Corns Run
Alpine Cheese
Holmes Cheese
Strasburg WWTP
Fig. 4 • DETAIL: Alpine Cheese Nutrient Trading Plan Area
Alpine Cheese Company
Biosolids Companies
Farms Paid to Implement BMPs
At-Risk Streams
Biosolids transport
At-Risk Watersheds
Tuscarawas
Walhonding
Miles0 2.5 5 10
SOURCE (Figures 5 and 6):
CARTOGRAPHER: Christopher Bride •
18 Food & Water Watch • foodandwaterwatch.org
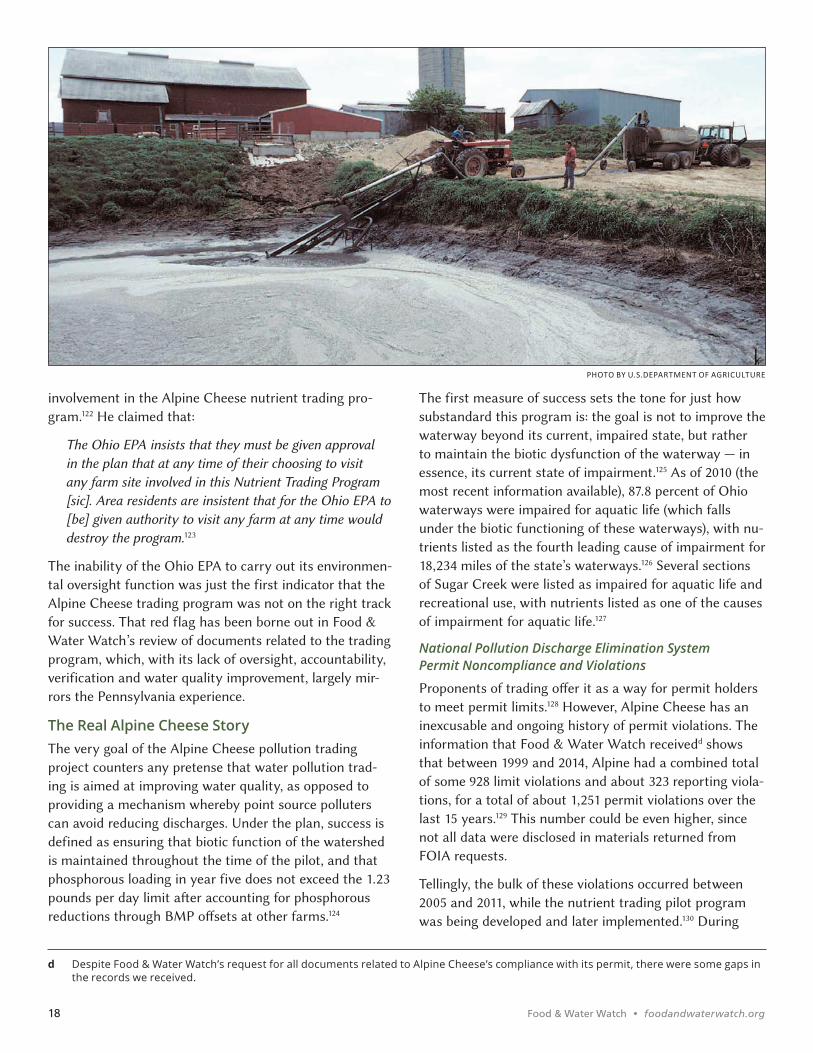
involvement in the Alpine Cheese nutrient trading pro-
gram.122 He claimed that:
The Ohio EPA insists that they must be given approval
in the plan that at any time of their choosing to visit
any farm site involved in this Nutrient Trading Program
[sic]. Area residents are insistent that for the Ohio EPA to
[be] given authority to visit any farm at any time would
destroy the program.123
The inability of the Ohio EPA to carry out its environmen-
tal oversight function was just the first indicator that the
Alpine Cheese trading program was not on the right track
for success. That red flag has been borne out in Food &
Water Watch’s review of documents related to the trading
program, which, with its lack of oversight, accountability,
verification and water quality improvement, largely mir-
rors the Pennsylvania experience.
The Real Alpine Cheese StoryThe very goal of the Alpine Cheese pollution trading
project counters any pretense that water pollution trad-
ing is aimed at improving water quality, as opposed to
providing a mechanism whereby point source polluters
can avoid reducing discharges. Under the plan, success is
defined as ensuring that biotic function of the watershed
is maintained throughout the time of the pilot, and that
phosphorous loading in year five does not exceed the 1.23
pounds per day limit after accounting for phosphorous
reductions through BMP offsets at other farms.124
The first measure of success sets the tone for just how
substandard this program is: the goal is not to improve the
waterway beyond its current, impaired state, but rather
to maintain the biotic dysfunction of the waterway — in
essence, its current state of impairment.125 As of 2010 (the
most recent information available), 87.8 percent of Ohio
waterways were impaired for aquatic life (which falls
under the biotic functioning of these waterways), with nu-
trients listed as the fourth leading cause of impairment for
18,234 miles of the state’s waterways.126 Several sections
of Sugar Creek were listed as impaired for aquatic life and
recreational use, with nutrients listed as one of the causes
of impairment for aquatic life.127
National Pollution Discharge Elimination System Permit Noncompliance and Violations
Proponents of trading offer it as a way for permit holders
to meet permit limits.128 However, Alpine Cheese has an
inexcusable and ongoing history of permit violations. The
information that Food & Water Watch receivedd shows
that between 1999 and 2014, Alpine had a combined total
of some 928 limit violations and about 323 reporting viola-
tions, for a total of about 1,251 permit violations over the
last 15 years.129 This number could be even higher, since
not all data were disclosed in materials returned from
FOIA requests.
Tellingly, the bulk of these violations occurred between
2005 and 2011, while the nutrient trading pilot program
was being developed and later implemented.130 During
d Despite Food & Water Watch’s request for all documents related to Alpine Cheese’s compliance with its permit, there were some gaps in the records we received.
PHOTO BY U.S.DEPARTMENT OF AGRICULTURE

Water Quality Trading: Polluting Public Waterways for Private Gain 19
this period, Alpine Cheese had about 712 limit violations
and about 49 reporting violations, for a total of some 761
permit violations over the course of the pilot program (see
Figure 5).131 Again, these numbers could be even higher be-
cause of a lack of complete records provided by the Ohio
EPA. It is also worth noting that these were not violations
of the protective standards that should have been in place
under the TMDL, but violations of relaxed standards left
in place because of the trading program offsets.
Some of these violations were especially egregious, and, in
some cases, Alpine Cheese exceeded permit discharge limits
by as much as 3,893 percent and 778 percent.132 A signifi-
cant number of the violations were in excess of 50 percent
of the required discharge limits.133 These violations were for
nutrients such as phosphorous, nitrogen, fecal coliform and
others, and were discharged into the Middle Fork Sugar
Creek via an unnamed tributary (see Figure 6).134
SOURCE:
Fig. 5 • Alpine Cheese: Number of Limit and Reporting Violations
250
200
150
100
50
01999 2000 2001 2002 2003 2004 2005 2006 2007 2008 2009 2010 2011 2012 2013 2014
Num
ber
of v
iola
tion
s
Pollution limit violations
Reporting violations
Records not provided
17
193
3831
63
30
5
2011
53
118
66
229
58
1
137
103
49
27
2
Num
ber
of v
iola
tion
s
1999 2000 2001 2002 2003 2004 2005 2006 2007 2008 2009 2010 2011 2012 2013 2014
150
120
90
60
30
0
Phosphorous limit violations
Nitrogen limit violations
Records not provided
1 210
20
4 5 8
36
23
136
43
11 14
115
5
81
311
2
Fig. 6 • Alpine Cheese: Number of Limit Violations by Pollutant
20 Food & Water Watch • foodandwaterwatch.org
Regarding the permit compliance status of Alpine
Cheese, between 2012 and 2015 alone (the most recent
reporting periods), the company was listed as being in
“Noncompliance” for 8 quarters out of a total of 12.135
In addition, between June 2010 and March 2015, Alpine
Cheese had instances of noncompliance with its permit
every year.136 Documents obtained from Food & Water
Watch’s FOIA requests also show a persistent trend of
violation and noncompliance between 1999 and 2009.137
Despite these ongoing examples of clear noncompliance,
the most recent NPDES permit for Alpine Cheese, issued
in May 2014, considers allowing Alpine to make changes
to its wastewater treatment plant by moving the final
outfall (discharge point of pollution) from the smaller
unnamed tributary of Sugar Creek directly to the main
stem of Middle Fork Sugar Creek.138 The corresponding
Antidegradation Report also discusses expanding the
Alpine wastewater treatment plant capacity and hence its
average daily flow (or discharge) volume into Sugar Creek
from 0.140 million gallons per day to 0.160 MGD, since
the main stem of Sugar Creek is a larger stream and can
accommodate higher waste load allocations.139
In short, despite being able to take full advantage of
upgrade avoidance by taking part in a nutrient trading
program, Alpine Cheese has been a chronic violator of its
discharge permit, with little to no accountability for the
past 15 years. And now, after years of consistent non-
compliance under cover of a trading program, the facility
is seeking to expand and discharge even more pollution.
Despite some trading proponents’ insistence that permit
violators should never be able to avail themselves of pol-
lution trading, permit violators like Alpine Cheese seek to
avoid compliance through credit purchasing.
Best Management Practices:
As stated, the Alpine Cheese trading program centers
around the company paying nearby farms to implement
BMPs to generate the credits it will use in place of making
on-site reductions in nutrient discharges (see Figure 4).
However, the verification, monitoring and transparency
surrounding these BMPs is woefully inadequate, bringing
into question the legitimacy of the entire program.
The phosphorous trading plan states that reports on the
project will be submitted semi-annually over the five-year
trading agreement by Holmes SWCD — the body respon-
sible for monitoring and verifying BMPs — to the Ohio
EPA.140 However, in all of the 1,898 pages of documents
that Food & Water Watch received via FOIA requests,
there were only two of these semi-annual reports, totaling
nine pages.141 Other information, which may have been
information on BMPs, was compiled on a compact disc
and could not be fully accessed, or made sense of — not
even by Ohio EPA personnel themselves — because of the
software used.142
The other documents received from Holmes SWCD
produced only some 29 pages of sparsely filled-out forms
to show for the SWCD’s monitoring and verification of
the over 90 BMPs.143 Many of these documents are barely
filled out, or are filled out by hand and are often illegible.
They are not even properly labeled in many cases, making
it difficult to draw any kind of accurate conclusion about
the number of credits generated.144 Some forms consist of
checking boxes and marking “yes” or “no.”145 This manner
and scarcity of verification reports calls into question
whether the verification methods are even accurate.
The lack of oversight becomes even more concerning since
the BMP sites are in close proximity to Alpine Cheese,
and, with very questionable monitoring and verification,
the legitimacy of net reductions in nutrient discharges is
highly suspect.146 If it cannot be said for certain that BMPs
are reducing nutrient discharges while Alpine Cheese con-
tinues to discharge pollutants above its permit limit, there
is an incredible risk of no reductions in nutrient discharges
and even net increases in nutrient discharges.
As stated earlier, point source pollution loads to our wa-
terways under the Clean Water Act are subject to moni-
tored and easily verified data. With Alpine Cheese and
water pollution trading, we are now allowing a chronic
CWA permit violator to swap out these verifiable and
measurable discharges for unverifiable and unmeasured
credits. Once again, water pollution trading represents a
complete erosion of the CWA and its accountability core.
Biosolids (Mis)Management
Keeping in mind that the purported goal of water pol-
lution trading is a net decrease of nutrient pollution to
waterways, another disturbing component of Alpine
Cheese’s trading scheme concerns the company’s sludge
management. Under its NPDES permit, Alpine Cheese
is required to properly manage its sludge byproduct, or
biosolids.147 These nutrient-rich biosolids are produced
from the company’s production processes, most of which
come from the cheese-making facility.148
According to Alpine’s “Biosolids Management Plan,” the
company produces 2,000 gallons per day of biosolids,
with 260 days of production per year, or 520,000 gallons
Water Quality Trading: Polluting Public Waterways for Private Gain 21
per year.149 The biosolids are treated and held on-site
before being transferred off-site to Holmes Cheese Co.,150
Bull Country Compost (BCC), Agri-Sludge Inc. or the
Strasburg wastewater treatment plant for land application
(see Figure 4).151 The portion of biosolids waste that is used
for land application is applied on nearby fields in either
liquid or solid form, and some receiving sites, like Holmes
Cheese Company, are only about 18 miles away from
Alpine Cheese (and Sugar Creek).152
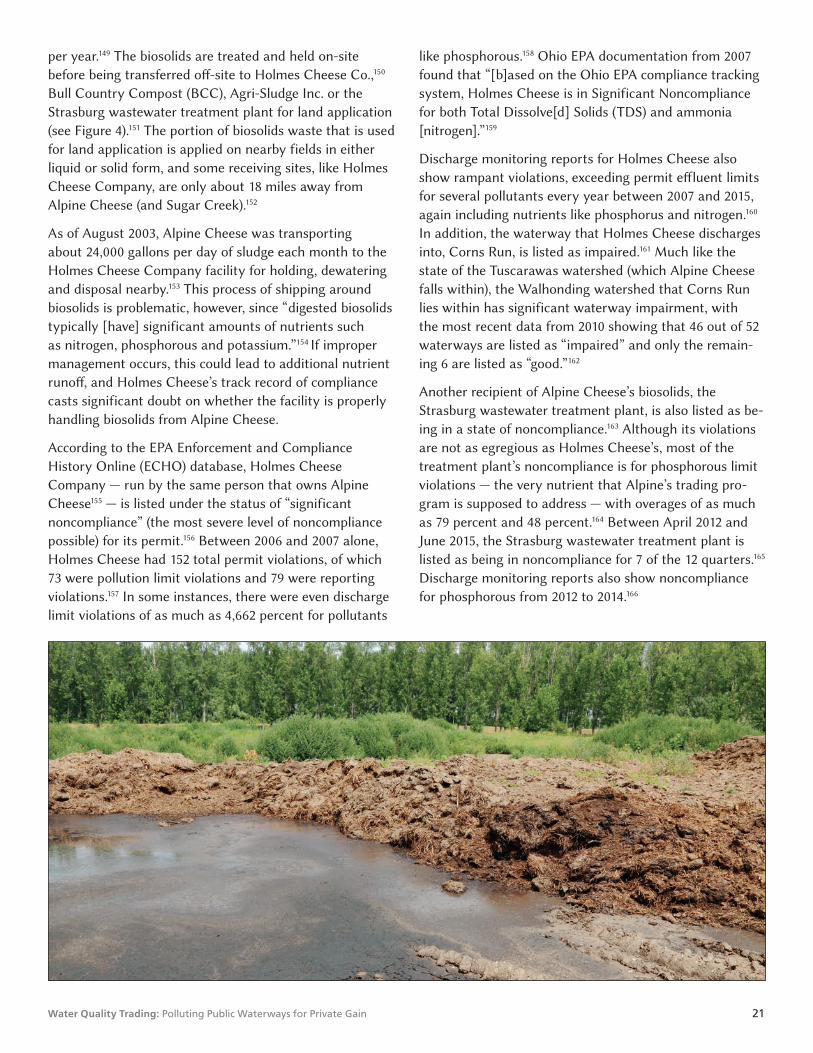
As of August 2003, Alpine Cheese was transporting
about 24,000 gallons per day of sludge each month to the
Holmes Cheese Company facility for holding, dewatering
and disposal nearby.153 This process of shipping around
biosolids is problematic, however, since “digested biosolids
typically [have] significant amounts of nutrients such
as nitrogen, phosphorous and potassium.”154 If improper
management occurs, this could lead to additional nutrient
runoff, and Holmes Cheese’s track record of compliance
casts significant doubt on whether the facility is properly
handling biosolids from Alpine Cheese.
According to the EPA Enforcement and Compliance
History Online (ECHO) database, Holmes Cheese
Company — run by the same person that owns Alpine
Cheese155 — is listed under the status of “significant
noncompliance” (the most severe level of noncompliance
possible) for its permit.156 Between 2006 and 2007 alone,
Holmes Cheese had 152 total permit violations, of which
73 were pollution limit violations and 79 were reporting
violations.157 In some instances, there were even discharge
limit violations of as much as 4,662 percent for pollutants
like phosphorous.158 Ohio EPA documentation from 2007
found that “[b]ased on the Ohio EPA compliance tracking
system, Holmes Cheese is in Significant Noncompliance
for both Total Dissolve[d] Solids (TDS) and ammonia
[nitrogen].”159
Discharge monitoring reports for Holmes Cheese also
show rampant violations, exceeding permit effluent limits
for several pollutants every year between 2007 and 2015,
again including nutrients like phosphorus and nitrogen.160
In addition, the waterway that Holmes Cheese discharges
into, Corns Run, is listed as impaired.161 Much like the
state of the Tuscarawas watershed (which Alpine Cheese
falls within), the Walhonding watershed that Corns Run
lies within has significant waterway impairment, with
the most recent data from 2010 showing that 46 out of 52
waterways are listed as “impaired” and only the remain-
ing 6 are listed as “good.”162
Another recipient of Alpine Cheese’s biosolids, the
Strasburg wastewater treatment plant, is also listed as be-
ing in a state of noncompliance.163 Although its violations
are not as egregious as Holmes Cheese’s, most of the
treatment plant’s noncompliance is for phosphorous limit
violations — the very nutrient that Alpine’s trading pro-
gram is supposed to address — with overages of as much
as 79 percent and 48 percent.164 Between April 2012 and
June 2015, the Strasburg wastewater treatment plant is
listed as being in noncompliance for 7 of the 12 quarters.165
Discharge monitoring reports also show noncompliance
for phosphorous from 2012 to 2014.166
22 Food & Water Watch • foodandwaterwatch.org
The trend of biosolids mismanagement only raises further
concerns that nutrient loads to public waterways are not
being reduced, despite misleading claims to the contrary.
Alpine Cheese’s extensive pollution shifting scheme
allows the company to ignore protective nutrient permit
limits by purchasing credits from farms that allegedly are
implementing nutrient reduction BMPs, and then ship-
ping a portion of its own nutrient-laden biosolids waste
off to other farms and facilities to be applied to land and
potentially pollute waterways — all the while violating
even the relaxed standards contained in the company’s
own discharge permit.
In the face of the information gleaned from the FOIA
documents, claims that the Alpine Cheese trading
program is a success appear unfounded. In addition to
serving as a case study of how pollution trading is a false
solution, Alpine Cheese serves as an example of how
offsets continue to fail as a policy.
Bioassessment Inconsistencies and Subjective Congressional Testimony
Proponents of the Alpine Cheese trading program also
have depended on a bioassessment report as proof that
the trading program is working to clean up the Middle
Fork Sugar Creek waterway.167 This report was carried out
by the Center for Applied Bioassessment & Biocriteria
(CABB) at the Midwest Biodiversity Institute, and it also
is relied upon in Congressional testimony supporting the
trading program. 168
However, the bioassessment was completed in 2010, and
data from the U.S. EPA on the years leading up to and
including 2010 conflict with the findings of the report.169
The CABB report claims that the Middle Fork Sugar
Creek waterway achieved full attainment status, but EPA
data show that the same waterway, as well as surround-
ing waterways and the overall watershed, are still listed
as impaired during the same time period, bringing into
question the reliability of this assessment.170 The bioas-
sessment also relies on the claim that water quality im-
proved because the presence of pollution-tolerant species
improved; however, within the same findings it shows that
the presence of pollution-intolerant species declined.171
Moreover, the monitoring and analysis necessary to deter-
mine reductions in phosphorous loading, and subsequent
improvements in water quality, must be carried out over
at least 10, if not 40, years at several sampling locations.172
The bioassessment for Alpine Cheese was conducted in
2010 — only three years after the NPDES permit allowing
the trading program began. Any assessment of water
quality that claims results after only three years, like the
bioassessment for Alpine, is wholly unfounded.
Despite the fact the Sugar Creek bioassessment was
conducted only three years into the trading project, and at
a time when Alpine Cheese was in regular violation of its
discharge permit, in 2014 Richard Moore testified in front
of Congress that the Alpine trading program was a suc-
cess. Moore is the executive director of the Environmental
Sciences Network at Ohio State University, whose group
at the Ohio Agricultural Research and Development
Center (OARDC) helped to develop the Alpine Cheese
trading program.173 The OSU team also received payment
from Alpine Cheese under the trading program.174
In the testimony, Moore claims his group “acted as an
impartial body to monitor the streams in the area to
determine changes” and “achieved our five-year reduction
goal (5,500 lbs. of phosphorous) in three years, and by
year five the actual amount of phosphorous remediated
was 7,133 lbs.”175 Based on monitoring requirements for
detecting decreases in phosphorous loading and improve-
ments in water quality, not enough time has passed nor
enough information collected to make these claims.
Pollution Laundering and Reduction EvasionThe basis of the Alpine Cheese trading program — pay-
ing nearby farms to reduce their pollution discharges via
BMPs and generating credits that Alpine can apply to-
ward its NPDES permit limits — is nothing more than an
offset scheme. But here, there is no attempt to meet even
the minimal offset requirements that even proponents of
market-based pollution control claim are necessary.
In this case, the credits generated by the BMPs are the
offsets. The entire design of the program is not to im-
prove waterways beyond their state prior to the trading
program, but to maintain the impaired status quo. It is
dangerously inaccurate to say that the Alpine program is
a model to improve water quality, when it is nothing more
than a way to evade compliance with protective permit
standards through BMP offsets.
The Alpine Cheese program does not even meet neces-
sary offset standards. On the issue of “additionality” —
the requirement that any reduction in pollutant loadings
that generate credits would not have occurred but for
the trading program — there is no apparent baseline to
determine whether the farm pollution reductions from
the BMPs were actually additional and would not have
happened but for the Alpine Cheese project. On the
issue of “permanence,” the program fails outright, as the
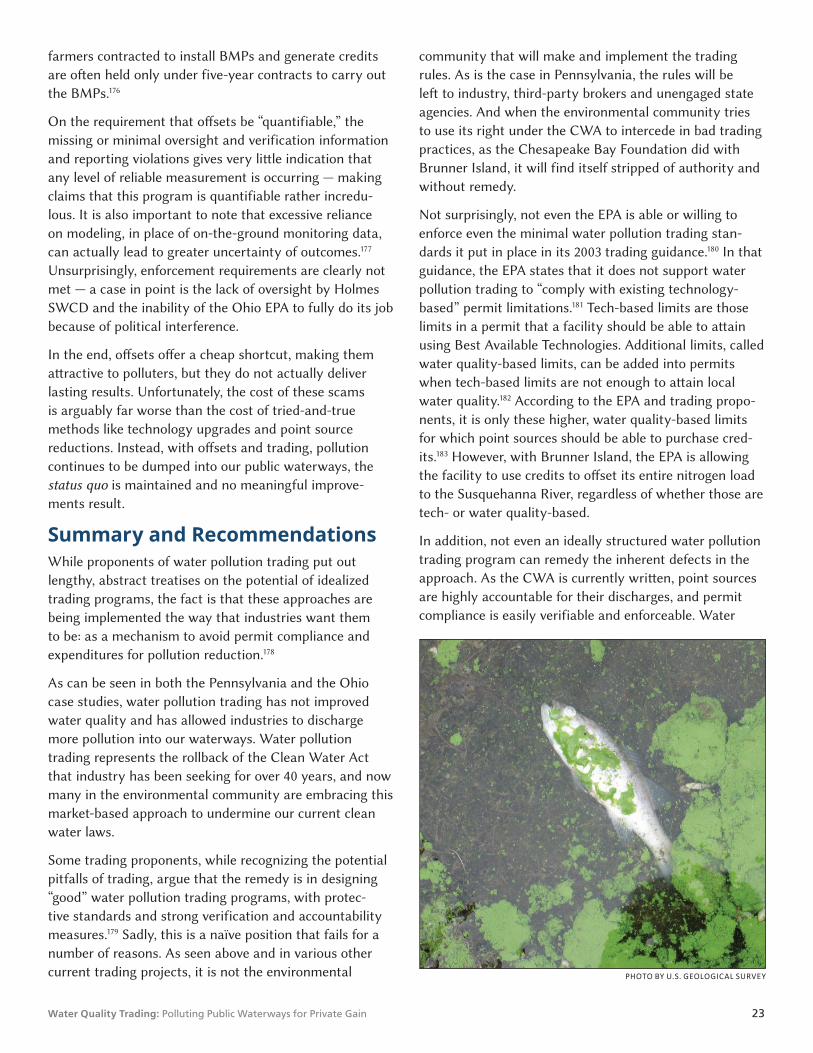
Water Quality Trading: Polluting Public Waterways for Private Gain 23
farmers contracted to install BMPs and generate credits
are often held only under five-year contracts to carry out
the BMPs.176
On the requirement that offsets be “quantifiable,” the
missing or minimal oversight and verification information
and reporting violations gives very little indication that
any level of reliable measurement is occurring — making
claims that this program is quantifiable rather incredu-
lous. It is also important to note that excessive reliance
on modeling, in place of on-the-ground monitoring data,
can actually lead to greater uncertainty of outcomes.177
Unsurprisingly, enforcement requirements are clearly not
met — a case in point is the lack of oversight by Holmes
SWCD and the inability of the Ohio EPA to fully do its job
because of political interference.
In the end, offsets offer a cheap shortcut, making them
attractive to polluters, but they do not actually deliver
lasting results. Unfortunately, the cost of these scams
is arguably far worse than the cost of tried-and-true
methods like technology upgrades and point source
reductions. Instead, with offsets and trading, pollution
continues to be dumped into our public waterways, the
status quo is maintained and no meaningful improve-
ments result.
Summary and RecommendationsWhile proponents of water pollution trading put out
lengthy, abstract treatises on the potential of idealized
trading programs, the fact is that these approaches are
being implemented the way that industries want them
to be: as a mechanism to avoid permit compliance and
expenditures for pollution reduction.178
As can be seen in both the Pennsylvania and the Ohio
case studies, water pollution trading has not improved
water quality and has allowed industries to discharge
more pollution into our waterways. Water pollution
trading represents the rollback of the Clean Water Act
that industry has been seeking for over 40 years, and now
many in the environmental community are embracing this
market-based approach to undermine our current clean
water laws.
Some trading proponents, while recognizing the potential
pitfalls of trading, argue that the remedy is in designing
“good” water pollution trading programs, with protec-
tive standards and strong verification and accountability
measures.179 Sadly, this is a naïve position that fails for a
number of reasons. As seen above and in various other
current trading projects, it is not the environmental
community that will make and implement the trading
rules. As is the case in Pennsylvania, the rules will be
left to industry, third-party brokers and unengaged state
agencies. And when the environmental community tries
to use its right under the CWA to intercede in bad trading
practices, as the Chesapeake Bay Foundation did with
Brunner Island, it will find itself stripped of authority and
without remedy.
Not surprisingly, not even the EPA is able or willing to
enforce even the minimal water pollution trading stan-
dards it put in place in its 2003 trading guidance.180 In that
guidance, the EPA states that it does not support water
pollution trading to “comply with existing technology-
based” permit limitations.181 Tech-based limits are those
limits in a permit that a facility should be able to attain
using Best Available Technologies. Additional limits, called
water quality-based limits, can be added into permits
when tech-based limits are not enough to attain local
water quality.182 According to the EPA and trading propo-
nents, it is only these higher, water quality-based limits
for which point sources should be able to purchase cred-
its.183 However, with Brunner Island, the EPA is allowing
the facility to use credits to offset its entire nitrogen load
to the Susquehanna River, regardless of whether those are
tech- or water quality-based.
In addition, not even an ideally structured water pollution
trading program can remedy the inherent defects in the
approach. As the CWA is currently written, point sources
are highly accountable for their discharges, and permit
compliance is easily verifiable and enforceable. Water
PHOTO BY U.S. GEOLOGICAL SURVEY

24 Food & Water Watch • foodandwaterwatch.org
pollution trading allows this transparent, accountable
system to be replaced with one that makes it virtually
impossible for anyone to ever properly track point source
compliance; credits that these facilities rely on are not the
product of any measured decrease in pollutant loads from
credit-generating agricultural sources, but from complex
models filled with variables and from questionable ma-
nure transport programs that simply move pollutants
from one impaired waterway to another.
Trading adherents also ignore that the CWA does not
allow for water pollution trading as a mechanism for point
sources to avoid permit compliance. The Act’s permitting
provisions are very clear that each point source of pollution
must meet individual permit requirements; there are no
allowances in the Act to purchase credits in lieu of compli-
ance. While the Clean Air Act specifically allows for some
degree of air emissions trading, efforts to amend the CWA
to allow for trading have never passed, nor should they.
Pollution trading will not improve our waterways or pro-
tect our communities. It will not stop giant algae blooms
or keep another Toledo disaster from occurring.
People who care about water quality should never support
water pollution trading. Instead, we should be taking steps
to strengthen the Clean Water Act, learning from its past
successes and remedying its past failures. Some of the
things that need to happen are:
• Congress needs to reaffirm that the Clean Water
Act does not allow for point source pollution
trading. It must defeat attempts to amend the Act
to include a trading program and prohibit states
from spending any funds on implementing trading
programs. This groundbreaking statute was enacted in
1972 in order to turn our waterways around. It moved
us from a watershed-based, ambient water quality
approach to one of individual accountability through
a point source permitting program. Water pollution
trading is antithetical to that approach.
• Federal agencies, particularly the U. S. Depart-
ment of Agriculture, need to stop spending
taxpayers’ dollars to promote these pay-to-
pollute schemes across the country. The USDA,
and to a lesser extent the EPA, are actively funding
market-based approaches to water quality control,
giving out millions of dollars to nonprofits, industry
groups and researchers to set up pilot programs and
implement pollution trading. Public funds should not
be used to undermine our public trust waterways.
• State and federal governments need to replace
voluntary pollution control approaches with
mandatory measures in the nonpoint source
sector. The CWA point source control program
has been successful because of accountability and
permitting. Regulators have failed to control our
largest source of pollution, agriculture, because of
our continued reliance on voluntary pollution control
measures in that sector. The answer is not to move
our failed approaches to the point source industries
with water pollution trading, but to employ our
successful point source strategies – monitoring,
permitting and enforcement – in the agricultural
industry.
• Federal agencies must fund agricultural Best
Management Practices without compromising
current point source controls. People rightfully
concerned about uncontrolled industrial agriculture
pollution see trading as a way to incentivize the
adoption of BMPs on farms. But, as this report
shows, using trading as an incentive undermines our
successful point source control of other industries
by allowing permit violators to buy their way into
polluting more than they should. A better approach
would be to diligently enforce the Clean Water Act
against point source polluters who do not comply with
their permits, and use the money from those enforce-
ment actions to fund effective farm BMPs.
• The environmental community needs to wake up
to the dangers of water pollution trading. These
programs are being implemented across the county
while the environmental community either ignores
it or actively supports it. If you are a member of an
environmental organization, contact the staff and ask
them why it is not fighting against this irresponsible
approach to water quality. If you work for an environ-
mental organization, get involved and take a stand
against these failing market-based schemes.
• Advocacy groups need to legally challenge water
pollution trading programs. Any legal advocate
who relies on the CWA to keep waterways clean and
communities safe should be very concerned about
what water pollution trading is doing to citizens’
ability to enforce the law against polluters. With such
trading, we are rapidly moving away from the ability
to hold point sources accountable for permit violations
because permits have no real limits and, even when
they do, it will be impossible to track the credits used
to exceed those limits.
Water Quality Trading: Polluting Public Waterways for Private Gain 25
1 Fitzsimmons, Emma G. “Tap water ban for Toledo residents.” . August 3, 2014.
2 See, for example, Electric Power Research Institute (EPRI). “Ohio River Basin Trading Project: Nutrient Reduction at Lower Cost.” Accessed September 3, 2015 at http://wqt.epri.com/overview.
Water. “Water Quality Trading.” June 5, 2014. Accessed at http://water.epa.gov/type/watersheds/trading.cfm.
3 U.S. EPA. June 5, 2014.
Economist. “Water Quality Trading Programs.” Accessed August 31, 2015 at http://www.usda.gov/oce/environmental_mar-
“Chesapeake Bay Regional Water Quality Trading Program.” Accessed September 15, 2015 at http://www.usda.gov/oce/en-vironmental_markets/chesapeake.htm; EPRI. Ohio River Basin Trading Project. “Overview.” Accessed September 15, 2015 at http://wqt.epri.com/overview.html.
5 USDA. “Water Quality Trading Programs.”; Cobb, Shaka L. “City seeks grant approval for water quality project.” (GA). September 23, 2015; Willamette Partnership, World Resources Institute and National Network on Water Quality Trading (NNWQT). “Building a Water Quality Trading Program: Options and Considerations.” Version 1. June 2015 at 7 to 8.
Quality Trading Projects.” November 22, 2013. Accessed at http://water.epa.gov/type/watersheds/trading/twg_index.cfm; USDA. Natural Resources Conservation Service. “Conservation Innovation grants – Water Quality Credit Trading Awardees, FY 2012.” Accessed August 31, 2015 at http://www.nrcs.usda.
cig/?cid=stelprdb1048722.7 See Chesapeake Bay Foundation. “Nutrient Trading 101.”
Accessed at http://www.cbf.org/about-the-bay/the-issues/nu-trient-trading. See, for example, EPRI. “Ohio River Basin Trading Project: Nutrient Reduction at Lower Cost.”
8 See Willamette Partnership, World Resources Institute and NNWQT, 2015.
9 . 10 .11 . at 178.12 U.S. EPA. June 5, 2014. 13 Latson, Jennifer. “The burning river that sparked a revolution.”
. June 22, 2015. 14 Adler, Jonathan H. “The fable of the burning river, 45 years
later.” Washington Post. June 22, 2014. 15 Jeanneret, Doug. Ohio State University (OSU). Ohio Sea Grant
College Program. “Lake Erie water quality: Past, present and future.” Fact Sheet 046. 1989 at 1.
16 Dr. Seuss. Lorax. August 12, 1971. 17 See 33 U.S.C. § 1251 et seq. (1948).18 See 33 U.S.C. § 1251 et seq. (1965). 19 U.S. EPA. “Our mission and what we do.” Accessed
August 31, 2015 at http://www2.epa.gov/aboutepa/our-mission-and-what-we-do.
20 33 U.S.C. § 1251 et seq. (2002). 101(a). 21 33 U.S.C. § 1251 et seq. (2002). 101(a)1.22 33 U.S.C. § 1251 et seq. (2002). 402.23 33 U.S.C. § 1251 et seq. (2002). 402.24 33 U.S.C. § 1251 et seq. (2002). 301.
25 33 U.S.C. § 1251 et seq. (2002). 301(b)2(A)(i).26 33 U.S.C. § 1251 et seq. (2002). 301(d).27 33 U.S.C. § 1251 et seq. (2002). 505.28 33 U.S.C. § 1251 et seq. (2002). 505.29 See
“Clean Water Act: Changes needed if key EPA program is to help
2013.30 Husar, John. “Here’s proof Lake Erie’s alive and well.” Chicago
. August 18, 1985. -
mation: Assessed waters of the United States.” Accessed September 3, 2015 at http://ofmpub.epa.gov/waters10/attains_nation_cy.control.
32 .
of Water. “Nonpoint source pollution.” Accessed September 1, 2015 at http://www.epa.gov/region9/water/nonpoint/.
34 See, for example, EPRI. “Ohio River Basin Trading Project: Nutrient Reduction at Lower Cost”; U.S. EPA. National Center for Environmental Economics. “Economic Incentives.” September 1, 2015. Accessed at http://yosemite.epa.gov/EE%5Cepa%5Ceed.nsf/webpages/EconomicIncentives.html.
35 Connecticut Department of Energy and Environmental Protection. Bureau of Water Protection and Land Reuse. “Connecticut’s Nitrogen Credit Exchange — An Incentive-based Water Quality Trading Program.” March 2010.
36 9 VAC 25-820; USDA. “Water Quality Trading Programs.” 37 USDA. “Water Quality Trading Programs.”38 33 U.S.C. § 1251 et seq. (2002). 303(d).39 Chesapeake Bay Program. “Reducing Nitrogen Pollution:
Nitrogen Loads to the Bay by Source.” March 31, 2015. Accessed at http://www.chesapeakebay.net/indicators/indicator/reduc-ing_nitrogen_pollution; Chesapeake Bay Program. “Reducing Phosphorous Pollution: Phosphorous Loads to the Bay by Source.” March 31, 2015. Accessed at http://www.chesapeake-bay.net/indicators/indicator/reducing_phosphorus_pollution.
40 33 U.S.C. § 1251 et seq. (2002). 303(d).41 U.S. EPA. Region 3. “Chesapeake Bay Total Maximum Daily Load
for Nitrogen, Phosphorous and Sediment.” December 29, 2010.42 . 43 . at ES-1.44 . at 4-1 et seq.45 Chesapeake Bay Program. “Reducing Nitrogen Pollution:
Nitrogen Loads to the Bay by Source”; Chesapeake Bay Program. “Reducing Phosphorous Pollution: Phosphorous Loads to the Bay by Source.”
46 USDA. Farm Service Agency. “Conservation programs.” Accessed September 3, 2015 at http://www.fsa.usda.gov/programs-and-services/conservation-programs/index.
47 .; University of Maryland. Integration and Application Network, Center for Environmental Science. “Chesapeake Bay Report Card 2013.” May 2014.
48 See, for example, GAO. 2013. 49 U.S. EPA. Region 3. “Chesapeake Bay Total Maximum Daily
Load for Nitrogen, Phosphorous and Sediment: Appendix S
and sediment to the Chesapeake Bay watershed.” December 29, 2010.
Endnotes
26 Food & Water Watch • foodandwaterwatch.org
50 Pennsylvania Department of Environmental Protection (DEP). “2014 Nitrogen Generators.” Updated November 30,
Updated November 30, 2014.51 EPRI. “Ohio River Basin Water Quality Trading Project.” March
2014.
[Memorandum]. “National Pollutant Discharge Elimination (NPDES) Permitting of Wastewater Discharges from Flue Gas Desulfurization (FGD) systems and coal combustion residual (CCR) impoundments at Steam Electric Power Plants.” June 7, 2010.
53 Pennsylvania Department of Conservation and Natural Resources. “Appendix 5I: NE Multi-State Area: Ohio River Basin.” October 16, 2009 at 5I-6.
54 . at 5I-7.55 See, for example, EPRI. “Ohio River Basin Trading Project:
Nutrient Reduction at Lower Cost.” 56 USDA. Natural Resources Conservation Service, Indiana. [Press
release]. “USDA awards conservation innovation grant to Electric Power Research Institute.” August 9, 2012; EPRI. March 2014.
57 EPRI. “Case Studies of Water Quality Trading Being Used for Compliance with National Pollutant Discharge Elimination System Permit Limits.” December 2013.
58 OSU, Holmes Soil and Water Conservation District (SWCD) and Alpine Cheese Company. “A Plan to Reduce Phosphorous Loading and Improve Stream Ecological Function in the Middle Fork and Adjoining Watersheds of the Sugar Creek Watershed: Joint Recommendations for the Alpine Cheese Phosphorus Nutrient Trading Plan.” January 1, 2006 at 22; Moore, Richard H. Executive Director, Environmental Sciences Network, OSU. Testimony before The Water Resources and Environment Subcommittee of the Committee on Transportation and Infrastructure. U.S. House of Representatives. March 25, 2014.
59 Willamette Partnership, World Resources Institute and NNWQT. 2015 at 33 to 48.
60 . at 33 to 48.61 33 U.S.C. § 1251 et seq. (2002). 301(b)2(A)(i).
January 13, 2003.63 Pennsylvania DEP. “2013 Nutrient Buyers Summary.” Updated
November 30, 2014.
as a natural resource. Can pollution trading save the bay?” . October 5, 2011.
65 .66 Pennsylvania code §96.8(c)-(f).67 Pennsylvania DEP. Nutrient Credit Registry. “2014 Nitrogen
Generators.” At 1.68 See, for example, Red Barn Trading Company. “Nutrient Credit
Trading Proposal. Prepared for Client 0535, Lancaster County, Pennsylvania, Watershed Segment 710, Susquehanna River watershed.” Provided under Pennsylvania Right to Know Law by the Pennsylvania Department of Environmental Protection. September 23, 2008.
69 SeeNutrient Credit Generation. Prepared for Client 0535, Lancaster County, Pennsylvania, Watershed Segment 710, Susquehanna River watershed.” August 23, 2011.
70 See, for example, Roda, Ann. Pennsylvania DEP. Letter to Paul
Watch.
71 Environmental Crime Programme. “Guide to carbon trading crime.” INTERPOL. June, 2013, at 7 and 11 to 24.
72 Kotrba, Ron. “Hearing on EPA handling of biodiesel RIN fraud to occur this week.” Biodiesel Magazine. July 9, 2012.
Proposals” November 14, 2014; Davis, Michael A. et al. “Poultry manure as fertilizer.” IFAS Extension, University of Florida. Document ID PS1. March 1992 at 1.
74 Schmitt, Michael and George Rehm. “Fertilizing cropland with poultry manure.” Minnesota Extension Service, University of Minnesota. Document ID AG-FO-5881-C. 1992 at 5.
75 Food & Water Watch analysis of Pennsylvania DEP. “List of
76 .77 .78 .79 Pennsylvania DEP. “Phase 2 Watershed Implementation Plan
Nutrient Trading Supplement.” Revised June 18, 2015. At 2.80 Pennsylvania DEP. Response to PA RTK J&L Hay 4500-15-048.
81 .82 .83 See, for example, Red Barn Trading Company. August 23, 2011.84 Capacasa, Jon M. Director, Water Protection Division, EPA
Region III. Letter to Cathy Curran Myers, Pennsylvania DEP.
Generation. Prepared for Client 0535, Lancaster County, Pennsylvania, Watershed Segment 710, Susquehanna River watershed.” September 1, 2010, at 11 to 12.
86 Schwartz, Ronald A. Assistant Regional Director, Southwest
87 Food & Water Watch interview with Veronica Kasi, Division of Technical and Financial Assistance, Pennsylvania DEP. August 14, 2015.
88 Food & Water Watch analysis of Pennsylvania DEP. “List of
89 33 U.S.C. § 1251 et seq (1972) 101(a)(1).
November 2015 at http://www2.epa.gov/eg/
91 .92 Food & Water Watch analysis of Pennsylvania DEP. “2014
Nitrogen Generators.” November 30, 2014.93 Red Barn Trading Company. “Nitrogen Credit Calculation Form,
A. Dale Herr.” August 3, 2011.94 .95 EnergyWorks. [Press release]. “Scranton Sewer Authority and
Gettysburg Energy & Nutrient Recovery Facility announce nutrient credit relationship.” August 28, 2014.
96 .97 Talen Energy. “Brunner Island Power Plant.” Accessed June
2015 at https://www.talenenergy.com/generation/fossil-fuels/brunner-island.
98 Environmental Integrity Project. “Dirty kilowatts: America’s most polluting power plants.” July 2007 at 12 to 13.
99 Adkins, Sean. “Brunner Island listed among the nation’s most carbon polluting plants.” (York, PA). September 10, 2013.
100 U.S. Energy Information Administration. “Electric Power Annual.” March 23, 2015. At Table 4.1.

Water Quality Trading: Polluting Public Waterways for Private Gain 27
Chart for PPL Brunner Island Steam Electric Station, NPDES permit PA0008281. Accessed June 2015 at http://echo.epa.gov/
102 Pennsylvania DEP. “The Clean Streams Law and the Federal Clean Water Act. Applications for National Pollution Discharge Elimination System (NPDES) Permits and Water Quality Management (WQM) Permits.” , 38 Pa.B. 4534. August 16, 2008.
103 Pennsylvania DEP. “2013 Credit buyers summary (PDF).” November 30, 2013. At 1; Pennsylvania DEP. “2014 Credit buyers summary (PDF).” November 30, 2014. At 1.
104 Food & Water Watch analysis of Pennsylvania DEP. “2013 Credit buyers summary (PDF).” November 30, 2013; Pennsylvania DEP. “2014 Credit buyers summary (PDF).” November 30, 2014.
105 USDA. Natural Resources Conservation Service. “Conservation Innovation Grants – Water Quality Credit Trading Awardees: Fiscal 2012.” At 1.
106 Smail, Paul A. and Jon A. Mueller. Counsel, Chesapeake Bay Foundation. Letter to DeCampli, David G., President, PPL Brunner Island LLC, and to Aunkst, Dana, Acting Secretary, PA
107 33 U.S.C. § 1251 et seq. (2002). 505.108 Smail and Mueller. 2014 at 8 to 9. 109 . at 9. 110 Ohio Department of Natural Resources (DNR). Division of
Soil and Water Conservation. “Soil & Water Conservation Partnership Annual Report.” Supplement to Ohio Farmer. 2006 at 2; Moore. March 25, 2014 at 3.
111 Ohio DNR. 2006 at 2; Moore. 2014 at 3; OSU, Holmes SWCD and Alpine Cheese Company. 2006 at 3.
112 Food & Water Watch analysis of OSU, Holmes SWCD and Alpine Cheese Company. 2006 at 6; ATS Engineering. “Alpine Cheese Company Biosolids Management Plan.” May 16, 2007 at 1 to 2.
113 Food & Water Watch analysis of OSU, Holmes SWCD and Alpine Cheese Company. 2006 at 6; ATS Engineering. 2007 at 1 to 2.
114 Food & Water Watch analysis of OSU, Holmes SWCD and Alpine Cheese Company. 2006 at 6; ATS Engineering. 2007 at 1 to 2.
115 Mississippi River Gulf of Mexico Watershed Nutrient Task Force.
Forward on Gulf Hypoxia: Annual Report.” 2010 at 18.116 . at 18 to 19. 117 OSU, Holmes SWCD and Alpine Cheese Company. 2006 at 3.118 . at 10; OSU. School of Environment and Natural Resources.
“Community-based Water Quality Trading.” May 2013 at 1. 119 Mississippi River Gulf of Mexico Watershed Nutrient Task Force.
2010 at 18. 120 Moore. 2014 at 5 to 6.121 OSU, Holmes SWCD and Alpine Cheese Company. 2006 at 16.122 Gibbs, Bob. Ohio State Representative, 97th House District.
Letter to Joe Kincelik. Director, Ohio Environmental Protection
123 . 124 OSU, Holmes SWCD and Alpine Cheese Company. 2006 at 17.
Assessed Waters of Ohio by Watershed.” 2004. Accessed at http://iaspub.epa.gov/tmdl_waters10/attains_state.control?p_state=OH&p_cycle=2010&p_report_type=A.
& Environmental Results: Ohio Assessment Data for 2010.” Accessed at http://iaspub.epa.gov/tmdl_waters10/attains_state.control?p_state=OH&p_cycle=2010&p_report_type=A.
Assessed Waters of Ohio by Watershed.” 2010. Accessed at http://iaspub.epa.gov/tmdl_waters10/attains_state.control?p_state=OH&p_cycle=2010&p_report_type=A.
128 OSU, Holmes SWCD and Alpine Cheese Company. 2006 at 10.129 Food & Water Watch analysis of FOIA documents from
Watch.130 .131 .132 . Violations on August 1, 2006 and August 1, 2007,
respectively.133 .134 .; Ohio EPA. “Authorization to Discharge Under the National
Pollution Discharge Elimination System.” Application No. OH0007960. May 8, 2006 at 1.
135 U.S. EPA. ECHO. “Detailed Facility Report: Alpine Dairy 1658 Township Road, Dundee, OH 44624.” Accessed June 8, 2015 at
pane3110006203811.
OH0007960. Accessed June 12, 2015 at http://echo.epa.gov/
137 Food & Water Watch analysis of Ohio EPA FOIA documents.138 Ohio EPA. “Authorization to Discharge Under the National
Pollution Discharge Elimination System.” Application No. OH0007960. May 29, 2014 at 19; Alpine Dairy, LLC. “Antidegradation Addendum & Report: Ohio EPA Submittal. NPDES Renewal and Proposed Wastewater Treatment Plant Improvements.” September 2013 at 1.
139 Alpine Dairy, LLC. September 2013 at 1.140 OSU, Holmes SWCD and Alpine Cheese Company. 2006 at 7 and
25.141 . at 7 and 25; Food & Water Watch analysis of FOIA
Documents from Ohio EPA.142 Blasick, Richard. Ohio EPA. Email to Elizabeth Nussbaumer.
Watch. 143 Food & Water Watch analysis of Holmes SWCD FOIA docu-
144 . 145 . 146 . 147 Ohio EPA. “Authorization to Discharge Under the National
Pollution Discharge Elimination System.” Application No. OH0007960. May 8, 2006 at 16; Kwolek, John. Division of
Cheese U.S. Route 62 NPDES Permit No 3IH00100.” Notice of Violation. May 1, 2007.
148 Burgess & Niple. “Alpine Dairy, LLC Biosolids Management Plan.” May 16, 2007. Revised December 28, 2012.
149 ATS Engineering. 2007 at 1 to 2.150 . at 1.151 Burgess & Niple. 2012 at 1. 152 ATS Engineering. 2007 at 12; Food & Water Watch analysis of
153 Kwolek, John and Dennis Lee. Division of Surface Water.
Route 62.” August 13, 2003 at 2; ATS Engineering. 2007; Food &
at Food & Water Watch.154 ATS Engineering. 2007 at 1 to 2.

28 Food & Water Watch • foodandwaterwatch.org
155 U.S. EPA. Integrated Compliance Information System. “ICIS Detailed Reports: Holmes Cheese Co Inc.” Accessed June 17, 2015 at http://iaspub.epa.gov/enviro/ICIS_DETAIL_REPORTS_NPDESID.icis_tst?npdesid=OH0075922&npvalue=1&npvalue=13&npvalue=14&npvalue=3&npvalue=4&npvalue=5&npvalue=6&rvalue=13&npvalue=2&npvalue=7&npvalue=8&npvalue=11&-npvalue=12; OSU, Holmes SWCD and Alpine Cheese Company. 2006 at 33.
156 U.S. EPA. ECHO. “Detailed Facility Report: Holmes Cheese Co Inc, 9444 ST RTE 39, Millersburg, OH 44654.” Accessed June 17,
157 Food & Water Watch analysis of Ohio EPA FOIA documents; Kwolek, John. Division of Surface Water. Northeast District
Watch. 158 U.S. EPA. ECHO. “Detailed Facility Report Data Dictionary.”
Accessed June 18, 2015 at http://echo.epa.gov/help/reports/dfr-
Report: Holmes Cheese Co Inc, 9444 ST RTE 39, Millersburg, OH 44654.” Accessed June 17, 2015 at http://echo.epa.gov/
3OH0075922. 159 Kwolek. 2007 at 3.160 U.S. EPA. Discharge Monitoring Report (DMR) Pollutant
Loading Tool. “Facility Information (DMR): Holmes Cheese Co Inc, Millersburg, OH 44654.” NPDES ID: OH0075922. Accessed June 17, 2015 at http://cfpub.epa.gov/dmr/facility_detail.cfm?fac=OH0075922.
161 U.S. EPA. ICIS. “ICIS Detailed Reports: Holmes Cheese Co Inc.” Accessed June 17, 2015 at http://iaspub.epa.gov/en-viro/ICIS_DETAIL_REPORTS_NPDESID.icis_tst?npdesid=OH0075922&npvalue=1&npvalue=13&npvalue=14&npvalue=3&npvalue=4&npvalue=5&npvalue=6&rvalue=13&npvalue=2&npvalue=7&npvalue=8&npvalue=11&npvalue=12;
& Environmental Results: 2010 Waterbody Report for Shrimplin Creek-Killbuck Creek.” Accessed June 17, 2015 at http://ofmpub.epa.gov/waters10/attains_waterbody.control?p_au_id=OH050400030705&p_cycle=2010.
& Environmental Results: Ohio, Walhonding Watershed.” Accessed June 17, 2015 at http://ofmpub.epa.gov/tmdl_wa-ters10/attains_watershed.control?p_huc=05040003&p_state=OH&p_cycle=2010&p_report_type=A.
163 U.S. EPA. ECHO. “Detailed Facility Report: Strasburg WWTP, 850 Railroad Ave SW, Strasburg, OH 44680.” Accessed August 19, 2015 at http://echo.epa.gov/
164 .165 .166 U.S. EPA. DMR Pollutant Loading Tool. “Facility Information
(DMR): Strasburg WWTP, 850 Railroad Ave SW, Strasburg, OH 44680.” Accessed August 19, 2015 at http://cfpub.epa.gov/dmr/facility_detail.cfm.
167 Smith, Travis, Martin Knapp and Chris Yoder. Center for Applied Bioassessment & Biocriteria. Midwest Biodiversity Institute. “Biological and Habitat Assessment of the Middle Fork of Sugar Creek.” December 6, 2010.
168 Moore. 2014; Smith, Knapp and Yoder. 2010.
“Assessment Summary for Reporting Year 2010 Ohio, Tuscarawas Watershed.” 2010. Accessed June 8, 2015 at http://iaspub.epa.gov/tmdl_waters10/attains_watershed.control.
Water. “Ohio Assessment Data for 2010: Assessed Waters of Ohio by Watershed.” 2010. Accessed June 8, 2015 at http://iaspub.epa.gov/tmdl_waters10/attains_state.control?p_state=OH&p_cycle=2010&p_report_type=A.
171 Smith, Knapp and Yoder. 2010 at 4. 172 Betanzo, Elin A. et al. Northeast-Midwest Institute and U.S.
Geological Survey. “Water Data to Answer Urgent Water Policy
-ment practices for reducing tributary loads to Lake Erie.” June 17, 2015 at 4.
173 Moore. 2014 at 3.174 OSU, Holmes SWCD and Alpine Cheese Company. 2006 at 22.175 Moore. 2014 at 3; Holmes SWCD. Alpine Cheese Nutrient
Trading Program Semi-Annual Report.” December 31, 2006 and December 31, 2010.
176 Holmes SWCD. Alpine Cheese Nutrient Trading Program Semi-Annual Report.” December 31, 2010; Moore. 2014 at 5.
177 Betanzo et al. 2015 at 25. 178 See .; Willamette Partnership, World Resources Institute and
NNWQT. 2015.179 See Chesapeake Bay Foundation. “Nutrient Trading 101.”
Accessed at http://www.cbf.org/about-the-bay/the-issues/nutrient-trading; Betanzo et al. 2015; Willamette Partnership, World Resources Institute and NNWQT. 2015.
January 13, 2003. 181 . 182 . 183 .
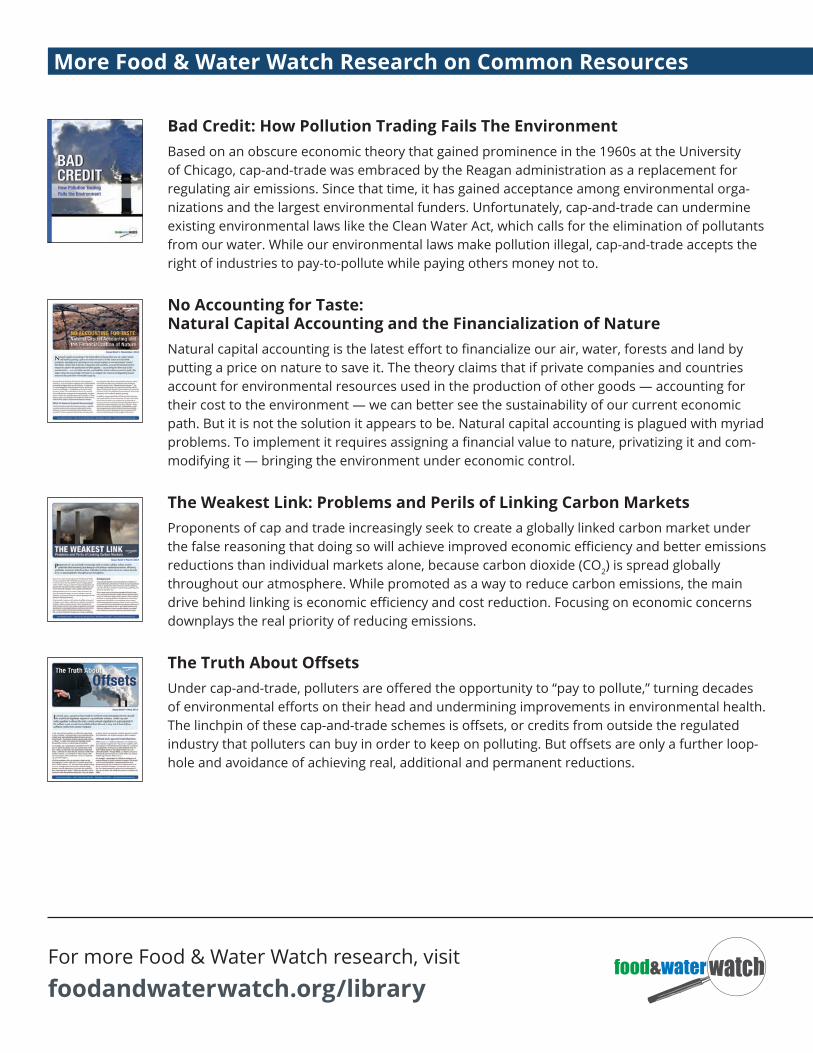
More Food & Water Watch Research on Common Resources
Bad Credit: How Pollution Trading Fails The EnvironmentBased on an obscure economic theory that gained prominence in the 1960s at the University of Chicago, cap-and-trade was embraced by the Reagan administration as a replacement for regulating air emissions. Since that time, it has gained acceptance among environmental orga-nizations and the largest environmental funders. Unfortunately, cap-and-trade can undermine existing environmental laws like the Clean Water Act, which calls for the elimination of pollutants from our water. While our environmental laws make pollution illegal, cap-and-trade accepts the right of industries to pay-to-pollute while paying others money not to.
No Accounting for Taste: Natural Capital Accounting and the Financialization of Nature
putting a price on nature to save it. The theory claims that if private companies and countries account for environmental resources used in the production of other goods — accounting for their cost to the environment — we can better see the sustainability of our current economic path. But it is not the solution it appears to be. Natural capital accounting is plagued with myriad
-modifying it — bringing the environment under economic control.
The Weakest Link: Problems and Perils of Linking Carbon MarketsProponents of cap and trade increasingly seek to create a globally linked carbon market under
reductions than individual markets alone, because carbon dioxide (CO2) is spread globally throughout our atmosphere. While promoted as a way to reduce carbon emissions, the main
downplays the real priority of reducing emissions.
-hole and avoidance of achieving real, additional and permanent reductions.
foodandwaterwatch.org/library

1616 P Street, NWSuite 300Washington, DC 20036(202) 683-2500
COVER PHOTO: GULF OF MEXICO “DEAD ZONE” AS SEEN FROM SPACE IN APRIL 2009. COURTESY OF U.S. NATIONAL AERONAUTICS AND SPACE ADMINISTRATION