Embed Size (px)
Citation preview
Water Quality Interventions to Prevent Diarrhoea: Cost and Cost-Effectiveness
Dr Thomas F. Clasen, London School of Hygiene & Tropical Medicine, UK Ms Laurence Haller, World Health Organization, Geneva, Switzerland
Public Health and the Environment Water, Sanitation and Hygiene

WHO/HSE/WSH/08.02
Water Quality Interventions to Prevent Diarrhoea: Cost and Cost-Effectiveness
Prepared by: Dr Thomas F. Clasen, London School of Hygiene & Tropical Medicine, UK Ms Laurence Haller, World Health Organization, Geneva, Switzerland
Public Health and the Environment World Health Organization
Geneva 2008
Water Quality Interventions to Prevent Diarrhoea: Cost and Cost-Effectiveness © World Health Organization 2008 The illustration on the cover page is extracted from Rescue Mission: Planet Earth, © Peace Child International 1994; used by permission. All rights reserved. Publications of the World Health Organization can be obtained from WHO Press, World Health Organization, 20 Avenue Appia, 1211 Geneva 27, Switzerland (tel.: +41 22791 3264; fax: +41 22 791 4857; e-mail: [email protected]). Requests for permission to reproduce or translate WHO publications – whether for sale or for noncommercial distribution – should be addressed to WHO Press, at the above address (fax: +41 22 791 4806; e-mail: [email protected]). The designations employed and the presentation of the material in this publication do not imply the expression of any opinion whatsoever on the part of the World Health Organization concerning the legal status of any country, territory, city or area or of its authorities, or concerning the delimitation of its frontiers or boundaries. Dotted lines on maps represent approximate border lines for which there may not yet be full agreement. The mention of specific companies or of certain manufacturers’ products does not imply that they are endorsed or recommended by the World Health Organization in preference to others of a similar nature that are not mentioned. Errors and omissions excepted, the names of proprietary products are distinguished by initial capital letters. All reasonable precautions have been taken by the World Health Organization to verify the information contained in this publication. However, the published material is being distributed without warranty of any kind, either expressed or implied. The responsibility for the interpretation and use of the material lies with the reader. In no event shall the World Health Organization be liable for damages arising from its use. The named authors alone are responsible for the views expressed in this publication. Printed by the WHO Document Production Services, Geneva, Switzerland
i
TABLE OF CONTENTS
ACKNOWLEDGEMENTS .......................................................................................................................ii
EXECUTIVE SUMMARY ........................................................................................................................ii
1. INTRODUCTION................................................................................................................................... 1
1.1 BACKGROUND AND RATIONALE ....................................................................................................... 1 1.2 ECONOMIC EVALUATION AND COST-EFFECTIVENESS ANALYSIS.................................................... 3
2. METHODS .............................................................................................................................................. 4
2.1 GENERALIZED COST-EFFECTIVENESS ANALYSIS AND WHO CHOICE ........................................ 4 2.2 DEFINING THE INTERVENTIONS AND BASELINE .............................................................................. 5 2.3 ESTIMATING HEALTH EFFECTS OF THE INTERVENTIONS .............................................................. 6 2.4 ESTIMATING THE HEALTH IMPACT (DALYS AVERTED)................................................................ 9 2.5 ESTIMATING THE COST OF THE INTERVENTIONS .......................................................................... 11 2.6 PRESENTING AND INTERPRETING THE RESULTS ........................................................................... 15
3. RESULTS .............................................................................................................................................. 16
3.1 COSTS ............................................................................................................................................... 16 3.2 COST OFFSETS ................................................................................................................................. 18 3.3 DALYS AVERTED ............................................................................................................................ 21 3.4 COST-EFFECTIVENESS RATIONS(CERS) ............................................................................... 22
4. DISCUSSION ........................................................................................................................................ 24
5. CONCLUSIONS, LIMITATIONS AND QUALIFICATIONS........................................................ 25
REFERENCES.......................................................................................................................................... 28
ii
ACKNOWLEDGEMENTS Portions of this paper were previously published (Clasen 2007). The authors gratefully acknowledge D. Walker, J. Bartram and S. Cairncross, co-authors of that paper, as well as the following who provided advice, assistance, data and other valuable contributions to this study: Greg Allgood, Jeff Barnes, Sally Cowal, Chuck Szymanski, Bruce Gordon, Benjamin Johns, Bruce Keswick, Danielle Lantange, Anne Mills, Rob Quick, Rick Rheingans, Michael Roberts, Mark Sobsey, Tess Tan-Torres Edejer, Martin Wegelin. Guy Hutton, Adam Taghreed, and Kate Tulenko served as peer-reviewers and provided valuable comments and suggestions. Finally, the authors acknowledge with gratitude the financial support from the World Bank. EXECUTIVE SUMMARY
Diarrhoeal disease kills an estimated 1.8 million people each year, and accounts for 17% of deaths of children under 5 years of age in developing countries. Ninety-four percent of this disease burden is attributable to the environment, including risks associated with unsafe water, lack of sanitation and poor hygiene. While piped-in water supplies are an important long-term goal, the WHO and UNICEF acknowledge that it is unlikely to meet the MDG target of halving the proportion of the people without sustainable access to safe drinking water and basic sanitation by 2015. As a result, they and others are seeking alternative interventions that can deliver the health gains of safe drinking water at lower cost. Among the candidates are conventional source- and a variety of household-based water treatment interventions. Building on our recent Cochrane review of the effectiveness of water quality interventions to prevent diarrhoea (38 trials, 21 countries, more than 53,000 subjects), we collected cost information from 28 country programmes and computed the cost-effectiveness of conventional improvements of water quality at the source (well, borehole, communal stand post) and four interventions to improve water quality at the household level (chlorination, filtration, solar disinfection and combined flocculation/disinfection). We then employed the generalized cost-effectiveness analysis (CEA) methodology developed by the WHO under its CHOICE project in order to assess the cost-effectiveness of these interventions in 10 WHO epidemiological sub-regions with lower levels of improved water and sanitation coverage. For each intervention, we report the cost-effectiveness ratios (cost per disability adjusted life year (DALY) averted) (CER) and a range of CERs based on the upper and lower estimates of their effectiveness and costs. We also estimated health cost savings from implementing the interventions, though the CERs are reported on a gross cost basis exclusive of such savings. Among all water quality interventions, household-based chlorination is the most cost-effective. Solar disinfection is only slightly less cost-effective, owing to its almost identical cost but lower overall effectiveness. Conventional source-based interventions have a mean cost per DALY averted of about twice that of chlorination and solar disinfection. Household-based ceramic filters have a higher cost, but yield the largest health impact; they thus represent an opportunity to avert more DALYs with additional investment. Combined flocculation-disinfection was strongly dominated (i.e., higher cost and lower effectiveness) by all other interventions except under an assumption in which it can be implemented at its minimum cost. By way of example, in the Africa-E region (see page 17 for a listing of countries in each WHO Sub-Region), the cost per DALY averted is US$53 for household chlorination, US$61 for household solar disinfection, US$123 for source-based interventions, US$142 for household ceramic filtration and US$472 for household flocculation/disinfection. An “expansion path” on a cost-effectiveness plane which plots each of the interventions under investigation by cost and effectiveness would begin with household-based chlorination and end with household-based filtration, the other interventions being dominated by these two approaches.
iii
Direct cost offsets, even if limited to the WHO estimates of health cost savings, more than
offset the costs implementing most water quality interventions. This means that governments, who are chiefly incurring such costs, would reduce their overall outlays by investing in the implementation of such interventions rather than in the treatment of cases of diarrhoeal disease. As a cost-effectiveness rather than cost-benefit analysis, this study also omits the economic value of other benefits (including time savings) that have been shown to ensue from improvements in water supplies. Insofar as this CEA is based on effectiveness data which concerns only the prevention of diarrhoeal diseases, it does not address diseases such as typhoid, hepatitis A and E and polio that may be transmitted by the ingestion of unsafe water but whose pathology does not consist of diarrhoea. Moreover, because the systematic review on which the effectiveness data in this CEA was based was limited to endemic diarrhoea, the impact of such interventions on epidemic diarrhoea will not be included in the DALYs averted. In these respects, this CEA understates the true cost-effectiveness of such interventions.
1
1. INTRODUCTION 1.1 Background and Rationale
Diarrhoeal diseases kill an estimated 1.8 million people each year (WHO 2005). Among children under five years in developing countries, diarrhoea accounts for 17% of all deaths (United Nations 2006). Oral rehydration therapy has dramatically decreased the mortality associated with diarrhoea, but has had little effect on morbidity estimated to be approximately 4 billion cases per year (Kosek 2003). With continued high attack rates, diarrhoeal disease is also an enormous economic burden, resulting in significant direct costs to the health sector and patients for treatment as well as in lost time at school, work and other productive activities (Mulligan 2005). The infectious agents associated with diarrhoeal disease are transmitted chiefly through the faecal-oral route (Black 2001). An estimated 94% of the diarrhoeal burden of disease is attributable to the environment, and associated with risk factors such as unsafe drinking water, lack of sanitation and poor hygiene (Prüss-Üstün & Corvalán 2006). While conventional interventions to improve water supplies at the source (point of distribution) have long been recognized as effective in preventing diarrhoea (Esrey 1985, 1991), more recent reviews have shown household-based (point-of-use) interventions to be significantly more effective than those at the source (Fewtrell 2005; Clasen 2006). As a result, there is increasing interest in such household-based interventions.
However, the extent to which such interventions are ultimately deployed to reduce the burden of disease will not be determined on their effectiveness alone. It will also depend on their cost. With limited resources, particularly in developing countries, governments are forced to allocate health expenditures to an array of public health challenges. NGOs must do the same in order to satisfy donors of the responsible use of their funds. Even interventions such as insecticide-treated nets that have shown the potential for commercial or quasi-commercial (e.g., social marketing) distribution often require public expenditures to promote basic health messages, awareness of the intervention, and continued and appropriate use. The use of purely commercial products that also have a health impact, such as soap or insecticide treated nets, is also effectively rationed by the cost that consumers can afford to pay for it.
While public sector decisions on health expenditures are often based on political commitments or
other expediencies, economic efficiency, by definition, requires that resources be directed to their most productive use. In the health context, such allocative efficiency means “assessing which intervention will produce greatest health gains for a given investment of resources, and focusing on that activity” (Witter 2000). This implies more than cost; the lowest cost intervention is seldom the most effective. Thus, economic evaluation is normally a function of both the cost of the intervention and the return on that cost, measured either in terms of overall economic benefits (a “cost-benefit analysis” or CBA) or in the realization of a social objective, such as the prevention of disease (a “cost-effectiveness analysis” or CEA). In a CBA, all of the outcomes of the investment are valued in economic terms, and the output is expressed as a return on the investment. The output of a CEA is a ratio (the cost-effectiveness ratio) between the cost of the intervention and a operational outcome measured in its own units. For health interventions, a common unit of measurement is healthy life years (HLYs) gained or deaths or disability adjusted life years (DALYs) averted as a result of the intervention.
Traditionally, economic evaluation of water and sanitation interventions has focused on
infrastructural improvements--mainly construction of facilities to improve water supplies and excreta disposal. Owing to the high cost of such improvements, such water and sanitation interventions carried costs per death averted of US$3600, well above the US$200 to US$250 for an intervention such as primary health care (Walsh 1979). Briscoe (1984a) argued that the methodology being used was misleading, since it employed gross rather than net (after savings) costs and underestimated the health
2
impact. Varley and colleagues (1998) also challenged this approach, arguing that the benefits associated with such infrastructural improvements in water and sanitation were beyond health, and thus that the health sector should not be charged with the full cost or responsibility of such “hardware” interventions. Their analysis found that improved “software”, including project design, hygiene education and water quality regulation, were cost-effective approaches for controlling childhood diarrhoea. However, when interventions to improve the microbial quality of water—all of which involved hardware expenditures such as wells and boreholes—were added to the analysis, they were in fact cost effective, since their ratio was below the US$150 per DALY averted then-prescribed by the World Bank as upper limit of cost-effectiveness (World Bank 1993).
In its 2002 World Health Report, the WHO assessed the cost-effectiveness of interventions to
increase coverage of water and sanitation services. It concluded that the most cost-effective strategy was the provision of disinfection capacity at the point of use—a combined hardware and software intervention not evaluated by Varley and colleagues (WHO 2002). A CBA analysis of water and sanitation improvements came to the same conclusion: while all of the interventions were found to be cost-beneficial, the combination of high health improvements and low incremental (adding to existing capacity to cover more users) suggests that household water treatment and safe storage may offer the highest return on investment among interventions to improve water or sanitation (Hutton 2004; Hutton 2007a). This was true even though household-based water treatment did not provide the benefit of time savings associated with improved water supply. The principal benefits from household water treatment are health related—reducing patient and health system costs by preventing water-borne disease.
However, the foregoing analyses had certain shortcomings that their authors themselves
acknowledged. First, the reliability of any tool of economic evaluation depends largely on the accuracy of its inputs, namely effectiveness in preventing disease and cost of implementation. Varley and colleagues (1998) based their analysis on a limited number of disparate health outcome studies, and the WHO CEA based its estimate of effectiveness on household-based chlorination (Quick 1999, Quick 2002). The Cochrane review described below provides perhaps the best available evidence on the effectiveness of such interventions and will form a more reliable basis on which to estimate the effectiveness of interventions in a CEA. Second, Varley excludes the hardware component from its cost analysis, arguing that it is not properly borne by the health sector. The cost estimates for the WHO assessments, on the other hand, were based principally on the hardware component of the home water chlorination method, and did not assess the full programmatic cost of implementing the intervention.1 A comprehensive analysis would include all costs associated with an intervention, including hardware and software. Third, Varley does not address household-based interventions whatsoever, and the WHO analyses include only home-based chlorination. As the Cochrane review shows, we now have a number of studies providing effectiveness data from at least three other means of household water treatment that Sobsey (2002) deemed promising: filtration, solar disinfection and combined flocculation/disinfection. Finally, like all CBAs, the Hutton (2004) assessment required certain assumptions about the valuation and magnitude of the time saving from improved water supplies that the authors acknowledge are not always evidence-based.
This cost and cost-effectiveness analysis attempts to build on these previous analyses and provide a more accurate assessment of the cost-effectiveness of interventions to improve water quality for the prevention of diarrhoeal disease. First, effectiveness will be based on the results of the systematic review.
1 While Esrey and colleagues (1985) were charged with estimating the cost-effectiveness of water and sanitation interventions as part of their analysis, they ultimately declined to do so, partly because of the inability to value the multiple benefits derived from such interventions but also because of the lack of reliable data on the costs of software support (e.g., promotion of community participation, hygiene education) and of apportioned institutions overheads. Like other assessments, their cost data included only hardware costs.
3
Second, cost estimates are based on a more comprehensive assessment of costs using a methodology now followed by the WHO for assessing the cost-effectiveness of health interventions generally. Third, the analysis will include each of the four leading approaches to household-based water treatment. However, since policy makers are not simply choosing among this group but between these and conventional source-based improvements in water supply, the analysis also includes three of the leading approaches to such source-based interventions as well (tap stands, bore holes and dug wells). Finally, by following the cost-effectiveness approach and reporting the results in terms of DALYs averted for each dollar invested, this analysis does not need to speculate on the economic valuation of other possible benefits of the interventions as with a CBA. At the same time, by reporting more detailed cost information for each category of intervention, it provides the basis for a more comprehensive, if not more accurate, CBA. 1.2 Economic evaluation and cost-effectiveness analysis
In recent years, the economic evaluation of health interventions has become an important area of inquiry and analysis. Leading institutions have refined methods and developed guidelines for the conduct of CEAs (Drummond 1996; Weinstein 1996; Murray 2000). In this context, Hutton (2000) reviewed conventional cost-effectiveness analyses of environmental health interventions. Among the findings of that review were the alarming lack of CEAs with respect to environmental interventions and the failure of health ministries to consider the costs and benefits of such interventions in setting policy. That study also found certain challenges in conducting CEAs of environmental interventions, including the difficulty in assessing costs and cost offsets (savings in health costs, such as reduced treatment expense), and the uncertainty of results arising from methodological difficulties, lack of reliable data and non-generalisability of data between settings. While the WHO has attempted to address these issues in developing its own guidelines for CEAs, the methodology is still in development and its reliability should not be overestimated.
In a review published in 2001, 24 studies addressing the economic aspects of water and sanitation
interventions were identified (Hutton 2001). Fifteen of these are willingness-to-pay (WTP) studies, 3 were cost-of-illness studies, and most of the rest covered sanitation or interventions other than drinking water or microbial water quality. Only Briscoe (1984) and Varley (1998) deal specifically with the cost-effectiveness of interventions to improved drinking water supplies, and even these have certain limitations. Briscoe mainly deals with methodological issues, presenting data to support his contention that water and sanitation interventions are as cost-effective as oral rehydration in reducing the incidence of diarrhoeal diseases. Varley’s analysis is of a hypothetical city using data collected from various countries. Since Hutton’s review, only two additional CEAs of water supply interventions have been published (WHO 2002; Cairncross 2004)2. Cairncross and Valdmanis estimated cost-effectiveness ratios (CERs) of US$94 and US$223 per DALY averted for handpump/standpost and household connections, respectively. Using costs based on water sector regulation, advocacy and promotion, the CER was US$47. They used the US$150/day averted threshold discussed in footnote 11, concluding that the handpump/standpost option was cost effective, while the household connection (unless using the lower regulatory-based cost estimate) was not.
The 2002 World Health Report concluded that “the intervention which is consistently the most cost-effective across regions and would be classified as very cost-effective in all areas where it was evaluated was the provision of disinfection capacity at point of use. On purely cost-effectiveness grounds it would be the first choice where resources are scarce.” It also noted that adding basic low technology water and sanitation to this option would also be either very cost-effective or cost-effective in most 2 CEAs of related interventions have also been published recently, including a latrine revision programme in Kabul (Meddings 2004), hygiene promotion (Borghi 2002), zinc as an adjunct therapy for acute childhood diarrhea (Robberstad 2004) and various interventions for achieving the MDGs (Evans 2005c).
4
settings, but that moving to the ideal of piped water supply and sewage could not be considered a cost-effective means of improving health in poor areas of the world. The actual data on which these conclusions are based can be found on the WHO-CHOICE database: (http://www3.who.int/whosis/menu.cfm?path=whosis,cea&language=english). The Report’s conclusions regarding the cost-effectiveness of point-of-use disinfection were an important impetus for household based water treatment. They are also a reason to compare chlorination with other approaches to household-based water treatment. At the same time, they provide an opportunity to revisit the assumptions on which these conclusions were based and to place the cost-effectiveness of household-based water treatment in a context with conventional public interventions to improve water supplies, such as stand posts, dug wells and boreholes.
2. METHODS 2.1 Generalized Cost-effectiveness Analysis and WHO CHOICE
As its name implies, cost-effectiveness is a measure of the cost of a particular intervention and its
effectiveness with respect to a certain health outcome (e.g., the prevention of diarrhoeal disease). Effectiveness requires an assessment of the fatal and non-fatal health outcomes that occur when an intervention is introduced. In general, interventions might change the incidence, duration of time within different health states, or the case fatality rate. Because interventions to improve water quality are preventive, the main outcome is first a reduction in the number of diarrhoea episodes and then a reduction in the number of deaths. A common measure of the population health effect of the intervention is disability life years (DALYs) averted as a result of the intervention. DALYs are a time-based measure of health that include the impact of interventions on years of life lost (YLL) due to premature mortality and years of life lived with a non-fatal health outcome, weighted by the severity of the outcome.
There are a variety of methodologies for conducting CEAs (Gold 1996). Often, they are
undertaken as part of an intervention study and therefore assess effectiveness and costs of one or two intervention arms in a particular setting, e.g., permethrin-treated bed nets in an area of intense malarial transmission in Western Kenya (Wiseman 2003), improved treatment for sexually transmitted diseases in preventing HIV-1 in Mwanza, United Republic of Tanzania (Gilson 1997), and in-house residual spraying vs. insecticide-treated nets in Surat, India (Bhatia 2004)). Such an approach, however, is restricted to assessing the efficiency of adding a single new intervention to the existing set, or substituting one for another, both in a manner that is context-specific. These studies also usually cover a small area and are not at scale at the national level.
An alternative approach developed and now used by the WHO is known as “generalized cost-
effectiveness analysis”. The basic approach has been described (Murray 2000; Tan-Torres Edejer 2003). It has been utilized in a number of recent CEAs, including tuberculosis control strategies (Baltussen 2005), use of injection in health care settings (Dziekan 2003) and interventions to reach the MDGs for childhood survival (Tan-Torres Edejer 2005). Unlike other approaches to CEA, generalized CEA allows for a comparison of current interventions as well as interventions being considered for implementation on a sector-wide basis for a group of populations with comparable health systems and epidemiological profiles (Murray 2000).
Generalized CEA is used by the Global Programme on Evidence for Health Policy (GPE) under
WHO-CHOICE (Choosing Interventions that are Cost Effective) (http://www.who.int/choice/en/). WHO-CHOICE assembles regional databases on costs, health impact and cost-effectiveness. It produces and publishes sets of regional cost-effectiveness estimates, for up to 50 interventions each quarter, of interventions against more than a dozen diseases, including diarrhoea. By employing generalized CEA in a manner that is compatible with the WHO-CHOICE methodology, health analysts not only can use the
5
tools developed by the programme, but also draw on these databases to provide and compare cost and effectiveness data. More importantly, they can compare their results with other interventions against diarrhoea and other important diseases. By adopting this standardized approach, the results can be compared with a wide range of environmental and other interventions, providing important evidence for setting health priorities and allocating investments. WHO has developed a comprehensive guide for conducting generalized CEA (Tan-Torres Edejer 2003). Additional information, including software programs for collecting and analyzing costs (Cost-It), estimating the health impact of the intervention on a given population over time (PopMod), and calculating cost-effectiveness ratios with uncertainty intervals (MCLeague) are also available on the WHO-CHOICE website.
In general, the process for conducting a generalized CEA at the country level consists of four
basic steps. These include (i) defining the interventions to be investigated, as well as the counterfactual (null) or baseline state; (ii) estimating the effectiveness of the interventions; (iii) modelling the study population based on demographic, exposure and risk data, using the effectiveness data to determine the DALYs averted by each intervention compared to the counterfactual; (iv) estimating the costs associated with the interventions; and (iv) calculating the cost per DALY averted and interpreting the results. These basic steps, together with certain special considerations relevant to conducting a CEA in the context of water quality interventions to prevent diarrhoeal disease, are summarized below.
2.2 Defining the Interventions and Baseline
CEA compares the effect of one or more interventions against the counterfactual state of an
alternative intervention. In generalized CEA, this alternative is the null, or the situation in which the intervention did not exist. The first step in the methodology is to determine the interventions to be investigated and to describe them precisely enough so that accurate information can be obtained regarding their costs and effectiveness. Among other things, it is important to that the interventions be defined with reference to the setting in which they will be undertaken, the population (including coverage level) to which they will be targeted, and the time horizon over which the interventions will be delivered.
A wide variety of interventions have been implemented to improve the microbiological quality of
drinking water, including central water treatment leading to household connections, protected communal wells and springs, and, increasingly, household water treatment. In order for a CEA to yield useful comparisons of possible choices of interventions, however, the data respecting the cost and effectiveness of such interventions must be comparable. As explained more fully in Section 2.3 below, the effectiveness data for this CEA is based on a systematic review of water quality interventions to prevent diarrhoeal diseases (Clasen 2006). The studies included in the review provided data on the effectiveness of only certain interventions to improve water quality: source-based interventions and four types of household-based interventions. The studies on source-based interventions extended only to improving wells, boreholes and systems leading to communal tap stands, not to household connections. As there are no randomized, controlled trials of the health impact of household connections, we were not able to include household connections in this analysis (Cairncross 2004).
The household-based interventions included in this review are four types of point-of-use water
treatment methods for which there was rigorous evidence of effectiveness in randomized or quasi-randomised controlled field trials. The first type was chlorination using sodium hypochlorite following the “Safe Water System” (SWS) developed and promoted by the US Centers for Disease Control and Prevention (CDC) with safe storage and behaviour change techniques to promote adoption and consistent use. The second is gravity filtration using either commercial “candle” style gravity filters or locally fabricated pot-style filters developed by Potters for Peace. The third is solar disinfection following the “Sodis” method in which clear 2L PET bottles are filled with raw water and than exposed to the sun’s UV and infrared radiation for 6-48 hours for killing and inactivating microbes. The fourth is flocculation-
6
disinfection using Procter & Gambles PUR® sachets which combine an iron-based flocculant with a chlorine-based disinfectant to treat water in 10L batches. Complete details of these methods are available elsewhere (Sobsey 2002).
In generalized CEA, the subject is evaluated against a counterfactual or null. Because
generalized CEA is designed to allow analysts to consider what would happen if all resources were reallocated, the counterfactual assumes that none of these interventions are implemented and all related interventions cease forthwith. However, in the present case, it was deemed most appropriate that the counterfactual would be the current status of water supplies. This is because, unlike a withdrawal of say a vaccination programme in favour of an alternative intervention, a reversal of water supply infrastructure is illogical; countries are not going to dismantle existing systems. Thus, the counterfactual in this case consists of the status quo. For purposes of this CEA, this is based on the 2002 results from the Global Water Supply and Sanitation Assessment (WHO/UNICEF 2005).
The time horizon over which to evaluate the interventions against the baseline must also be
determined. While many interventions are evaluated over a year, this favours programs with relatively small start up costs even if they may have higher costs and lower effectiveness over the longer term when brought to scale. A long term (>25 years) is perhaps more accurate, but is beyond the planning cycle of policy makers. As a result, WHO recommends that when using generalized CEA, interventions be evaluated over a period of 10 years. The total cost of implementation thus includes annualized start-up costs prior to this 10-year period as well as 10 full years of implementation cost. As discussed more fully below, analysts should not necessarily assume that costs or effectiveness are uniform during this 10-year period.
2.3 Estimating Health Effects of the Interventions
The next step was to evaluate the impact of the interventions against the counterfactual. Like
costs, it is possible to estimate the effectiveness of an intervention based on an individual trial. In its own estimate of the effectiveness of point-of-use disinfection for the 2002 World Health Report, the WHO estimate assumed a 45% reduction in diarrhoeal disease as a result of the intervention. This was based on a single study (Quick 1999).3 However, individual trials have shown a wide range of effectiveness in water quality interventions to prevent diarrhoea. Systematic reviews which are designed to reflect all available evidence on the effectiveness of a given intervention and to minimize bias provide a better basis on which to estimate effectiveness (Tan-Torres Edejer 2003).
The effectiveness data used in this CEA is based on a recent systematic review conducted under
the auspices of the Cochrane Collaboration (Clasen 2006). Following a comprehensive search strategy designed to include all randomized and quasi-randomized controlled trials of interventions designed to improve the microbial quality of water for the prevention of diarrhoeal disease, the review identified 38 published and unpublished trials through 31 December 2005 that met the review’s inclusion criteria. The authors extracted key data, including the measures of effect, and performed sub-group analysis in an attempt to explain heterogeneity. The review found substantial differences in the interventions and the settings and other conditions in which they were implemented; they also found important methodological differences in the studies themselves. As a result, only limited meta-analysis of the studies included in the review was possible. Nevertheless, the review did find significant differences in the pooled measures of effect between source- and household-based interventions, and among the four types of household interventions inter se. The review contains important qualifications and limitations on its probative value. Nevertheless, the review provides perhaps the best evidence to date on the effectiveness of
3 See, for example, http://www3.who.int/whosis/cea/interventiontable/WS/TableG.xls This compares to the Cochrane review’s pooled estimate from 16 studies of household chlorination interventions of 37%.
7
interventions, including those at the household level, to prevent diarrhoea by improving the microbial quality of water. Accordingly, the review is the basis for the effectiveness estimates used in this CEA.
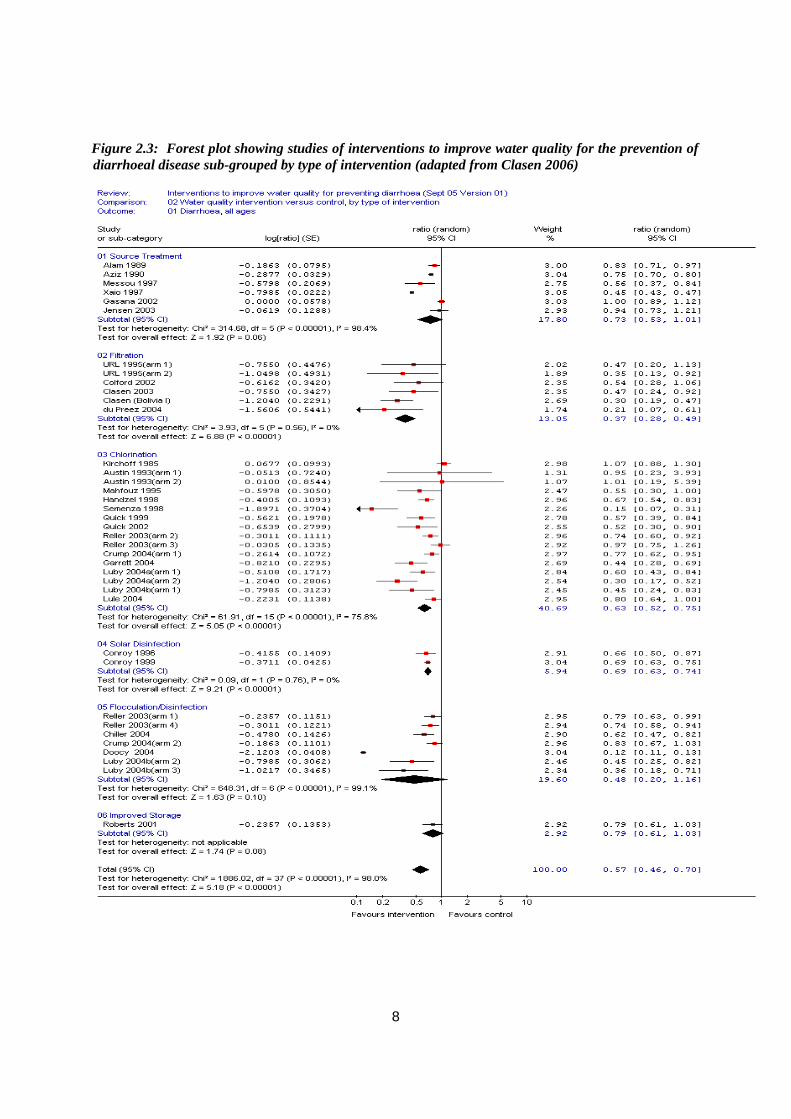
Figure 2.3 contains a forest plot of the studies included in the systematic review sub-grouped by type of intervention: source, chlorination, filtration, solar disinfection and combined flocculation/disinfection. Meta-analysis was used to derive pooled estimates of effect. The weight ascribed to each study in the meta-analysis was based on the precision of its results in accordance with the inverse variance method, where weight is a function of the reciprocal of the squared standard error of the point estimate of effect. Because of important differences in study methodology, settings, intervention types, as well as substantial heterogeneity in study results, the random effects (rather than fixed effects) model was employed. In order capture as many studies as possible in each sub-group, the pooled estimates of effect shown in Figure 2.3 are based on all studies included in the review, regardless of the measure of effect that such studies report. There are important statistical issues associated with such homologous treatment of different measures of effect—including in this case, risk ratios, rate ratios, longitudinal prevalence ratios, odds ratios and means ratios (Zhang 1998; McNutt 2003). The effectiveness estimates are summarized in Table 2.3. The limitations and qualifications applicable to such pooled estimates and described in systematic review should be borne in mind in considering the results of this CEA.
8
Figure 2.3: Forest plot showing studies of interventions to improve water quality for the prevention of diarrhoeal disease sub-grouped by type of intervention (adapted from Clasen 2006)
9
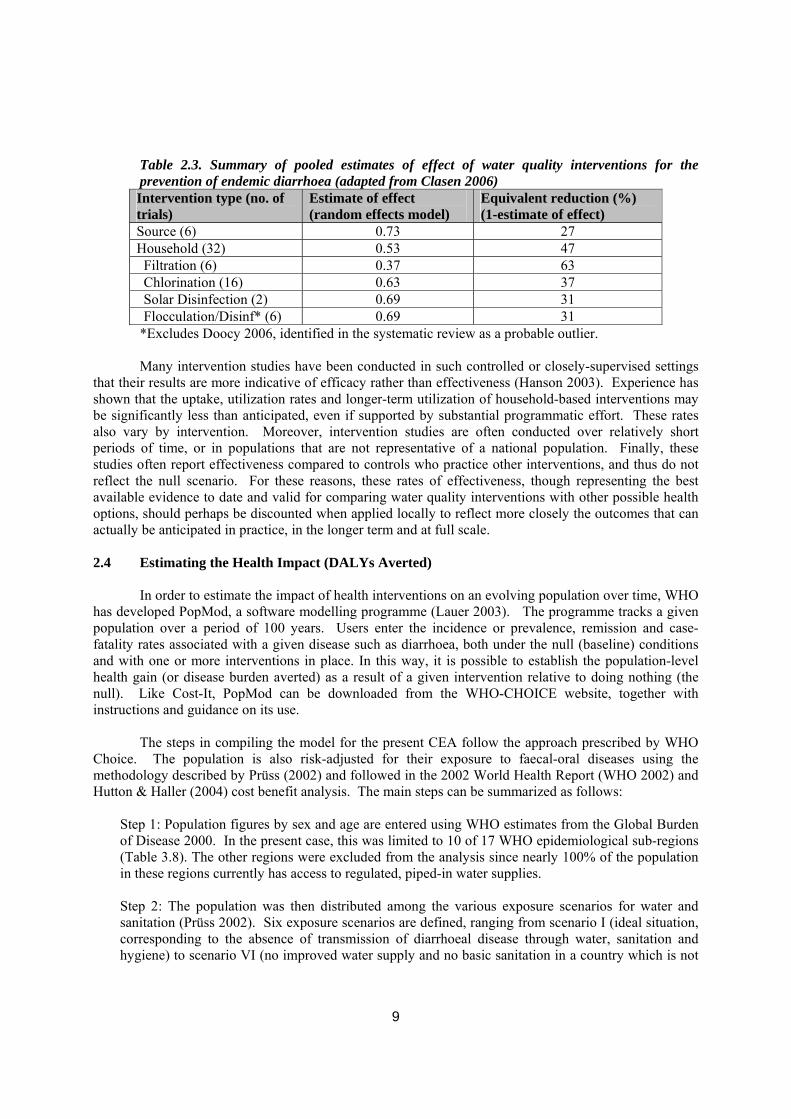
Table 2.3. Summary of pooled estimates of effect of water quality interventions for the prevention of endemic diarrhoea (adapted from Clasen 2006) Intervention type (no. of trials)
Estimate of effect (random effects model)
Equivalent reduction (%) (1-estimate of effect)
Source (6) 0.73 27 Household (32) 0.53 47 Filtration (6) 0.37 63 Chlorination (16) 0.63 37 Solar Disinfection (2) 0.69 31 Flocculation/Disinf* (6) 0.69 31
*Excludes Doocy 2006, identified in the systematic review as a probable outlier. Many intervention studies have been conducted in such controlled or closely-supervised settings
that their results are more indicative of efficacy rather than effectiveness (Hanson 2003). Experience has shown that the uptake, utilization rates and longer-term utilization of household-based interventions may be significantly less than anticipated, even if supported by substantial programmatic effort. These rates also vary by intervention. Moreover, intervention studies are often conducted over relatively short periods of time, or in populations that are not representative of a national population. Finally, these studies often report effectiveness compared to controls who practice other interventions, and thus do not reflect the null scenario. For these reasons, these rates of effectiveness, though representing the best available evidence to date and valid for comparing water quality interventions with other possible health options, should perhaps be discounted when applied locally to reflect more closely the outcomes that can actually be anticipated in practice, in the longer term and at full scale.
2.4 Estimating the Health Impact (DALYs Averted)
In order to estimate the impact of health interventions on an evolving population over time, WHO
has developed PopMod, a software modelling programme (Lauer 2003). The programme tracks a given population over a period of 100 years. Users enter the incidence or prevalence, remission and case-fatality rates associated with a given disease such as diarrhoea, both under the null (baseline) conditions and with one or more interventions in place. In this way, it is possible to establish the population-level health gain (or disease burden averted) as a result of a given intervention relative to doing nothing (the null). Like Cost-It, PopMod can be downloaded from the WHO-CHOICE website, together with instructions and guidance on its use.
The steps in compiling the model for the present CEA follow the approach prescribed by WHO
Choice. The population is also risk-adjusted for their exposure to faecal-oral diseases using the methodology described by Prüss (2002) and followed in the 2002 World Health Report (WHO 2002) and Hutton & Haller (2004) cost benefit analysis. The main steps can be summarized as follows:
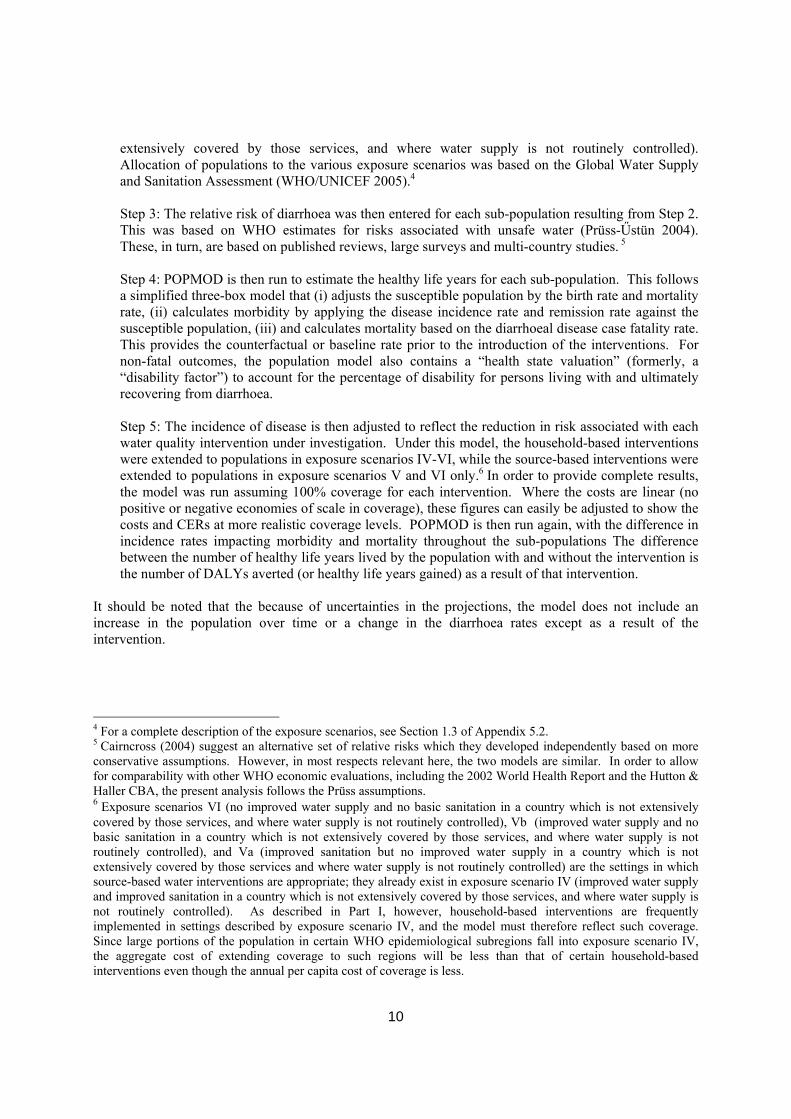
Step 1: Population figures by sex and age are entered using WHO estimates from the Global Burden of Disease 2000. In the present case, this was limited to 10 of 17 WHO epidemiological sub-regions (Table 3.8). The other regions were excluded from the analysis since nearly 100% of the population in these regions currently has access to regulated, piped-in water supplies.
Step 2: The population was then distributed among the various exposure scenarios for water and sanitation (Prüss 2002). Six exposure scenarios are defined, ranging from scenario I (ideal situation, corresponding to the absence of transmission of diarrhoeal disease through water, sanitation and hygiene) to scenario VI (no improved water supply and no basic sanitation in a country which is not
10
extensively covered by those services, and where water supply is not routinely controlled). Allocation of populations to the various exposure scenarios was based on the Global Water Supply and Sanitation Assessment (WHO/UNICEF 2005).4 Step 3: The relative risk of diarrhoea was then entered for each sub-population resulting from Step 2. This was based on WHO estimates for risks associated with unsafe water (Prüss-Űstün 2004). These, in turn, are based on published reviews, large surveys and multi-country studies. 5 Step 4: POPMOD is then run to estimate the healthy life years for each sub-population. This follows a simplified three-box model that (i) adjusts the susceptible population by the birth rate and mortality rate, (ii) calculates morbidity by applying the disease incidence rate and remission rate against the susceptible population, (iii) and calculates mortality based on the diarrhoeal disease case fatality rate. This provides the counterfactual or baseline rate prior to the introduction of the interventions. For non-fatal outcomes, the population model also contains a “health state valuation” (formerly, a “disability factor”) to account for the percentage of disability for persons living with and ultimately recovering from diarrhoea. Step 5: The incidence of disease is then adjusted to reflect the reduction in risk associated with each water quality intervention under investigation. Under this model, the household-based interventions were extended to populations in exposure scenarios IV-VI, while the source-based interventions were extended to populations in exposure scenarios V and VI only.6 In order to provide complete results, the model was run assuming 100% coverage for each intervention. Where the costs are linear (no positive or negative economies of scale in coverage), these figures can easily be adjusted to show the costs and CERs at more realistic coverage levels. POPMOD is then run again, with the difference in incidence rates impacting morbidity and mortality throughout the sub-populations The difference between the number of healthy life years lived by the population with and without the intervention is the number of DALYs averted (or healthy life years gained) as a result of that intervention.
It should be noted that the because of uncertainties in the projections, the model does not include an increase in the population over time or a change in the diarrhoea rates except as a result of the intervention.
4 For a complete description of the exposure scenarios, see Section 1.3 of Appendix 5.2. 5 Cairncross (2004) suggest an alternative set of relative risks which they developed independently based on more conservative assumptions. However, in most respects relevant here, the two models are similar. In order to allow for comparability with other WHO economic evaluations, including the 2002 World Health Report and the Hutton & Haller CBA, the present analysis follows the Prüss assumptions. 6 Exposure scenarios VI (no improved water supply and no basic sanitation in a country which is not extensively covered by those services, and where water supply is not routinely controlled), Vb (improved water supply and no basic sanitation in a country which is not extensively covered by those services, and where water supply is not routinely controlled), and Va (improved sanitation but no improved water supply in a country which is not extensively covered by those services and where water supply is not routinely controlled) are the settings in which source-based water interventions are appropriate; they already exist in exposure scenario IV (improved water supply and improved sanitation in a country which is not extensively covered by those services, and where water supply is not routinely controlled). As described in Part I, however, household-based interventions are frequently implemented in settings described by exposure scenario IV, and the model must therefore reflect such coverage. Since large portions of the population in certain WHO epidemiological subregions fall into exposure scenario IV, the aggregate cost of extending coverage to such regions will be less than that of certain household-based interventions even though the annual per capita cost of coverage is less.
11
Table 2.4: WHO Epidemiological Sub-regions included in CEA Region* Mortality
Stratum** Countries
AFR D Algeria, Angola, Benin, Burkina Faso, Cameroon, Cape Verde, Chad, Comoros, Equatorial Guinea, Gabon, Gambia, Ghana, Guinea, Guinea-Bissau, Liberia, Madagascar, Mali, Mauritania, Mauritius, Niger, Nigeria, Sao Tome And Principe, Senegal, Seychelles, Sierra Leone, Togo
AFR E Botswana, Burundi, Central African Republic, Congo, Côte d’Ivoire, Democratic Republic of the Congo, Eritrea, Ethiopia, Kenya, Lesotho, Malawi, Mozambique, Namibia, Rwanda, South Africa, Swaziland, Uganda, United Republic of Tanzania, Zambia, Zimbabwe
AMR B Antigua and Barbuda, Argentina, Bahamas, Barbados, Belize, Brazil, Chile, Colombia, Costa Rica, Dominica, Dominican Republic, El Salvador, Grenada, Guyana, Honduras, Jamaica, Mexico, Panama, Paraguay, Saint Kitts and Nevis, Saint Lucia, Saint Vincent and the Grenadines, Surinam, Trinidad and Tobago, Uruguay, Venezuela
AMR D Bolivia, Ecuador, Guatemala, Haiti, Nicaragua, Peru EMR B Bahrain, Cyprus, Iran (Islamic Republic of), Jordon, Kuwait, Lebanon,
Libyan Arab Jamahiriya, Oman, Qatar, Saudi Arabia, Syrian Arab Republic, Tunisia, United Arab Emirates
EMR D Afghanistan, Djibouti, Egypt, Iraq, Morocco, Pakistan, Somalia, Sudan, Yemen
EUR B Albania, Armenia, Azerbaijan, Bosnia and Herzegovina, Bulgaria, Georgia, Kyrgyzstan, Poland, Romania, Slovakia, Tajikistan, The former Yugoslav Republic of Macedonia, Turkey, Turkmenistan, Uzbekistan, Yugoslavia
SEAR D Indonesia, Sri Lanka, Thailand SEAR B Bangladesh, Bhutan, Democratic People’s Republic of Korea, India,
Maldives, Myanmar, Nepal WPR B Cambodia, China, Cook Islands, Fiji, Kiribati, Lao People’s Democratic
Republic, Malaysia, Marshall Islands, Micronesia (Federated States of), Mongolia, Nauru, Niue, Palau, Papua New Guinea, Philippines, Republic of Korea, Samoa, Solomon Islands, Tonga, Tuvalu, Vanuatu, Viet Nam
*AFR=Africa; AMR=Americas; EMR= Eastern Mediterranean; EUR=Europe; SEAR=South-East Asia; WPR=Western Pacific**B=low adult, low child morality; C=high adult, low child mortality; D=high adult, high child mortality; E=very high adult, high child mortality
2.5 Estimating the Cost of the Interventions
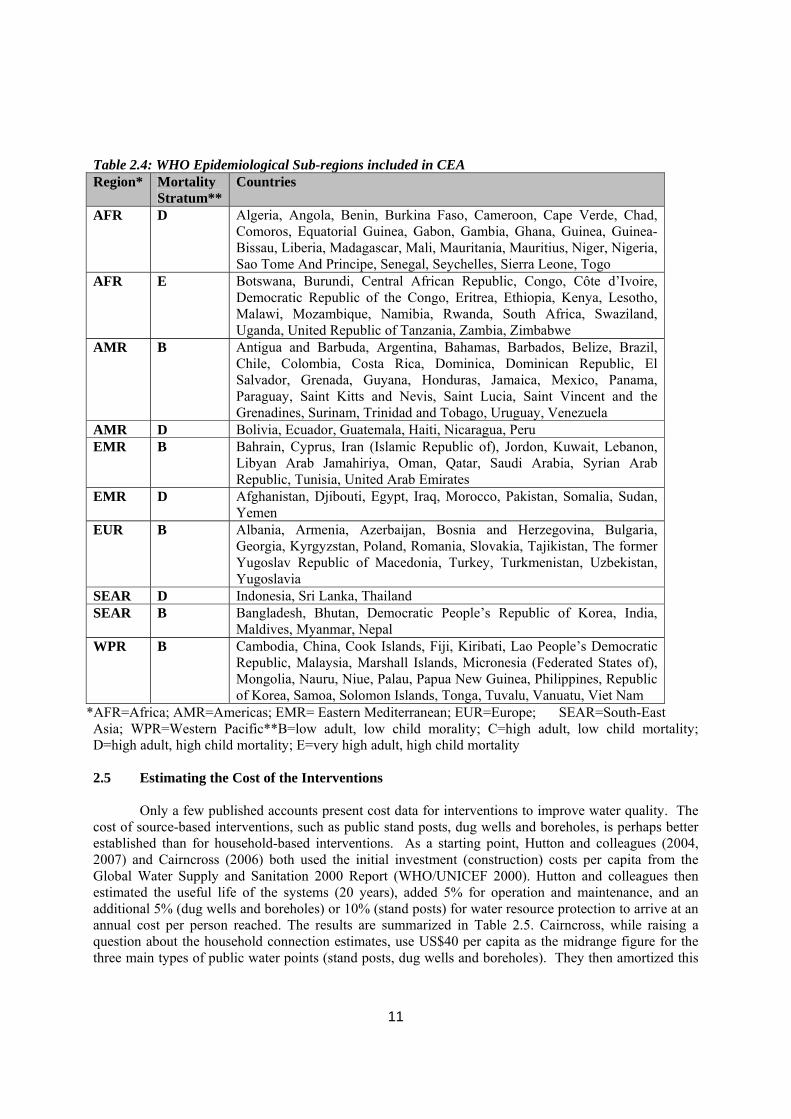
Only a few published accounts present cost data for interventions to improve water quality. The cost of source-based interventions, such as public stand posts, dug wells and boreholes, is perhaps better established than for household-based interventions. As a starting point, Hutton and colleagues (2004, 2007) and Cairncross (2006) both used the initial investment (construction) costs per capita from the Global Water Supply and Sanitation 2000 Report (WHO/UNICEF 2000). Hutton and colleagues then estimated the useful life of the systems (20 years), added 5% for operation and maintenance, and an additional 5% (dug wells and boreholes) or 10% (stand posts) for water resource protection to arrive at an annual cost per person reached. The results are summarized in Table 2.5. Cairncross, while raising a question about the household connection estimates, use US$40 per capita as the midrange figure for the three main types of public water points (stand posts, dug wells and boreholes). They then amortized this
12
over the same 20 years, and added $1 per year for operation and maintenance, for a total cost of US$3 per person per year.7 Table 2.5a: Annual costs per person for improvements in water supply
Annual Cost per person reached (US$ year 2000) Intervention Africa Asia Latin America & Caribbean
Standpost 2.40 4.95 3.17 Borehole 1.70 1.26 4.07 Dug Well 1.55 1.63 3.55 Source: adapted from Hutton (2004, 2007) The Global Assessment acknowledges that its figures are rough estimates, and that local costs may vary widely based on population density and ease of access to water resources. There are, however, other reasons why these figures may not represent the full economic cost of these interventions. First, they appear to include only the direct costs of labour and material, and not indirect (overhead) costs (management personnel, office and warehouse facilities, transportation, communication, etc.) that would be incurred by the governmental or other organization implementing the intervention. Second, these figures do not include “software” costs that may be associated with the intervention. Many of the studies of such source-based improvements included in the Cochrane review included software components (Clasen 2006). Finally, the 20-year expected life of these systems may be excessive, even if the cost estimate is grossed up by an amount for operation and maintenance. Five years after installing pumps on tubewells in Bangladesh, Hoque (1995) found 18% of the pumps no longer functioning. In South Africa, Mathekgana (2001) found stand pipes not working only 30% of the time.
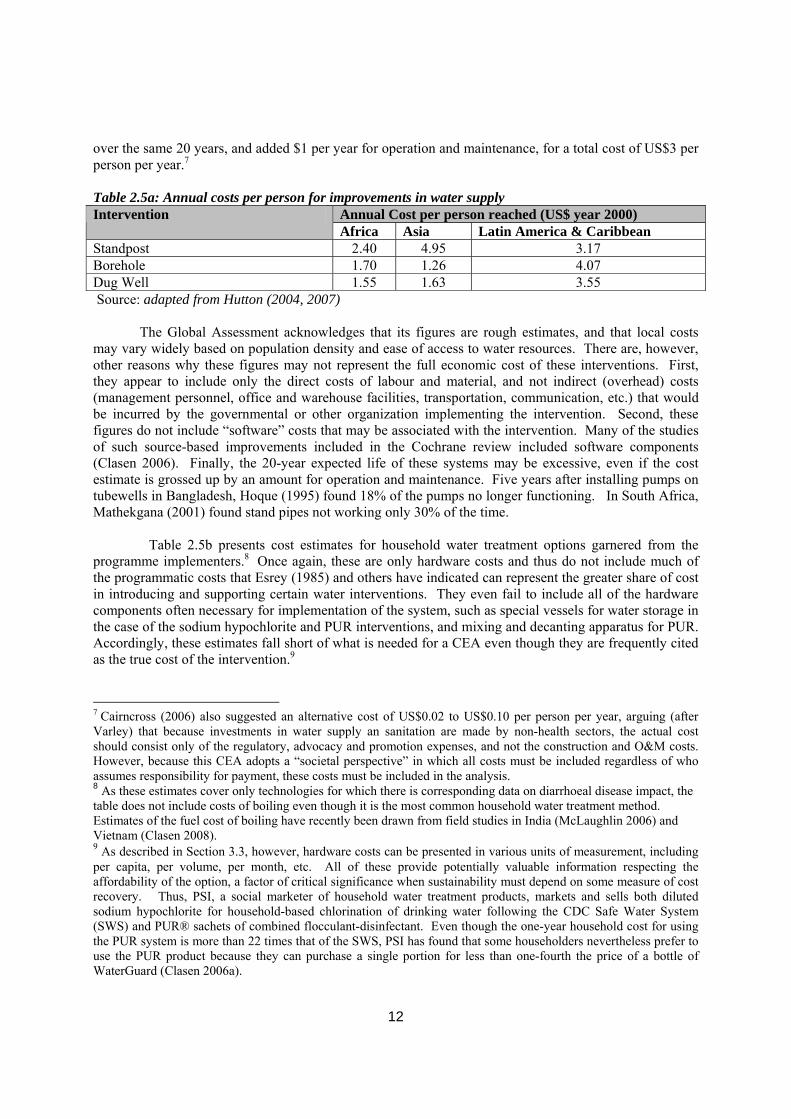
Table 2.5b presents cost estimates for household water treatment options garnered from the programme implementers.8 Once again, these are only hardware costs and thus do not include much of the programmatic costs that Esrey (1985) and others have indicated can represent the greater share of cost in introducing and supporting certain water interventions. They even fail to include all of the hardware components often necessary for implementation of the system, such as special vessels for water storage in the case of the sodium hypochlorite and PUR interventions, and mixing and decanting apparatus for PUR. Accordingly, these estimates fall short of what is needed for a CEA even though they are frequently cited as the true cost of the intervention.9
7 Cairncross (2006) also suggested an alternative cost of US$0.02 to US$0.10 per person per year, arguing (after Varley) that because investments in water supply an sanitation are made by non-health sectors, the actual cost should consist only of the regulatory, advocacy and promotion expenses, and not the construction and O&M costs. However, because this CEA adopts a “societal perspective” in which all costs must be included regardless of who assumes responsibility for payment, these costs must be included in the analysis. 8 As these estimates cover only technologies for which there is corresponding data on diarrhoeal disease impact, the table does not include costs of boiling even though it is the most common household water treatment method. Estimates of the fuel cost of boiling have recently been drawn from field studies in India (McLaughlin 2006) and Vietnam (Clasen 2008). 9 As described in Section 3.3, however, hardware costs can be presented in various units of measurement, including per capita, per volume, per month, etc. All of these provide potentially valuable information respecting the affordability of the option, a factor of critical significance when sustainability must depend on some measure of cost recovery. Thus, PSI, a social marketer of household water treatment products, markets and sells both diluted sodium hypochlorite for household-based chlorination of drinking water following the CDC Safe Water System (SWS) and PUR® sachets of combined flocculant-disinfectant. Even though the one-year household cost for using the PUR system is more than 22 times that of the SWS, PSI has found that some householders nevertheless prefer to use the PUR product because they can purchase a single portion for less than one-fourth the price of a bottle of WaterGuard (Clasen 2006a).
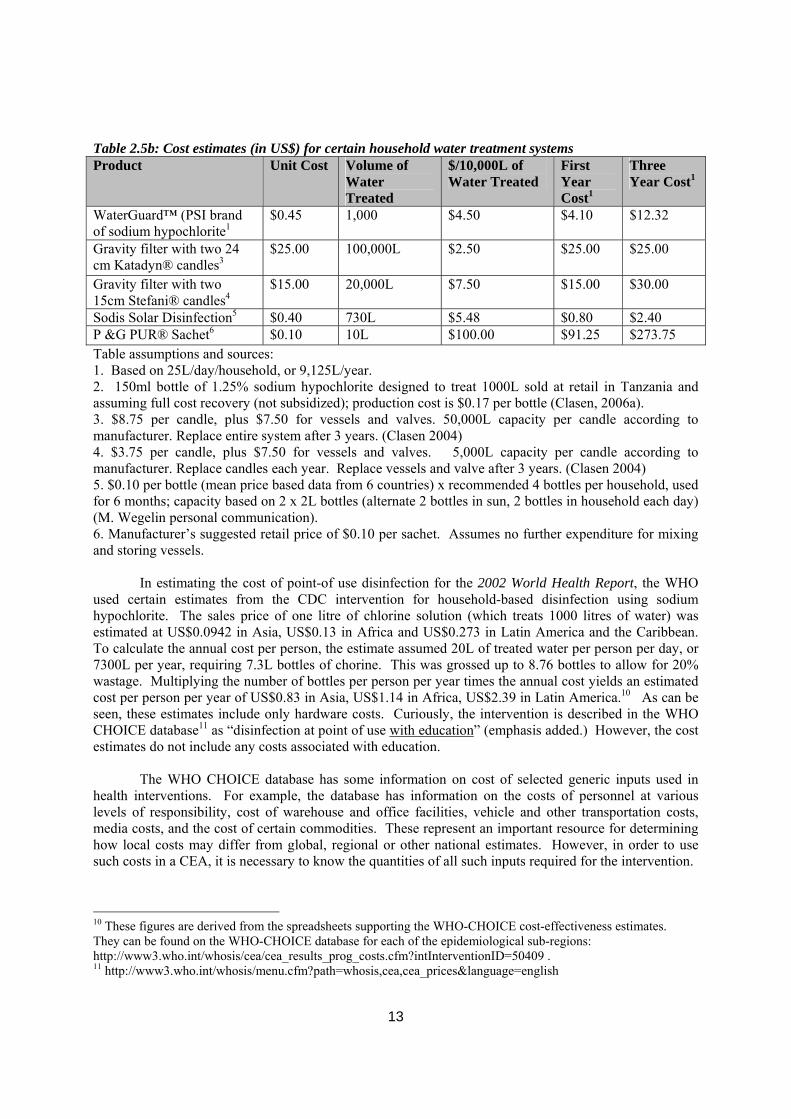
13
Table 2.5b: Cost estimates (in US$) for certain household water treatment systems Product Unit Cost Volume of
Water Treated
$/10,000L of Water Treated
First Year Cost1
Three Year Cost1
WaterGuard™ (PSI brand of sodium hypochlorite1
$0.45 1,000 $4.50 $4.10 $12.32
Gravity filter with two 24 cm Katadyn® candles3
$25.00 100,000L $2.50 $25.00 $25.00
Gravity filter with two 15cm Stefani® candles4
$15.00 20,000L $7.50 $15.00 $30.00
Sodis Solar Disinfection5 $0.40 730L $5.48 $0.80 $2.40 P &G PUR® Sachet6 $0.10 10L $100.00 $91.25 $273.75 Table assumptions and sources: 1. Based on 25L/day/household, or 9,125L/year. 2. 150ml bottle of 1.25% sodium hypochlorite designed to treat 1000L sold at retail in Tanzania and assuming full cost recovery (not subsidized); production cost is $0.17 per bottle (Clasen, 2006a). 3. $8.75 per candle, plus $7.50 for vessels and valves. 50,000L capacity per candle according to manufacturer. Replace entire system after 3 years. (Clasen 2004) 4. $3.75 per candle, plus $7.50 for vessels and valves. 5,000L capacity per candle according to manufacturer. Replace candles each year. Replace vessels and valve after 3 years. (Clasen 2004) 5. $0.10 per bottle (mean price based data from 6 countries) x recommended 4 bottles per household, used for 6 months; capacity based on 2 x 2L bottles (alternate 2 bottles in sun, 2 bottles in household each day) (M. Wegelin personal communication). 6. Manufacturer’s suggested retail price of $0.10 per sachet. Assumes no further expenditure for mixing and storing vessels.
In estimating the cost of point-of use disinfection for the 2002 World Health Report, the WHO used certain estimates from the CDC intervention for household-based disinfection using sodium hypochlorite. The sales price of one litre of chlorine solution (which treats 1000 litres of water) was estimated at US$0.0942 in Asia, US$0.13 in Africa and US$0.273 in Latin America and the Caribbean. To calculate the annual cost per person, the estimate assumed 20L of treated water per person per day, or 7300L per year, requiring 7.3L bottles of chorine. This was grossed up to 8.76 bottles to allow for 20% wastage. Multiplying the number of bottles per person per year times the annual cost yields an estimated cost per person per year of US$0.83 in Asia, US$1.14 in Africa, US$2.39 in Latin America.10 As can be seen, these estimates include only hardware costs. Curiously, the intervention is described in the WHO CHOICE database11 as “disinfection at point of use with education” (emphasis added.) However, the cost estimates do not include any costs associated with education.
The WHO CHOICE database has some information on cost of selected generic inputs used in
health interventions. For example, the database has information on the costs of personnel at various levels of responsibility, cost of warehouse and office facilities, vehicle and other transportation costs, media costs, and the cost of certain commodities. These represent an important resource for determining how local costs may differ from global, regional or other national estimates. However, in order to use such costs in a CEA, it is necessary to know the quantities of all such inputs required for the intervention.
10 These figures are derived from the spreadsheets supporting the WHO-CHOICE cost-effectiveness estimates. They can be found on the WHO-CHOICE database for each of the epidemiological sub-regions: http://www3.who.int/whosis/cea/cea_results_prog_costs.cfm?intInterventionID=50409 . 11 http://www3.who.int/whosis/menu.cfm?path=whosis,cea,cea_prices&language=english
14
For all of these reasons, the accuracy and completeness of existing cost information on household-based interventions was deemed inadequate to serve as the basis for a rigorous CEA. Accordingly, the starting point for this CEA was to solicit the cost information directly from those involved in the implementation of programs involving such interventions. Detailed guidelines and a worksheet were developed by the authors in consultation with B. Johns of WHO in order to ensure the consistent accumulation and reporting of costs and cost offsets (savings) (Clasen 2006a). The worksheet also requested specific information on quantities as well as costs. This was designed to provide analysts with the opportunity to calculate costs in different countries based on the local costs for the inputs necessary to implement the intervention. In December 2004, the guidelines and worksheet were sent to 12 implementers of household-based water treatment interventions identified by surveys conducted by the International Network to Promote Household Water Treatment and Safe Storage. Numerous exchanges with the programme implementers and their field personnel ultimately yielded cost information that was sufficient for purposes of this analysis. Ultimately, the cost data used in this analysis was derived from (i) household-based chlorination programmes in 17 countries using the CDC-developed Safe Water System (SWS) as implemented by Population Health Services (PSI), (ii) four ceramic filter programmes implemented by different NGOs, two using commercial, candle filters and two using locally-fabricated pot-style filters, (iii) solar disinfection programmes in 13 countries using the Sodis method as implemented by Sendec-EAWAG partners, and (iv) combined flocculation-disinfection sachets in five countries using PUR® sachets manufactured and distributed by Procter & Gamble Company. Complete details on the sources of cost information and the manner for calculating the point estimate and range of costs is described elsewhere (Clasen 2006a).
For purposes of CEA, costs are usually divided between programme costs and patient or
individual costs. Programme costs incorporate all resources used to start up and maintain the intervention over the period of implementation. Programme costs include administrative and technical personnel needed to develop and run the programme, materials and supplies, media, transport and capital items such as vehicles and office space (Johns 2003). Individual costs are those out of pocket expenditures incurred by the targeted population at the point of delivery.
Under the WHO CHOICE procedure, programme costs are reported at the national, regional,
community and household level, while individual costs are reported at the household level only. Confusion may arise as to whether certain costs incurred at the household level should be reported as programme costs or individual costs. Where a programme itself pays the cost of an item deployed in the household (e.g., a filter) and provides the same to the householder free of charge without any reimbursement or payment by the household, it is reported only as a programme cost at the household level. On the other hand, if the householder is required to pay all or a part of the cost of the item, the amount paid by the household was reported as an individual cost. Any subsidy or other non-reimbursed portion of the item must still be reported as a programme cost.
In collecting information on costs, it is also useful to include data on cost offsets that have been
demonstrated as a result of the implementation of the intervention. In the context of water quality interventions, these typically involve two categories of economic savings: health costs and other household savings. Health costs averted include health sector and patient costs saved due to less treatment of diarrhoeal diseases. This information was gathered from WHO's database on coverage and effectiveness. Improvements in water supply may offer time savings in collecting water, while both source and household-based interventions may also offer savings when introduced as an alternative, say, to boiling (potential savings in fuel expenditures and time to collect/procure wood or other fuel for boiling water) or purchasing drinking water. The guidelines and worksheet sought information from programme implementers on such non-health cost offsets.
15
Cost-It (cost intervention templates) is a software programme developed by WHO-CHOICE to record and analyze cost data. Set up as a spreadsheet into which cost information can be inserted, the programme automatically calculates the economic cost of interventions. Among other things, Cost-It includes macros for converting costs from any given year into a base year chosen by the analyst; it also allows costs to be adjusted for different levels of capacity. The software may be downloaded from the WHO-CHOICE website. User guides are also available.
Finally, it is noted that under the “societal” perspective used in generalized CEA, all costs related
to the intervention are included in the analysis, regardless of whether they are incurred by a governmental ministry, the government, a donor, a programme implementer or the beneficiary. Such a perspective is consistent with notions of economic efficiency and more readily allows interventions to be compared on the basis of cost-effectiveness, regardless of the party responsible for payment. At the same time, analysts must note that some interventions may be better suited than others for full or partial cost recovery. Thus, as described more fully below, certain water quality interventions, such as bottles of sodium hypochlorite, may consist of products or services for which the users pay all or part of the cost, while others, such as communal tapstands, are paid for by the government. From a societal perspective, the cost of such interventions may be similar, and the CEA may thus yield a similar cost-effectiveness ratio. However, from the governmental or householder perspective, these interventions will have significantly different “costs” due to the different allocation of responsibility for payment. This must, of course, be considered in the overall analysis of the options. 2.6 Presenting and Interpreting the Results
Once the cost of each intervention is estimated per person per year, it is simply a matter of
multiplication to determine the aggregate cost of extending that intervention at a given level of coverage over a given population. The model makes adjustment for economies of scale. That aggregate cost is then divided by the number of DALYs averted in that population to determine the CER (cost per DALY averted). In presenting the results, future costs and health effects are typically discounted to reflect their present values (Tan-Torres 2003). Subject to the discussion below regarding sensitivity analysis, WHO-CHOICE recommends discounting both costs and health effects by 3%. Results are reported for the actual cost estimate as well as the range.
Results of a comparison of mutually-exclusive interventions can be compared graphically and/or
in tabular format. Interventions that are more costly and less effective than other choices (in economic terms, “dominated”) are excluded from the presentation. On a graph, intervention costs are shown on the y-axis and health benefits on the x-axis. Average cost-effectiveness for each intervention is represented by the slope of the line joining that intervention and the currently delivered intervention or the null. Incremental cost effectiveness is shown by the slope of the line joining the proposed intervention with the next most cost-effective intervention. In tabular format, the results of a generalized CEA are presented in a single league table of mutually exclusive interventions, beginning with the intervention with the lowest average cost-effectiveness ratio (the lowest slope in the figure of cost against benefits). Non-dominated interventions then appear in succession based on their CERs. This presentation readily shows the health maximizing alternative based on the available budget.
The Commission on Macroeconomics and Health (CMH) has defined interventions that have a
cost-effectiveness ratio of less than three times the gross domestic product (GDP) per capita as “cost-effective” (CMH 2001).12 Interventions that avert a DALY (or, conversely, gain a healthy life year, or
12 The World Bank’s 1993 World Development Report established a threshold of US$150/DALY averted based on then current data. Thus, CERs under US$150 per DALY averted were considered cost effective. While this threshold is still cited, a threshold based on national GDP is more useful in guiding national decisions.
16
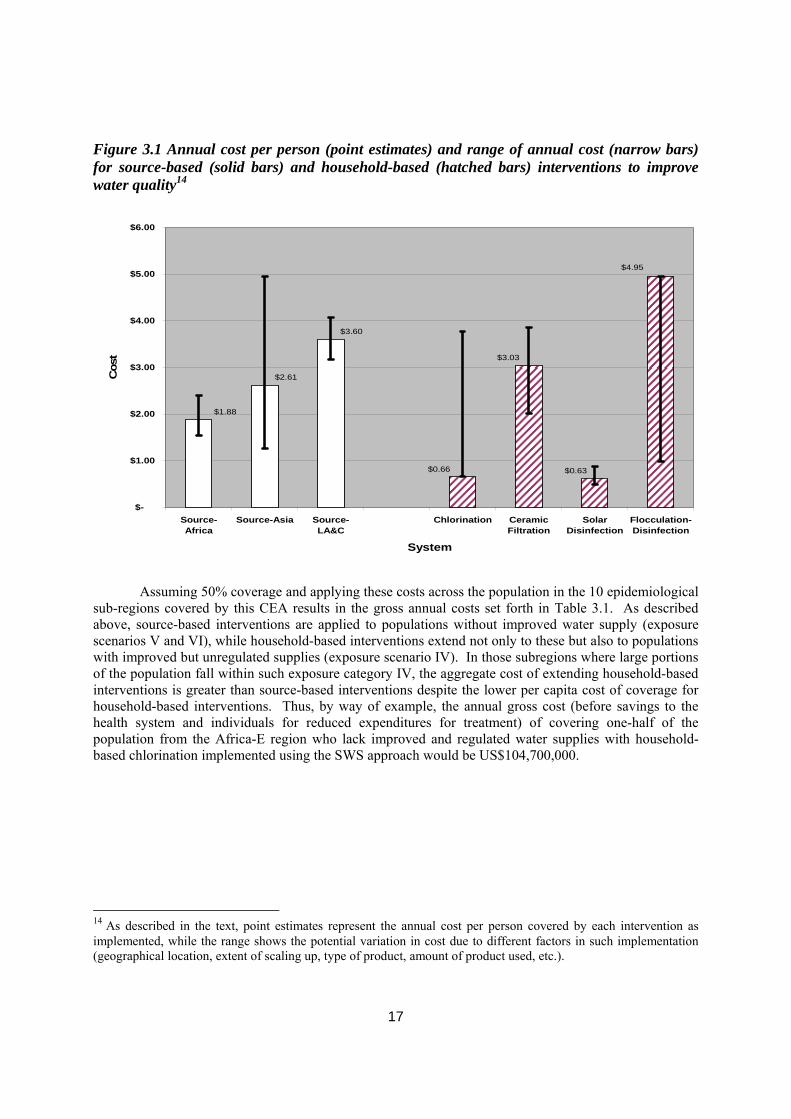
HLY) at a cost that is less than the gross domestic product (GDP) per capita are defined as “very cost effective”, and those that avert a DALY at a cost less than 3 times this amount are considered “cost effective”. Interventions whose CERs are higher than this are considered “not cost effective.” 3. RESULTS 3.1 Costs 13 Figure 3.1 reflects the overall cost estimates to be used in the cost-effectiveness analysis. The figure sets forth the point estimate as well as the range in cost. As described above, the point estimate for household-based interventions represents the best available estimate of the true annual cost per person covered by the intervention, while the range reflects certain variations in such cost. For chlorination, we used the low end of the range as this represents that cost of a fully implemented programme that has demonstrated actual economies of scale. For ceramic filtration, the point estimate represents the the mean cost between higher cost commercial candles and lower cost locally fabricated candles. For solar disinfection the point estimate represents the mean of the cost of programme implementation, and generally reflects differences in bottle cost in the various implementation sites. Finally, for flocculation disinfection, we used the higher cost of its range as this reflects implementation using 5 sachets per household per week (similar to that used in the effectiveness trials) even though there is evidence that some householders use as few as one sachet per week (the lower end of the cost range shown in Figure 3.1). There were insufficient data to present household-based interventions on a regional basis. The point estimates for the source-based estimates represent the mean of the three geographical regions and the range represents the highest and lowest cost based on those geographical estimates. It is important to recognize that the basis for the range thus differs depending on the intervention.
13 In this Section 4.1, unless otherwise noted, the symbol “$” refers to year 2002 US dollars.
17
Figure 3.1 Annual cost per person (point estimates) and range of annual cost (narrow bars) for source-based (solid bars) and household-based (hatched bars) interventions to improve water quality14
$0.66
$1.88
$2.61
$3.60
$3.03
$0.63
$4.95
$-
$1.00
$2.00
$3.00
$4.00
$5.00
$6.00
Source-Africa
Source-Asia Source-LA&C
Chlorination CeramicFiltration
SolarDisinfection
Flocculation-Disinfection
System
Cos
t
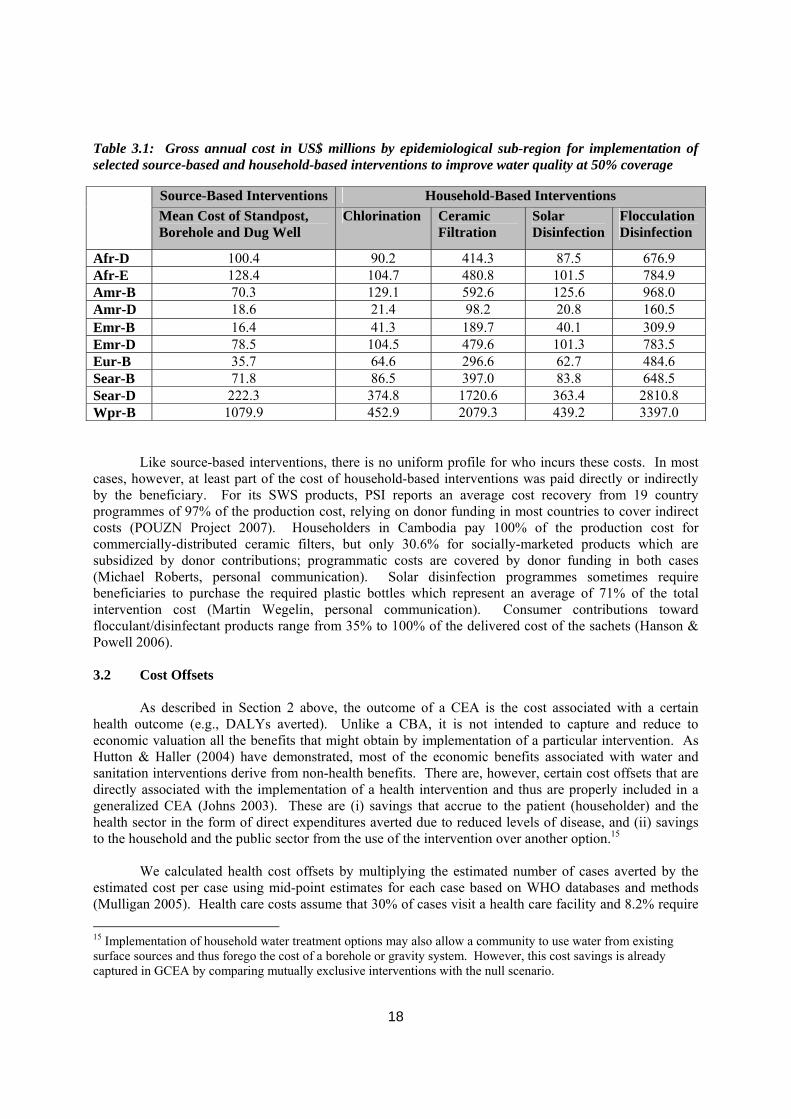
Assuming 50% coverage and applying these costs across the population in the 10 epidemiological sub-regions covered by this CEA results in the gross annual costs set forth in Table 3.1. As described above, source-based interventions are applied to populations without improved water supply (exposure scenarios V and VI), while household-based interventions extend not only to these but also to populations with improved but unregulated supplies (exposure scenario IV). In those subregions where large portions of the population fall within such exposure category IV, the aggregate cost of extending household-based interventions is greater than source-based interventions despite the lower per capita cost of coverage for household-based interventions. Thus, by way of example, the annual gross cost (before savings to the health system and individuals for reduced expenditures for treatment) of covering one-half of the population from the Africa-E region who lack improved and regulated water supplies with household-based chlorination implemented using the SWS approach would be US$104,700,000.
14 As described in the text, point estimates represent the annual cost per person covered by each intervention as implemented, while the range shows the potential variation in cost due to different factors in such implementation (geographical location, extent of scaling up, type of product, amount of product used, etc.).
18
Table 3.1: Gross annual cost in US$ millions by epidemiological sub-region for implementation of selected source-based and household-based interventions to improve water quality at 50% coverage
Like source-based interventions, there is no uniform profile for who incurs these costs. In most cases, however, at least part of the cost of household-based interventions was paid directly or indirectly by the beneficiary. For its SWS products, PSI reports an average cost recovery from 19 country programmes of 97% of the production cost, relying on donor funding in most countries to cover indirect costs (POUZN Project 2007). Householders in Cambodia pay 100% of the production cost for commercially-distributed ceramic filters, but only 30.6% for socially-marketed products which are subsidized by donor contributions; programmatic costs are covered by donor funding in both cases (Michael Roberts, personal communication). Solar disinfection programmes sometimes require beneficiaries to purchase the required plastic bottles which represent an average of 71% of the total intervention cost (Martin Wegelin, personal communication). Consumer contributions toward flocculant/disinfectant products range from 35% to 100% of the delivered cost of the sachets (Hanson & Powell 2006). 3.2 Cost Offsets As described in Section 2 above, the outcome of a CEA is the cost associated with a certain health outcome (e.g., DALYs averted). Unlike a CBA, it is not intended to capture and reduce to economic valuation all the benefits that might obtain by implementation of a particular intervention. As Hutton & Haller (2004) have demonstrated, most of the economic benefits associated with water and sanitation interventions derive from non-health benefits. There are, however, certain cost offsets that are directly associated with the implementation of a health intervention and thus are properly included in a generalized CEA (Johns 2003). These are (i) savings that accrue to the patient (householder) and the health sector in the form of direct expenditures averted due to reduced levels of disease, and (ii) savings to the household and the public sector from the use of the intervention over another option.15 We calculated health cost offsets by multiplying the estimated number of cases averted by the estimated cost per case using mid-point estimates for each case based on WHO databases and methods (Mulligan 2005). Health care costs assume that 30% of cases visit a health care facility and 8.2% require 15 Implementation of household water treatment options may also allow a community to use water from existing surface sources and thus forego the cost of a borehole or gravity system. However, this cost savings is already captured in GCEA by comparing mutually exclusive interventions with the null scenario.
Source-Based Interventions Household-Based Interventions Mean Cost of Standpost, Borehole and Dug Well
Chlorination Ceramic Filtration
Solar Disinfection
Flocculation Disinfection
Afr-D 100.4 90.2 414.3 87.5 676.9 Afr-E 128.4 104.7 480.8 101.5 784.9 Amr-B 70.3 129.1 592.6 125.6 968.0 Amr-D 18.6 21.4 98.2 20.8 160.5 Emr-B 16.4 41.3 189.7 40.1 309.9 Emr-D 78.5 104.5 479.6 101.3 783.5 Eur-B 35.7 64.6 296.6 62.7 484.6 Sear-B 71.8 86.5 397.0 83.8 648.5 Sear-D 222.3 374.8 1720.6 363.4 2810.8 Wpr-B 1079.9 452.9 2079.3 439.2 3397.0
19
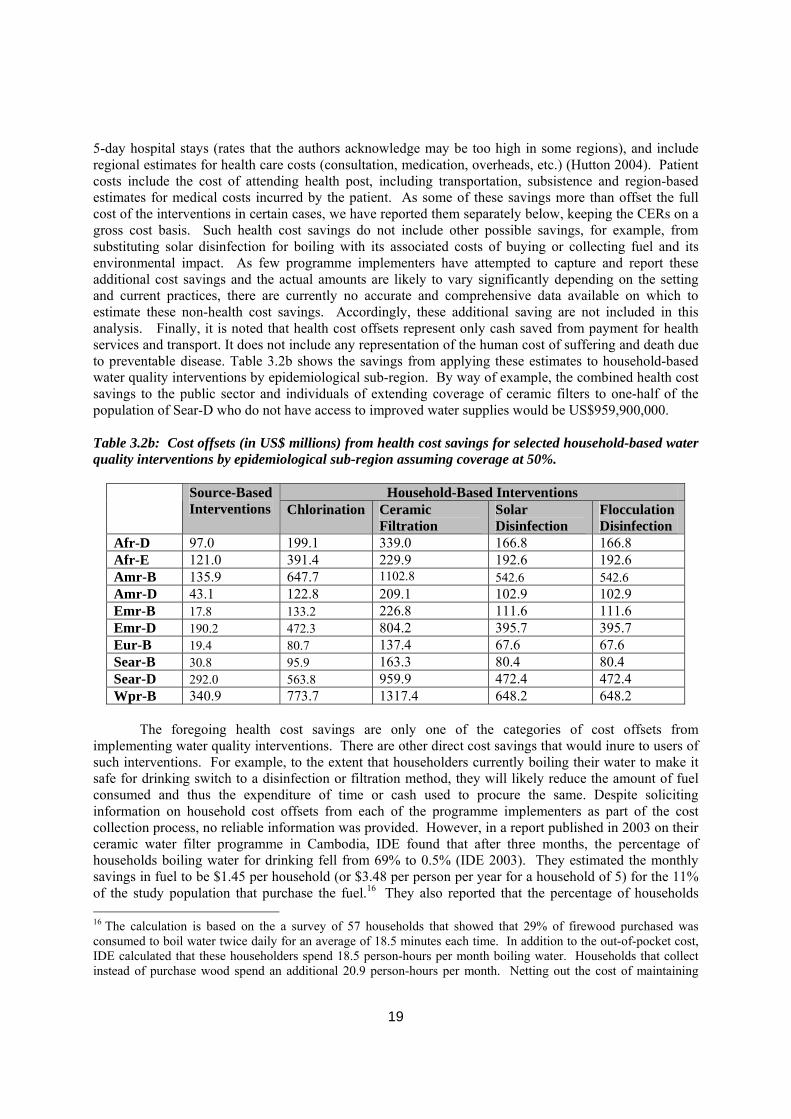
5-day hospital stays (rates that the authors acknowledge may be too high in some regions), and include regional estimates for health care costs (consultation, medication, overheads, etc.) (Hutton 2004). Patient costs include the cost of attending health post, including transportation, subsistence and region-based estimates for medical costs incurred by the patient. As some of these savings more than offset the full cost of the interventions in certain cases, we have reported them separately below, keeping the CERs on a gross cost basis. Such health cost savings do not include other possible savings, for example, from substituting solar disinfection for boiling with its associated costs of buying or collecting fuel and its environmental impact. As few programme implementers have attempted to capture and report these additional cost savings and the actual amounts are likely to vary significantly depending on the setting and current practices, there are currently no accurate and comprehensive data available on which to estimate these non-health cost savings. Accordingly, these additional saving are not included in this analysis. Finally, it is noted that health cost offsets represent only cash saved from payment for health services and transport. It does not include any representation of the human cost of suffering and death due to preventable disease. Table 3.2b shows the savings from applying these estimates to household-based water quality interventions by epidemiological sub-region. By way of example, the combined health cost savings to the public sector and individuals of extending coverage of ceramic filters to one-half of the population of Sear-D who do not have access to improved water supplies would be US$959,900,000.
Table 3.2b: Cost offsets (in US$ millions) from health cost savings for selected household-based water quality interventions by epidemiological sub-region assuming coverage at 50%.
Household-Based Interventions Source-Based Interventions Chlorination Ceramic
Filtration Solar Disinfection
Flocculation Disinfection
Afr-D 97.0 199.1 339.0 166.8 166.8 Afr-E 121.0 391.4 229.9 192.6 192.6 Amr-B 135.9 647.7 1102.8 542.6 542.6 Amr-D 43.1 122.8 209.1 102.9 102.9 Emr-B 17.8 133.2 226.8 111.6 111.6 Emr-D 190.2 472.3 804.2 395.7 395.7 Eur-B 19.4 80.7 137.4 67.6 67.6 Sear-B 30.8 95.9 163.3 80.4 80.4 Sear-D 292.0 563.8 959.9 472.4 472.4 Wpr-B 340.9 773.7 1317.4 648.2 648.2
The foregoing health cost savings are only one of the categories of cost offsets from implementing water quality interventions. There are other direct cost savings that would inure to users of such interventions. For example, to the extent that householders currently boiling their water to make it safe for drinking switch to a disinfection or filtration method, they will likely reduce the amount of fuel consumed and thus the expenditure of time or cash used to procure the same. Despite soliciting information on household cost offsets from each of the programme implementers as part of the cost collection process, no reliable information was provided. However, in a report published in 2003 on their ceramic water filter programme in Cambodia, IDE found that after three months, the percentage of households boiling water for drinking fell from 69% to 0.5% (IDE 2003). They estimated the monthly savings in fuel to be $1.45 per household (or $3.48 per person per year for a household of 5) for the 11% of the study population that purchase the fuel.16 They also reported that the percentage of households 16 The calculation is based on the a survey of 57 households that showed that 29% of firewood purchased was consumed to boil water twice daily for an average of 18.5 minutes each time. In addition to the out-of-pocket cost, IDE calculated that these householders spend 18.5 person-hours per month boiling water. Households that collect instead of purchase wood spend an additional 20.9 person-hours per month. Netting out the cost of maintaining
20
purchasing water for drinking fell from 9% to 0%, resulting in mean savings of $2.11 per household per month ($5.06 per person per year) for such households. These data suggest that there are direct savings at the household level from implementing interventions to improve water quality. These are in addition to the obvious indirect benefits (mainly time savings in collecting water) that accrue from source-based interventions such as new stand posts and wells, as reported in CBAs (e.g., Hutton & Haller 2004). Nevertheless, estimating these cost offsets is problematic. As the IDE data suggest, even estimating the savings from converting from boiling water to another household water treatment option would require assumptions regarding fuel costs, fuel expended exclusively for boiling water, portion of populations currently boiling, etc. These are likely to vary dramatically from one country or region to another. While such information could be collected household in surveys under the Joint Monitoring Program (JMP), accurate and comprehensive data are not currently available. Moreover, for many populations, boiling is not practised for reasons of culture, acceptability, affordability, or a lack of understanding of the potential benefits, even if actively promoted (Wellin 1955; White 1972; Gilman 1985). Thus, even estimating the portion of a given population that follows the practice would be difficult. Even less information is available on expenditures on vendor-supplied water, bottled water and tankered water or the extent to which expenditures on such supplies may be reduced as a result of the introduction of one of the subject water quality interventions.17 Accordingly, while it is important to recognize the likelihood of such non-health cost savings when interpreting the results, no attempt is made to include them in this CEA. Subtracting these cost offsets to the costs at the 50% coverage level (from Table 3.1.6) yields the net costs estimates shown in Table 3.2c. In most cases the cost offsets more than cover the cost outlays from the implementation of the intervention, thus resulting in net negative costs (i.e., income). To the extent that these health costs are incurred by the public sector, implementing these interventions would save governments money even if the public sector were to pay the full cost of such implementation. This is emphasized in the discussion below. In keeping with convention, however, the analysis of cost-effectiveness ratios (CERs) and the comparison of such CERs below are made on the basis of the gross rather than net cost of the interventions.
their filters, this resulted in time savings from using filters to be 15.9 person hours per month for firewood purchasers and 22.0 person hours per month for firewood collectors. However, unlike direct savings from reduced out-of-pocket expenses, these indirect time savings are not included in a CEA. 17 These are critical questions, since in some respects, they define the market for interventions to improve water quality, and thus allow for potential investors to determine the risk-adjusted returns available. For an example of how this information was defined for long-lasting insecticidal nets, see WHO (2004).
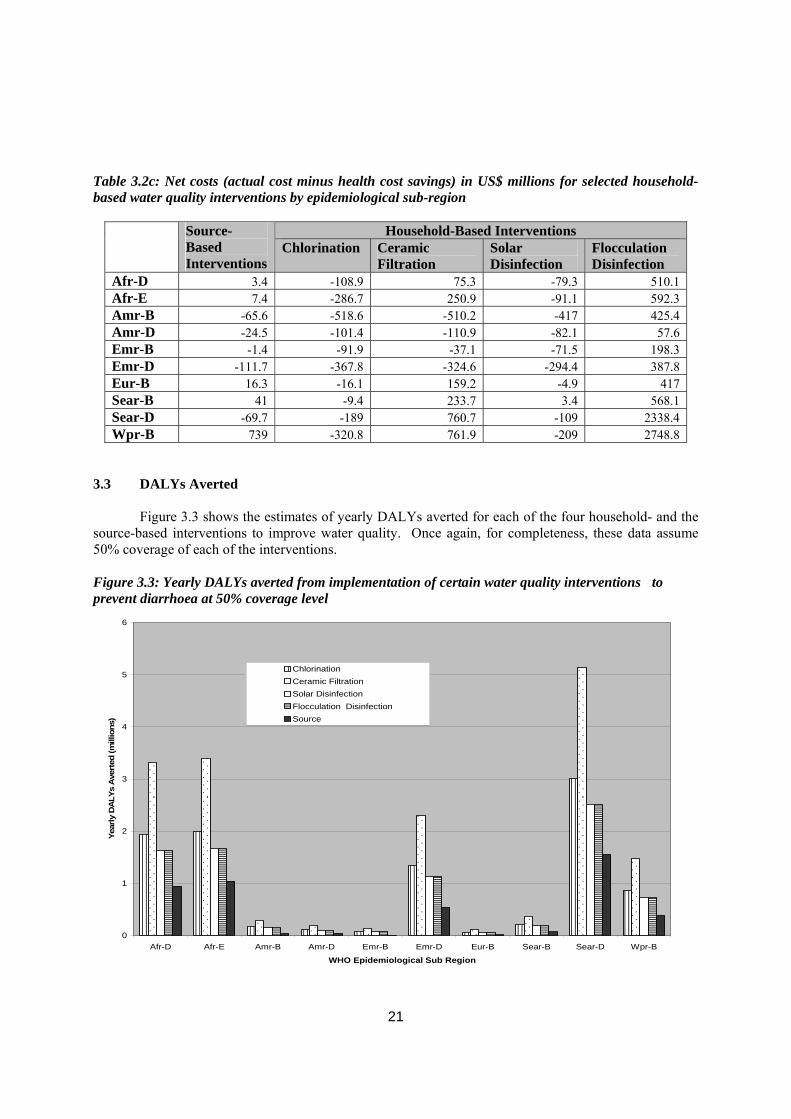
21
Table 3.2c: Net costs (actual cost minus health cost savings) in US$ millions for selected household-based water quality interventions by epidemiological sub-region
Household-Based Interventions Source-Based Interventions
Chlorination Ceramic Filtration
Solar Disinfection
Flocculation Disinfection
Afr-D 3.4 -108.9 75.3 -79.3 510.1 Afr-E 7.4 -286.7 250.9 -91.1 592.3 Amr-B -65.6 -518.6 -510.2 -417 425.4 Amr-D -24.5 -101.4 -110.9 -82.1 57.6 Emr-B -1.4 -91.9 -37.1 -71.5 198.3 Emr-D -111.7 -367.8 -324.6 -294.4 387.8 Eur-B 16.3 -16.1 159.2 -4.9 417 Sear-B 41 -9.4 233.7 3.4 568.1 Sear-D -69.7 -189 760.7 -109 2338.4 Wpr-B 739 -320.8 761.9 -209 2748.8
3.3 DALYs Averted
Figure 3.3 shows the estimates of yearly DALYs averted for each of the four household- and the source-based interventions to improve water quality. Once again, for completeness, these data assume 50% coverage of each of the interventions.
Figure 3.3: Yearly DALYs averted from implementation of certain water quality interventions to prevent diarrhoea at 50% coverage level
0
1
2
3
4
5
6
Afr-D Afr-E Amr-B Amr-D Emr-B Emr-D Eur-B Sear-B Sear-D Wpr-B
WHO Epidemiological Sub Region
Year
ly D
ALY
s A
vert
ed (m
illio
ns)
ChlorinationCeramic FiltrationSolar DisinfectionFlocculation DisinfectionSource
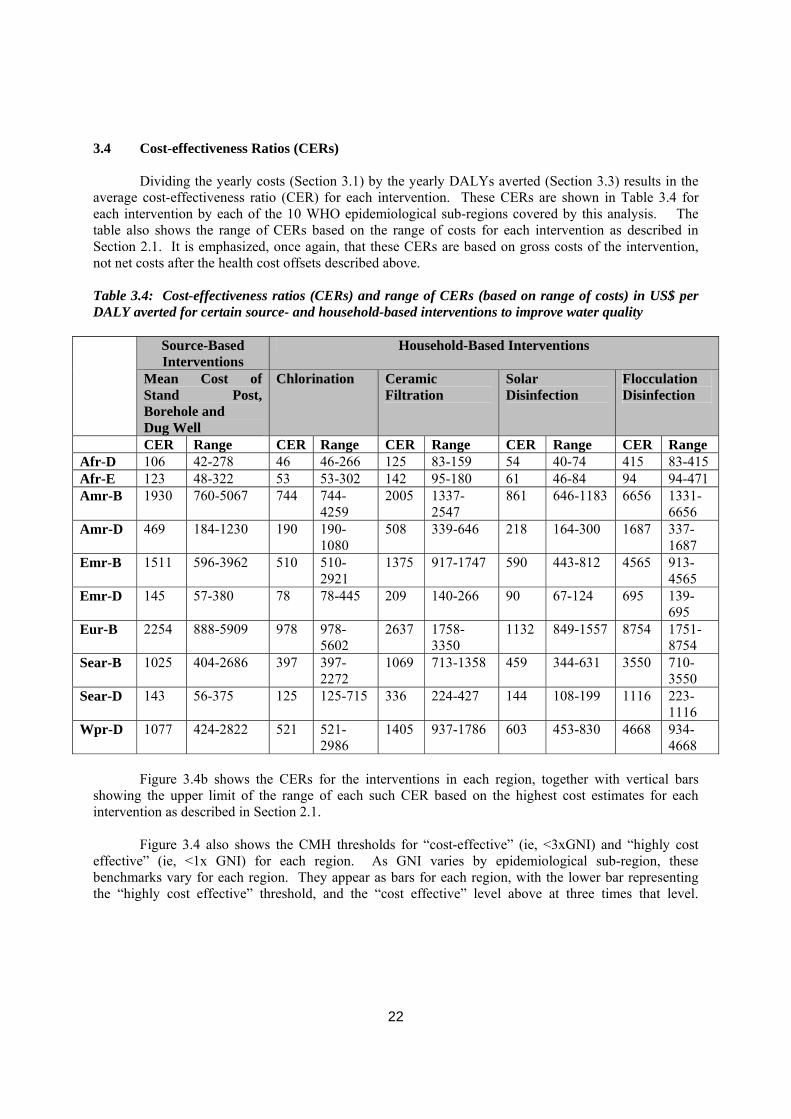
22
3.4 Cost-effectiveness Ratios (CERs)
Dividing the yearly costs (Section 3.1) by the yearly DALYs averted (Section 3.3) results in the average cost-effectiveness ratio (CER) for each intervention. These CERs are shown in Table 3.4 for each intervention by each of the 10 WHO epidemiological sub-regions covered by this analysis. The table also shows the range of CERs based on the range of costs for each intervention as described in Section 2.1. It is emphasized, once again, that these CERs are based on gross costs of the intervention, not net costs after the health cost offsets described above.
Table 3.4: Cost-effectiveness ratios (CERs) and range of CERs (based on range of costs) in US$ per DALY averted for certain source- and household-based interventions to improve water quality
Source-Based Interventions
Household-Based Interventions
Mean Cost of Stand Post, Borehole and Dug Well
Chlorination Ceramic Filtration
Solar Disinfection
Flocculation Disinfection
CER Range CER Range CER Range CER Range CER Range Afr-D 106 42-278 46 46-266 125 83-159 54 40-74 415 83-415 Afr-E 123 48-322 53 53-302 142 95-180 61 46-84 94 94-471 Amr-B 1930 760-5067 744 744-
4259 2005 1337-
2547 861 646-1183 6656 1331-
6656 Amr-D 469 184-1230 190 190-
1080 508 339-646 218 164-300 1687 337-
1687 Emr-B 1511 596-3962 510 510-
2921 1375 917-1747 590 443-812 4565 913-
4565 Emr-D 145 57-380 78 78-445 209 140-266 90 67-124 695 139-
695 Eur-B 2254 888-5909 978 978-
5602 2637 1758-
3350 1132 849-1557 8754 1751-
8754 Sear-B 1025 404-2686 397 397-
2272 1069 713-1358 459 344-631 3550 710-
3550 Sear-D 143 56-375 125 125-715 336 224-427 144 108-199 1116 223-
1116 Wpr-D 1077 424-2822 521 521-
2986 1405 937-1786 603 453-830 4668 934-
4668 Figure 3.4b shows the CERs for the interventions in each region, together with vertical bars showing the upper limit of the range of each such CER based on the highest cost estimates for each intervention as described in Section 2.1. Figure 3.4 also shows the CMH thresholds for “cost-effective” (ie, <3xGNI) and “highly cost effective” (ie, <1x GNI) for each region. As GNI varies by epidemiological sub-region, these benchmarks vary for each region. They appear as bars for each region, with the lower bar representing the “highly cost effective” threshold, and the “cost effective” level above at three times that level.
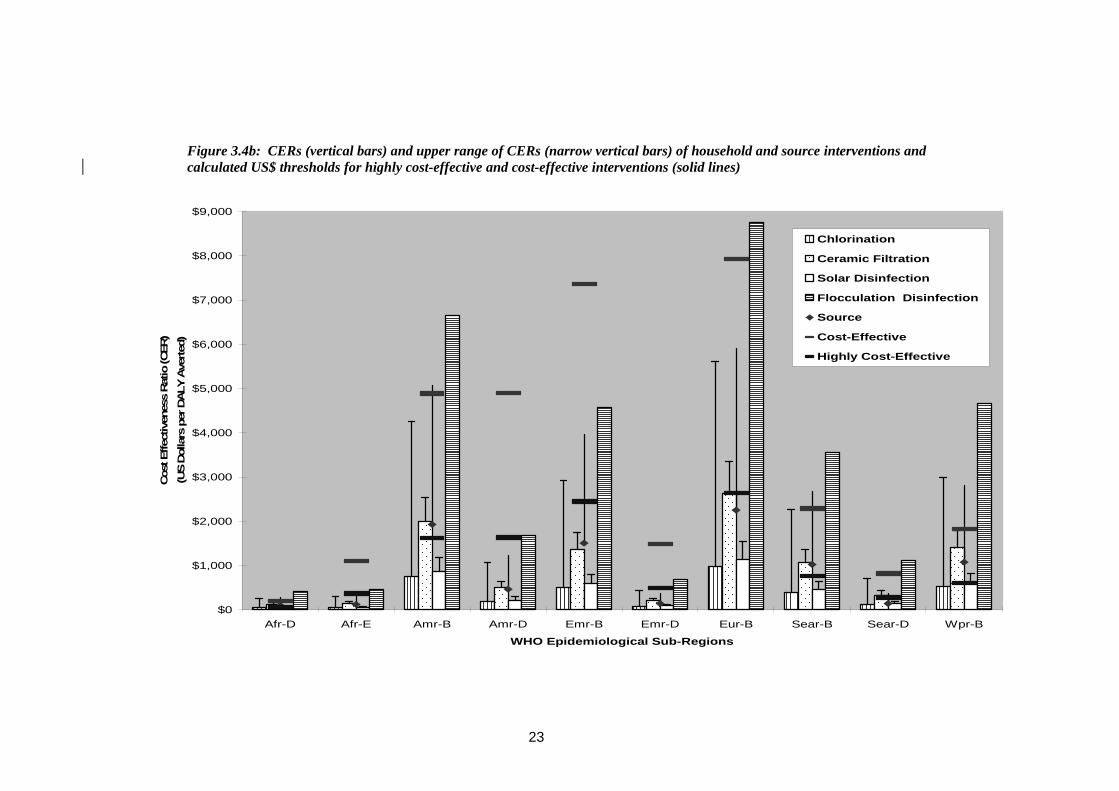
23
Figure 3.4b: CERs (vertical bars) and upper range of CERs (narrow vertical bars) of household and source interventions and calculated US$ thresholds for highly cost-effective and cost-effective interventions (solid lines)
$0
$1,000
$2,000
$3,000
$4,000
$5,000
$6,000
$7,000
$8,000
$9,000
Afr-D Afr-E Amr-B Amr-D Emr-B Emr-D Eur-B Sear-B Sear-D Wpr-B
WHO Epidemiological Sub-Regions
Cos
t Effe
ctiv
enes
s Rat
io (C
ER)
(US
Dol
lars
per
DALY
Ave
rted
)
Chlorination
Ceramic Filtration
Solar Disinfection
Flocculation Disinfection
Source
Cost-Effective
Highly Cost-Effective
24
4. DISCUSSION
Among all water quality interventions to prevent diarrhoea, chlorination (SWS) is the most cost-effective, a finding that is consistent with that reported in the WHO World Health Report (WHO 2002). While a recent CEA of home-based chlorination among HIV-affected households in Uganda found a significantly higher cost per DALY averted, the authors ascribed the result to lower than expected mortality in the study setting (Shrestha 2006). Solar disinfection is only slightly less cost effective, owing to its almost identical cost but lower overall effectiveness. Both of these interventions meet the Commission on Macroeconomics (CMH) definition for “highly cost effective” in each of the 10 WHO epidemiological sub-regions included in this analysis. Source-based interventions have mean CER about twice that of chlorination and solar disinfection, and would be considered “highly cost effective” in all but three regions (Afr-D, Amr-B, Wpr-B) where is meets the definition of “cost effective”. Ceramic filters represent an opportunity to avert higher levels of DALYs with additional investment. This represents additional costs and benefits (positive incremental CERs) beyond household-based chlorination, and reflects a potential debate over the resources that individual householders or the public sector may want to deploy in order to achieve health returns. The choices could be shown in a league table or graphically by the “expansion path” on a cost-effectiveness plane which plots each of the interventions by cost and effectiveness. Here, the expansion path would begin with household-based chlorination and end with household-based filtration, the other interventions being dominated (i.e., more costly and less effective) by these approaches. Though shown in the systematic review to be the most effective of the household-based interventions in preventing diarrhoea, filtration has a mean CER about 2.5 times higher than chlorination or solar disinfection, owing to its higher cost. This also illustrates how CEA recommends intervention choices that differ from cost alone (in ascending order, solar disinfection, chlorination, source improvement, filtration, flocculation/disinfection) or effectiveness alone (in descending order, filtration, chlorination, solar or combined flocculation disinfection, and source improvement). Combined flocculation-disinfection was strongly dominated by all other interventions except under an assumption in which it can be implemented at its minimum cost. Source-based interventions as well as household-based solar disinfection are weakly dominated by household chlorination and household filtration at their respective point estimates for cost and effectiveness, but such dominance is lost when comparing interventions at their respective ranges of effectiveness and cost. In addition to this uncertainty about their actual cost-effectiveness, there are other reasons not to rule out these interventions completely or to choose among options solely on the basis of cost-effectiveness. First, not all interventions are equally suitable under all circumstances. Household interventions may not be an effective alternative to source-improvements when water quantities are inadequate (Clasen 2006). Household chlorination may not be suitable in settings where the water contains a high level of turbidity or chlorine-resistant pathogens, challenges for which the flocculant/disinfectant was specifically designed (Souter 2003). Second, source-based interventions yield important benefits in terms of convenience and improved productivity that are not measured in this CEA (Hutton & Haller 2004). Third, user preferences may be more important than cost and effectiveness in scaling up these interventions on a sustainable basis (DuBois 2003).
Direct cost offsets, even if limited to the WHO estimates of health cost savings, more than
offset the costs implementing household-based water quality interventions. This means that governments, who are chiefly incurring such costs, would reduce their overall outlays by investing in the implementation of such interventions rather than in the treatment of cases of diarrhoeal disease. While a finding of such negative costs (i.e., income) are not uncommon in CEAs with high DALYs averted for relatively low costs, it should be noted that these estimates include only health costs offsets, and not other
25
savings that are likely to inure to householders as they begin to adopt household water treatments, such as reduced fuel costs. As a cost-effectiveness rather than cost-benefit analysis, this study also omits the economic value of other benefits (including time savings) that have been shown to ensue from improvements in water supplies (Hutton & Haller 2004).
Insofar as this CEA is based on effectiveness data which concerns only the prevention of diarrhoeal diseases, it does not address diseases such as typhoid, hepatitis A and E and polio that may be transmitted by the ingestion of unsafe water but whose pathology does not consist of diarrhoea. While the burden of disease associated with diarrhoea dwarfs any other waterborne disease, these other diseases cannot be ignored. Moreover, because the systematic review on which the effectiveness data in this CEA was based was limited to endemic diarrhoea, the impact of such interventions on epidemic diarrhoea will not be included in the DALYs averted. In these respects, this CEA understates the true cost-effectiveness of such interventions. Finally, by assuming the all inclusive “societal perspective” in determining costs, this CEA does not address the important issue of who pays for the intervention. While only limited information on cost recovery was available, certain programmes have required contributions from the beneficiaries. Studies suggest that beneficiaries will pay at least a portion of the cost of both source- and household-based interventions (Harris 2005; Hutton 2000). This potential for cost recovery could have important implications regarding the net cost of implementing these interventions. It may also present important advantages in terms of financing, sustainability and scalability. 5. CONCLUSIONS, LIMITATIONS AND QUALIFICATIONS The disciplined application of cost-effectiveness analysis yields results that policy makers can find compelling. Complex choices among sector priorities and individual interventions seem to be magically resolved when plotted on a graph showing cost against health gains or when summarized in stochastic league tables. Generalized CEA is a powerful tool and can play an important role in formulating policy. By providing a means of comparing a set of interventions, generalized CEA can help set national priorities at both the programme and sectoral level. This should result in improved economic efficiency for the health system overall. Generalized CEA can also help inform decisions about targeting, combining, scaling up and financing interventions. It can also help guide research and development priorities. By drawing on the WHO-CHOICE database, national governments can also obtain access to evidenced-based cost and effectiveness data on emerging interventions and technologies (Tan-Torres Edejer 2003). At the same time, it is important to understand the limitations of CEA. Chief among these is the uncertainty that underlies the apparent precision of the results. Uncertainty arises in three areas (Tan-Torres Edejer 2003). First, there is parameter uncertainty due to sample variation around the estimates used to develop a CER and the assumptions used in the analysis (e.g., the discount rate). Second, there is model uncertainty, particularly arising from the lack of data on the cost and effectiveness of joint or multiple interventions. Third, there is generalisability uncertainty associated with the need to extrapolate the data from individual programs and trials to target populations as a whole. All of these sources of uncertainty are present in CEAs of household water treatment interventions, but so are others such as imprecise estimates of cost and effectiveness. While sensitivity analysis and probabilistic uncertainty analysis can be used to quantify this uncertainty to some extent, and thus allow analysts to report a range around a CER, policymakers will often fail to appreciate the uncertainty or understand how to interpret results when uncertainty intervals overlap. The WHO-CHOICE MDG Team perhaps puts this uncertainty most clearly in its recent series: “For cross disease analysis, we believe it is not possible to recommend that an intervention shown to cost $45 per DALY averted is more efficient than one costing $60, given
26
the nature of the uncertainties. However, we are much more confident that $45 per DALY is better than $450 per DALY” (Evans 2005). Analysts have a special duty to present their findings in a manner that does not overstate their precision or conclusiveness. The uncertainty associated with CEAs can be reduced with more reliable data. In the case of household-based interventions to improve water quality, all three types of uncertainty could be reduced by collecting more complete data at the household level on demographics, water and sanitation facilities, current water treatment and other handling practices, hygiene behaviour, access to household-based intervention technologies, the acceptability and affordability of such technologies, and the prevalence and patterns of diarrhoea and other diseases associated with waterborne pathogens. This information could potentially be solicited as part of the existing international household surveys conducted by the USAID-supported Demographic and Health Surveys (DHS) and the UNICEF-supported Multiple Indicator Cluster Surveys (MICS) (Ezzati 2005). More complete and accurate information on the costs of implementing household-based water treatment interventions, particularly over the long term, can be obtained by providing programme implementers with the tools and means of recording and sharing cost data, and encouraging them to do so, perhaps with support (and pressure) by funders. The WHO-backed International Network to Promote Household Water Treatment and Safe Storage is advancing this effort through research, advocacy and actual implementation (www.who.int/household_water). Finally, as suggested by the Cochrane review, assumptions used to estimate the effectiveness of water quality interventions to prevent diarrhoea must be enhanced by conducting rigorous, long-term, multi-arm trials in different settings that can help reduce or identify the sources of heterogeneity that characterize current pooled estimates. The WHO recommends three other means of dealing with the uncertainty associated with CEAs. Uncertainty relating to variables that carry value judgements should be subjected to one-way and, if appropriate, two-way sensitivity analysis. While WHO-CHOICE defaults to a 3% discount rate for both costs and health effects, with age-weighting, analysts are urged to examine the sensitivity of results by using 0% discounting for health effects, 6% for costs, and no age weighting. Uncertainty relating to parameter estimates should be quantified by probabilistic uncertainty analysis using Monte Carlo simulations (repeated random draws from the distribution of each key variable to determine the probability distribution of the CER). Finally, stochastic league tables can be used to provide additional information on how to interpret the results in view of the uncertainty. The WHO has developed a software programme, known as MC League, based on Monte Carlo simulations, to help develop the stochastic league table. Like the Cost-It and PopMod programmes, MC League can be downloaded directly from the WHO-CHOICE website. It is anticipated that these steps will be taken, with assistance from WHO, when the foregoing results are prepared and submitted for publication. Finally, in interpreting these results, four qualifications should be noted. First, insofar as the effectiveness data on which this CEA is based concerns only the prevention of diarrhoea, this analysis reports only on the cost-effectiveness of selected interventions to prevent diarrhoea. Thus, it does not address diseases such as typhoid, hepatitis A and E and polio that may be transmitted by the ingestion of unsafe water but whose pathology does not consist of diarrhoea. While the burden of disease associated with diarrhoea dwarfs any other waterborne disease, these other diseases cannot be ignored. Moreover, because the Cochrane review was limited to endemic diarrhoea, the impact of such interventions on epidemic diarrhoea will not be included in the DALYs averted. By the same token all benefits other than health impacts will be ignored below. In these respects, this CEA will understate the true impact of such interventions. Second, the comparison of household-based interventions with conventional improvements in water supplies (household taps, protected wells, rainwater harvesting, etc.) presents at least three potential problems. First, as discussed above, these interventions are in an important sense more than interventions
27
to improve water quality—they also typically increase water quantity and availability. To the extent that quantity and availability impact diarrhoeal disease, this is captured in the effectiveness estimates from the Cochrane review. However, it is likely that increased quantity and access provides other health benefits, such as reducing water-washed diseases such as trachoma, improving personal hygiene thereby further impacting faecal-oral diseases, and saving time which may translate into improved nutrition and attention to risk factors at home (Esrey 1991; Cairncross 2006). Since household-based interventions do not typically increase the quantity or availability of water, they would not offer comparable benefits. Second, because the Cochrane review identified only 6 trials of source interventions, no subgrouping within this category was possible to draw out possibly important differences in the effectiveness of the various types of source-based interventions. Esrey (1991) observed, and Cairncross (2006) recently emphasized with further data, that larger reductions in diarrhoea were achieved from improvements in water supply that piped water into or near the home than those involving protected wells, tubewells or standpipes. As discussed more fully below, household connections are excluded from this CEA since the effectiveness data from the Cochrane review did not include any studies involving interventions to improve household connections (with the arguable exception of Jensen (2003), who introduced chlorine into an existing distribution system that included household connections). For assessments of the cost-effectiveness of household connections, readers are referred to Cairncross (2006). Third, insofar as a CEA addresses only a specific health outcome, it will not encompass the non-health benefits of these conventional improvements in water supply. As Hutton & Haller (2004) concluded in their CBA, most of the benefits associated with improvements in water supply are associated with time savings and improved productivity. Household treatment of drinking water provides few benefits other than health, and as the Cochrane review concluded, even the health benefits are not clearly available in settings where there is not already a minimum level of water quantity available. Thus, while the CEA can help focus attention on optimal solutions to reduce diarrhoea, it must be read with a CBA to understand the overall impact of the possible interventions. Finally, cost and cost-effectiveness, important as they are for setting health priorities, must be considered in the context of other economic and non-economic criteria, especially if the goal is to achieve a sustainable solution by having some or all of the cost of safe drinking water borne by the beneficiaries. Among the other economic criteria are affordability and perceived value. The fact that a point-of-use water treatment product may improve water quality at a lower cost per unit (person, household, day, litre, etc.) than some alternative product may be important to government planners, funders and policy makers. But to consumers being asked to pay for the product, the overriding consideration may be whether they have enough money on hand that day to buy it (Prahalad 2005). Such “ability to pay” may depend not on the cost as determined by economic analysis, but on the price at that time and place that the householder must pay.18 A bottle of dilute sodium hypochlorite that costs $1.50 and can last a family six months has a significantly lower unit cost than a sachet of flocculant/ disinfectant priced at $0.10 and lasting less than a week. Nevertheless, as companies who market to the poor have frequently found, consumers with limited cash may nevertheless prefer the sachets because they find them to be more affordable given their available cash. The minimum purchasable unit and minimum purchases price can sometimes influence the choices of poor consumers more than the unit price. Similarly, consumers’ “willingness to pay” depends largely on their current cash position, other priorities, assessment of the risk to be avoided, perceived utility of the proposed solution, etc., economic factors that are not strictly related to cost (Whittington 1990; Merrett, 2002). Rogers (2004) has shown that non-economic factors, such as compatibility, complexity and observability, also influence consumer attitudes and practices with respect
18 It is well known that lower-income populations pay a “poverty premium” for basic products and services such as water. Prahalad and Hammond (2002), for example, found that the price per unit of volume that the poor in Mumbai’s Dharavi slum pay for water from a vendor was 37 times the municipal price charged in a neighbouring middle-class area receiving piped water.
28
to adoption of an innovative product. Cultural preferences also play a role. Policy makers and programme implementers must consider these factors in addition to basic cost and cost-effectiveness if they expect to secure some measure of cost recovery in scaling up household water treatment.
REFERENCES
Baltussen R, Floyd K, Dye C (2005). Cost-effectiveness analysis of strategies for tuberculosis control in developing countries. BMJ 331:1364-69 Bhatia, Mrigesh; Fox-Rushby, J.; Mills, A (2004). Cost-effectiveness of malaria control interventions in Surat, India: Treated mosquito nets versus in-house residual spraying. Soc.Sci & Med. 59(3): 525-539 Black, R.E. 2001. Diarrheal diseases, in Nelson KE, Masters Williams C, Graham N, Infectious Disease Epidemiology: Theory and Practice. Gaithersburg, MD: Aspen Publisher, Inc. Borghi J, Guinness L, Ouedraogo J, Curtis V (2002). Is hygiene promotion cost-effective? A case study in Burkina Faso. Trop Med Int’l Health 7:960-969 Briscoe J (1984). Intervention studies and the definition of dominant transmission routes. Am. J. Epidemiol. 120(3): 449-55. Briscoe J (1984a). Water supply and health in developing countries: selective primary health care revisited. Am J. Pub. Health 74:1009-1013 Cairncross, S. & Valdmanis, V. 2006. Water supply, sanitation and hygiene promotion. In: Jamison DT, Breman JG, Measham AR et al. (eds.) Disease Control Priorities in Developing Countries. B. J. Jamison DT, Measham AR et al. (eds.). Washington DC: The World Bank, 771-792. Clasen T. 2006a. Household water treatment for the prevention of diarrhoeal disease [PhD dissertation]. University of London, London School of Hygiene & Tropical Medicine. Clasen T, Brown J, Suntura O, Collin S, Cairncross (2004). Reducing diarrhoea through household-based ceramic filtration of drinking water: a randomized, controlled trial in Bolivia. Am J Trop Med Hyg 70(6): 651-7 Clasen T, Haller L, Walker D, Bartram J, Cairncross S (2007). Cost-effectiveness analysis of water quality interventions for preventing diarrhoeal disease in developing countries. J. Water & Health 5(4):599-608 Clasen T, Hoang T, Boisson S, Shippin O (2008). Microbiological effectiveness and cost of boiling to Disinfect drinking water in rural Vietnam: ascertaining the benchmark in household water treatment. Environmental Sci & Tech. (in press) Clasen T, Roberts I, Rabie T, Schmidt W, Cairncross S (2006). Interventions to improve water quality for preventing diarrhoea. (A Cochrane Review). In: The Cochrane Library, Issue 3, 2006. Oxford: Update Software. CMH (2001). Commission on Macroeconomics and Health, Macroeconomics and health: investing in health for economics development. Boston: Center for International Development at Harvard University
29
Doocy S, Burnham G (2006). Point-of-use water treatment and diarrhoea reduction in the emergency context: an effectiveness trial in Liberia. Trop Med Int Health 11, 1542-52. Drummond MF, Jefferson TO (1996). Guidelines for authors and peer reviewers of economic submissions to the BMJ. BMJ 313: 275-283. Dziekan G, Chisholm D, Johns B, Rovira J, Hutin YJF (2003). The Cost-Effectiveness of Policies for the Safe and Appropriate Use of Injection in Health Care Settings, Bull WHO 81: 277-285. Esrey, SA, Feachem RG, Hughes JM (1985). Interventions for the control of diarrhoeal diseases among young children: improving water supplies and excreta disposal facilities. Bull. WHO 64: 776-72. Esrey, S.A., Potash, J.B., Roberts, L. & Shiff, C. 1991. Effects of improved water supply and sanitation on ascariasis, diarrhoea, dracunculiasis, hookworm infection, schistosomiasis, and tracoma. Bull. WHO 69: 609-21. Evans DB, Adam T, Tan-Torres Edejer T, Lim SS, Cassels A, Evans TG (2005a). Time to reassess strategies for improving health in developing countries. BMJ 331:1133-36 Evans DB, Lim SS, Adam T, Tan-Torres T (2005c). Evaluation of current strategies and future proorites for improving health in developing countries. BMJ 331:1140-44 Evans DB, Tan-Torres Edejer T, Adam T, Lim S (2005b). Methods to assess the costs and health effects of interventions for improving health in developing countries. BMJ 331:1137-1140. Ezzati M, Utzinger J, Cairncross S, Cohen AJ, Singer BH (2005). Environmental risks in the developing world: exposure indicators for evaluating interventions, programmes, and policies. J Epidemiol Community Health 59:15-22 Fewtrell L, Kaufmann R, Kay D, Enanoria W, Haller L , Colford J (2005). Water, sanitation, and hygiene interventions to reduce diarrhoea in less developed countries: a systematic review and meta-analysis. Lancet Infect Dis 5: 42-52 Gilman RH, Skillicorn P (1985). Boiling of drinking-water: can a fuel-scarce community afford it? Bull WHO 63:157-163 Gilson L, Mkanje R, Grosskurth H, Mosha F, Picard J, Gavyole A, Todd J, Mayaud P, Swai R, Fransen L, Mabey D, Mills A, Hayes R (1997). Cost-effectiveness of improved treatment services for sexually transmitted diseases in preventing HIV-1 infection in Mwanza Region, Tanzania. Lancet 350(9094):1805-9. Gold M, editor (1996) Cost-effectiveness in health and medicine. Oxford: Oxford University Press. Harris J (2005). Challenges to the commercial viability of point-of-use (POU) water treatment systems in low-income settings. MSc Dissertation, Oxford University School of Geography and the Environment, 77pp. Hanson K, Kikumbih N, Schellenberg JA, Mponda H, Nathan R, Lake S, Mills A, Tanner M, Lengeler C (2003). Cost-effectiveness of social marketing of insecticide-treated nets in Tanzania. Bull WHO 81(4):269–276.
30
Hanson M, Powell K (2006). INSEAD Case Study: Procter and Gamble PuR Purifier of Water (A&B). INSEAD School of Business, Paris, France. Hogan DR, altussen R, Hayashi C, Luer JA, Salomon JA (2005). Cost-effectiveness analysis of strategies to combat HIV/AIDS in developing countries. BMJ 331:1431-1437 Hoque BA, Juncker T, Sack RB, Ali M, Aziz KM (1996). Sustainability of a water, sanitation and hygiene education project in rural Bangladesh: a 5-year follow-up. Bull WHO 74:431-37 Hutton G (2000). Considerations in evaluating the cost-effectiveness of environmental health interventions. Geneva: World Health Organization Hutton, G. (2001). Economic evaluation and priority setting in water and sanitation interventions. In: Fewtrell, L. (ed.) and Bartram, J. (ed.) (2001). Water quality : guidelines, standards and health : assessment of risk and risk management for water-related infectious disease.. World Health Organization, Geneva, Switzerland . Hutton G, Haller L (2004). Evaluation of the Costs and Benefits of Water and Sanitation Improvements at the Global Level. Geneva: World Health Organization Hutton G, Haller L, Bartram J (2007). Estimating the costs and health benefits of water and sanitation improvements at global level. J Water Health 5(4):467-80. Hutton G, Haller L, Bartram J (2007a). Global cost-benefit analysis of water supply and sanitation interventions. J. Water Health 5(4):481-502 Hutubessy RC, Baltussen RM, Evans DB, Barendregt JJ, Murray CJ (2001). Stochastic league tables: communicating cost-effectiveness results to decision-makers. Health Economics 10(5):473-7 Hutubessy R.C., Baltussen, RMPM, Tan Torres-Edejer T, Evans DB (2002). Generalized cost-effectiveness analysis: an aid to decision making in health, Applied Health Economics and Health Policy, 1:2, 39-46 IDE (2003). Ceramic Water Purifier Cambodia Field Tests. IDE Working Paper No. 1, October 2003 Washington, DC: International Development Enterprises Jensen PK, Ensink JH, Jayasinghe G, van der Hoek W, Cairncross S, Dalsgaard A (2003). Effect of chlorination of drinking-water on water quality and childhood diarrhoea in a village in Pakistan. J Health Popul Nutr 21:26-31 Johns B, Baltussen R (2004). Accounting for the cost of scalingup health interventions. Health Econ 13:1117-24 Johns B, Baltussen R, Hutubessy R (2003). Programme costs in the economic evaluation of health interventions, Cost-effectiveness and Resource Allocation 1: 1. Kosek, M., Bern, C. & Guerrant, R.L. (2003). The global burden of diarrhoeal disease, as estimated from studies published between 1992 and 2000. Bull. WHO 81, 197-204.
31
Lauer, J.A., Murray, C.J.L., Roehrich, K. & Wirth, H. 2003. PopMod: A longitudinal four-state population model with two disease states and co-morbidity. Cost-effectiveness & Resource Allocation, 1:1-6. Mathekgana MA, Chauke LK, Otieno FA (2001). Improvement of environmental health and hygiene practise—case study in Northern Province. Water Sci. Technol. 44:109-17 McLaughlin C. Costs of treating drinking water by boiling in Virar, Vasai and Nalasopara, India. [MSc dissertation]. London: London School of Hygiene & Tropical Medicine, 2006. McNutt L-A, Wu C, Xue X, Hafner JP (2003). Estimating the relative risk in cohort studies and clinical trials of common outcomes. Am J Epidemiol 157:940-943 Meddings DR, Ronald LA, Marion S, Pinera JF, Oppliger A (2004). Cost-effectiveness of a latrine revision programme in Kabul, Afghanistan. Bull WHO 82:281-289 Merrett S (2002). Willingness to pay—a review: deconstructing househols’ willingness to pay for water in low income countries. Water Policy 4:157-72. Messou E, Sangare SV, Josseran R, Le Corre C, Guelain J (1997). Effet de l'observance des mesures d'hygiene, d'approisionnement en eau et de la therapie par voie orale sur les diarrhees chez les enfants de moins de 5 ans dans le sud de la Cote D'Ivoire. Bull Soc Pathol Exot 90:44-47 Mulligan, J., Fox-Rushby, J., Adam, T., Johns, B. & Mills A. 2005 Unit costs of health care inputs in low- and middle- income regions. Disease Control Priorities Project Working Paper No. 9. September 2003, revised June, 2005. Geneva: The World Health Organization Murray C, Evans DB, Acharya A, Baltussen RMPM (2000). Development of WHO Guidelines on Generalized Cost-Effectiveness Analysis, Health Economics 9: 235-251. Murray, CJL, Evans DB, Acharya A, Baltussen RMPM (2002). Development of WHO Guidelines on Generalised Cost-Effectiveness Analysis. Global Programme on Evidence for Health Policy Discussion Paper Series: No. 4. World Health Organization. POUZN Project (2007). Best Practices in Social Marketing Safe Water Solution for Household Water Treatment: Lessons Learned from Population Services International Field Programs. The Social Marketing Plus for Diarrheal Disease Control: Point-of Use Water Disinfection and Zinc Treatment (POUZN) Project, Abt Associates Inc., Bethesda, MD. Prahalad CK (2005). The Fortune at the Bottom of the Pyramid: Eradicating Poverty through Profits. Upper Saddle River, NJ: Wharton School Publishing Prüss, A., Kay, D., Fewtrell, L. & Bartram, J. 2002. Estimating the burden of disease from water, sanitation and hygiene at the global level. Env. Health Perspectives 110: 537-42 Prüss-Üstün, A. & Corvalán, C. 2006. Preventing disease through healthy environments: toward an estimate of the environmental burden of disease. Geneva: The World Health Organization. Prüss-Üstün, A., Kay, D., Fewtrell, L. & Bartram, J. 2004. Unsafe water, sanitation and hygiene, in Ezzati M, Rogers AD, Lopez AD, Murray CJL (eds.), Comparative Quantification of Health Risks: Global and
32
Regional Burden of Disease due to Selected Major Risk Factors, Vol. 2. Geneva: The World Health Organization. Quick RE, Kimura A, Thevos A, Tembo M, Shamputa I, Hutwagner L, Mintz E (2002). Diarrhoea prevention through household-level water disinfection and safe storage in Zambia. Am J Trop Med Hyg 66(5): 584-9 Quick RE, Venczel LV, Mintz ED, Soleto L, Aparicio J, Gironaz M, Hutwagner L, Greene K, Bopp C, Maloney K, Chavez D, Sobsey M, Tauxe RV (1999). Diarrhoea prevention in Bolivia through point-of-use water treatment and safe storage: a promising new strategy. Epidemiol. Infect. 122(1): 83-90 Robberstad B, Strand T, Black RSommerfelt H (2004). Cost-effectiveness of zinc as adjunct therapy for acute childhood diarrhoea in developing countries. Bull. WHO 82:523-531 Rogers EM (2003). Diffusion of Innovations (5th ed.). New York: Free Press Shrestha, R.K., Marseille, E., Kahn, J.G., Lule, J.R., Pitter, C., Blandford, J.M., Bunnell, R., Coutinho, A., Kizito, F., Quick, R. & Mermin, J. 2006. Cost-effectiveness of home-base chlorination and safe water storage in reducing diarrhea among HIV-affected households in Uganda. Am J Trop Med Hyg 74: 884-90. Sobsey MD (2002). Managing water in the home: accelerated health gains from improved water supply. Geneva: The World Health Organization (WHO/SDE/WSH/02.07) Souter, P.F., Cruickshank, G.D., Tankerville, M.Z., Keswick, B.H., Ellis, B.D., Langworthy, D.E., Metz, K.A., Appleby, M.R., Hamilton, N., Jones, A.L. & Perry, J.D. 2003. Evaluation of a new water treatment for point-of-use household applications to remove microorganisms and arsenic from drinking water. J Water Health 1: 73-84 Tan-Torres Edejer T, Aikins M, Black R, Wolfson L, Hutubessey R, Evans D (2005). Cost-effectiveness analysis of strategies for child health in developing countries. BMJ doi:10.1136/bmj.38652.550278.7C Tan-Torres Edejer T, Baltussen R, Adam T, Hutubessy R, Acharya A, Evans DB, Murray CJL (2003). WHO Guide to Cost-Effectiveness Analysis. Geneva: World Health Organization United Nations (2006). UN Statistical Division. Progress towards the Millennium Development Goals, 1990-2005, New York: The United Nations. Universidad Rafael Landivar (URL) (1995). Instituto de Investigaciones Económicas y Sociales, Contra la morbilidad infantil: filtros artesanales y educación. Guatemala: Revista de Estudios Sociales No. 53, IV Epoca, pp 1-66 Varley RCG, Tarvid J, Chao DNW (1998). A reassessment of the cost-effectiveness of water and sanitation interventions in programmes for controlling childhood diarrhoea. WHO Bull. 76, 617-631. Walsh JA, Warren KS (1979). Selective primary health care: an interim strategy for disease control in developing countries. N Engl J Med 301(18):967-974. Weinstein MC, Siegel JE (1996). Recommendations of the panel on cost-effectiveness in health and medicine. JAMA 276:1253-58
33
Wellin E (1955). Water boiling in a peruvian town. In Paul BD (ed.), Health, Culture and Community. New York: Russel Safe Foundation. White GF, Bradley DJ, White AU (1972). Drawers of Water: Domestic Water Use in East Africa. Chicago: University of Chicago Press Whittington D, Briscoe J (1990). Estimating the willingness to pay for water services in developing countries: a case study of the use of contingent valuation surveys in Southern Haiti. Economic Dev. & Cultural Change: 293-311 Wiseman V, Hawley WA, ter Kuile FO, Phillips-Howard PA, Vulule JM, Nahlen BL, Mills AJ. (2003). The cost-effectiveness of permethrin-treated bednets in an area of intense malaria transmission in western Kenya. Am J Trop Med & Hyg 68:161-67 Witter S, Ensor T, Jowett M & Thompson R (2000) Health economics for developing countries - a practical guide. London: Macmillan Education World Bank (1993). World development report 1993: investing in health. New York: Oxford University Press WHO (2002). The World Health Report 2002. Geneva: The World Health Organization. http://www.who.int/whr/2002/en/ WHO (2004). Business plan for stimulating the development, manufacturing, and widespread distribution of long-lasting insecticidal nets. Geneva: The World Health Organization WHO (2005). World Health Report 2005. Geneva: World Health Organization WHO (2005a). Progress towards the Millennium Development Goals, 1990-2005. (downloaded from http://unstats/un.org/unsd/mi/goals_2005/goal_4.pdf on 15 November 2006) WHO/UNICEF (2000). Global Water Supply and Sanitation Assessment. Geneva: The World Health Organization and the United Nations Children’s Fund. WHO/UNICEF (2005). Meeting the MDG Drinking Water and Sanitation Target: A Midterm Assessment of Progress. Geneva: The World Health Organization and the United Nations Children’s Fund. WHO/UNICEF JMP (2005). Water for Life: Decade for Action 2005-2015. Geneva: World Health Organization and United Nations Children’s Fund Joint Monitoring Programme Zhang J, Yu KF (1998). What's the relative risk? JAMA 280:1690-91