Embed Size (px)
Citation preview
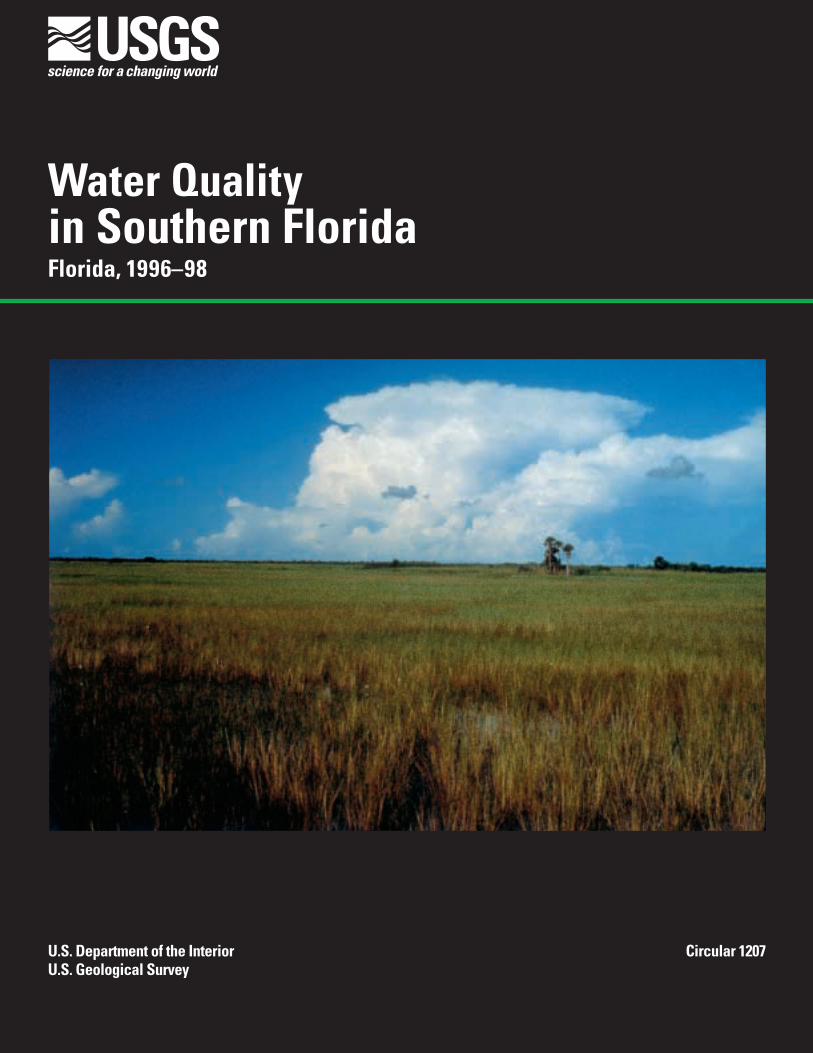
Water Qualityin Southern FloridaFlorida, 1996–98
U.S. Department of the InteriorU.S. Geological Survey
Circular 1207
POINTS OF CONTACT AND ADDITIONAL INFORMATION
Front cover:
Everglades National Park
(photograph by Benjamin F. McPherson)
.
Back cover:
Left, Southern Everglades C-111 agricultural basin, irrigation of crops
;
center, Northern Everglades, slough and tree islands; right, areal view of Miami
(photographs by Benjamin F. McPherson)
.
The companion Web site for NAWQA summary reports:
http://water.usgs.gov/nawqa/
Southern Florida contact and Web site:
USGS State Representative: Carl GoodwinU.S. Geological SurveyWater Resources Division227 N. Bronough St., Suite 3015Tallahassee, FL 32301state rep [email protected]://water.usgs.gov/pubs/nawqa/
National NAWQA Program:
Chief, NAWQA ProgramU.S. Geological SurveyWater Resources Division12201 Sunrise Valley Drive, M.S. 413Reston, VA 20192http://water.usgs.gov/nawqa/
River Basin Assessments
Albemarle-Pamlico Drainage Basin (Circular 1157)Allegheny and Monongahela River Basins (Circular 1202)Apalachicola-Chattahoochee-Flint River Basin (Circular 1164)Central Arizona Basins (Circular 1213)Central Columbia Plateau (Circular 1144)Central Nebraska Basins (Circular 1163)Connecticut, Housatonic and Thames River Basins (Circular 1155)Eastern Iowa Basins (Circular 1210)Georgia-Florida Coastal Plain (Circular 1151)Hudson River Basin (Circular 1165)Kanawha-New River Basins (Circular 1204)Lake Erie-Lake Saint Clair Drainages (Circular 1203)Las Vegas Valley Area and the Carson and Truckee River Basins
(Circular 1170)Lower Illinois River Basin (Circular 1209)Long Island-New Jersey Coastal Drainages (Circular 1201)Lower Susquehanna River Basin (Circular 1168)Mississippi Embayment (Circular 1208)Ozark Plateaus (Circular 1158)Potomac River Basin (Circular 1166)
Other NAWQA summary reports
Puget Sound Basin (Circular 1216)Red River of the North Basin (Circular 1169)Rio Grande Valley (Circular 1162)Sacramento River Basin (Circular 1215)San Joaquin-Tulare Basins (Circular 1159)Santee River Basin and Coastal Drainages (Circular 1206)South-Central Texas (Circular 1212) South Platte River Basin (Circular 1167)Trinity River Basin (Circular 1171)Upper Colorado River Basin (Circular 1214) Upper Mississippi River Basin (Circular 1211)Upper Snake River Basin (Circular 1160)Upper Tennessee River Basin (Circular 1205)Western Lake Michigan Drainages (Circular 1156)White River Basin (Circular 1150)Willamette Basin (Circular 1161)
National Assessments
The Quality of Our Nation‘s Waters—Nutrients and Pesticides (Circular 1225)
Water Quality in Southern Florida
Florida,1996–98
By
Benjamin F. McPherson, Ronald L. Miller, Kim H. Haag,
and
Anne Bradner
U.S. GEOLOGICAL SURVEY CIRCULAR 1207
Library of Congress Cataloging-in-Publications Data
The use of firm, trade, and brand names in this report is for identification purposes only anddoes not constitute endorsement by the U.S. Government.
Free on application to theU.S. Geological SurveyInformation ServicesBox 25286 Federal CenterDenver, CO 80225
Or call: 1-888-ASK-USGS
U.S. DEPARTMENT OF THE INTERIORBRUCE BABBITT, Secretary
U.S. GEOLOGICAL SURVEY
Charles G. Groat, Director
2000
Water quality in Southern Florida, Florida, 1996–98 / by Benjamin F. McPherson…[et al.].p. cm. -- (U.S. Geological Survey Circular ; 1207)
Includes bibliographical references.ISBN 0-607-95413-2 (alk. paper)1. Water quality--Florida--Everglades. 2. Watersheds--Florida. I. McPherson, Benjamin F. II. Geological
Survey (U.S.) III. Series.
TD224.F6 W3723 2000363.739’42’0975939--dc21
00-049463
CONTENTS
Contents III
NATIONAL WATER-QUALITY ASSESSMENT PROGRAM ............................................................... IV
SUMMARY OF MAJOR FINDINGS.................................................................................................... 1
Surface-Water Highlights .............................................................................................................. 1
Ground-Water Highlights .............................................................................................................. 2
INTRODUCTION TO THE SOUTHERN FLORIDA NAWQA STUDY UNIT ........................................ 3
Rainfall .......................................................................................................................................... 6
MAJOR FINDINGS ............................................................................................................................. 7
Nutrient enrichment is prevalent in surface water ......................................................................... 7
NATIONAL PERSPECTIVE—Nutrient concentrations vary widely in southern Florida and the Nation............................................................................................................................ 7
Nutrient concentrations in ground water are highly variable ......................................................... 9
Dissolved organic carbon concentrations are often high .............................................................. 9
Pesticides are present in most surface-water samples................................................................. 10
NATIONAL PERSPECTIVE—Pesticide detections vary with land use in southern Florida and the Nation............................................................................................................................ 11
Regional patterns of pesticides, VOCs and trace elements are evident in ground water ............. 12
NATIONAL PERSPECTIVE—What combinations of pesticides occur most frequently in southern Florida and the Nation?........................................................................................... 13
Pesticides, PCBs, other organics and trace elements have accumulated in bottom sediment and fish ...................................................................................................................... 15
Mercury is a contaminant in the Southern Florida Study Unit ...................................................... 16
Biological communities are influenced by water quality ................................................................ 18
NATIONAL PERSPECTIVE—Southern Florida aquatic communities in a national context ......... 20
Exotic species are a threat to native biota .................................................................................... 21
STUDY UNIT DESIGN........................................................................................................................ 22
GLOSSARY ........................................................................................................................................ 24
REFERENCES ................................................................................................................................... 25
APPENDIX A—WATER-QUALITY DATA FROM SOUTHERN FLORIDA IN A NATIONAL CONTEXT............................................................................................................... 27
NATIONAL WATER-QUALITY ASSESSMENT PROGRAM
IV National Water-Quality Assessment Program
THIS REPORT
summarizes major findings about water quality in the southern Florida area studied by the U.S. Geological Survey (USGS) National Water-Quality Assessment (NAWQA) Program between 1996 and 1998. Water quality is discussed in terms of local and regional issues and compared to conditions found in all 36 NAWQA study areas, called Study Units, assessed to date. Findings also are explained in the context of selected national benchmarks, such as those for drinking-water quality and the protection of aquatic organisms. The NAWQA Program was not intended to assess the quality of the Nation’s drinking water, such as by monitoring water from household taps. Rather, the assessments focus on the quality of the resource itself, thereby complementing many ongoing Federal, State, and local drinking-water monitoring programs. The comparisons made in this report to drinking-water standards and guidelines are only in the context of the available untreated resource. Finally, this report includes information about the status of aquatic communities and the condition of stream habitats as elements of a complete water-quality assessment.
Many topics covered in this report reflect the concerns of officials of State and Federal agencies, water-resource managers, and members of stakeholder groups who provided advice and input during the Southern Florida assessment. Basin residents who wish to know more about water quality in the areas where they live will find this report informative as well.
THE NAWQA PROGRAM
seeks to improve scientific and public understanding of water quality in the Nation’s major river basins and ground-water systems. Better understanding facilitates effective resource management, accurate identification of water-quality priorities, and successful development of strategies that protect and restore water quality. Guided by a nationally consistent study design and shaped by ongoing communication with local, State, and Federal agencies, NAWQA assessments support the investigation of local issues and trends while providing a firm foundation for understanding water quality at regional and national scales. The ability to integrate local and national scales of data collection and analysis is a unique feature of the USGS NAWQA Program.
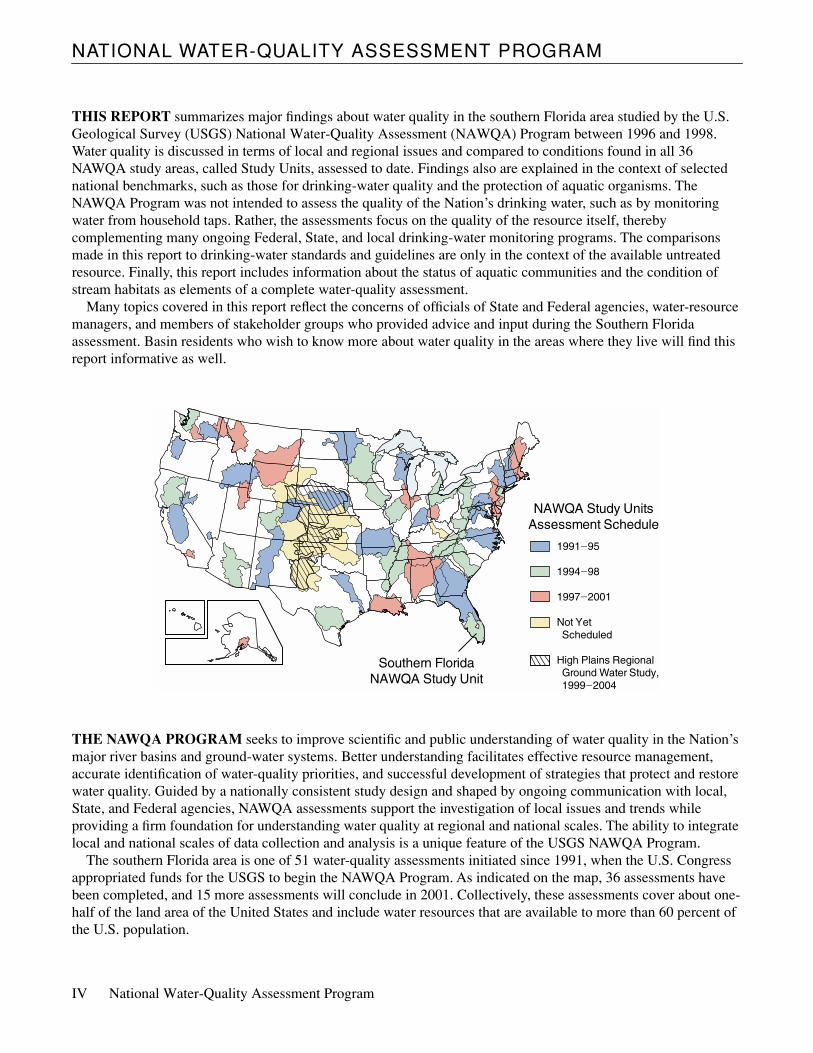
The southern Florida area is one of 51 water-quality assessments initiated since 1991, when the U.S. Congress appropriated funds for the USGS to begin the NAWQA Program. As indicated on the map, 36 assessments have been completed, and 15 more assessments will conclude in 2001. Collectively, these assessments cover about one-half of the land area of the United States and include water resources that are available to more than 60 percent of the U.S. population.
NAWQA Study UnitsAssessment Schedule
1991_95
1994_98
1997_2001
Not YetScheduled
High Plains RegionalGround Water Study,1999_2004
Southern FloridaNAWQA Study Unit
Summary of Major Findings 1
SUMMARY OF MAJOR FINDINGS
Surface-Water Highlights
The environment in southern Florida is being degraded by human activities. Native biota have been reduced greatly in abundance and diversity by drain-age, development, alteration of water flows, degrad-ation of water quality, and by continuing invasions of exotic species.The Everglades ecosystem, which is adapted to water that has an extremely low phosphorus concentration, is being altered by agricultural activities that produce high levels of phosphorus in water. Nutri-ent loading in the major rivers is contributing to over-enrichment of Lake Okeechobee and estuaries such as Charlotte Harbor. Mercury has accumulated in Ever-glades game fish, and consumption of the fish poses a potential human health risk. Mercury has accumulated
in the Everglades food web because natural conditions and human influences enhance methylation of mercury to its organic form and because high atmospheric mercury deposition rates (among the highest in the Nation) sustain mercury methylation.
Federal and State agencies and environmen-tal groups agree that parts of southern Florida should be restored to predevelopment condi-tions. Restoration will require massive changes in the water-management system to restore pre-development drainage patterns, improve water quality, and protect native biota.
Major findings on water quality and biology from this study: • Concentrations of total phosphorus (TP) at the
Southern Florida (SOFL) National Water- Quality Assessment (NAWQA) Program sites were above Everglades background levels and exceeded the U.S. Environmental Protection Agency’s (USEPA) Everglades water-quality standard of 0.01 milligram per liter (mg/L). A major source of the high TP is fertilizer from agriculture.
• Concentrations of dissolved organic carbon (DOC) in southern Florida water were rela-tively high compared with those in other waters of the Nation. High DOC concentra-tions provide food for bacteria to grow, reduce light penetration in the water, and enhance transport and cycling of pesticides and trace elements such as mercury.
• Pesticides were detected in almost all SOFL samples. Most concentrations were below aquatic-life criteria; however, the criteria do not address potential effects of mixtures of
pesticides and their degradation products, which were common in the samples.
• Organochlorine pesticides, such as DDT and its degradation products, are still prevalent in bottom sediment and fish tissue at the SOFL sites, even though most uses of these compounds have been discontinued in recent decades. The mobilization of these pesticides by the reflooding of Everglades farm lands could lead to food-web contamination.
• Of 21 NAWQA basins nationwide, the Everglades has the second highest ratio of methylmercury to mercury in sediment.This enrichment in methyl-mercury enhances mercury uptake by the biota.
• The frequency of external anomalies (lesions, ulcers, and tumors) on fish collected at two SOFL agricultural canal sites was in the top 25 percent of
41
STUDY-UNITBOUNDARY
ATLANTIC
OC
EAN
GU
LF OF M
EXICO
STRAITS OF F
LORIDA
St. LucieRiver
Black CreekCanal
Bar
ron
Riv
erC
anal
St. Lucie
Canal
BiscayneBay
WestPalm
Beach
FortLauderdale
Miami
Homestead
0 25 50 MIL
0 50 KILOMETERS25
ES
Other public lands
NATIVE AMERICAN LANDS
WATER CONSERVATION AREA
MODIFIED KISSIMMEE-OKEECHOBEE-EVERGLADESBOUNDARY
25°
26°
Everglades National Park
Big Cypress National Preserve
PUBLIC LANDS
OTHER
AGRICULTURAL LAND
URBAN LAND
EXPLANATION
Naples
Alva
FortMyers
Arcadia
Florida Keys
Tamiami Canal L−67
A
C11
1WCA
2
WCA3
WCA3
WCA1
BeachCanal
CaloosahatcheeCanal
West Palm
North New
River CanalHillsboro
Canal
CharlotteHarbor
Florida Bay
27°Pe
ace
Riv
er
Mya
kka
Riv
er
Kissimm
ee
River
LakeOkeechobee
28°
83° 82° 81° 80°
Base from U.S. Geological Survey digital data, 1:2,000,000, 1972Albers Equal-Area Conic projectionStandard Parallels 29°30′ and 45°30′, central meridian -83°00′
RiverCaloo sahatchee
Miam
i Canal and River
LOCATIONOF STUDY
AREA
ALABAMA GEORGIA
FLORIDA
Tamiami Trail
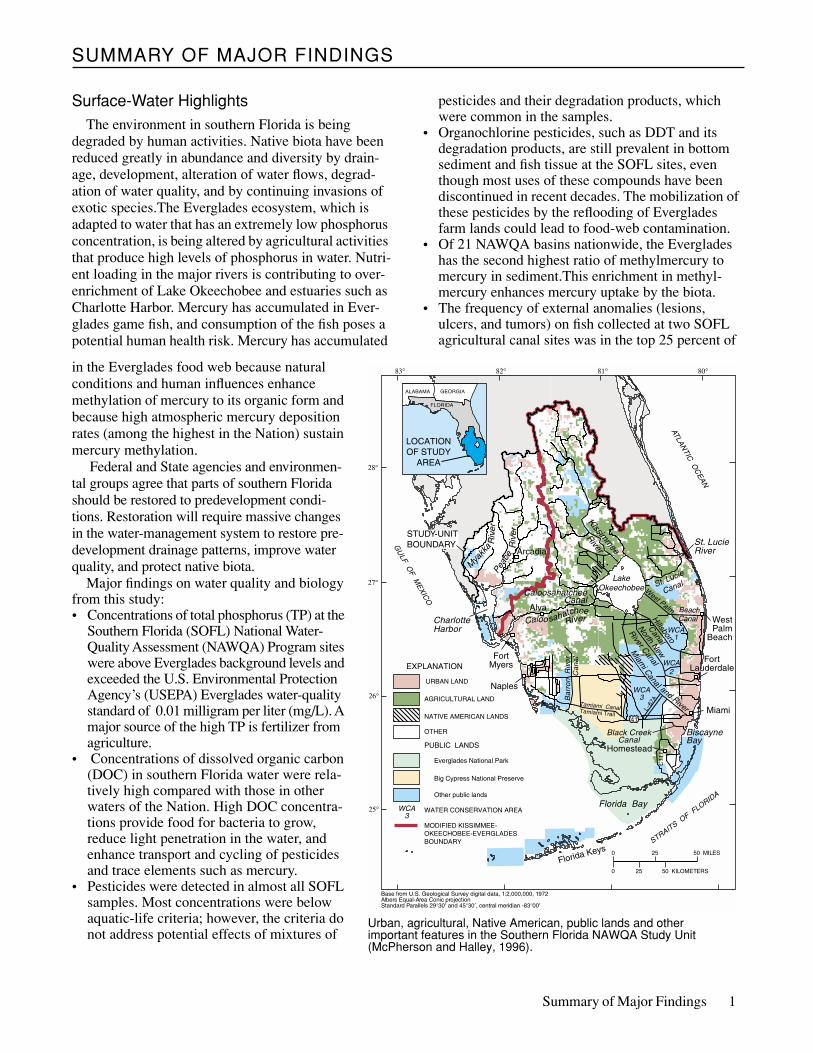
Urban, agricultural, Native American, public lands and other important features in the Southern Florida NAWQA Study Unit (McPherson and Halley, 1996).
2 Water Quality in Southern Florida, 1996–98
144 NAWQA sites sampled nationwide. Anomalies can be indications that fish are stressed by contami-nation.
• Exotic animals and plants are a threat to native biota. Ten of the 54 exotic fish species established in the region were collected at the SOFL sites. Several herbicides used to control exotic plants were detected in surface water.
Major Influences on Surface Waterand Ecology
• Drainage modifications and wetland destruction.• Runoff from agricultural and urban areas.• High concentrations of DOC and its effects on the
transport of mercury and the attenuation of light.• Deliberate or accidental release of exotic species.
Ground-Water Highlights
In much of the SOFL region, ground water in the surficial aquifers, such as the Biscayne aquifer, is of good quality and usually meets Federal and State drink-ing-water quality standards. Contaminants are usually in low concentrations, presumably because of rapid flushing and recharge as a result of high annual rainfall (about 55 inches) and shallow aquifers and porous lime-stone that allow the easy interchange of surface and ground water. However, because of the shallow aquifers and porous limestone, ground water is vulnerable to surface contamination and to saltwater intrusion.
Major findings on ground-water quality from this study include the following: • Nitrate concentrations were below the drinking-
water standard (10 mg/L) in 108 SOFL wells
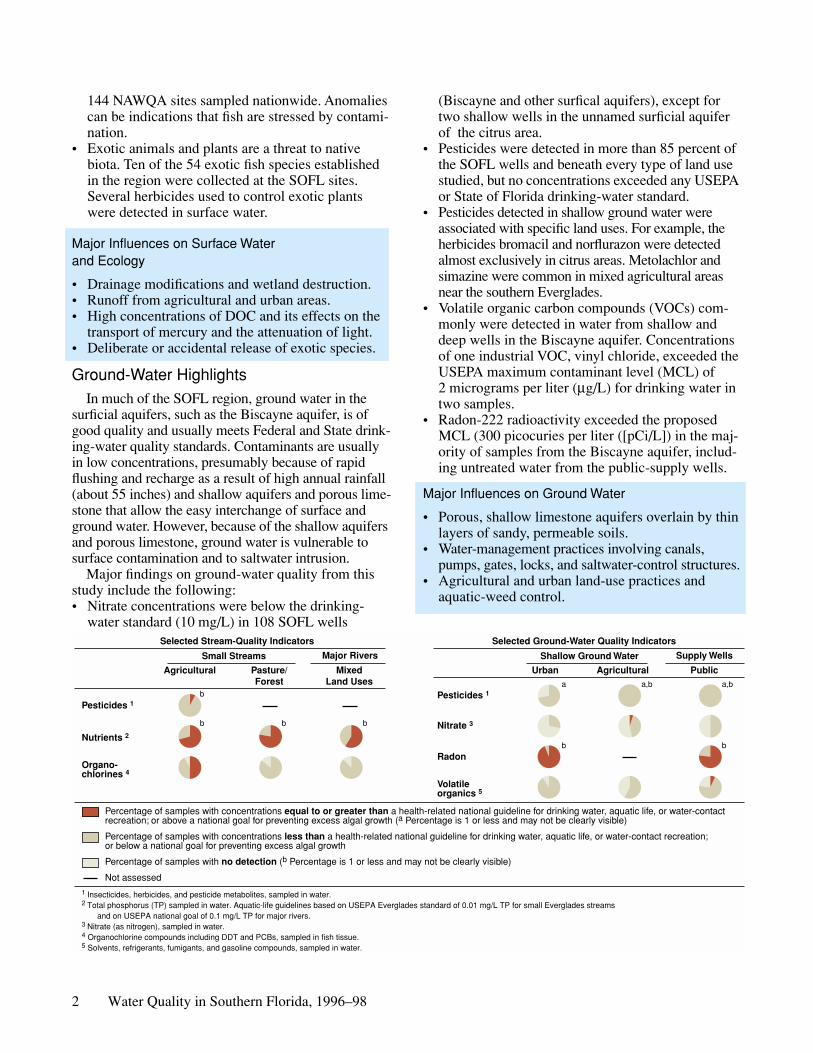
Small Streams Major Rivers
Agricultural Pasture/Forest
Selected Stream-Quality Indicators
MixedLand Uses
1 Insecticides, herbicides, and pesticide metabolites, sampled in water.2 Total phosphorus (TP) sampled in water. Aquatic-life guidelines based on USEPA Everglades standard of 0.01 mg/L TP for small Everglades streams and on USEPA national goal of 0.1 mg/L TP for major rivers.3 Nitrate (as nitrogen), sampled in water.4 Organochlorine compounds including DDT and PCBs, sampled in fish tissue.5 Solvents, refrigerants, fumigants, and gasoline compounds, sampled in water.
Nutrients 2
Pesticides 1
Organo-chlorines 4
Percentage of samples with concentrations equal to or greater than a health-related national guideline for drinking water, aquatic life, or water-contact recreation; or above a national goal for preventing excess algal growth (a Percentage is 1 or less and may not be clearly visible)
Percentage of samples with concentrations less than a health-related national guideline for drinking water, aquatic life, or water-contact recreation; or below a national goal for preventing excess algal growth
Percentage of samples with no detection (b Percentage is 1 or less and may not be clearly visible)
Not assessed
Selected Ground-Water Quality Indicators
Shallow Ground Water Supply Wells
AgriculturalUrban Public
Nitrate 3
Pesticides 1
Radon
Volatileorganics 5
bbb
ba a,b a,b
b b
(Biscayne and other surfical aquifers), except for two shallow wells in the unnamed surficial aquifer of the citrus area.
• Pesticides were detected in more than 85 percent of the SOFL wells and beneath every type of land use studied, but no concentrations exceeded any USEPA or State of Florida drinking-water standard.
• Pesticides detected in shallow ground water were associated with specific land uses. For example, the herbicides bromacil and norflurazon were detected almost exclusively in citrus areas. Metolachlor and simazine were common in mixed agricultural areas near the southern Everglades.
• Volatile organic carbon compounds (VOCs) com-monly were detected in water from shallow and deep wells in the Biscayne aquifer. Concentrations of one industrial VOC, vinyl chloride, exceeded the USEPA maximum contaminant level (MCL) of 2 micrograms per liter (
µ
g/L) for drinking water in two samples.
• Radon-222 radioactivity exceeded the proposed MCL (300 picocuries per liter ([pCi/L]) in the maj-ority of samples from the Biscayne aquifer, includ-ing untreated water from the public-supply wells.
Major Influences on Ground Water
• Porous, shallow limestone aquifers overlain by thin layers of sandy, permeable soils.
• Water-management practices involving canals, pumps, gates, locks, and saltwater-control structures.
• Agricultural and urban land-use practices and aquatic-weed control.
Introduction to the Southern Florida NAWQA Study Unit 3
INTRODUCTION TO THE SOUTHERN FLORIDA NAWQA STUDY UNIT
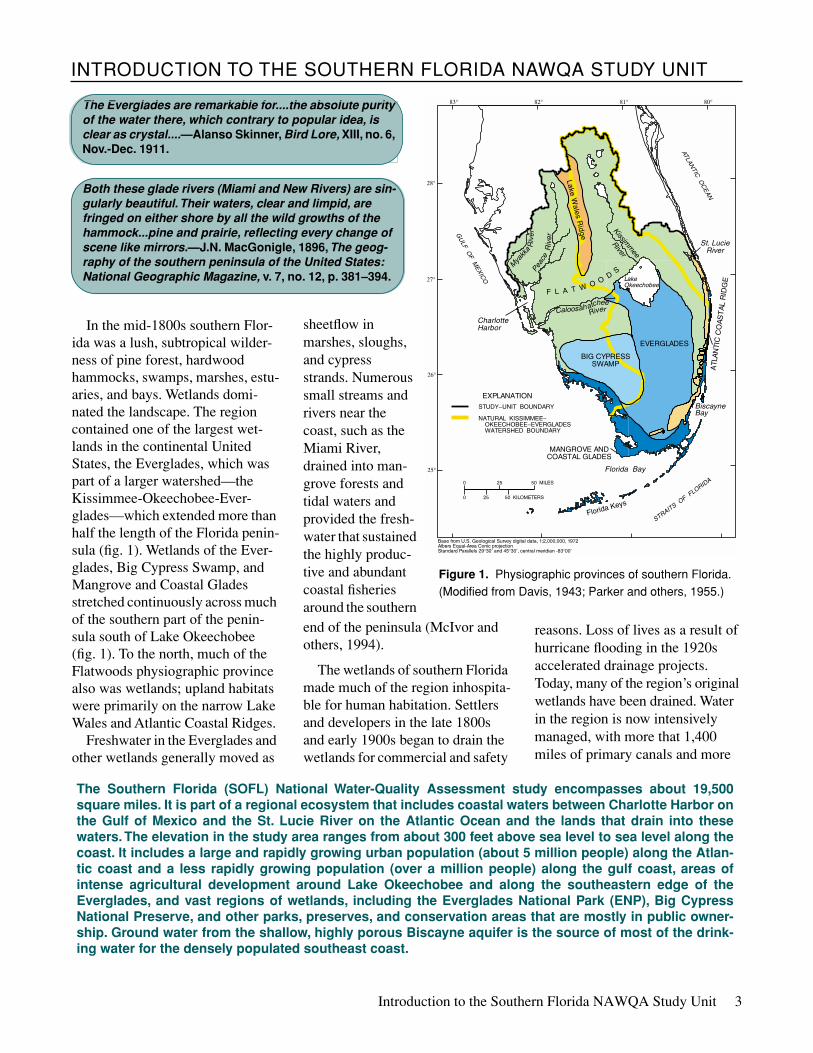
In the mid-1800s southern Flor-ida was a lush, subtropical wilder-ness of pine forest, hardwood hammocks, swamps, marshes, estu-aries, and bays. Wetlands domi-nated the landscape. The region contained one of the largest wet-lands in the continental United States, the Everglades, which was part of a larger watershed—the Kissimmee-Okeechobee-Ever-glades—which extended more than half the length of the Florida penin-sula (fig. 1). Wetlands of the Ever-glades, Big Cypress Swamp, and Mangrove and Coastal Glades stretched continuously across much of the southern part of the penin-sula south of Lake Okeechobee (fig. 1). To the north, much of the Flatwoods physiographic province also was wetlands; upland habitats were primarily on the narrow Lake Wales and Atlantic Coastal Ridges.
Freshwater in the Everglades and other wetlands generally moved as
sheetflow in marshes, sloughs, and cypress strands. Numerous small streams and rivers near the coast, such as the Miami River, drained into man-grove forests and tidal waters and provided the fresh-water that sustained the highly produc-tive and abundant coastal fisheries around the southern end of the peninsula (McIvor and others, 1994).
The wetlands of southern Florida made much of the region inhospita-ble for human habitation. Settlers and developers in the late 1800s and early 1900s began to drain the wetlands for commercial and safety
reasons. Loss of lives as a result of hurricane flooding in the 1920s accelerated drainage projects. Today, many of the region’s original wetlands have been drained. Water in the region is now intensively managed, with more that 1,400 miles of primary canals and more
0 25 50 MILES
0 50 KILOMETERS25
Base from U.S. Geological Survey digital data, 1:2,000,000, 1972Albers Equal-Area Conic projectionStandard Parallels 29°30′ and 45°30′, central meridian -83°00′
P
25°
80°81°82°83°
28°
27°
26°
L
ATLANTIC
OC
EAN
GU
LF OF M
EXICO
STRAITS OF F
LORIDA
Florida Keys
CharlotteHarbor
Florida Bay
St. LucieRiver
BiscayneBay
Peac
e
Riv
er
Mya
kka
Riv
er
Kissimm
ee
River
RiverCaloosahatchee
EVERGLADES
BIG CY RESSSWAMP
F L A T W O OD
S
Lake Wales R
idge
STUDY−UNIT BOUNDA
EXPLANATION
NATURAL KISSIMMEEOKEECHOBEE−EVWATERSHED BOUNDA
MANGROVE ANDCOASTAL GLADES
NTI
C C
OA
ST
AL
RID
GE
ATL
A
RY
−ERGLADES
RY
akeOkeechobee
Figure 1. Physiographic provinces of southern Florida. (Modified from Davis, 1943; Parker and others, 1955.)
The Southern Florida (SOFL) National Water-Quality Assessment study encompasses about 19,500square miles. It is part of a regional ecosystem that includes coastal waters between Charlotte Harbor onthe Gulf of Mexico and the St. Lucie River on the Atlantic Ocean and the lands that drain into thesewaters. The elevation in the study area ranges from about 300 feet above sea level to sea level along thecoast. It includes a large and rapidly growing urban population (about 5 million people) along the Atlan-tic coast and a less rapidly growing population (over a million people) along the gulf coast, areas ofintense agricultural development around Lake Okeechobee and along the southeastern edge of theEverglades, and vast regions of wetlands, including the Everglades National Park (ENP), Big CypressNational Preserve, and other parks, preserves, and conservation areas that are mostly in public owner-ship. Ground water from the shallow, highly porous Biscayne aquifer is the source of most of the drink-ing water for the densely populated southeast coast.
The Everglades are remarkable for....the absolute purity of the water there, which contrary to popular idea, is clear as crystal....
—Alanso Skinner,
Bird Lore,
XIII, no. 6, Nov.-Dec. 1911.
Both these glade rivers (Miami and New Rivers) are sin-gularly beautiful. Their waters, clear and limpid, are fringed on either shore by all the wild growths of the hammock...pine and prairie, reflecting every change of scene like mirrors.
—J.N. MacGonigle, 1896,
The geog-raphy of the southern peninsula of the United States:
National Geographic Magazine,
v. 7, no. 12, p. 381–394.
4 Water Quality in Southern Florida, 1996–98
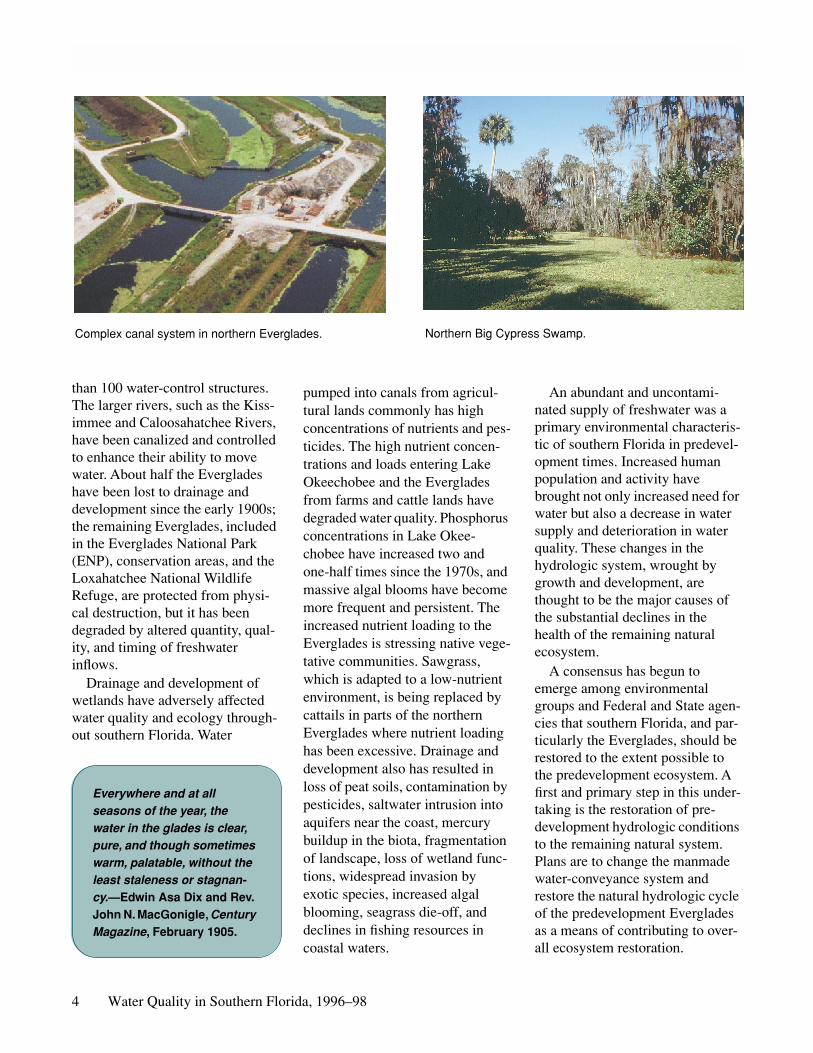
than 100 water-control structures. The larger rivers, such as the Kiss-immee and Caloosahatchee Rivers, have been canalized and controlled to enhance their ability to move water. About half the Everglades have been lost to drainage and development since the early 1900s; the remaining Everglades, included in the Everglades National Park (ENP), conservation areas, and the Loxahatchee National Wildlife Refuge, are protected from physi-cal destruction, but it has been degraded by altered quantity, qual-ity, and timing of freshwater inflows.
Drainage and development of wetlands have adversely affected water quality and ecology through-out southern Florida. Water
Complex canal system in northern Everglades. Northern Big Cypress Swamp.
pumped into canals from agricul-tural lands commonly has high concentrations of nutrients and pes-ticides. The high nutrient concen-trations and loads entering Lake Okeechobee and the Everglades from farms and cattle lands have degraded water quality. Phosphorus concentrations in Lake Okee-chobee have increased two and one-half times since the 1970s, and massive algal blooms have become more frequent and persistent. The increased nutrient loading to the Everglades is stressing native vege-tative communities. Sawgrass, which is adapted to a low-nutrient environment, is being replaced by cattails in parts of the northern Everglades where nutrient loading has been excessive. Drainage and development also has resulted in loss of peat soils, contamination by pesticides, saltwater intrusion into aquifers near the coast, mercury buildup in the biota, fragmentation of landscape, loss of wetland func-tions, widespread invasion by exotic species, increased algal blooming, seagrass die-off, and declines in fishing resources in coastal waters.
An abundant and uncontami-nated supply of freshwater was a primary environmental characteris-tic of southern Florida in predevel-opment times. Increased human population and activity have brought not only increased need for water but also a decrease in water supply and deterioration in water quality. These changes in the hydrologic system, wrought by growth and development, are thought to be the major causes of the substantial declines in the health of the remaining natural ecosystem.
A consensus has begun to emerge among environmental groups and Federal and State agen-cies that southern Florida, and par-ticularly the Everglades, should be restored to the extent possible to the predevelopment ecosystem. A first and primary step in this under-taking is the restoration of pre-development hydrologic conditions to the remaining natural system. Plans are to change the manmade water-conveyance system and restore the natural hydrologic cycle of the predevelopment Everglades as a means of contributing to over-all ecosystem restoration.
Everywhere and at all seasons of the year, the water in the glades is clear, pure, and though sometimes warm, palatable, without the least staleness or stagnan-cy.
—Edwin Asa Dix and Rev. John N. MacGonigle,
Century Magazine
, February 1905.
Introduction to the Southern Florida NAWQA Study Unit 5
Aquifers and Water Use
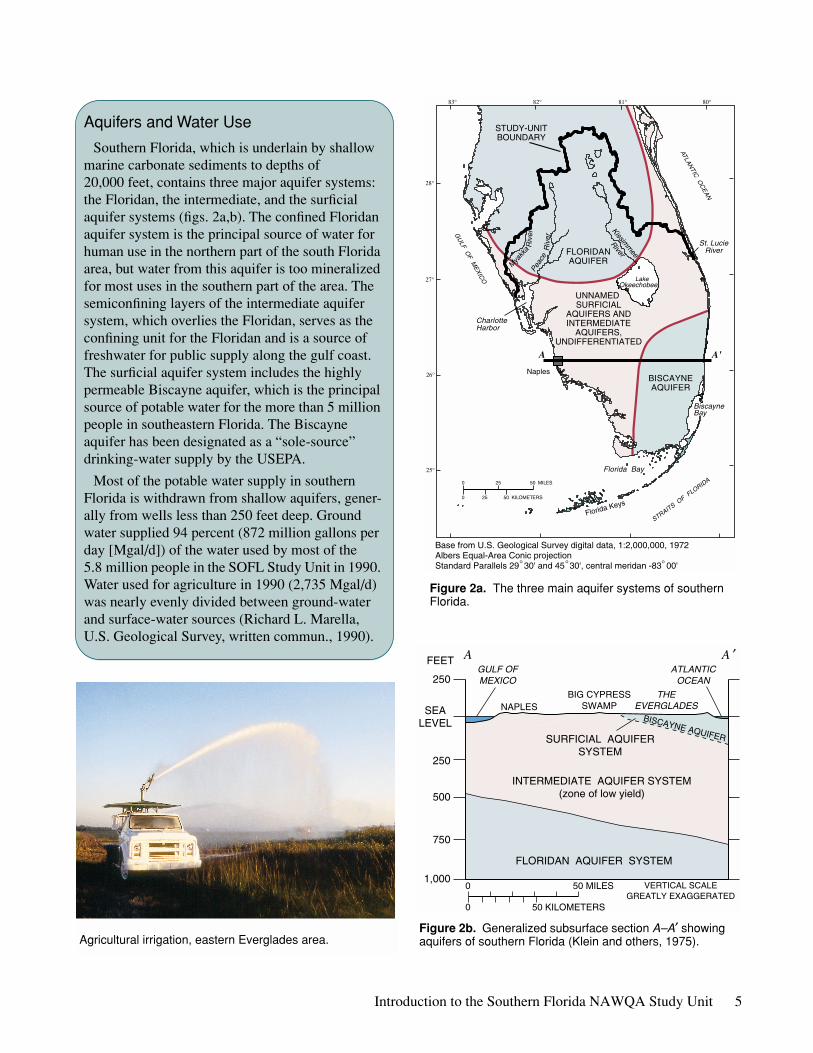
Southern Florida, which is underlain by shallow marine carbonate sediments to depths of 20,000 feet, contains three major aquifer systems: the Floridan, the intermediate, and the surficial aquifer systems (figs. 2a,b). The confined Floridan aquifer system is the principal source of water for human use in the northern part of the south Florida area, but water from this aquifer is too mineralized for most uses in the southern part of the area. The semiconfining layers of the intermediate aquifer system, which overlies the Floridan, serves as the confining unit for the Floridan and is a source of freshwater for public supply along the gulf coast. The surficial aquifer system includes the highly permeable Biscayne aquifer, which is the principal source of potable water for the more than 5 million people in southeastern Florida. The Biscayne aquifer has been designated as a “sole-source” drinking-water supply by the USEPA.
Most of the potable water supply in southern Florida is withdrawn from shallow aquifers, gener-ally from wells less than 250 feet deep. Ground water supplied 94 percent (872 million gallons per day [Mgal/d]) of the water used by most of the 5.8 million people in the SOFL Study Unit in 1990. Water used for agriculture in 1990 (2,735 Mgal/d) was nearly evenly divided between ground-water and surface-water sources (Richard L. Marella, U.S. Geological Survey, written commun., 1990).
CaloosahatcheeRiver
0 25 50 MILES
0 50 KILOMETERS25
25°
80°81°82°83°
28°
27°
26°
A A'
° ° °
Base from U.S. Geological Survey digital data, 1:2,000,000, 1972Albers Equal-Area Conic projectionStandard Parallels 29 30' and 45 30', central meridan -83 00'
ATLANTIC
OC
EAN
GU
LF OF M
EXICO
STRAITS OF F
LORIDA
Florida Keys
CharlotteHarbor
Florida Bay
St. LucieRiver
BiscayneBay
Peac
e
Riv
er
Mya
kka
Riv
er
Kissimm
ee
River
STUDY-UNITBOUNDARY
FLORIDANAQUIFER
UNNAMED SURFICIAL
AQUIFERS ANDINTERMEDIATE
AQUIFERS,UNDIFFERENTIATED
NaplesBISCAYNEAQUIFER
LakeOkeechobee
Figure 2a. The three main aquifer systems of southern Florida.
SHALLOW AQUIFER
A A ′
BISCAYNE AQUIFER
FLORIDAN AQUIFER SYSTEM
SURFICIAL AQUIFERSYSTEM
INTERMEDIATE AQUIFER SYSTEM(zone of low yield)
250
250
500
750
1,000
SEALEVEL
FEETGULF OFMEXICO
ATLANTICOCEAN
NAPLESBIG CYPRESS
SWAMPTHE
EVERGLADES
VERTICAL SCALEGREATLY EXAGGERATED
0 50 KILOMETERS
0 50 MILES
Figure 2b. Generalized subsurface section A–A′ showing aquifers of southern Florida (Klein and others, 1975).Agricultural irrigation, eastern Everglades area.
6 Water Quality in Southern Florida, 1996–98
• Drainage basins are poorly defined.• Surface and ground water are closely connected.• Sheetflow is common through the “River of Grass” and other wetlands.• Surface-water flow in canals and rivers is highly managed and regulated.• Organic soils (peats) are abundant, but much has been lost to oxidation.• The farming season is in winter.• Coastal meteorological effects often dominate.• Tropical storms are common.• Nutrient concentrations are naturally low in the Everglades and other pristine
wetlands.• Dissolved organic carbon concentrations are high.• Water color is dark in some rivers and wetlands. • There are extensive subtropical wetlands and public lands, including four
national parks, preserves, or refuges.• Many exotic species thrive in the subtropical climate.
HOW IS THE SOUTHERN FLORIDA NAWQA DIFFERENT FROM OTHER NAWQA STUDY UNITS?
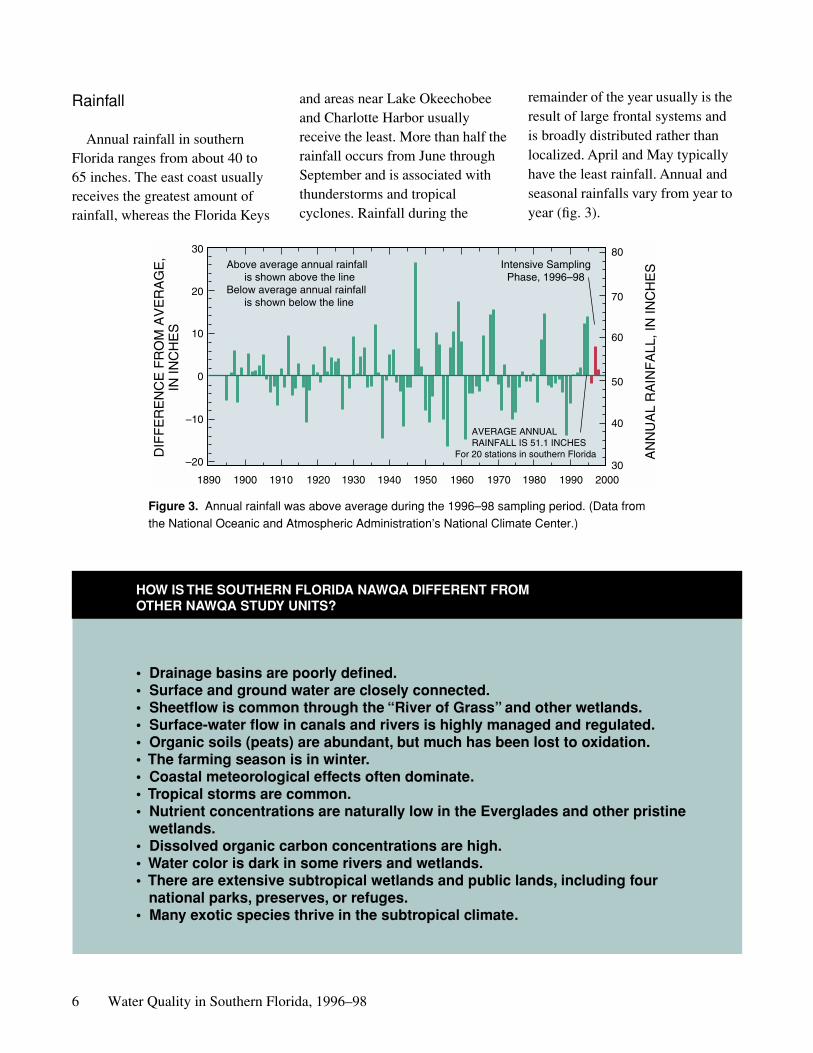
Rainfall
Annual rainfall in southern Florida ranges from about 40 to 65 inches. The east coast usually receives the greatest amount of rainfall, whereas the Florida Keys
80
70
60
50
40
30–20
–10
0
10
20
30
DIF
FE
RE
NC
E F
RO
M A
VE
RA
GE
,IN
INC
HE
S
AN
NU
AL
RA
INF
ALL
, IN
INC
HE
SIntensive SamplingPhase, 1996–98
Above average annual rainfall is shown above the lineBelow average annual rainfall is shown below the line
1890 1900 1910 1920 1930 1940 1950 1960 1970 1980 1990 2000
For 20 stations in southern Florida
AVERAGE ANNUALRAINFALL IS 51.1 INCHES
Figure 3. Annual rainfall was above average during the 1996–98 sampling period. (Data from the National Oceanic and Atmospheric Administration’s National Climate Center.)
and areas near Lake Okeechobee and Charlotte Harbor usually receive the least. More than half the rainfall occurs from June through September and is associated with thunderstorms and tropical cyclones. Rainfall during the
remainder of the year usually is the result of large frontal systems and is broadly distributed rather than localized. April and May typically have the least rainfall. Annual and seasonal rainfalls vary from year to year (fig. 3).
MAJOR FINDINGS
21 252024NUMBER OF SAMPLES
MEDIAN VALUE
29
Kissim
mee
Rive
r at S
-65E
47
Hillsbo
ro C
anal
36
Tam
iami C
anal
at B
R-105
28
Caloos
ahat
chee
Rive
r at A
lva
51
C-111
Can
al at
S-1
77 P33 P34 P35 P36
1.1
1.0
0.9
0.8
0.7
0.6
0.5
1.2
24
Peace
Rive
r at A
rcad
iaP
eace
Riv
er
36
U.S. S
ugar
Can
al1
U.S
. Sug
ar v
alue
of 0
.34
EXPLANATION
USEPA National Recommended Goal Everglades Water-Quality Standard
0
0.05
0.10
0.15
0.20
0.25
TOTA
L P
HO
SP
HO
RU
S,
IN M
ILLI
GR
AM
S P
ER
LIT
ER
NA
WQ
A S
ites
EN
P R
efer
ence
Site
s
Nutrient enrichment is prevalent in surface water
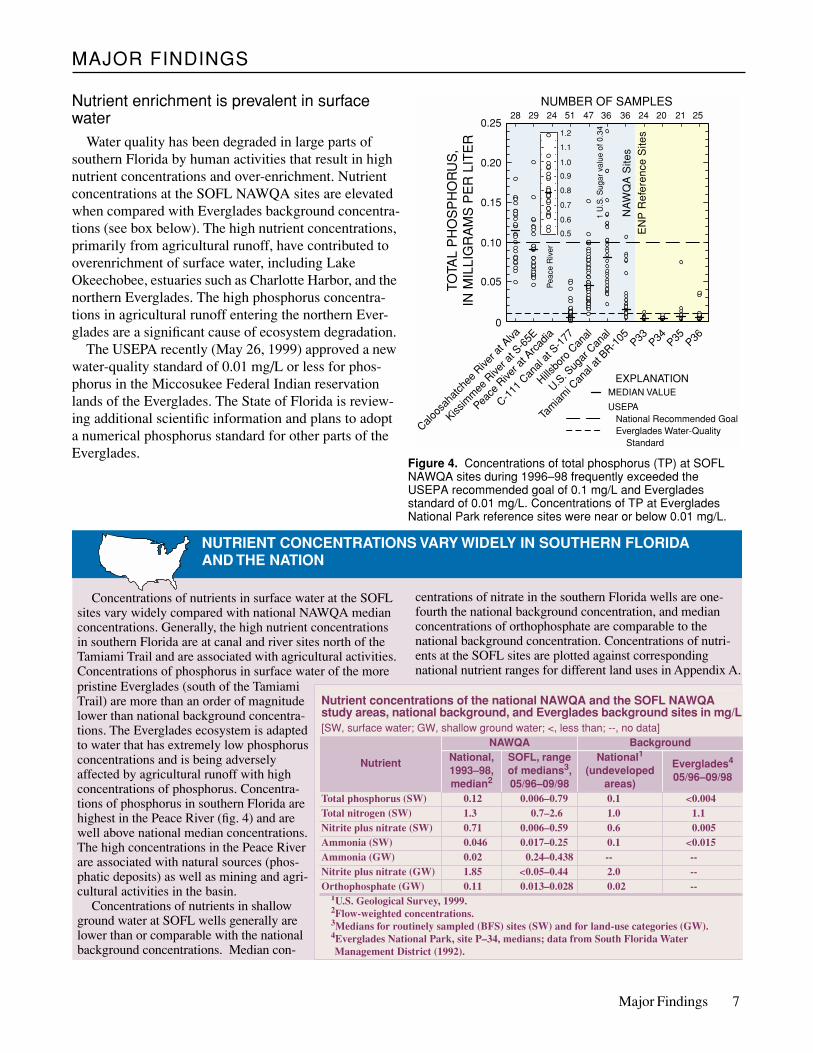
Water quality has been degraded in large parts of southern Florida by human activities that result in high nutrient concentrations and over-enrichment. Nutrient concentrations at the SOFL NAWQA sites are elevated when compared with Everglades background concentra-tions (see box below). The high nutrient concentrations, primarily from agricultural runoff, have contributed to overenrichment of surface water, including Lake Okeechobee, estuaries such as Charlotte Harbor, and the northern Everglades. The high phosphorus concentra-tions in agricultural runoff entering the northern Ever-glades are a significant cause of ecosystem degradation.
The USEPA recently (May 26, 1999) approved a new water-quality standard of 0.01 mg/L or less for phos-phorus in the Miccosukee Federal Indian reservation lands of the Everglades. The State of Florida is review-ing additional scientific information and plans to adopt a numerical phosphorus standard for other parts of the Everglades.
Figure 4. Concentrations of total phosphorus (TP) at SOFL NAWQA sites during 1996–98 frequently exceeded the USEPA recommended goal of 0.1 mg/L and Everglades standard of 0.01 mg/L. Concentrations of TP at Everglades National Park reference sites were near or below 0.01 mg/L.
NUTRIENT CONCENTRATIONS VARY WIDELY IN SOUTHERN FLORIDA AND THE NATION
Concentrations of nutrients in surface water at the SOFL sites vary widely compared with national NAWQA median concentrations. Generally, the high nutrient concentrations in southern Florida are at canal and river sites north of the Tamiami Trail and are associated with agricultural activities. Concentrations of phosphorus in surface water of the more
Nutrient concentrations of the national NAWQA and the SOFL NAWQA study areas, national background, and Everglades background sites in mg/L[SW, surface water; GW, shallow ground water; <, less than; --, no data]
Nutrient
NAWQA BackgroundNational, 1993–98, median2
SOFL, range of medians3, 05/96–09/98
National1
(undeveloped areas)
Everglades4
05/96–09/98
Total phosphorus (SW) 0.12 0.006–0.79 0.1 <0.004Total nitrogen (SW) 1.3 0.7–2.6 1.0 1.1Nitrite plus nitrate (SW) 0.71 0.006–0.59 0.6 0.005Ammonia (SW) 0.046 0.017–0.25 0.1 <0.015Ammonia (GW) 0.02 0.24–0.438 -- --Nitrite plus nitrate (GW) 1.85 <0.05–0.44 2.0 --Orthophosphate (GW) 0.11 0.013–0.028 0.02 --
1U.S. Geological Survey, 1999.2Flow-weighted concentrations.3Medians for routinely sampled (BFS) sites (SW) and for land-use categories (GW).4Everglades National Park, site P–34, medians; data from South Florida Water
Management District (1992).
pristine Everglades (south of the Tamiami Trail) are more than an order of magnitude lower than national background concentra-tions. The Everglades ecosystem is adapted to water that has extremely low phosphorus concentrations and is being adversely affected by agricultural runoff with high concentrations of phosphorus. Concentra-tions of phosphorus in southern Florida are highest in the Peace River (fig. 4) and are well above national median concentrations. The high concentrations in the Peace River are associated with natural sources (phos-phatic deposits) as well as mining and agri-cultural activities in the basin.
Concentrations of nutrients in shallow ground water at SOFL wells generally are lower than or comparable with the national background concentrations. Median con-
centrations of nitrate in the southern Florida wells are one-fourth the national background concentration, and median concentrations of orthophosphate are comparable to the national background concentration. Concentrations of nutri-ents at the SOFL sites are plotted against corresponding national nutrient ranges for different land uses in Appendix A.
Major Findings 7
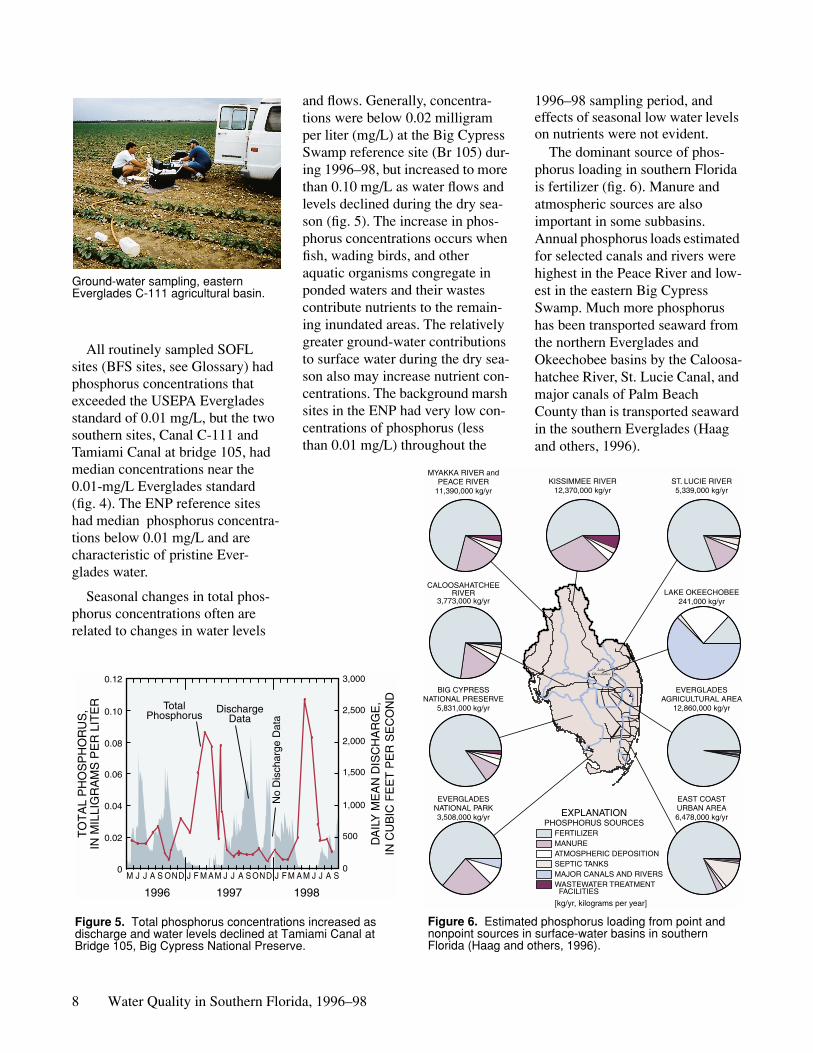
Ground-water sampling, eastern Everglades C-111 agricultural basin.
KISSIMMEE RIVER12,370,000 kg/yr
MYAKKA RIVER andPEACE RIVER
11,390,000 kg/yrST. LUCIE RIVER5,339,000 kg/yr
LAKE OKEECHOBEE241,000 kg/yr
CALOOSAHATCHEERIVER
3,773,000 kg/yr
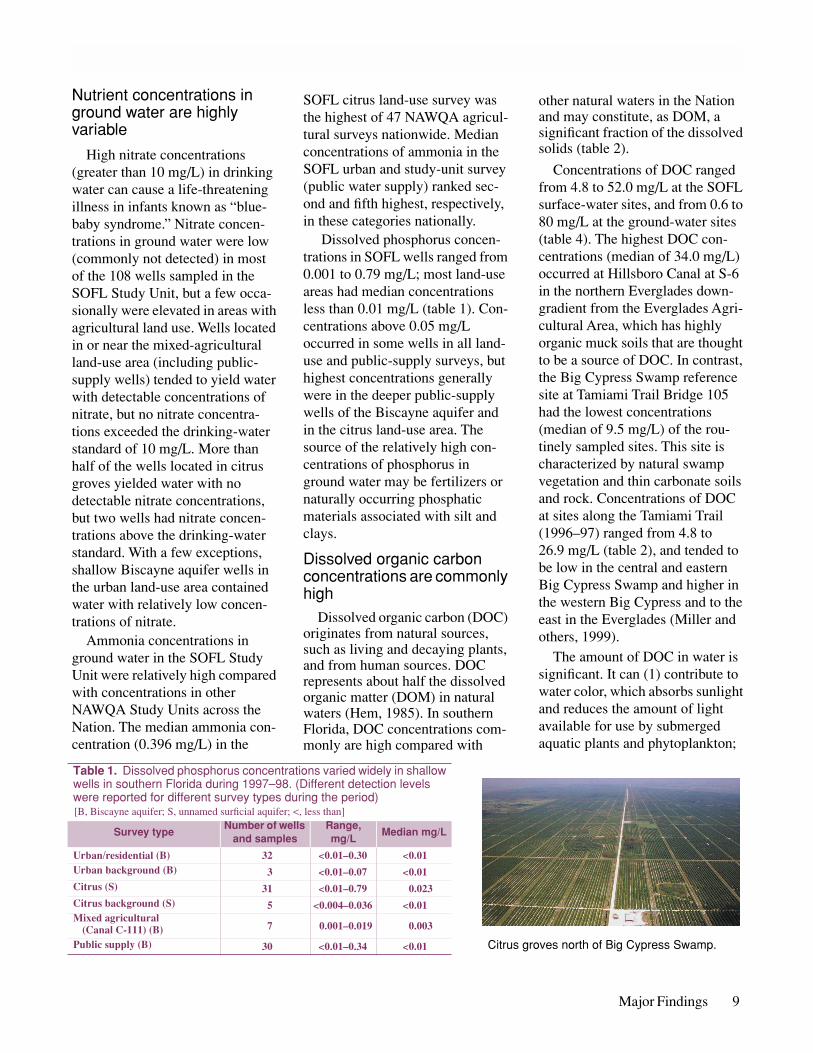
All routinely sampled SOFL sites (BFS sites, see Glossary) had phosphorus concentrations that exceeded the USEPA Everglades standard of 0.01 mg/L, but the two southern sites, Canal C-111 and Tamiami Canal at bridge 105, had median concentrations near the 0.01-mg/L Everglades standard (fig. 4). The ENP reference sites had median phosphorus concentra-tions below 0.01 mg/L and are characteristic of pristine Ever-glades water.
Seasonal changes in total phos-phorus concentrations often are related to changes in water levels
8 Water Quality in Southern Flori
No
Dis
char
ge D
ata
DischargeData
0
0.02
0.04
0.06
0.08
0.10
0.12
TO
TA
L P
HO
SP
HO
RU
S,
IN M
ILLI
GR
AM
S P
ER
LIT
ER
M J J A S OND J F M AM J J A S OND J F M
19971996
TotalPhosphorus
Figure 5. Total phosphorus concentratiodischarge and water levels declined at TaBridge 105, Big Cypress National Preserv
and flows. Generally, concentra-tions were below 0.02 milligram per liter (mg/L) at the Big Cypress Swamp reference site (Br 105) dur-ing 1996–98, but increased to more than 0.10 mg/L as water flows and levels declined during the dry sea-son (fig. 5). The increase in phos-phorus concentrations occurs when fish, wading birds, and other aquatic organisms congregate in ponded waters and their wastes contribute nutrients to the remain-ing inundated areas. The relatively greater ground-water contributions to surface water during the dry sea-son also may increase nutrient con-centrations. The background marsh sites in the ENP had very low con-centrations of phosphorus (less than 0.01 mg/L) throughout the
da, 1996–98
DA
ILY
ME
AN
DIS
CH
AR
GE
,IN
CU
BIC
FE
ET
PE
R S
EC
ON
D
0
500
1,000
1,500
2,000
3,000
2,500
A M J J A S
1998
ns increased as miami Canal at e.
BIG CYPRESSNATIONAL PRESERVE
5,831,000 kg/yr
EVERGLADESNATIONAL PARK3,508,000 kg/yr
Figure 6. Estimatnonpoint sources Florida (Haag and
1996–98 sampling period, and effects of seasonal low water levels on nutrients were not evident.
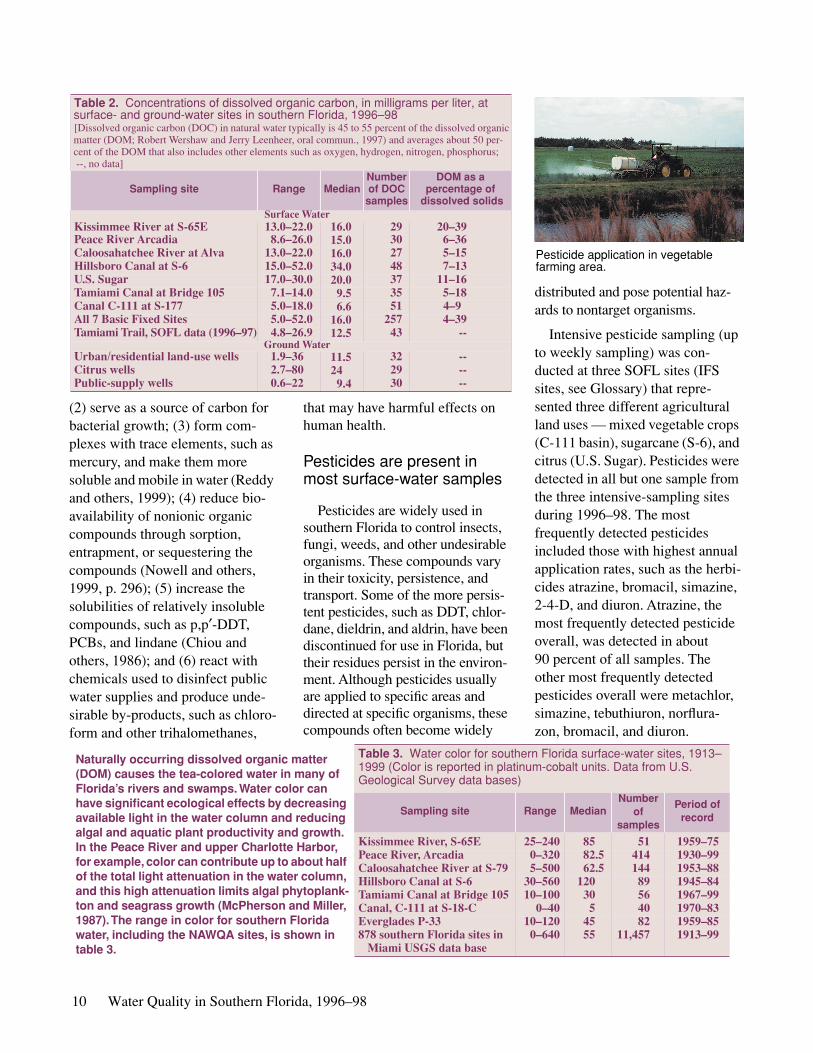
The dominant source of phos-phorus loading in southern Florida is fertilizer (fig. 6). Manure and atmospheric sources are also important in some subbasins. Annual phosphorus loads estimated for selected canals and rivers were highest in the Peace River and low-est in the eastern Big Cypress Swamp. Much more phosphorus has been transported seaward from the northern Everglades and Okeechobee basins by the Caloosa-hatchee River, St. Lucie Canal, and major canals of Palm Beach County than is transported seaward in the southern Everglades (Haag and others, 1996).
LakeOkeechobee
[kg/yr, kilograms per year]
PHOSPHORUS SOURCESEXPLANATION
EAST COASTURBAN AREA6,478,000 kg/yr
FERTILIZERMANUREATMOSPHERIC DEPOSITIONSEPTIC TANKSMAJOR CANALS AND RIVERSWASTEWATER TREATMENT FACILITIES
EVERGLADESAGRICULTURAL AREA
12,860,000 kg/yr
ed phosphorus loading from point and in surface-water basins in southern others, 1996).
Nutrient concentrations in ground water are highly variable
High nitrate concentrations (greater than 10 mg/L) in drinking water can cause a life-threatening illness in infants known as “blue-baby syndrome.” Nitrate concen-trations in ground water were low (commonly not detected) in most of the 108 wells sampled in the SOFL Study Unit, but a few occa-sionally were elevated in areas with agricultural land use. Wells located in or near the mixed-agricultural land-use area (including public-supply wells) tended to yield water with detectable concentrations of nitrate, but no nitrate concentra-tions exceeded the drinking-water standard of 10 mg/L. More than half of the wells located in citrus groves yielded water with no detectable nitrate concentrations, but two wells had nitrate concen-trations above the drinking-water standard. With a few exceptions, shallow Biscayne aquifer wells in the urban land-use area contained water with relatively low concen-trations of nitrate.
Ammonia concentrations in ground water in the SOFL Study Unit were relatively high compared with concentrations in other NAWQA Study Units across the Nation. The median ammonia con-centration (0.396 mg/L) in the
Table 1. Dissolved phosphorus concentrawells in southern Florida during 1997–98.were reported for different survey types d[B, Biscayne aquifer; S, unnamed surficial aquifer;
Survey typeNumber of we
and sample
Urban/residential (B) 32Urban background (B) 3Citrus (S) 31Citrus background (S) 5Mixed agricultural
(Canal C-111) (B) 7
Public supply (B) 30
SOFL citrus land-use survey was the highest of 47 NAWQA agricul-tural surveys nationwide. Median concentrations of ammonia in the SOFL urban and study-unit survey (public water supply) ranked sec-ond and fifth highest, respectively, in these categories nationally.
Dissolved phosphorus concen-trations in SOFL wells ranged from 0.001 to 0.79 mg/L; most land-use areas had median concentrations less than 0.01 mg/L (table 1). Con-centrations above 0.05 mg/L occurred in some wells in all land-use and public-supply surveys, but highest concentrations generally were in the deeper public-supply wells of the Biscayne aquifer and in the citrus land-use area. The source of the relatively high con-centrations of phosphorus in ground water may be fertilizers or naturally occurring phosphatic materials associated with silt and clays.
t u<ls
Dissolved organic carbon concentrations are commonly high
Dissolved organic carbon (DOC) originates from natural sources, such as living and decaying plants, and from human sources. DOC represents about half the dissolved organic matter (DOM) in natural waters (Hem, 1985). In southern Florida, DOC concentrations com-monly are high compared with
ions varied widely in shallow (Different detection levels ring the period), less than]ls Range,
mg/L Median mg/L
<0.01–0.30 <0.01
<0.01–0.07 <0.01
<0.01–0.79 0.023
<0.004–0.036 <0.01
0.001–0.019 0.003
<0.01–0.34 <0.01 Citrus g
other natural waters in the Nation and may constitute, as DOM, a significant fraction of the dissolved solids (table 2).
Concentrations of DOC ranged from 4.8 to 52.0 mg/L at the SOFL surface-water sites, and from 0.6 to 80 mg/L at the ground-water sites (table 4). The highest DOC con-centrations (median of 34.0 mg/L) occurred at Hillsboro Canal at S-6 in the northern Everglades down-gradient from the Everglades Agri-cultural Area, which has highly organic muck soils that are thought to be a source of DOC. In contrast, the Big Cypress Swamp reference site at Tamiami Trail Bridge 105 had the lowest concentrations (median of 9.5 mg/L) of the rou-tinely sampled sites. This site is characterized by natural swamp vegetation and thin carbonate soils and rock. Concentrations of DOC at sites along the Tamiami Trail (1996–97) ranged from 4.8 to 26.9 mg/L (table 2), and tended to be low in the central and eastern Big Cypress Swamp and higher in the western Big Cypress and to the east in the Everglades (Miller and others, 1999).
The amount of DOC in water is significant. It can (1) contribute to water color, which absorbs sunlight and reduces the amount of light available for use by submerged aquatic plants and phytoplankton;
Major Findings 9
roves north of Big Cypress Swamp.
Pesticide application in vegetable farming area.
Table 2.
Concentrations of dissolved organic carbon, in milligrams per liter, at surface- and ground-water sites in southern Florida, 1996–98
[Dissolved organic carbon (DOC) in natural water typically is 45 to 55 percent of the dissolved organic matter (DOM; Robert Wershaw and Jerry Leenheer, oral commun., 1997) and averages about 50 per-cent of the DOM that also includes other elements such as oxygen, hydrogen, nitrogen, phosphorus; --, no data]
Sampling site Range MedianNumber of DOC
samples
DOM as a percentage of
dissolved solids
Surface Water
Kissimmee River at S-65E 13.0–22.0 16.0 29 20–39Peace River Arcadia 8.6–26.0 15.0 30 6–36Caloosahatchee River at Alva 13.0–22.0 16.0 27 5–15Hillsboro Canal at S-6 15.0–52.0 34.0 48 7–13U.S. Sugar 17.0–30.0 20.0 37 11–16Tamiami Canal at Bridge 105 7.1–14.0 9.5 35 5–18Canal C-111 at S-177 5.0–18.0 6.6 51 4–9All 7 Basic Fixed Sites 5.0–52.0 16.0 257 4–39Tamiami Trail, SOFL data (1996–97) 4.8–26.9 12.5 43 --
Ground Water
Urban/residential land-use wells 1.9–36 11.5 32 --Citrus wells 2.7–80 24 29 --Public-supply wells 0.6–22 9.4 30 --
(2) serve as a source of carbon for bacterial growth; (3) form com-plexes with trace elements, such as mercury, and make them more soluble and mobile in water (Reddy and others, 1999); (4) reduce bio-availability of nonionic organic compounds through sorption, entrapment, or sequestering the compounds (Nowell and others, 1999, p. 296); (5) increase the solubilities of relatively insoluble compounds, such as p,p′-DDT, PCBs, and lindane (Chiou and others, 1986); and (6) react with chemicals used to disinfect public water supplies and produce unde-sirable by-products, such as chloro-form and other trihalomethanes,
10 Water Quality in Southern Flori
that may have harmful effects on human health.
Pesticides are present in most surface-water samples
Pesticides are widely used in southern Florida to control insects, fungi, weeds, and other undesirable organisms. These compounds vary in their toxicity, persistence, and transport. Some of the more persis-tent pesticides, such as DDT, chlor-dane, dieldrin, and aldrin, have been discontinued for use in Florida, but their residues persist in the environ-ment. Although pesticides usually are applied to specific areas and directed at specific organisms, these compounds often become widely
da, 1996–98
Table 3. Water color for southe1999 (Color is reported in platinuGeological Survey data bases)
Sampling site R
Kissimmee River, S-65E 2Peace River, ArcadiaCaloosahatchee River at S-79Hillsboro Canal at S-6 3Tamiami Canal at Bridge 105 1Canal, C-111 at S-18-CEverglades P-33 1878 southern Florida sites in
Miami USGS data base
distributed and pose potential haz-ards to nontarget organisms.
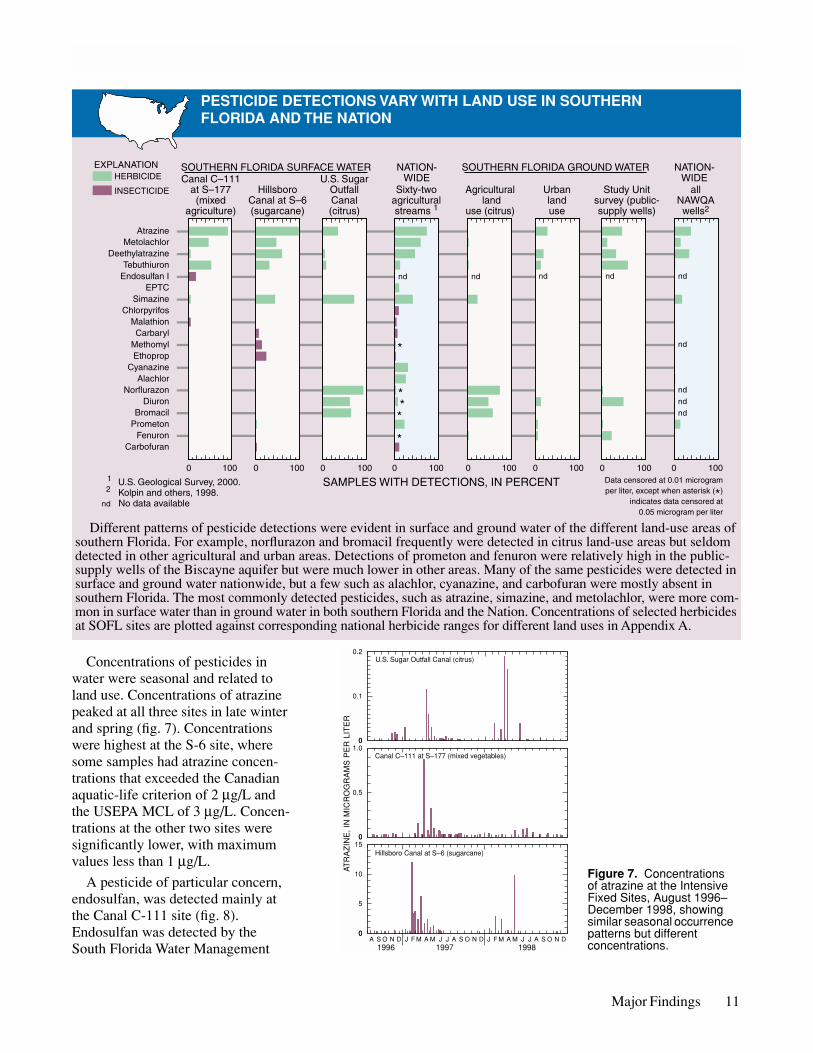
Intensive pesticide sampling (up to weekly sampling) was con-ducted at three SOFL sites (IFS sites, see Glossary) that repre-sented three different agricultural land uses — mixed vegetable crops (C-111 basin), sugarcane (S-6), and citrus (U.S. Sugar). Pesticides were detected in all but one sample from the three intensive-sampling sites during 1996–98. The most frequently detected pesticides included those with highest annual application rates, such as the herbi-cides atrazine, bromacil, simazine, 2-4-D, and diuron. Atrazine, the most frequently detected pesticide overall, was detected in about 90 percent of all samples. The other most frequently detected pesticides overall were metachlor, simazine, tebuthiuron, norflura-zon, bromacil, and diuron.
rn Florida surface-water sites, 1913–m-cobalt units. Data from U.S.
ange MedianNumber
ofsamples
Period of record
5–240 85 51 1959–750–320 82.5 414 1930–995–500 62.5 144 1953–880–560 120 89 1945–840–100 30 56 1967–990–40 5 40 1970–83
0–120 45 82 1959–850–640 55 11,457 1913–99
Naturally occurring dissolved organic matter (DOM) causes the tea-colored water in many of Florida’s rivers and swamps. Water color can have significant ecological effects by decreasing available light in the water column and reducing algal and aquatic plant productivity and growth. In the Peace River and upper Charlotte Harbor, for example, color can contribute up to about half of the total light attenuation in the water column, and this high attenuation limits algal phytoplank-ton and seagrass growth (McPherson and Miller, 1987). The range in color for southern Florida water, including the NAWQA sites, is shown in table 3.
U.S. SugarOutfallCanal(citrus)
HillsboroCanal at S–6(sugarcane)
Sixty-twoagriculturalstreams 1
nd nd nd nd
1 U.S. Geological Survey, 2000. 2 Kolpin and others, 1998.nd No data available
Canal C–111at S–177(mixed
agriculture)
SAMPLES WITH DETECTIONS, IN PERCENT1000 100010001000
Study Unitsurvey (public-supply wells)
Urbanlanduse
allNAWQAwells2
Agricultural land
use (citrus)
1000 100010001000
Atrazine
DeethylatrazineMetolachlor
Simazine
Fenuron
Tebuthiuron
Norflurazon
BromacilDiuron
Endosulfan I
Alachlor
EPTC
CyanazineEthoprop
ChlorpyrifosMalathionCarbaryl
Methomyl
Prometon
Carbofuran
SOUTHERN FLORIDA SURFACE WATER NATION-WIDE
NATION-WIDE
SOUTHERN FLORIDA GROUND WATERHERBICIDE
INSECTICIDE
EXPLANATION
Data censored at 0.01 microgramper liter, except when asterisk (*)
indicates data censored at0.05 microgram per liter
nd
nd
nd
nd
nd
*
***
*
A S O N D J F M A M J J A S O N D J F M A M J J A S O N D1996 1997 1998
ATR
AZ
INE
, IN
MIC
RO
GR
AM
S P
ER
LIT
ER
0
1.0
0
0.5
U.S. Sugar Outfall Canal (citrus)
015
0
5
10
0
0.2
0
0.1
Hillsboro Canal at S–6 (sugarcane)
Canal C–111 at S–177 (mixed vegetables)
Figure 7. Concentrations of atrazine at the Intensive Fixed Sites, August 1996–December 1998, showing similar seasonal occurrence patterns but different concentrations.
Concentrations of pesticides in water were seasonal and related to land use. Concentrations of atrazine peaked at all three sites in late winter and spring (fig. 7). Concentrations were highest at the S-6 site, where some samples had atrazine concen-trations that exceeded the Canadian aquatic-life criterion of 2 µg/L and the USEPA MCL of 3 µg/L. Concen-trations at the other two sites were significantly lower, with maximum values less than 1 µg/L.
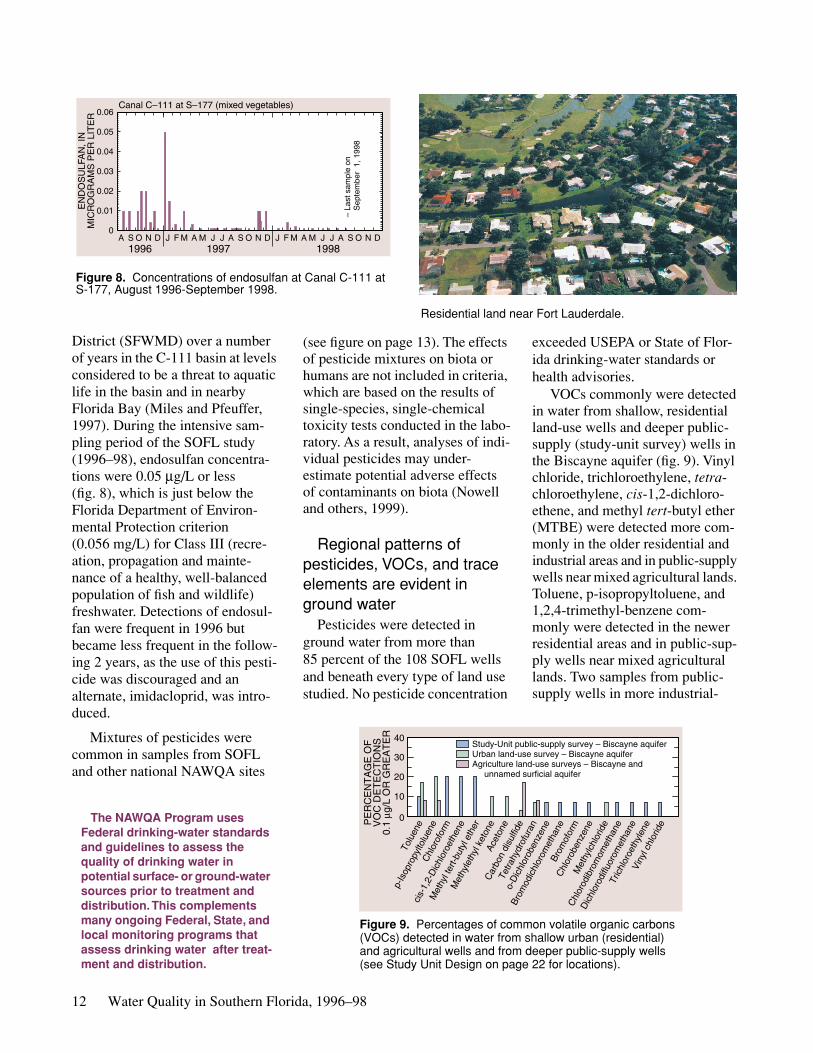
A pesticide of particular concern, endosulfan, was detected mainly at the Canal C-111 site (fig. 8). Endosulfan was detected by the South Florida Water Management
PESTICIDE DETECTIONS VARY WITH LAND USE IN SOUTHERN FLORIDA AND THE NATION
Different patterns of pesticide detections were evident in surface and ground water of the different land-use areas of southern Florida. For example, norflurazon and bromacil frequently were detected in citrus land-use areas but seldom detected in other agricultural and urban areas. Detections of prometon and fenuron were relatively high in the public-supply wells of the Biscayne aquifer but were much lower in other areas. Many of the same pesticides were detected in surface and ground water nationwide, but a few such as alachlor, cyanazine, and carbofuran were mostly absent in southern Florida. The most commonly detected pesticides, such as atrazine, simazine, and metolachlor, were more com-mon in surface water than in ground water in both southern Florida and the Nation. Concentrations of selected herbicides at SOFL sites are plotted against corresponding national herbicide ranges for different land uses in Appendix A.
Major Findings 11
0.06
0
0.01
0.02
0.03
0.04
0.05
– La
st s
ampl
e on
S
epte
mbe
r 1
, 199
8
A S O N D J F M A M J J A S O N D J F M A M J J A S O N D
EN
DO
SU
LFA
N, I
NM
ICR
OG
RA
MS
PE
R L
ITE
R
Canal C–111 at S–177 (mixed vegetables)
1996 1997 1998
Figure 8. Concentrations of endosulfan at Canal C-111 at S-177, August 1996-September 1998.
Residential land near Fort Lauderdale.
30
40
20TA
GE
OF
EC
TIO
NS
GR
EA
TE
R
Study-Unit public-supply survey – Biscayne aquiferUrban land-use survey – Biscayne aquiferAgriculture land-use surveys – Biscayne and unnamed surficial aquifer
District (SFWMD) over a number of years in the C-111 basin at levels considered to be a threat to aquatic life in the basin and in nearby Florida Bay (Miles and Pfeuffer, 1997). During the intensive sam-pling period of the SOFL study (1996–98), endosulfan concentra-tions were 0.05 µg/L or less (fig. 8), which is just below the Florida Department of Environ-mental Protection criterion (0.056 mg/L) for Class III (recre-ation, propagation and mainte-nance of a healthy, well-balanced population of fish and wildlife) freshwater. Detections of endosul-fan were frequent in 1996 but became less frequent in the follow-ing 2 years, as the use of this pesti-cide was discouraged and an alternate, imidacloprid, was intro-duced.
Mixtures of pesticides were common in samples from SOFL and other national NAWQA sites
12 Water Quality in Southern Flori
(see figure on page 13). The effects of pesticide mixtures on biota or humans are not included in criteria, which are based on the results of single-species, single-chemical toxicity tests conducted in the labo-ratory. As a result, analyses of indi-vidual pesticides may under-estimate potential adverse effects of contaminants on biota (Nowell and others, 1999).
Tolu
ene
p-Is
opro
pylto
luen
eC
hlor
ofor
m
cis-
1,2-
Dic
hlor
oeth
ene
Met
hyl t
ert-b
utyl
eth
er
Met
hyle
thyl
ket
one
Acet
one
Car
bon
disu
lfide
Tetra
hydr
ofur
an
o-D
ichl
orob
enze
ne
Brom
odic
hlor
omet
hane
Brom
ofor
m
Chl
orob
enze
neM
ethy
lchl
orid
e
Chl
orod
ibro
mom
etha
ne
Dic
hlor
odifl
uoro
met
hane
Tric
hlor
oeth
ylen
eVi
nyl c
hlor
ide
0
10
PE
RC
EN
VO
C D
ET
0.1
µg/L
OR
Figure 9. Percentages of common volatile organic carbons (VOCs) detected in water from shallow urban (residential) and agricultural wells and from deeper public-supply wells (see Study Unit Design on page 22 for locations).
The NAWQA Program uses Federal drinking-water standards and guidelines to assess the quality of drinking water in potential surface- or ground-water sources prior to treatment and distribution. This complements many ongoing Federal, State, and local monitoring programs that assess drinking water after treat-ment and distribution.
Regional patterns of pesticides, VOCs, and trace elements are evident in ground water
Pesticides were detected in ground water from more than 85 percent of the 108 SOFL wells and beneath every type of land use studied. No pesticide concentration
da, 1996–98
exceeded USEPA or State of Flor-ida drinking-water standards or health advisories.
VOCs commonly were detected in water from shallow, residential land-use wells and deeper public-supply (study-unit survey) wells in the Biscayne aquifer (fig. 9). Vinyl chloride, trichloroethylene, tetra-chloroethylene, cis-1,2-dichloro-ethene, and methyl tert-butyl ether (MTBE) were detected more com-monly in the older residential and industrial areas and in public-supply wells near mixed agricultural lands. Toluene, p-isopropyltoluene, and 1,2,4-trimethyl-benzene com-monly were detected in the newer residential areas and in public-sup-ply wells near mixed agricultural lands. Two samples from public-supply wells in more industrial-
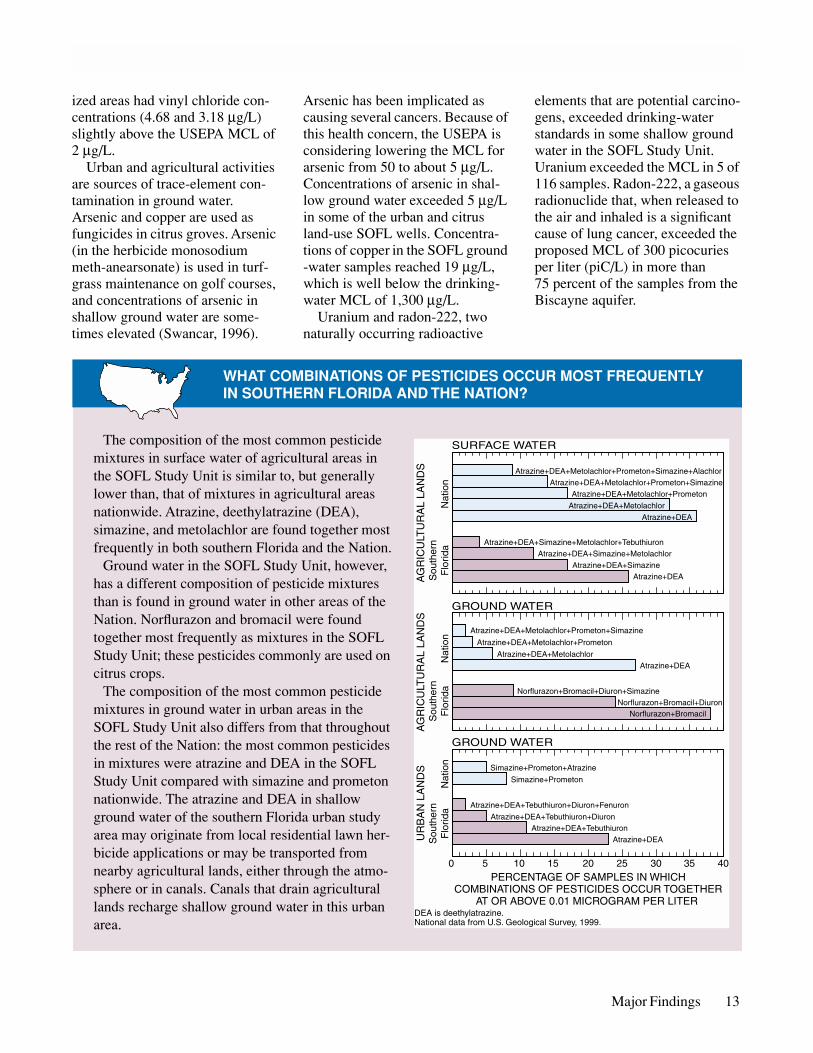
ized areas had vinyl chloride con-centrations (4.68 and 3.18 µg/L) slightly above the USEPA MCL of 2 µg/L.
Urban and agricultural activities are sources of trace-element con-tamination in ground water. Arsenic and copper are used as fungicides in citrus groves. Arsenic (in the herbicide monosodium meth-anearsonate) is used in turf-grass maintenance on golf courses, and concentrations of arsenic in shallow ground water are some-times elevated (Swancar, 1996).
Arsenic has been implicated as causing several cancers. Because of this health concern, the USEPA is considering lowering the MCL for arsenic from 50 to about 5 µg/L. Concentrations of arsenic in shal-low ground water exceeded 5 µg/L in some of the urban and citrus land-use SOFL wells. Concentra-tions of copper in the SOFL ground -water samples reached 19 µg/L, which is well below the drinking-water MCL of 1,300 µg/L.
Uranium and radon-222, two naturally occurring radioactive
0 5 10
SURFACE W
GROUND WA
GROUND WA
PERCECOMBINATION
AT OR ABDEA is deethylatrazine.National data from U.S. Geol
Atrazine+DE
Atr
No
Atrazine
Atrazine+DEA
Atrazine+DEA+
Atrazine+
Atrazine+DEA+
Sim
Simazine+
Nat
ion
AG
RIC
ULT
UR
AL
LAN
DS
Sou
ther
nF
lorid
aN
atio
n
AG
RIC
ULT
UR
AL
LAN
DS
Sou
ther
nF
lorid
aN
atio
n
UR
BA
N L
AN
DS
Sou
ther
nF
lorid
a
elements that are potential carcino-gens, exceeded drinking-water standards in some shallow ground water in the SOFL Study Unit. Uranium exceeded the MCL in 5 of 116 samples. Radon-222, a gaseous radionuclide that, when released to the air and inhaled is a significant cause of lung cancer, exceeded the proposed MCL of 300 picocuries per liter (piC/L) in more than 75 percent of the samples from the Biscayne aquifer.
WHAT COMBINATIONS OF PESTICIDES OCCUR MOST FREQUENTLY IN SOUTHERN FLORIDA AND THE NATION?
15 20 25 30 35 40
ATER
TER
TER
NTAGE OF SAMPLES IN WHICHS OF PESTICIDES OCCUR TOGETHER
OVE 0.01 MICROGRAM PER LITER
ogical Survey, 1999.
Atrazine+DEA+SimazineAtrazine+DEA
Atrazine+DEA+Simazine+MetolachlorA+Simazine+Metolachlor+Tebuthiuron
Atrazine+DEA
Atrazine+DEA+Metolachlor
Atrazine+DEA+Metolachlor+PrometonAtrazine+DEA+Metolachlor+Prometon+Simazine
azine+DEA+Metolachlor+Prometon+Simazine+Alachlor
Norflurazon+BromacilNorflurazon+Bromacil+Diuron
rflurazon+Bromacil+Diuron+Simazine
Atrazine+DEA+DEA+Metolachlor
+Metolachlor+Prometon
Metolachlor+Prometon+Simazine
Atrazine+DEAAtrazine+DEA+Tebuthiuron
DEA+Tebuthiuron+Diuron
Tebuthiuron+Diuron+Fenuron
azine+Prometon
Prometon+Atrazine
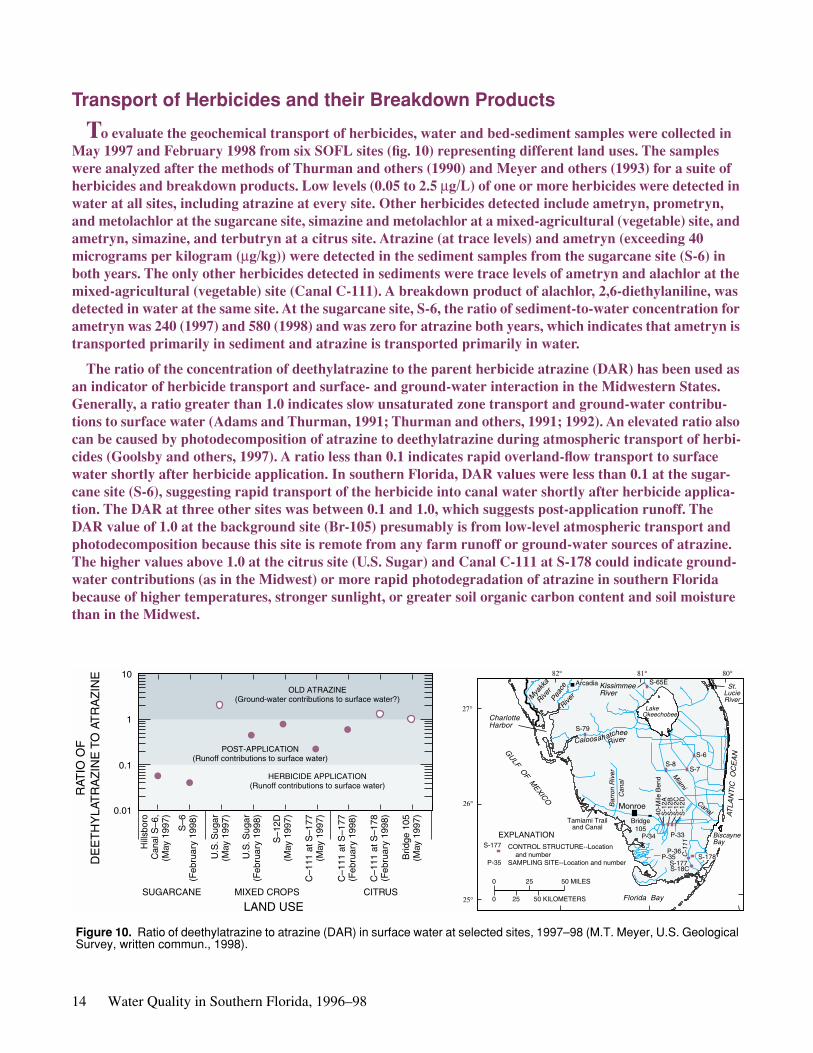
The composition of the most common pesticide mixtures in surface water of agricultural areas in the SOFL Study Unit is similar to, but generally lower than, that of mixtures in agricultural areas nationwide. Atrazine, deethylatrazine (DEA), simazine, and metolachlor are found together most frequently in both southern Florida and the Nation.
Ground water in the SOFL Study Unit, however, has a different composition of pesticide mixtures than is found in ground water in other areas of the Nation. Norflurazon and bromacil were found together most frequently as mixtures in the SOFL Study Unit; these pesticides commonly are used on citrus crops.
The composition of the most common pesticide mixtures in ground water in urban areas in the SOFL Study Unit also differs from that throughout the rest of the Nation: the most common pesticides in mixtures were atrazine and DEA in the SOFL Study Unit compared with simazine and prometon nationwide. The atrazine and DEA in shallow ground water of the southern Florida urban study area may originate from local residential lawn her-bicide applications or may be transported from nearby agricultural lands, either through the atmo-sphere or in canals. Canals that drain agricultural lands recharge shallow ground water in this urban area.
Major Findings 13
Transport of Herbicides and their Breakdown Products
To evaluate the geochemical transport of herbicides, water and bed-sediment samples were collected in May 1997 and February 1998 from six SOFL sites (fig. 10) representing different land uses. The samples were analyzed after the methods of Thurman and others (1990) and Meyer and others (1993) for a suite of herbicides and breakdown products. Low levels (0.05 to 2.5 µg/L) of one or more herbicides were detected in water at all sites, including atrazine at every site. Other herbicides detected include ametryn, prometryn, and metolachlor at the sugarcane site, simazine and metolachlor at a mixed-agricultural (vegetable) site, and ametryn, simazine, and terbutryn at a citrus site. Atrazine (at trace levels) and ametryn (exceeding 40 micrograms per kilogram (µg/kg)) were detected in the sediment samples from the sugarcane site (S-6) in both years. The only other herbicides detected in sediments were trace levels of ametryn and alachlor at the mixed-agricultural (vegetable) site (Canal C-111). A breakdown product of alachlor, 2,6-diethylaniline, was detected in water at the same site. At the sugarcane site, S-6, the ratio of sediment-to-water concentration for ametryn was 240 (1997) and 580 (1998) and was zero for atrazine both years, which indicates that ametryn is transported primarily in sediment and atrazine is transported primarily in water.
The ratio of the concentration of deethylatrazine to the parent herbicide atrazine (DAR) has been used as an indicator of herbicide transport and surface- and ground-water interaction in the Midwestern States. Generally, a ratio greater than 1.0 indicates slow unsaturated zone transport and ground-water contribu-tions to surface water (Adams and Thurman, 1991; Thurman and others, 1991; 1992). An elevated ratio also can be caused by photodecomposition of atrazine to deethylatrazine during atmospheric transport of herbi-cides (Goolsby and others, 1997). A ratio less than 0.1 indicates rapid overland-flow transport to surface water shortly after herbicide application. In southern Florida, DAR values were less than 0.1 at the sugar-cane site (S-6), suggesting rapid transport of the herbicide into canal water shortly after herbicide applica-tion. The DAR at three other sites was between 0.1 and 1.0, which suggests post-application runoff. The DAR value of 1.0 at the background site (Br-105) presumably is from low-level atmospheric transport and photodecomposition because this site is remote from any farm runoff or ground-water sources of atrazine. The higher values above 1.0 at the citrus site (U.S. Sugar) and Canal C-111 at S-178 could indicate ground-water contributions (as in the Midwest) or more rapid photodegradation of atrazine in southern Florida because of higher temperatures, stronger sunlight, or greater soil organic carbon content and soil moisture than in the Midwest.
14 Water Quality in Southern Florida, 1996–98
OLD ATRAZINE(Ground-water contributions to surface water?)
POST-APPLICATION(Runoff contributions to surface water)
HERBICIDE APPLICATION(Runoff contributions to surface water)
10
1
0.1
0.01
RAT
IO O
FD
EE
TH
YLA
TR
AZ
INE
TO
AT
RA
ZIN
E
Hill
sbor
oC
anal
S–6
,(M
ay 1
997)
S–6
(Feb
ruar
y 19
98)
C–1
11 a
t S–1
77(M
ay 1
997)
C–1
11 a
t S–1
77(F
ebru
ary
1998
)
C–1
11 a
t S–1
78(F
ebru
ary
1998
)
Brid
ge 1
05(M
ay 1
997)
U.S
. Sug
ar(M
ay 1
997)
U.S
. Sug
ar(F
ebru
ary
1998
)
S–1
2D(M
ay 1
997)
SUGARCANE MIXED CROPS
LAND USECITRUS
25°
80°82°
27°
26° Monroe
Tamiami Trailand Canal
Bar
ron
Riv
erC
anal
Miam
i
P-34
Bridge105
S-8
S-177S-18C
S-7
S-6
S-79
S-65E
P-33
P-36P-35
40-M
ile B
end
S-1
2AS
-12B
S-1
2CS
-12D
ATLA
NT
IC O
CE
ANG
ULF OF M
EXICO
CharlotteHarbor
Florida Bay
St.LucieRiverPe
ace
Mya
kka
River
River
KissimmeeRiver
RiverCaloosahatchee
0 25 50 MILES
0 25 50 KILOMETERS
BiscayneBay
LakeOkeechobee
C-1
11
81°
P-35
S-177 CONTROL STRUCTURE--Location and numberSAMPLING SITE--Location and number
EXPLANATION
Canal
Arcadia
S-178
Figure 10. Ratio of deethylatrazine to atrazine (DAR) in surface water at selected sites, 1997–98 (M.T. Meyer, U.S. Geological Survey, written commun., 1998).
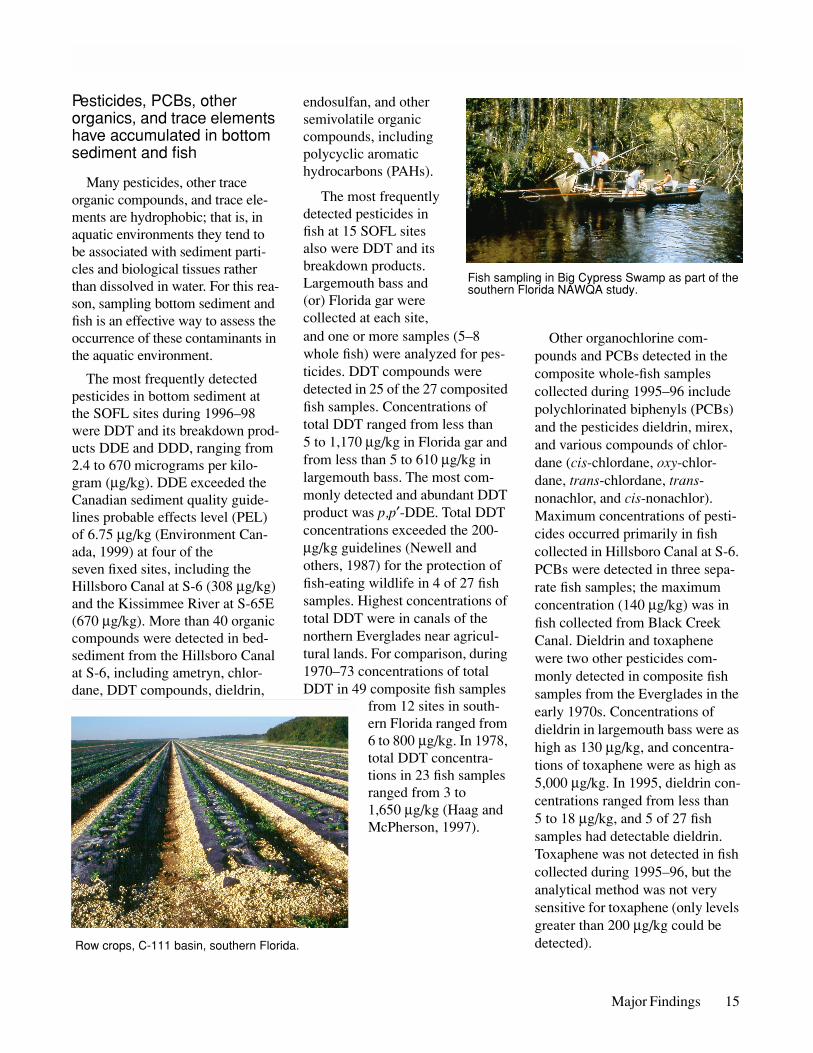
Fish sampling in Big Cypress Swamp as part of the southern Florida NAWQA study.
Pesticides, PCBs, other organics, and trace elements have accumulated in bottom sediment and fish
Many pesticides, other trace organic compounds, and trace ele-ments are hydrophobic; that is, in aquatic environments they tend to be associated with sediment parti-cles and biological tissues rather than dissolved in water. For this rea-son, sampling bottom sediment and fish is an effective way to assess the occurrence of these contaminants in the aquatic environment.
The most frequently detected pesticides in bottom sediment at the SOFL sites during 1996–98 were DDT and its breakdown prod-ucts DDE and DDD, ranging from 2.4 to 670 micrograms per kilo-gram (µg/kg). DDE exceeded the Canadian sediment quality guide-lines probable effects level (PEL) of 6.75 µg/kg (Environment Can-ada, 1999) at four of the seven fixed sites, including the Hillsboro Canal at S-6 (308 µg/kg) and the Kissimmee River at S-65E (670 µg/kg). More than 40 organic compounds were detected in bed-sediment from the Hillsboro Canal at S-6, including ametryn, chlor-dane, DDT compounds, dieldrin,
Row crops, C-111 basin, southern Florida
endosulfan, and other semivolatile organic compounds, including polycyclic aromatic hydrocarbons (PAHs).
The most frequentlydetected pesticides in fish at 15 SOFL sites also were DDT and its breakdown products. Largemouth bass and (or) Florida gar were collected at each site,
and one or more samples (5–8 whole fish) were analyzed for pes-ticides. DDT compounds were detected in 25 of the 27 composited fish samples. Concentrations of total DDT ranged from less than 5 to 1,170 µg/kg in Florida gar and from less than 5 to 610 µg/kg in largemouth bass. The most com-monly detected and abundant DDT product was p,p′-DDE. Total DDT concentrations exceeded the 200-µg/kg guidelines (Newell and others, 1987) for the protection of fish-eating wildlife in 4 of 27 fish samples. Highest concentrations of total DDT were in canals of the northern Everglades near agricul-tural lands. For comparison, during 1970–73 concentrations of total DDT in 49 composite fish samples.
from 12 sites in south-ern Florida ranged from 6 to 800 µg/kg. In 1978, total DDT concentra-tions in 23 fish samples ranged from 3 to 1,650 µg/kg (Haag and McPherson, 1997).
Other organochlorine com-pounds and PCBs detected in the composite whole-fish samples collected during 1995–96 include polychlorinated biphenyls (PCBs) and the pesticides dieldrin, mirex, and various compounds of chlor-dane (cis-chlordane, oxy-chlor-dane, trans-chlordane, trans-nonachlor, and cis-nonachlor). Maximum concentrations of pesti-cides occurred primarily in fish collected in Hillsboro Canal at S-6. PCBs were detected in three sepa-rate fish samples; the maximum concentration (140 µg/kg) was in fish collected from Black Creek Canal. Dieldrin and toxaphene were two other pesticides com-monly detected in composite fish samples from the Everglades in the early 1970s. Concentrations of dieldrin in largemouth bass were as high as 130 µg/kg, and concentra-tions of toxaphene were as high as 5,000 µg/kg. In 1995, dieldrin con-centrations ranged from less than 5 to 18 µg/kg, and 5 of 27 fish samples had detectable dieldrin. Toxaphene was not detected in fish collected during 1995–96, but the analytical method was not very sensitive for toxaphene (only levels greater than 200 µg/kg could be detected).
Major Findings 15
P-34P-33
STUDY-UNITBOUNDARY
ATLANTIC
OC
EAN
GU
LF OF M
EXICO
25°
26°
CaloosahatcheeCanal
Miam
i
Canal
27°
Kissim
mee
LakeOkeechobee
28°
83° 82° 81° 80°
° ° °
Base from U.S. Geological Survey digital data, 1:2,000,000, 1972Albers Equal-Area Conic projectionStandard Parallels 29 30' and 45 30', central meridan -83 00'
River
Caloosahatchee
0 25 MILES
0 25 KILOMETERS
River
EXPLANATIONMERCURY
CONCENTRATIONSIN BASS TISSUE
(µg/g)
MEDIAN SULFATE CONCENTRATION–In milligrams per liter
0.5 to 1.5Greater than 1.5
50 10
25
25
22
5
4
<1
<1
58
SAMPLING SITE–Location and numberP-34
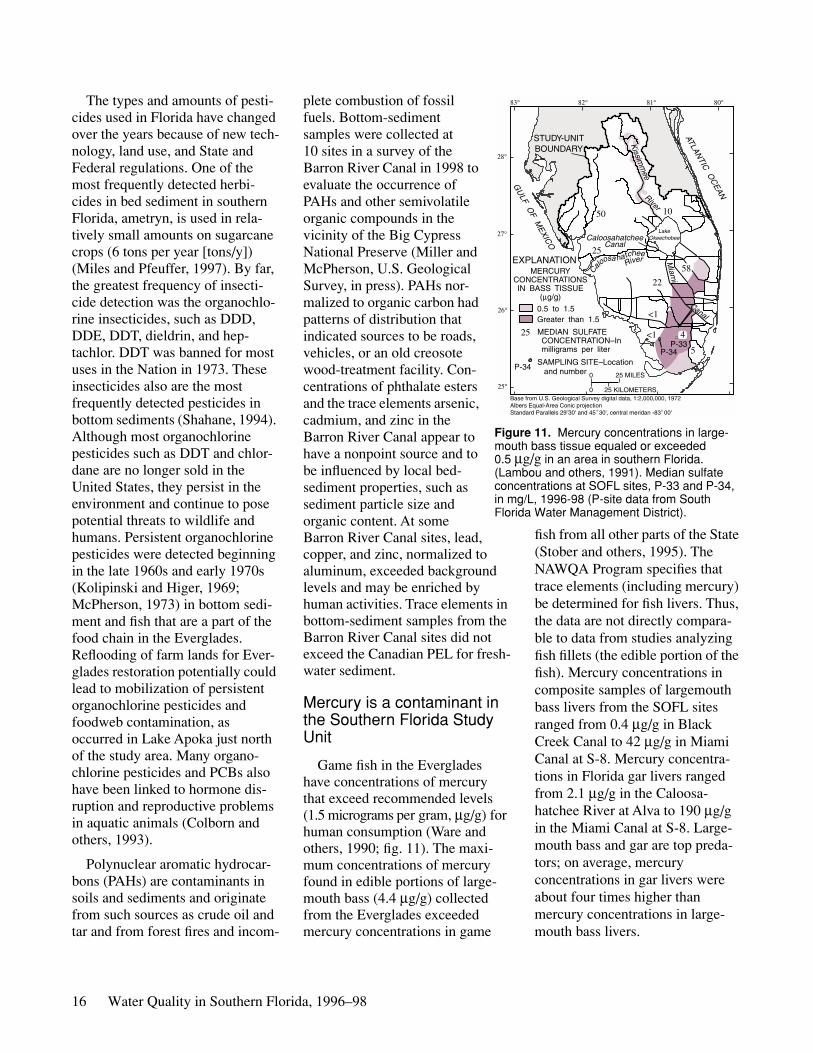
Figure 11. Mercury concentrations in large-mouth bass tissue equaled or exceeded 0.5 µg/g in an area in southern Florida. (Lambou and others, 1991). Median sulfate concentrations at SOFL sites, P-33 and P-34, in mg/L, 1996-98 (P-site data from South Florida Water Management District).
The types and amounts of pesti-cides used in Florida have changed over the years because of new tech-nology, land use, and State and Federal regulations. One of the most frequently detected herbi-cides in bed sediment in southern Florida, ametryn, is used in rela-tively small amounts on sugarcane crops (6 tons per year [tons/y]) (Miles and Pfeuffer, 1997). By far, the greatest frequency of insecti-cide detection was the organochlo-rine insecticides, such as DDD, DDE, DDT, dieldrin, and hep-tachlor. DDT was banned for most uses in the Nation in 1973. These insecticides also are the most frequently detected pesticides in bottom sediments (Shahane, 1994). Although most organochlorine pesticides such as DDT and chlor-dane are no longer sold in the United States, they persist in the environment and continue to pose potential threats to wildlife and humans. Persistent organochlorine pesticides were detected beginning in the late 1960s and early 1970s (Kolipinski and Higer, 1969; McPherson, 1973) in bottom sedi-ment and fish that are a part of the food chain in the Everglades. Reflooding of farm lands for Ever-glades restoration potentially could lead to mobilization of persistent organochlorine pesticides and foodweb contamination, as occurred in Lake Apoka just north of the study area. Many organo-chlorine pesticides and PCBs also have been linked to hormone dis-ruption and reproductive problems in aquatic animals (Colborn and others, 1993).
Polynuclear aromatic hydrocar-bons (PAHs) are contaminants in soils and sediments and originate from such sources as crude oil and tar and from forest fires and incom-
16 Water Quality in Southern Flori
plete combustion of fossil fuels. Bottom-sediment samples were collected at 10 sites in a survey of the Barron River Canal in 1998 to evaluate the occurrence of PAHs and other semivolatile organic compounds in the vicinity of the Big Cypress National Preserve (Miller and McPherson, U.S. Geological Survey, in press). PAHs nor-malized to organic carbon had patterns of distribution that indicated sources to be roads, vehicles, or an old creosote wood-treatment facility. Con-centrations of phthalate esters and the trace elements arsenic, cadmium, and zinc in the Barron River Canal appear to have a nonpoint source and to be influenced by local bed-sediment properties, such as sediment particle size and organic content. At some
Barron River Canal sites, lead, copper, and zinc, normalized to aluminum, exceeded background levels and may be enriched by human activities. Trace elements in bottom-sediment samples from the Barron River Canal sites did not exceed the Canadian PEL for fresh-water sediment.d
Mercury is a contaminant in the Southern Florida Study Unit
Game fish in the Everglades have concentrations of mercury that exceed recommended levels (1.5 micrograms per gram, µg/g) for human consumption (Ware and others, 1990; fig. 11). The maxi-mum concentrations of mercury found in edible portions of large-mouth bass (4.4 µg/g) collected from the Everglades exceeded mercury concentrations in game
a, 1996–98
fish from all other parts of the State (Stober and others, 1995). The NAWQA Program specifies that trace elements (including mercury) be determined for fish livers. Thus, the data are not directly compara-ble to data from studies analyzing fish fillets (the edible portion of the fish). Mercury concentrations in composite samples of largemouth bass livers from the SOFL sites ranged from 0.4 µg/g in Black Creek Canal to 42 µg/g in Miami Canal at S-8. Mercury concentra-tions in Florida gar livers ranged from 2.1 µg/g in the Caloosa-hatchee River at Alva to 190 µg/g in the Miami Canal at S-8. Large-mouth bass and gar are top preda-tors; on average, mercury concentrations in gar livers were about four times higher than mercury concentrations in large-mouth bass livers.
����������������������������������������������������
ADVECTION / DIFFUSION / SEDIMENT RESUSPENSION PEATPEAT
SAWGRASS
SLOUGH
TREEISLAND
BEDROCK
METHYLATION
BIOACCUMULATION
PERIPHYTON
REDUCTION
DEMETHYLATION
Hg(0)
DOC,Other Nutrients
VOLATILIZATION (Hg0)and
DEPOSITION(Hg(II), CH3Hg)
CH3Hg
CH3Hg
Hg(II)
Hg(II)
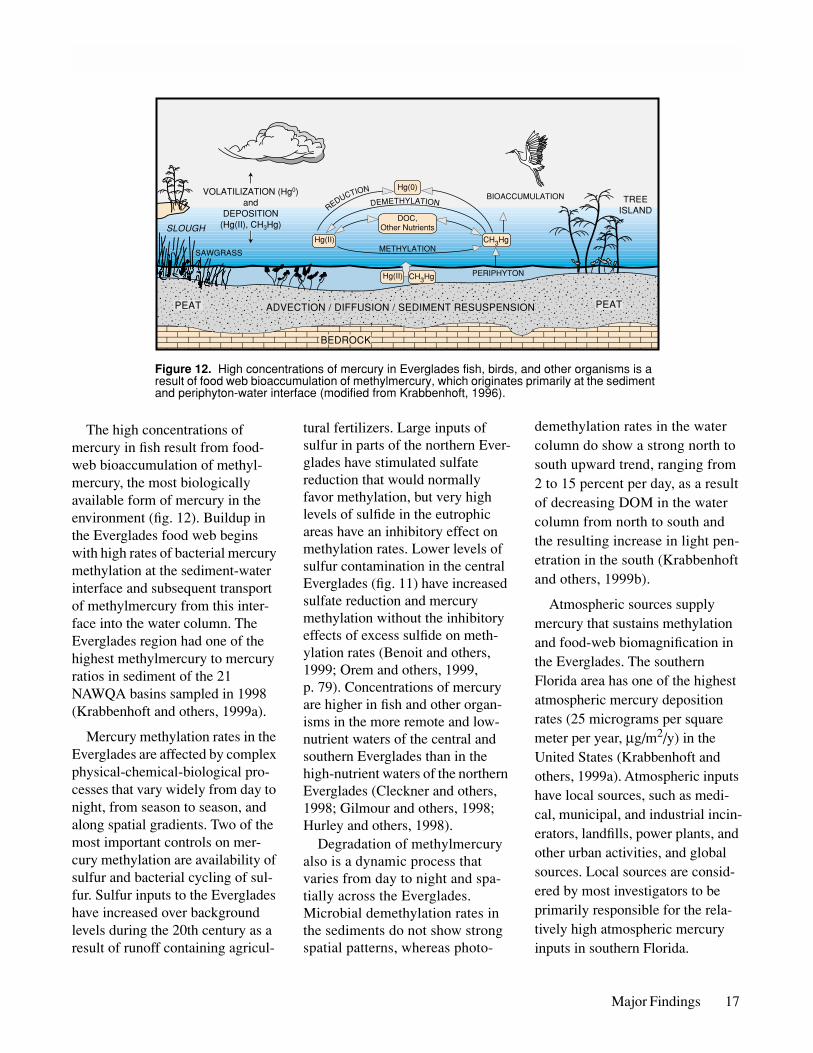
Figure 12. High concentrations of mercury in Everglades fish, birds, and other organisms is a result of food web bioaccumulation of methylmercury, which originates primarily at the sediment and periphyton-water interface (modified from Krabbenhoft, 1996).
The high concentrations of mercury in fish result from food-web bioaccumulation of methyl-mercury, the most biologically available form of mercury in the environment (fig. 12). Buildup in the Everglades food web begins with high rates of bacterial mercury methylation at the sediment-water interface and subsequent transport of methylmercury from this inter-face into the water column. The Everglades region had one of the highest methylmercury to mercury ratios in sediment of the 21 NAWQA basins sampled in 1998 (Krabbenhoft and others, 1999a).
Mercury methylation rates in the Everglades are affected by complex physical-chemical-biological pro-cesses that vary widely from day to night, from season to season, and along spatial gradients. Two of the most important controls on mer-cury methylation are availability of sulfur and bacterial cycling of sul-fur. Sulfur inputs to the Everglades have increased over background levels during the 20th century as a result of runoff containing agricul-
tural fertilizers. Large inputs of sulfur in parts of the northern Ever-glades have stimulated sulfate reduction that would normally favor methylation, but very high levels of sulfide in the eutrophic areas have an inhibitory effect on methylation rates. Lower levels of sulfur contamination in the central Everglades (fig. 11) have increased sulfate reduction and mercury methylation without the inhibitory effects of excess sulfide on meth-ylation rates (Benoit and others, 1999; Orem and others, 1999, p. 79). Concentrations of mercury are higher in fish and other organ-isms in the more remote and low-nutrient waters of the central and southern Everglades than in the high-nutrient waters of the northern Everglades (Cleckner and others, 1998; Gilmour and others, 1998; Hurley and others, 1998).
Degradation of methylmercury also is a dynamic process that varies from day to night and spa-tially across the Everglades. Microbial demethylation rates in the sediments do not show strong spatial patterns, whereas photo-
demethylation rates in the water column do show a strong north to south upward trend, ranging from 2 to 15 percent per day, as a result of decreasing DOM in the water column from north to south and the resulting increase in light pen-etration in the south (Krabbenhoft and others, 1999b).
Atmospheric sources supply mercury that sustains methylation and food-web biomagnification in the Everglades. The southern Florida area has one of the highest atmospheric mercury deposition rates (25 micrograms per square meter per year, µg/m2/y) in the United States (Krabbenhoft and others, 1999a). Atmospheric inputs have local sources, such as medi-cal, municipal, and industrial incin-erators, landfills, power plants, and other urban activities, and global sources. Local sources are consid-ered by most investigators to be primarily responsible for the rela-tively high atmospheric mercury inputs in southern Florida.
Major Findings 17
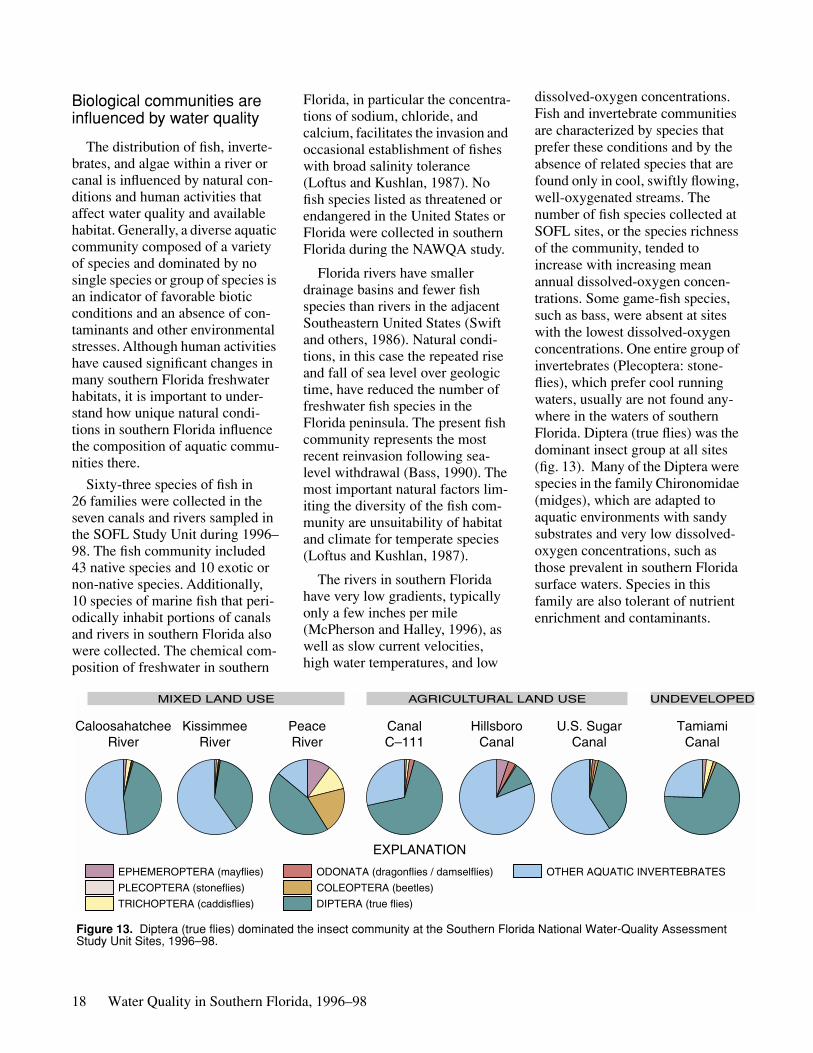
Biological communities are influenced by water quality
The distribution of fish, inverte-brates, and algae within a river or canal is influenced by natural con-ditions and human activities that affect water quality and available habitat. Generally, a diverse aquatic community composed of a variety of species and dominated by no single species or group of species is an indicator of favorable biotic conditions and an absence of con-taminants and other environmental stresses. Although human activities have caused significant changes in many southern Florida freshwater habitats, it is important to under-stand how unique natural condi-tions in southern Florida influence the composition of aquatic commu-nities there.
Sixty-three species of fish in 26 families were collected in the seven canals and rivers sampled in the SOFL Study Unit during 1996–98. The fish community included 43 native species and 10 exotic or non-native species. Additionally, 10 species of marine fish that peri-odically inhabit portions of canals and rivers in southern Florida also were collected. The chemical com-position of freshwater in southern
18 Water Quality in Southern Flori
CaloosahatcheeRiver
KissimmeeRiver
PR
EPHEMEROPTERA (mayflies)
PLECOPTERA (stoneflies)
TRICHOPTERA (caddisflies)
MIXED LAND USE
Figure 13. Diptera (true flies) dominatedStudy Unit Sites, 1996–98.
Florida, in particular the concentra-tions of sodium, chloride, and calcium, facilitates the invasion and occasional establishment of fishes with broad salinity tolerance (Loftus and Kushlan, 1987). No fish species listed as threatened or endangered in the United States or Florida were collected in southern Florida during the NAWQA study.
Florida rivers have smaller drainage basins and fewer fish species than rivers in the adjacent Southeastern United States (Swift and others, 1986). Natural condi-tions, in this case the repeated rise and fall of sea level over geologic time, have reduced the number of freshwater fish species in the Florida peninsula. The present fish community represents the most recent reinvasion following sea-level withdrawal (Bass, 1990). The most important natural factors lim-iting the diversity of the fish com-munity are unsuitability of habitat and climate for temperate species (Loftus and Kushlan, 1987).
The rivers in southern Florida have very low gradients, typically only a few inches per mile (McPherson and Halley, 1996), as well as slow current velocities, high water temperatures, and low
da, 1996–98
eaceiver
ODONATA (dragonflies / damselflies)
COLEOPTERA (beetles)
DIPTERA (true flies)
CanalC–111
HillsboroCanal
AGRICULTURAL L
EXPLANATION
the insect community at the Southern Florid
dissolved-oxygen concentrations. Fish and invertebrate communities are characterized by species that prefer these conditions and by the absence of related species that are found only in cool, swiftly flowing, well-oxygenated streams. The number of fish species collected at SOFL sites, or the species richness of the community, tended to increase with increasing mean annual dissolved-oxygen concen-trations. Some game-fish species, such as bass, were absent at sites with the lowest dissolved-oxygen concentrations. One entire group of invertebrates (Plecoptera: stone-flies), which prefer cool running waters, usually are not found any-where in the waters of southern Florida. Diptera (true flies) was the dominant insect group at all sites (fig. 13). Many of the Diptera were species in the family Chironomidae (midges), which are adapted to aquatic environments with sandy substrates and very low dissolved-oxygen concentrations, such as those prevalent in southern Florida surface waters. Species in this family are also tolerant of nutrient enrichment and contaminants.
OTHER AQUATIC INVERTEBRATES
TamiamiCanal
UNDEVELOPED
U.S. SugarCanal
AND USE
a National Water-Quality Assessment
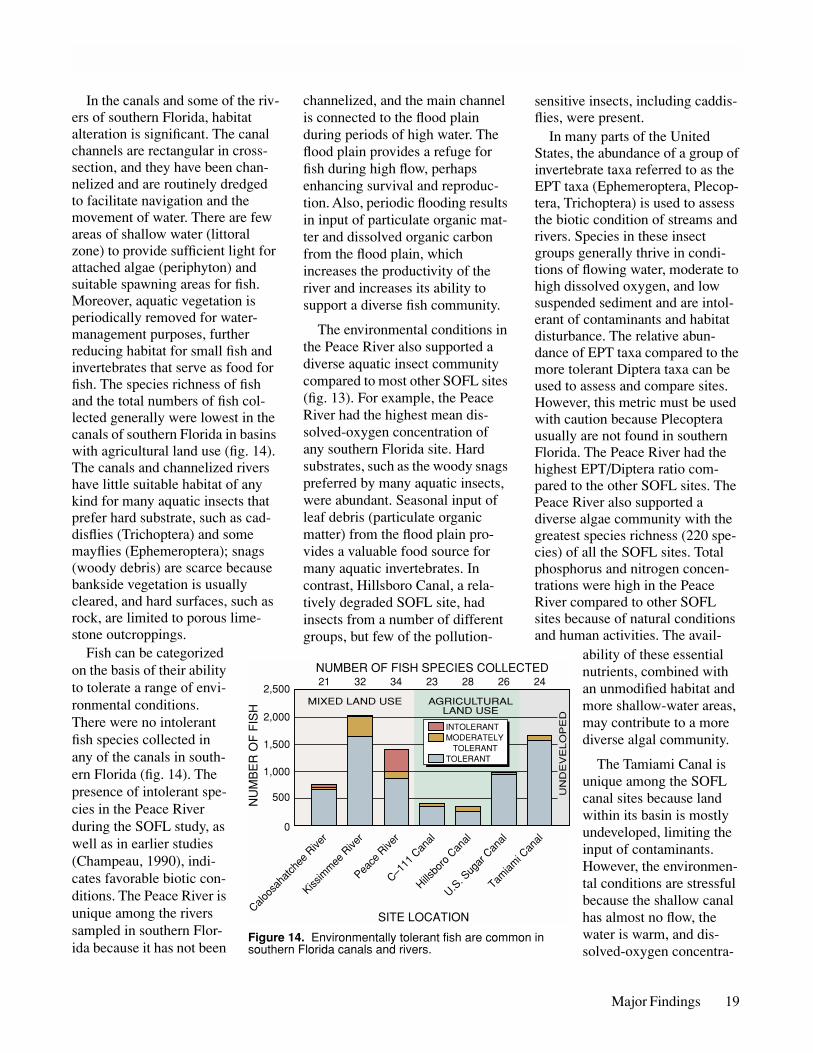
In the canals and some of the riv-ers of southern Florida, habitat alteration is significant. The canal channels are rectangular in cross-section, and they have been chan-nelized and are routinely dredged to facilitate navigation and the movement of water. There are few areas of shallow water (littoral zone) to provide sufficient light for attached algae (periphyton) and suitable spawning areas for fish. Moreover, aquatic vegetation is periodically removed for water-management purposes, further reducing habitat for small fish and invertebrates that serve as food for fish. The species richness of fish and the total numbers of fish col-lected generally were lowest in the canals of southern Florida in basins with agricultural land use (fig. 14). The canals and channelized rivers have little suitable habitat of any kind for many aquatic insects that prefer hard substrate, such as cad-disflies (Trichoptera) and some mayflies (Ephemeroptera); snags (woody debris) are scarce because bankside vegetation is usually cleared, and hard surfaces, such as rock, are limited to porous lime-stone outcroppings.
C–111
Can
al
Caloos
ahat
chee
Rive
r
Hillsbo
ro C
anal
Kissim
mee
Rive
r
Peace
Rive
r
Tamiam
i Can
al
U.S. S
ugar
Can
al
UN
DE
VE
LO
PE
D
0
2321 2832 34 2426
500
1,000
1,500
2,000
2,500
SITE LOCATION
NUMBER OF FISH SPECIES COLLECTED
NU
MB
ER
OF
FIS
H
MIXED LAND USE AGRICULTURALLAND USE
INTOLERANTMODERATELY TOLERANTTOLERANT
Figure 14. Environmentally tolerant fish are common in southern Florida canals and rivers.
Fish can be categorized on the basis of their ability to tolerate a range of envi-ronmental conditions. There were no intolerant fish species collected in any of the canals in south-ern Florida (fig. 14). The presence of intolerant spe-cies in the Peace River during the SOFL study, as well as in earlier studies (Champeau, 1990), indi-cates favorable biotic con-ditions. The Peace River is unique among the rivers sampled in southern Flor-ida because it has not been
channelized, and the main channel is connected to the flood plain during periods of high water. The flood plain provides a refuge for fish during high flow, perhaps enhancing survival and reproduc-tion. Also, periodic flooding results in input of particulate organic mat-ter and dissolved organic carbon from the flood plain, which increases the productivity of the river and increases its ability to support a diverse fish community.
The environmental conditions in the Peace River also supported a diverse aquatic insect community compared to most other SOFL sites (fig. 13). For example, the Peace River had the highest mean dis-solved-oxygen concentration of any southern Florida site. Hard substrates, such as the woody snags preferred by many aquatic insects, were abundant. Seasonal input of leaf debris (particulate organic matter) from the flood plain pro-vides a valuable food source for many aquatic invertebrates. In contrast, Hillsboro Canal, a rela-tively degraded SOFL site, had insects from a number of different groups, but few of the pollution-
sensitive insects, including caddis-flies, were present.
In many parts of the United States, the abundance of a group of invertebrate taxa referred to as the EPT taxa (Ephemeroptera, Plecop-tera, Trichoptera) is used to assess the biotic condition of streams and rivers. Species in these insect groups generally thrive in condi-tions of flowing water, moderate to high dissolved oxygen, and low suspended sediment and are intol-erant of contaminants and habitat disturbance. The relative abun-dance of EPT taxa compared to the more tolerant Diptera taxa can be used to assess and compare sites. However, this metric must be used with caution because Plecoptera usually are not found in southern Florida. The Peace River had the highest EPT/Diptera ratio com-pared to the other SOFL sites. The Peace River also supported a diverse algae community with the greatest species richness (220 spe-cies) of all the SOFL sites. Total phosphorus and nitrogen concen-trations were high in the Peace River compared to other SOFL sites because of natural conditions and human activities. The avail-
ability of these essential nutrients, combined with an unmodified habitat and more shallow-water areas, may contribute to a more diverse algal community.
The Tamiami Canal is unique among the SOFL canal sites because land within its basin is mostly undeveloped, limiting the input of contaminants. However, the environmen-tal conditions are stressful because the shallow canal has almost no flow, the water is warm, and dis-solved-oxygen concentra-
Major Findings 19
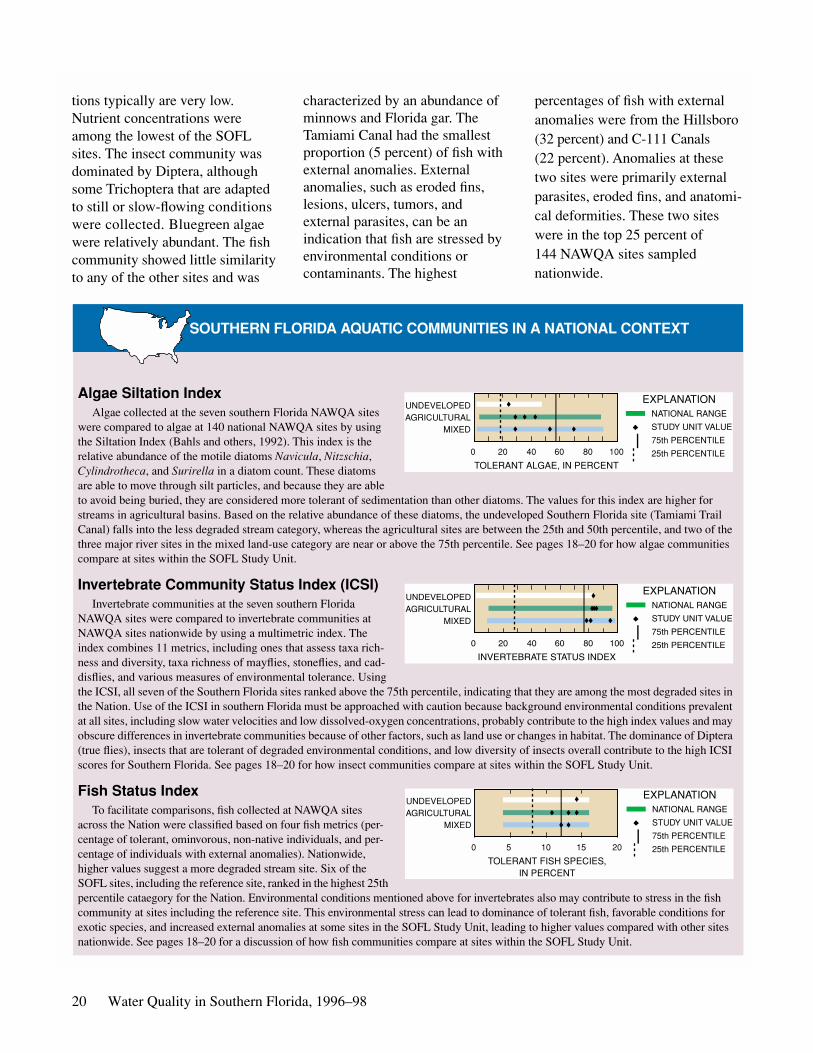
tions typically are very low. Nutrient concentrations were among the lowest of the SOFL sites. The insect community was dominated by Diptera, although some Trichoptera that are adapted to still or slow-flowing conditions were collected. Bluegreen algae were relatively abundant. The fish community showed little similarity to any of the other sites and was
20 Water Quality in Southern Flori
characterized by an abundance of minnows and Florida gar. The Tamiami Canal had the smallest proportion (5 percent) of fish with external anomalies. External anomalies, such as eroded fins, lesions, ulcers, tumors, and external parasites, can be an indication that fish are stressed by environmental conditions or contaminants. The highest
da, 1996–98
UNDEVELOPEDAGRICULTURAL
MIXED
TOLERANT
0 20
UNDEVELOPEDAGRICULTURAL
MIXED
INVERTEBR
0 20
UNDEVELOPEDAGRICULTURAL
MIXED
TOLERANIN
0 5
percentages of fish with external anomalies were from the Hillsboro (32 percent) and C-111 Canals (22 percent). Anomalies at these two sites were primarily external parasites, eroded fins, and anatomi-cal deformities. These two sites were in the top 25 percent of 144 NAWQA sites sampled nationwide.
SOUTHERN FLORIDA AQUATIC COMMUNITIES IN A NATIONAL CONTEXT
ALGAE, IN PERCENT
40 60 80 100
NATIONAL RANGE
STUDY UNIT VALUE
75th PERCENTILE
25th PERCENTILE
EXPLANATION
Algae Siltation Index Algae collected at the seven southern Florida NAWQA siteswere compared to algae at 140 national NAWQA sites by using the Siltation Index (Bahls and others, 1992). This index is the relative abundance of the motile diatoms Navicula, Nitzschia, Cylindrotheca, and Surirella in a diatom count. These diatoms are able to move through silt particles, and because they are able
to avoid being buried, they are considered more tolerant of sedimentation than other diatoms. The values for this index are higher for streams in agricultural basins. Based on the relative abundance of these diatoms, the undeveloped Southern Florida site (Tamiami Trail Canal) falls into the less degraded stream category, whereas the agricultural sites are between the 25th and 50th percentile, and two of the three major river sites in the mixed land-use category are near or above the 75th percentile. See pages 18–20 for how algae communities compare at sites within the SOFL Study Unit.ATE STATUS INDEX
40 60 80 100
NATIONAL RANGE
STUDY UNIT VALUE
75th PERCENTILE
25th PERCENTILE
EXPLANATION
Invertebrate Community Status Index (ICSI)Invertebrate communities at the seven southern FloridaNAWQA sites were compared to invertebrate communities at NAWQA sites nationwide by using a multimetric index. The index combines 11 metrics, including ones that assess taxa rich-ness and diversity, taxa richness of mayflies, stoneflies, and cad-disflies, and various measures of environmental tolerance. Using
the ICSI, all seven of the Southern Florida sites ranked above the 75th percentile, indicating that they are among the most degraded sites in the Nation. Use of the ICSI in southern Florida must be approached with caution because background environmental conditions prevalent at all sites, including slow water velocities and low dissolved-oxygen concentrations, probably contribute to the high index values and may obscure differences in invertebrate communities because of other factors, such as land use or changes in habitat. The dominance of Diptera (true flies), insects that are tolerant of degraded environmental conditions, and low diversity of insects overall contribute to the high ICSI scores for Southern Florida. See pages 18–20 for how insect communities compare at sites within the SOFL Study Unit.T FISH SPECIES, PERCENT
10 15 20
NATIONAL RANGE
STUDY UNIT VALUE
75th PERCENTILE
25th PERCENTILE
EXPLANATION
Fish Status IndexTo facilitate comparisons, fish collected at NAWQA sitesacross the Nation were classified based on four fish metrics (per-centage of tolerant, ominvorous, non-native individuals, and per-centage of individuals with external anomalies). Nationwide, higher values suggest a more degraded stream site. Six of the SOFL sites, including the reference site, ranked in the highest 25th
percentile cataegory for the Nation. Environmental conditions mentioned above for invertebrates also may contribute to stress in the fish community at sites including the reference site. This environmental stress can lead to dominance of tolerant fish, favorable conditions for exotic species, and increased external anomalies at some sites in the SOFL Study Unit, leading to higher values compared with other sites nationwide. See pages 18–20 for a discussion of how fish communities compare at sites within the SOFL Study Unit.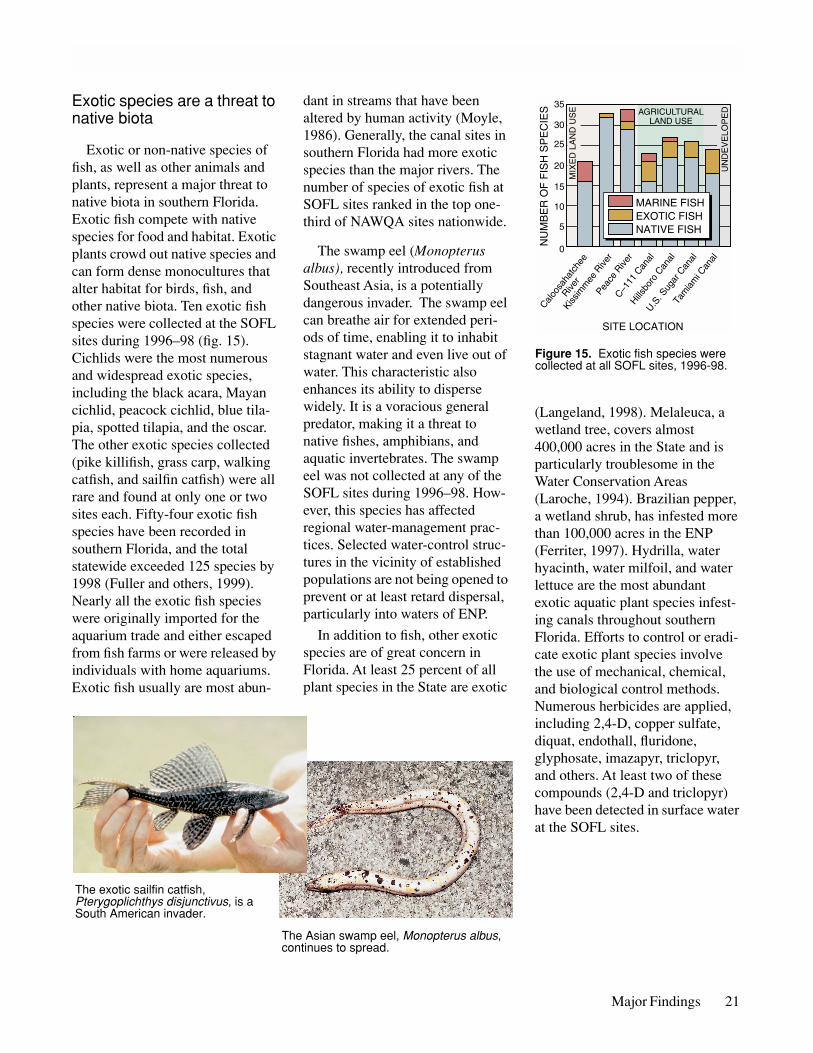
MIX
ED
LA
ND
US
E
UN
DE
VE
LOP
EDAGRICULTURAL
LAND USE
C–111
Can
al
Caloo
saha
tche
e
River
Hillsbo
ro C
anal
Kissim
mee
Rive
rPea
ce R
iver
Tam
iam
i Can
al
U.S. S
ugar
Can
al
NU
MB
ER
OF
FIS
H S
PE
CIE
S
0
10
20
30
25
35
5
15
SITE LOCATION
MARINE FISHEXOTIC FISHNATIVE FISH
Figure 15. Exotic fish species were collected at all SOFL sites, 1996-98.
Exotic species are a threat to native biota
Exotic or non-native species of fish, as well as other animals and plants, represent a major threat to native biota in southern Florida. Exotic fish compete with native species for food and habitat. Exotic plants crowd out native species and can form dense monocultures that alter habitat for birds, fish, and other native biota. Ten exotic fish species were collected at the SOFL sites during 1996–98 (fig. 15). Cichlids were the most numerous and widespread exotic species, including the black acara, Mayan cichlid, peacock cichlid, blue tila-pia, spotted tilapia, and the oscar. The other exotic species collected (pike killifish, grass carp, walking catfish, and sailfin catfish) were all rare and found at only one or two sites each. Fifty-four exotic fish species have been recorded in southern Florida, and the total statewide exceeded 125 species by 1998 (Fuller and others, 1999). Nearly all the exotic fish species were originally imported for the aquarium trade and either escaped from fish farms or were released by individuals with home aquariums. Exotic fish usually are most abun-
Thco
The exotic sailfin catfish, Pterygoplichthys disjunctivus, is a South American invader.
dant in streams that have been altered by human activity (Moyle, 1986). Generally, the canal sites in southern Florida had more exotic species than the major rivers. The number of species of exotic fish at SOFL sites ranked in the top one-third of NAWQA sites nationwide.
The swamp eel (Monopterus albus), recently introduced from Southeast Asia, is a potentially dangerous invader. The swamp eel can breathe air for extended peri-ods of time, enabling it to inhabit stagnant water and even live out of water. This characteristic also enhances its ability to disperse widely. It is a voracious general predator, making it a threat to native fishes, amphibians, and aquatic invertebrates. The swamp eel was not collected at any of the SOFL sites during 1996–98. How-ever, this species has affected regional water-management prac-tices. Selected water-control struc-tures in the vicinity of established populations are not being opened to prevent or at least retard dispersal, particularly into waters of ENP.
In addition to fish, other exotic species are of great concern in Florida. At least 25 percent of all plant species in the State are exotic
e Asian swamp eel, Monopterus albus, ntinues to spread.
(Langeland, 1998). Melaleuca, a wetland tree, covers almost 400,000 acres in the State and is particularly troublesome in the Water Conservation Areas (Laroche, 1994). Brazilian pepper, a wetland shrub, has infested more than 100,000 acres in the ENP (Ferriter, 1997). Hydrilla, water hyacinth, water milfoil, and water lettuce are the most abundant exotic aquatic plant species infest-ing canals throughout southern Florida. Efforts to control or eradi-cate exotic plant species involve the use of mechanical, chemical, and biological control methods. Numerous herbicides are applied, including 2,4-D, copper sulfate, diquat, endothall, fluridone, glyphosate, imazapyr, triclopyr, and others. At least two of these compounds (2,4-D and triclopyr) have been detected in surface water at the SOFL sites.
Major Findings 21
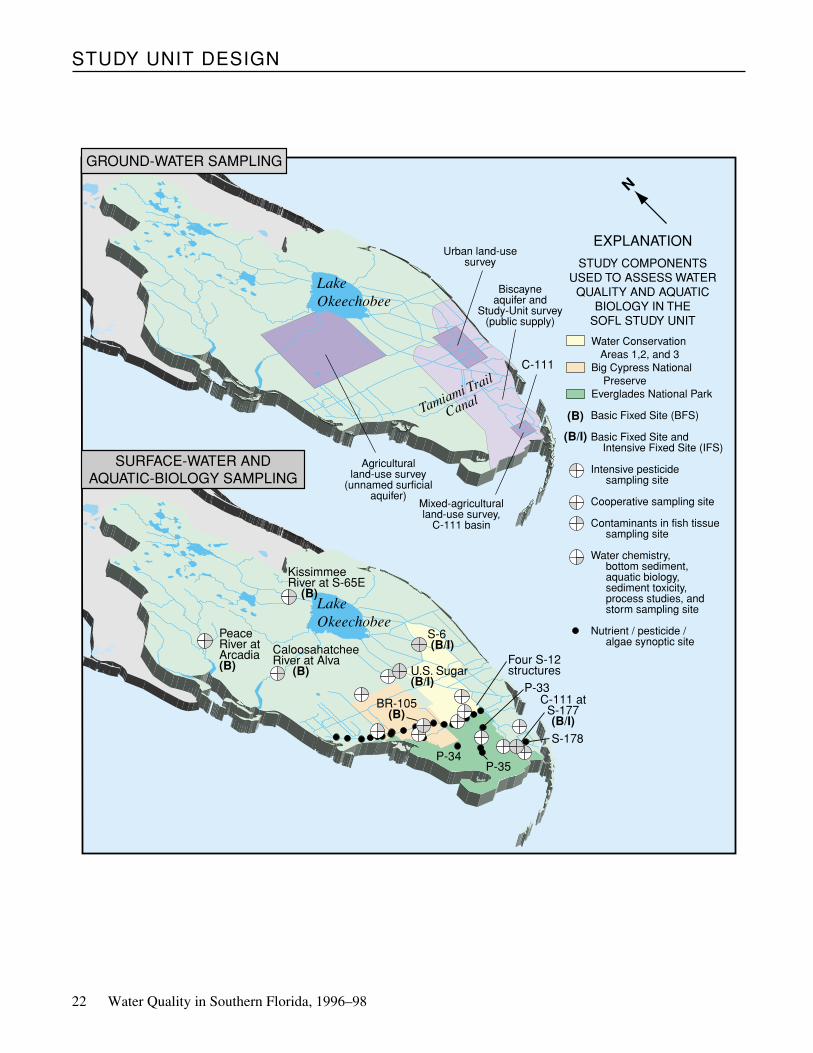
22 Water Quality in Southern Florida, 1996–98
STUDY UNIT DESIGN
EXPLANATION
LakeOkeechobee
PeaceRiver atArcadia(B)
KissimmeeRiver at S-65E (B)
C-111 atS-177(B/I)
S-6 (B/I)
S-178
Four S-12structures
P-33
P-34P-35
U.S. Sugar(B/I)
BR-105(B)
CaloosahatcheeRiver at Alva (B)
Water Conservation Areas 1,2, and 3Big Cypress National PreserveEverglades National Park
Basic Fixed Site (BFS)
Basic Fixed Site and Intensive Fixed Site (IFS)
Intensive pesticide sampling site
Cooperative sampling site
Contaminants in fish tissue sampling site
Water chemistry, bottom sediment, aquatic biology, sediment toxicity, process studies, and storm sampling site
Nutrient / pesticide / algae synoptic site
(B)
(B/I)
STUDY COMPONENTSUSED TO ASSESS WATER
QUALITY AND AQUATICBIOLOGY IN THE
SOFL STUDY UNIT
N
LakeOkeechobee
Tamiami Trail
Canal
Urban land-usesurvey
Biscayneaquifer and
Study-Unit survey(public supply)
Mixed-agriculturalland-use survey,
C-111 basin
Agriculturalland-use survey
(unnamed surficialaquifer)
C-111
GROUND-WATER SAMPLING
SURFACE-WATER ANDAQUATIC-BIOLOGY SAMPLING
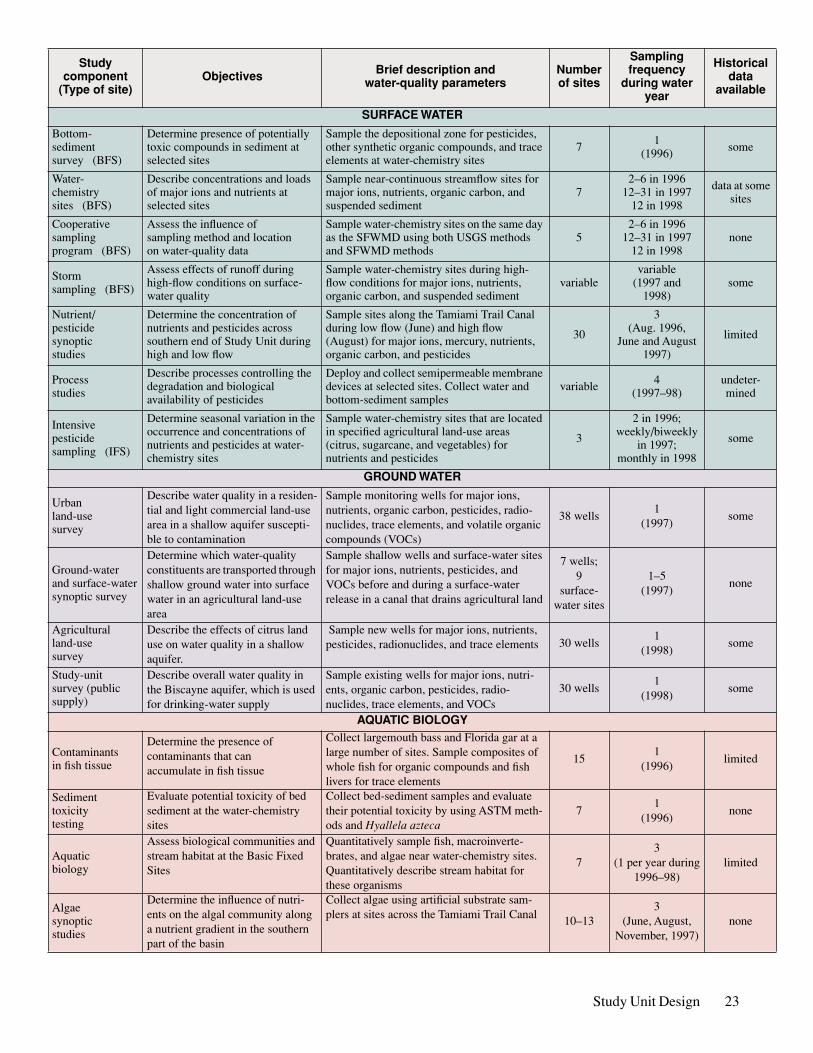
Study Unit Design 23
Study component
(Type of site)Objectives Brief description and
water-quality parametersNumberof sites
Sampling frequency
during water year
Historicaldata
available
SURFACE WATER
Bottom-sediment survey (BFS)
Determine presence of potentially toxic compounds in sediment at selected sites
Sample the depositional zone for pesticides, other synthetic organic compounds, and trace elements at water-chemistry sites
7 1(1996) some
Water-chemistry sites (BFS)
Describe concentrations and loads of major ions and nutrients at selected sites
Sample near-continuous streamflow sites for major ions, nutrients, organic carbon, and suspended sediment
72–6 in 1996
12–31 in 199712 in 1998
data at some sites
Cooperativesamplingprogram (BFS)
Assess the influence ofsampling method and locationon water-quality data
Sample water-chemistry sites on the same day as the SFWMD using both USGS methods and SFWMD methods
52–6 in 1996
12–31 in 199712 in 1998
none
Storm sampling (BFS)
Assess effects of runoff during high-flow conditions on surface-water quality
Sample water-chemistry sites during high-flow conditions for major ions, nutrients, organic carbon, and suspended sediment
variablevariable
(1997 and 1998)
some
Nutrient/pesticide synoptic studies
Determine the concentration of nutrients and pesticides across southern end of Study Unit during high and low flow
Sample sites along the Tamiami Trail Canal during low flow (June) and high flow (August) for major ions, mercury, nutrients, organic carbon, and pesticides
30
3(Aug. 1996,
June and August 1997)
limited
Process studies
Describe processes controlling the degradation and biological availability of pesticides
Deploy and collect semipermeable membrane devices at selected sites. Collect water and bottom-sediment samples
variable 4(1997–98)
undeter-mined
Intensive pesticidesampling (IFS)
Determine seasonal variation in the occurrence and concentrations of nutrients and pesticides at water-chemistry sites
Sample water-chemistry sites that are located in specified agricultural land-use areas (citrus, sugarcane, and vegetables) for nutrients and pesticides
3
2 in 1996; weekly/biweekly
in 1997;monthly in 1998
some
GROUND WATER
Urban land-use survey
Describe water quality in a residen-tial and light commercial land-use area in a shallow aquifer suscepti-ble to contamination
Sample monitoring wells for major ions, nutrients, organic carbon, pesticides, radio-nuclides, trace elements, and volatile organic compounds (VOCs)
38 wells1
(1997)some
Ground-waterand surface-watersynoptic survey
Determine which water-quality constituents are transported through shallow ground water into surface water in an agricultural land-use area
Sample shallow wells and surface-water sites for major ions, nutrients, pesticides, and VOCs before and during a surface-water release in a canal that drains agricultural land
7 wells;9
surface-water sites
1–5(1997)
none
Agriculturalland-use survey
Describe the effects of citrus land use on water quality in a shallow aquifer.
Sample new wells for major ions, nutrients, pesticides, radionuclides, and trace elements 30 wells
1(1998)
some
Study-unit survey (public supply)
Describe overall water quality in the Biscayne aquifer, which is used for drinking-water supply
Sample existing wells for major ions, nutri-ents, organic carbon, pesticides, radio-nuclides, trace elements, and VOCs
30 wells1
(1998)some
AQUATIC BIOLOGY
Contaminantsin fish tissue
Determine the presence of contaminants that can accumulate in fish tissue
Collect largemouth bass and Florida gar at a large number of sites. Sample composites of whole fish for organic compounds and fish livers for trace elements
151
(1996)limited
Sedimenttoxicity testing
Evaluate potential toxicity of bed sediment at the water-chemistry sites
Collect bed-sediment samples and evaluate their potential toxicity by using ASTM meth-ods and
Hyallela azteca
71
(1996)none
Aquatic biology
Assess biological communities and stream habitat at the Basic Fixed Sites
Quantitatively sample fish, macroinverte-brates, and algae near water-chemistry sites. Quantitatively describe stream habitat for these organisms
73
(1 per year during1996–98)
limited
Algaesynopticstudies
Determine the influence of nutri-ents on the algal community along a nutrient gradient in the southern part of the basin
Collect algae using artificial substrate sam-plers at sites across the Tamiami Trail Canal 10–13
3(June, August,
November, 1997)none
GLOSSARY
Aquatic-life criteria - Water-quality guidelines for protec-tion of aquatic life. Often refers to U.S. Environmental Protection Agency water-quality criteria for protection of aquatic organisms.
Aquifer - A water-bearing layer of soil, sand, gravel, or rock that will yield usable quantities of water to a well.
Basic Fixed Sites (BFS) - Sites on streams or canals at which streamflow is measured and samples are routinely collected for temperature, salinity, major ions, nutrients, and organic carbon. Samples may also be periodically col-lected for contaminants in bottom sediment, biota, storm effects, or other constituents.
Breakdown products - Compounds resulting from transfor-mation of an organic substance through chemical, photo-chemical, and/or biochemical reactions.
DDT - Dichloro-diphenyl-trichloroethane. An organochlorine insecticide no longer registered for use in the United States. DDT degradation products include DDE and DDD.
Drinking-water standard or guideline - A threshold con-centration in a public drinking-water supply, designed to protect human health.
Ecosystem - The interacting populations of plants, animals, and microorganisms occupying an area, plus their physi-cal environment.
Intensive Fixed Sites (IFS) - Basic Fixed Sites with increased sampling frequency during selected seasonal periods and analysis of dissolved pesticides for 1 year.
Load - General term that refers to a material or constituent in solution, in suspension, or in transport; usually expressed in terms of mass or volume.
Maximum contaminant level (MCL) - Maximum permis-sible level of a contaminant in water that is delivered to any user of a public water system. MCLs are enforceable standards established by the U.S. Environmental Protec-tion Agency.
Methylation - The addition of a methyl group (–CH3) to a molecule or atom through a chemical reaction.
Micrograms per liter (µg/L) - A unit expressing the con-centration of constituents in solution as weight (micro-grams) of solute per unit volume (liter) of water; equivalent to one part per billion in most stream water and ground water.
Nutrient - Element or compound essential for animal and plant growth. Common nutrients in fertilizer include nitro-gen, phosphorus, and potassium.
Organochlorine insecticide - A class of organic insecticides containing a high percentage of chlorine. Includes dichlo-rodiphenylethanes (such as DDT), chlorinated cyclo-dienes (such as chlordane), and chlorinated benzenes (such as lindane).
Periphyton - Organisms that grow on underwater surfaces; periphyton include algae, bacteria, fungi, protozoa, and other organisms.
24 Water Quality in Southern Florida, 1996–98
Pesticide - A chemical applied to crops, rights of way, lawns, or residences to control weeds, insects, fungi, nem-atodes, rodents or other “pests.”
Phosphorus - A nutrient essential for growth that can play a key role in stimulating aquatic growth in lakes and streams.
Phthalates - A class of organic compounds containing phthalic acid esters [C6H4(COOR)2] and derivatives. Used as plasticizers in plastics. Also used in many other products (such as detergents, cosmetics) and industrial processes (such as defoaming agents during paper and paperboard manufacture, and dielectrics in capacitors).
Polychlorinated biphenyls (PCBs) - A mixture of chlori-nated derivatives of biphenyl, marketed under the trade name Aroclor with a number designating the chlorine con-tent (such as Aroclor 1260). PCBs were used in transform-ers and capacitors for insulating purposes and in gas pipeline systems as a lubricant. Further sale for new use was banned by law in 1979.
Polycyclic aromatic hydrocarbon (PAH) - A class of organic compounds with a fused-ring aromatic structure. PAHs result from incomplete combustion of organic car-bon (including wood), municipal solid waste, and fossil fuels, as well as from natural or anthropogenic introduc-tion of uncombusted coal and oil. PAHs include benzo(a)pyrene, fluoranthene, and pyrene.
Recharge - Water that infiltrates the ground and reaches the saturated zone.
Reference site - A sampling site selected for its relatively undisturbed conditions.
Trace element - An element found in only minor amounts (concentrations less than 1.0 mg/L) in water or sediment; includes arsenic, cadmium, chromium, copper, lead, mer-cury, nickel, and zinc.
Volatile organic compounds (VOCs) - Organic chemicals that have a high vapor pressure relative to their water sol-ubility. VOCs include components of gasoline, fuel oils, and lubricants, as well as organic solvents, fumigants, some inert ingredients in pesticides, and some by-products of chlorine disinfection.
Water-quality criteria - Specific levels of water quality which, if reached, are expected to render a body of water unsuitable for its designated use.
Water-quality standards - State-adopted and U.S. Environ-mental Protection Agency-approved ambient standards for water bodies. Standards include the use of the water body and the water-quality criteria that must be met to protect the designated use or uses.
Water year - The 12-month period October 1 through September 30, designated by the calendar year in which it ends.
REFERENCES
References 25
Adams, C.D., and Thurman, E.M., 1991, Formation and trans-port of deethylatrazine in the soil and vadose zone: Journal of Environmental Quality, v. 20, no. 3, p. 540–547.
Bahls, L.R., Burkantis, R., and Tralles, S., 1992, Benchmark biology of Montana reference streams: Helena, Montana, Department of Health and Environmental Science, Water Quality Bureau, 47 p.
Bass, D.G., Jr., 1990, Monitoring Florida’s riverine fish communities: Florida Science, v. 53, no. 1, p. 1–10.
Benoit, J.M., Gilmour, C.C., Mason, R.P., and Heyes, A., 1999, Sulfide controls on mercury speciation and bio-availability to methylating bacteria in sediment and pore waters: Environmental Science and Technology, v. 33, p. 951–957.
Champeau, T.R., 1990, Ichthyofaunal evaluation of the Peace River, Florida: Florida Scientist, v. 53, p. 302–311.
Chiou, C.T., Malcolm, R.L., Brinton, T.I., and Kile, D.E., 1986, Water solubility enhancement of some organic pol-lutants and pesticides by dissolved humic and fulvic acids: Environmental Science and Technology, v. 20, p. 502–508.
Cleckner, L.A., Garrison, P.J., Hurley, J.P., Olson, M.O., and Krabbenhoft, D.P., 1998, Trophic transfer of methyl mer-cury in the northern Florida Everglades: Biogeochemis-try, v. 40, p. 347–361.
Colborn, T., vom Saal, F.S., and Sota, A.M., 1993, Develop-mental effects of endocrine-disrupting chemicals in wild-life and humans: Environmental Health Perspectives, v. 101, p. 378–384.
Davis, J.H., Jr., 1943, The natural features of southern Florida, especially the vegetation, and the Everglades: Florida Geological Survey Bulletin 25, 311 p.
Environment Canada, 1999, Canadian sediment quality guidelines for the protection of aquatic life, Summary tables: accessed September 17, 1999 at http://www.ec.gc.ca/ceqg-rcqe/sediment.htm.
Ferriter, A.P., 1997, Brazilian pepper management plan for Florida: West Palm Beach, Fla., Florida Exotic Pest Plant Council, 38 p.
Fuller, P.L., Nico, L.G., and Williams, J.D., 1999, Nonindig-enous fishes introduced into inland waters of the United States: Bethesda, Md., American Fisheries Society, Spe-cial Publication, v. 27, 613 p.
Gilmour, C.C., Riedel, G.S., Ederington, M.C., Bell, J.T., Benoit, J.M., Gill, G.A., and Stordal, M.C., 1998, Mercury methylation and sulfur cycling across a trophic gradient in the northern Everglades: Biogeochemistry, v. 40, p. 327–345.
Goolsby, D.A., Thurman, E.M., Pomes, M.L., Meyer, M.T., and Battaglin, W.A., 1997, Herbicides and their metabo-lites in rainfall: Origin, transport, and deposition patterns across the Midwestern and Northeastern United States, 1990–1991: Environmental Science and Technology, v. 31, p. 1325–1333.
Haag, K.H., and McPherson, B.F., 1997, Organochlorine pes-ticides and PCBs in southern Florida fishes—Then and Now: U.S. Geological Survey Fact Sheet FS–110–97, 4 p.
Haag, K.H., Miller, R.L., Bradner, L.A., and McCulloch, D.S., 1996, Water-quality assessment of southern Florida—An
overview of available information on surface and ground water and ecology: U.S. Geological Survey Water-Resources Investigations Report 96–4177, 42 p.
Hem, J.D., 1985, Study and interpretation of the chemical characteristics of natural water (3d ed.): U.S. Geological Survey Water-Supply Paper 2254, 263 p.
Hurley, J.P., Krabbenhoft, D.P., Cleckner, L.B., Olson, M.L., Aiken, G., and Rawlik, P.S., Jr., 1998, System controls on aqueous mercury distribution in the northern Everglades: Biogeochemistry 40, p. 293–311.
Klein, Howard, Armbruster, J.T., McPherson, B.F., and Freiberger, H.J., 1975, Water and the south Florida envi-ronment: U.S. Geological Survey Water-Resources Investigation 24–75, 165 p.
Kolipinski, M.C., and Higer, A.L., 1969, Some aspects of the effects of the quantity and quality of water on biological communities in Everglades National Park: U.S. Geologi-cal Survey Open-File Report, 97 p.
Kolpin, D.W., Barbash, J.E., and Gilliom, R.J., 1998, Occur-rence of pesticides in shallow ground water of the United States—Initial results from the National Water-Quality Assessment Program: Environmental Science and Tech-nology, v. 32, 558–566 p.
Krabbenhoft, D.P., 1996, Mercury studies in the Florida Ever-glades: U.S. Geological Survey Fact Sheet FS–166–96, 4 p.
Krabbenhoft, D.P., Wiener, J.G., Brumbaugh, W.G., Olson, M.L., DeWild, J.F., and Sabin, T.J., 1999a, A national pilot study of mercury contamination of aquatic ecosys-tems along multiple gradients,
in
Morganwalp, D.W., and Buxton, H.T., eds., U.S. Geological Survey Toxic Sub-stances Hydrology Program—Proceedings of the Techni-cal Meeting, Charleston, SC, March 8–12, 1999—Contamination of hydrologic systems and related ecosystems: U.S. Geological Survey Water-Resources Investigations Report 99–4018B, v. 2, p. 147–160.
Krabbenhoft, D.P., Hurley, J.P., Marvin-DiPasquale, M., Orem, W.H., Aiken, G.R., Schuster, P.J., Gilmour, C.C., and Harris, R., 1999b, The aquatic cycling of mercury in the Everglades (ACME) project: A process-based inves-tigation of mercury biogeochemistry in a complex envi-ronmental setting,
in
Gerould, Sarah, and Higer, Aaron, compilers, U.S. Geological Survey, Program on the South Florida Ecosystem—Proceedings of South Florida Restoration Science Forum, May 17–19, 1999, Boca Raton, Florida: U.S. Geological Survey Open-File Report 99–181, p. 54–56.
Lambou, V.W., Barkay, T., Braman, R.S., Delfino, J.J., Jansen, J.J., Nimmo, D., Parks, J.W., Porcella, D.B., Rudd, J., Schultz, D., Stober, J., Watras, C., Wiener, J.G., Gill, G., Huckabee, J., and Rood, B.E., 1991, Mercury technical advisory committee interim report to the Flor-ida Governor’s Mercury in Fish and Wildlife Taskforce and the Department of Environmental Regulation: Talla-hassee, Fla., Center for Biomedical and Toxicological Research and Waste Management, 60 p.
Langeland, K.A., 1998, Help protect Florida’s natural areas from non-native invasive plants: Gainesville, University
26 Water Quality in Southern Florida, 1996-98
of Florida, Cooperative Extension Service, Institute of Food and Agricultural Sciences, Circular 1204, 6 p.
Laroche, F.B., ed., 1994, Melaleuca management plan for Florida: West Palm Beach, Florida Exotic Pest Plant Council, 88 p.
Loftus, W.F., and Kushlan, J.A., 1987, Freshwater fishes of southern Florida: Gainesville, Fla., Bulletin of the Florida State Museum of Biological Sciences, v. 31, no. 4, 344 p.
McIvor, C.C., Ley, J.A., and Bjork, R.D., 1994, Changes in freshwater inflow from the Everglades to Florida Bay including effects on biota and biotic processes—A review,
in
Davis, S.M., and Ogden, J.C., eds., Ever-glades—The ecosystem and its restoration: Delray Beach, Fla., St. Lucie Press, p. 117–146.
McPherson, B.F., 1973, Water quality in the conservation areas of the central and southern Florida Flood Control District, 1970–72: U.S. Geological Survey Open-File Report 73–014, 39 p.
McPherson, B.F., and Halley, Robert, 1996, The south Florida environment—A region under stress: U.S. Geo-logical Survey Circular 1134, 61 p.
McPherson, B.F., and Miller, R.L., 1987, The vertical atten-uation of light in Charlotte Harbor, a shallow, subtropi-cal estuary, southwestern Florida: Estuarine, Coastal, and Shelf Science, v. 25, p. 721–737.
Meyer, M.T., Mills, M.S., and Thurman, E.M., 1993, Auto-mated solid-phase extraction of herbicides from water for gas chromatographic-mass spectrometric analysis: Journal of Chromatography, v. 629, p. 55–59.
Miles, C.J., and Pfeuffer, R.J., 1997, Pesticides in canals of south Florida: Archives of Environmental Contamina-tion and Toxicology, v. 32, p. 337–345.
Miller, R.L., and McPherson, B.F., in press, Occurrence and distribution of contaminants in bottom sediment and water of the Barron River Canal, Big Cypress National Preserve, Florida, October 1998: Florida Scientist, v. 64, no. 1.
Miller, R.L., McPherson, B.F., and Haag, K.L., 1999, Water quality in the southern Everglades and Big Cypress Swamp in the vicinity of the Tamiami Trail, 1996–97: U.S. Geological Survey Water-Resources Investigations Report 99–4062, 16 p.
Moyle, P.B., 1986, Fish introductions into North Amer-ica—Patterns and ecological impact,
in
Mooney, H.A., and Drake, J.A., eds., Ecology of biological invasions of North America and Hawaii: New York, Springer-Verlag, p. 27–43.
Newell, A.J., Johnson, D.W., and Allen, L.K., 1987, Niagara River Project—Fish flesh criteria for piscivo-rous wildlife: New York State Department of Environ-mental Conservation Technical Report 87–3.
Nowell, L.H., Capel, P.D., and Dileanis, P.D., 1999, Pesti-cides in stream sediment and aquatic biota—Distribu-tion, trends, and governing factors: Boca Raton, Fla., Lewis Publishers, 1001 p.
Orem, W.H., Bates, A.L., Lerch, H.E., Corum, Margo, and Boylan, Ann, 1999, Sulfur contamination in the Everglades and its relation to mercury methylation,
in
Gerould, Sarah, and Higer, Aaron, comps., U.S. Geolog-
ical Survey Program on the South Florida Ecosys-tem—Proceedings of South Florida Restoration Science Forum, May 17–19, 1999, Boca Raton, Florida: U.S. Geological Survey Open-File Report 99–181, 121 p.
Parker, G.G., Ferguson, G.E., Love, S.K., and others, 1955, Water resources of southeastern Florida, with special ref-erence to geology and ground water of the Miami area: U.S. Geological Survey Water-Supply Paper 1255, 965 p.
Reddy, M.M., Aiken, G.R., and Schuster, P.F., 1999, Mer-cury-dissolved organic carbon interactions in the Florida Everglades—A field and laboratory investigation,
in
U.S. Geological Survey, Program on the south Florida ecosystem, Proceedings of South Florida Restoration Science Forum, May 17–19, 1999, Boca Raton, Fla.: U.S. Geological Survey Open-File Report 99–181, p. 86–87.
Shahane, A.N.,1994, Pesticide detections in surface waters of Florida—Toxic substances and the hydrologic sci-ences: American Institute of Hydrology, p. 408–416.
Stober, Q.J., Jones, R.D., and Scheidt, D.J., 1995, Ultra trace level mercury in the Everglades ecosystem, a multi-media canal pilot study: Water, Air, and Soil Pollution, v. 80, p. 991–1001.
Swancar, Amy, 1996, Water quality, pesticide occurrence, and effects of irrigation with reclaimed water at golf courses in Florida: U.S. Geological Survey Water-Resources Investigations Report 95–4250, 85 p.
Swift, C.C., Gilbert, C.R., Bortone, S.A., Burgess, G.H., and Yerger, R.W., 1986, Zoogeography of the freshwater fishes of the southeastern United States—Savannah River to Lake Pontchartrain,
in
Hocutt, C.H. and Wiley, E.O., eds., The zoogeography of northern American freshwater fishes: New York, John Wiley and Sons, p. 213–265.
Thurman, E.M., Goolsby, D.A., Meyer, M.T., and Kolpin, D.W., 1991, Herbicides in surface waters of the Midwest-ern United States—The effect of the spring flush: Envi-ronmental Science and Technology, v. 25, p. 1794–1796.
Thurman, E.M., Goolsby, D.A., Meyer, M.T., Mills, M.S., Pomes, M.L., and Koplin, D.W., 1992, A reconnaissance study of herbicides and their metabolites in surface water of the Midwestern United States using immunoas-say and gas chromatography/mass spectrometry: Envi-ronmental Science and Technology, v. 26, p. 2440–2447.
Thurman, E.M., Meyer, M.T., Pomes, M.L., Perry, C.A., and Schwab, P., 1990, Comparison of an enzyme-linked immunosorbent assay and gas chromatography/mass spectrometry for the analysis of herbicides in water: Analytical Chemistry, v. 62, p. 2043–2048.
U.S. Geological Survey, 2000, Pesticides in surface and ground water of the United States: Summary of results of the National Water-Quality Assessment Program (NAWQA): accessed Aug. 18, 2000, at http://wwwd-cascr.wr.usgs.gov/pnsp/allsum_sw.html.
———1999, The quality of our Nation’s waters: U.S. Geo-logical Survey Circular 1225, 82 p.
Ware, F. J., Royals, H., and Lange, T., 1990, Mercury con-tamination in Florida largemouth bass: Proceedings of the Annual Conference Southeastern Association of Fish and Wildlife Agencies, no. 44, p. 5–12.
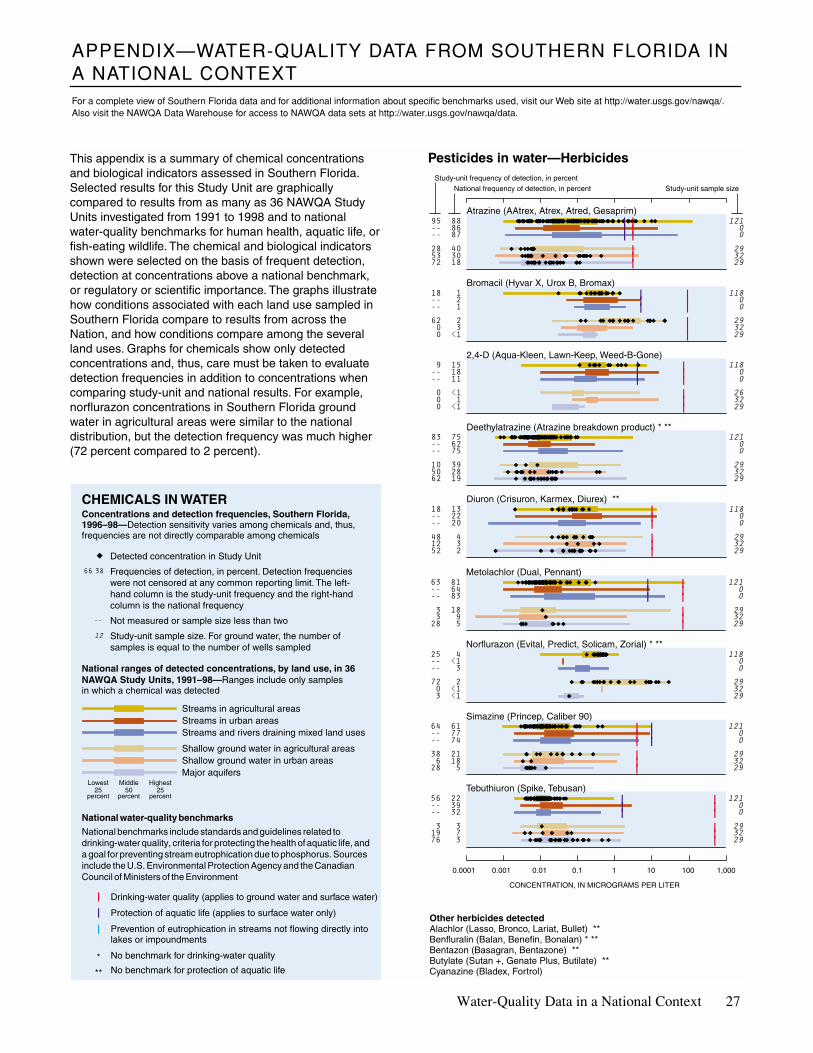
Water-Quality Data in a National Context 27
Streams in agricultural areas Streams in urban areasStreams and rivers draining mixed land uses
Shallow ground water in agricultural areasShallow ground water in urban areas Major aquifers
Detected concentration in Study Unit
Frequencies of detection, in percent. Detection frequencies were not censored at any common reporting limit. The left-hand column is the study-unit frequency and the right-hand column is the national frequency
Not measured or sample size less than two
Study-unit sample size. For ground water, the number of samples is equal to the number of wells sampled
National ranges of detected concentrations, by land use, in 36 NAWQA Study Units, 1991–98—Ranges include only samplesin which a chemical was detected
Drinking-water quality (applies to ground water and surface water)
Protection of aquatic life (applies to surface water only)
Prevention of eutrophication in streams not flowing directly into lakes or impoundments
No benchmark for drinking-water quality
No benchmark for protection of aquatic life*
**
66 38
Other herbicides detectedAlachlor (Lasso, Bronco, Lariat, Bullet) **Benfluralin (Balan, Benefin, Bonalan) * **Bentazon (Basagran, Bentazone) **Butylate (Sutan +, Genate Plus, Butilate) **Cyanazine (Bladex, Fortrol)
CHEMICALS IN WATERConcentrations and detection frequencies, Southern Florida, 1996–98—Detection sensitivity varies among chemicals and, thus, frequencies are not directly comparable among chemicals
Lowest25
percent
Middle50
percent
Highest25
percent
National water-quality benchmarks
National benchmarks include standards and guidelines related to drinking-water quality, criteria for protecting the health of aquatic life, and a goal for preventing stream eutrophication due to phosphorus. Sources include the U.S. Environmental Protection Agency and the Canadian Council of Ministers of the Environment
|
|
|
--
This appendix is a summary of chemical concentrations and biological indicators assessed in Southern Florida. Selected results for this Study Unit are graphically compared to results from as many as 36 NAWQA Study Units investigated from 1991 to 1998 and to national water-quality benchmarks for human health, aquatic life, or fish-eating wildlife. The chemical and biological indicators shown were selected on the basis of frequent detection, detection at concentrations above a national benchmark, or regulatory or scientific importance. The graphs illustrate how conditions associated with each land use sampled in Southern Florida compare to results from across the Nation, and how conditions compare among the several land uses. Graphs for chemicals show only detected concentrations and, thus, care must be taken to evaluate detection frequencies in addition to concentrations when comparing study-unit and national results. For example, norflurazon concentrations in Southern Florida ground water in agricultural areas were similar to the national distribution, but the detection frequency was much higher (72 percent compared to 2 percent).
CONCENTRATION, IN MICROGRAMS PER LITER
0.0001 0.001 0.01 0.1 1 10 100 1,000
Study-unit frequency of detection, in percentNational frequency of detection, in percent
Pesticides in water—Herbicides
Study-unit sample size
12
Atrazine (AAtrex, Atrex, Atred, Gesaprim) ||95 88 121||-- 86 0||-- 87 0
|28 40 29|53 30 32|72 18 29
Bromacil (Hyvar X, Urox B, Bromax) ||18 1 118||-- 2 0||-- 1 0
|62 2 29|0 3 32|0 <1 29
2,4-D (Aqua-Kleen, Lawn-Keep, Weed-B-Gone) ||9 15 118||-- 18 0||-- 11 0
|0 <1 26|0 1 32|0 <1 29
Deethylatrazine (Atrazine breakdown product) * **83 75 121-- 62 0-- 75 0
10 39 2950 28 3262 19 29
Diuron (Crisuron, Karmex, Diurex) **|18 13 118|-- 22 0|-- 20 0
|48 4 29|12 3 32|52 2 29
Metolachlor (Dual, Pennant) ||63 81 121||-- 64 0||-- 83 0
|3 18 29|3 9 32|28 5 29
Norflurazon (Evital, Predict, Solicam, Zorial) * **25 4 118-- <1 0-- 3 072 2 290 <1 323 <1 29
Simazine (Princep, Caliber 90) | |64 61 121| |-- 77 0| |-- 74 0
|38 21 29|6 18 32|28 5 29
Tebuthiuron (Spike, Tebusan) ||56 22 121||-- 39 0||-- 32 0
|3 3 29|19 7 32|76 3 29
APPENDIX—WATER-QUALITY DATA FROM SOUTHERN FLORIDA IN A NATIONAL CONTEXT
For a complete view of Southern Florida data and for additional information about specific benchmarks used, visit our Web site at http://water.usgs.gov/nawqa/. Also visit the NAWQA Data Warehouse for access to NAWQA data sets at http://water.usgs.gov/nawqa/data.
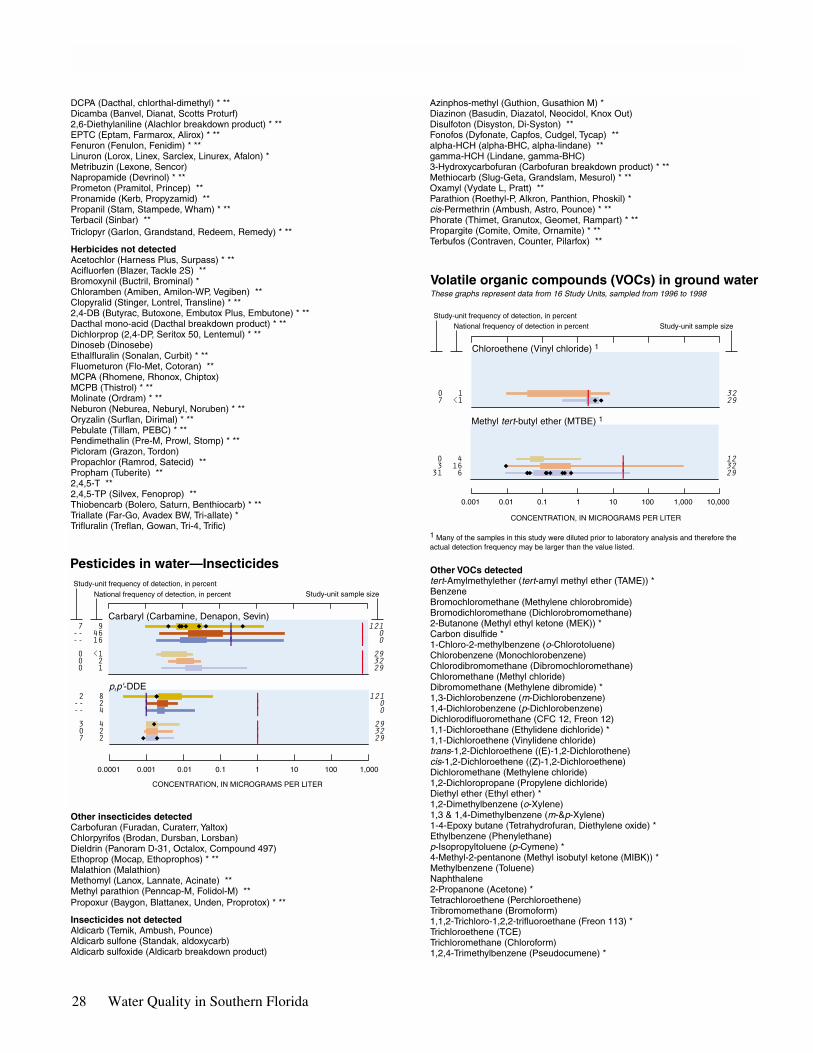
28 Water Quality in Southern Florida
CONCENTRATION, IN MICROGRAMS PER LITER
0.0001 0.001 0.01 0.1 1 10 100 1,000
DCPA (Dacthal, chlorthal-dimethyl) * **Dicamba (Banvel, Dianat, Scotts Proturf) 2,6-Diethylaniline (Alachlor breakdown product) * **EPTC (Eptam, Farmarox, Alirox) * **Fenuron (Fenulon, Fenidim) * **Linuron (Lorox, Linex, Sarclex, Linurex, Afalon) * Metribuzin (Lexone, Sencor) Napropamide (Devrinol) * **Prometon (Pramitol, Princep) **Pronamide (Kerb, Propyzamid) **Propanil (Stam, Stampede, Wham) * **Terbacil (Sinbar) **Triclopyr (Garlon, Grandstand, Redeem, Remedy) * **
Herbicides not detectedAcetochlor (Harness Plus, Surpass) * **Acifluorfen (Blazer, Tackle 2S) **Bromoxynil (Buctril, Brominal) * Chloramben (Amiben, Amilon-WP, Vegiben) **Clopyralid (Stinger, Lontrel, Transline) * **2,4-DB (Butyrac, Butoxone, Embutox Plus, Embutone) * **Dacthal mono-acid (Dacthal breakdown product) * **Dichlorprop (2,4-DP, Seritox 50, Lentemul) * **Dinoseb (Dinosebe) Ethalfluralin (Sonalan, Curbit) * **Fluometuron (Flo-Met, Cotoran) **MCPA (Rhomene, Rhonox, Chiptox) MCPB (Thistrol) * **Molinate (Ordram) * **Neburon (Neburea, Neburyl, Noruben) * **Oryzalin (Surflan, Dirimal) * **Pebulate (Tillam, PEBC) * **Pendimethalin (Pre-M, Prowl, Stomp) * **Picloram (Grazon, Tordon) Propachlor (Ramrod, Satecid) **Propham (Tuberite) **2,4,5-T **2,4,5-TP (Silvex, Fenoprop) **Thiobencarb (Bolero, Saturn, Benthiocarb) * **Triallate (Far-Go, Avadex BW, Tri-allate) * Trifluralin (Treflan, Gowan, Tri-4, Trific)
Study-unit frequency of detection, in percentNational frequency of detection, in percent
Pesticides in water—Insecticides
Study-unit sample size
Volatile organic compounds (VOCs) in ground waterThese graphs represent data from 16 Study Units, sampled from 1996 to 1998
Study-unit frequency of detection, in percentNational frequency of detection in percent Study-unit sample size
CONCENTRATION, IN MICROGRAMS PER LITER
0.001 0.01 0.1 1 10 100 1,000 10,000
Other VOCs detectedtert-Amylmethylether (tert-amyl methyl ether (TAME)) * Benzene Bromochloromethane (Methylene chlorobromide) Bromodichloromethane (Dichlorobromomethane) 2-Butanone (Methyl ethyl ketone (MEK)) * Carbon disulfide * 1-Chloro-2-methylbenzene (o-Chlorotoluene) Chlorobenzene (Monochlorobenzene) Chlorodibromomethane (Dibromochloromethane) Chloromethane (Methyl chloride) Dibromomethane (Methylene dibromide) * 1,3-Dichlorobenzene (m-Dichlorobenzene) 1,4-Dichlorobenzene (p-Dichlorobenzene) Dichlorodifluoromethane (CFC 12, Freon 12) 1,1-Dichloroethane (Ethylidene dichloride) * 1,1-Dichloroethene (Vinylidene chloride) trans-1,2-Dichloroethene ((E)-1,2-Dichlorothene) cis-1,2-Dichloroethene ((Z)-1,2-Dichloroethene) Dichloromethane (Methylene chloride) 1,2-Dichloropropane (Propylene dichloride) Diethyl ether (Ethyl ether) * 1,2-Dimethylbenzene (o-Xylene) 1,3 & 1,4-Dimethylbenzene (m-&p-Xylene) 1-4-Epoxy butane (Tetrahydrofuran, Diethylene oxide) * Ethylbenzene (Phenylethane) p-Isopropyltoluene (p-Cymene) * 4-Methyl-2-pentanone (Methyl isobutyl ketone (MIBK)) * Methylbenzene (Toluene) Naphthalene 2-Propanone (Acetone) * Tetrachloroethene (Perchloroethene) Tribromomethane (Bromoform) 1,1,2-Trichloro-1,2,2-trifluoroethane (Freon 113) * Trichloroethene (TCE) Trichloromethane (Chloroform) 1,2,4-Trimethylbenzene (Pseudocumene) *
Carbaryl (Carbamine, Denapon, Sevin) ||7 9 121||-- 46 0||-- 16 0
|0 <1 29|0 2 32|0 1 29
p,p'-DDE ||2 8 121||-- 2 0||-- 4 0
|3 4 29|0 2 32|7 2 29
Other insecticides detected Carbofuran (Furadan, Curaterr, Yaltox) Chlorpyrifos (Brodan, Dursban, Lorsban) Dieldrin (Panoram D-31, Octalox, Compound 497) Ethoprop (Mocap, Ethoprophos) * **Malathion (Malathion) Methomyl (Lanox, Lannate, Acinate) **Methyl parathion (Penncap-M, Folidol-M) **Propoxur (Baygon, Blattanex, Unden, Proprotox) * **
Insecticides not detectedAldicarb (Temik, Ambush, Pounce) Aldicarb sulfone (Standak, aldoxycarb) Aldicarb sulfoxide (Aldicarb breakdown product)
Azinphos-methyl (Guthion, Gusathion M) * Diazinon (Basudin, Diazatol, Neocidol, Knox Out) Disulfoton (Disyston, Di-Syston) **Fonofos (Dyfonate, Capfos, Cudgel, Tycap) **alpha-HCH (alpha-BHC, alpha-lindane) **gamma-HCH (Lindane, gamma-BHC) 3-Hydroxycarbofuran (Carbofuran breakdown product) * **Methiocarb (Slug-Geta, Grandslam, Mesurol) * **Oxamyl (Vydate L, Pratt) **Parathion (Roethyl-P, Alkron, Panthion, Phoskil) * cis-Permethrin (Ambush, Astro, Pounce) * **Phorate (Thimet, Granutox, Geomet, Rampart) * **Propargite (Comite, Omite, Ornamite) * **Terbufos (Contraven, Counter, Pilarfox) **
Chloroethene (Vinyl chloride) 1
|0 1 32|7 <1 29
Methyl tert-butyl ether (MTBE) 1
|0 4 12|3 16 32|31 6 29
1 Many of the samples in this study were diluted prior to laboratory analysis and therefore the actual detection frequency may be larger than the value listed.
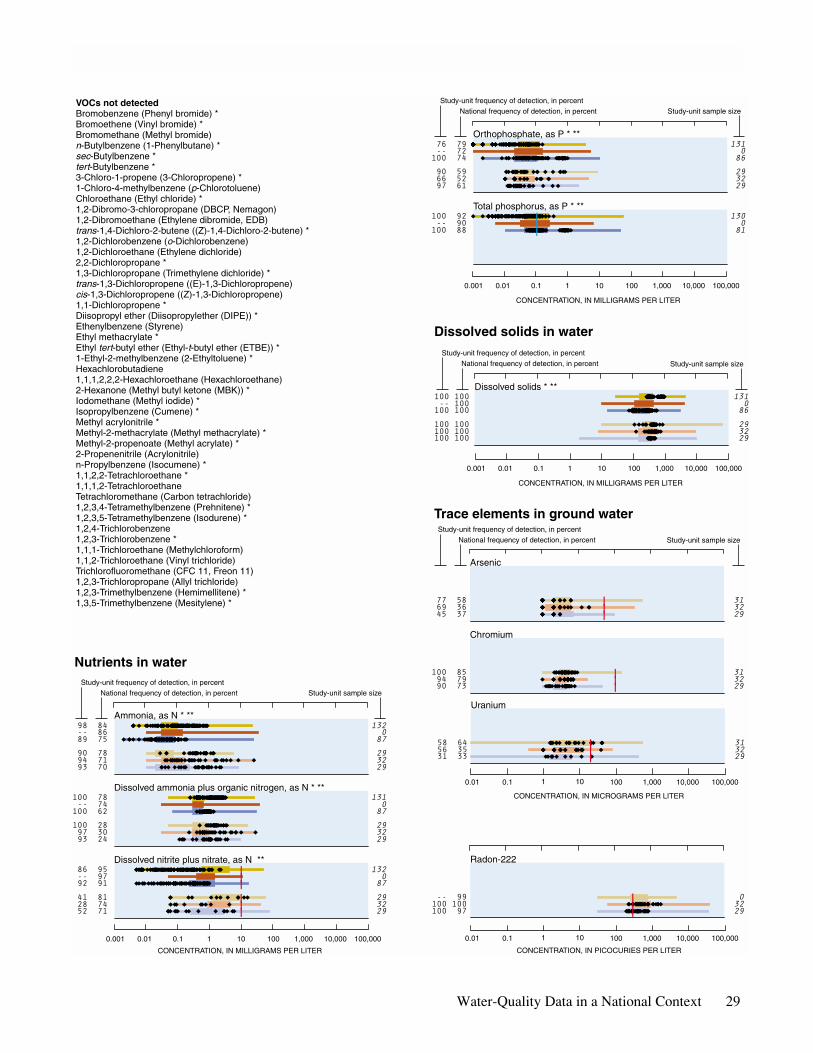
Water-Quality Data in a National Context 29
CONCENTRATION, IN MILLIGRAMS PER LITER
0.001 0.01 0.1 1 10 100 1,000 10,000 100,000
CONCENTRATION, IN MILLIGRAMS PER LITER
0.001 0.01 0.1 1 10 100 1,000 10,000 100,000
Nutrients in waterStudy-unit frequency of detection, in percent
National frequency of detection, in percent Study-unit sample size
CONCENTRATION, IN MILLIGRAMS PER LITER
0.001 0.01 0.1 1 10 100 1,000 10,000 100,000
Study-unit frequency of detection, in percent
National frequency of detection, in percent Study-unit sample size
Dissolved solids in waterStudy-unit frequency of detection, in percent
National frequency of detection, in percent Study-unit sample size
VOCs not detectedBromobenzene (Phenyl bromide) * Bromoethene (Vinyl bromide) * Bromomethane (Methyl bromide) n-Butylbenzene (1-Phenylbutane) * sec-Butylbenzene * tert-Butylbenzene * 3-Chloro-1-propene (3-Chloropropene) * 1-Chloro-4-methylbenzene (p-Chlorotoluene) Chloroethane (Ethyl chloride) * 1,2-Dibromo-3-chloropropane (DBCP, Nemagon) 1,2-Dibromoethane (Ethylene dibromide, EDB) trans-1,4-Dichloro-2-butene ((Z)-1,4-Dichloro-2-butene) * 1,2-Dichlorobenzene (o-Dichlorobenzene) 1,2-Dichloroethane (Ethylene dichloride) 2,2-Dichloropropane * 1,3-Dichloropropane (Trimethylene dichloride) * trans-1,3-Dichloropropene ((E)-1,3-Dichloropropene) cis-1,3-Dichloropropene ((Z)-1,3-Dichloropropene) 1,1-Dichloropropene * Diisopropyl ether (Diisopropylether (DIPE)) * Ethenylbenzene (Styrene) Ethyl methacrylate * Ethyl tert-butyl ether (Ethyl-t-butyl ether (ETBE)) * 1-Ethyl-2-methylbenzene (2-Ethyltoluene) * Hexachlorobutadiene 1,1,1,2,2,2-Hexachloroethane (Hexachloroethane) 2-Hexanone (Methyl butyl ketone (MBK)) * Iodomethane (Methyl iodide) * Isopropylbenzene (Cumene) * Methyl acrylonitrile * Methyl-2-methacrylate (Methyl methacrylate) * Methyl-2-propenoate (Methyl acrylate) * 2-Propenenitrile (Acrylonitrile) n-Propylbenzene (Isocumene) * 1,1,2,2-Tetrachloroethane * 1,1,1,2-Tetrachloroethane Tetrachloromethane (Carbon tetrachloride) 1,2,3,4-Tetramethylbenzene (Prehnitene) * 1,2,3,5-Tetramethylbenzene (Isodurene) * 1,2,4-Trichlorobenzene 1,2,3-Trichlorobenzene * 1,1,1-Trichloroethane (Methylchloroform) 1,1,2-Trichloroethane (Vinyl trichloride) Trichlorofluoromethane (CFC 11, Freon 11) 1,2,3-Trichloropropane (Allyl trichloride) 1,2,3-Trimethylbenzene (Hemimellitene) * 1,3,5-Trimethylbenzene (Mesitylene) *
CONCENTRATION, IN PICOCURIES PER LITER
Trace elements in ground water
Arsenic
|77 58 31|69 36 32|45 37 29
Chromium
|100 85 31|94 79 32|90 73 29
Radon-222
|-- 99 0|100 100 32|100 97 29
Uranium
|58 64 31|56 35 32|31 33 29
CONCENTRATION, IN MICROGRAMS PER LITER
Study-unit frequency of detection, in percent
National frequency of detection, in percent Study-unit sample size
0.01 0.1 1 10 100 1,000 10,000 100,000
0.01 0.1 1 10 100 1,000 10,000 100,000
Ammonia, as N * **98 84 132-- 86 089 75 8790 78 2994 71 3293 70 29
Dissolved ammonia plus organic nitrogen, as N * **100 78 131-- 74 0
100 62 87100 28 2997 30 3293 24 29
Dissolved nitrite plus nitrate, as N **|86 95 132|-- 97 0|92 91 87
|41 81 29|28 74 32|52 71 29
Orthophosphate, as P * **76 79 131-- 72 0100 74 8690 59 2966 52 3297 61 29
Total phosphorus, as P * **|100 92 130|-- 90 0|100 88 81
Dissolved solids * **100 100 131-- 100 0100 100 86
100 100 29100 100 32100 100 29
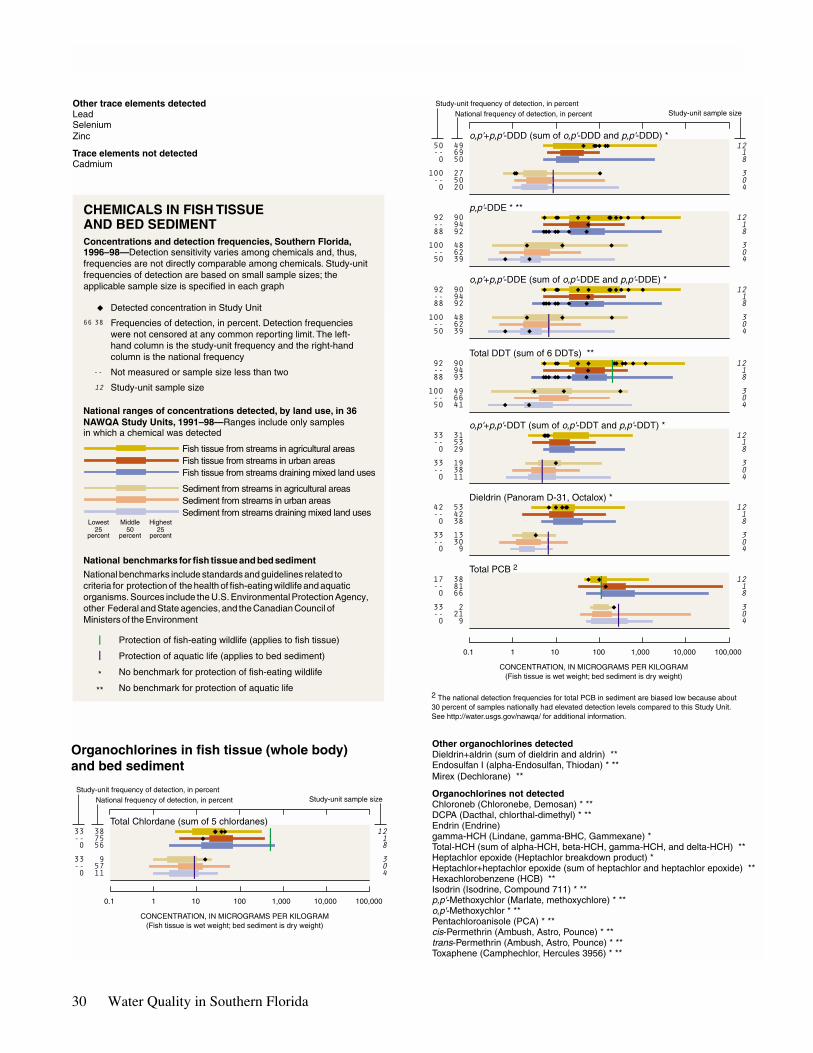
30 Water Quality in Southern Florida
Fish tissue from streams in agricultural areasFish tissue from streams in urban areasFish tissue from streams draining mixed land uses
Sediment from streams in agricultural areas Sediment from streams in urban areas Sediment from streams draining mixed land uses
Protection of fish-eating wildlife (applies to fish tissue)
Protection of aquatic life (applies to bed sediment)
No benchmark for protection of fish-eating wildlife
No benchmark for protection of aquatic life
|
|
**
CHEMICALS IN FISH TISSUEAND BED SEDIMENTConcentrations and detection frequencies, Southern Florida, 1996–98—Detection sensitivity varies among chemicals and, thus, frequencies are not directly comparable among chemicals. Study-unit frequencies of detection are based on small sample sizes; the applicable sample size is specified in each graph
Lowest25
percent
Middle50
percent
Highest25
percent
National benchmarks for fish tissue and bed sediment
National benchmarks include standards and guidelines related to criteria for protection of the health of fish-eating wildlife and aquatic organisms. Sources include the U.S. Environmental Protection Agency, other Federal and State agencies, and the Canadian Council of Ministers of the Environment
*
Other organochlorines detectedDieldrin+aldrin (sum of dieldrin and aldrin) **Endosulfan I (alpha-Endosulfan, Thiodan) * **Mirex (Dechlorane) **
Organochlorines not detectedChloroneb (Chloronebe, Demosan) * **DCPA (Dacthal, chlorthal-dimethyl) * **Endrin (Endrine) gamma-HCH (Lindane, gamma-BHC, Gammexane) * Total-HCH (sum of alpha-HCH, beta-HCH, gamma-HCH, and delta-HCH) **Heptachlor epoxide (Heptachlor breakdown product) * Heptachlor+heptachlor epoxide (sum of heptachlor and heptachlor epoxide) **Hexachlorobenzene (HCB) **Isodrin (Isodrine, Compound 711) * **p,p'-Methoxychlor (Marlate, methoxychlore) * **o,p'-Methoxychlor * **Pentachloroanisole (PCA) * **cis-Permethrin (Ambush, Astro, Pounce) * **trans-Permethrin (Ambush, Astro, Pounce) * **Toxaphene (Camphechlor, Hercules 3956) * **
CONCENTRATION, IN MICROGRAMS PER KILOGRAM(Fish tissue is wet weight; bed sediment is dry weight)
0.1 1 10 100 1,000 10,000 100,000
CONCENTRATION, IN MICROGRAMS PER KILOGRAM(Fish tissue is wet weight; bed sediment is dry weight)
0.1 1 10 100 1,000 10,000 100,000
National ranges of concentrations detected, by land use, in 36 NAWQA Study Units, 1991–98—Ranges include only samplesin which a chemical was detected
Detected concentration in Study Unit
Frequencies of detection, in percent. Detection frequencies were not censored at any common reporting limit. The left-hand column is the study-unit frequency and the right-hand column is the national frequency
Not measured or sample size less than two
Study-unit sample size
66 38
--
12
Organochlorines in fish tissue (whole body)and bed sediment
Study-unit frequency of detection, in percentNational frequency of detection, in percent Study-unit sample size
Study-unit frequency of detection, in percentNational frequency of detection, in percent Study-unit sample size
2 The national detection frequencies for total PCB in sediment are biased low because about 30 percent of samples nationally had elevated detection levels compared to this Study Unit. See http://water.usgs.gov/nawqa/ for additional information.
Other trace elements detectedLead Selenium Zinc
Trace elements not detected
Cadmium
Total Chlordane (sum of 5 chlordanes) |33 38 12|-- 75 1|0 56 8
|33 9 3|-- 57 0|0 11 4
o,p'+p,p'-DDD (sum of o,p'-DDD and p,p'-DDD) * 50 49 12-- 69 10 50 8
|100 27 3|-- 50 0|0 20 4
p,p'-DDE * **92 90 12-- 94 188 92 8
100 48 3-- 62 050 39 4
o,p'+p,p'-DDE (sum of o,p'-DDE and p,p'-DDE) * 92 90 12-- 94 188 92 8
|100 48 3|-- 62 0|50 39 4
Total DDT (sum of 6 DDTs) **|92 90 12|-- 94 1|88 93 8
100 49 3-- 66 050 41 4
o,p'+p,p'-DDT (sum of o,p'-DDT and p,p'-DDT) * 33 31 12-- 53 10 29 8
|33 19 3|-- 38 0|0 11 4
Dieldrin (Panoram D-31, Octalox) * 42 53 12-- 42 10 38 8
|33 13 3|-- 30 0|0 9 4
Total PCB 2|17 38 12|-- 81 1|0 66 8
|33 2 3|-- 21 0|0 9 4
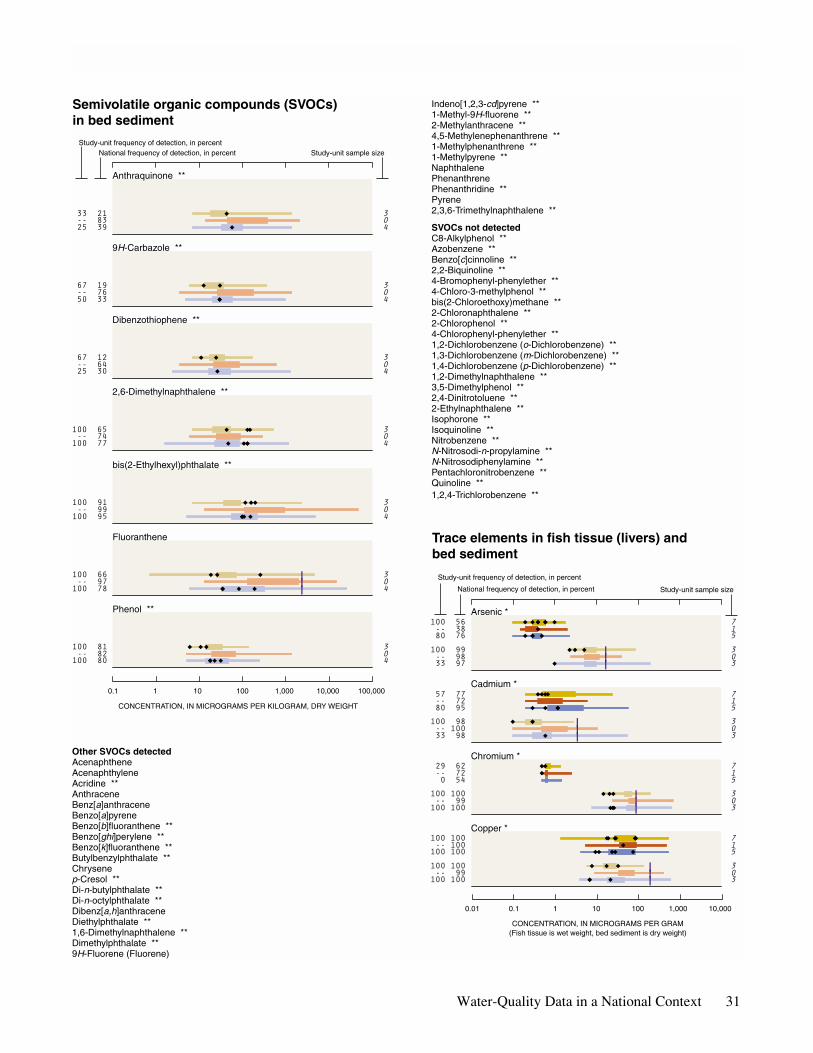
Water-Quality Data in a National Context 31
CONCENTRATION, IN MICROGRAMS PER KILOGRAM, DRY WEIGHT
0.1 1 10 100 1,000 10,000 100,000
Study-unit frequency of detection, in percentNational frequency of detection, in percent
Semivolatile organic compounds (SVOCs)in bed sediment
Study-unit sample size
Other SVOCs detectedAcenaphthene Acenaphthylene Acridine **Anthracene Benz[a]anthracene Benzo[a]pyrene Benzo[b]fluoranthene **Benzo[ghi]perylene **Benzo[k]fluoranthene **Butylbenzylphthalate **Chrysene p-Cresol **Di-n-butylphthalate **Di-n-octylphthalate **Dibenz[a,h]anthracene Diethylphthalate **1,6-Dimethylnaphthalene **Dimethylphthalate **9H-Fluorene (Fluorene)
Indeno[1,2,3-cd]pyrene **1-Methyl-9H-fluorene **2-Methylanthracene **4,5-Methylenephenanthrene **1-Methylphenanthrene **1-Methylpyrene **Naphthalene Phenanthrene Phenanthridine **Pyrene 2,3,6-Trimethylnaphthalene **
SVOCs not detectedC8-Alkylphenol **Azobenzene **Benzo[c]cinnoline **2,2-Biquinoline **4-Bromophenyl-phenylether **4-Chloro-3-methylphenol **bis(2-Chloroethoxy)methane **2-Chloronaphthalene **2-Chlorophenol **4-Chlorophenyl-phenylether **1,2-Dichlorobenzene (o-Dichlorobenzene) **1,3-Dichlorobenzene (m-Dichlorobenzene) **1,4-Dichlorobenzene (p-Dichlorobenzene) **1,2-Dimethylnaphthalene **3,5-Dimethylphenol **2,4-Dinitrotoluene **2-Ethylnaphthalene **Isophorone **Isoquinoline **Nitrobenzene **N-Nitrosodi-n-propylamine **N-Nitrosodiphenylamine **Pentachloronitrobenzene **Quinoline **1,2,4-Trichlorobenzene **
CONCENTRATION, IN MICROGRAMS PER GRAM(Fish tissue is wet weight, bed sediment is dry weight)
0.01 0.1 1 10 100 10,000 1,000
Study-unit frequency of detection, in percent
National frequency of detection, in percent
Trace elements in fish tissue (livers) and bed sediment
Study-unit sample size
Anthraquinone **
33 21 3-- 83 025 39 4
9H-Carbazole **
67 19 3-- 76 050 33 4
Dibenzothiophene **
67 12 3-- 64 025 30 4
2,6-Dimethylnaphthalene **
100 65 3-- 74 0
100 77 4
bis(2-Ethylhexyl)phthalate **
100 91 3-- 99 0100 95 4
Fluoranthene
|100 66 3|-- 97 0|100 78 4
Phenol **
100 81 3-- 82 0100 80 4
Arsenic * 100 56 7-- 38 180 76 5
|100 99 3|-- 98 0|33 97 3
Cadmium * 57 77 7-- 72 180 95 5
|100 98 3|-- 100 0|33 98 3
Chromium * 29 62 7-- 72 10 54 5
|100 100 3|-- 99 0|100 100 3
Copper * 100 100 7-- 100 1
100 100 5
|100 100 3|-- 99 0|100 100 3
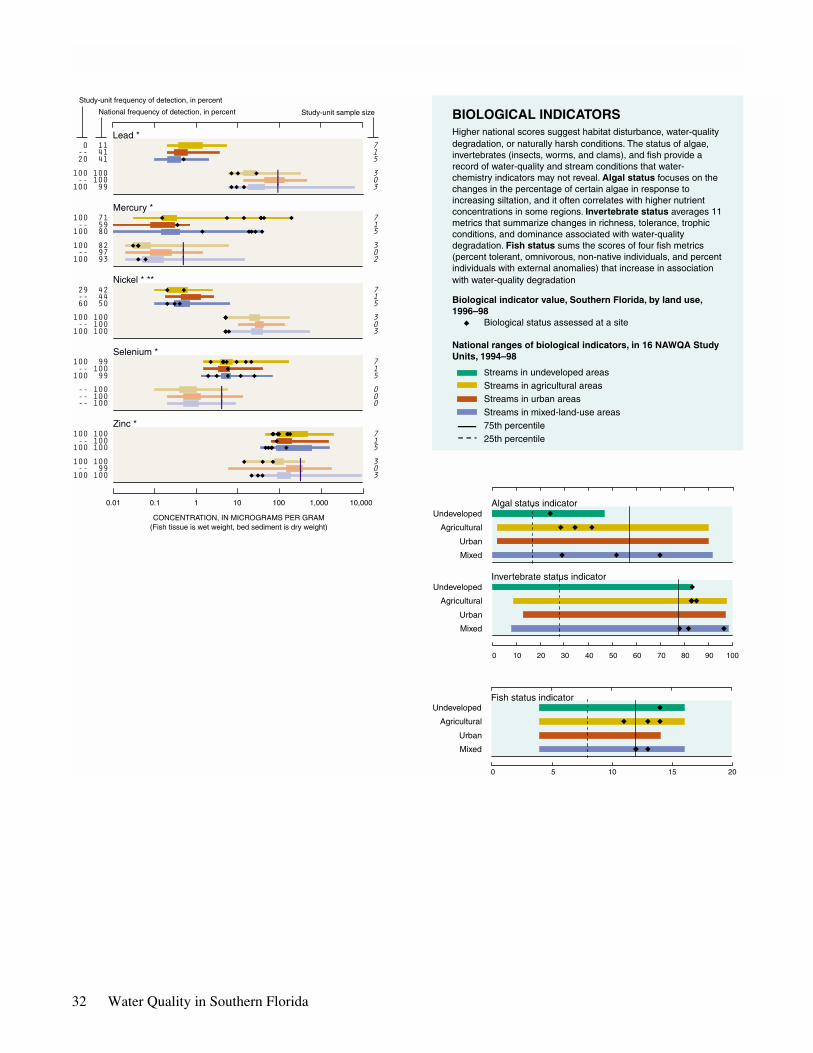
32 Water Quality in Southern Florida
Biological indicator value, Southern Florida, by land use, 1996–98
Biological status assessed at a site
National ranges of biological indicators, in 16 NAWQA Study Units, 1994–98
Streams in undeveloped areasStreams in agricultural areasStreams in urban areasStreams in mixed-land-use areas75th percentile25th percentile
BIOLOGICAL INDICATORSHigher national scores suggest habitat disturbance, water-quality degradation, or naturally harsh conditions. The status of algae, invertebrates (insects, worms, and clams), and fish provide a record of water-quality and stream conditions that water- chemistry indicators may not reveal. Algal status focuses on the changes in the percentage of certain algae in response to increasing siltation, and it often correlates with higher nutrient concentrations in some regions. Invertebrate status averages 11 metrics that summarize changes in richness, tolerance, trophic conditions, and dominance associated with water-quality degradation. Fish status sums the scores of four fish metrics (percent tolerant, omnivorous, non-native individuals, and percent individuals with external anomalies) that increase in association with water-quality degradation
0 10 20 30 40 50 60 70 80 90 100
CONCENTRATION, IN MICROGRAMS PER GRAM(Fish tissue is wet weight, bed sediment is dry weight)
0.01 0.1 1 10 100 10,000 1,000
Study-unit frequency of detection, in percent
National frequency of detection, in percent Study-unit sample size
0 5 10 15 20
Algal status indicatorUndeveloped
Agricultural
Urban
Mixed
Invertebrate status indicatorUndeveloped
Agricultural
Urban
Mixed
Fish status indicatorUndeveloped
Agricultural
Urban
Mixed
Lead * 0 11 7-- 41 120 41 5
|100 100 3|-- 100 0|100 99 3
Mercury * 100 71 7-- 59 1100 80 5
|100 82 3|-- 97 0|100 93 2
Nickel * **29 42 7-- 44 160 50 5100 100 3-- 100 0100 100 3
Selenium * 100 99 7-- 100 1100 99 5
|-- 100 0|-- 100 0|-- 100 0
Zinc * 100 100 7-- 100 1100 100 5
|100 100 3|-- 99 0|100 100 3
A COORDINATED EFFORT
Coordination among agencies and organizations is an integral part of the NAWQA Program. We thank the follow-ing agencies and organizations who contributed data used in this report or participated in the Study Unit liaison committee.
Federal Organizations Native American
National Park Service Miccosukee Tribe of Indians of FloridaNational Oceanic and Atmospheric Administration Seminole Tribe of FloridaU.S. Army Corps of EngineersU.S. Department of Agriculture
Universities
U.S. Environmental Protection Agency University of MiamiU.S. Fish and Wildlife Service University of FloridaNational Marine Fisheries Service Florida International University
State Agencies
Florida Marine Research Institute
Local Agencies
Florida Department of Agriculture and Consumer Services City of NaplesFlorida Department of Environmental Protection Metropolitan Dade CountyFlorida Game and Freshwater Fish Commission Palm Beach CountyFlorida Geological Survey Broward CountyFlorida Park Service Collier CountySouth Florida Water Management DistrictSouthwest Florida Water Management District
Private Organizations
Nature Conservancy
Special thanks to U.S. Geological Survey employees for their contributions:
Bruce Bernard, lead technician for SOFL, John Byrnes, Mark Zucker for data collection. Becky Deckard, Teresa Embry, Pat Mixson, andRon Spencer for production of the report, including editing, layout, and illustrations. Michael Meyers for his contribution on pesticide deg-radation.Appreciation also is extended to those individuals and agencies that reviewed this report: Edward Oaksford, U.S. Geological Survey, Michael Thurman, U.S. Geological Survey, Richard Pfeuffer, South Florida Water Management District.
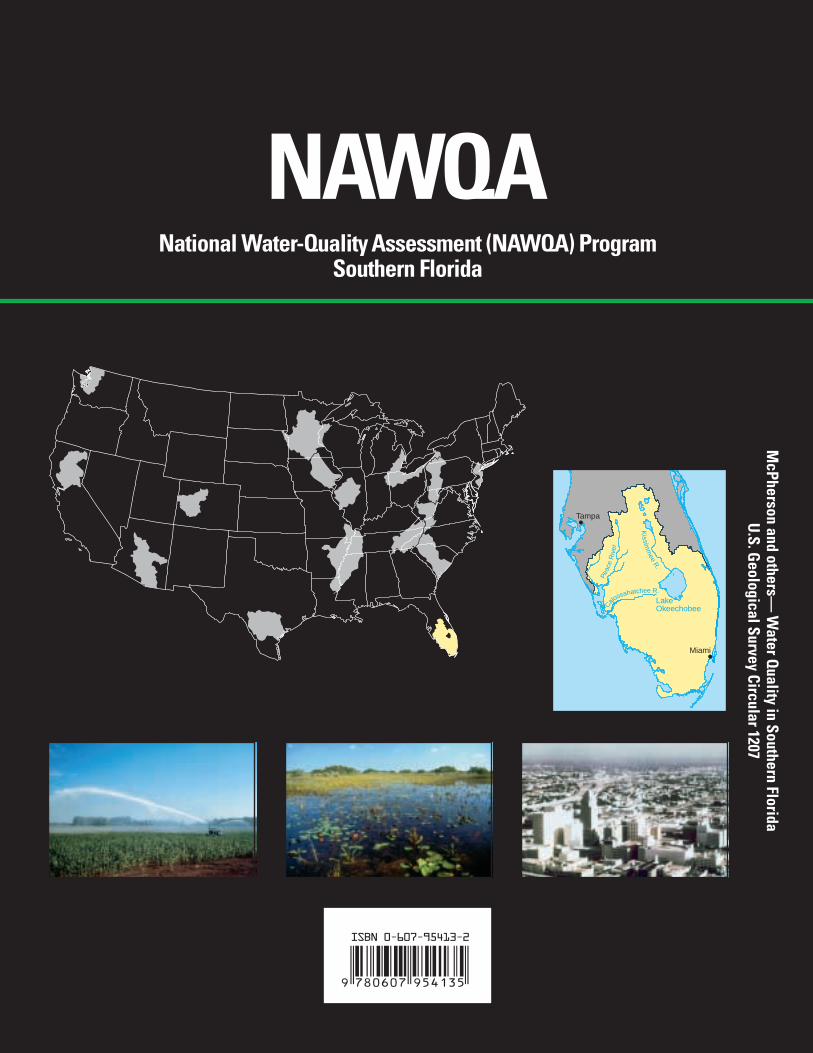
McPherson and others—
Water Q
uality in Southern FloridaU
.S. Geological Survey Circular 1207
National Water-Quality Assessment (NAWQA) ProgramSouthern Florida
LakeOkeechobee
Miami
Tampa
Kissim
mee
R.
Caloosahatchee R.
Peac
eR
ive
r
NAWQA