Embed Size (px)
Citation preview
Jennifer H. Richards1
Tom Philippi1P. Kalla2 and D. Scheidt3
1Dept. of Biological Sciences, Florida International University, Miami, FL 2U.S Environmental Protection Agency, Region 4, Science and Ecosystem Support
Division, Athens, GA 3U.S. Environmental Protection Agency, Region 4, Water Management Division,
Athens, GA
Characterization of Southern Florida Marsh Vegetation Using a Landscape
Scale Random Sample: R-EMAP Phase III Vegetation Sampling.
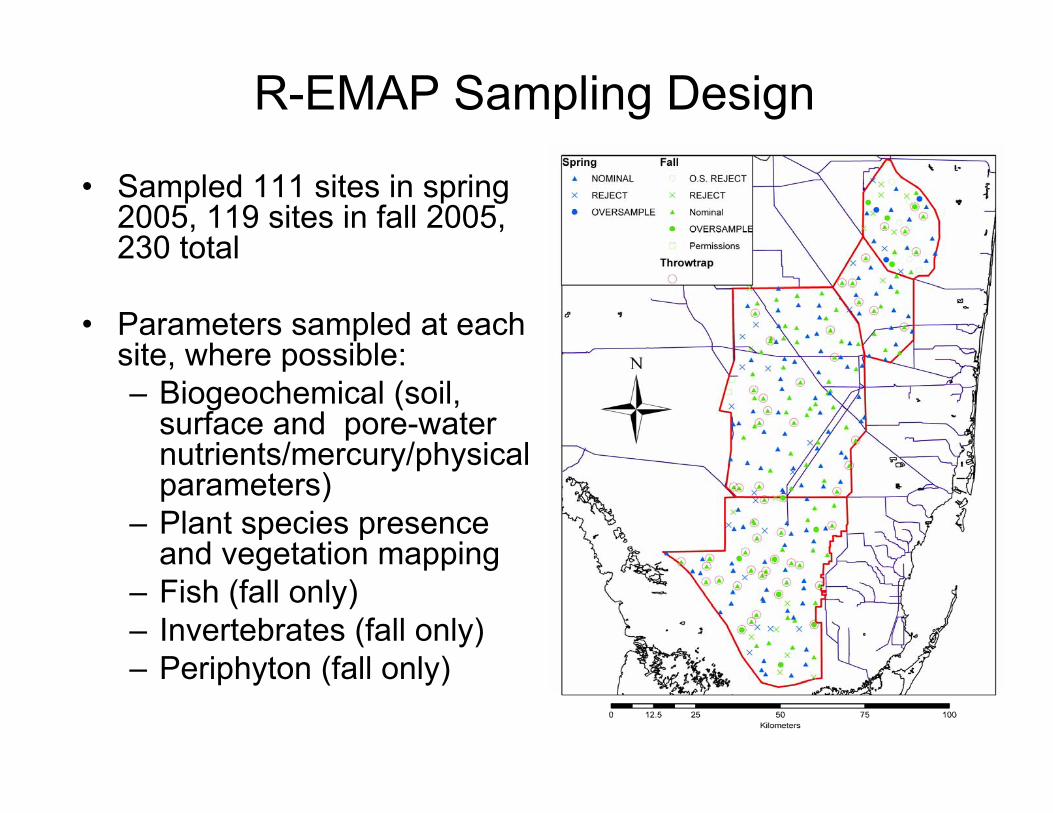
• Sampled 111 sites in spring 2005, 119 sites in fall 2005, 230 total
• Parameters sampled at each site, where possible:– Biogeochemical (soil,
surface and pore-water nutrients/mercury/physical parameters)
– Plant species presence and vegetation mapping
– Fish (fall only)– Invertebrates (fall only)– Periphyton (fall only)
R-EMAP Sampling Design
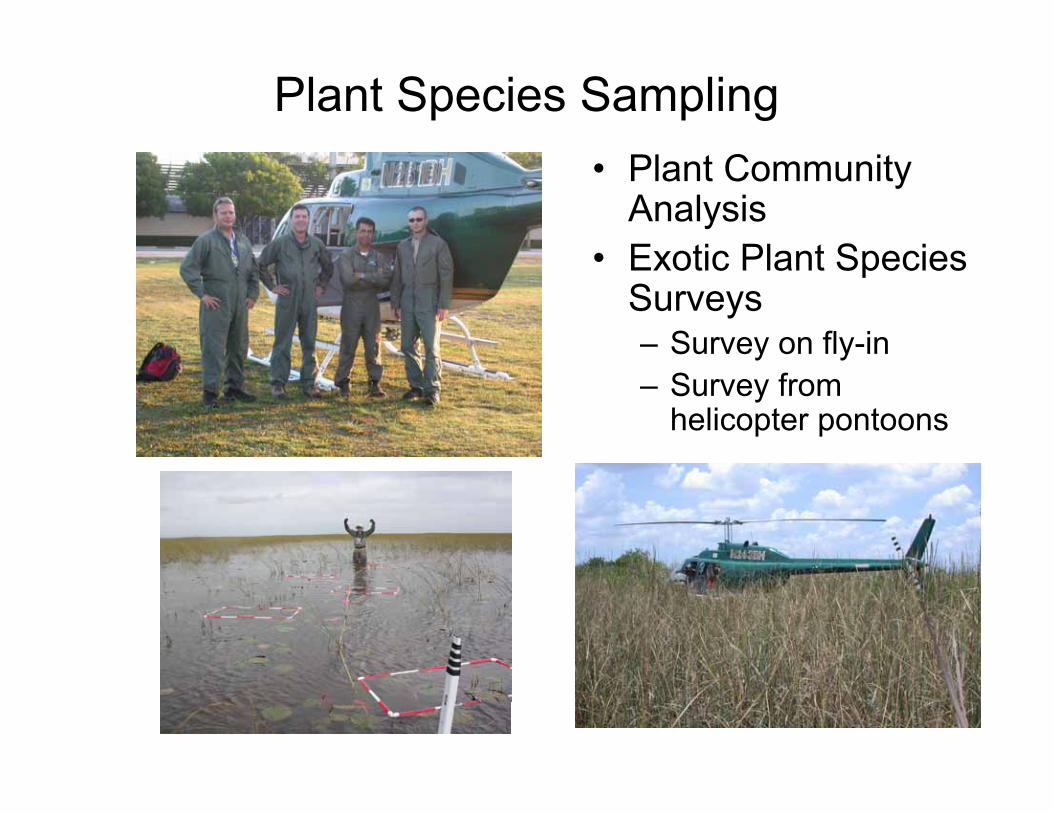
Plant Species Sampling• Plant Community
Analysis• Exotic Plant Species
Surveys– Survey on fly-in– Survey from
helicopter pontoons
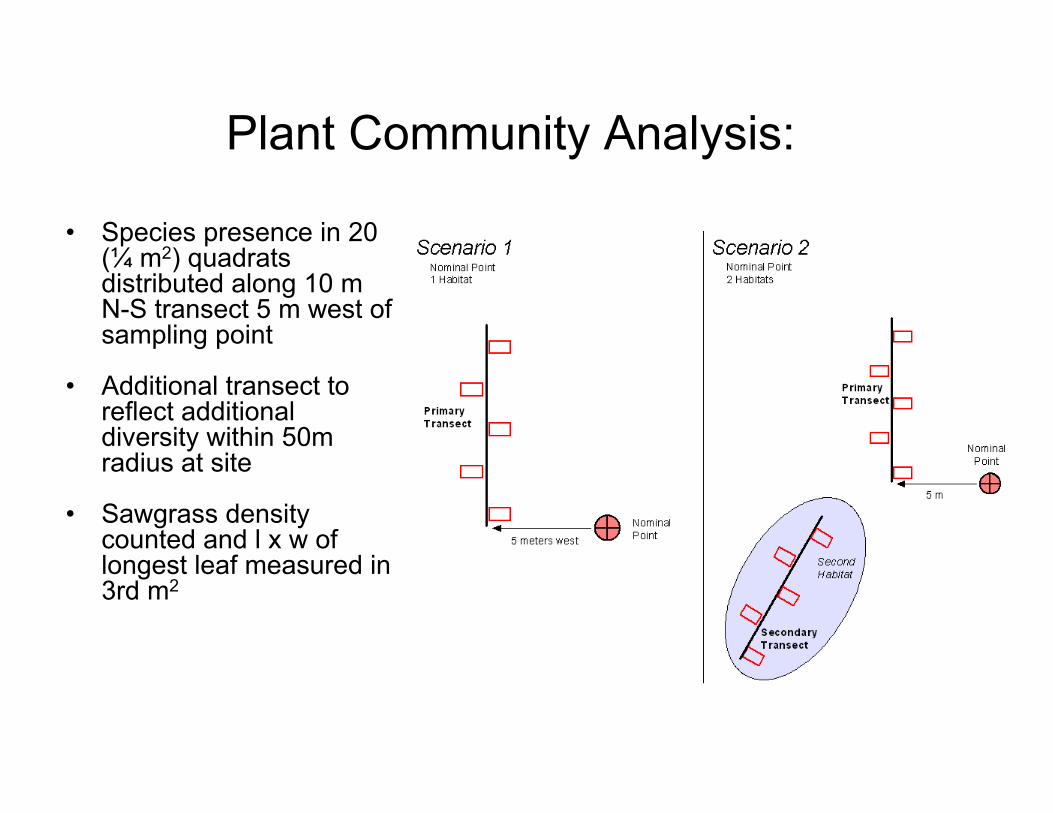
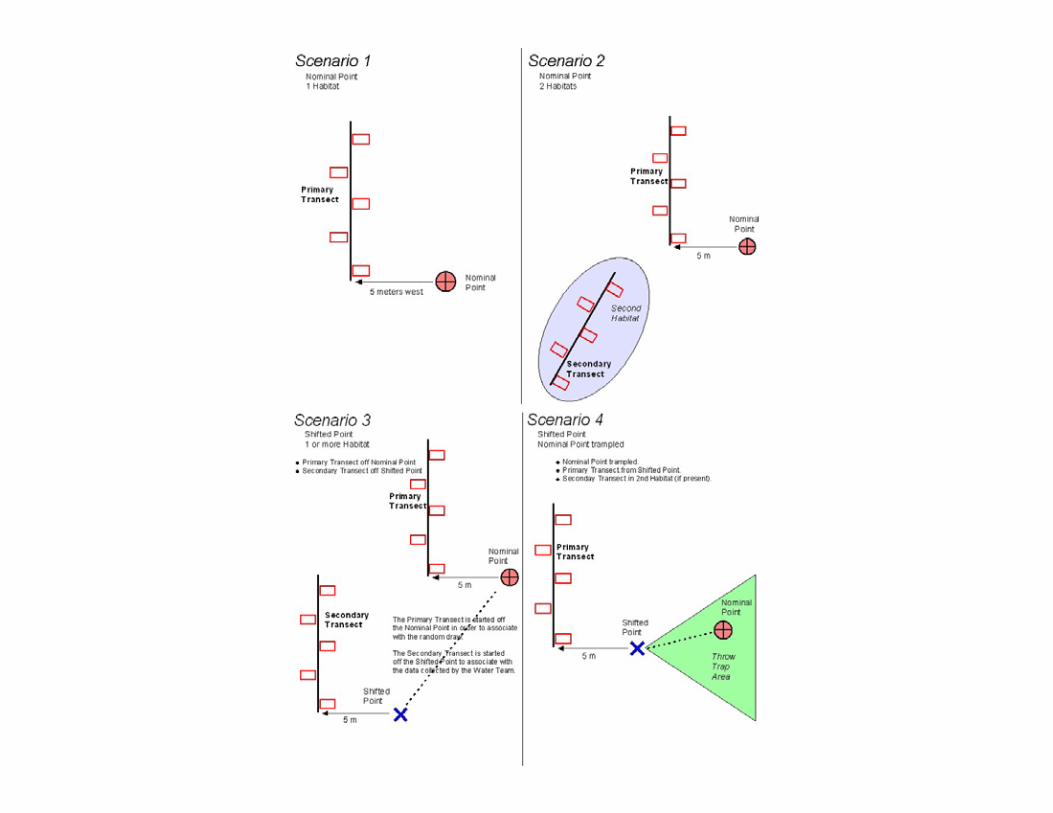
Plant Community Analysis:
• Species presence in 20 (¼ m2) quadratsdistributed along 10 m N-S transect 5 m west of sampling point
• Additional transect to reflect additional diversity within 50m radius at site
• Sawgrass density counted and l x w of longest leaf measured in 3rd m2
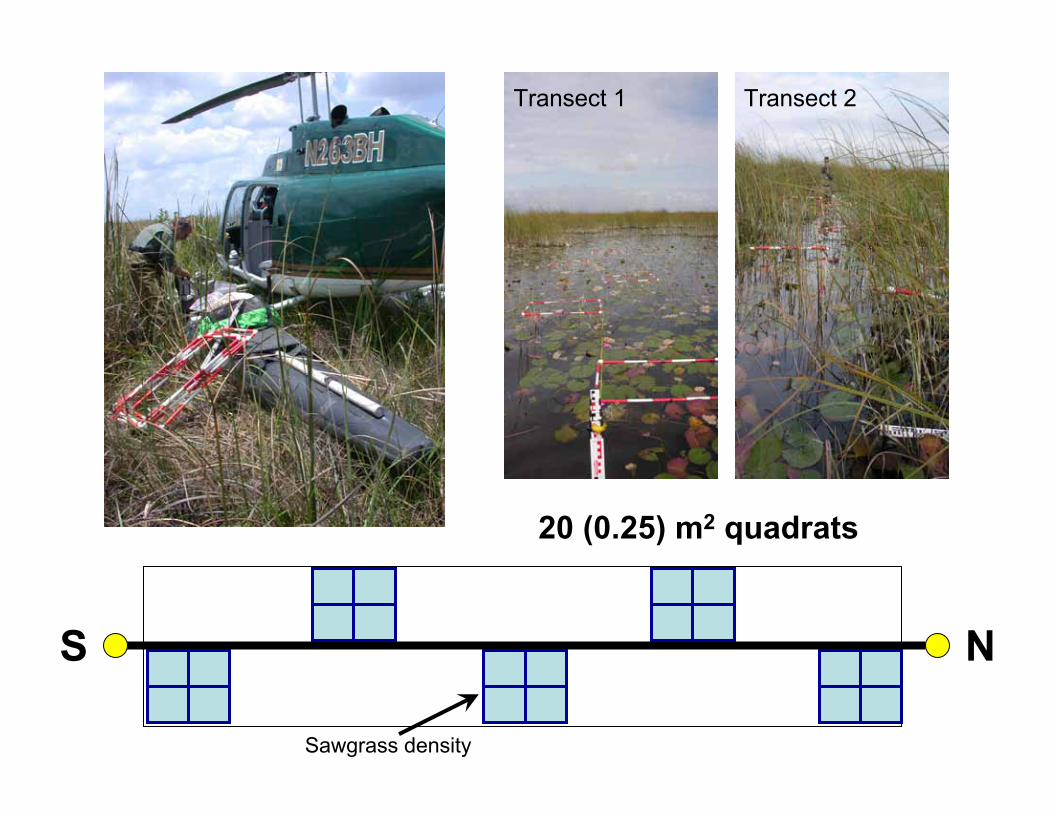
Transect 1 Transect 2
20 (0.25) m2 quadrats
Sawgrass density
S N
• 230 sites visited (111 spring, 119 fall)– 114 sites had transect 2
• 187 species encountered (including 4 unknowns)– 173 on transect 1– 106 on transect 2– 14 species present on transect 2 but not on
transect 1
Plant Community Analysis
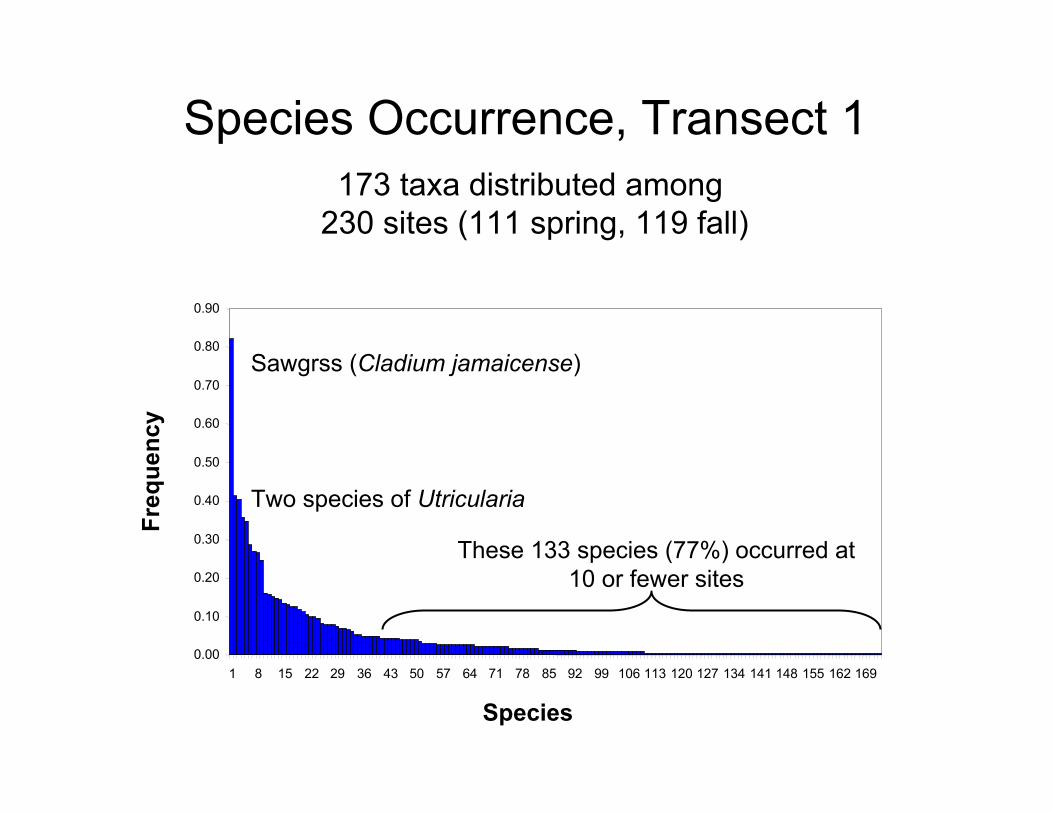
Species Occurrence, Transect 1
0.00
0.10
0.20
0.30
0.40
0.50
0.60
0.70
0.80
0.90
1 8 15 22 29 36 43 50 57 64 71 78 85 92 99 106 113 120 127 134 141 148 155 162 169
Species
Freq
uenc
y
These 133 species (77%) occurred at10 or fewer sites
Sawgrss (Cladium jamaicense)
Two species of Utricularia
173 taxa distributed among 230 sites (111 spring, 119 fall)
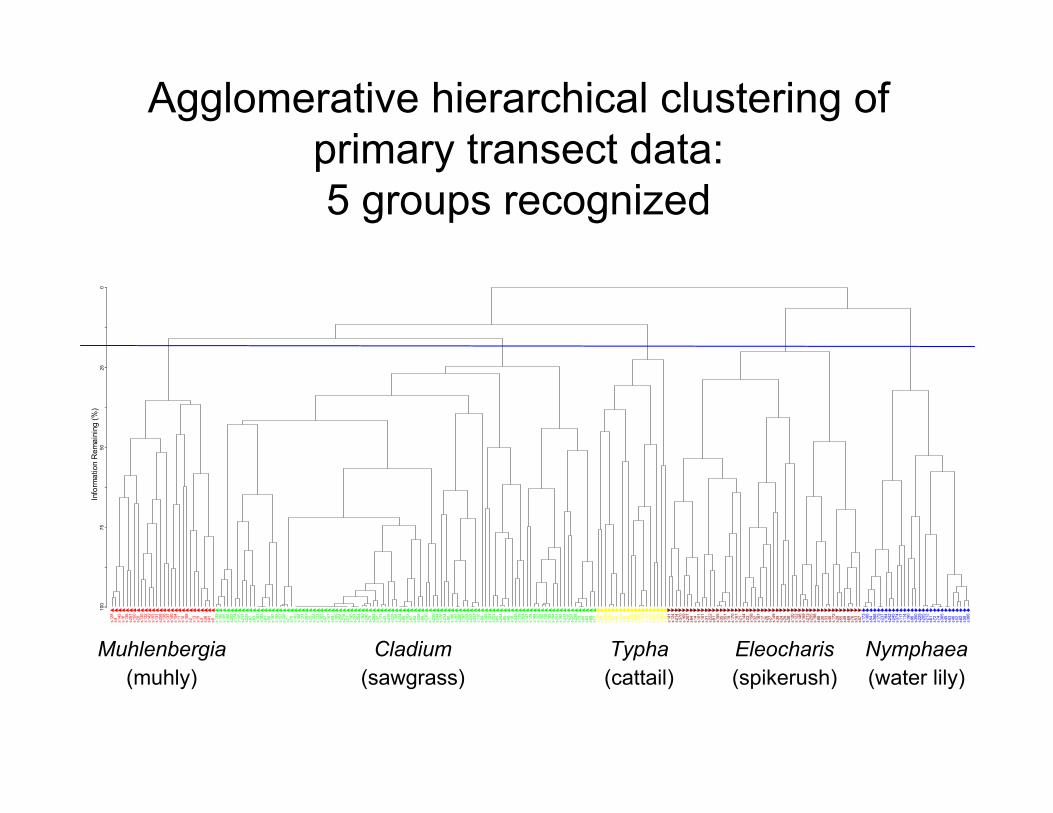
Agglomerative hierarchical clustering of primary transect data:5 groups recognized
Info
rmat
ion
Rem
aini
ng (%
)10
075
5025
0
s128
s4 s143
s16
s138
s257
s150
s20
s130
s132
s142
s153
s131
s258
s136
s137
s140
s154
s11
s10
s108
s2 s13
s15
s3 s36
s41
s5 s135
s180
s165
s160
s253
s174
s105
s217
s229
s87
s93
s181
s182
s81
s56
s187
s185
s157
s100
s7 s70
s162
s166
s171
s367
s25
s104
s112
s163
s47
s107
s59
s189
s206
s216
s51
s195
s227
s254
s183
s240
s75
s252
s37
s177
s43
s219
s228
s106
s224
s95
s102
s67
s94
s226
s66
s230
s1 s239
s244
s176
s234
s90
s186
s191
s200
s197
s208
s223
s233
s110
s89
s145
s123
s202
s65
s204
s85
s48
s18
s249
s119
s364
s147
s178
s148
s152
s192
s118
s199
s194
s251
s193
s211
s215
s221
s238
s73
s80
s83
s68
s77
s156
s97
s218
s231
s82
s99
s179
s86
s84
s210
s220
s235
s109
s121
s236
s488
s115
s203
s12
s141
s124
s214
s370
s169
s207
s64
s14
s101
s151
s31
s222
s91
s155
s35
s351
s19
s170
s161
s21
s144
s23
s158
s32
s167
s17
s26
s27
s149
s39
s24
s29
s38
s120
s122
s146
s159
s213
s255
s198
s88
s30
s33
s40
s172
s28
s55
s49
s69
s76
s53
s57
s173
s188
s54
s368
s175
s237
s184
s242
s245
s374
s117
s114
s190
s96
s350
s225
s205
s212
s61
s72
s74
s365
s45
s63
s46
s52
s62
s58
s366
Muhlenbergia Cladium Typha Eleocharis Nymphaea(muhly) (sawgrass) (cattail) (spikerush) (water lily)
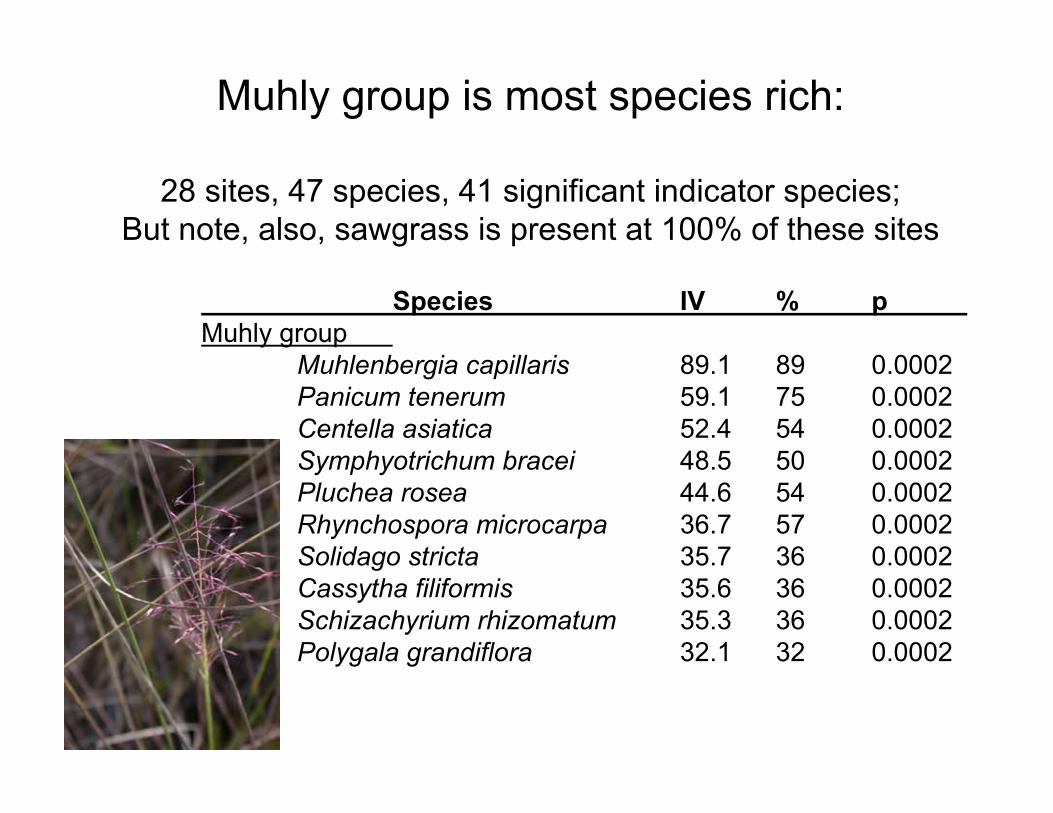
Species IV % pMuhly group
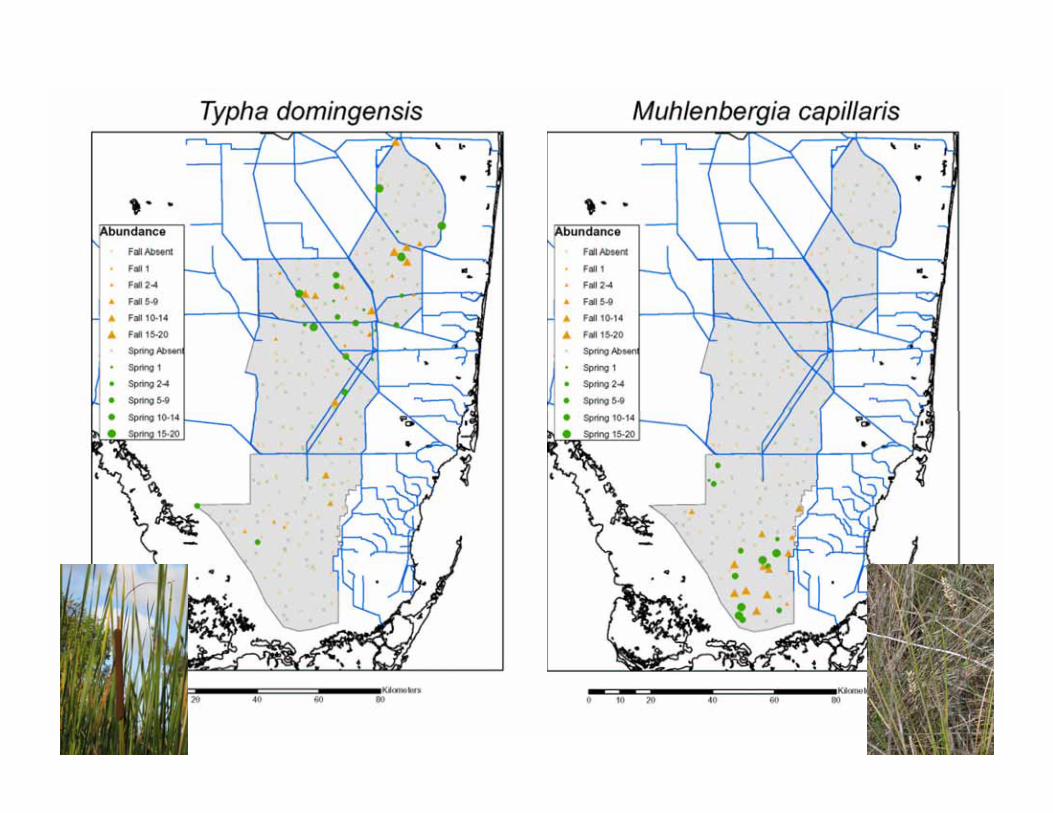
Muhlenbergia capillaris 89.1 89 0.0002Panicum tenerum 59.1 75 0.0002Centella asiatica 52.4 54 0.0002Symphyotrichum bracei 48.5 50 0.0002Pluchea rosea 44.6 54 0.0002Rhynchospora microcarpa 36.7 57 0.0002Solidago stricta 35.7 36 0.0002Cassytha filiformis 35.6 36 0.0002Schizachyrium rhizomatum 35.3 36 0.0002Polygala grandiflora 32.1 32 0.0002
Muhly group is most species rich:
28 sites, 47 species, 41 significant indicator species;But note, also, sawgrass is present at 100% of these sites
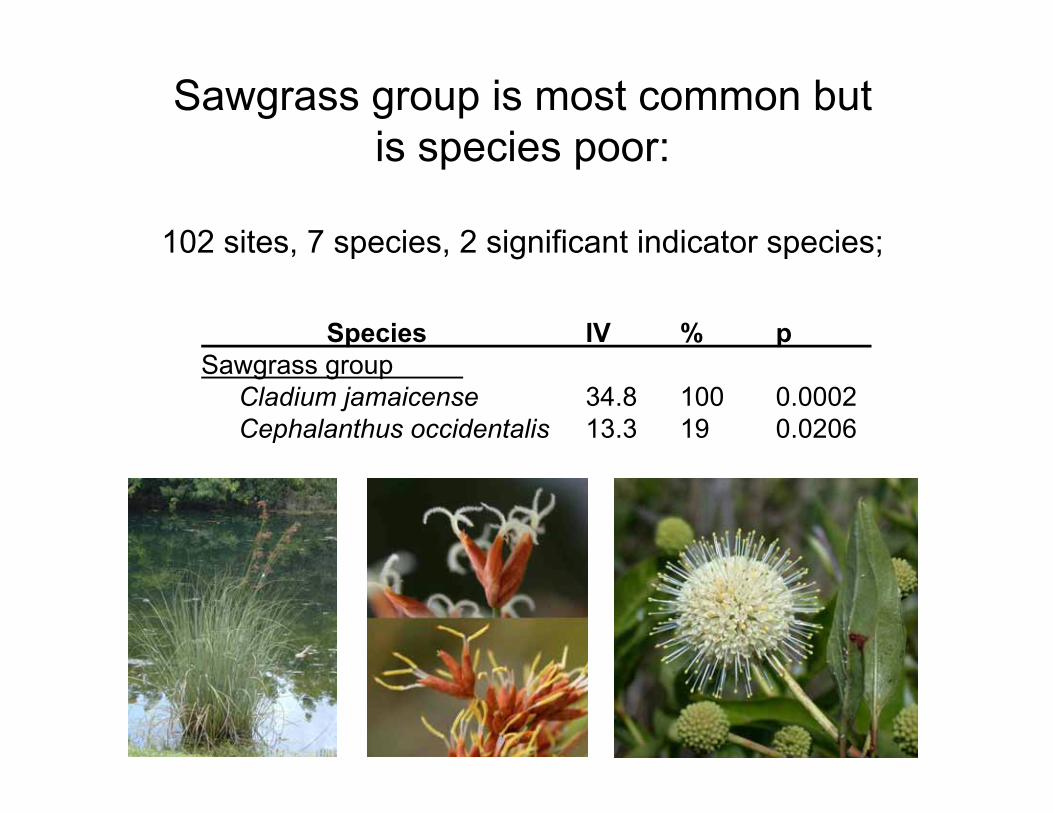
Sawgrass group is most common but is species poor:
102 sites, 7 species, 2 significant indicator species;
Species IV % pSawgrass group
Cladium jamaicense 34.8 100 0.0002Cephalanthus occidentalis 13.3 19 0.0206
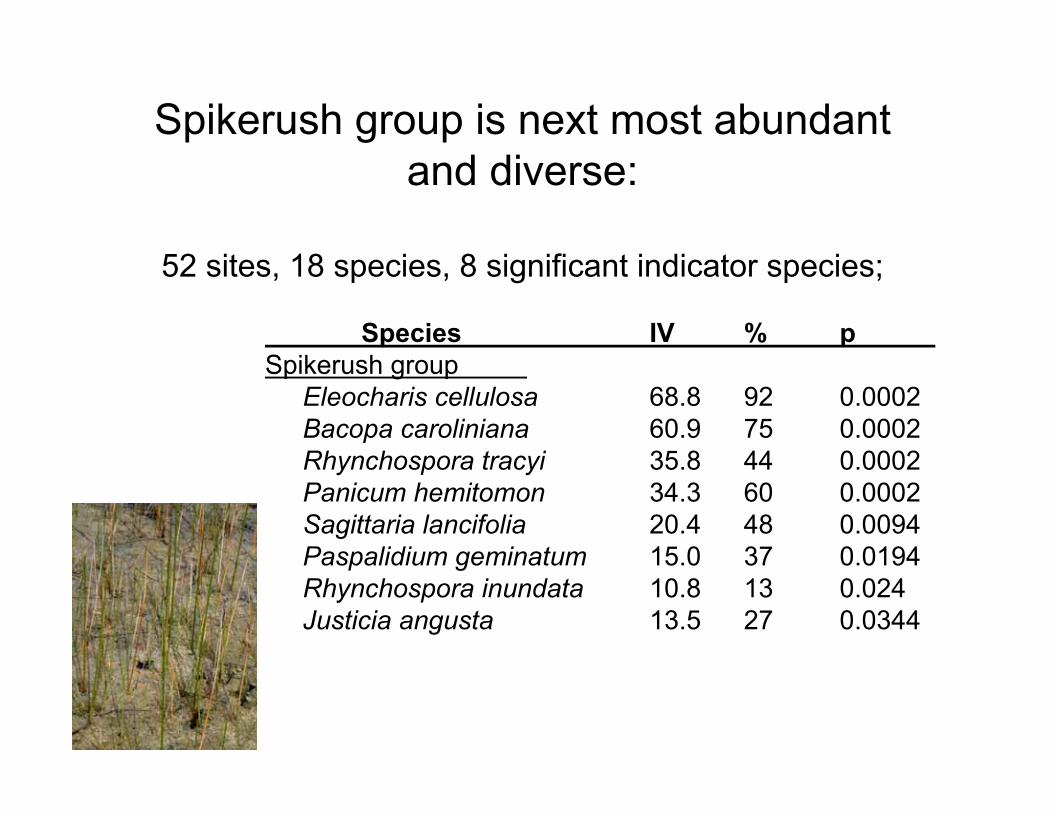
Species IV % pSpikerush group
Eleocharis cellulosa 68.8 92 0.0002Bacopa caroliniana 60.9 75 0.0002Rhynchospora tracyi 35.8 44 0.0002Panicum hemitomon 34.3 60 0.0002Sagittaria lancifolia 20.4 48 0.0094Paspalidium geminatum 15.0 37 0.0194Rhynchospora inundata 10.8 13 0.024Justicia angusta 13.5 27 0.0344
Spikerush group is next most abundant and diverse:
52 sites, 18 species, 8 significant indicator species;
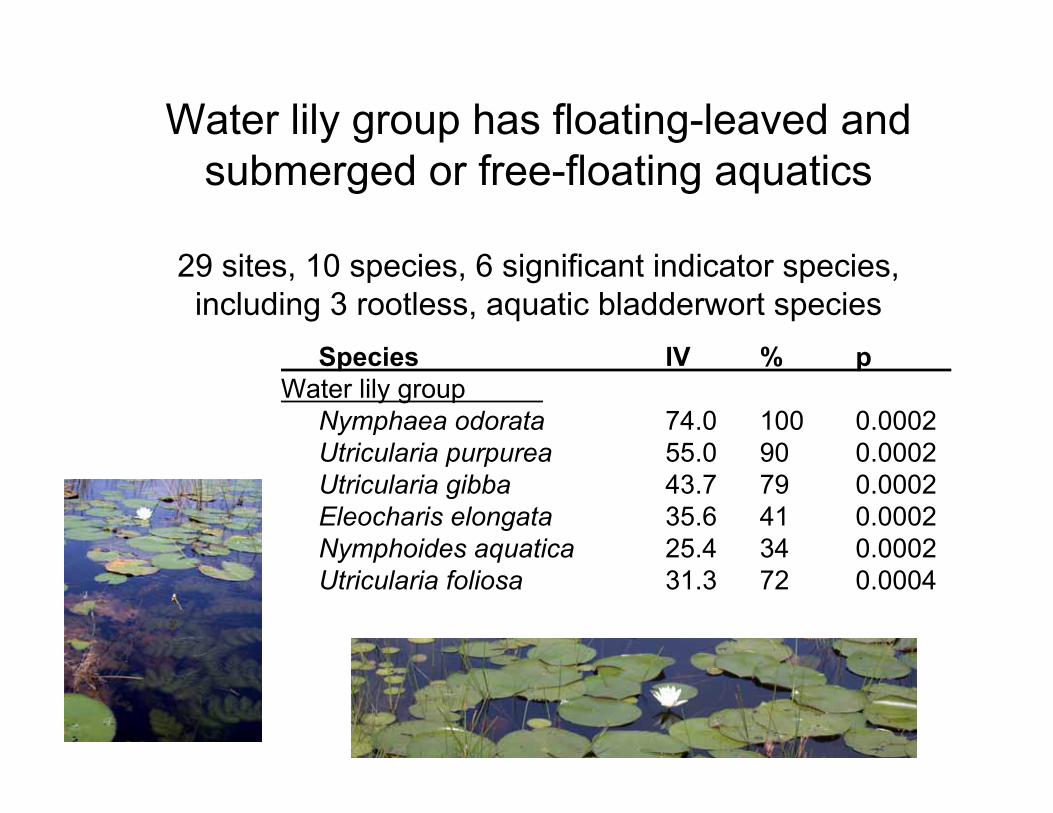
Species IV % pWater lily group
Nymphaea odorata 74.0 100 0.0002Utricularia purpurea 55.0 90 0.0002Utricularia gibba 43.7 79 0.0002Eleocharis elongata 35.6 41 0.0002Nymphoides aquatica 25.4 34 0.0002Utricularia foliosa 31.3 72 0.0004
Water lily group has floating-leaved and submerged or free-floating aquatics
29 sites, 10 species, 6 significant indicator species, including 3 rootless, aquatic bladderwort species
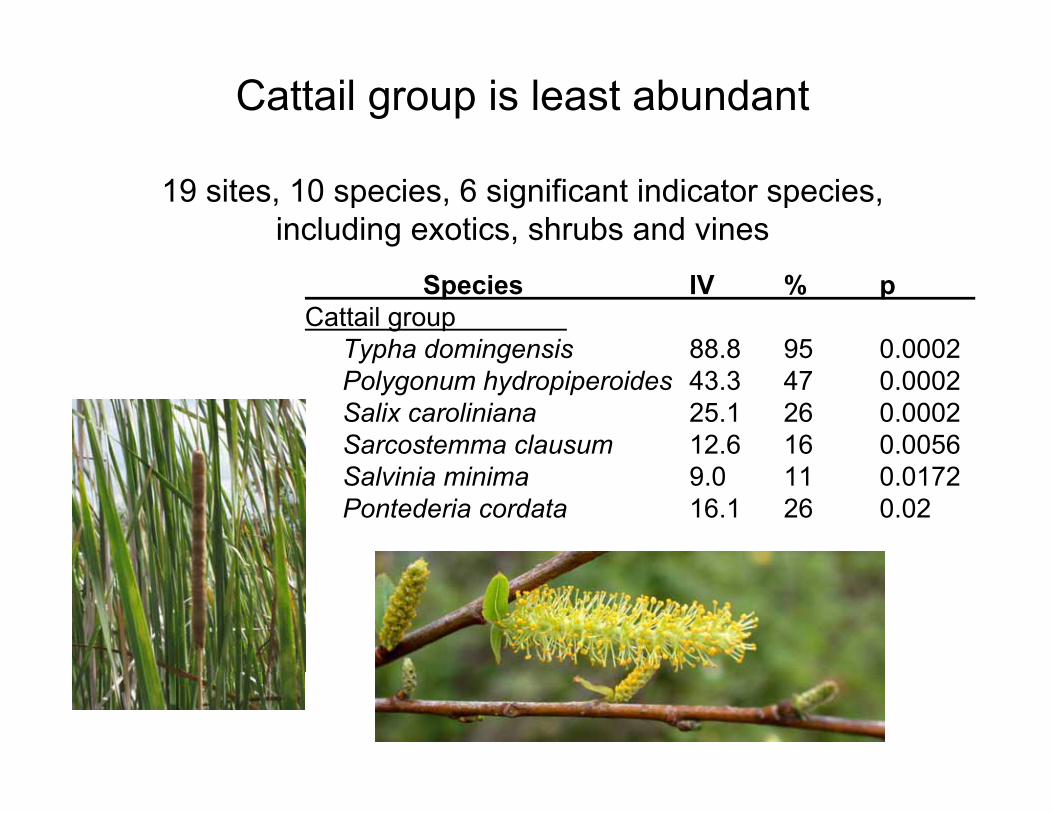
Species IV % pCattail group
Typha domingensis 88.8 95 0.0002Polygonum hydropiperoides 43.3 47 0.0002Salix caroliniana 25.1 26 0.0002Sarcostemma clausum 12.6 16 0.0056Salvinia minima 9.0 11 0.0172Pontederia cordata 16.1 26 0.02
Cattail group is least abundant
19 sites, 10 species, 6 significant indicator species, including exotics, shrubs and vines
Muhly groupSawgrass groupCattail groupSpikerush groupWater Lily group
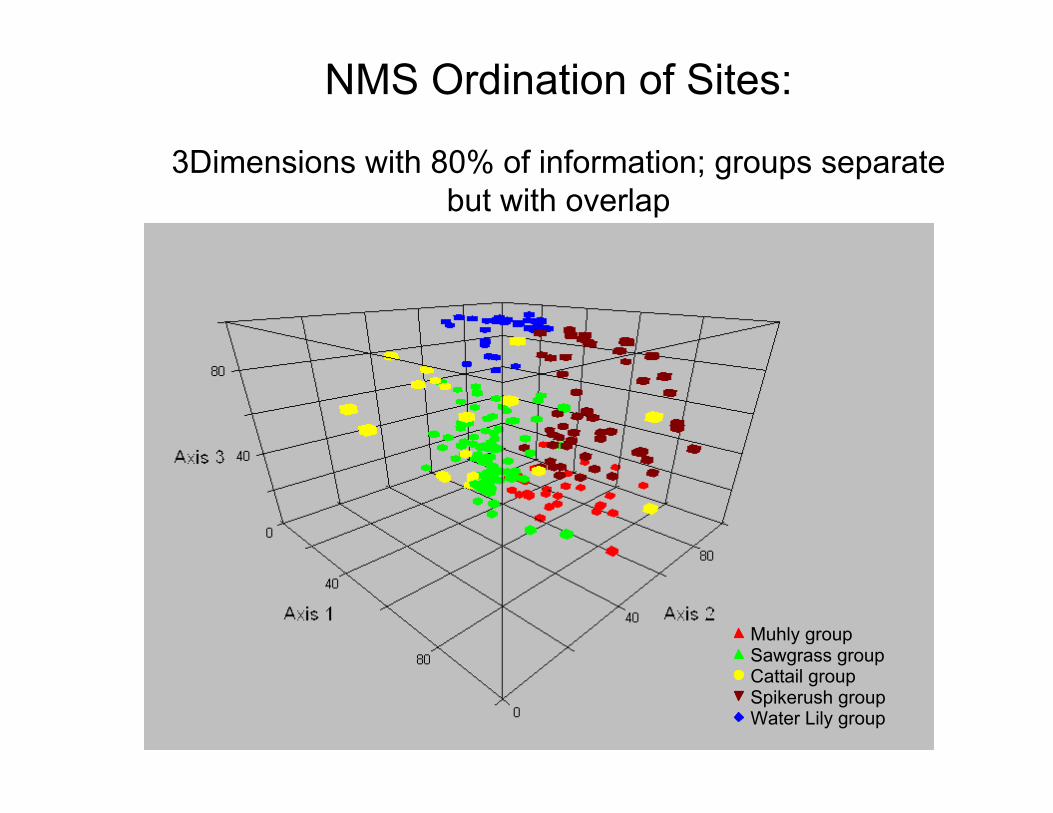
NMS Ordination of Sites:
3Dimensions with 80% of information; groups separate but with overlap
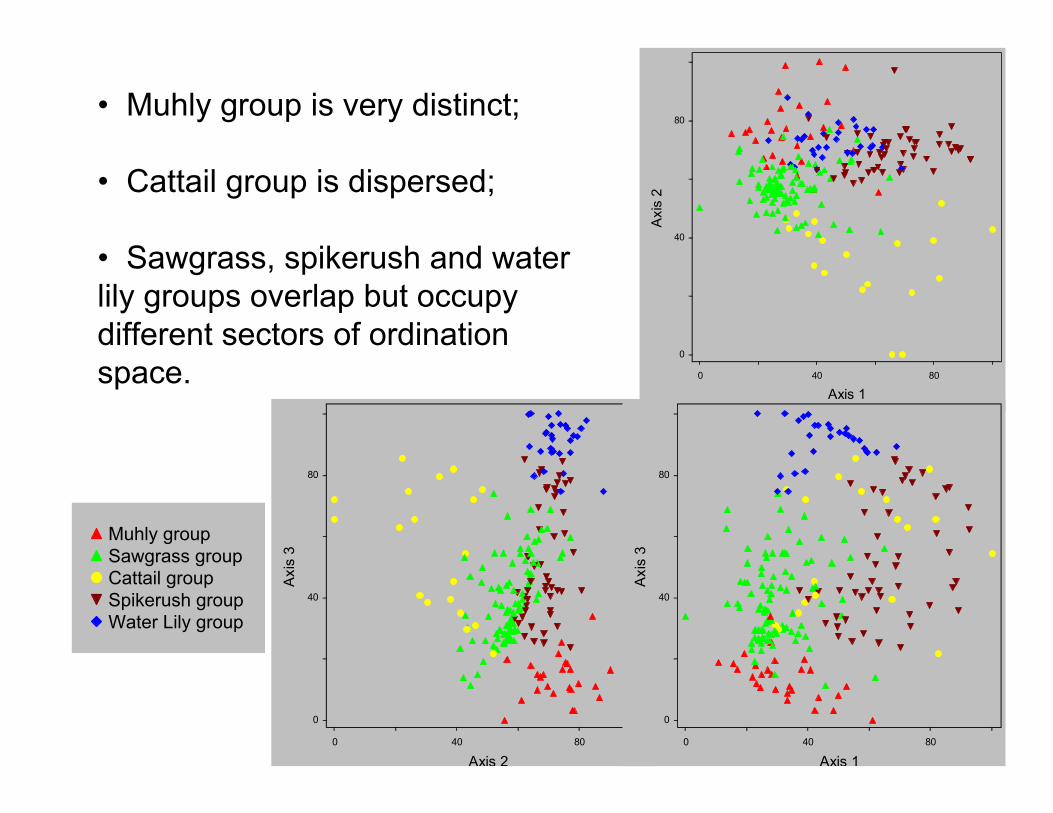
• Muhly group is very distinct;
• Cattail group is dispersed;
• Sawgrass, spikerush and water lily groups overlap but occupy different sectors of ordination space.
Muhly groupSawgrass groupCattail groupSpikerush groupWater Lily group
0
0
40 80
40
80
Axis 2
Axi
s 3
0
0
40 80
40
80
Axis 1
Axi
s 2
0
0
40 80
40
80
Axis 1
Axi
s 3
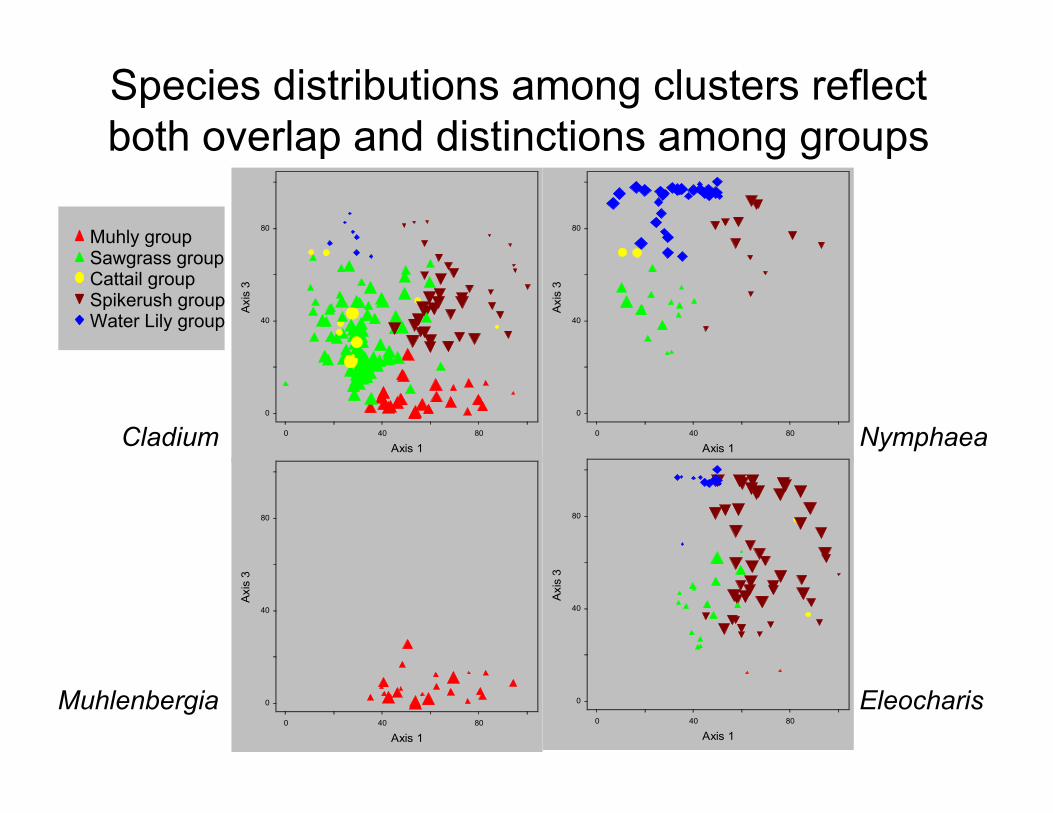
Species distributions among clusters reflectboth overlap and distinctions among groups
Cladium
Muhlenbergia
Nymphaea
Eleocharis
Muhly groupSawgrass groupCattail groupSpikerush groupWater Lily group
0
0
40 80
40
80
Axis 1
Axi
s 3
0
0
40 80
40
80
Axis 1
Axi
s 3
0
0
40 80
40
80
Axis 1
Axi
s 3
0
0
40 80
40
80
Axis 1
Axi
s 3
Muhly groupSawgrass groupCattail groupSpikerush groupWater Lily group
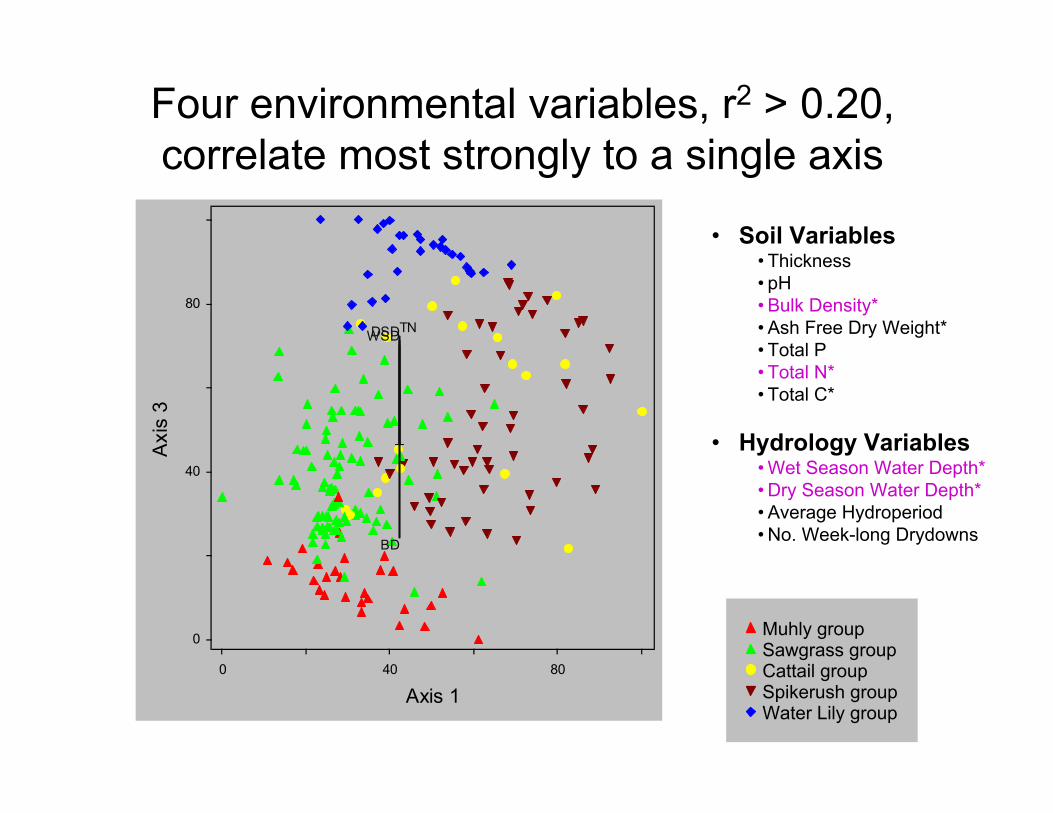
• Soil Variables• Thickness• pH• Bulk Density*• Ash Free Dry Weight*• Total P• Total N*• Total C*
• Hydrology Variables• Wet Season Water Depth*• Dry Season Water Depth*• Average Hydroperiod• No. Week-long Drydowns
Four environmental variables, r2 > 0.20, correlate most strongly to a single axis
TN
BD
DSDWSD
0
0
40 80
40
80
Axis 1
Axi
s 3
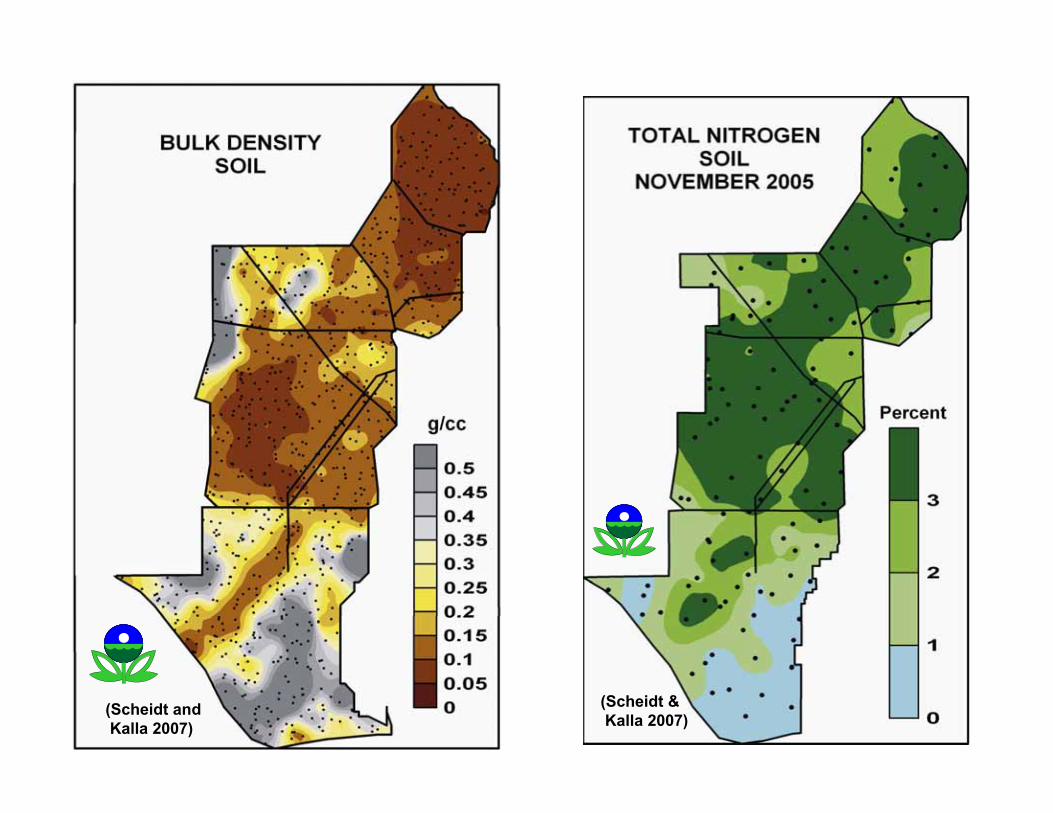
(Scheidt andKalla 2007)
(Scheidt &Kalla 2007)
Muhly groupSawgrass groupCattail groupSpikerush groupWater Lily group
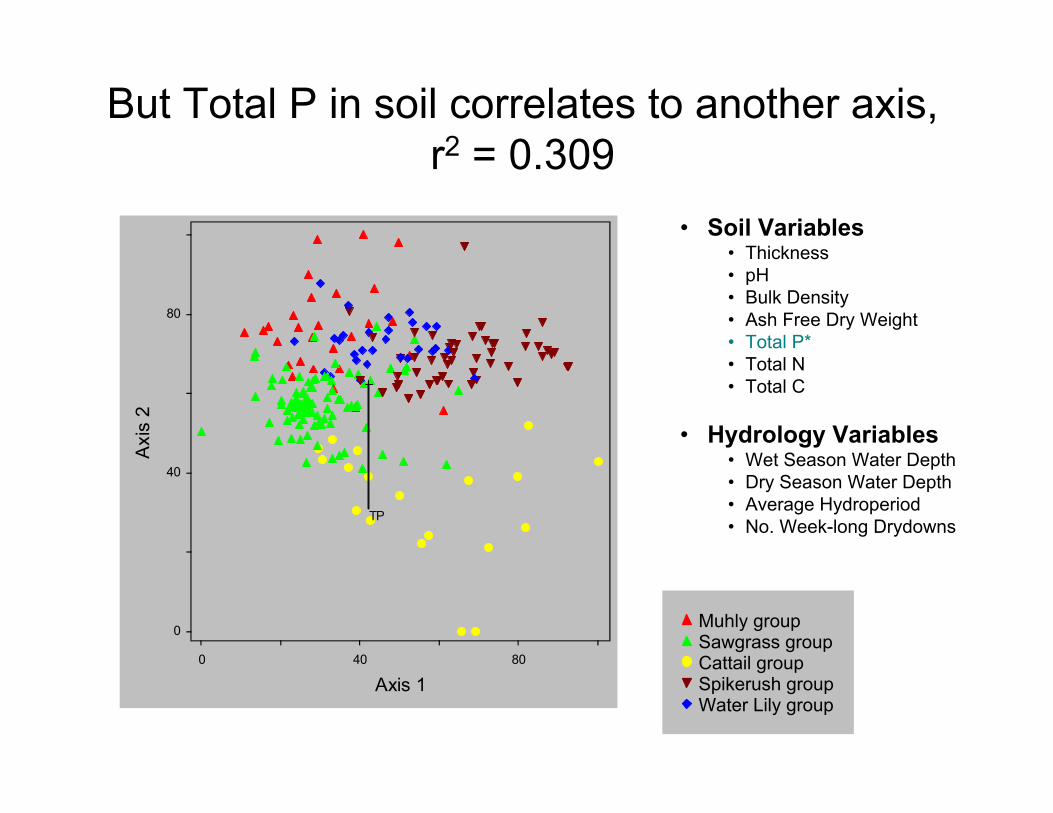
• Soil Variables• Thickness• pH• Bulk Density• Ash Free Dry Weight• Total P*• Total N• Total C
• Hydrology Variables• Wet Season Water Depth• Dry Season Water Depth• Average Hydroperiod• No. Week-long Drydowns
But Total P in soil correlates to another axis, r2 = 0.309
TP
0
0
40 80
40
80
Axis 1
Axi
s 2
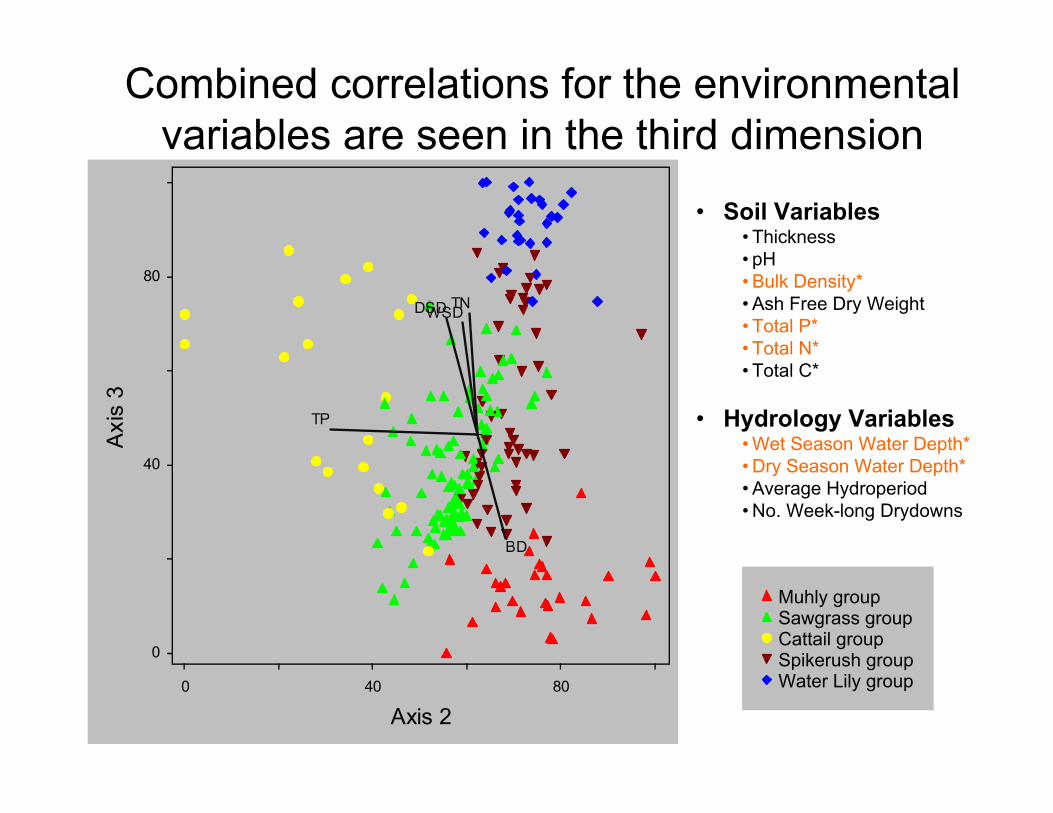
Combined correlations for the environmental variables are seen in the third dimension
TP
TN
BD
DSDWSD
0
0
40 80
40
80
Axis 2
Axi
s 3
Muhly groupSawgrass groupCattail groupSpikerush groupWater Lily group
• Soil Variables• Thickness• pH• Bulk Density*• Ash Free Dry Weight• Total P*• Total N*• Total C*
• Hydrology Variables• Wet Season Water Depth*• Dry Season Water Depth*• Average Hydroperiod• No. Week-long Drydowns
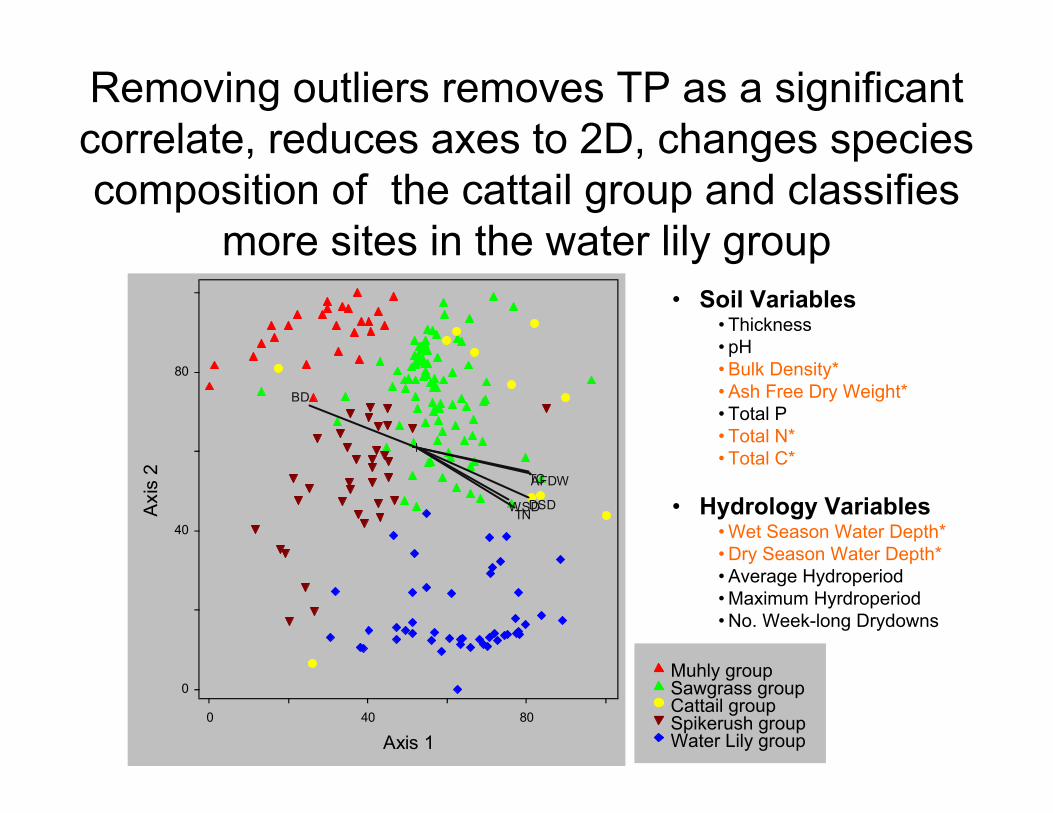
Removing outliers removes TP as a significant correlate, reduces axes to 2D, changes species composition of the cattail group and classifies
more sites in the water lily group
TC
TN
BD
AFDW
DSDWSD
0
0
40 80
40
80
Axis 1
Axi
s 2
Muhly groupSawgrass groupCattail groupSpikerush groupWater Lily group
• Soil Variables• Thickness• pH• Bulk Density*• Ash Free Dry Weight*• Total P• Total N*• Total C*
• Hydrology Variables• Wet Season Water Depth*• Dry Season Water Depth*• Average Hydroperiod• Maximum Hyrdroperiod• No. Week-long Drydowns
Species Distributions Across the Landscape
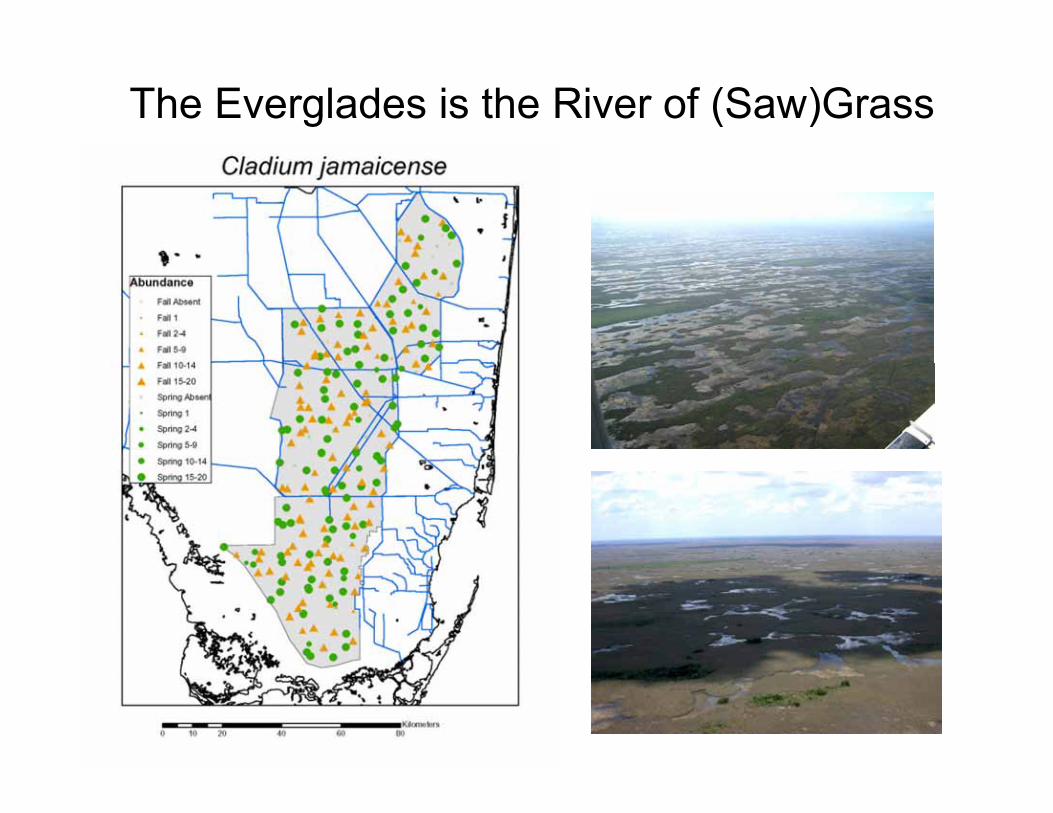
The Everglades is the River of (Saw)Grass
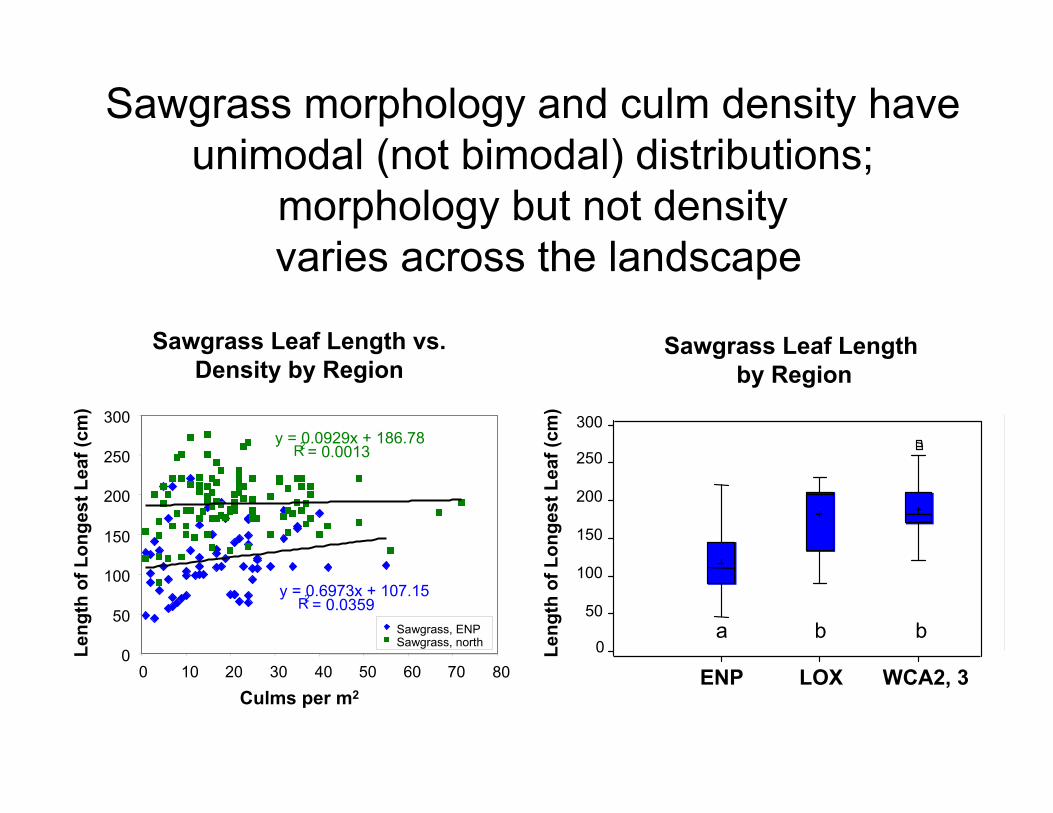
Sawgrass Leaf Length vs. Density by Region
Culms per m2
Leng
th o
f Lon
gest
Lea
f (cm
)
R2y = 0.6973x + 107.15= 0.0359
R2y = 0.0929x + 186.78= 0.0013
0
50
100
150
200
250
300
0 10 20 30 40 50 60 70 80
Sawgrass, ENPSawgrass, north
Sawgrass morphology and culm density have unimodal (not bimodal) distributions;
morphology but not density varies across the landscape
Sawgrass Leaf Length by Region
Leng
th o
f Lon
gest
Lea
f (cm
)
300
250
200
150
100
50
0
ENP WCA2, 3LOX
a bb
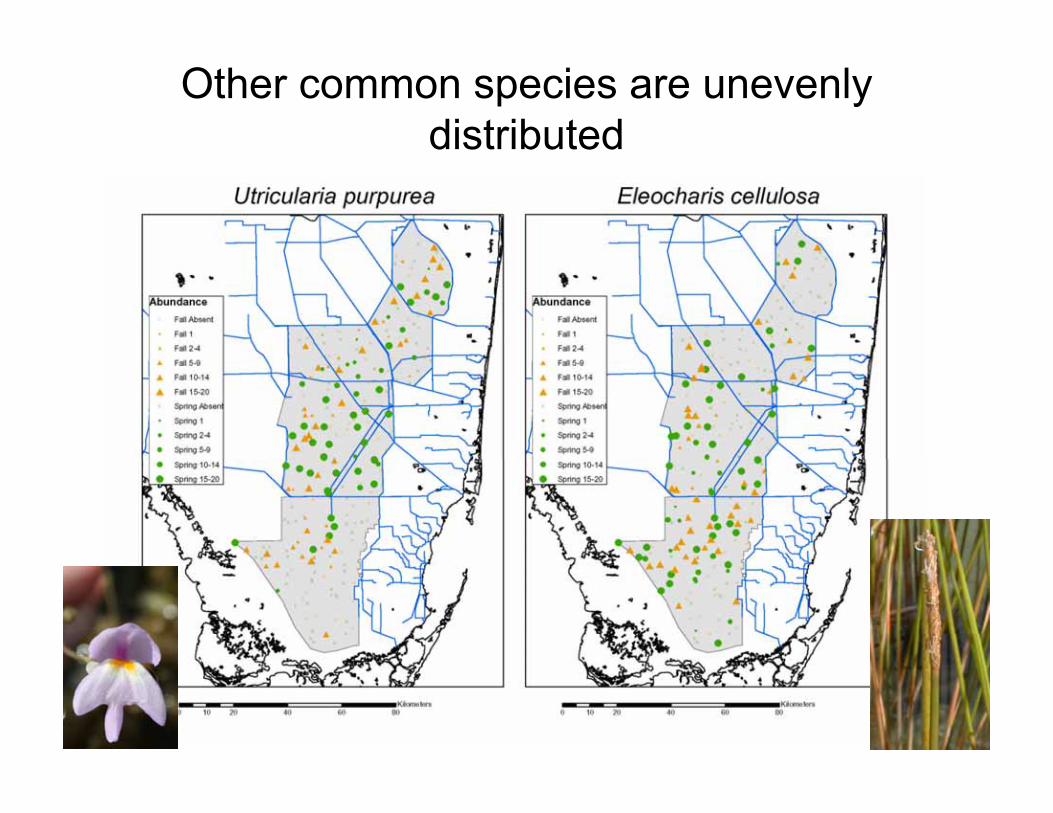
Other common species are unevenly distributed
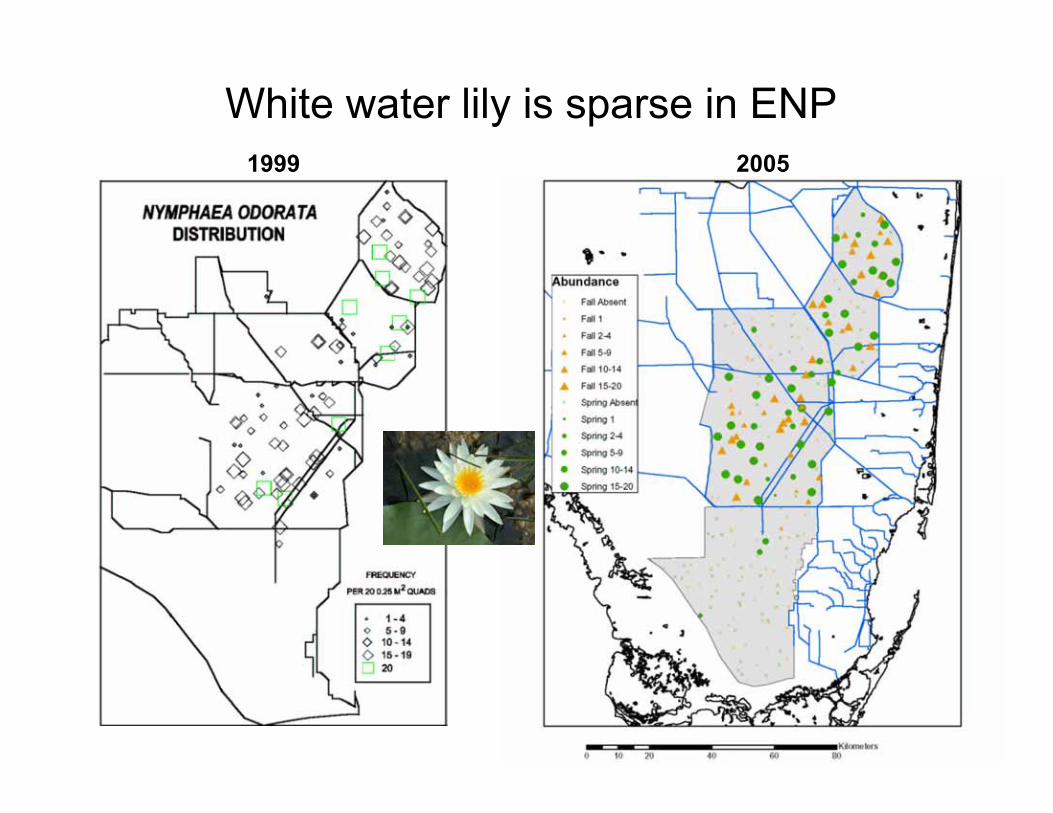
White water lily is sparse in ENP1999 2005
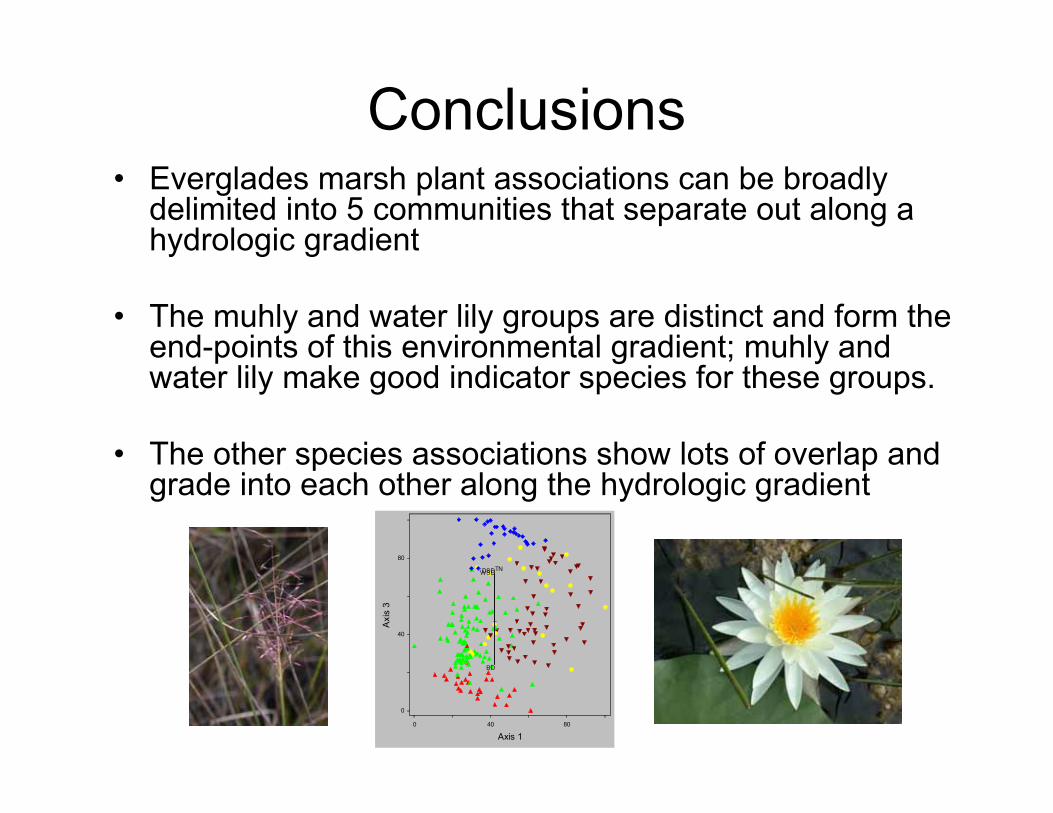
Conclusions• Everglades marsh plant associations can be broadly
delimited into 5 communities that separate out along a hydrologic gradient
• The muhly and water lily groups are distinct and form the end-points of this environmental gradient; muhly and water lily make good indicator species for these groups.
• The other species associations show lots of overlap and grade into each other along the hydrologic gradient
TN
BD
DSDWSD
0
0
40 80
40
80
Axis 1
Axi
s 3
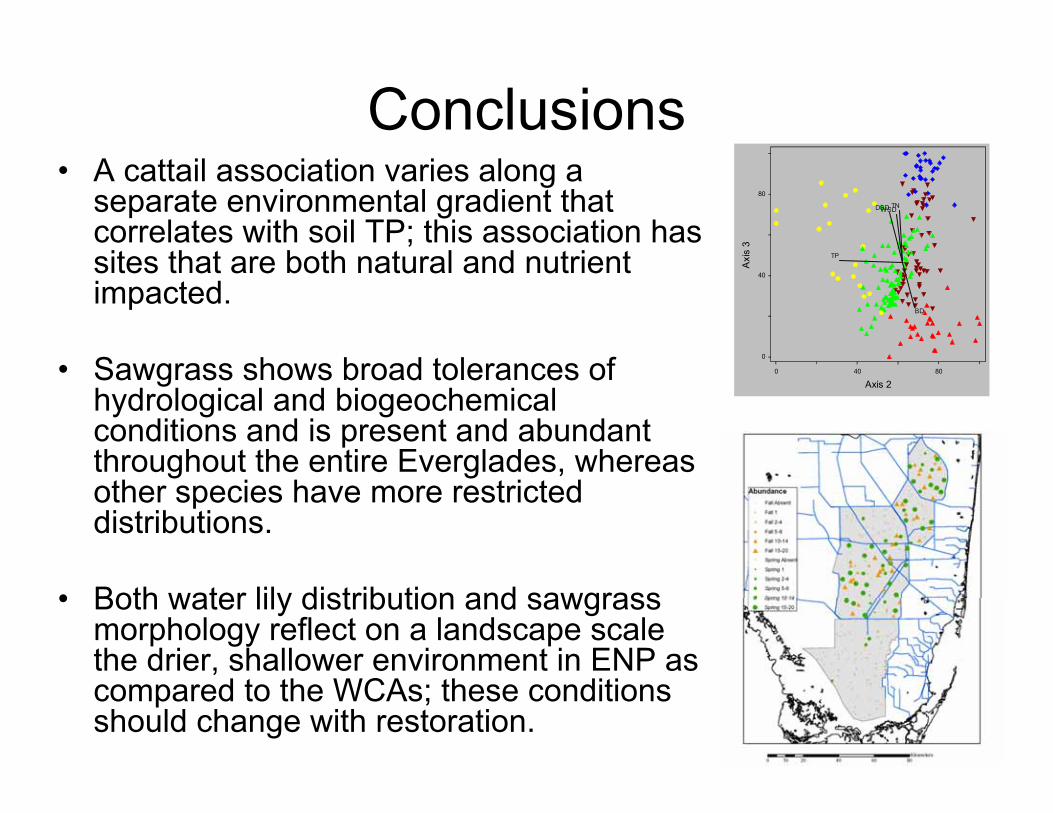
Conclusions• A cattail association varies along a
separate environmental gradient that correlates with soil TP; this association has sites that are both natural and nutrient impacted.
• Sawgrass shows broad tolerances of hydrological and biogeochemical conditions and is present and abundant throughout the entire Everglades, whereas other species have more restricted distributions.
• Both water lily distribution and sawgrass morphology reflect on a landscape scale the drier, shallower environment in ENP as compared to the WCAs; these conditions should change with restoration.
TP
TN
BD
DSDWSD
0
0
40 80
40
80
Axis 2
Axi
s 3
Acknowledgements• Paul Groff, Diana Van Dillewijn, Ana
Castellanos, Walter Zagarra, Marlene Dow• Morris Flexner, Chris Decker, and the rest
of the EPA plant sampling team• The Institute for Regional Conservation