Embed Size (px)
Citation preview

UNITED STATES EPARTMENT OF THE INTERIOR- ., / GEOLOGICAL SURVEY
FLOODS IN FLORIDA
MAGNITUDE AND FREQUENCY
By R.W. Pride
Prepared in cooperation with Florida State Road Department
Open-file report
1958
MAR 2

CONTENTS
PageIntroduction. ........................................... 1
Acknowledgements ....................................... 1Description of the area ..................................... 1
Topography ......................................... 2Coastal Lowlands ..................................... 2Central Highlands ..................................... 2Tallahassee Hills ..................................... 2Marianna Lowlands .................................... 2Western Highlands. .................................... 3
Drainage basins ....................................... 3St. Marys River. ......_.............................. 3St. Johns River ...................................... 3Lake Okeechobee and the everglades. ............................ 3Peace River ....................................... 3Withlacoochee River. ................................... 3Suwannee River ...................................... 3Ochlockonee River. .................................... 5Apalachicola River .................................... 5Choctawhatchee, Yellow, Blackwater, Escambia, and Perdido Rivers. ............. 5
Climate. .......................................... 5Flood records ......................................... 6
Method of flood-frequency analysis ................................. 9Flood frequency at a gaging station ................................ 9
The flood-frequency graph .................................. 10Limitations of flood-frequency graphs ............................. 10
Flood frequency by combining records .............................. 11Combining records by geometric similarity, of frequency graphs. ................. 11Computation of mean annual floods ................................ 12Test for geometric similarity .... ............................. 12Regional frequency graph ................................... 12
Combining records by similarity of mean annual floods ....................... 12Factors influencing the mean annual flood. ........................... 13Hydrologic areas. ...................................... 13
Flood frequency in Florida ..................................... 13Flood regions of Florida. .................................... 13
Delineation of flood regions .................................. 14Region A ......................................... 14Region B ......................................... 14Southern Florida ..................................... 16
Hydrologic areas of Florida ......................... .......... 16Delineation of hydrologic areas ................................ 18
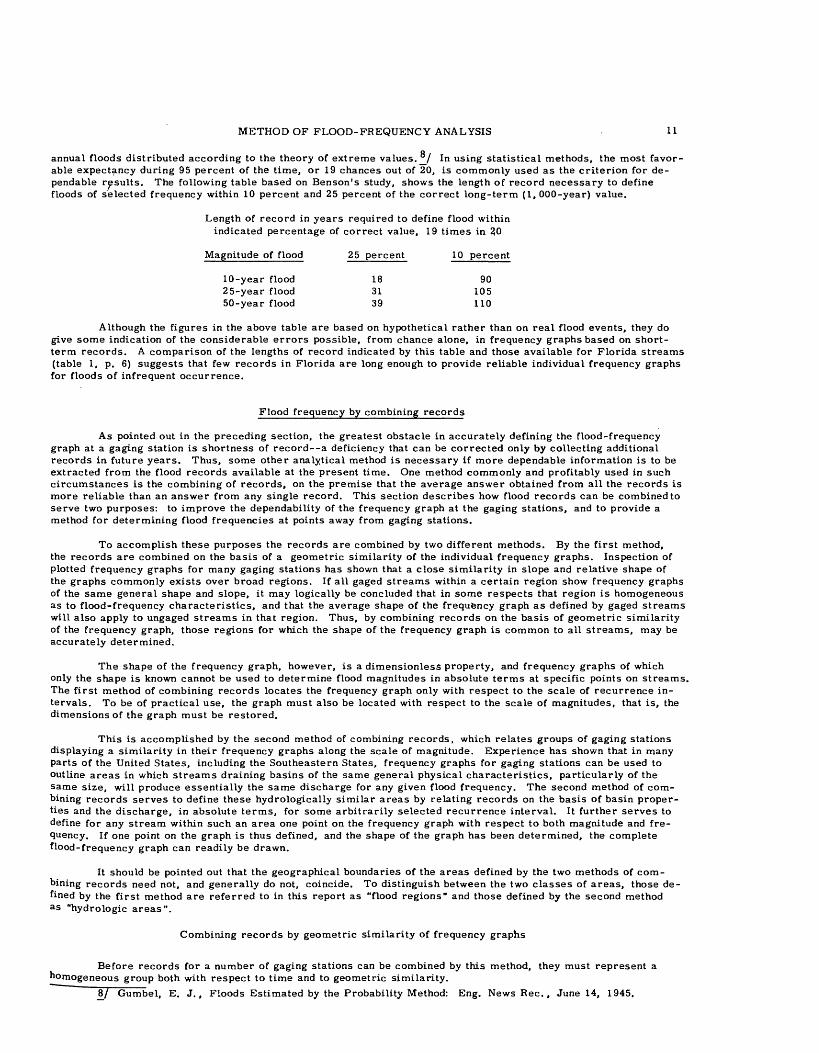
Area 1 .......................................... 18Areas 2A and 2B ..................................... 18Area 3 .......................................... 18Area 4 .......................................... 19Area 5 .......................................... 20Area 6 .......................................... 21Area 7 . ........................................... 21
Frequency of annual flood stages ................................. 21St. Johns River ....................................... 22Kissimmee River ...................................... 22
Summary of flood-frequency relationships ............................. 23Maximum floods known. ........... ^ .......................... 25Gaging station records ....................................... 37
Satilla River basin ....................................... 38Satilla River near Waycross, Ga. ............................... 38Satilla River at Atkinson, Ga. ................................. 38
St. Marys River basin. ... .................................. 39North Prong St. Marys River at Moniac, Ga. .......................... 39St. Marys River near Macclenny, Fla ............................. 40
St. Johns River basin ...................................... 40St. Johns River headwaters near Vero Beach. Fla. ....................... 40St. Johns River headwaters near Kenansville, Fla ........................ 41St. Johns River near Melbourne, Fla. ............................. 41Lake Washington near Eau Gallic, Fla ............................. 42Lake Poinsett near Cocoa, Fla. ................................ 42St. Johns River near Christmas, Fla . ............................ 43Econlockhatchee River near Chuluota, Fla ........................... 44St. Johns River above Lake Harney, near Geneva, Fla. ..................... 44St. Johns River at Osceola, Fla ................................ 45JessupT.ake Outlet near Sanford. Fla ............................. 46St. Johns River above Lake Monroe, near Sanford, Fla ..................... 46St. Johns River near Sanford, Fla ............................... 47
III

IV CONTENTS
Page Gaging station records Continued
St. Johns River basin ContinuedWekiva River near Sanford. Fla. ................................ 48St. Johns River near De Land, Fla ............................... 49Lake Apopka at Winter Garden, Fla ............................... 50Apopka-Beauclair Canal near Astatula. Fla. ........................... 50Lake Dora at Mount Dora, Fla ................................. 51Dead River near Tavares, Fla . '. ............................... 52Lake Minnehaha at Clermont, Fla. ............................... 52Palatlakaha Creek near Mascotte, Fla. ............................. 53Haines Creek at Lisbon, Fla .................................. 53Lake Weir at Oklawaha, Fla .................................. 54Oklawaha River at Moss Bluff, Fla ............................... 54Oklawaha River near Ocala, Fla. ................................ 55Silver Springs near Ocala, Fla ................................. 56Oklawaha River near Conner, Fla. ............................... 57Oklawaha River at Eureka, Fla ................................. 57Newnans Lake near Gainesville, Fla. ........................ 58Orange Lake near Boardman, Fla. ............................... 59Orange Lake Outlet near Citra, Fla ............................... 59Lochloosa Lake at Lochloosa, Fla. ............................... 60Lochloosa Lake Outlet near Lochloosa, Fla ........................... 61Orange Creek at Orange Springs, Fla .............................. 61Oklawaha River near Orange Springs, Fla ............................ 62Oklawaha River at Riverside Landing near Orange Springs. Fla .................. 63South Fork Black Creek near Penny Farms, Fla ......................... 63North Fork Black Creek near Middleburg, Fla .......................... 64
Moultrie Creek basin. ....... ............................... 64Moultrie Creek near St. Augustine, Fla ............................. 64
Lake Okeechobee and the Everglades. ............................... 65Lake Okeechobee, Fla ..................................... 65Fisheating Creek at Palmdale. Fla ............................... 66Indian Prairie Canal near Okeechobee, Fla. ........................... 66Alligator Lake near Ashton, Fla . ............................... 67Hart Lake near Narcoossee, Fla . ............................... 68East Tohopekaliga Lake at St. Cloud, Fla ............................ 68Lake Tohopekaliga at Kissimmee, Fla .............................. 69Cypress Lake near St. Cloud, Fla. ............................... 69Lake Butler at Windermere, Fla ................................ 70Cypress Creek at Vineland, Fla. ................................ 70Reedy Creek near Loughman, Fla. ............................... 71Lake Hatchineha near Haines City, Fla .............................. 72Catfish Creek near Lake Wales, Fla. .............................. 72Lake Kissimmee near Lake Wales, Fla ............................. 73Weohyakapka-Rosalie Canal nr. Lake Wales, Fla.................... i .... 73Kissimmee River below Lake Kissimmee, Fla .......................... 74Kissimmee River at Fort Kissimmee, Fla ............................ 74Reedy Lake Outlet near Frostproof, Fla . ............................ 75Lake Arbuckle near Avon Park, Fla. .............................. 76Arbuckle Creek near De Soto City, Fla ............................. 76Josephine Creek near De Soto City, Fla ............................. 77Lake Istokpoga near De Soto City, Fla. ............................. 78Istokpoga Canal near Cornwell, Fla. . ............................. 78Kissimmee River near Cornwell, Fla . ............................. 79Kissimmee River near Okeechobee, Fla ............................. 80St. Lucie Canal at Lake Okeechobee, Fla ............................ 81West Palm Beach Canal at Canal Point. Fla ........................... 82West Palm Beach Canal at West Palm Beach, Fla. ........................ 83Hillsboro Canal at Belle Glade, Fla. .............................. 84Hillsboro Canal at Shawano Plantation, Fla ........................... 85Hillsboro Canal near Deerfield Beach, Fla. ........................... 86North New River Canal at South Bay, Fla ............................ 87North New River Canal at 26-mile bend, near Fort Lauderdale, Fla ................ 88North New River Canal near Fort Lauderdale, Fla ........................ 89Miami Canal at Pennsuco, near Miami, Fla ........................... 90Miami Canal at water plant, Hialeah, Fla ............................ 91Tamiami Canal outlets, Miami to Monroe. Fla .......................... 91Lake Trafford near Immokalee, Fla. ... ........................... 92Imperial River near Bonita Springs, Fla. ............................ 93Caloosahatchee Canal at Moore Haven, Fla ........................... 93Orange River near Fort Myers, Fla. ... ........................... 94
Peace River basin ............. ........ ^ .............. . . . 95Drainage Canal west of Dundee, Fla. ... ........................... 95Peace Creek Marsh outlet near Alturas, Fla ........................... 95Lake Howard at Winter Haven, Fla .... *.......................... 96Lulu Lake Outlet at Eloise, Fla. ................................ 96Peace River at Bartow, Fla ....... ........................... 97Peace River at Zolfo Springs, Fla. .... ........................... 97Peace River at Arcadia. Fla ....... ........................... 98

CONTENTS V
Page Gaging station records--Continued
Miakka River basin. ....................................... 99/ Miakka River near Sarasota, Fla ................................ 99
Manatee River basin ....................................... 99Manatee River near Bradenton, Fla ............................ > 99
Little Manatee River basin .................................... 100Little Manatee River near Wimauma, Fla ............................ 100
Alafia River basin ........................................ 101Alafia River at Lithia, Fla ................................... 101
Hillsborough River basin ..................................... 101Hillsborough River near Zephyrhills, Fla ............................ 101Hillsborough River near Tampa, Fla. .............................. 102
Lake Tarpon basin ........................................ 103Brooker Creek near Odessa, Fla ................................ 103
Anclote River basin ....................................... 103Anclote River near Elfers, Fla ................................. 103
Withlacoochee River basin .................................... 104Withlacoochee River at Trilby, Fla ............................... 104Withlacoochee River at Croom, Fla ............................... 104Withlacoochee River near Holder, Fla. ............................. 105
Waccasassa River basin ..................................... 106Waccasassa River near Otter Creek, Fla ............................ 106Otter Creek at Otter Creek, Fla ................................ 106
Suwannee River basin. ...................................... 107Suwannee River at Fargo, Ga . ................................. 107Suwannee River at White Springs, Fla .............................. 107Alapaha River near Alapaha, Ga ................................ 108Alapaha River at Statenville, Ga ................................ 109Little River near Adel, Ga ................................... 109Withlacoochee River near Quitman, Ga ............................. 110Withlacoochee River near Pinetta, Fla. .............................HISuwannee River at Ellaville, Fla ................................HISuwannee River at Luraville, Fla ................................ 112Suwannee River at Branford, Fla ................................ H3Santa Fe River at Worthington, Fla ...............................113Santa Fe River near High Springs, Fla. ............................. 114Santa Fe River near Fort White, Fla ..............................115Suwannee River near Bell, Fla .................................115Suwannee River near Wilcox, Fla ................................. 116
Fenholloway River basin .....................................117Fenholloway River at Foley, Fla ................................ 117
Ochlockonee River basin ..................................... 117Ochlockonee River near Thomasville, Ga ............................117Tired Creek near Cairo, Ga .................................. 118Ochlockonee River near Havana, Fla ............................... 119Ochlockonee River near Bloxham, Fla. ............................. 119
Apalachicola River basin ..................................... 120Spring Creek near Iron City, Ga ................................ 120Apalachicola River at Chattahoochee, Fla ............................ 121Mosquito Creek at Chattahoochee, Fla. ............................. 121Apalachicola River near Blountstown, Fla ............................ 122Chipola River near Altha, Fla. ................................. 123
Bear Creek basin. ........................................ 124Econfina Creek near Bennett, Fla. ............................... 124
Choctawhatchee River basin .................................... 124Choctawhatchee River near Newton, Ala ............................. 124Pea River near Samson, Ala .................................. 125Choctawhatchee River at Caryville, Fla ............................. 126Choctawhatchee River near Bruce, Fla. ............................. 127
Yellow River basin ........................................ 127Lightwood Knot Creek at Babbie, Ala .............................. 127Yellow River at Milligan, Fla. ................................. 128Shoal River near Crestview, Fla ................................ 129Yellow River near Holt, Fla .................................. 129
Blackwater River basin ...................................... 130Coldwater Creek near Milton, Fla. ............................... 130
Escambia River basin. ...................................... 131Conecuh River near Andalusia, Ala ............................... 131Sepulga River near McKenzie, Ala ............................... 132Pigeon Creek near Thad, Ala .................................. 132Conecuh River near Brooklyn, Ala ............................... 133Murder Creek near Evergreen, Ala ............................... 134Escambia Creek at Flomaton, Ala. ...... . ........................ 134Escambia River near Century, Fla ............................... 135
ferdido River basin. ....................................... 136Perdido River at Barrineau Park, Fla. ............................. 136

VI CONTENTS
ILLUSTRATIONS
Page
Plate i. Map showing hydrologic areas and flood regions of Florida. ........... .Inside back coverFigure i. Topographic divisions of Florida ...................... « 2
2. Map of Florida and adjacent area showing location of gaging stations on rivers, lakes,and canals ....................................... 4
3. Average annual rainfall, in inches, in Florida ....................... 54. Maximum 24-hour rainfall, in inches, to be expected once in 50 years ............ 55. Homogeneity test graph .......................... 136. Homogeneous flood regions of Florida ........................... 147. Composite frequency curve for floods in region A...................... 158. Composite frequency curve for floods in region B. ............ i ........ 159. Frequency of annual floods, Apalachicola River at Chattahoochee, Fla ............ 16
10. Relation of lake area above gaging station to reduction of mean annual flood. ....... .. . . 1711. Relation of mean annual flood to drainage area for area 1 .................. 1812. Relations of mean annual flood to drainage area along main stems of large rivers in Florida. . . 1913. Relation of mean annual flood to drainage area for areas 2A, 2B, and 3 ............ 2014. Relation of mean annual flood to drainage area for areas 4 and 5 ............... 2015. Relation of mean annual flood to drainage area for areas 6 and 7 ............... 2116. Variation of the mean annual, 5-, 10-, and 30-year flood stages with channel distance for
main stem of St. Johns River, Florida ......................... 2217. Variation of the mean annual, 5-, 10-, and 30-year flood stages with channel distance for
main stem of Kissimmee River, Florida. ........................ 2318. Summary of relations of mean annual flood to drainage area for Florida. ........... 2419. Relation of maximum to 30-year flood in region A. ..................... 25
20a. Relation of maximum to 50-year flood in Region B (areas 1, 2B and Kissimmee River andSt. Johns River above Lake Harney). .......................... 26
20b. Relation of maximum to 50-year flood in Region B (areas 4, 5 and Withlacoochee Riverand Suwannee River below Ellaville). .......................... 27
20c. Relation of maximum to 50-year flood in Region B (areas 6 and 7) .............. 28
TABLES
Table 1. Gaging station data. ................................... 62. Adjustment of mean annual flood for attenuation by storage in lakes . ............. 173. Maximum known stages and discharges prior to 1956 in Florida ............... 29

FLOODS IN FLORIDA
MAGNITUDE AND FREQUENCY
By R. W. Pride
INTRODUCTION
This report has been prepared to present a comprehensive summary of past floods in Florida and, from the pattern of recurrence of these floods, to develop an effective means of estimating the expectancy of floods in the future. Such information is a basic requirement in the proper design and location of structures placed in, across, or adjacent to flood plains.
When loss of life or extensive property damage would result if the structure is overtopped or destroyed, the design flood should be of such magnitude that it probably never will be exceeded. This report presents information on the maximum-known floods and rainfall in Florida that will be useful criteria for determining this ultimate design flood.
A much broader field of design, and one involving greater overall expenditures, concerns the selection of a design flood where loss of life is not a factor. Economic considerations dictate the basis for design in this field of engineering. Without knowledge of expectancy of floods, a structure may be so underdesigned that it suffers fre quent damage or even destruction, or it may be so overdesigned that it will be damaged only by floods with recur rence intervals far greater than its probable'useful life. With a knowledge of flood expectancy, the design flood may be selected on the sound economic basis of calculated risk.
Ideally, there would be available at the site of each proposed structure a long-term systematic record of flood events. Unfortunately, this ideal situation seldom exists because it is obviously impracticable to maintain stream-gaging stations at all points where flood data might be desired. Even when the importance of the proposed structure would warrant the installation of a gaging station at the site, it is rarely possible to anticipate the need far enough in advance to obtain records of sufficient length. There is thus a need, not only for a method of relating flood magnitudes and frequencies at points where flood data are available, but for a method of transferring those data and relations to other points. This report represents an attempt to meet these needs in the State of Florida.
Acknowledgements
The data in this report were compiled and. prepared for publication as part of a cooperative program for water-resources investigations between the U. S. Geological Survey and the Florida State Road Department. This program has been continuous since 1930.
The report was prepared by R. W. Pride in the district office of the U. S. Geological Survey, Ocala, Fla., under the direction of A. O. Patterson, district engineer. Tate Dalrymple and others of the staff of the Washington office of the U. S. Geological Survey rendered valuable technical assistance in review of report and preparing text for publication.
Most of the data on flood peaks are from the original records in the files of the U. S. Geological Survey but some are from the records of the Corps of Engineers, U. S. Army, the U. S. Weather Bureau, the Everglades Drainage District, and the Okeechobee Flood Control District.
/ Description of the Area
When the old Spanish province of Florida was acquired by Great Britain in 1763, it was divided into two colonies. East Florida and West Florida, separated by the Apalachicola River. These geographic divisions now have no legal standing, but the name of West Florida is still in common use. East Florida, at least the southern part of it, is more commonly known as the Peninsula. The present State includes both East and West Florida.
Florida is the second largest State east of the Mississippi River, comprising an area of 58, 666 square miles, of which 3, 805 square miles are water. The State has 3,751 miles of tidal shore line, including the Atlantic and Gulf of Mexico coasts, and of these total lengths 1,987 miles outline the mainland and 1,764 miles surround islands. I/
/Douglas, E. M., Boundaries, areas, geographic centers, and altitudes of the United States and the several States: U. S. Geol. Survey Bull. 817, 1930.
1

2 FLOODS IN FLORIDA
Topography
The State of Florida is a part of a much larger geographic unit, the Floridan Plateau, that lies above sea level. The State is divisible into five natural topographic regions: Coastal Lowlands, Central Highlands, Tallahassee Hills, Marianna Lowlands, and Western Highlands. The general outlines of these regions are shown in figure 1. £/
Figure 1.--Topogiaphic divisions of Florida.
Coastal Lowlands. --The Coastal Lowlands border the entire coast of Florida. They are widest in the south, where they cover all of the State south of Lake Okeechobee, and are narrowest from Choctawhatchee Bay to the west, where they are only 10 or 12 miles wide at Pensacola. Land elevation of the Coastal Lowlands varies from sea level to generally less than 100 feet above sea level.
Central Highlands. --The Central Highlands extend from a 60-mile width along the Georgia Iin6 south-south eastward along the peninsula to the vicinity of Glades County, a distance of approximately 250 miles. This area in cludes high swampy plains, hills, and thousands of lakes. The altitude ranges from less than 40 feet above sea level in some valleys to 325 feet on the summit of Iron Mountain near Lake Wales.
Tallahassee Hills. The Tallahassee Hills lie between the Georgia state line on the north and the Coastal Lowlands on the south--a width of nearly 25 miles and between the Withlacoochee River on the east and the Apalachicola River on the west--a length of 100 miles. Long gentle slopes with rounded summits are characteristic of the Tallahassee Hills except in the western part of Gadsden County where the upland surface consists of a nearly level plain which is about 300 feet above sea level.
Marianna Lowlands. --The Marianna Lowlands, consisting of a rough quadrilateral area in Jackson, Holmes, and Washington Counties, is a region of low rolling hills and hollows. It is dotted with many sinks, ponds, and small lakes.
2/ Cooke, C. Wythe, Scenery of Florida: Florida Geological Survey Bull. No. 17. 1939.

INTRODUCTION 3
Western Highlands. --The Western Highlands extend from the Apalachicola River westward to the Perdido River. In the eastern part of this area they are confined between wide strips of Marianna Lowlands on the north and Coastal Lowlands on the south. Farther west, however, they extend from the Alabama line almost to the Gulf, from which they/are separated by a narrow strip of lowlands. The Western Highlands consist of a plateau sloping gently southward. The northern part is hilly, ranging up to 345 feet in Walton County. The southern part is a broad, gently rolling upland ranging in altitude from about 100 feet to 220 feet above sea level and is deeply trenched by narrow steep-walled valleys, which cut down nearly to sea level.
Drainage basins
On the Florida Peninsula the Central Highlands form the divide between the drainage to the east into the Atlantic Ocean and that to the south and west into the Gulf of Mexico. In Northwest Florida most of the area is drained by river systems that originate in Georgia or Alabama and flow southward through Florida to the Gulf of Mexico.
Because of the long coastline and narrow width of the State, much of the drainage is by many small coastal streams. This is in contrast with the few larger river systems that form the drainage pattern of the interior states.
The major river or drainage basins totally or partly within the State of Florida are the St. Marys, St. Johns, Lake Okeechobee and the Everglades, Peace, Withlacoochee, Suwannee, Ochlockonee, Apalachicola, Choctawhatchee, Yellow, Blackwater, Escambia, and Perdido. These river systems in Florida are shown in figure 2.
St. Marys River. --The St. Marys River originates in the Okefenokee Swamp in southern Georgia and meanders in an erratic course to the Atlantic Ocean. This river forms the northeastern boundary of Florida and drains an area of about 1,500 square miles.
St. Johns River. --The St. Johns River is the largest river with its drainage area wholly within the State. The total drainage area of the St. Johns River is about 8,000 square miles. From its headwaters in the marshy area west of Vero Beach, it flows northward for about 250 miles to Jacksonville, where it turns eastward and enters the Atlantic Ocean at Mayport. The river has a very flat gradient and the effect of ocean tides extends up stream more than 100 miles. In the upper reaches of the St. Johns River, the channel expands intermittently to form several large lakes. In the lower reaches of the river between Palatka and Jacksonville, the width ranges from nearly 1 mile to more than 3 miles. Below Jacksonville the width is generally less than one-half mile. The largest tributary of the St. Johns River is the Oklawaha River, which drains an area of about 2, 100 square miles. The source of the Oklawaha River is in a group of large lakes in the center of the State.
Lake Okeechobee and the Everglades. --This system drains the entire area of southern Florida. The pre dominant feature of this drainage system is Lake Okeechobee, which is a large, shallow, roughly circular fresh water lake about 700 square miles in area. The principal inlets to Lake Okeechobee are the Kissimmee River and Fisheating Creek. The Kissimmee River flows southward and enters the north side of the lake. Fisheating Creek flows southward for over half of its length and eastward for the remainder and enters the lake on its west side. In its former natural state Lake Okeechobee had no well-defined outlet; its rising waters would spread over the vast Everglades area to the south, or spill slowly into the flat areas west of the lake and find their way to the Caloosa- hatchee River, or escape by seepage and overland flow to the Allapattah, Hungryland, and Loxahatchee Sloughs to the east. Under present conditions Lake Okeechobee is impounded by levees that block the water from escaping into the everglades; its present main outlets are the St. Lucie Canal to the east and the Caloosahatchee Canal to the west.
The Everglades is a grassy marsh with an average width of 40 miles extending from the southern shore of Lake Okeechobee for about 100 miles to the sea at the southern end of Florida. Under natural conditions the waters of Lake Okeechobee would rise over the southern rim of the lake, push through the dense growth which formed that rim, and then move slowly southward through the dense sawgrass marsh. This original condition of the Everglades has been greatly altered by the development of drainage and flood-control works. The West Palm Beach, Hillsboro, North New River, and Miami Canals, originating at Lake Okeechobee, cut through the Everglades in a southeast ward direction and provide some degree of drainage. At the present time the Everglades area is being further im proved and reclaimed by the construction of additional canals, levees, reservoir areas, and pumping stations by the Corps of Engineers and the Central and Southern Florida Flood Control District. The generally low elevation and flat topography of southern Florida with its poor natural drainage results in slow runoff of excess water.
Peace River. --The Peace River originates in the lake region in Polk County and follows a southwestward course into Charlotte Harbor and the Gulf of Mexico. This river drains an area of about 2,000 square miles.
Withlacoochee River. --The Withlacoochee River rises in a swampy area in Polk County and follows a north westward course past Tsala Apopka Lake to the Gulf.
jsuwannee River. --The Suwannee River heads in the Okefenokee Swamp in southern Georgia, flows southward er raPids nearly to White Springs, Florida, turns northwestward to its junction with the Alapaha River, thence
outhwestward past Dowling Park, then southeastward to the mouth of the Santa Fe River, and finally southward totiulf of Mexico. The principal tributaries of the Suwannee River are the Alapaha and Withlacoochee Rivers,
* ch likewise originate in Georgia, and the Santa Fe River, which is entirely within the State of Florida. The total rea drained by the Suwannee River basin is slightly less than 10, 000 square miles.

FLOODS IN FLORIDA
88° 87° 80°
EXPLANATION OF SYMBOLS Continuous record* of etoge ond dischorge o Continuous records of »toge
25 0 ^5 50^ 75 KX3Scale in miles
es
87 3°
Figure 2. --Map of Florida and adjacent area showing location of gaging stations on rivers,lakes, and canals. /

INTRODUCTION 5
Ochlockonee River. --The Ochlockonee River rises in Georgia and flows southward to the Gulf. The upper reach of this river has a fairly steep gradient. One of the few hydroelectric plants in Florida is located on this stream at the Jackson Bluff Dam west of Tallahassee.
/Apalachicola River. --The Apalachicola River is formed by the confluence of the Flint and the Chattahoochee
Rivers at the Georgia-Florida State line. The drainage area at this point is 17,100 square miles and the river is by far the largest passing through the State. However, most of the total drainage area is in Georgia and Alabama and a relatively small area is in Florida. The largest tributary of the Apalachicola River in Florida is the Chipola River which rises in Alabama and flows southward in Florida to empty into the Apalachicola River just above its mouth at the Gulf.
Choctawhatchee, Yellow, Blackwater, Escambia, and Perdido Rivers. All the larger rivers draining West Florida rise in southern Alabama and flow southward through Florida to the Gulf. These streams have fairly steep slopes and broad flood plains. The largest of these rivers and the total drainage area of each are as follows: Choctawhatchee, 4,646 square miles; Yellow, 1,365 square miles; Blackwater, 860 square miles; Escambia, 4,233 square miles; and Perdido, 925 square miles.
Climate
With its northernmost boundary at latitude 31°, the State of Florida is located well south in the temperate zone. Except on the north, the State is surrounded by waters of the Atlantic Ocean and Gulf of Mexico. No point in the State is more than 60 miles from salt water. This proximity to the sea, and the numerous inland bodies of water contrib ute to the causes that produce a temperate and a moist subhumid to humid climate. The slight variation in the alti tude of the land surface has little effect on the overall climate of the State. With average temperatures of 81° F. in July and 59° F. in January, the climate is usually neither excessively hot nor excessively cold.
In the extreme southeastern and northwestern sections of the State the average annual rainfall is 64 inches, and at other places it is generally more than 48 inches except for the Florida Keys where rainfall totals are smaller. The yearly average over the State as a whole is 53 inches. The distribution of the average annual rainfall over the State is shown in figure 3.
There are well-defined wet and dry seasons in Florida. In West Florida and in the northern part of the Florida Peninsula, the period of greatest rainfall and consequent flooding usually occurs between November and April and is caused by broad cyclonic disturbances which commonly bring steady downpours over large areas of several southeastern States.
In central and southern Florida the wet season is usually from June through October. It is during this season that the tropical hurricanes, which originate in the doldrums, move in from the1 Caribbean Sea or the Atlantic Ocean. Although the winds of a hurricane rotate around a calm center at high velocities, sometimes 100 to 150 miles an hour, the progressive movement of the storm itself averages only about 12 miles an hour.^/ These storms are usually accompanied by intense rainfall. Even though most hurricanes do not strike the Florida mainland, the coastal areas frequently receive heavy rains from many that move in a path fairly near the coast. These tropical storms gradually lose their intensity as they travel inland. This variation is illustrated by figure 4, which shows the 24-hour rainfall to be expected once in 50 years.
Figure 4. Maximum 24-hour rainfall, in inches, to be expected once in 50 years.
Figure 3. Average annual rainfall, in inches, in Florida.
37 Tannehill, Ivan Ray, Hurricanes: Princeton University Press. 1945.

6 FLOODS IN FLORIDA
Flood Records
The base data for this report were obtained from records of gage height and discharge that have been col lected by the Geological Survey and other agencies. All the larger streams in northern Florida head in Georgia or Alabama and records at upstream stations in these States have also been included.
The length of record of streamflow data in Florida is relatively short. In central and southern Florida very little systematic data had been collected before 1930. In northern Florida, records are available from a few gaging stations that were established as early as 1927. In this part of the State there are also records of stage at three stations operated by the U. S. Weather Bureau for a few years antedating Geological Survey record. Historical data pertaining to the peak stage of floods before the beginning of stream-gaging records have been included when such information could be obtained from reliable sources. Estimates of the peak discharge of these floods were made if there were reasonable assurance that the stage-discharge relation was applicable. The listing of the annual peaks in this report is by calendar year. This period was used because it more nearly coincides with the climatic year in Florida than does the water year beginning October 1.
Practically all of the discharge records presented in this report have been previously published in the annual Water-Supply Papers of the Geological Survey. Because of the importance of stage records and the inadequacy of discharge records, especially in southern Florida, there have also been included in this report considerable data on stage of lakes, as well as streams, from the unpublished files of the Ocala'District office.
Records from several recently established stations or those for short periods during earlier years were not sufficiently long to be included for frequency analysis purposes. In general, flood records for all stations operated for 5 years or more are included in this study.
Gaging stations providing the base data are listed in downstream order in table 1, which shows by bar graph the years for which annual peak stages or discharges are available at each station. The location of each station is indicated by index number on the map of figure 2.
Table 1. Gaging station data
No.
1 2
3
4
5
6
7 8 9 10 11 12
13 14 15
16 17 18 19 20
21 22 23 24 25 26 27 28 29 30
Gaging station
SATILLA RIVER BASIN Satilla River near Waycross, Ga. Satilla River at Atkinson, Ga.
ST. MARYS RIVER BASIN North Prong St. Marys River at Moniac,
Ga. St. Marys River near Macclenny, Fla.
ST. JOHNS RIVER BASIN St. Johns River headwaters near Vero
Beach, Fla. St. Johns River headwaters near Kenans-
ville, Fla. St. Johns River near Melbourne, Fla. Lake Washington near Eau Gallie, Fla. Lake Poinsett near Cocoa, Fla. St. Johns River near Christmas, Fla. Econlockhatchee River near Chuluota, Fla St. Johns River above Lake Harney, near
Geneva, Fla. St. Johns River at Osceola, Fla. Lake Jessup Outlet near Sanford, Fla. St. Johns River above Lake Monroe, near
Sanford, Fla. St. Johns River nsar Sanford, Fla. Wekiva River near Sanford, Fla. St. Johns River near DeLand, Fla. Lake Apopka at Winter Garden, Fla. Apopka-Beauclair Canal near Astatula»
Fla. Lake Dora at Mount Dora, Fla. Daad River near Tavares, Fla. Lake Minnehaha at Clermont, Fla. Palatlakaha Creek near Mascot te, Fla. Haines Creek at Lisbon, Fla. Lake Weir at Oklawaha, Fla. Oklawaha River at Moss Bluff, Fla. Oklawaha River near Ocala, Fla. Silver Springs near Ocala, Fla. Oklawaha River near Conner, Fla.
Flood region
B B
B B
B
B B B B B B
B A A
A A A A A
A A A A A A A A A A A
Drainage area (sq mi)
1,300 2,880
160 720
203
442 874
1,418 260
1,910 1,950
2,320 2,420
2,960 130
160 640 37
910 1,100
1,180
Mean annual flood (cfs)
8,200 16,003
1,700 8', 000
3,800
5,100 3,100
870 8,500
285 420__
1,080
2,050
Period of record of maximum annual peaks
88 g 8 S 3 g !?O» CT> CT> Ch CJi 0> Ch Cft
JHL_
n
mm
t
mm
i
nn
n
_ _
^ i
I i
1 1r --
in r1-!i ' i
r-J-,i
br-1
ri-,bi " '
i
1
1 ii
i- , 1_
br-
-
1=±=-

INTRODUCTION
Table 1. Gaging station data Continued
No.
31 32 33 34 35 36
37 38 39
40
41
42
43 44 45
46 47 48
49 50 51 52 53 54 55 56 57
58
59 60 61 62 63 64 65 66 67 63 69
70
71 72
73
74 75
76
77
78
79
80 81 82
83
/ Gaging station
Oklawaha River at Eureka, Fla. Newnans Lake near Gainesville, Fla. Orange Lake near Boardman, Fla. Orange Lake Outlet near Citra, Fla. Lochloosa Lake at Lochloosa, Fla. Lochloosa Lake Outlet near Lochloosa,
Fla. Orange Creek at Orange Springs, Fla. Oklawaha River near Orange Springs, Fla. Oklawaha River at Riverside Landing near
Orange Springs, Fla. South Fork Black Creek near Penney Farms,
Fla. North Fork Black Crekk near Middleburg,
Fla. JMOULTRIE CREEK BASIN
Moultrie Creek near St. Augustine, Fla. LAKE OKEECHOBEE AND THE EVERGLADES
Lake Okeechobee, Fla. Fisheating Creek at Palmdale, Fla. Indian Prairie Canal near Okeechobee,
Fla. Alligator Lake near Ashton, Fla. Hart Lake near Narcoossee, Fla. East Tohopekaliga Lake at St. Cloud,
Fla. Lake Tohopekaliga at Kissimmee, Fla. Cypress Lake near St. Cloud, Fla. Lake Butler at Windermere, Fla. Cypress Creek at Vineland, Fla. Reedy Creek near Loughman, Fla. Lake Hatchineha near Haines City, Fla. Catfish Creek near Lake Wales, Fla. Lake Kissimmee near Lake Wales, Fla. Weohyakapka-Rosalie Canal near Lake
Wales, Fla. Kissimmee River below 'Lake Kissimmee,
Fla. Kissimmee River at Fort Kissimmee, Fla. Reedy Lake Outlet near Frostproof, Fla. Lake Arbuckle near Avon Park, Fla. Arbuckle Creek near DeSota City, Fla. Josephine Creek near DeSota City, Fla. Lake Istokpoga near DeSota City, Fla. Istokpoga Canal near Cornwell, Fla. Kissimmee River near Cornwell, Fla. Kissimmee River near Okeechobee, Fla. St. Lucie Canal at Lake Okeechobee, Fla. West Palm Beach Canal at Canal Point,
Fla. West Palm Beach Canal at West Palm Beach,
Fla. Hillsboro Canal at Belle Glade, Fla. Hillsboro Canal at Shawno Plantation,
Fla. Hillsboro Canal near Daerfield Beach,
Fla. North New River Canal at South Bay, Fla. North New River Canal at 26-mile bend,
near Fort Lauderdale, Fla. North New River Canal near Fort
Lauderdale, Fla. Miami Canal at Pennsuco, near Miami,
Fla. Miami Canal at water plant, Hialeah,
Fla. Tamiami Canal outlets, Miami to Monroe,
Fla. Lake Tr afford near Immokalee, Fla. Imperial River near Bonita Springs, Fla. Caloosahatchee Canal at Moore Haven,
Fla. Orange River near Fort Myers, Fla.
Flood region
A A A A A
A A A
A
A
A
A
B
B B B
B B B B B B B B B
B
B B B B B B B B B B
Drainage area
(sq mi)
1,420
431 2,010
2,100
134
174
23.3
435
31.0 117
58.9
1,609
62.2
385 109
624 2,703 2,886
83.4
Mean annual flood (cfs)
3,000
690 4,000
5,500
5,000
730
5,000
66
131
3,000
86
2,900 630'
1,030
6,500
-
-
Period of record of maximum annual peaks
o in o in o m o m (M 01 to co *}' * m m CTio>o>oScftO>oioi
e
t
n
n n
1-
n ...
n
r
n
n
' _
cd
n t n t
1 1F
> ,
__
'
i
i
_0 , , L_
..... i...
' I H""
r±
1
BOP*?*
1
C
Kraui
i
i

FLOODS IN FLORIDA
Table 1. Gaging station data Continued
No.
84 85
86 87 88 89 90
91
92
93
94
95
96
97
98
99 100 101
102 103
104 105 106 107 109 109 110 111 112 113 114 115 116 117 118
119
120 121 122 123
124 125 126 127
128
129
130 131 132 133
134 135 136 137
Gaging station
PEACE RIVER BASIN Drainage Canal west of Ehindee, Fla. Peace Creek Marsh outlet near Alturas,
Fla. Lake Howard at Winter Haven, Fla. Lake Lulu Outlet near Eloise, Fla. Peace River at Bartow, Fla. Peace River at Zolfo Springs, Fla. Peace River at Arcadia, Fla.
MIAKKA RIVER BASIN Miakka River near Sarasota, Fla.
MANATEE RIVER BASIN Manatee River near Bradenton, Fla.
LITTLE MANATEE RIVER BASIN Little Manatee River near Wimauma, Fla.
ALAFIA RIVER BASIN Alafia River at Lithia, Fla.
HILLSBOROUGH RIVER BASIN Hillsborough River near Zephyrhills,
Fla. Hillsborough River near Tampa, Fla.
LAKE TARPON BASIN Brooker Creek near Odessa, Fla.
ANCLOTE RIVER BASIN Anclote River near Elfers, Fla.
WITHLACOOCHEE RIVER BASIN Withlacoochee River at Trilby, Fla. Withlacoochee River at Groom, Fla. Withlacoochee River near Holder, Fla.
WACCASASSA RIVER BASIN Waccasassa River near Otter Creek, Fla. Otter Creek near Otter Creek, Fla.
SUWANNEE RIVER BASIN Suwannee River at Fargo, Ga. Suwannee River at White Springs, Fla. Alapaha River near Alapaha, Ga. Alapaha River at Statenville, Ga. Little River near Adel, Ga. Withlacoochee River near Quitman, Ga. Withlacoochee River near Pinetta, Fla. Suwannee River at Ellaville, Fla. Suwannee River at Luraville, Fla. Suwannee River at Branford, Fla. Santa Fe River at Worthington, Fla. Santa Fe River near High Springs, Fla. Santa Fe River near "Fort White, Fla. Suwannee River near Bell, Fla. Suwannee River near Wilcox, Fla.
FENHOLLOWAY RIVER BASIN Fenholloway River at Foley, Fla.
OCHLOCKONEE RIVER BASIN Ochlockonee River near Thomasville, Ga. Tired Creek near Cairo, Ga. Ochlockonee River near Havana, Fla. Ochlockonee River near Bloxham, Fla.
APALACHICOLA RIVER BASIN Spring Creek near Iron City, Ga. Apalachicola River at Chattahoochee, Fla. Mosquito Creek at Chattahoochee, Fla. Apalachicola River near Blountstown,
Fla. Chipola River near Altha, Fla.
BEAR CREEK BASIN Econfina Creek near Bennett, Fla.
CHOCTAWHATCHEE RIVER BASIN Choctawhatchee River near Newton, Ala. Pea River nsar Samson, Ala. Choctawhatchee River at Caryville, Fla. Choctawhatchee River near Bruce, Fla.
YELLOW RIVER BASIN Lightwood Knot Creek at Babbie, Ala. Yellow River at Milligan, Fla. Shoal River near Crestview, Fla. Yellow River near Holt, Fla.
Flood region
B
B B B B B B
B
B
B
B
B B
B
B
B B B
B B
B B B B B B B B B B B B B B B
B
B B B B
B B B
B B
B
B
B B
B B B B
Drainage area
(sq mi)
50
150
26 390 840
1,370
235
90
145
335
220 650
10
67
650 9OO
1,710
1,260 1,990
644 1,400
547 1,560 2,220 6,580 6,900 7,090
630 950
1,080 9,260 9,500
180
550 55
1,020 1,660
520 17,100
60
17,300 781
182
683 1,187 3,499 4,384
113 624 474
1,220
Mean annual flood (cfs)
123
877
43 1,700 7,500 10,000
3,200
3,400
5,500
5,600
3,450 4,200
57
1,150
2,000 2,700 3,100
392 462
5,000 8,600 3,700 5,200 4,800 8,000 9,000
18,500
16,700 7,000 4,400 4,900 20,500
946
5,800 3,200 7,000
4,200 90,000
5,200
1,800
9,60013,30033,00038,000
4,2009,7008,500
-
Period of record of maximum annual peaks
o in o in Q in o in 01 CNJ to jo * *> 10 inOlGi OSOiOiGi O* O)
g
h_i_ mm
~ """1
n
1 __ j
nn
mmm
m
i _____
I
i
__ _
_
_ _
JBHHH
__
=
n
mtmm
-Jmm
_
M-_
_
,_
mm
=1
__
__
_-__
i
immm
____ ____
___
___ __

METHOD OF FLOOD-FREQUENCY ANALYSIS
Table 1. Gaging station data Continued
No.
1 «7Q
140 141142 143 144145146
BLACKWATER RIVER BASIN
ESCAMBIA RIVER BASIN
Sepulga River near McKenzie, Ala. Pigeon Creek near Thad, Ala.Conecuh River near Brooklyn, Ala. Murder Creek near Evergreen, Ala. Escambia Creek at Flomaton, Ala.
Perdido River at Barrineau Park, Fla.
Floodregion
B BB B B
B
Drainage£LT*63,
9T7
1,343 464 296
2,460 170 323
3 Q4 rj
394
Mean annualflood(cfs)
17,500 11,700 7,600
31,500 4,300 8,300
42 OOO
7,500
Period of record of maximum annual peaksowoir, owoirO»O»O»O»O» OIOIC
n n
n
n
___
mm ~
^^=*=mmmm mmmm mmt
1 I 1a 1871, 1880, 1898, 1910 (stage only) g 1906-08 (stage and discharge)b 1936-42 (once-monthly gage readings) h 1916 (stage only)c 1936-44 (once-monthly gage readings) i 1913 (stage and discharge)d 1936-45 (once-monthly gage readings) j 1926 or 1928 (stage only)e 1912-29 (intermittent gage heights at doubtful datum). k 1905-19 (stage and discharge)f 1912 (stage and discharge)
Bar symbols
Peak stage and discharge Peak stage only
METHOD OF FLOOD-FREQUENCY ANALYSIS!/
The methods of computing flood frequency used in this report represent current techniques that have been developed in a continuing study by engineers of the Water Resources Division of the Geological Survey and by others. These methods serve, first, to define flood-frequency relations for a particular stream at a specific point of obser vation (at a gaging station); and, second, by combining a number of these point relations on an areal basis, to esti mate flood-frequency relations at any point on any stream, gaged or ungaged, within a broad area (regional flood frequency).
Flood frequency at a gaging station
Flood data for a gaging station may be analyzed in two ways: as an annual flood series or as a partial- duration series.
As used in this report, an annual flood is defined as the highest momentary peak discharge in a calendar year. In an annual flood series, only one flood, the annual maximum, is considered for each year of record. This method of analysis is sometimes objectionable because the second highest flood in a given year, which the above rule omits, may outrank many annual floods. This objection is overcome by the partial-duration series, in which all floods above a selected magnitude are considered without regard to the number within any given period. An ob jection to the partial-duration series is that not all of the floods considered may be fully independent events, that is, one flood may set the stage for another.
There is an important distinction in meaning between recurrence intervals determined by the two methods. In the annual-flood series the recurrence interval is the average interval in which a flood equal to or greater than a given magnitude will occur as an annual maximum. For example, a flood having a recurrence interval of 25 years, or the "25-year flood", is the flood that can be expected to be equal or exceeded four times in 100 years. No reg ularity of occurrence is implied; two 25-year floods could occur in consecutive years. In the partial-duration series the recurrence interval is the average interval between floods of a given magnitude regardless of their rela tionship to the year or any other period of time. This distinction remains, even though for large floods the reccur- rence intervals are practically the same on both scales.
From statistical principles, there is a definite relationship between the values in the two series, following table£/ shows comparative values of recurrence intervals for the two methods:
The
£/ The general discussion of flood-frequency methods given herein was taken, in part, from similar re- Ports for Georgia and Alabama, published as Geological Survey Circulars 100 and 342, respectively.
j>/ Langbein, W. B.. Annual flood and the partial-duration series: Trans. Am. Geophys. Union. °ec. 1949.

10 FLOODS IN FLORIDA
Recurrence intervals in years
Annual flood series Partial-duration series
1.16 0.51.58 1.02.00 1.452.54 2.05.52 5.0
10.5 1020. 5 2050.5 50
100.5 100
This table shows that for recurrence intervals of 10 years and longer, or those commonly used for design purposes, both methods give essentially the same result. Because of its relative simplicity, the annual flood series has been used in this report.
The flood-frequency graph
The annual floods for each complete year of record are listed in chronological order and numbered in de scending order of magnitude--that is, beginning with the greatest as 1. The next step is to fit a time scale to the data. Published methods for this operation are quite diverse, largely because of differing ideas as to the proper method of treating small samples. In the method adopted by the Geological Survey, recurrence intervals are com puted as (n + l)/m, where ti is the number of years of record and m is the relative order of magnitude of each flood. This formula is simple to compute. It is applicable both to the annual flood data and to the partial-duration series, and gives acceptable results conforming with some of the latest theories.
Annual floods are then plotted with discharges as ordinates and recurrence intervals as abscissae on a special coordinate paper 6/ designed to make the plotted points approximate a straight line.
After the annual floods have been plotted, it is necessary to fit a curve to the data. Several methods of fitting the curves analytically have been proposed, but curves so fitted, even by the most elaborate and painstaking methods, appear to offer no advantages over curves simply fitted by eye. Thus, for this report, the frequency curves were drawn as the line of best fit as determined visually, with consideration for the limitations and peculi arities inherent in the data. In general, the plotting positions of the extreme values were discounted or ignored in drawing the curves because there is little opportunity for determining the true recurrence interval of those values. (For an example of a typical frequency graph, refer to figure 9, page 16).
Limitations of flood-frequency graphs
Many hydraulic design problems currently being encountered in Florida require the determination of a design flood for a recurrence interval considerably longer than the period of record. As few flood records for the State extend for more than 25 years, most frequency curves must be extrapolated if the necessary information is to be obtained. For example, suppose that a flood record of 30 years is available for determining a required 50-year flood. Generally, the computed plotting position of the greatest flood is not entirely dependable. Thus, the graph defining the 50-year flood might require extrapolation from the plotting position of the flood second (or possibly lower) in order of magnitude, that is, an extrapolation from about 15 to 50 years on the scale of recurrence inter vals. Although this linear distance appears short on the graph, the error of the curve at its outer end could be con siderable, regardless of the method of curve fitting or type of plotting paper used.
Another and more serious limitation of flood-frequency graphs based on relatively short records arises from the random manner in which flood events are distributed with respect to time. For example, a flood record of 100 years cannot be expected to include exactly one 100-year flood, two 50-year floods, three 33.3-year floods, and so on. If the 100-year record is separated into two 50-year periods, one period might include several 50-year floods; the other none. Frequency graphs based on each of the two 50-year periods may be vastly different and neither may closely resemble the frequency graph derived from the 100-year record considered as a whole. Simi larly, the frequency graph obtained from the 100-year record could be appreciably different from that for a different period of the same length, or for a longer period. Thus, the record of annual floods for a particular stream is a random sample which may yield a frequency graph far different from one which would be derived from a record of infinite length.
The maximum departure to be expected between flood magnitudes or frequencies computed from relatively short records and their true (long-term) values decreases with the magnitude of the flood and with the length of the record. The variation, owing to the chance factor alone, between the flood magnitudes computed from records of varying length and the long-term values has been studied by Benson, 2J who analyzed an array of 1,000 hypothetical
6/ Powell, R. W., A Simple Method of Estimating Flood Frequency: Civil Eng. Feb. 1943.
_?/ Benson, M. A., Characteristics of frequency curves based on a theoretical 1,000-year record: U. S. Geological Survey, open-file report; 1952.
METHOD OF FLOOD-FREQUENCY ANALYSIS 11
annual floods distributed according to the theory of extreme values. / In using statistical methods, the most favor able expectancy during 95 percent of the time, or 19 chances out of 20, is commonly used as the criterion for de pendable results. The following table based on Benson's study, shows the length of record necessary to define floods of selected frequency within 10 percent and 25 percent of the correct long-term (1,000-year) value.
Length of record in years required to define flood within indicated percentage of correct value, 19 times in 2.0
Magnitude of flood 25 percent 10 percent
10-year flood 18 9025-year flood 31 10550-year flood 39 110
Although the figures in the above table are based on hypothetical rather than on real flood events, they do give some indication of the considerable errors possible, from chance alone, in frequency graphs based on short- term records. A comparison of the lengths of record indicated by this table and those available for Florida streams (table 1, p. 6) suggests that few records in Florida are long enough to provide reliable individual frequency graphs for floods of infrequent occurrence.
Flood frequency by combining records
As pointed out in the preceding section, the greatest obstacle in accurately defining the flood-frequency graph at a gaging station is shortness of record--a deficiency that can be corrected only by collecting additional records in future years. Thus, some other analytical method is necessary if more dependable information is to be extracted from the flood records available at the present time. One method commonly and profitably used in such circumstances is the combining of records, on the premise that the average answer obtained from all the records is more reliable than an answer from any single record. This section describes how flood records can be combined to serve two purposes: to improve the dependability of the frequency graph at the gaging stations, and to provide a method for determining flood frequencies at points away from gaging stations.
To accomplish these purposes the records are combined by two different methods. By the first method, the records are combined on the basis of a geometric similarity of the individual frequency graphs. Inspection of plotted frequency graphs for many gaging stations has shown that a close similarity in slope and relative shape of the graphs commonly exists over broad regions. If all gaged streams within a certain region show frequency graphs of the same general shape and slope, it may logically be concluded that in some respects that region is homogeneous as to flood-frequency characteristics, and that the average shape of the frequency graph as defined by gaged streams will also apply to ungaged streams in that region. Thus, by combining records on the basis of geometric similarity of the frequency graph, those regions for which the shape of the frequency graph is common to all streams, may be accurately determined.
The shape of the frequency graph, however, is a dimensionless property, and frequency graphs of which only the shape is known cannot be used to determine flood magnitudes in absolute terms at specific points on streams. The first method of combining records locates the frequency graph only with respect to the scale of recurrence in tervals. To be of practical use, the graph must also be located with respect to the scale of magnitudes, that is, the dimensions of the graph must be restored.
This is accomplished by the second method of combining records, which relates groups of gaging stations displaying a similarity in their frequency graphs along the scale of magnitude. Experience has shown that in many parts of the United States, including the Southeastern States, frequency graphs for gaging stations can be used to outline areas in which streams draining basins of the same general physical characteristics, particularly of the same size, will produce essentially the same discharge for any given flood frequency. The second method of com bining records serves to define these hydrologically similar areas by relating records on the basis of basin proper ties and the discharge, in absolute terms, for some arbitrarily selected recurrence interval. It further serves to define for any stream within such an area one point on the frequency graph with respect to both magnitude and fre quency. If one point on the graph is thus defined, and the shape of the graph has been determined, the complete flood-frequency graph can readily be drawn.
It should be pointed out that the geographical boundaries of the areas defined by the two methods of com bining records need not, and generally do not, coincide. To distinguish between the two classes of areas, those de fined by the first method are referred to in this report as "flood regions" and those defined by the second method 3-s "hydrologic areas".
Combining records by geometric similarity of frequency graphs
Before records for a number of gaging stations can be combined by this method, they must represent a homogeneous group both with respect to time and to geometric similarity.
j}/ Gumbel, E. J., Floods Estimated by the Probability Method: Eng. News Rec., June 14, 1945.

12 FLOODS IN FLORIDA
For time, the records to be combined are conveniently reduced to the same basis by using a common period for all records. Since length of record is of primary importance in a frequency graph, the base period selected should be as long as feasible. Records shorter than the base period are extended to that length by either of two methods. The first method is by estimating annual floods for years of no record from nearby stations having complete record. Order numbers are then assigned to all annual floods, observed or estimated, within the base period at each station. The estimated floods serve only to determine the proper order numbers for ob served annual floods and otherwise do not enter into subsequent computations. The alternate method is to com pute the mean annual flood for the actual period of the short-term station. Then it can be adjusted to the base period by using the ratio of the mean flood for the two periods at nearby long-term gaging stations.
For geometric similarity, the records to be combined may be -regarded as a homogeneous group if the frequency graphs for the individual stations have approximately the same shape and slope. In comparing these graphs to ascertain whether this condition exists, it is convenient to compute the annual floods at each station as ratios to the station mean, thereby reducing all floods to dimensionless terms.
Computation of mean annual floods
The mean of the annual floods is commonly, though somewhat ambiguously, referred to as the "mean annual flood" which term, by virtue of convention, has been retained in this report. The mean annual flood is thus not to be confused with the flood having a recurrence interval of one year. According to the theory of extreme val ues as applied to floods by Gumbel, the mean of all the annual peak floods in a long-term record would have the magnitude of the flood of 2.33-year recurrence interval. The mean annual flood in this report was determined graphically from the individual station data as the intersection of the visually best-fitting frequency graph with the line corresponding to the 2.33-year recurrence interval. With occasional exceptions, experience has shown that the mean annual flood is indicative of the flood characteristics of a drainage basin and is therefore a good index on which to base comparisons.
Test for geometric similarity
Because flood records are random samples, a group of records can be tested for geometric similarity by determining whether the differences in slope of the individual frequency graphs for the lengths of record available are no greater than might result from chance alone. To test a group of records for this property the ratio of the 10-year flood to the mean annual flood is first determined fop each gaging station. These 10-year flood ratios are then averaged to obtain a mean 10-year flood ratio for the group. The mean annual flood at each gaging station is then multiplied by the mean ratio and the corresponding recurrence interval determined from the station frequency graph. These recurrence intervals are plotted against the number of years of record on a test graph, as shown in figure 5, based on the theory of extreme values. If the points for all the stations plot at random between the two curves, the group of records may be regarded as homogeneous and may be combined to define a flood region. Points plotting outside the envelope or grouped near the boundaries indicate where further subdivision is required.
Regional frequency graph
All station records satisfying the above test are used as a group to define an average or composite fre quency graph for that region. From the flood-frequency graph for each gaging station, the flood discharge is de termined for selected recurrence intervals (1.1, 1.5, 2.33, 5.0, 10, 25, and higher if curve is defined). These floods for each gaging station are then reduced to dimensionless terms by expressing them as ratios to the mean annual flood (2.33-year recurrence interval). Using all the station records in a homogeneous region, the median ratio is determined for the flood of each selected recurrence interval. The median ratios plotted against the cor responding recurrence intervals define the regional composite frequency graph, which is based on all significant flood data available and may be considered to represent the most likely flood-frequency relation for all streams in the region. As a composite frequency graph expresses floods of other frequencies in terms of the mean annual flood, a complete frequency graph for any stream in the region can be drawn provided the mean annual flood is known.
Combining records by similarity of mean annual floods
As previously pointed out, the second method of combining records leads to the delineation of hydrologic areas within which a flood of some arbitrarily chosen magnitude and frequency can be related to the characteristics of drainage basins, thus fixing one point on the frequency graph. From the foregoing discussion it is now apparent that the most suitable flood for this purpose is the mean annual flood.
The selection of suitable basin characteristics for this basic relation is not so self-evident. Many physi cal characteristics of drainage basins are recognized as influencing the mean annual flood. Some exert a major influence, some a minor one. Some are susceptible of accurate definition and appraisal, some are not. For the sake of simplicity, the number of such factors considered should be as few as possible without detracting seriously from the accuracy of the final result. At the same time, their numerical values must be readily determinable from available maps. ~"

FLOOD FREQUENCY IN FLORIDA
_ Factors influencing the mean annual flood
' Among the many physical characteristics of drainage basins that affect runoff (and consequently the mean annual flood), those most applicable in Florida are size of drainage area of the basin; amount of storage capacity in stream channels, swamps, and lakes; shape of basin; land and stream slopes; porosity of soil; type of vegetal cover; and land use, particularly as related to the existence of canal systems and pumping sta tions for drainage or irrigation.
13
Of these basin characteristics, the size of the drainage area is the dominant factor influencing the mean annual flood. Also of major importance on the Peninsula is the effect of storage in the numerous lakes in the drainage basin. This latter effect pro duces attenuated flood peaks. The attenuation, or re duction in flood peaks, is closely related to the per centage of lake area within the basin, a factor which can be readily determined from available maps.
1.401.301.20
Effective length of record, in years
Figure 5. --Homogeneity test graph.
Hydrologic areas
As a final step in combining records, the mean annual floods for all gaging stations are plotted against the corresponding drainage areas. For a drain age basin containing lake areas that are a significant percentage of the total drainage area, the mean annual flood has been adjusted for attenuation before corre lating with the size of drainage area. Plotted data that indicate definite trend lines and also can be related geographically, are separated into groups. The geo graphic boundaries of the areas represented by thesegrouped data are based largely on an appraisal of the land factors influencing floods, as climatic factors will generally show little variation. Much of the scattering of the plotted data is due to the influence of factors other than the size of drainage area and storage in lakes. However, in lieu of attempting to evaluate these factors, the State was subdivided into several additional hydrologic areas and fairly satisfactory correlations with drainage area have been obtained. For each of these hydrologic areas a curve relating mean annual flood and drainage area is prepared. An auxiliary curve is also prepared for defining the attenuation of flood peaks in applicable areas. Because these curves average the data for gaged points on streams in the area, they may be regarded as the most likely relations for ungaged points. Thus the only factors required to determine the mean annual flood at a desired point on a stream are the drainage area and the area of contributing lakes upstream.
FLOOD FREQUENCY IN FLORIDA
On the Peninsula of Florida, north of Lake Okeechobee and excluding the St. Marys and Suwannee River basins, practically no streamflow records were collected prior to 1930. However, several gaging stations were established in this region during 1930, generally on the larger streams, and there is available a fairly adequate network of stations on which to base frequency studies for the 24-year period, 1930-53. In the region including the St. Marys and Suwannee River basins and extending westward for the remainder of the State, records from a few gaging stations extend back to 1927 and the base period used for this region is the 27-year period, 1927-53.
Flood regions of Florida
On the basis of the test for geometric similarity, two regions in Florida were indicated for which the characteristics of annual flood peaks were more or less homogeneous. These homogeneous flood regions are des- lgnated as regions A and B in figure 6, and on plate 1. For the extreme southern part of the Florida peninsula, south of Lake Okeechobee, the available data are inadequate for flood-frequency studies. This region will be dis cussed in more detail in a following paragraph.
Records for several gaging stations in regions A and B have not been used to define the flood-frequency relationships because of regulation and diversions, interconnection of the drainage basins, proximity to other sta- ions, or short periods of record.

14 FLOODS IN FLORIDA
Figure 6. --Homogeneous flood regions of Florida.
Delineation of flood regions
Region A. --This region includes the lower part of the St! Johns River basin and the adjacent smallcoastal streams draining into the Atlantic Ocean. There are 11 gaging stations in this region that have sufficient length of discharge records on which the composite flood-frequency was based. Of these stations, only one is complete for the 24-year base period, 1930-53. Three other stations cover a term of 20 years or longer. By correlation, how ever, the period of annual flood peaks for each of the 11 stations was extended to the same 24-year base. The com posite flood-frequency graph for region A is shown as figure 7.
Region B. --This region covers practically the entire State except region A and the area south of Lake Okeechobee. In central Florida practically no discharge records were collected before 1930 and little information on historical floods could be obtained before the beginning of record. However, in the northern part of the penin sula and in West Florida a few discharge records extend back as far as 1927. Flood data for outstanding historical floods at several stations are available for a number of years antedating the period of record.
In this region there are 70 gaging stations with sufficiently long discharge records on which to base the composite flood-frequency relationship. Of these 70 gaging stations, records for only 4 are complete for a 27-year period, 1927-53, and 7 are complete for a 24-year period, 1930-53. However, by correlation by either of the two methods previously described and by use of historical data for several stations a composite flood-frequency graph based on the 70 gaging station records in region B has been defined. This composite flood-frequency graph is shown in figure 8 and has been extended to the 50-year recurrence interval with reasonable assurance.
Records for a number of stations in southern Georgia and southern Alabama were included for additional definition of the composite flood-frequency relationship for this region. The relationship for region B in Florida differs slightly from that applicable for region D in Georgia, as shown in Circular 100, and region B inyUabamaas shown in Circular 342, but is approximately the same as the average of the two. The relationship as shown in figure 8 is the best fit of the data for Florida gaging stations and is therefore considered applicable for conditions in Florida.
Records of annual flood peaks for the Apalachicola River at Chattahoochee have been available since 1919. The station-frequency curve for the 35-year period, 1919-53. has been included as figure 9 in this report.

FLOOD FREQUENCY IN FLORIDA 15
1.1 1.5 202 3' 4 5 10
Recurrence interval, in years
Figure 7. Composite frequency curve for floods in region A.
30 40 50
1.1 1.5 2 345 10
Recurrence interval, in years
20 30 40 50
Figure 8. --Composite frequency curve for floods in region B.

16 FLOODS IN FLORIDA
300
250
o 200
150
£ 100
1.1 1.5 2 345 10Recurrence interval, in years
20 30 40 50
Figure 9. --Frequency of annual floods. Apalachicola River at Chattahoochee. Fla.
Southern Florida. --Drainage in the area south of Lake Okeechobee is mainly by means of interconnected canal systems which are progressively being improved and developed. The regimen of flow in these canals is thus being continually altered. Practically no streamflow data had been collected in this area before 1940. Because of the short period of record, the progressive changes in the canal systems, regulation, and diversions, the flood frequency of this region is indeterminate. The annual flood peaks for several main channels have been included in this report in order to show the magnitude and variation of floods at selected sites.
The composite flood-frequency graphs of figures 7 and 8 are basic to the remainder of the report in that they are derived from all significant flood data and are presumed to represent the most probable relation between flood magnitude and frequency for any stream in the regions to which they apply. The graphs are of general appli cability because they express flood discharges as ratios to the mean annual flood. Thus, to derive a frequency graph for any stream, expressing flood discharges in cubic feet per second, it is only necessary to multiply the mean annual flood, in cubic feet per second, for that stream by the ratios indicated by the appropriate composite graph. The remainder of the analytical portion of this report is therefore largely devoted to methods of determin ing the mean annual flood for streams in Florida.
Hydrologic areas of Florida
The base data used for determining the hydrologic areas in Florida are listed in table 1, which shows the drainage area and mean annual flood for applicable base periods for gaging stations on streams in flood regions A and B. As previously discussed in this report, flood frequencies and mean annual floods on streams and canals in southern Florida cannot be evaluated on the basis of available data. Excluding southern Florida, the remainder of the State has been divided into seven areas in each of which the base data indicate a similarity in hydrologic con ditions relating to floods. For these hydrologic areas, the relationship between mean annual flood and drainage area has been defined. Many characteristics, other than size of the drainage area, influence the mean annual flood. The dominant secondary influence in Florida is the amount of storage capacity in lakes above a gaging station. In order to eliminate the effect of storage in lakes, an attenuation factor has been computed for adjusting the mean annual flood for a drainage basin containing a significant percentage of lake area. The method of adjustment of mean annual floods for several gaging stations with attenuated flood peaks is shown in table 2. The attenuation factor is shown in figure 10. In defining the relation of mean annual flood to drainage area for each hydrologic area the adjusted mean annual floods as shown in column 6, table 2, has been used in conjunction with mean annual floods for drainage areas devoid of lakes. To compensate for the less tangible factors that influence the mean annual flood, the State was subdivided into several hydrologic areas.
The 7 hydrologic areas of Florida are shown on plate 1. Because of inadequate data defining the areal boundaries, it was necessary to select these boundaries somewhat arbitrarily. In general, the boundaries follow drainage divides. In some areas, however, the boundaries cross stream lines. The crossings were placed at the junctions with large tributaries or lakes, where changes in the relation most logically occur.

FLOOD FREQUENCY IN FLORIDA 17
Table 2. --Adjustment of mean annual flood for attenuation by storage in lakes
1
Sta.No.
242528375255606263658485878889909197
114
Total drainage area(sq mi)
(1)
160640
1, 100431
31.058. 962.2
385109624
50.015026.0
390840
1, 370235
10.0630
Surface areaof contri
buting lakes(sq mi)
(2)
22. 112816155.48.37.3
16.029.620.493. 110. 515.87.3
42.045.745.78.51.3
15.6
Ratio of lakearea to totaldrainage area
(Col. 2fCol. 1)(3)
0.138.200.146.129.268. 124. 257.077. 187. 149.210. 105.280. 108.054.033.036
. .130.025
Mean annualflood(cfs)
(4)
285420
1,080690
66131
862,900
6301,030
123877
431, 7007, 500
10, 0003, 200
577,000
Dischargeratio from
Fig. 10
(5)
0. 18.091.16.21.068.23.071.60. 100.15.088.35.065.33.82.93.92.20.96
Adjusted meanannual dis
charge (cfs)(Col. 44- Col. 5)
(6)
1, 5804,6206,7503,280
970570
1,2104,8306,3006,8701,4002, 500
6605,1509,150
10,8003,480
2857,300
1.00
IT ' 80o to
H .60
c .50o-p
Si ."«) ff
J5
H
^ .30 T)
5to
fVH -20 oo
H +>
g
.5jT o -(->
1 .10 c
T\
t! .08 gB
-rt
5 t,
.05
i
»
2
T
.-c
-
^
-t.
-F
^
E
r
-
a-~
a
s
^
_
-
z-fr-T
^~
4^
J ?--
-t
"Y
t*
fc
v±if̂~
^
^
*
^ ==
:~
u
^
=
^
fT"
\ +
T
#
^-: I
-±+.~-
\^
lote to no
tt-
V
^ s
m te
^
\
sV
ad
-
s
Th in a
V,
IS CU
steir s exc
s
rve is of epti
nc n
or
t iaj is
ap or on
;F
P-Is J
ic ti i§
:a -e;
Die uns
1£
-
--
- M
10 20 25 30lake area, in percentage of total drainage area
Figure 10. --Relation of lake area above gaging station to reduction of mean annual flood.
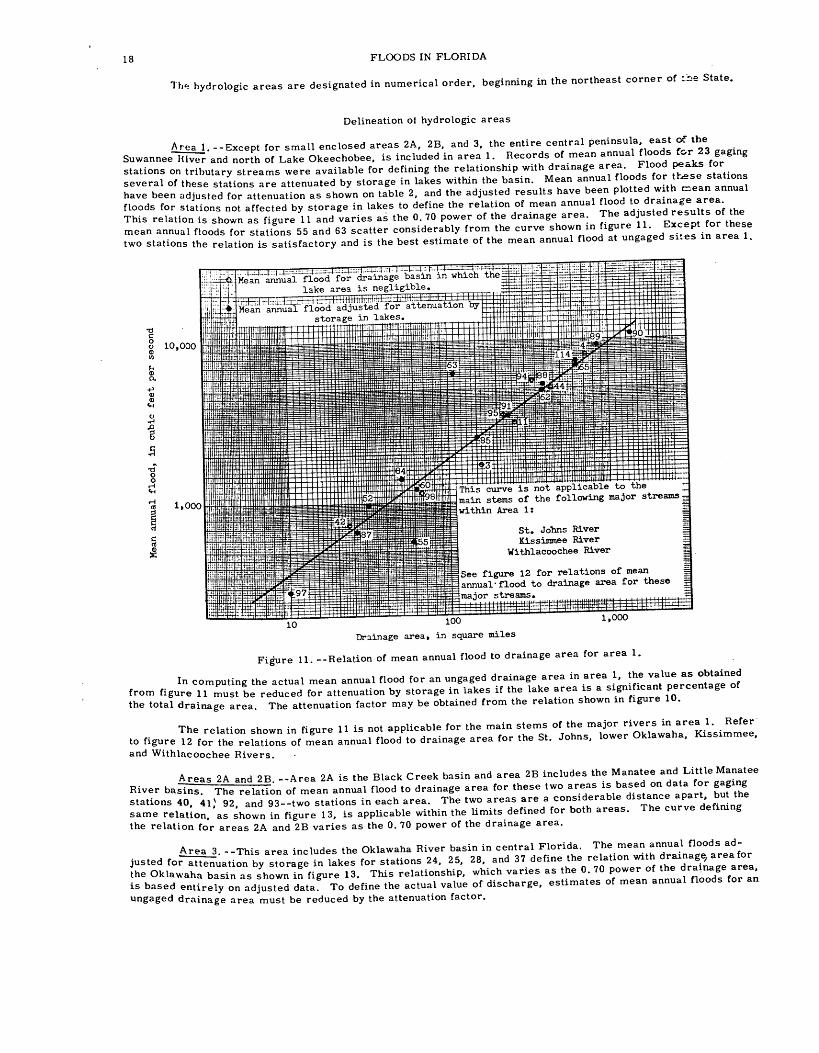
18 FLOODS IN FLORIDA
The hydrologic areas are designated in numerical order, beginning in the northeast corner of tie State.
Delineation ol hydrologic areas
Areaj. -Except for small enclosed areas 2A. 2B. and 3. the entire central peninsula east of the SuwanneelUvTr and north of Lake Okeechobee. is included in area 1. Records of mean annual "«<** for 23^gaging stations on tributary streams were available for defining the relationship with drainage area. Flood pe-ks for several of these stations are attenuated by storage in lakes within the basin. Mean annual have been adjusted for attenuation as shown on table 2. and the adjusted results have beenfloods for stations not affected by storage in lakes to define the relation of mean annual the This relation is shown as figure 11 and varies as the 0. 70 power of the drainage area. The ad ^ted resuIts jf the mean annual floods for stations 55 and 63 scatter considerably from the curve shown in figure 11. E^ept fortne two stations the relation is satisfactory and is the best estimate of the mean annual flood at ungaged si.es in area 1.
o 10,000
1,000
-t~^T"T"'l-l~-~'~ r~'~. r:; -i-i. i .-t--i -i- i _r~.-,-- Ban annual flood for drainage basin in which the
lake area is negligible ±tl:l JI-biiEEfcl-ij I lJ ' j|l*l!HltitmirTT--r-iTTn:r.:i : .1 . . i , , ..,ean annual flood adjusted for attenuation by
storage in lakes.
This curve is not applicable to themain stems of the following major streamswithin Area 1:
St. Johns RiverKissimmee River
Withlacoochee River
See figure 12 for relations of mean annual'flood to drainage area for these major streams.
Drainage area, in square miles
Figure 11. --Relation of mean annual flood to drainage area for area 1.
In computing the actual mean annual flood for an ungaged drainage area in area 1, "*ure 11 must be reduced for attenuation by storage in lakes if the lake area is a sigiiiu-^om H v...
drainage area. The attenuation factor may be obtained from the relation shown in figure 10.
In computing the actual mean annual flood for an ungaged drainage area in area 1. ^**»* < e from figure 11 must be reduced for attenuation by storage in lakes if the lake area is a significant percentage of the total drainage area. The attenuation factor may be obtained from the relation shown in figure 10.
The relation shown in fieure 11 is not applicable for the main stems of the major rivers in area 1. Refer to figure 12 tor ̂ the relates of m'eln annual flood'to drainage area for the St. Johns, lower Oklawaha. Kissimmee.
and Withlacoochee Rivers.
Areas 2A and 2B. -Area 2A is the Black Creek basin and area 2B includes the River basins. The relation of mean annual flood to drainage area for these two areas is stations 40. 41) 92. and 93-two stations in each area. The two areas are^ * f ?** same relation, as shown in figure 13. is applicable within the limits defined for both areas. The curve the relation for areas 2A and 2B varies as the 0. 70 power of the drainage area.
Area 3 --This area includes the Oklawaha River basin in central Florida. The mean annual floods ad- justed for^uatiL^ 25. 28. and 37 define .the gelation with [ the Oklawaha basin as shown in figure 13. This relationship, which varies as the 0 70 power of the is based entirely on adjusted data To define the actual value of discharge, estimates of mean annual floods for an
ungaged drainage area must be reduced by the attenuation factor.

10,000
FLOOD FREQUENCY IN FLORIDA
10,000
19
700 1,000 2,000 3,000 5,000 1,000 2,000 3,000 5,000
1,000 10,000500 700 1,000 2,000 3,000 5,000
Drainage area, in square miles10,000 20,000
Note: Data unavailable for defining mean annual flood along Apalachicola River. Mean annual flood at Chattahoochee (drainage area, 17,100 sq mi) is 90,000 cubic feet per second (see fig. 9).
Figure 12. Relations of mean annual flood to drainage area along main stems oflarge rivers in Florida.
The relation for area 3 as shown in figure 13 is not applicable to the main stem of the Oklawaha River below Silver Springs. Refer to figure 12 for the relation applicable to this reach of the river.
Area 4. --This area includes the Suwannee River basin, except for station 114 in area 1, and stations 108 and 109 in area 5. The western boundary of the area is indefinite, owing to an inadequate network of gaging stations on the small coastal streams between the Suwannee and Ochlockonee Rivers. Because of a lack of any conclusive evidence, the western boundary of area 4 has been arbitrarily drawn along the eastern watershed boundary of the Aucilla River.
The relation of mean annual flood to drainage area for the upper Suwannee River and tributaries are based on data for stations 104, 105, 106, 107, 110, 115, 116, and 119, some of which are in Georgia. This relation is shown in figure 14. The curve has a slope of 0. 70. The mean annual flood for Fenholloway River at Foley, station 119, is somewhat lower than that obtained from the relation curve. However, an extension of the lower end of the curve as a straight line with a slope of 0. 70 is considered to be more reliable than that indicated by the single Edging station with a short-term record. The relation as shown in figure 14 is the best estimate of mean annual floods of ungaged streams in area 4 in Florida. In Geological Survey Circular 100, "Floods in Georgia, Frequency and Magnitude, " the hydrologic areas were delineated somewhat differently and the relation curves were drawn to give the best results for Georgia, based on gaging stations in Georgia. Even though some of the Georgia gaging station data were used in this report and area 4 is adjacent to Georgia, the relation curve as defined in this report is the best fit of the data for Florida gaging stations and no adjustments were considered in order to obtain better conformity.

20 FLOODS IN FLORIDA
8,000
g 6,000
g 4,000
O 2,000
g 1,000iCurve for Area 3 is not applicable main stem of Oklawaha River below Silver Springs. I See figure 12 for this relation.
60 100 200 400Drainage area, in square miles
600"1,000
Figure 13. --Relation of mean annual flood to drainage area for areas 2A, 2B, and 3.
10,000
8,000
5,000
3,000
2,000
1,000
800
jX
ii=|i====:=ill:i!i:
--i-zf±:::::;;:S:h:ff- L < *
^ 129 -,'-- --- - - -X
/ T
i ^ X i
:fflgm|-f=i;;:=;i|tt^ji | :u
;-- ;; ;See figu:cLJ*6el to 1
f|=i
±rr
e 12 for relation oJ oean annual flood fo] Suwannee River below
1 1 III Illlllll!
0 n?A iGs
1 IlIMJIIMM
|::§l: |
r;1f i!nir drainage mainEllaville. --
II1IIIIIIHIIIIIIIIII :::iging station data in Area 4 .
1 1 1 1 L 1J I 1 " ' ' '"" ' ' ' 'ging station da
= = = = = = = = = = = § 1
ta in Area 5H'Mf100 200 300 600 1,000
Drainage area, in square miles
3,000
Figure 14. --Relation of mean annual flood to drainage area for areas 4 and 5.
Gaging stations 111, 113. and 117 on the main stem of Suwannee River below the confluence of the Withlacoochee River at Ellaville define flood characteristics slightly different from those of the smaller tribu taries. A plot of the mean annual flood versus drainage area for these stations is shown in figure 12 and provides the best basis for determining the mean annual floods at ungaged points along the main stem.
Area 5. --That part of northern Florida extending from the Aucilla River basin to the eastern watershed boundary of the Choctawhatchee River is designated as area 5. The relation of mean annual flood to drainage area is based on stations 108, 109, 120, 122, 124, 128, and 129, and is shown in figure 14. This curve has a slope of 0.70.

FLOOD FREQUENCY IN FLORIDA 21
Station 120 is in the upper Ochlockonee River basin in Georgia and the plotted data for this station show considerable departure from the relation curve. As indicated in the discussion above for area 4, the relation curve is more'applicable to conditions in Florida and therefore its location is more influenced by data from Florida gaging stations.
Records of discharge have been collected at only one station on the A pa lac hie o la River below the confluence of the Flint and Chattahoochee Rivers. The individual flood-frequency curve for this station is shown in figure 9. Mean annual flood for this station may be obtained from the frequency curve. Except for a long-term stage record at station 127, near Blountstown, there is no record on which to base any regional or composite relationships for the main stem of this river.
Area 6. --This area is drained by the Choctawhatchee River which flows in a southward direction from Alabama through Florida. Data for two stations, 132 and 133, in Florida and for several upstream stations in Alabama are available for defining the relationship between mean annual flood and drainage area. This relation is shown by the curve in figure 15. The slope of the curve is 0.70. Data for only two of the stations in Alabama, stations 130 and 131, are repeated in this report. Also from Geological Survey Circular 342, "Floods in Alabama, Magnitude and Frequency," data for two additional upstream stations were obtained for defining the lower limits of the curve. No flood data are available from small drainage areas in this section of Florida.
50,000
q 10,000
2,000Gaging station data in Area 6
Gaging station data in Area 7
100 1,000 Drainage area, in square miles
5,000
Figure 15. --Relation of mean annual flood to drainage area for areas 6 and 7.
Area 7. --This area includes the extreme northwestern part of Florida. The principal streams draining the area are the Yellow River, Blackwater River, Escambia River, and Perdido River. The relation between mean annual flood and drainage area is based on data from stations 135, 136, 138, 145, and 146 in Florida and several additional headwater stations in Alabama. The relation curve for this area is shown in figure 15. The slope of the curve is 0.70--the same as defined for each area in the State.
Frequency of annual flood stages
The foregoing analyses and discussion of flood frequencies pertain primarily to discharge data. In the c°astal lowlands and particularly in Southern Florida where the land surface is low and flat and has little slope, stage is an important index of flood conditions.
In addition to those stations at which both stage and discharge records have been collected, several sta tions on the St. Johns and Kissimmee Rivers, have been operated for a number of years for the collection of rec ords of stage only. Because of the importance of stage data on the main stem of these two rivers and the meajjer c°verage by discharge stations, flood-frequency plots of annual peak stages have been included in this report.

22 FLOODS IN FLORIDA
The base period for these stage-frequency analyses has been selected as the same 24-year period, 1930-53, as was used for the discharge-frequency studies. The methods of analysis and extension of all station records to the satne base period are also the same.
St. Johns River
Annual flood stages from stations 5, 6, 7, 8, 9, 10, 12, 16, and 18 on the main stem of the St. Johns River were available for defining the frequency-of-stage plots. Records of highwater elevations of outstanding floods at station 16 extend back to 1871 but there is some doubt as to the reliability of these historical data andalso of the gage datum. Correlation with other stations is too unreliable to extend the recurrence interval beyond the 24-year base period, 1930-53. Mean sea level stage curves for floods of 2.33-, 5-, 10-, and 30-year recurrence intervals are plotted against miles above the mouth of the river and are shown in figure 16. The curves in figure 16 have been drawn as straight lines connecting the plotted data, although the actual flood profile undoubtedly does not vary uniformly between stations. However, the approximate stages for various flood frequencies at ungaged sites along the main stem may be estimated from the curves shown in figure 16.
7 8
Station number
9 10 12 163 r-t 1818
260 240 220 200 180
Miles above mouth of river
160 140 120
Figure 16.--Variation of mean annual, 5-, 10-, and 30-year flood stages with for main stem of St. Johns River, Florida.
channel distance
Kissimmee River
Annual flood-stage records were available from stations 58, 59, 66, and 67 on the main stem of the Kissimmee River; the stage-frequency relations were based on these records. Mean sea level stage curves for floods of 2.33-, 5-, 10-, and 30-year recurrence intervals are plotted against miles above the mouth of the river and are shown in figure 17. This relation provides the best basis for estimates of stage for floods of various fre quencies at ungaged sites along the main stem of the Kissimmee River.

FLOOD FREQUENCY IN FLORIDA 23
58
Station number
59 66 675Q . -_ . -----
8 _S.
55---- jr; -I ̂ ^ ±- IT"""" --- + -------
v S SK, \ "^ ^
*S ^ k. v.Sk S
> S S^, h_ ^ ^ *
:_.~:~,,~"' ~~~ s. ^p\ /,* ??'- - - - % *^ \/ 7 <T^____________________5 Sj^z 5-jr
- H \ O^ Mea
J -L Sk / i_
^ / \
It-* i ^i ^ ^ \
V \ ^L
V. S> , \ \
^5 \_
S s.w
_ ^4U
25: __ _ "____: _ :_:__ _ _ _:::_
Par flood! ____ _ __ _______I I I 1 i I
L
"^ ^
^ >
L- 5C S
i_!S ^S _.
^ ^ 1sX k ^ S
^ \ V
Si ^ Si _^^ J X V_. s ^
L. ^ S_, ^ ss .s s
_ _..._.S__.[-i__._--__.--. -._----.- _L t ^ V
c .J \ 5 __ _.
^ __ fc.
s _, ^S c S ^s ^s 5
S \r SI
s Sk \
^ 5 ' .
' r
60 50 40 30 20
Miles above mouth of river (at Lake Okeechobee)
10
Figure 17. --Variation of mean annual, 5-. 10-, and 30-year flood stages with channel distance for main stem of Kissimmee River, Florida.
Summary of flood-frequency relationships
Composite frequency curves for floods with recurrence interval of 50 years or less have been developed for two flood regions in Florida. These flood regions, designated A and B, are shown in figure 6 and on plate 1. The flood frequency curves have been developed by expressing flood magnitudes as ratios to the mean annual flood. Curves applicable to regions A and B are shown in figures 7 and 8 respectively. Flood data are inadequate for de fining the flood-frequency relation applicable to southern Florida.
To estimate the mean annual flood in regions A and B, 7 hydrologic areas have been delineated as shown in plate 1, and in each area the mean annual flood has been expressed as a function of the drainage area. The curves of relation between mean annual flood and drainage area in these areas are shown in figures 11, 13-15, and are combined in figure 18. As shown by relations in figure 12, the main stems of the major rivers do not have the same characteristics as the tributary streams. The relation of the mean annual flood along the main stem of these rivers has been shown as a plot of the mean annual flood against the drainage area. Such relations are required for the St. Johns River main stem, Oklawaha River main stem below Silver Springs, Kissimmee River main stem, the Withlacoochee River main stem, and the lower Suwannee River main stem.

FLOODS IN FLORIDA
These curves are not applicable to the main stems of the following major streams:
St. Johns RiverOklawaha River below Silver SpringsKissimmee RiverWithlacoochee RiverSuwannee River below EllavilleApalachicola River
i' See figure 12 for relations of mean annual flood to drainage area forthese major streams. I..-J- - ^
100 200 500 1,000 2,000 5,000 10,000 Drainage area, in square miles
Figure 18. --Summary of relations of mean annual flood to drainage area for Florida.
The following procedure is used to estimate the flood magnitude for any selected recurrence interval within the limits of the frequency curves at a particular site on streams in Florida:
1. Determine, in square miles, the drainage area above the site.2. Determine the total surface area of lakes connected with the drainage system and express this
lake area as a percentage of the total drainage area above the site. (This step not required for the exceptions shown in figure 18).
3. Determine from plate 1 the hydrologic area in which the stream lies.4. Determine the unadjusted mean annual flood from figure 18, using the hydrologic area
determined in step 3.5. Determine the attenuation factor from figure 10. For drainage basins devoid of lakes this
factor is 1.00.6. Adjust the mean annual flood as obtained in step 4 for attenuation by multiplying by the
attenuation factor from step 5.7. Determine from plate 1 the flood region in which the stream lies.8. Determine from figure 7 or 8 the flood ratio for the desired recurrence interval, using
the curve for the region determined in step 7.9. Multiply the mean annual flood from step 6 by the flood ratio from step 8 to obtain the /
desired discharge. '
To estimate the flood magnitude at ungaged sites on the main stems of the large rivers that have been excepted from figure 18, obtain the mean annual flood from the relations shown in figure 12 which define the mean annual floods directly without adjustments for attenuation. Steps 2, 5, and 6 as outlined above are therefore not required for the computations when the mean annual flood is determined from figure 12.

MAXIMUM FLOODS KNOWN 25
If desired, a complete frequency graph may be defined by plotting values determined in the above manner for a number'of different recurrence intervals.
It is recommended that the above method be followed to determine magnitude and frequency at gaged sites as well. The results based on a composite frequency curve and an average relation between mean annual flood and drainage area should be more reliable than those obtained from a frequency curve based on data for the individual
site alone.
MAXIMUM FLOODS KNOWN
Maximum flood stages and discharges known for Florida streams and lakes are shown in table 3. Dis charges are given both in cubic feet per second (cfs) and in cubic feet per second per square mile; stages are given as elevation in feet above the zero of the gage (gage height) and above mean sea level. Nearly all the tabulated data show the maximum occurring during the period of record at a gaging station. At some gaging stations and at several miscellaneous sites, the data for the maximum known flood occurring before the period of record have also been included in the table, where a reliable figure was determined. The index numbers in the first column of the table correspond to those'for stations described more fully in the section of this report entitled "GAGING STATION RECORDS. " The stations are listed in downstream order. At stations affected by backwater, the peak gage height and peak discharge did not always occur at the same time and were shown on separate lines.
The comparison of maximum known floods in each combination of hydrologic areas and flood region A with the corresponding flood of 30-year recurrence interval is shown in figure 19. Figure 20 (a. b. and c) shows the comparison of maximum known floods in region B with the corresponding 50-year recurrence interval. These plots provide a rough means of judging the possible frequencies of the maximum flood.
100
4)
"e
' 20
a.
L9
.< *: <
c H
«r 20000u mjs0a"° 101
<a£
40 50
1 __
)
3
1
^-^" ~~«»
r-^. **^^
20 1( Area 1
Legend Flood peak on stream with 1 no attenuation by lakes andFlood peak attenuated by la! swamps above gaging station
^-^
~-^
"" ^
0
)0
Lttle swampces an
1
^-^
OIs d
0
6
4
2
^ ^
200
y/O
O
500
*-V
40
20
10
2
1 1
100 200 500 1000 2000 4000 Area 2A Oklawaha River below
Silver Springs Drainage area, in square miles
, ^
o
00 2C
10
5
3100
"- ^ "--.
0
» ,
o
" - -
>
»
o
0 1000 Area 3
^ ^^""*-0
2000
0 2000 10St. Johns River below
Lake Harney
,000
Figure 19. --Relation of maximum to 30-year flood in region A.

26 FLOODS IN FLORIDA
200
100
41
"a41
t> 20
* 10
U-l
3
g 200m O
cd
* 100
50
o
O
(
^^
.O
<
2 10
S\.
4
^-^
-v^.
Su mu zoo 500Area 2B
Drainage
^
1
o0
10
6
4.
t
9
(
^,
C
~-
c
Legend Flood peak on stream with litt
no attenuation by lakes and svi
o Flood peak attenuated by lakes swamps above gaging station
"---^
i
0 <
o
100 Area 1
-x*
O
^,.-"
tuuu 2TOCT 4000 Kissimmee River
area, in square miles
.
^\
V*
1200
2C
1C
65
^*~«.
ti
g
--^, .^
*
0
^"
]e or amps
and
^>
1000
)_
^-^.
o
^-^
2000
00 1000 2000 3000St. Johns River above
Lake Harney
Figure 20a. --Relation of maximum to 50-year flood in region B (areas 1, 2B and Kissimmee River and St. Johns River above Lake Harney).
The attenuation of flood peaks by storage in lakes and swamps is clearly shown in the plots for several areas in figures 19 and 20. For areas 1 and 3 in figure 19 and for area 1 in figure 20a the relations for the 30- or 50-year peak discharge is based on data from gaging stations relatively devoid of lakes or from data adjusted by the attenuation factor shown in figure 10. The gaging station data plotted in these figures represent the actual maximum known floods. Thus for a tributary stream with many lakes and swamps in the drainage basins, the re lations shown in these figures represent enveloping curves that will rarely be equaled. The relations and the plotted data shown for several of the larger rivers in the lake region on the Peninsula are based on existing con ditions without adjustment for storage.

MAXIMUM FLOODS KNOWN 27
20
10
400 1000 2000 Withlacoochee River
80
2C
3000 id100
20
10
4000 10,000200
Area 41000 2000 3000 Suwannee River
below Ellaville300
200
100
20
10
<
^
^-^
~-^^~.
a
4*^ " ».
"^
Legend Flood peak on stream with lit
no attenuation by lakes and s\o Flood peak attenuated by lake!
swamps above gaging station
Area 5 Drainage area, in square miles
Figure 20b. Relation of maximum to 50-year flood in region B (areas 4, 5 and Withlacoochee River and Suwannee River below Ellaville).
28 FLOODS IN FLORIDA
200
100
"a
u3
B
0. g
S 20B
U
S. 400 u«
u| 200 u
H
S> 100uB i-l o
£
20
^
*
*. fc^"^*^
^*~*<^^ ^~ -^.
"~~ ^.^~^,
.
---~.^-^
^^^-.
^u 100 200 1000 2000 lOpOO Area 6
*
,
\.
m
^-^
» ^~~- »^_
^ »«,
*- .- ^^
^*^> *^^."^"^^
"^,
»0 100 200 1000 2000 10,000 Area 7
Drainage area, In square miles
Figure 20c. --Relation of maximum to 50-year flood in region B (areas 6 and 7).

MAXIMUM FLOODS KNOWN
Table 3. Maximum known stages and discharges prior to 1956 in Florida
29
No.Stream or lake and place
of determination
Drainagearea
(sq mi)
Periodof
known floods
Maximum known flood
DateGageheight
(ft)
Elevation above msl
Discharge
CfsCfsper
(sq mi)
ST. MARYS RIVER BASIN
North Prong St. Marys River at Monlac, Ga.
South Prong St. Marys River at Glen St. Mary, Fla.
St. Marys River near Macclenny, Fla---
ST. JOHNS RIVER BASIN
St. Johns River headwaters near Vero Beach, Fla.
St. Johns River headwaters near Kenansvllle, Fla.
Jane Green Creek near Deer Park, Fla--
St. Johns River near Melbourne, Fla---
Lake Washington near Eau Gallic, Fla--
160
150
720
203
442
248
874
9 Lake Polnsett near Cocoa, Fla-
10 St. Johns River near Christmas, Fla 1,418
11 Econlockhatchee River near Chuluota, 260 Fla.
12 St. Johns River above Lake Harney, 1,910 near Geneva, Fla.
13 St. Johns River at Osceola, Fla - 1,950
Lake Maltland at Winter Park, Fla-
14 Lake Jessup Outlet near Sanford, Fla-
15 St. Johns River above Lake Monroe, 2,320 near Sanford, Fla.
16 St. Johns River near Sanford, Fla 2/420
17 Weklva River near Sanford, Fla-
18 St. Johns River near DeLand, Fla 2,960
19 Lake Apopka at Winter Garden, Fla 130
20 Apopka-Beauclalr Canal nr. Astatula, Fla.
21 Lake Dora at Mount Dora, Fla-
22 Dead River near Tavares, Fla-
23 Lake Mlnnehaha at Clermont, Fla-
Palatlakaha Creek at Groveland, Fla--
24 Palatlakaha Creek near Mascotte, Fla 160
25 Halnes Creek at'Llsbon, Fla 640
26 Lake Weir at Oklawaha, Fla-
27 Oklawaha River at Moss Bluff, Fla 910
28 Oklawaha River near Ocala, Fla 1,100
29 Silver Springs near Ocala, Fla-
30 Oklawaha River near Conner, Fla 1,180
31 Oklawaha River at Eureka, Fla 1,420
Newnans Lake near Galnesvllle, Pla-
1921-34; 1950-55
1947-55
1^27-55
1942-55
1942-55
1353-55
1939-55
1942-55
1941-55
1933-55
1935-55
1941-55
1941-47
1945-52
1941-47
1941-47
1871-1920 1920-55
1935-55
1934-55
1936-55
1936-55
1943-55
1945-55
1945-55
1945-55
1943-55
1936-55
1944-55
1930-55
1933-55
1930-46
1930-52
1936-52
Sept. 19, 1928
September 1947
Sept. 25, 1947
Oct. 12, 1947
October 1948
Oct. 9 or 10, 1953
Oct. 12, 1953
Oct. 12, 13, 1953
Oct. 11, 1953
Oct. 12, 1953
Sept, 24, 1948
Oct. 14, 1953
Sept. 21, 1945
Sept. 16, 1945
July 1930 Sept. 26, 1945
October 1924 Sept. 28, 1945
1880Oct. 15, 1953
Sept. 17, 1945
Oct. 11, 12, 1953
Oct. 12, 1936
Unknown
September 1926 Jan. 4-7, 1954
1926Jan. 1-4, 1954
Oct. 9, 10, 1953
Sept. 17, 1945
Oct. 4, 5, 1945 Oct. 11, 12, 1953
1926Jan. 3-5, 1954
January 1938
Jan. 11, 12, 1954
Sept. 6, 1933 June 15, 1934
Sept. 6, 1933 Nov. 2-4, 1950
Sept. 6, 1933
Sept. 7, 1933
Mar. 12, 1948
16.7
13.0
22.29
8.81
8.52
8.65
9.47
7.68
12.50
10.59
18.09
10.62
9.62
3.04
7.76
7.62
8.61
5.60
7.17
5.24
7.52
7.12
4.24
49.49
5.52
5.50
9.14
11.00
7.88
109.3
90.1
62.29
27.37
25.54
27.20
20.69
20.07
17.56
12.21
20.23
10.62
9.62
67.0
8.4 7.76
8.5 7.62
13.288.52
6.06
C 69.3
67.0
65.865.40
66.164.54
98.84
97.43
96.66
65.663.46
C59.6
49.49
42.04
44.46
40.93
26.44
71.21
a 6,060
6,700
28,100
6,880
8,850
11,700
10,000
2,060
b!7,100
458
819
1,060
1,810
1,150
3,700
6,260
37.9
44.7
39.0
27.7
10.1
8.2
38.5
5.8
2.9
1.3
1.2
1.6
3.1
4.4
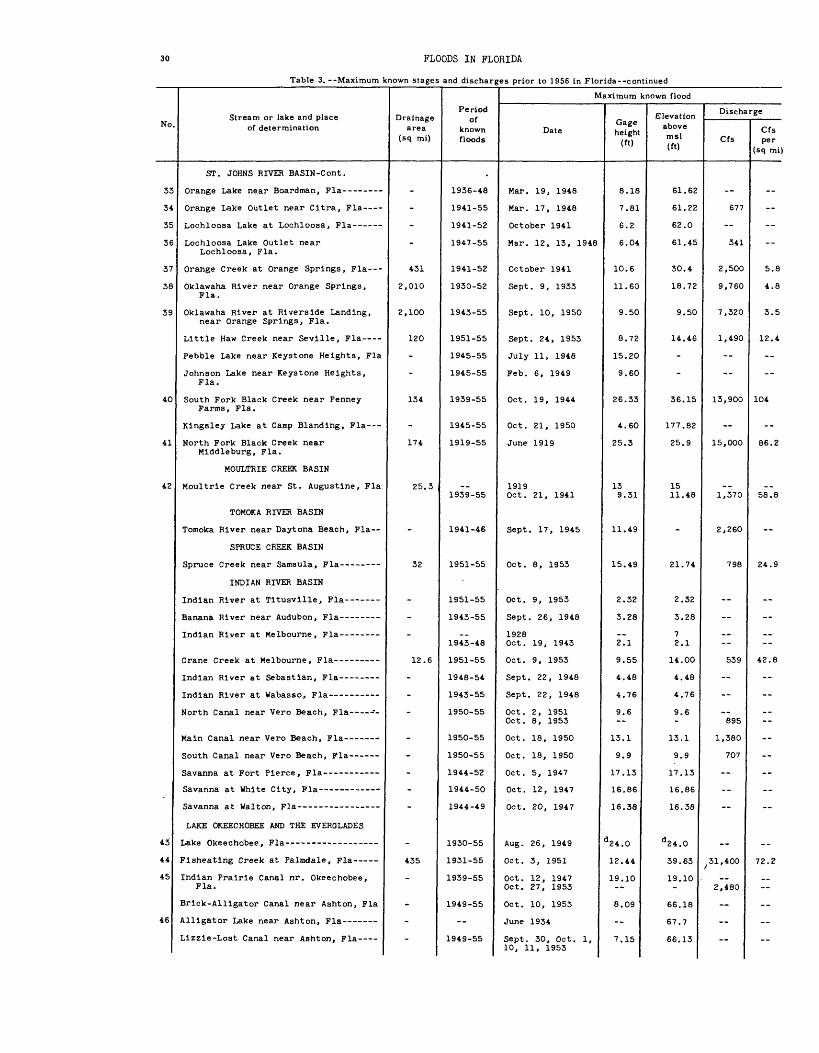
30 FLOODS IN FLORIDA
Table 3. --Maximum known stages and discharges prior to 1956 in Florida continued
NoStream or lake and place
of determinationDrainage
area (sq mi)
Periodof
known floods
Maximum known flood
DateGageheight
(ft)
Elevation above msl
Discharge
CfsCfs per
(sq mi)
42
ST. JOHNS RIVER BASIN-Cont.
Orange Lake near Boardman, Fla-- --
Orange Lake Outlet near Cltra, Fla -
Lochlooaa Lake at Lochlooaa, Fla----
Lochlooaa Lake Outlet near Lochlooaa, Fla.
Orange Creek at Orange Springs, Fla -
Oklawaha River near Orange Sprlnga, Fla.
Oklawaha River at Rlveralde Landing, near Orange Sprlnga, Fla.
Little Haw Creek near Seville, Fla
Pebble Lake near Keyatone Heights, Fla
Johnaon Lake near Keyatone Helghta, Fla.
South Fork Black Creek near Penney Farina, Fla.
Klngsley Lake at Camp Blandlng, Fla-
North Fork Black Creek near Mlddleburg, Fla.
MOULTRIE CREEK BASIN
Moultrle Creek near St. Auguatlne, Fla
TOMOKA RIVER BASIN
Tomoka River near Daytona Beach, Fla
SPRUCE CREEK BASIN
Spruce Creek near Samaula, Fla
INDIAN RIVER BASIN
Indian River at Tltuavllle, Fla
Banana River near Audubon, Fla
Indian River at Melbourne, Fla
Crane Creek at Melbourne, Fla
Indian River at Sebaatlan, Fla
Indian River at Wabaaso, Fla
North Canal near Vero Beach, Fla
Main Canal near Vero Beach, Fla
South Canal near Vero Beach, Fla
Savanna at Fort Pierce, Fla
Savanna at White City, Fla
Savanna at Walton, Fla
LAKE OKEECHOBEE AND THE EVERGLADES
43 Lake Okeechobee, Fla
44 Flaheatlng Creek at Palmdale, Fla
45 Indian Prairie Canal nr. Okeechobee, Fla.
Brick-Alligator Canal near Ashton, Fla
46 Alligator Lake near Aahton, Fla
Llzzle-Loat Canal near Ashton, Fla -
431
2,010
2,100
120
134
174
25.3
32
12.6
435
1936-48
1941-55
1941-52
1947-55
1941-52
1930-52
1943-55
1951-55
1945-55
1945-55
1939-55
1945-55
1919-55
1939-55
1941-46
1951-55
1951-55
1943-55
1943-48
1951-55
1948-54
1943-55
1950-55
1950-55
1950-55
1944-52
1944-50
1944-49
1930-55
1931-55
1939-55
1949-55
1949-55
Mar. 19, 1948
Mar. 17, 1948
October 1941
Mar. 12, 13, 1948
October 1941
Sept. 9, 1933
Sept. 10, 1950
Sept. 24, 1953
July 11, 1948
Feb. 6, 1949
Oct. 19, 1944
Oct. 21, 1950
June 1919
1919Oct. 21, 1941
Sept. 17, 1945
Oct. 8, 1953
Oct. 9, 1953
Sept. 26, 1948
1928Oct. 19, 1943
Oct. 9, 1953
Sept. 22, 1948
Sept. 22, 1948
Oct. 2, 1951 Oct. 8, 1953
Oct. 18, 1950
Oct. 18, 1950
Oct. 5, 1947
Oct. 12, 1947
Oct. 20, 1947
Aug. 26, 1949
Oct. 3, 1951
Oct. 12, 1947 Oct. 27, 1953
Oct. 10, 1953
June 1934
Sept. 30, Oct. 1, 10, 11, 1953
8.18
7.81
6.2
6.04
10.6
11.60
9.50
8.72
15.20
9.60
26.33
4.60
25.3
139.31
11.49
15.49
2.32
3.28
2.1
9.55
4.48
4.76
9.6
13.1
9.9
17.13
16.86
16.38
'24.0
12.44
19.10
8.09
7.15
61.62
61.22
62.0
61.45
30.4
18.72
9.50
14.46
36.15
177.82
25.9
1511.48
21.74
2.32
3.28
7 2.1
14.00
4.48
4.76
9.6
13.1
9.9
17.13
16.86
16.38
3 24.0
39.63
19.10
66.18
67.7
66.13
677
341
2,500
9,760
7,320
1,490
13,900
15,000
1,370
2,260
798
539
895
1,380
707
31,400
2,480
5.8
4.8
3.5
12.4
104
86.2
58.8
24.9
42.8
72.2

MAXIMUM FLOODS KNOWN
Table 3. --Maximum known stages and discharges prior to 1956 in Florida--continued
31
No
47
48
49
50
51
52
53
54
55
56
57
58
59
60
61
62
Stream or lake and place of determination
LAKE OKEECHOBEE AND THE EVERGLADES-Cont .
Myrtle -Mary Jane Canal nearNarcoosaee, Pla.
Mary Jane Lake near Narcooaaee, Pla
Hart Lake near Narcooasee, Pla --------
Lake Conway near Plnecastle, Pla- -
Eaat Tohopekallga Lake at St. Cloud,Pla.
Eaat Tohopekallga-Tohopekallga Canalnear St. Cloud, Pla.
Lake Tohopekallga at Klssliranee, Pla -
Tohopekallga-Cypreaa Canal nearSt. Cloud, Pla.
Cypress Lake near St. Cloud, Pla- -----
Lake Gentry near St. Cloud, Pla -----
Canoe Creek near St. Cloud, Pla -------
Lake Butler at Wlndermere, Pla- -----
Cypress Creek at Vlneland, Pla -----
Reedy Creek near Loughman, Pla- -----
Lake Hatchlneha near Halnes City, Pla-
Catflah Creek near Lake Walea, Pla -
Hatchlneha-Klaalmmee Canal nearLake Walea, Pla.
Cypress-Klaalmmee Canal near LakeWalea, Pla.
Lake Klaalnunee near Lake Walea, Pla-
Weohyakapka-Roaalle Canal nearLake Wales, Pla.
Klaslmmee River below Lake Klaalmmee,Pla.
Klaalmmee River at Port Klaalmmee , Pla
Crooked Lake near Babaon Park, Pla --
Lake Clinch at Frostproof, Pla -------
Reedy Lake Outlet near Frostproof, Pla
Lake Arbuckle near Avon Park, Fla -
Lake Lotela at Avon Park, Pla --
Lake Letta at Avon Park, Fla ---------
Arbuckle Creek near DeSota City, Pla--
Rex Beach Lake at Sebrlng, Fla-
Lake Josephine near DeSoto City, Fla--
Lake Placid near Lake Placid, Fla
Mirror Lake near Lake Placid, Pla
Lake June-ln-Winter near Lake Placid,Fla.
Drainage area
(sq mi)
111
_
-
_
300
-
_
ac cob , D
31.0
_
58.9
_
_
-
_
1,609
-
- .
62.2
_
385
-
Period of
known floods
1949-55
1949-55
1941-55
1952-55
1941-55
_1950-55
1942-55
1942-55
T QA *> ^^iy*t OD
1949 55
1949-55
1933-35
1945-55
1 Q^Q R^X9tJ J «Js?
1942-55
1947-55
1949-55
1950-55
1942-55
1930-55
1941-55
1945-55
1947-55
1946-55
__1942-55
1950-55
1951-55
1939-55
1945-55
1946-55
1945-55
1951-55
1945-55
Maximum known flood
Date
Oct. 1, 1953
Oct. 1, 10-12,1953
Sept. 20, 1945
UnknownDec. 5-8, 1953
July 1930 .Oct. 12, 13, 1953
Sept. 19, 1945Oct. 13, 1953
Oct. 10, 11, 1953
Oct. 9, 1953
Oct. 12, 13, 1953
Oct. 10, 1953
1 Q^RX9o O
Oct. 19, 1950
September 1926 Sept. 17, 1945
. Sept. 16, 1945
Hr» * 99 9^ 1 QAA UU U . ££ , £**, A3**,
Sept. 20, 21, 1947Aug. 30, 1953
1934Oct. 14, 15, 19,1953
Oct. 9, 1953
Oct. 1, 1953
Oct. 16, 1953
September 1947
September 1933
Oct. 5 or 6, 1948Oct. 9, 1953
Oct. 11, 1953
Oct. 8, 1948
Oct. 10, 1948
Oct. 5, 1948
1926, 1928Sept. 24, 1948
Sept. 30, 1953
Oct. 7, 1953
Sept. 23, 1948
1941Sept. 19, 1947
Sept. 26, 1948
Sept. 25, 1948
Oct. 10, 1953
October 1950
Gageheight
(ft)
7.67
7.33
9. 13
19.20
__10.63
__9.48
58.62
10.25
8 -TO. oo
5.71
11.4
4.88
3.83
4.08
__9.61
5.81
__
__
9.77
_
__13.16
12.89
8.30
10.21
4.37
__6.7
8 QO. 3t
5.07
8.71
7.45
11.1
1 ^ QAID . yo
10.52
12.2
Elevation above msl(ft)
64.75
63.99
C A A7b4 ,o/
e 90.488.20
62.1762.01
_61.80
58.62
59.01
57.16
CX -i -xbo . lo
61.759.6
101.30101.28
100.03
-68.57
57.056.84
78.51
_
_
56.71
62.8
_56.64
50.92
124.01
110.21
80.42
58.758.2
T r\& Q^JLUo * oo
101.38
44.22
104.1103.76
76.8
95.64
QA QTy* , 3o
77.6
Discharge
Cfs
703
fl,1401,110
2,650
1,550
181
530
__
191
2,820
3,230
8,820
--
166
__"
7,380
-
Cfsper
(sq mi)
6.3
_
__
._3.7
__
17.9
--
5.8
___
3.2
__
__
_
5.5
2.7
__--
19.2

32 FLOODS IN FLORIDA
Table 3. --Maximum known stages and discharges prior to 1956 in Florida - -continued
No.
63
64
65
66
67
68
69
70
71
72
73
74
75
76
77
78
79
Stream or lake and place of determination
LAKE OKEECHOBEE AND THE EVERGLADES-Cont.
Josephine Creek near DeSoto City, Fla-
Graaay Lake near Lake Placid, Fla -----
Lake Huntley at Lake Placid, Fla ------
Lake Clay at Lake Placid, Fla ----- -
Lake latokpoga near DeSoto City, Fla
latokpoga Canal near Cornwell, Fla
Klaslmmee River near Cornwell, Fla ----
Klsslmmee River near Okeechobee, Fla
St. Lucle Canal at Lake Okeechobee, Fla.
West Palm Beach' Canal at Canal Point, Fla.
West Palm Beach Canal at 20-mile bend, Fla.
West Palm Beach Canal at West Palm Beach, Fla.
Hlllsboro Canal at Belle Glade, Fla
Hlllsboro Canal at Shawano Plantation, Fla.
Hlllsboro Canal at Indian Run near Deerfleld Beach, Fla.
Indian Run at Hlllsboro Canal near Deerfleld Beach, Fla.
Hlllsboro Canal at Range Line Road near Deerfleld Beach, Fla.
Hlllsboro Canal near Deerfleld Beach, Fla.
North New River Canal at South Bay, Fla.
North New River Canal at 26-mile bend, near Fort Lauderdale, Fla.
North New River Canal near Fort Lauderdale, Fla.
South New River Canal at Davle, Fla ---
Snake Creek Canal at North Miami Beach, Fla.
Blscayne Canal at North Miami, Fla -
Little River Canal at N.W. 7th Ave., Miami, Fla.
Miami Canal above broken dam, near Miami, Fla.
Miami Canal at Pennsuco, near Miami, Fla.
Miami Canal Russian Colony Canal, near Hlaleah, Fla.
Miami Canal at water plant, Hlaleah, Fla.
Miami Canal at N.W. 27th Ave., Miami, Fla.
Tamlaml Canal outlets, Miami to Monroe, Fla.
Drainage area
(sq mi)
109
624
2,703
2,886
-
-
-
-
-
-
-
-
-
-
-
-
-
-
-
-
-
-
-
-
-
-
-
Period of
known floods
1946-55
1951-55
1951-55
1951-55
1936-55
1933-55
1928-55
1928-55
1931-51
1940-55
1947-50
1940-55
1929-52
1947-53
1947-55
1947-52
1939-52
1940-55
1942-52
1940-55
1947-55
1947-55
1946-55
1946-55
1941-55
1926-55
1941-55
1940-55
1945-55
1939-55
Maximum known flood
Date
Sept. 23, 1948
Sept. 19, 1953
Oct. 13, 1953
Oct. 14, 1953
September 1945
Sept. 22, 1948 Oct. 12, 1953
Oct. 12, 13, 1953
August 1928
Nov. 2, 6, 1951
June 15, 1942 Oct. 23, 1947 Mar. 18, 1948
Oct. 16, 17, 1947
Oct. 23, 24, 1924
Feb. 14, 1940 Sept. 9, 1940 Oct. 15, 16, 1947
Oct. 12, 13, 1947
Oct. 12, 1947
Oct. 12, 1947
Oct. 12, 1947
Oct. 17, 1944 Oct. 12, 1947
July 27, 28, 1926 June 10, 1942 Sept. 30, 1947
Oct. 12, 1947
Oct. 15, 1929 Oct. 17, 1947 Nov. 19, 1947
Oct. 21, 1947
Sept. 22, 1948
Oct. 15, 1947
Oct. 15, 1947
Oct. 12, 1947
Oct. 12, 1947
Oct. 12, 1947
Oct. 15, 1947
Oct. 11, 1947
Oct. 12, 1947
Gage height
(ft)
11.56
25.36
15.50
10.50
11.41
11.48
30.3
18.54
17,48
1 13.20
16.71
17.81
15.54
15.95
14.70
112.10
20.56
1 12.97
i»:»17.78
^4.24
1 5.43
14.68
10.05
9.58
8.8
7.34
4.57
Elevation above msl (ft)
64.55
94.26
84.42
79.44
43.22
41.12
36.12
28.9
-
18.54
17.48
1 13.20
16.71
16.37
15.54
15.95
14.70
112.10
20.56
112.97
110.83
17.78
14.24
15.43
14.68
9.82
9.00
8.7
7.33
4.57
-
Discharge
Cfs
1,780
2,040
20,000
g7,470
ghl,760
6 817
8,570
6481
~
-
63,490
6h 404 61,040
5,400
63,280
--
^,170
617,100
Cfs per
(sq ml)
16.3
3.3
^ 6.9
-
--
~~
-
--

MAXIMUM FLOODS KNOWN 33
Table 3. Maximum known stages and discharges prior to 1956 in Florida continued
No
80
81
82
83
84
85
86
87
88
89
90
Stream or lake and place of determination
LAKE OKEECHOBEE AND THE EVERQLADES-Cont .
Tamlaml Canal at 40-mile bend, Pla
Tamlaml Canal at P. E.G. Railway, near Miami, Fla.
Tamlaml Canal at Red Road, Miami, Fla-
Coral Gables Canal at Red Road, Coral Gables, Fla.
Snapper Creek Canal at Coral Gables, Fla.
Barron River Canal near Everglades, Fla.
Lake Trafford near Inunokalee, Fla
Imperial River near Bonlta Springs, Fla.
Estero River at Estero, Fla -
Mulock Creek near Estero, Fla
Llne-A Canal near Fort Myers, Fla
Caloosahatchee Canal at Moore Haven, Fla.
Orange River near Fort Myers, Fla
PEACE RIVER BASIN
Lake Rochelle near Lake Alfred, Fla
Conlne Lake at Florence Villa, Fla
Drainage Canal west of Dundee, Fla
Mountain Lake near Lake Wales, Fla -
Peace Creek Marah outlet near Alturas, Fla.
Lake Mariana near Auburndale, Fla- --
Lake Jessie near Auburndale, Fla
Lake Hartrldge at Winter Haven, Fla
Deer Lake near Winter Haven, Fla
Lake Howard at Winter Haven, Fla
Lulu Lake at Elolse, Fla
Lulu Lake Outlet at Blolse, Fla-
Lake Parker at Lakeland, Fla
Arlana Lake at Auburndale, Fla
Peace River at Bartow, Fla
Peace River at Zolfo Springs, Fla
Little Charley Bowlegs Creek near Sebrlng, Fla.
Charlie Apopka Creek near Zolfo Springs, Fla.
Charlie Apopka Creek near Gardner, Fla.
Peace River at Arcadia, Fla
Joahua Creek at Nocatee, Fla -
Horse Creek near Arcadia, Fla -
Drainage area
(sq mi)
-
-
-
-
-
-
-
-.
-
83.4
-
-
50
-
150
-
26
390
840
32.4
-
330
1,370
115
205
Period of
known floods
1939-55
1947-55
1940-55
1946-55
1945-50
1941-55
1940-54
1942-48
1938-55
1936-46
1946-55
1946-54
1947-55
1945-55
1928*55
1946-55
1946-54
1946-55
1946-55
1945-55
1946-55
1946-55
1949-55
1945-48
1939-55
1933-55
1952-55
--
1950-55
1912-55
1950-55
1950-55
Maximum known flood
Date
Oct. 12, 1947
Oct. 14, 1947
Oct. 15, 1947
Oct. 11, 1047
Oct. 11, 1947
1947
Sept. 18, 1947
June 15, 1936 Sept. 12, 1940
June 1936
June 1936
Sept. 19, 1947
Dec. 8, 1945
June 15, 1936
Sept. 27, 1948
Sept. 19, 1947
Sept. 22, 1948
Oct. 8, 15, 1948
1928
Oct. 1, 1948
Oct. 3, 1948
Sept. 30, 1948
Sept. 7, 1953
Sept. 28, 1948
Oct. 7, 1949
Aug. 25, 1948 Oct. 10, 1953
Oct. 12, 1953
Aug. 28, 1946
Sept. 24, 1947
Sept. 6, 1933
Oct. 10, 1953
October 1947
1928 Oct. 10, 1953
1912
Oct. 10, 1953
September 1948 Oct. 2, 1951
Gage height
(ft)
1-8.27
6.00
is. 28
is. 50
6.60
9.71-"
13.40
9.86
10.63
7-. 3 7
9.04
13.3
17.80
12.64
12.76
20.96
12.77
12.26
*11.18
5.28
5.80
6.45
20.05
m!6.83
17.85
18.80
16.84
Elevation above msl (ft)
JlO.3
iS. 27
6.00
is. 28
i3. 50
7.0
22.60
13.4
14.0
9.0
9.71
15.11
129.86
130.63
121.45
116.80
111.0
137.80
132.64
132.76
140.96
132.77
132.26
*131.18
131.78
97.01
55.25
m79.15
51.0
45.9 39.51
26.6
22.7*4
28.8 27.80
Discharge
Cfs
--
--
-
2,890
g5,660
5,300
251
2,540
-
86
4,140
26,300
682
-
6,640
43,000
8,670
6,680
Cfs per
(sq mi)
-
-
63.5
4.6
16.9
3.3
10.6
31.3
21.0
20.1
31.4
75.3
32.6

34 FLOODS IN FLORIDA
Table 3. --Maximum known stages and discharges prior to 1956 in Florida--continued
No
91
92
93
94
95
96
Stream or lake and place of determination
MIAKKA RIVER BASIN
Upper Lake Miakka near Sarasota, Fla--
Miakka River near Sarasota, Fla -----
Lower Lake Miakka near Sarasota, Fla--
MANATEE RIVER BASIN
Manatee River near Bradenton, Fla-- -
LITTLE MANATEE RIVER BASIN
Little Manatee River near Wimauma, Fla
ALAFIA RIVER BASIN
North Prong Alafia River at Keysville, Fla.
Alafia River at Lithia, Fla -------
HILLSBOROUGH RIVER BASIN
Blackwater Creek near Knights, Fla -
Hillsborough River near Zephyrhills, Fla.
Hanna Lake near Lutz, Fla------- --
Hanna Lake Outlet near Lutz, Fla-- --
Lake Stemper near Lutz, Fla------- --
Hillsborough River near Tampa, Fla --
Lake Hobbs near Lutz, Fla- ___-
Cooper Lake near Lutz, Fla--- -
Hutchins Lake outlet near Lutz, Fla---
Platt Lake near Lutz, Fla
Drainage Ditch at Bearss Ave. near Sulphur Springs, Fla.
SWEETWATER CREEK BASIN
Lake Magdalene near Lutz, Fla-
Bay Lake near Sulphur Springs, Fla
Lake Ellen near Sulphur Springs, Fla--
Sweetwater Creek near Sulphur Springs, Fla.
Lake Carroll near Sulphur Springs, Fla.
ROCKY CREEK BASIN
Rocky Creek near Sulphur Springs, Fla-
ALLIGATOR CREEK BASIN
Alligator Creek near Safety Harbor, Fla.
ALLEN CREEK BASIN
Alien Creek near Largo, Fla----
LONG BAYOU BASIN
Seminole Lake Outlet near Largo, Fla--
MCKAY CREEK BASIN
McKay Creek at Walsingham Reservoir, near Indian Rocks, Fla.
McKay Creek at Taylor Ave. Reservoir, near Largo, Fla.
Drainage area
(sq mi)
235
90
145
175
335
110
220
650
2.7
12
-
-
6.4
-
35
9.0
0.8
14
-
-
Period of
known floods
1946-55
1936-55
1946-55
1939-55
1939-55
1950-55
1933-55
1951-55
1939-55
1946-55
1946-51
1946-55
1933-55
1946-55
1946-55
1946-52
1946-55
1946-55
1946-55
1946-55
1946-55
1951-55
1946-55
1953-55
1949-55
1947-51
1950-55
1944-55
1944-55
Maximum known flood
Date
Sept. 20, 1947
Sept. 21, 1947
Sept. 21, 1947
Sept. 18, 1947
June 24, 1945
Sept. 7, 1950
Sept. 7, 1933
Sept. 27, 1953
Sept. 19, 1947 Sept. 7, 1950
Aug. 20, 1953
Sept. 24, 1947
Sept. 27, 1953
Sept. 9, 1933
Sept. 27, 1953
Sept. 24, 1947
Aug. 14, 1947
Sept. 8, 1950
Sept. 29, 1946 Sept. 23, 25, 1947
Aug. 22, 1947
Aug. 23, 1949
Oct. 12, 1953
Sept. 16, 1953
Sept. 25, 1947
Sept. 27, 1953
Sept. 6, 1950
Sept. 5, 1950
Sept. 5, 1950
Sept. 6, 1950
Sept. 5, 1950
Gage height
(ft)
19.32
10.78
18.17
24.51
14.44
12.78
25.6
8.13
13.80
2.90
31.96
n!5.5
8.10
32.54
21.38
20.18
20.74
16.70
11.74
3.40
10.08
12.00
9.00
5.45
7.44
56.62
(P)
Elevation above msl
19.32
18.70
18.17
36.23
16.61
51.34
35.5
78.69
47.08
62.90
61.96
n34.7
68.10
62.54
51.38
50.18
50.74
46.70
41.74
34.08
40.08
11.85
8.15
21.03
7.44
56.62
about 42
Discharge
Cfs
6,620
6,170
9,450
3,890
19,300
1,800
5,920
46
n!6,400
28
107
~
~
83
697
490
539
/
~
Cfs per
(sq mi)
28.2
68.6
65.2
22.2
57.6
16.4
26.9
25.2
10.4
8.9
--
13.0
~
19.9
54.4
38.5
~

MAXIMUM FLOODS KNOWN
Table 3. --Maximum known stages and discharges prior to 1956 in Florida--continued
35
No./ Stream or lake and place
of determination
Drainagearea
(sq mi)
Periodof
known floods
Maximum known flood
Date
Gage height "(ft)
Elevationabovemsl(ft)
Discharge
CfsCfsper
(sq mi)
LAKE TARPON BASIN
97 Brooker Creek near Odessa, Pla - - 10
Brooker Creek near Tarpon Springs, Pla 30
Lake Tarpon near Tarpon Springs, Fla--
ANCLOTE RIVER BASIN
98 Anclote River near Elfera, Fla-------- 67
WITHLACOOCHEE RIVER BASIN
99 Wlthlacoochee River at Trilby, Pla 650
100 Wlthlacoochee River at Groom, Pla- -- 900
101 Wlthlacoochee River near Holder, Pla 1,710
WACCASASSA RIVER BASIN
102 Waccasassa River near Otter Creek, Pla
103 Otter Creek at Otter Creek, Pla-
SUWANNEE RIVER BASIN
104 Suwannee River at Pargo, Ga- 1,260
Suwannee River at State Highway 6, near Jasper, Pla.
105 Suwannee River at White Springs, Pla-- 1,990
106 Alapaha River near Alapaha, Ga- 644
107 Alapaha River at Statenvllle, Ga- 1,400
108 Little River near Adel, Ga -- 547
109 Wlthlacoochee River near Qultman, Qa 1,560
110 Wlthlacoochee River near Plnetta, Fla- 2,220
Wlthlacoochee River at State Highway 6, near Madison, Pla.
111 Suwannee River at Ellavllle, Pla 6,580
Suwannee River at Dowling Park, Pla
112 Suwannee River at Luravllle, Pla -- 6,900
113 Suwannee River at Branford, Pla 7,090
New River at Lake Butler, Pla 212
114 Santa Pe River at Worthlngton, Pla 630
115 Santa Pe River near High Springs, Pla- 950
116 Santa Pe River near Port White, Fla--- 1,080
117 Suwannee River near Bell, Pla - 9,260
118 Suwannee River near Wllcox, Pla --- 9,500
STEINHATCHEE RIVER BASIN
Stelnhatchee River near Cross City, 360 Pla.
PENHOLLOWAY RIVER BASIN
Fenholloway River at Poley, Fla------- 180
ECONFINA RIVER BASIN
Econflna River near Perry, Pla 230
AUCILLA RIVER BASIN
Aucllla River at Lament, Pla 680
Aucllla River at Nuttall Rise, Pla
1946-55
1950-55
1945-55
1945-55
1928-55
1939-55
1928-55
1945-53
1945-53
1921-55
1927-55
1928-55
1862-195!
1862-195!
1862-1951
1862-195!
1862-1955
1862-1955
1862-1955
1950-55
1931-55
1931-55
1926-55
1862-1955
1862-1955
1950-55
1946-55
1950-55
1950-55
Aug. 23/, 1949
Sept. 6, 1950
Sept. 8, 1950
Aug. 8 or 9, 1S-45
June 21, 1934
Sept. 12, 1950
July 9, 10, 1934
Sept. 7, 1950
Sept. 6, 1950
Oct. 1, 1928
April 1948
Apr. 5, 1948
1928
Apr. 6, 1948
Apr-. 2, 1948
Apr. 4, 1948
Apr. 5, 1948
April 1948
Apr. 7,' 8, 19*3
April 1948
April 1948
Apr. 11, 1948
Sept. 8, 1950
June 17, 1934 Oct. 21, 1944
Mar. 14, 1948
Mar. 14, 1948 Apr. 12, 1948
Apr. 13, 1948
Apr. 14, 1948
Sept. 30, Oct. 1, 1953
Mar. 10, 1948
Apr. 17, 1953
Apr. 16, 1953
April 1948
13.20
12.80
6.44
320.5
12.71
11.63
7.16
7.93
19.5
36.65
29.8
21.0
31.7
38.64
4O.88
34.07
12.02
24.94
15.71
13.70
27.43
22.32
15.39
16.03
10.75
10.64
43\ 20
12.80
6.44
27.7
<?69.6
51.65
39.15
30.68
21.28
111.4
102.1
85.19
227.3
106.6
192.1
116.0
85.85
75.5
68.70
61.5
53.5
38.88
95.8
67.68
42.07
34.56
31.03
22.32
23.23
45.39
25.10
53.54
8.8
180
1,080
5,000
8,840
8,450
6,740
rl,210
3,000
13,800
28,500
16,000
27,300
38,800
66,000
79,400
95,300
83,900
6,470
17,500
12,700
12,300
82,300
84,700
3,740
2,640
758
1,640
18.0
36.0
74.6
13.6
9.4
3.9
10.9
14.3
24.8
19.5
70.9
42.3
35.8
14.5
11.8
30.5
27.8
13.4
11.4
8.9
8.9
10.4
.14.7
3.3
2.4

36 FLOODS IN FLORIDA
Table 3. --Maximum known stages and discharges prior to 1956 in Florida continued
No.
120
121
122
123
124
125
126
127
128
129
130
131
132
133
134
135
136
137
138
145
Stream or lake and place of determination
OCHLOCKONEE RIVER BASIN
Oohlockonee River near Thomasville, Ga.
Ochlockonee River near Havana, Fla
Ochlockonee River near Bloxhan, Fla
APALACHICOLA RIVER BASIN
Apalachlcola River at Chattahoochee, Fla.
Mosquito Creek at Chattahoochee, Fla--
Apalachicola River near Blountstown, Fla.
BEAR CREEK BASIN
CHOCTAWHATCHEE RIVER BASIN
Choctawhatchee River near Newton, Ala-
Choctawhatchee River at Geneva, Ala
Choctawhatohee River at State Highway 2, near Miller Cross Roads, Fla.
Choctawhatchee River at Caryville, Fla
Choctawhatchee River near Bruce, Fla
ALAQUA CREEK BASIN
Alaqua Creek near DeFuniak Springs, Fla.
YELLOW RIVER BASIN
Lightwood Knot Creek at Babbie, Ala
BLACKWATER RIVER BASIN
ESCAMBIA RIVER BASIN
Pine Barren Creek near Barth, Fla-
Drainage area
(sq mi)
550
55
1,020
250
1,660
130
520
17,100
60
17,300
781
182
683
1,187
1,347
3,200
3,499
386
4,384
65.6
113
624
123
474
1,220
205
237
3,817
75.3
4,160
Period of
known floods
1862-1955
1943-55
1862-1955
1950-55
1862-1955
1950-55
1937-55
1919-55
1937-42
1916-55
1922-55
1936-55
1922-27, 1930-55
1936-55
1925-55
1928-55
1950-55
1929-55
1951-55
1944-53
1938-55
1951-55
1938-55
1933-41
1950-55
1938-55
1952-55
1951-55
Maximum known flood
Date
Apr. 2, 1948
Apr. 1, 1948
Apr. 4, 1948
Sept. 1, 1950
Apr. 5, 1948
Mar. 20, 1951
Apr. 1, 1948
Mar. 20, 1929
Sept. 1, 1937
Mar. 21, 1929
Sept. 20, 1926
1926 or 1928 Apr. 2, 1948
Mar. 15, 1929
Jan. 17, 1925
Mar. 15, 1929 Jan. 22, 1936
Mar. 16, 1929
March 1929
Mar. 17, 1929
Sept. 2, 1950
March 1929
Sept. 26, 1953
Sept. 11, 1944
March 1929 Dec. 6, 1953
Sept. 27, 1953
March 1929 July 7, 1940
March 1929 July 9, 1940
Dec. 4, 1953
Aug. 17, 1939
March 1929
Apr. 14, 1955
March 1929
Dec. 9, 1953
Gage height
(ft)
29.1
16.3
35.08
13.69
23.50
8.35
19.9
S 34.70
11.54
28.6
33.55
15.0 12.46
45
28.0
45.3 37.2
46.9
27.1
19.02
18.47
11.9
15.13
21.86
14.26
15.62
20.80
17.33
37.8
18.0
6.77
above msl (ft)
162.7
175.3
94.24
96.88
53.19
107.85
105.6
S 79.55
55.6
53.50
16.0 13.49
184
166.6
143.2 135.2
108.0
93.1
66.1
29.72
t28.7
38.12
77.8 66.68
127.45
64.2 61.47
43.4 33.57
81.3
26.43
66.1-
47.9
31.5
6.77
^
Discharge
Cfs
72,000
28,100
55,900
3,480
50,200
4,080
12,600
293,000
1,310
25,000
4,860
28,000
27,800
206,000
5,240
220,000
5,160
12,100
28,000
8,690
21,700
35,100
17,200
23,100
315,000
24,800
Cfs Per
sq mi) -
131
511
54.8
13.9
30.2
31.4
24.2
17.1
21.8
32.0
26.7
41.0
23.4
58.9
13.6
50.2
78.7
107
44.9
70.7
45.8
28.8
83.9
97.5
82.5
329

GAGING STATION RECORDS 37
Table 3. Maximum known stages and discharges prior to 1956 in Florida continued
No.
146
/ Stream or lake and place
of determination
ESCAMBIA RIVER BASIN -Cont.
Escambia River at Regans Landing at Chemstrand Plant, Fla.
PERDIDO RIVER BASIN
Perdido River at Barrineau Park, Fla-
Drainage area
(sq mi)
-
394
Period of
known floods
--
1941-55
Maximum known flood
Date
March 1929
Mar. 15, 1929 Apr. 15, 1955
Gage height
(ft)
23.94
Elevation above msl (ft)
18
51.4 49.65
Discharge
Cfs
U39,000
Cfs per
(sq mi)
--
98.9
a Discharge estimated.b Occurred, on Oct. 15, 1953.c Maximum observed monthly reading; probably not maximum during year.d At Hurricane Gate No. 4; caused by hurricane.e Average of elevations varying from 89.9 to 90.8 ft determined from evidence around lake.f Result of discharge measurement.g Maximum daily.h Negative figures indicate flow toward lake.1 Above control.J Approximately; water over gage.k At former site 1,500 ft upstream.m Below control.n At site of former station near Barney, 8^ miles upstream.p Water over upper limit of gage which is at 13.5 ft.q At former site l£ miles downstream.r Main channel only.a At former site seven-eights of a mile downstream.t At former site 1 mile downstreamu From rating curve extended above 5,500 cfs.
GAGING STATION RECORDS
Annual peak gage heights and discharges at gaging stations in Florida are tabulated in this section. These data provide the basis for the study of flood frequency and magnitude presented on previous pages of this report.
Gage heights represent the water level in feet above an arbitrary datum which is referenced to local bench marks at the gaging station. The elevation of this arbitrary datum above mean sea level is also given in the station description. Changes in datum are noted in the station description. Where a change in datum has been made and the gage has remained at essentially the same site, all gage heights have been converted to the datum of the present gage in the tabulation of annual flood peaks. Significant changes in site are denoted by a full line between two items in the tabulation.
Gage heights listed are the maximum gage height during each calendar year from the beginning of the rec ord to Dec. 31, 1953. The calendar year was chosen rather than the water year as the base period for listing of annual peaks as it more nearly coincides with the climatic year in Florida than does the water year.
The gage heights were obtained generally from water-stage recorder charts or from gage readings by an observer. Many of the gage heights shown for major floods outside the period of record were obtained by leveling to floodmarks pointed out by local residents.
Peak discharges are computed from peak gage heights through the medium of a stage-discharge relation, except for those streams where this relation is affected by backwater. Above the range defined by current-meter measurements the stage-discharge relation is based upon measurements made by the slope-area method or upon a study of the conveyance characteristics of the stream channel. Where the stage-discharge relation is affected by backwater, the slope of the stream is commonly used as a second variable in computing discharge, and the peak discharge and peak stage do not necessarily occur at the same time. For these floods the peak discharge and the peak gage height have been tabulated as separate items.
Some of the figures of peak discharge shown in this report are not in agreement with figures published in the U. S. Geological Survey Water-Supply Papers. Most of these revisions are based upon data obtained after the discharge records were originally published. If the revised figures differ considerably from figures previously Published, the appropriate changes will be noted as revisions in subsequent Water-Supply Papers.
Unless otherwise noted, the streamflow data in this report were collected by the U. S. Geological Survey in cooperation with many State and municipal agencies, the Corps of Engineers, and the Florida Power Corporation, ^hen records collected by other agencies or private organizations are used, credit is given under the heading "Records available" in the manuscript.
In the station description the present site of the gaging station is described in "Location"; previous loca tions are described under "Gage". Where there has been a significant change in location, the appropriate notes have been shown in the tabulation of the annual flood peaks.

38 FLOODS IN FLORIDA
Satilla River Basin
(l) Satilla River near Waycross, Ga.
Location.--Lat 31°14', long 82°19', on downstream side of bridge pier near center of span onState Route 38, 3 miles northeast of Waycross, Ware County, and 16 miles upstream from Alabama River.
Drainage area. 1,300 sq mi, approximately.
Records available. U. S. Geological Survey: March 1937 to December 1953, daily gage heights and discharges.
Gage. Water-stage recorder. Datum of gage is 66.43 ft above mean sea level, datum of 1929, supplementary adjustment of 1936. Prior to Nov. 22, 1952, staff gage at site 300 ft down stream at same datum.
Stage-discharge relation.--Defined by current-meter measurements below 23,000 cfs and by slope- conveyance determination at 39,000 cfs.
Historical data.--The flood of September 1928 reached a stage of 22.2 ft, from information by pumping-station operator. This flood was reported by a local newspaper to be the highest known to the oldest settlers of the area.
Annual peak stages and discharges
Calendar year
1928
1937193819391940
19411942194319441945
Date
Sept.
Apr. 11July 30Mar. 4Feb. 23
Mar. 29, 30Jan. 6Mar. 12Mar . 10Aug. 25
Gage height (feet)
22.2
16.214.117.014.2
10.817.613.018.015.1
Discharge (cfs)
37,000
9,2404,160
11,0004,300
1,96012,8003,120
13,4005,560
Calendar year
19461947194819491950
195119521953
Date
July 31Apr. 21Apr. 4Sept. 4July 15
Apr . 4Mar. 4,5,6Oct .- 1
Gage height (feet)
14.616.522.418.113.4
16.212.718.1
Discharge (cfs)
4,8208,520
39,00013,8003,450
»7,7702,870
13,800
(2) Satilla River at Atkinson, Ga.
Location. Lat 31°13', long 81°52', on downstream side of right pier of bridge on U. S. Highway 84, 400 ft downstream from Atlantic Coast Line Railroad bridge and 1 mile west of Atkinson, Brantley County.
Drainage area.--2,880 sq mi, approximately.
Records available. U. S. Geological Survey: October 1931 to December 1953, daily gage heights and discharges.
Gage. Water-stage recorder. Datum of gage is 14.79 ft above mean sea level, datum of 1929, supplementary adjustment of 1936. Prior to Dec. 5, 1933, staff gage at same site and datum.
Stage-discharge relation. Defined by current-meter measurements below 68,000 cfs.
Historical data. Maximum stage known, 27.2 ft, from information by local residents, in September 1928.
Remarks.--Peak stage of Jan. 26, 1931, from records by Corps of Engineers.

GAGING STATION RECORDS 39
Satilla River Basin
(2) Satilla River at Atkinson, Ga.--Continued
Annual peak stages and discharges
Calendar year
1928
19311932193319341935
19361937193819391940
1941
Date
Sept.
Jan. 26Aug. 31Feb. 18June 11Sept. 18
Feb. 17Apr. 14Aug.. 5, 6Mar. 7Feb. 26, 27
July 27
Gage height (feet)
27.2
13.015.416.9615.7916.25
14.516.2713.6817.5414.5
13.2
Discharge (cfs)
110,000
5,51012,20015,20011,90013,000
8,77013,3007,140
17,0007,920
6,080
Calendar year
1942194319441945
19461947194819491950
195119521953
Date
Jan. 9Mar. 17, 18Mar. 31Aug. 27
Jan. 7Apr . 25Apr. 6Sept. 5Sept. 11
Apr . 9Mar. 11Oct. 3
Gage height (feet)
18.813.018.315.3
14.416.023.919.616.6.
16.012.919.8
Discharge (cfs)
26,6005,650
26,10011,200
8,50013,80068,10033,20015,500
13,0005,360
34,600
St. Marys River Basin
(3) North Prong St. Marys River at Monlac, Ga.
Location. Lat 30°31', long 82°14", In sec. 8, T. IN., R. 21 E., near right bank at upstream side of bridge on State Highway 94, 950 ft upstream from Georgia Southern and.Florida Railway bridge, 0.5 mile west of Monlac, and 1.0 mile downstream from Moccasin Creek.
Drainage area.--About 160 sq ml, Includes part of watershed In Okefenokee Swamp which Is Indefinite.
Records available. U. S. Geological Survey: January 1921 to December 1923, January 1927 to June 1930, July 1932 to June 1934, October 1950 to December 1953, dally gage heights and discharges.
Gage_.--Water-stage recorder. Datum of gage Is 89.40 ft above mean sea level, datum of 1929. January 1921 to June 1934, staff gage 800 ft downstream at datum 3.22 ft higher. Oct. 3 to Dec. 13, 1950, wire-weight gage at present site and datum.
Stage discharge relation. Defined by current-meter measurements below 3,700 cfs.
Remarks. Peak stage for flood of Sept. 19, 1928, determined from high-water mark; discharge estimated.
Annual peak stages and discharges
Calendar year
1921 1922 1923
1927 1928
__ 1929
Date
Aug. 2 Oct. 19 Jan. 7, 8
July 23 Sept. 19 Oct. 2
Gage height (feet)
7.0 7.0
8.2 16.7 11.51
Discharge (cfs)
2,200 670 670
1,100 6,060 2,640
Calendar year
1932 1933 1934
1951 1952 1953
Date
Sept. 16 Feb. 9 June 18
Dec . 28 Mar. 14 Oct. 1
Gage height (feet)
10.20 9.89 7.00
10.01 12.36 14.27
Discharge (cfs)
1,870 1,770
550
492 1,330 2.140

40 FLOODS IN FLORIDA
St. Marys River Basin
(4) St. Marys River near Macclenny, Pla.
Location. Lat 30°21'35", long 82°04'55", In sec. 2, T. 2 S., R. 22 E., on right bank, 200 ftdownstream from site of former Stokes Bridge on county road, 1 mile downstream from confluence of North and South Prongs, and 6 miles northeast of Macclenny.
Drainage area. 720 sq ml, approximately, Includes part of watershed In Okefenokee Swamp which Is Indeterminate.
Records available. U. S. Geological Survey: October 1926 to December 1953, dally gage heights and discharges.
Gage.--Water-stage recorder. Datum of gage Is 40.00 ft above mean sea level (levels by Mees and Mees). Prior to Feb. 21, 1939, staff gage at site of former bridge 200 ft upstream at same datum. Feb. 21, 1939, to Aug. 15, 1948, water-stage recorder on downstream wing wall of former bridge 200 ft upstream at same datum.
Stage-discharge relation. Defined by current-meter measurements below 24,000 cfs.
Annual peak stages and discharges
Calendar year
1927192819291930
19311932193319341935
19361937193819391940
Date
Aug. 24Sept. 20Oct. 2Mar . 25
Apr. 7Sept. 18Apr . 17June 18Sept. 8
Feb. 23Oct. 4Aug. 8July 12Feb . 20
Gage height (feet)
12.421.918.1817.30
10.6214.1014.3816.3914.20
9.4016.0016.2513.1511.11
Discharge (cfs)
3,07026,10011,4009,760
2,0804,8605,2508,2604,990
1,5407,5807,9203,7702,250
Calendar year
19411942194319441945
19461947194819491950
195119521953
Date
Dec. 29Jan. 6Aug. 21Oct. 21Aug. 22
Aug. 2Sept. 25Apr. 3Feb. 8Sept. 7
Dec. 29Feb . 28Oct. 2
Gage height (feet)
13.5015.368.98
19.6716.00
15.1322.2921.9716.5821.96
6.7410.2318.27
Discharge (cfs)
4,2406,8001,450
16,1007,750
6,26028,10026,6008,230
26,600
7351,810
11,900
St. Johns River Basin
(5) St. Johns River headwaters near Vero Beach, Fla.
Location. Lat 27°38', long 80°40', In sec. 6. T. 33 S., R. 37 E., on upstream side of right abutment of bridge on State Highway 60, 16$ miles west of city hall In Vero Beach.
Drainage area. 203 sq ml.
Records available. U. S. Geological Survey: February 1942 to December 1953, daily gage heights.
Gage. Water-stage recorder. Datum of gage is 18.56 ft above mean sea level, datum of 1929 (levels by Corps of Engineers).
Stage-discharge relation. Not defined.
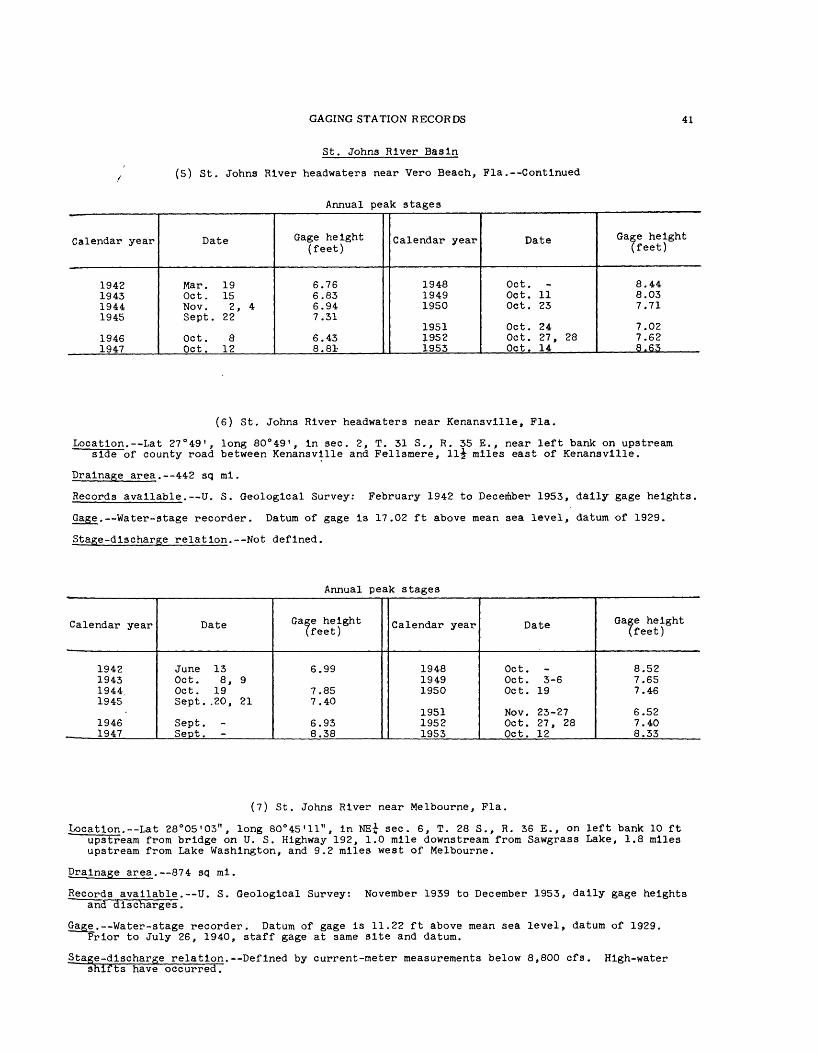
GAGING STATION RECORDS 41
St. Johns River Basin
(5) St. Johns River headwaters near Vero Beach, Fla. Continued
Annual peak stages
Calendar year
1942194319441945
19461947
Date
Mar. 19Oct. 15Nov. 2, 4Sept. 22
Oct. 8Oct. 12
Gage height (feet)
6.766.836.947.31
6.438.81-
Calendar year
194819491950
195119521953
Date
Oct. -Oct. 11Oct. 23
Oct. 24Oct. 27, 28Oct. 14
Gage height (feet)
8.448.037.71
7.027.628.63
(6) St. Johns River headwaters near Kenansvllle, Fla.
Location. Lat 27 °49', long 80° 49', In sec. 2, T. 31 S., R. 35 E., near left bank on upstream side of county road between Kenansvllle and Fellsmere, 11^ miles east of Kenansvllle.
Drainage area. --442 sq ml.
Records available. U. S. Geological Survey: February 1942 to December 1953, dally gage heights.
Gage . Water-stage recorder. Datum of gage Is 17.02 ft above mean sea level, datum of 1929.
Stage-discharge relation. Not defined.
Annual peak stages
Calendar year
1942 1943 1944 1945
1946 1947
Date
June 13 Oct. 8, 9 Oct. 19 Sept. .20, 21
Sept. - Sept.
Gage height (feet)
6.99
7.85 7.40
6.93 8.38
Calendar year
1948 1949 1950
1951 1952 1953
Date
Oct. - Oct. 3-6 Oct. 19
Nov. 23-27 Oct. 27, 28 Oct. 12
Gage height (feet)
8.52 7.65 7.46
6.52 7.40 8.33
(7) St. Johns River near Melbourne, Fla.
Location.--Lat 28°05'03", long 80°45'11", In NE£ sec. 6, T. 28 S., R. 36 E., on left bank 10 ft upstream from bridge on U. S. Highway 192, 1.0 mile downstream from Sawgrass Lake, 1.8 miles upstream from Lake Washington, and 9.2 miles west of Melbourne.
Drainage area. 874 sq ml.
Records available. U. S. Geological Survey: November 1939 to December 1953, dally gage heights ~and discharges.
Gag^e. Water-stage recorder. Datum of gage Is 11.22 ft above mean sea level, datum of 1929. Prior to July 26, 1940, staff gage at same site and datum.
Stage-discharge relation. Defined by current-meter measurements below 8,800 cfs. High-water shifts have occurred.
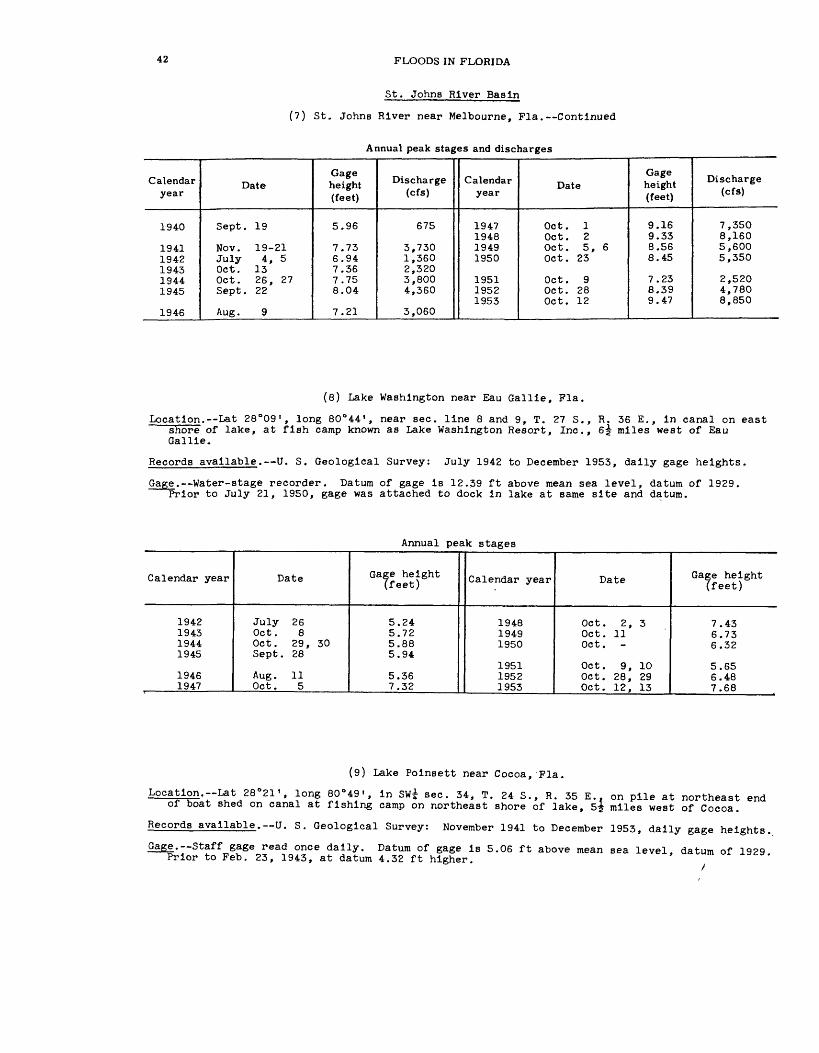
42 FLOODS IN FLORIDA
St. Johns River Basin
(7) St. Johns River near Melbourne, Fla. Continued
Annual peak stages and discharges
Calendar year
1940
19411942194319441945
1946
Date
Sept. 19
Nov. 19-21July 4, 5Oct. 13Oct. 26, 27Sept. 22
Aug. 9
Gage height (feet)
5.96
7.736.947.367.758.04
7.21
Discharge (cfs)
675
3,7301,3602,3203,8004,360
3,060
Calendar year
1947194819491950
195119521953
Date
Oct. 1Oct. 2Oct. 5, 6Oct. 23
Oct. 9Oct. 28Oct. 12
Gage height (feet)
9.169.338.568.45
7.238.399.47
Discharge (cfs)
7,3508,1605,6005,350
2,5204,7808,850
(8) Lake Washington near Eau Gallie, Fla.
Location.--Lat 28°09', long 80°44', near sec. line 8 and 9, T. 27 S., R. 36 E., in canal on east shore of lake, at fish camp known as Lake Washington Resort, Inc., 6^ miles west of Eau Gallie.
Records available. U. S. Geological Survey: July 1942 to December 1953, daily gage heights.
Gage. Water-stage recorder. Datum of gage is 12.39 ft above mean sea level, datum of 1929. Prior to July 21, 1950, gage was attached to dock in lake at same site and datum.
Annual peak stages
Calendar year
1942194319441945
19461947
Date
July 26Oct. 8Oct. 29, 30Sept. 28
Aug. 11Oct. 5
Gage height (feet)
5.245.725.885.94
5.367.32
Calendar year
194819491950
195119521953
Date
Oct. 2, 3Oct. 11Oct. -
Oct. 9, 10Oct. 28, 29Oct. 12, 13
Gage height (feet)
7.436.736.32
5.656.487.68
(9) Lake Poinsett near Cocoa, Fla.
Location.-Lat 26°21', long 80°49', in SW£ sec. 34, T. 24 S., R. 35 E.. on pile at northeast end of boat shed on canal at fishing camp on northeast shore of lake, 5i miles west of Cocoa.
Records available. U. S. Geological Survey: November 1941 to December 1953, daily gage heights.
Gage. Staff gage read once daily. Datura of gage is 5.06 ft above mean sea level, datum of 1929 Prior to Feb. 23, 1943, at datum 4.32 ft higher.
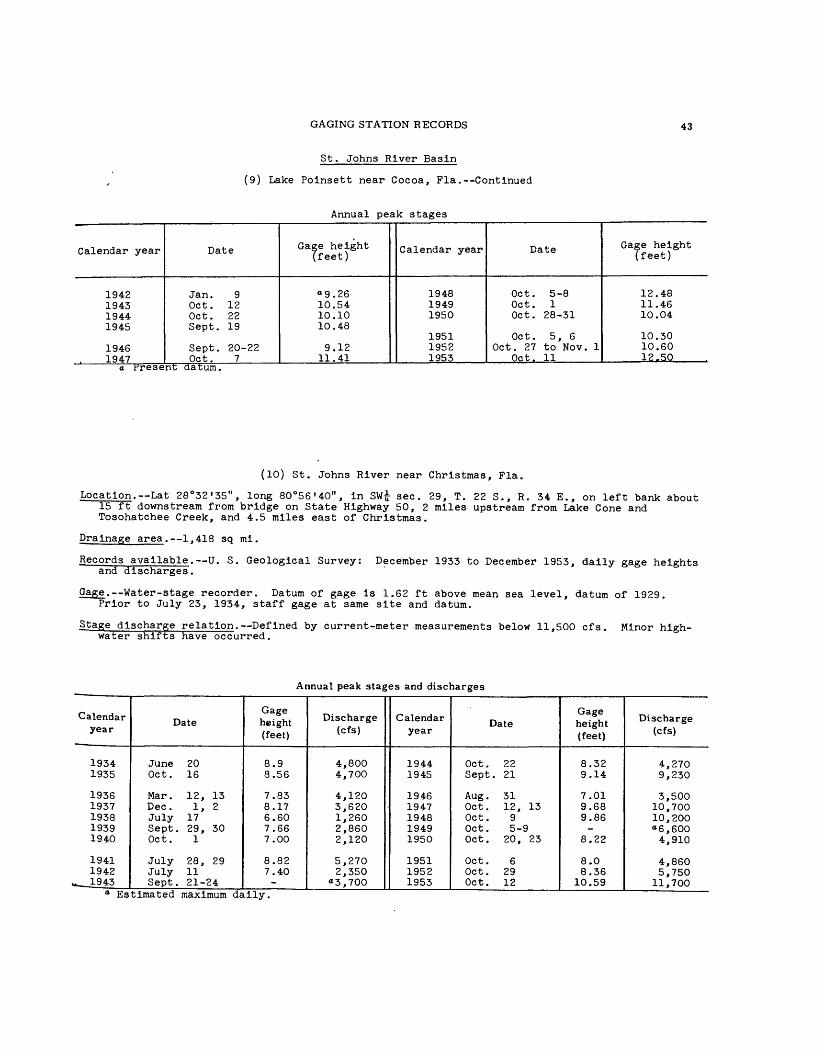
GAGING STATION RECORDS 43
St. Johns River Basin
(9) Lake Polnsett near Cocoa, Fla. Continued
Annual peak stages
Calendar year
1942 1943 1944 1945
1946 1947
Date
Jan. 9 Oct. 12 Oct. 22 Sept. 19
Sept. 20-22 Oct. 7
Gage height (feet)
«9.26 10.54 10.10 10.48
9.12 11.41
Calendar year
1948 1949 1950
1951 1952 1953
Date
Oct. 5-8 Oct. 1 Oct. 28-31
Oct. 5, 6 Oct. 27 to Nov. 1
Oct. 11
Gage height (feet)
12.48 11.46 10.04
10.30 10.60 12.50
a Fresent datum.
(10) St. Johns River near Christmas, Fla.
Location. Lat 28°32'35", long 80°56'40", in SW£ sec. 29, T. 22 S., R. 34 E., on left bank about 15 ft downstream from bridge on State Highway 50, 2 miles upstream from Lake Cone and Tosohatchee Creek, and 4.5 miles east of Christmas.
Drainage area. 1,418 sq mi.
Records available. U. S. Geological Survey: December 1933 to December 1953, daily gage heights and discharges.
Gage. Water-stage recorder. Datum of gage is 1.62 ft above mean sea level, datum of 1929. Prior to July 23, 1934, staff gage at same site and datum.
Stage discharge relation. Defined by current-meter measurements below 11,500 cfs. Minor high- water shifts have occurred.
Annual peak stages and discharges
Calendar year
19341935
19361937193819391940
19411942
*___1943
Date
June 20Oct. 16
Mar. 12, 13Dec. 1, 2July 17Sept. 29, 30Oct. 1
July 28, 29July 11Sept. 21-24
Gage height (feet)
8.98.56
7.838.176.607.667.00
8.827.40-
Discharge (cfs)
4,8004,700
4,1203,6201,2602,8602,120
5,2702,350
«3,700a Estimated maximum daily.
Calendar year
19441945
19461947194819491950
195119521953
Date
Oct. 22Sept. 21
Aug. 31Oct. 12, 13Oct. 9Oct. 5-9Oct. 20, 23
Oct. 6Oct. 29Oct. 12
Gage height (feet)
8.329.14
7.019.689.86-
8.22
8.08.36
10.59
Discharge (cfs)
4,2709,230
3,50010,70010,200"6,600
4,910
4,8605,750
11,700

44 FLOODS IN FLORIDA
St. Johns River Basin
(11) Econlockhatchee River near Chuluota,. Fla.
Location.--Lat 28°40'40", long 81°06'50", In sec. 10, T. 21 S., R. 32 E., on right bank, 10 ft downstream from highway bridge, 2.6 miles northeast of Chuluota, and 10 miles upstream from mouth.
Drainage area. 260 sq ml, approximately.
Records available. U. S. Geological Survey: November 1935 to December 1953, dally gage heights, and discharges.
Gage. Water-stage recorder. Datum of gage Is 2.14 ft above mean sea level (Corps of Engineers oenchmark). Prior to May 18, 1939, staff gage at same site and datum.
Water-stage recorder for station on St. Johns River above Lake Harney, near Geneva Is used as an auxiliary gage for this station.
Stage-discharge relation.--Defined by current-meter measurements below 4,300 cfs; affected at times by backwater from St. Johns River. Since September 1943, discharge computed by using fall, as determined from auxiliary gage, as a factor.
Remarks.--Records Include some flow diverted from Lake Mary Jane In Lake Okeechobee and the Everglades basin through Econlockhatchee Headwaters Canal.
Annual peak stages and discharges
Calendar year
19361937193819391940
19411942194319441945
Date
Oct. 15Dec. 1July 17June 18Aug. 6, 7
July 14July 9Sept. 22Oct. 21Sept. 18
Gage height (feet)
10.5510.579.81
11.61-
_9.43
11.7514.9617.93
Discharge (cfs)
1,7601,7601,4902,430
950
2,1601,3602,0006,1009,040
Calendar year
19461947194819491950
195119521953
Date
Aug. 5Sept. 25Sept. 24Oct. 1Oct. 20
Oct. 5Oct. 23Sept. 6
Gage height (feet)
9.7213.8718.0913.2816.54
11.0312.0013.72
Discharge (cfs)
1,2004,560
10,0003,7007,350
2,0002,6304,080
(12) St. Johns River above Lake Harney, near Geneva, Fla.
Location. Lat 28°43', .long 81°02', In sec. 33, T. 20 S., R. 33 E., near right bank at upstream side of bridge on State Highway 46, 1 mile upstream from Lake Harney, 5^ miles southeast of Geneva, and 15^ miles southeast of Sanford.
Drainage area. 1,910 sq ml, approximately.
Records available. Corps of Engineers: July 1941 to August 1943, dally gage heights. U. S. Geological Survey: September 1943 to December 1953, daily gage heights; July 1951 to December 1953, periodic discharge measurements.
Gage. Water-stage recorder. Datum of gage is at mean sea level, datum of 1929 (Corps of Engineers benchmark). Prior to Sept. 4, 1943, staff gage at same site and datum.
Stage-discharge relation. Not defined; affected by backwater from Lake Harney.

GAGING STATION RECORDS 45
St. Johns River Basin
(12) St. Johns River above Lake Harney, near Geneva, Fla. Continued
Annual peak stages
Calendar year
19411942194319441945
19461947
Date
Aug. 1Mar. 22-25Sept. 25Oct. 25Sept. 21
Sept. 23Oct.
Gage height (feet)
7.84.87.457.819.87
6.539.49
Calendar year
194819491950
195119521953
Date
Oct. 10Oct. 4Oct. 24
Oct. 8Oct. 28Oct. 14
Gage height (feet)
9.728.448.29
6.887.52
10.62
(13) St. Johns River at Osceola, Fla.
Location.--Lat 28°48', long 81°04', in'sec. 31, T. 19 S., R. 33 E., on right bank on upstream fender piling of Florida East Coast Railway bridge at Osceola-, half a mile downstream from Lake Harney.
Drainage area. 1,950 sq mi, approximately.
Records available. Corps of Engineers: August 1941 to August 1943, daily gage heights. U. S. Geological Survey: September 1943 to July 1948, daily gage heights.
Gage. Water-stage recorder. Datum of gage is at mean sea level, datum of 1929 (Corps of Engineers benchmark). Aug. 8, 1941, to Sept. 2, 1943, staff gage at same site and datum. Sept. 2, 1943, to Nov. 4, 1943, water-stage recorder at site a quarter of a mile downstream at same datum.
Stage-discharge relation. Not defined.
Annual peak stages
Calendar year
1941 1942 1943
__ 1944
Date
- Aug. Mar. 24, 25 Sept. 25 Oct. 26
Gage height (feet)
(a) 4.35 (a) 7.61
Calendar year
1945
1946 1947
Date
Sept. 21
Sept. Oct. 16
Gage height (feet)
9.62
6.41 9.22
a No gage-height record,

46 FLOODS IN FLORIDA
St. Johns River Basin
(14) Jessup Lake Outlet near Sanford, Fla.
Location.--Lat 28°47', long 81°11', In sec. 1, T. 20 S., R. 31 E., near left bank on downstream side of bridge on State Highway 46, 5-^ miles southeast of Sanford.
Records available. Corps of Engineers: July 1941 to August 1943, dally gage heights. U. S. Geological Survey: August 1943 to July 1948, dally gage heights.
Gage. Water-stage recorder. Datum of gage Is at mean sea level, datum of 1929 (Corps of Engineers benchmark). Prior to Aug. 28, 1943, staff gage at same site and datum.
Stage-discharge relation. Not defined.
Historical data. Flood of July 1930 reached a stage of 8.4 ft, from Information by local resident.
Annual peak stages
Calendar year
1930
1941 1942 1943
Date
July -
Aug. 1-9 Mar. 21 Sept. -
Gage height (feet)
8.4
5.8 3.6 5.8
Calendar year
1944 1945
1946 1947
Date
Oct. 28 Sept. 26
Sept. 26 Oct. 21
Gage height (feet)
6.10 7.76
5.03 7.60
(15) St. Johns River above Lake Monroe, near Sanford, Fla.
Location. Lat 28°48', long 81°13', In sec. 27, T. 19 S., R. 31 E., near left bank on downstream side of bridge on State Highway 415, about 2 miles upstream from Lake Monroe and 3-J- miles east of Sanford.
Drainage area. 2,320 sq ml, approximately.
Records available. Corps of Engineers: July 1941 to August 1943, dally gage heights. U. S. Geological Survey: August 1943 to July 1948, dally gage heights.
Gage. Water-stage recorder. Datum of gage Is at mean sea level, datum of 1929 (Corps of Engineers benchmark). Prior to Aug. 28, 1943, staff gage at same site and datum.
.Stage-discharge relation.--Not defined.
Historical data. Flood of October 1924 reached a stage of 8.5 ft, from Information by local resident. S~ee additional high-water data for Lake Monroe listed with data for following station (St. Johns River near Sanford, Fla.).
Annual peak stages
Calendar year
1924
1941 1942 1943 .
Date
Oct. -
Aug. 4-7 Jan. 3, 4 Oct. 10
Gage height (feet)
8.5
5.1 3.6 5.92
Calendar year
1944 1945
1946 1947
Date
Oct. 29 Sept. 28
Sept. 26 Oct. 22
Gage height (feet)
5.95 7.62
I 4.89 7.42

GAGING STATION RECORDS 47
St. Johns River Basin
(16) St. Johns River near Sanford, Fla.
Location. Lat 28°50', long 81°19', in sec. 16, T. 19 S., R. 30 E., on left bank 25 ft downstream from bridge on U. S. Highways 17 and 92, near downstream end of Lake Monroe, and 4 miles northwest of Sanford.
Drainage area. 2,420 sq mi, approximately.
Records available.--City of Sanford: July 1920 to January 1940, once-weekly gage heights. U. S. Geological Survey: August 1941 to December 1953, daily gage heights and periodic discharge measurements.
Gage. Water-stage recorder. Datum of gage is 0.09 ft below mean sea level, datum of 1929.Gage used by city of Sanford was staff gage in Lake Monroe upstream from present site. Datum of gage was at mean sea level (levels by city engineer). (All gage heights shown below have been reduced to elevations above mean sea level).
Stage-discharge relation.--Not defined; affected by backwater, tion of annual discharge maxima.
Insufficient data for computa-
Historical data. Elevations for floods of 1871, 1880, 1898, and 1910, furnished by Mr. Fred T. Williams, former city engineer for Sanford. (Several datum adjustments have been used in Southern Florida; it is assumed that these elevations have been adjusted to datum of 1929) .
Annual peak stages
Calendar year
1871
1880
1898
1910
1920
19211922192319241925
19261927192819291930
193119321933
Date
-
-
-
Oct. -
Nov.Nov.
June -, July -Oct. -Sept. -
Aug.Oct. -Oct. -Oct. -July -
Jan.JuneSept. -
Gage height (feet)
11.78
13.28
9.37
7.16
4.1
4.05.26.08.064.2
7.101.66.56.28.16
3.42.45.4
Calendar year
19341935
19361937193819391940
19411942194319441945
19461947194819491950
195119521953
Date
June -, July -Oct. -
Mar. -Dec.Aug. -Oct. -
-
Aug. 6Mar. 20, 21Oct. 11Oct. 30Sept. 28, 29
Sept. 27Oct. 22, 23Oct. 13Oct. 11Oct. 29, 30
Oct. 18, 25Nov. 3, 4Oct. 15
Gage height (feet)
6.05.0
4.04.52.53.6(a)
5.383.255.695.707.30
4.637.147.325.915.66
4.274.978.52
a No gage-height record

48 FLOODS IN FLORIDA
St. Johns River Basin
(17) Wekiva River near Sanford, Fla. ;!
Location. Lat 28°49', long 81°25', on line between sees. 21 and 28, T. 19 S., R. 29 E., near right bank at downstream side of bridge on State Highway 46, 4^ miles downstream from Little Wekiva River, 5f miles upstream from mouth, and 9 miles west of Sanford.
Records available. U. S. Geological Survey: October 1931 to September 1935, periodic discharge measurements; October 1935 to December 1953, daily gage heights and discharges.
Gage. Staff gage read once dally. Datum of gage is not determined. Prior to Nov. 6, 1935, reference point at same site.
Stage-discharge relation. Defined by current-meter measurements below 820 cfs. Considerable shifting at all stages and backwater effect from hyacinths Jams and the St. Johns River.
Remarks. Wekiva River is fed by numerous springs.
Annual peak stages and discharges
Calendar year
19361937193819391940
19411942194319441945
Date
June 5Oct. 2July 18Sept. 27Apr. 9
July 27Sept. 7Aug. 22Oct. 20Sept. 17
Gage height (feet)
4.363.983.74-
3.45
3.843.724.285.085.60
Discharge (cfs)
912673490711484
927511884
"1,5802,060
Calendar year
19461947194819491950
195119521953
Date
July 29Sept. 23Jan. 25Aug. 29Oct. 19
Oct. 3Oct. 9Aug. 29
Gage height (feet)
4.524.824.194.545.40
4.004.18-
Discharge (cfs)
8901,130
671929
1,610
551689
*1,100
a Maximum daily.

GAGING STATION RECORDS 49
St. Johns River Basin
, .- (18) St. Johns River near De Land, Fla.
Location. Lat 29°01', long 8i°23', T. 17 S., R. 29 E. f on left bank 1,000 ft downstream from Crows Bluff Bridge on State Highway 44 and 5 miles west of DeLand.
Drainage area. 2,960 sq ml, approximately.
Records available. U. S. Geological Survey: January 1934 to December 1953, daily gage heights and discharges.
IGage. Water-stage recorder. Oatum of gage is 1.114 ft below mean sea level (levels by Corps of Engineers). Prior to May 8, 1936, staff gage at Crows Bluff Bridge 1,000 ft upstream at same datum.
Auxiliary water-stage ^ jorder at St. Francis Landing, 4 miles downstream from Crows Bluff Bridge. Datum of gage is .716 ft below mean sea level (levels by Corps of Engineers). Prior to Jan. 16, 1943, an additional auxiliary water-stage recorder ij miles upstream from CrowsBluff Bridge.
iStage-discharge relation. De)' ned by current-meter measurements below 17,000 cfs; affected by
fall. Discharge computed .- using fall, as determined by auxiliary water-stage recorder at St. Francis Landing, as a f ctor.
Remarks .--Slight tide effect c. . low stages.
Annual peak stages and discharges
Calendaryear
19341935
1936
1937
1938
1939
1940
1941
1942
1943
Date
July 5Oct. 13Oct. 23
Feb. 24Mar. 17Oct. 4Dec. 21July 25Nov. 12Sept. 25, 26Oct. 27Oct. 2Oct. 3, 4
Aug. 7Oct. 27Jan. 2Jan. 11Mar . 27Oct. 9Oct. 12
Gage h-.jight(fee;)
CrowsBluff
5.14.6-
3.6-
4.15---
3.95-
3.51-
4.51-
3.48--
5.31-
St.Fi ancisLanding
t.045.70-
?,84-
'..65--.74
1.36
3.05-
-3 81
-2.85
-4 57
Dailydischarge
(cfs)
10,600-
7,900
.5,950-
6,2903,880--
5,120-
3,820
9,020---
5,370-
7,800
Calendaryear
1944
1945
1946
1947
1948
19491950
1951
1952
1953
Date
Oct. 22-24Oct. 25-27Dot. 31Sept. 29Sept. 30
Sept. 26Oct. 8Oct. 18Oct. 23Oct. 12, 13Oct. 15, 16Oct. 11Dot. 29, 30Nov. 4
Oct. 6-10)ct. 18Dot. 29, 30>Jov. 10Dot. 11, 12Dot. 15
Gage height(feet)
CrowsBluff
_5.08-
6.12-
-4.456.12-
6.33-
5.225.23-
-4.554.55-
7.17-
St.FrancisLanding
4.38--
5.03-
-3.855.14-
5.43-
4.424.47-
--
3.92-
6.32-
Dailydischarge
(cfs)
-
8,290-
14,400
6,230--
13,400-
13,90010,000
-10,800
«7,500_-
8,560-
17,100a Estimated average for 5-day period,

50 FLOODS IN FLORIDA
St. Johns River Basin
(19) Lake Apopka at Winter Garden, Fla.
Location. Lat 28°35', long 81°35', In sec. 14, T. 22 S., R. 27 E., In southeast corner of west boat basin In city park at Winter Garden.
Drainage area above outlet. 130 sq ml, approximately.
Records available. Corps of Engineers: December 1935 to December 1942, once monthly gage heights.U. S. Geological Survey: September 1942 to December 1953, dally gage heights.
Gage.--Water-stage recorder. Datum of gage Is 62.57 ft above mean sea level, datum of 1929. Prior to Sept. 19, 1942, Corps of Engineers staff gage on city dock at datum approximately 0.3 ft higher. Gage heights shown below have been reduced to elevations above mean sea level
Annual peak stages
Calendar year
19361937193819391940
19411942194319441945
Date
Oct. 12-
Jan. 10Oct. 2
-
Dec. 1Mar. 3Sept. 23Oct. 24Sept. 20
Gage height (feet)
a 69.3 68.7 68.1 67.2 67.1
a67.6°68.267.4967.8367.94
Calendar year
19461947194819491950
195119521953
Date
Sept. 27, 30Sept. 27Jan. 31Jan. 1Oct. 24
Feb. 8, Dec. 27Feb. 27Oct. 9
Gage height
67.5968.9068.7167.0966.56
66.4766.7468.32
Maximum observed monthly reading; probably not maximum during" year. Note. Momentary peak stages are wind affected and elevations shown for years 1943 to
1953 are maximum daily figures.
(20) Apopka-Beauclalr Canal near Astatula, Fla.
Location.--Lat 28°45', long 81°41', In E| sec. 15, T. 20 S., R. 26 E., on'left bank near timber control and bridge on State Highway 448, l£ miles west of Lake Jem, 3^ miles northeast of Astatula and 5 miles southwest of Mount Dora.
Upper gage Is 280 ft upstream from bridge and 330 ft upstream from control. Lower gage is 330 ft downstream from control.
Records available. U. S. Geological Survey: July 1942 to July 1948, daily gage heights and periodic discharge measurements prior to the construction of the timber control (completed about Aug. 15, 1950). November 1950 to December 1953, fragmentary gage heights only, from upper and lower gages.
Gage. Staff gages at upper and lower locations read once daily when an observer is available. Datum of each gage is at mean sea level, datum of 1929. Prior to July 1948, before control was constructed, staff gage at approximately same site as upper gage. Gage was read twice dally. Datum of this gage was 60.68 ft above mean sea level, datum of 1929.
Stage-discharge relation. Not defined.
Historical data. High water mark on bridge for some flood prior to July 1942 (date unknown) was at elevation 67.0 ft.

GAGING STATION RECORDS 51
St. Johns River Basin
(20) Apopka-Beauclalr Canal near Astatula, Pla. Continued
Annual peak stages
Calendar year
194319441945194619471948
Mar.Oct.Sept.Jan.Sept.Mar.
Date
7, Apr. 19201616246, 12
Elevation(feet above
mean sea level)
Former gage
67.065.0765.7365.7165.1365.1865.99
-
Control constructed August 1950
1951
19521953
Jan.Feb.Apr.Dec .
151423
Upper gage
.65.85
a 66.5566.78
Lower gage
64.13-
B64.1765.78
0 Maximum observed during period of fragmentary gage- height record; probably not maximum during year.
(21) Lake Dora at Mount Dora, Fla.
Location. Lat 28°48', long 81°38", near boundary between sees. 31 and 32, T. 19 S., R. 27 E., at boat dock In Elizabeth Evans Park In Mount Dora.
Records available. Corps of Engineers: November 1935 to July 1942, gage heights read monthly or oftener.U. S. Geological Survey: July 1942 to December 1953, daily gage heights.
Gage. Staff gage read once daily. Datum of gage is at mean sea level, datum of 1929. Prior to Nov. 17, 1950, datum of gage was 59.88 ft above mean sea level, datum of 1929.
Prior to July 14, 1942, staff gage in boat slip at Wise Boat Works at datum about 0.08 ft higher.
Historical data.--High-water of September 1926 reached a stage of 65.8 ft above mean sea level, from information by Mr. Wise, owner of Wise Boat Works, and Mr. Tremain, Mount Dora realtor.
Annual peak stages
Calendar year
1926
1936 1937 1938 1939 1940
1941 1942 1943 1944
Date
Sept. -
Oct. Oct. -, Dec. -
Jan. Oct.
Sept. -, Oct.-
Aug. Jan. -, Apr. -
Sept. 22 Nov. 5. 6. 10
Elevation, feet above
mean sea level
65.8
°64.1 "64.2 a 64.3 a 62.3 "62.3
°63.6a 63.6 63.18 64.28
Calendar year
1945
1946 1947 1948 1949 1950
1951 1952 1953
Date
Oct. 2, 5
Jan. 17 Nov. 25, 26 Oct. 6 Oct. 5 Jan. 1
Jan. 8, 15, 16 Apr. 1, 2 Dec. 28-31
° Maximum observed monthly reading; probably not maximum during year.
Elevation, feet above
mean sea level
64.90
64.50 63.96 65.21 65.22 64.5
63.82 63.70 65.36

52 FLOODS IN FLORIDA
St. Johns River Basin
(22) Dead River near Tavares, Fla.
Location. Lat 28°49', long 81°45', near corner of sees. 24 and 25 of R. 25 E., and 19 and 30 of R. 26 E., T. 19 S., on right bank 15 ft upstream from bridge on U. S. Highway 441, and 2 miles
west of Tavares.
Records available. U. S. Geological Survey: July 1942 to December 1953, daily gage heights.
Gage.--Staff gage read once daily. Datum of gage is 59.30 ft above mean sea level,.datum of 1929.
Stage-discharge relation. Not defined. The normal flow in Dead River is in northeasterly direction or from Lake Harris to Lake Eustis, but at times during occurrence of strong
northeast winds, the flow has been observed to reverse, or from Lake Eustis to Lake Harris.
Historical data.--High-water of 1926 reached a stage of 66.1 ft above mean sea level, from information by Mr. T. W. Camp, Seaboard Railway^station agent.
Annual peak stages
Calendar year
1926
194319441945
19461947
Date
.
Sept. 20, 23, 24Oct. 23Oct. 3-7, 10-14
Jan. 1Nov. 4-17
Elevation,feet above
mean sea level
66.1
62.2663.2063.98
63.6863.36
Calendar year
194819491950
195119521953
Date
Oct. 8, 9Oct. 8, 9, 15,16Jan. 1, 2
Jan. 5-7Mar. 29 -Apr. 2Dec. 31
Elevation,feet above
mean sea level
64.0864.5063.76
' 63.1062.7064.52
.
(23) Lake Minnehaha at Clermont, Fla.
Location. Lat 28°33', long 81°45', in sec. 30, T. 22 S., R. 26 E., on north shore, 96 ft south of centerline of Lake Shore Drive between East Avenue and Drew Avenue in Clermont.
Records available. U. S. Geological Survey: May 1945 to December 1953, daily gage heights.
Gage. Water-stage recorder. Datum of gage is 91.32 ft above mean sea level, datum of 1929. Prior to June 5, 1946, staff gage at same site and datum read once daily.
Annual peak stages
Calendar year
1945
1946194719481949
Date
Sept. 24 to Oct. 4
Oct. 8Oct. 6, 7Oct. 13-15Oct. 11-13
Gage height (feet)
7.50
5.906.966.986.72
Calendar year
1950
195119521953
Date
Oct. 26-28
Dec. 1Jan. -Oct. 9, 10
Gage height (feet)
6.00
6.365.67.52

GAGING STATION RECORDS53
St. Johns River Basin
(24) Palatlakaha Creek near Mascotte, Fla. /
Location.--Lat 28°37', long 81°51', In sec. 36, T. 21 S., R. 24 E., on right bank 5 ft upstream from county highway bridge, 0.2 mile downstream from Lake Emma, and 3-5- miles northeast of Mascotte.
Drainage area.--160 sq mi, approximately.
Records available. U. S. Geological Survey: May 1945 to December 1953, daily gage heights and discharges.
Gage. Water-stage recorder. Datum of gage is 89.54 ft above mean sea level, datum of 1929. Prior to May 21, 1946, staff gage at same site and datum read once daily.
Stage-discharge relation.--Defined by current-meter measurements below 420 cfs. Considerable shifting at all stages and backwater effect from hyacinths Jams and lakes below station.
Annual peak stages and discharges
Calendar year
1945
1946 1947 1948 1949
Date
Oct. 4, 5
Sept. 21 Oct. 16 Oct. 18 Sect. 29
Gage height (feet)
7.06
5.20 6.61 6.35 6.31
Discharge (cfs)
. 458
164 362 326 342
Calendar year
1950
1951 1952 1953
Date
Oct. 21
Dec. 27 Mar. 28 Oct.' 11, 12
Gage height (feet)
5.52
5.84 5.50 7.12
Discharge (cfs)
222
206 152 372
(25) Haines Creek at Lisbon, Fla.
Location. Lat 28°53', long 81°47', in sec. 2, T. 19 S., R. 25 E., on left bank 15 ft downstream from bridge on State Highway 44, a quarter of a mile west of Lisbon, and 8^ miles northeast of Leesburg.
Drainage area.--640 sq mi, approximately.
Records available.--U. S. Geological Survey: July 1942 to December 1953, daily gage heights and discharges.
Gag_e_. Staff gage read once daily. Datum of gage is 59.22 ft above mean sea level, datum of 1929 (Corps of Engineers benchmark).
Stage-discharge relation. Defined by current-meter measurements below 805 cfs. Considerable shifting at all stages.
Historical data.--Flood of 1926 reached a stage about 6.4 ft, from information by Mr. George R. Gastfield, observer.
Annual peak stages and discharges
Calendar year
1926
1943 19441945
1946 1947
Date
_
Sept. 21-23 Oct. 26Oct. 26
Feb. 28 Nov. 12
Gage height (feet)
6.4
2.51 3.163.68
3.39 3.24
Discharge (cfs)
_
196 384585
489 429
Calendar year
19481949 1950
19511952 1953
Date
Oct. 5, 9, 10Oct. 7, 8, 11 Oct. 29
Feb. 7Mar. 31 to Apr. 2 Dec. 29
Gage height (feet)
3.844.22 3.04
3.112.77 4.20
Discharge (cfs)
557704361
382400 805

54 FLOODS IN FLORIDA
St. Johns River Basin
(26) Lake Weir at Oklawaha, Fla.
Location. Lat 29°02'30", long 81°55'30", in sec. 5, T. 17 S., R. 24 E., on dock 100 ft east of Johnsons Beach Pavilion, 0.2 mile south of Post Office in Oklawaha.
Drainage area above outlet. 37 sq mi, approximately.
Records available. Corps of Engineers: April 1936 to December 1943, once monthly gage heights. U. S. Geological Survey: November 1942 to December 1953, daily gage heights and occasional discharge measurements of flow at the outlet.
Gage. Water-stage recorder. Datum of gage is 55.58 ft above mean sea level (Corps of Engineers benchmark). Prior to Nov. 5, 1942, Corps of Engineers staff gage at approximately same site at datum at mean sea level. (All gage heights shown below have been reduced to elevations above mean sea level).
Annual peak stages
Calendar year
19361937193819391940
19411942194319441945
Date
Apr. -, Oct. -3ept . - , Oct . - ,Dec. -
Jan.Oct.Aug.
Aug.Jan.Sept. 22Oct. 20Sept. 17
Elevation,feet above
mean sea level
°59.0°59.5«59.6 58.4 58.1
58.4 58.657.6357.7657.78
Calendar year
19461947194819491950
195119521953
Date
Mar. 14,15,28,29Oct. 24Oct. 5Oct. 1, 2Oct. 19
Jan. 4-7Mar. 27, 28Dec. 25,26,29-31
Elevation,feet above
mean sea level
58.0258.4458.3458.4457.83
57.4957.7158.11
Maximum observed monthly reading; probably not maximum during year. Note.--Momentary peak stages are wind affected and elevations shown for years 1943 to
1953 are maximum daily figures.
(27) Oklawaha River at Moss Bluff, Fla.
Location. Lat 29°05', long 81°53', in sec. 22 or 23, T. 16 S., R. 24 E., on left bank 25 ft upstream from old channel, 50 ft upstream from highway bridge, 600 ft downstream from power- plant, and 0.4 mile southwest of Moss Bluff.
Drainage area. 910 sq mi, approximately.
Records available. U. S. Geological Survey: February to September 1943, occasional discharge measurements. October 1943 to December 1953, daily gage heights and discharges.
Gag^e. Water-stage recorder. Datum of gage is at mean sea level (Corps of Engineers benchmark). Prior to Aug. 12, 1943, staff gage at same site and datum.
Stage-discharge relation. Defined by current-meter measurements below 1,050 cfs. Considerable shifting at all stages.
Remarks. Records include flow of old Oklawaha River channel. Flow regulated by powerplant above station.

GAGING STATION RECORDS 55
St. Johns River Basin
(27) Oklawaha River at Moss Bluff, Fla. Continued
Annual peak stages and discharges
Calendar year
19441945
1946194719481949
Date
Oct. 19Aug. 23
Feb. 28Sept. 23Aug. 19Aug. 28Sept. 23
Gage height (feet)
49.3148.90
48.3748.5048.4248.47
-
Discharge (cfs)
988910
811831811-
855
Calendar year
1950
195119521953
Date
Oct. 19
Feb. 7Feb. 17Dec. 28
Gage height (feet)
48.10
46.4147.9449.20
Discharge (cfs)
796
555731
1,020
(28) Oklawaha River near Ocala, Fla.
Location. Lat 29°11', long 82°00', in sec. 15, T. 15 S., R. 23 E., on left bank about 15 ft upstream from county highway bridge known as Sharpes Ferry, 2 miles upstream from Silver
River, and 9 miles east of Ocala.
Drainage area. 1,100 sq mi, approximately.
Records available. U. S. Geological Survey: February 1930 to December 1953, daily gage heights and discharges.
Gage. Water-stage recorder. Datum of gage is 36.52 ft above mean sea level, datum of 1929,supplementary adjustment of 1937 (Corps of Engineers benchmark). Prior to Mar. 2, 1932, staff gage at same site and datum.
Stage-discharge relation. Defined by current-meter measurements below 1,400 cfs. Considerable shifting at all stages.
Annual peak stages and discharges
Calendar year
1930
19311932193319341935
19361937193819391940
*_ 1941
Date
Mar . 29
Apr. 5May 20Sept. 6June 15Aug. 25
Apr. 1Aug. 31July 19Aug. 29Feb. 19
July 31
Gage height (feet)
4.12
4.001.255.525.143.59
-4.58--
2.04
2.85
Discharge (cfs)
1,110
1,160333
1,0301,810
862
8621,720
736906525
698
Calendar year
1942194319441945
19461947194819491950
195119521953
Date
Jan. 6, 7Aug. 21Oct. 19Sept. 17
Feb. 28Sept. 24Aug. 19-22Aug. 28Sept. 6
Nov. 17Feb. 18Dec. 24
Gage height (feet)
3.553.004.264.08
3.993.92-
4.154.86
2.743.634.55
Discharge (cfs)
905723
1,3401,250
1,2001,1601,0201,2201,590
631968
1,470

56 FLOODS IN FLORIDA
St. Johns River Basin
(29) Silver Springs near Ocala, Fla.
Location. Measuring point for discharge measurements at lat 29,13', long 82°02', in sec. 6,T. 15 S., R. 23 E., 700 ft downstream from Paradise Landing, 0.7 mile downstream from head of springs and 6.0 miles northeast of Ocala.
Records available. U. S. Geological Survey: gage heights and daily discharges.
January 1933 to December 1953, daily or weekly
Gage. Water-stage recorder at head of springs in boat repair basin. Datum of gage is 38.96 ft above mean sea level, datum of 1929. Prior to Feb. 20, 1947, staff gage at same site and datum.
Auxiliary water-stage recorder on Sharpes Ferry artesian well about 400 ft east of Oklawaha River, 2 miles upstream from Silver River, and 4.2 miles southeast of head of springs. Datum of gage is 42.36 ft above mean sea level, datum of 1929, supplementary adjustment of 1937 (Corps of Engineers benchmark).
Stage-discharge relation. No relation between stage at head of springs and discharge of springs becuase of backwater effect from Oklawaha River. Discharge computed from relation between artesian pressure at Sharpes Ferry well and discharge at measuring point. This relation is well defined by current-meter measurements and minor shifts have occurred.
Annual peak stages and discharges
Calendar year
1933
1934
1935
1936
1937
1938
19391940
1941
1942
1943
Date
Sept. 6Oct. 7June 16July 7Sept. 28Oct. 19
June 6June 20Oct. 16Oct. 23Jan. 1July 30Sept. 30Jan. 1, 2Jan. 4
Dec. 18Dec. 31Apr. 17-19July 27Sept. 20Oct. 2
Gage height (feet)
head of springs
5.50-
3.40-
2.79-
2.79-
2.54-_
2.192.05-
1.19
2.02--
2.962.07-
Discharge (cfs)
.1,140
-1,060
-958
-974-926894-854758-
-908
1,030--854
Calendar year
1944
1945
1946
1947
1948
1949
1950
1951
1952
1953
Date
Oct. 20Nov. 28Sept. 17Oct. 3-6
Sept. 22Dec. 2Sept. 24Nov. 11Sept. 22Oct. 4Oct. 11-13Oct. 12-15Oct. 19Nov. 2-4
Jan. 1-3Jan. 7Feb. 17Apr. 13Oct. 24Dec. 24
Gage height (feet)
head of springs
2.87' -3.18-
2.60-
-2.92--
2.862.83-
3.51-
2.31-
2.21--
3.15
Discharge (cfs)
838-
1,060
-1,010
-1,0501,110
--
1,120-
1,150
-1,030
-938
1,030-

GAGING STATION RECORDS 57
St. Johns River Basin
(30) Oklawaha River near Conner, Fla. /
Location. Lat 29°13', long 81°59', in sec. 3, T. 15 S., R. 23 E. t on right bank about 15 ft ' downstream from bridge on State Highway 40, a quarter of a mile downstream from Silver River,
about li miles southwest of Connor, and 8 miles east of Ocala.
Drainage area. 1,180 sq mi, approximately.
Records available. U. S. Geological Survey: February 1930 to September 1946, dally gage heights and discharges.
Gage Water-stage recorder. Datum of gage is 31.79 ft above mean sea level, datum of 1929. Feb. 13, 1930, to Aug. 23, 1935, staff gage and Aug. 24, 1935, to June 11, 1939, water-stage
recorder at upstream side of bridge at same datum.
Stage-discharge relation.--Defined by current-meter measurements below 3,630 cfs. Considerable shifting at all stages.
Annual peak stages and discharges
Calendar year
1930
19311932193319341935
19361937
_ 1938
Date
Mar. 29
Apr. 6June 19Sept. 6June 15Sept. 5
June 3Aug. 31July 29
Gage height (feet)
7.37
7.294.699.148.506.65
6.787.586.50
Discharge (cfs)
2,280
2,430945
3,7003,4301,860
1,8602,5901,680
Calendar year
19391940
19411942194319441945
1946
Date
Aug. 30Feb. 19, 20
Apr. 5July 27
Aug. 21, Sept. 22Oct. 20Sept. 17
Feb. 28
Gage height (feet)
6.285.41
-6.67-
7.337.14
6.86
Discharge (cfs)
1,7201,290
1,4601,8901,4502,3202,190
2,120
(31) Oklawaha River at Eureka, Fla.
Location.--Lat 29°22 r, long 81°54', in sec. 9, T. 13 S., R. 24 E., on right bank 20 ft upstream from bridge on State Highway 316 in Eureka, and 3 miles downstream from Eaton Creek.
Drainage area.--1,420 sq mi, approximately.
Records available.--U. S. Geological Survey: February 1930 to June 1934, September 1943 to December 1952, daily gage heights and discharges.
Gage.--Water-stage recorder. Datum of gage is 15.44 ft above mean sea level, datum of 1929 (Corps of Engineers benchmark). Prior to Nov. 19, 1943, staff gage at same site and datum.
Stage-discharge relation.--Defined by current-meter measurements below 2,800 cfs. Considerable shifting at all stages.

58 FLOODS IN FLORIDA
St. Johns River Basin
(31) Oklawaha River at Eureka, Fla. Continued
Annual peak stages and discharges
Calendar year
1930
1931193219331934
194319441945
Date
Mar . 31
Apr. 7June 20Sept. 7June 17
Sept. 22Oct. 21Sept. 18
Gage height (feet)
8.02
7.885.13
11.010.06
7.008.758.42
Discharge (cfs)
3,400
3,0301,0806,2605,360
2,2203,9503,520
Calendar year
19461947194819491950
19511952
Date
Mar. 2Sept. 25Oct. 5Aug. 30Sept. 7
Sept. 21Feb. 19
Gage height (feet)
7.607.817.528.03
10.12
6.747.16
Discharge (cfs)
2,7602,9402,7503,2305,370
2,1202,460
(32) Newnans Lake near Gainesville, Fla.
Location. --La t 29°39', long 82°14', in w£ sec. 5, T. 10 S. , R. 21 E. , on west shore of lake at Myers fish camp, 5 miles east of Gainesville.
Records available. Corps of Engineers: April 1936 to December 1947, once monthly gage heights, U. S. Geological Survey: November 1945 to September 1952, twice weekly gage heights.
Gage. Staff gage. Datum of gage is 63.33 ft above mean sea level, datum of 1929. June 27, 1951, at various nearby locations at same datum.
Prior to
Annual peak stages
Calendar year
1936 19371938 1939 1940
1941 19421943 1944
a Maxim Note.
stage may
Date
Apr. - Oct. -Jan. - July - Mar. -
Nov. - Jan. -Oct. - Nov. -
Gage height (feet)
«3.7 "5.0"4.3 «5.9 a 4.1
a 5.2a 4.8°2.6 a5.2
Calendar year
1945
1946 1947 19481949 1950
1951 1952
Date
Dec. 29
Aug. 5 Oct. 27 Mar. 12Sept. 6 Sept. 12
Nov. 23 Mar. 4
Gage height (feet)
5.14
6.39 6.64 7.885.42 6.18
4.50 4.85
urn observed monthly reading; prooaoiy not maximum during year. Readings for years 1945-52 were maximum observed at twice-weekly intervals; peak have been slightly higher.

GAGING STATIONS RECORDS 59
St. Johns River Basin
' (33) Orange Lake near Boardman, Fla.
Location.--Lat 29°27', long 82°11', In sec. 15, T. 12 S., R. 21 E., on southwest shore of lake, 11 miles southeast of Boardman.
Records available. Corps of Engineers: November 1935 to December 1947, once monthly gage heights from gage located in town of Orange Lake. U. S. Geological Survey: November 1945 to
May 1948, daily or twice weekly gage heights.
Gage Staff gage. Datum of gage is 53.44 ft above mean sea level, datum of 1929. Datum of Corps of Engineers staff gage at town of Orange Lake was 56.2 ft above mean sea level. Gage
heights collected at the two locations are comparable. (All gage heights shown below have been reduced to elevations above mean sea level).
Annual peak stages
Calendar year
19361937193819391940
19411942
Date
Mar. -Oct. -Jan.Aug. -
^ay-, Aug.-, Sept. -
Nov.Jan. -, Apr. -
Elevation,feet above
mean sea level
°59.0a 59.6a 59.1a 60.0a58.2
a61.5a60.1
Calendar year
194319441945
194619471948
Date
Jan.Nov.Oct. -
Oct. 12Nov. 19Mar. 19
Elevation,feet above
mean sea level
a57.4a 58.4a59.0
60.8460.6861.62
Maximum observed monthly reading; probably not maximum during year.
(34) Orange Lake Outlet near Citra, Fla.
Location. Lat 29°26', long 82°07', in sec. 21, T. 12 S., R. 22 E., on left bank 15 ft upstream from bridge on U. S. Highway 301 and State Highway 200, 0.8 mile south of Island Grove, and
1.5 miles north of Citra.
Drainage area. Indeterminate. Total drainage area of Orange Lake Outlet and Lochlooss Lake Outlet above highway is 323 sq mi.
Records available. U. S. Geological Survey: November 1941, three discharge measurements; July '1942 to December 1946, daily gage heights; January 1947 to December 1953, daily gage heights
and discharges.
Gage. Water-stage recorder. Datum of gage is 53.41 ft above mean sea level, datum of 1929.July 2, 1942, to June 27, 1943, staff gage at same site and at datum 2.00 ft higher. June 28, 1943, to Mar. 27, 1947, staff gage and same site and datum.
Stage-discharge relation. Defined by current-meter measurements for period 1947 to 1953.Shifting channel and channel improvement work preclude computation of discharge maxima for other years.
Historical data. Flood of October 1941 reached a stage of 7.7 ft, from floodmarks on bridge.
Remarks. Orange and Lochloosa are connected by Cross Creek through which there may be a natural diversion from one lake to the other.
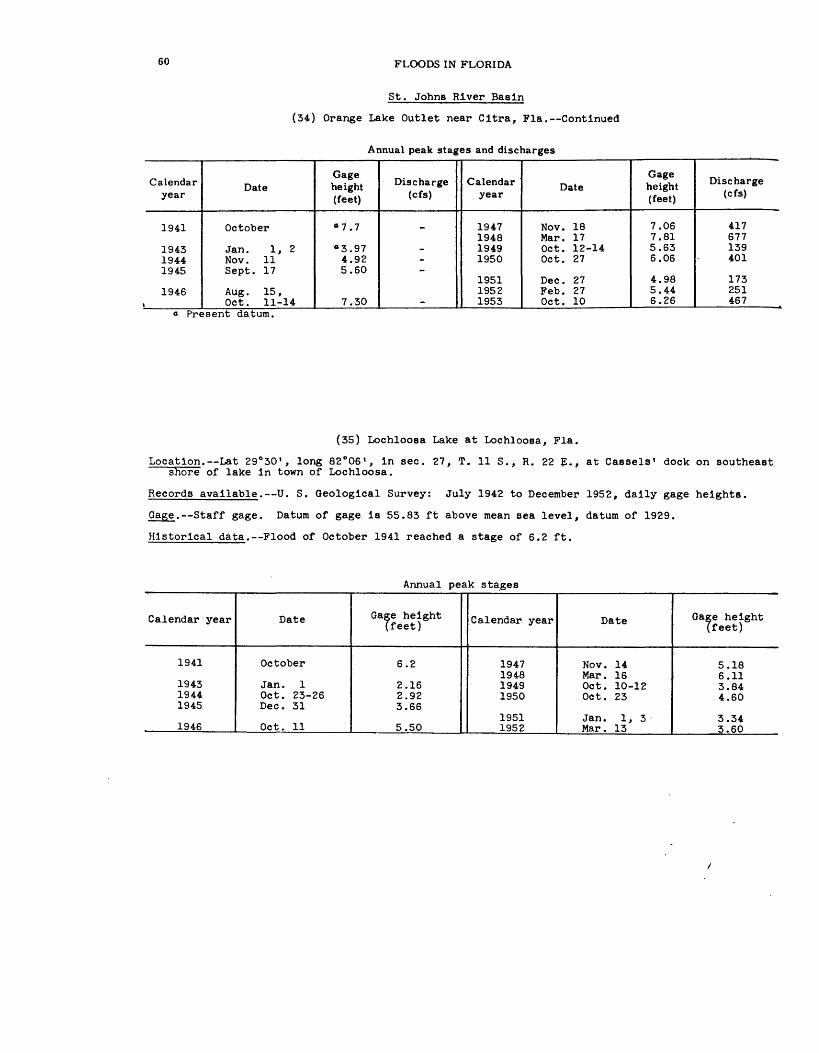
60 FLOODS IN FLORIDA
St. Johns River Basin
(34) Orange Lake Outlet near Citra, Fla. Continued
Annual peak stages and discharges
Calendar year
1941
194319441945
1946
Date
October
Jan. 1, 2Nov. 11Sept. 17
Aug. 15,Oct. 11-14
Gage height (feet)
«7.7
«3.974.925.60
7.30
Discharge (cfs)
_--
-
Calendar year
1947194819491950
195119521953
Date
Nov. 18Mar. 17Oct. 12-14Oct. 27
Dec. 27Feb. 27Oct. 10
Gage height (feet)
7.067.815.636.06
4.985.446.26
Discharge (cfs)
417677139401
173251467
Present datum.
(35) Lochloosa Lake at Lochloosa, Fla.
Location. Lat 29°30', long 82°06', In sec. 27, T. 11 S., R. 22 ?., at Cassels 1 dock on southeast shore of lake In town of Lochloosa.
Records available. U. S. Geological Survey: July 1942 to December 1952, dally gage heights.
Gage. Staff gage. Datum of gage Is 55.83 ft above mean sea level, datum of 1929.
Historical data. Flood of October 1941 reached a stage of 6.2 ft.
Annual peak stages
Calendar year
1941
194319441945
1946
Date
October
Jan. 1Oct. 23-26Dec. 31
Oct. 11
Gage height (feet)
6.2
2.162.923.66
5.50
Calendar year
1947194819491950
19511952
Date
Nov. 14Mar. 16Oct. 10-12Oct. 23
Jan . 1,3Mar. 13
Gage height (feet)
5.186.113.844.60
3.343.60
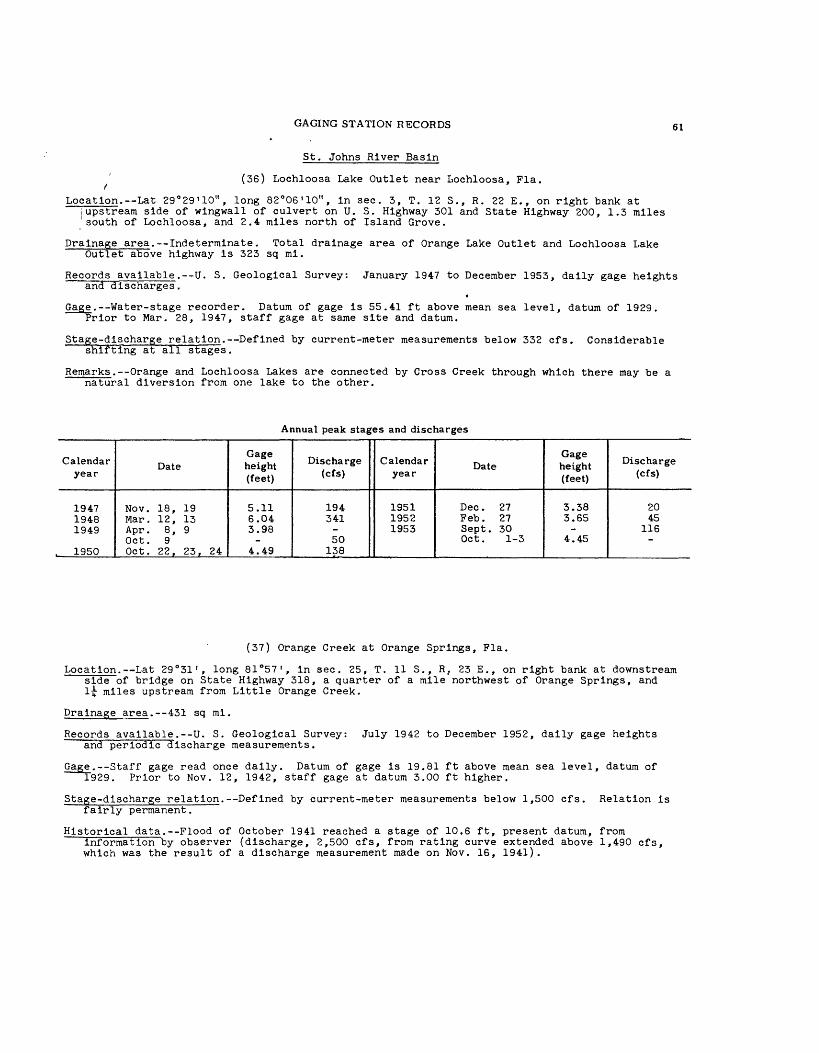
GAGING STATION RECORDS 61
St. Johns River Basin
(36) Lochloosa Lake Outlet near Lochloosa, Fla.
Location.--Lat 29°29'10", long 82°06'10", in sec. 3, T. 12 S., R. 22 E., on right bank at iupstream side of wingwall of culvert on U. S. Highway 301 and State Highway 200, 1.3 miles 'south of Lochloosa, and 2.4 miles north of Island Grove.
Drainage area.--Indeterminate. Total drainage area of Orange Lake Outlet and Lochloosa Lake Outlet above highway is 323 sq mi.
Records available.--U. S. Geological Survey: January 1947 to December 1953, daily gage heights and discharges.
Gage.--Water-stage recorder. Datum of gage is 55.41 ft above mean sea level, datum of 1929. Prior to Mar. 28, 1947, staff gage at same site and datum.
Stage-discharge relation. Defined by current-meter measurements below 332 cfs. Considerable shifting at all stages.
Remarks.--Orange and Lochloosa Lakes are connected by Cross Creek through which there may be a natural diversion from one lake to the other.
Annual peak stages and discharges
Calendar year
194719481949
. 1950
Date
Nov. 18, 19Mar. 12, 13Apr. 8, 9Oct. 9Oct. 22, 23, 24
Gage height (feet)
5.116.043.98-
4.49
Discharge (cfs)
194341-50
138
Calendar year
195119521953
Date
Dec . 27Feb . 27Sept. 30Oct. 1-3
Gage height (feet)
3.383.65-
4.45
Discharge (cfs)
2045
116-
(37) Orange Creek at Orange Springs, Fla.
Location. Lat 29°31', long 81°57', in sec. 25, T. 11 S., R. 23 E., on right bank at downstream side of bridge on State Highway 318, a quarter of a mile northwest of Orange Springs, and l£ miles upstream from Little Orange Creek.
Drainage area.--451 sq mi.
Records available.--U. S. Geological Survey: July 1942 to December 1952, daily gage heights and periodic discharge measurements.
Gage.--Staff gage read once daily. Datum of gage is 19.81 ft above mean sea level, datum of 1929. Prior to Nov. 12, 1942, staff gage at datum 3.00 ft higher.
Stage-discharge relation.--Defined by current-meter measurements below 1,500 cfs. Relation Is fairly permanent.
Historical data.--Flood of October 1941 reached a stage of 10.6 ft, present datum, frominformation by observer (discharge, 2,500 cfs, from rating curve extended above 1,490 cfs,which was the result of a discharge measurement made on Nov. 16, 1941).
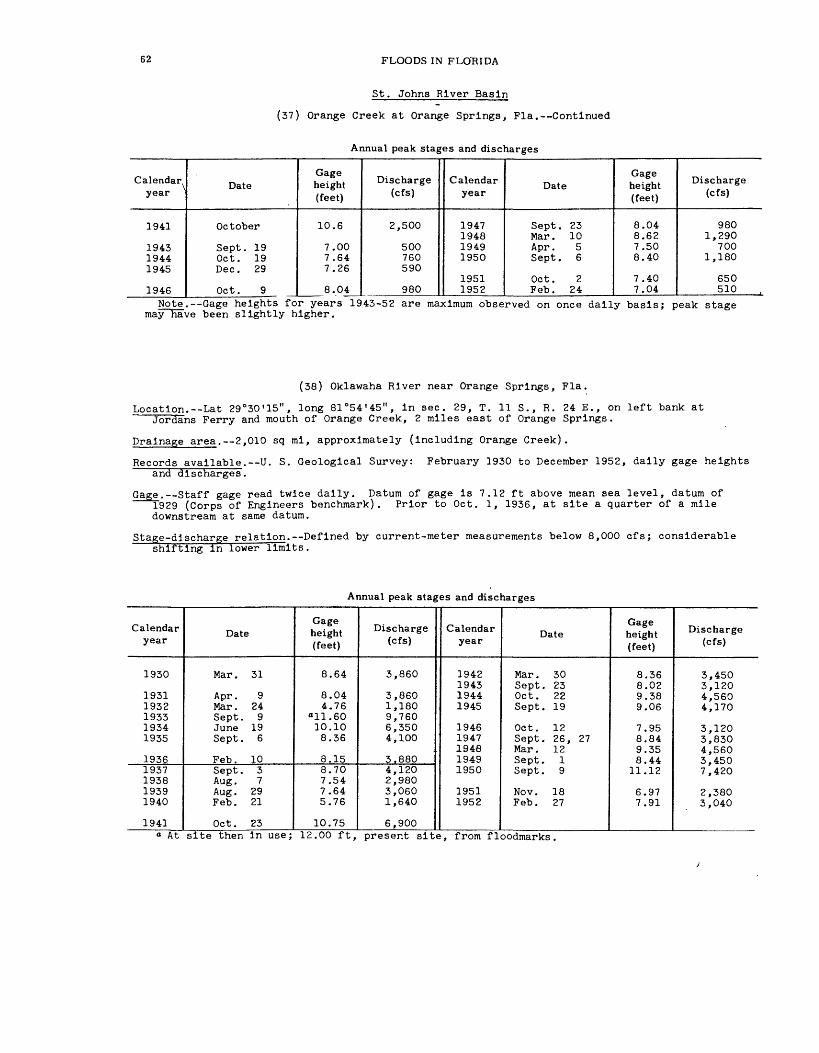
62 FLOODS IN FLORIDA
St. Johns River Basin
(37) Orange Creek at Orange Springs, Fla. Continued
Annual peak stages and discharges
Calendar year
1941
194319441945
1946
Date
October
Sept. 19Oct. 19Dec. 29
Oct. 9
Gage height (feet)
10.6
7.007.647.26
8.04
Discharge (cfs)
2,500
500760590
980
Calendar year
1947194819491950
19511952
Date
Sept. 23Mar. 10Apr. 5Sept. 6
Oct. 2Feb. 24
Gage height (feet)
8.048.627.508.40
7.407.04
Discharge (cfs)
9801,290
7001,180
650510
Note.--Gage heights for years 1943-52 are maximum observed on once dally basis; peak stage may have been slightly higher.
(38) Oklawaha River near Orange Springs, Fla.
Location. Lat 29°30'15", long 81°54'45", In sec. 29, T. 11 S., R. 24 E., on left bank at Jordans Ferry and mouth of Orange Creek, 2 miles east of Orange Springs.
Drainage area. 2,010 sq ml, approximately (Including Orange Creek).
Records available.--U. S. Geological Survey: February 1930 to December 1952, dally gage heights and discharges.
Gage. Staff gage read twice daily. Datum of gage Is 7.12 ft above mean sea level, datum of 1929 (Corps of Engineers benchmark). Prior to Oct. 1, 1936, at site a quarter of a mile downstream at same datum.
Stage-discharge relation. Defined by current-meter measurements below 8,000 cfs; considerable shifting In lower limits.
Annual peak stages and discharges
Calendar year
1930
19311932193319341935
19361937193819391940
1941
Date
Mar. 31
Apr. 9Mar . 24Sept. 9June 19Sept. 6
Feb. 10Sept. 3Aug. 7Aug. 29Feb. 21
Oct. 23
Gage height (feet)
8.64
8.044.76
a11.6010.108.36
8.158.707.547.645.76
10.75
Discharge (cfs)
3,860
3,8601,1809,7606,3504,100
3.8804,120.2,9803,0601,640
6,900
Calendar year
1942194319441945
19461947194619491950
19511952
Date
Mar . 30Sept. 23Oct. 22Sept. 19
Oct. 12Sept. 26, 27Mar. 12Sept. 1Sept. 9
Nov. 18Feb. 27
Gage height (feet)
8.368.029.389.06
7.958.849.358.44
11.12
6.977.91
Discharge (cfs)
3,4503,1204,5604,170
3,1203,8304,5603,4507,420
2,3803,040
0 At site then in use; 12.00 ft, present site, from floodmarks.

GAGING STATION RECORDS 63
St. Johns River Basin
(39) Oklawaha River at Riverside Landing, near Orange Springs, Fla.
Location.--Lat 29°30', long 81°48', In sec. 33, T. 11 S., R. 25 E., at Riverside Landing on right bank near boat dock, 8-5- miles east of Orange Springs.
Drainage area. 2,100 sq ml, approximately.
Records available. U. S. Geological Survey: October 1943 to December 1953, dally gage heights and discharges.
Gage. Water-stage recorder. Datum of gage Is at mean sea level, datum of 1929 (Corps of Engineers benchmark).
Stage-discharge relation. Defined by current-meter measurements below 5,800 cfs.
Annual peak stages and discharges
Calendar year
1944 1945
1946 1947
. 1948
Date
Oct. 23 Sept. 20
Sept. 21 Sept. 24 Mar. 12
Gage height (feet)
8.54 8.25
7.60 8.57 8.83
Discharge (cfs)
5,550 5,040
4,100 5,720 6,060
Calendar year
1949 1950
1951 1952 1953
Date
Sept. 2 Sept. 10
Oct. 3 Feb. 27 Oct. 4
Gage height (feet)
7.74 9.50
7.57 7.35 8.30
Discharge (cfs)
4,370 7,320
4,180 3,840 5,480
(40) South Fork Black Creek near Penney Farms, Fla.
Location. Lat 29°59', long 81°51', In sec. 13, T. 6 S., R. 24 E., on right bank about 20 ftdownstream from bridge on State Highway 16, half a mile downstream from Greens Creek, 2\ miles west of Penney Farms, and 10 miles west of Green Cove Springs.
Drainage area.--154 sq ml.
Records available. U. S. Geological Survey: November 1939 to December 1953, dally gage heights and discharges.
Gage. Water-stage recorder. Datum of gage Is 9.82 ft above mean sea level, datum of 1929("levels by Corps of Engineers). Prior to July 18, 1940, staff gage at same site and datum.
Stage-discharge relation. Defined by current-meter measurements below 8,000 cfs.
Annual peak stages and discharges
Calendar year
1940
19411942194319441945
, _ 1946
Date
Dec . 25
Oct. 21, 22Mar . 15Aug. 15Oct. 19Sept. 17
May 20
Gage height (feet)
14.16
21.6514.7419.8726.3317.13
13.91
Discharge (cfs)
1,650
8,5601,8506,240
13,9003,940
1,530
Calendar year
1947194819491950
195119521953
Date
Sept. 24Mar. 11Oct. 2Oct. 19
Nov. 17Oct. 22Apr . 20
Gage height (feet)
22.6019.2414.7721.25
10.9513.7119.40
Discharge (cfs)
9,3905,9701,9007,970
9701,4705,790

64 FLOODS IN FLORIDA
St. Johns River Basin
(41) North Fork Black Creek near Middleburg, Fla.
Location. Lat 30°06'50", long 81°54'35", in sec. 33, T. 4 S., R. 24 E., at left bank, a third of a mile upstream frc= Big Branch, 4 miles northwest of Middleburg, and 6£ miles upstream from confluence with South Fork.
Drainage area.--174 sq ml.
Records available. U. S. Geological Survey: November 1931 to December 1953, dally gage heights and discharges.
Gage. Staff gage read twice daily. Datum of gage Is 0.62 ft above mean sea level, datum of1929 (levels by Corps of Engineers). Prior to Mar. 29, 1933, at site three-eighths of a mile downstream at different datum.
Stage-discharge relation. Defined by current-meter measurements below 7,000 cfs.
Historical data. Maximum stage known, 25.3 ft In June 1919, from Information by old resident (discharge, 15,000 cfs, from rating curve extended above 7,000 cfs).
Annual peak stages and discharges
Calendar year
1919
1932193319341935
19361937193819391940
1941
Date
June
Sect. 16Sept. 6June 15Sept. 6
Feb. 8Oct. 2Oct . 25Aug . 15Feb. 19
Oct. 22
Gageheight (feet)
25.3
8.8819.3518.5316.38
10.7218.0520.212.6613.68
18.44
Discharge (cfs)
15,000
9296,7205,5803,340
1,1904,6206,9901,4101,630
5,020
Calendar year
1942194319441945
19461947194819491950
195119521953
Date
Jan. 5Aug . 15Oct. 19Sept. 18
Oct. 9Sept. 24Oct. 3Feb. 7Oct. 19
Nov. 18Sep.t. 24Aug. 28
Gage height (feet)
16.0715.2823.7617.32
16.8822.3421.5717.9220.88
6.2211.6017.78
Discharge (cfs)
2,8902,290
10,4003,950
3,5809,5608,8405,0208,120
5161,270 '4,890
Moultrle Creek Basin
(42) Moultrie Creek near St. Augustine, Fla.
Location. Lat 29°49'40n , long 81°21'00", In sec. 11, T. 8 S., R. 29 E., on right bank 6 ftdownstream from bridge on Kings Road, two-fifths of a mile upstream from Fort Peyton Branch, and 5 miles southwest of St. Augustine.
Drainage area.--25.5 sq ml.
Records available. D. S. Geological Survey: November 1939 to December 1953, daily gage heights and discharges.
Gage. Water-stage recorder and wooden control. Datum of gage is 2.17 ft above mean sea level, datum of 1929.
Stage-discharge relation.--Defined by current-meter measurements below 1,100 cfs.
Historical data. Maximum stage known, about 13 ft in 1919, from Information by local resident.

GAGING STATION RECORDS 65
Moultrie Creek Basin
(42) Moultrie Creek near St. Augustine, Fla. Continued
Annual peak stages and discharges
Calendar year
1919
1940
19411942194319441945
Date
Feb. 18
Oct. 21Mar . 14Sept. 20Oct. 19Sept. 17
Gage height (feet)
about 13
6.07
9.316.117.329.258.17
Discharge (cfs)
115
1,370180563
1,320852
Calendar year
19461947194819491950
195119521953
Date
Sept. 16Sept. 23Mar. 11Oct. 1Oct. 19
Nov. 11Oct. 23Sept. 24
Gage height (feet)
7.256.917.928.317.58
6.597.837.76
Discharge (cfs)
546433763909661
333738714
Lake Okeechobee and the Everglades
(43) Lake Ckeechobee, Fla.
Location. Center of lake, lat 26°57", long 80°50", in southern Florida.
Records available. Everglades Drainage District: 1912 to 1931, intermittent records of stage at various locations on the lake. Reliability of these records is questionable due to uncertainty of gage datum and location with respect to lake outlets and consequent drawdown and lockage effects. U. S. Geological Survey: April 1931 to December 1953, daily gage heights collected and furnished by Corps of Engineers.
Gage. Three staff gages, at Hurricane Gate No. 2_ Hurricane Gate No. 6, and Port Mayaca, read once daily. Oct. 1, 1941, to Dec. 31, 1950, seven staff gages at various locations on rim of lake. Prior to Oct. 1, 1941, staff gage at St. Lucie Canal.
Datum of gages is at mean sea level (levels by Corps of Engineers). Oct. 1, 1933, to June 30, 1947, datum of gage or gages was 1.44 ft below mean sea level (levels by Corps of Engineers). Prior to Oct. 1, 1933, datum of gage was 1.01 ft below mean sea level. (All gage heights tabulated below have been converted to present datum, at mean sea level).
Remarks.--Stage of lake regulated by gates at several lake outlets, elevation is computed from readings of 3 or more gages.
Since Oct. 1, 1940, average
Annual peak stages
Calendar year
1930
19311932193319341935
19361937193819391940
1941
Date
July 20-23
Jan. 6Nov. 12, 27Sept. 4Oct. 8, 9, 12Jan. 23
July 20Dec. 2 Jan. 4Nov. 1Feb. 22
Oct. 23, 25
Elevation, feet above
mean sea level
17.5
16.413.620.115.415.3
15.415.815.115.9015.78
15.21
Calendar year
1942194319441945
19461947194819491950
195119521953
Date
Feb. 25Dec. 16, 17Jan. 1Oct. 31
Mar. 19Nov. 2Oct. 18, 19Jan. 1Jan. 2
Oct. 13Oct. 28, 29Oct. 29
Elevation, feet above
mean sea level
15.2013.9213.7515.78
15.4618.7717.7715.5315.16
15.9715.8117.66
Note. Maximum stages shown above computed from readings of one gage prior to Oct. 1, 1941, and from average of 3 or more gages at various locations subsequent to that date.

66 FLOODS IN FLORIDA
Lake Okeechobee and the Everglades
(44) Flsheatlng Creek at Palmdale, Fla.
Location. Lat 26°56', long 81°19', in sec. 3, T. 41 S., R. 30 E., near right bank on downstream side of bridge on U. S. Highway 27, 1 mile south of Palmdale, and 16 miles upstream from Lake Okeechobee.
Drainage area.--455 sq mi, approximately.
Records available. U. S. Geological Survey: April 1931 to December 1953, daily gage heights and discharges.
Gage. Water-stage recorder. Datum of gage is 27.19 ft above mean sea level, datum of 1929. Prior to Mar. 16, 1949, staff gage at same site and datum.
Stage-discharge relation.--Defined by current-meter measurements below 21,000 cfs. Considerable shifting at all stages.
Annual peak stages and discharges
Calendar year
1932193319341935
19361937193819391940
19411942
Date
Sept. 13Sept. 6Aug. 9Sept. 7
June 15, 16July 1Oct. 17Aug. 29Sept. 12
Apr . 10Feb. 26
Gageheight (feet)
8.268.60-
6.42
8.106.987.146.926.92
6.707.04
Discharge (cfs)
5,5706,460
9201,480
5,8003,0103,2302,7903,090
2,7903,260
Calendar year
194319441945
19461947194819491950
195119521953
Date
Oct. 5Sept. 2Sept. 17
Sept. 23Sept. 19Sept. 24Aug. 29Sept . 9
Oct. 3Oct. 21Oct. 10
Gage height (feet)
7.306.309.18
5.9611.0610.527.865.88
12.447.778.53
Discharge (cfs)
3,6201,5008,980
94616,40014,5005,300
583
31,4004,9207,520
(45) Indian Prairie Canal near Okeechobee, Fla.
Location.--Lat 27 0 04', long 80°59', in sec. 24, T. 39 S., R. 33 E., on right bank at downstream side of bridge on State Highway 78, 2 miles upstream from shore of Lake Okeechobee corres ponding to lake elevation of 12.5 ft above mean sea level, and 15 miles southwest of town of Okeechobee.
Records available. U. S. Geological Survey: April 1931 to February 1933, daily gage heights and discharges, at site 3 miles upstream published as "near Lakeport". June 1939 to December 1950, daily gage heights and discharges. Corps of Engineers: January 1951 to December 1953, daily gage heights and discharges.
Gage. Water-stage recorder. Datum of gage is at mean sea level, unadjusted (levels by Corps of Engineers). April 1931 to February 1933, at site 3 miles upstream at different datum.
Stage-discharge relation.--Poorly defined by current-meter measurements, affected by backwater from Lake Okeechobee and hyacinth Jams.

GAGING STATION RECORDS 67
Lake Okeechobee and the Everglades
(45) Indian Prairie Canal near Okeechobee, Fla. Continued
Annual peak stages and discharges
Calendar year
19311932
19391940
19411942194319441945
1946a Est
Date
Mar. 7Sept. 15
Aug. 12Sept. 11, 12
July 18June 14Aug . 31Sept. 12Sept. 16
AUK. 4
Gage height (feet)
20.421.00
17.6217.46
17.2217.4917.3715.7318.05
16.34
Discharge (cfs)
9001,140
704&517
1,0901,240
72877
1,540
315
Calendar year
1947
1948
19491950
1951
1952
1953
Date
Sept. 18Oct. 12Oct. 5Oct. 16Aug. 28Oct. 21
Oct. 3Oct. 9Oct. 20Oct. 21Oct. 27
Gage height (feet)
_19.10
18.5018.4414.05
18.16--
18.0118.76
Discharge (cfs)
1,610
1,880_
1.880*149
-»>1,500&1,500
-*2,480
Imated.b Maximum daily.
(46) Alligator Lake near Ashton, Fla.
Location. Lat 28°13'59", long 81°11'25", In sec. 14, T. 26 S., R. 31 E., on dock on northeast shore of lake, 300 ft east of canal connecting Alligator Lake and Lake Lizzie, 350 ft southwest of U. S. Highway 192, and 4 miles east of Ashton.
Records available. U. S. Geological Survey: November 1941 to December 1953, dally gage heights,
gage.--Staff gage read once dally. Datum of gage Is 60.74 ft above mean sea level (levels by Corps of Engineers).
Historical data. High water of June 1934, reached a stage of about 7.0 ft, from information by observer.
Annual peak stages
Calendar year
1934
1942194319441945
19461947
Date
June
July 6Sept. 22, 23Oct. 21Sept. 19, 20
Oct. 10Oct. 13
Gage height (feet)
7.0
4.964.555.645.28
3.925.28
Calendar year
194819491950
19511952
1953
Date
Oct. 6, 7Oct. 6Jan. 1
Nov. 23Oct. 28-31;Nov. 1, 3Oct. 11
Gage height (feet)
5.484.803.50
4.32
4.005.54
.

68 FLOODS IN FLORIDA
Lake Okeechobee and the Everglades
(47) Hart Lake near Narcoossee, Fla.
Location. Lat 28°22'40", long 81°13'30", In sec. 21, T. 24 S., R. 31 E., near west shore of lake, 1.2 miles east of State Highway 15, and 5.5 miles north-northeast of Narcoossee.
Records available. U. S. Geological Survey: November 1941 to December 1953, dally gage heights,
Gage Staff gage read once dally. Datum of gage Is 55.74 ft above mean sea level (levels by Corps of Engineers). Prior to Dec. 11, 1942, staff gage at same site and at datum 2.22 ft
higher.
Annual peak stages
Calendar year
1942 1943 19441945
1946 1947
Date
July 18 Sept. 23 Oct. 27-30Sept. 20
Oct. 1, 2 Oct. 3
Gage height (feet)
B5.65 6.41 5.789.13
5.13 7.82
Calendar year
194S 1949 1950
19511952 1953
Date
Oct. 7 Oct. 6, 7 Oct. 24
Oct. 7-9Oct. 30, 31 Oct. 2, 4
Gage height (feet)
8.83 6.98 5.76
5.245.42 8.30
a Present datum.
(48) East Tohopekaliga Lake at St. Cloud, Fla.
Location. Lat 28°15'29", long 81°16'57", In sec. 2, T. 2? S., R. 30 E., In boat basin on south side of lake at St. Cloud.
Records available. U. S. Geological Survey: November 1941 to December 1953, dally gage heights.
Gage. Staff gage read once dally. Datum of gage Is 51.35 ft above mean sea level (Corps of Engineers benchmark). Prior to Mar. 5, 1943, staff gace was located on former city pier at approximately same location, at datum 2.61 ft higher.
Historical data. Flood of July 1930 reached a stage of i:.79 ft, present datum, from Information by Mr. J. C. Gallatln, St. Cloud.
Annual peak stages
Calendar year
1930
1942194319441945
1946
Date
July
Mar . 31Oct. 10, 11Nov. 3, 4, 6Sept. 24, 25
Jan. 1
Gage height (feet)
10.79
°6.696.666.70
10.37
6.38
Calendar year
isrists1S*S195C
195113:11953
Date
Oct. 13Oct. 13, 14Oct. 7-14Jan. 1, 2
Nov. 29Jan. 1Oct. 12, 13
Gage height (feet)
9.3710.068.676.66
7.286.68
10.630 Present datum.

GAGING STATION RECORDS 69
Lake Okeechobee and the Everglades
(49) Lake Tohopekaliga at Klssimmee, Fla.
Location. Lat 28°17'20", long 81°24'22", in sec. 27, T. 25 S., R. 29 E., on southeast end of municipal dock on north shore of lake at Kissimmee.
Records available.--U. S. Geological Survey: January 1942 to December 1953, daily gage heights.
Gage.--Water-stage recorder. Datum of gage is at mean sea level, datum of 1929. Prior toJune 15, 1950, water stage recorder was located on the west shore of lake about 9 miles south of Kissimmee. Datum of gage at this location was 50.36 ft above mean sea level (levels by Corps of Engineers). (All gage heights tabulated below have been reduced to present datum, at mean sea level).
Annual peak stages
Calendar year
1942 1943 1944 1945
1946 1947
Date
July 8 Oct. 7, 11, 12 Sept. 24, 25 Sept. 23, 24
Oct. 11 Oct. 13
Elevation, feet above
mean sea level
55.32 54.56 55.12 58.32
55.62 58.5
Calendar year
1948 1949 1950
1951 1952 1953
Date
Oct. 13 Oct. - Jan. 2-5
Nov. 26 Jan. 1 Oct. 10, 11
Elevation, feet above
mean sea level
57.79 57.62 55.75
55.70 55.02 58.62
Note . --Momentary peaKs are wina-anectea ana elevations snown are maximum mean aames .
(50) Cypress Lake near St. Cloud, Fla.
Location.--Lat 28°03'40", long 81°19'58", in SW£ sec. 8, T. 28 S., R. 30 E., about 580 ft from south shore of lake, 1,600 ft east of head of Cypress-Hatchineha Canal, and about 13 miles south of St. Cloud.
Records available. U. S. Geological Survey: January 1942 to December 1953, daily gage heights,
Gage.--Water-stage recorder. Datum of gage is 48.78 ft above mean sea level, datum of 1929 (levels by Corps of Engineers). Prior to June 6, 1950, at site on northwest shore of lake at same datum.
Annual peak stages
Calendar year
1942194319441945
19461947
Date
July 7, 8Oct. 10Nov. 1Sept. 23, 24
Oct. 9-11Oct. 11
Gage height (feet)
5.994.905.787.70
5.408.33
Calendar year
194819491950
195119521953
Date
Oct. 8Oct. 6, 7Jan. 5, 6
Nov. 28, 29Oct. 29Oct. 12, 13
Gage height (feet)
7.547.075.39
5.284.878.38
Note. Momentary peaks are wind-affected and elevations shown are maximum mean dailies

70 FLOODS IN FLORIDA
Lake Okeechobee and the Everglades
(51) Lake Butler at Windermere, Fla.
Location. Lat 28°30', long 81 0 32', In sec. 17, T. 23 S., R. 28 E., on east shore of lake at boat house of George A. Morley, near Intersection of 9th Avenue and Main Street, Wlndermere.
Records available.--Samuel Morley: January 1933 to November 1941, once weekly gage heights. U. S. Geological Survey: November 1941 to December 1953, dally gage heights.
Gage.--Staff gage read once dally. Datum of gage Is 96.40 ft above mean sea level, datum of i929. January 1933 to November 1941, readings from reference point were made once weekly by Samuel Morley. Elevation of reference point was 100.17 ft above mean sea level;. (All gage heights shown below have been reduced to elevations above mean sea level)..
Historical data.--High water of September 1926 reached a stage of 101.30 ft, from information by a local resident.
Annual peak stages
Calendar year
1926
193319341935
19361937193819391940
19411942
Date
Sept. -
Sept. 10Aug. 12Sept. 29
Mar . 15Oct. 24Jan . 2,9Oct. 22Sept. 15
Aug. 4July 11
Elevation,feet above
mean sea level
101.30
100.92 100.89 100.32
*100.42 100.22 100.11 100.02 99.50
100.42100.55
Calendar year
194319441945
19461947194819491950
195119521953
Date
Sept. 22, 23Oct. 20, 21Sept. 17
Sept. 24, 27Sept. 24Oct. 5Jan. 1, 2Oct. 24
Feb. 7, 8Mar. 27-30Oct. 1
_
Elevation,feet above
mean sea level
100.25101.06101.28
100.85101.17100.98100.0999.80
99.7999.86
101.03
Maximum observed weekly elevation; peak stage may have been slightly higher,
(52) Cypress Creek at Vineland, Fla.
Location. Lat 28°23'25", long 81°31'll", in sec. 21, T. 24 S., R. 28 E., on left bank at down stream side of bridge on State Highway 535, 1 mile west of Vineland.
Drainage area. 31.0 sq mi.
Reccrds available. U. S. Geological Survey: August 1945 to December 1953, daily gage heights ; .nd discharges.
Gage. Water-stage recorder. Datum of gage is 96.20 ft above mean sea level. Prior to June 13, 1946, staff gage at same site and datum.
Stage-discharge relation. Defined by current-meter measurements below 140 cfs. Considerable shifting at all stages.

GAGING STATION RECORDS
Lake Okeechobee and the Everglades
(52) Cypress Creek at Vineland, Fla.--Continued
71
Annual peak stages and discharges
Calendar year
1945
1946194719481949
Date
Sept. 16
Aug. 14Sept. 18Jan. 24Sept. 29
Gage height (feet)
3.83
3.273.513.253.20
Discharge (cfs)
181
68112
6964
Calendar year
1950
195119521953
Date
Oct. 19
Aug. 6Mar. 27Sept. 27
Gage height (feet)
2.87
3.032.533.61
Discharge (cfs)
36
5716
135
(53) Reedy Creek near Loughman, Fla.
Location. Lat 28°15'48", long 81°32'12", in sec. 32, T. 25 S., R. 28 E., on left bank, 20 ft upstream from bridge on U. S. Highways 17 and 92, 2^- miles northeast of Loughman, and 3 miles downstream from Davenport Creek.
Drainage area. 117 sq mi (includes part of watershed in Reedy Creek Swamp which is indeter- minate).
Records available. U. S. Geological Survey: November 1939 to December 1953, daily gage heights and discharges.
Gag_e. Water-stage recorder. Datum of gage is 64.49 ft above mean sea level, datum of 1929. Prior to Aug. 20, 1940, staff gage at same site and datum.
.Stage-discharge relation.--Defined by current-meter measurements below 500 cfs. Some shifting and backwater from hyacinths at all stages.
Remarks. Records do not include diversions above station into Shingle Creek.
Annual peak stages and discharges
Calendar year
1940
19411942
194319441945
1946
Date
July 11
July 26June 13, 14Sept. 8, 9July 21, 22Oct. 22, 23Sept. 19
Sept. 23, 24
Gage height (feet)
3.14
3.973.27-
3.344.023.92
3.68
Discharge (cfs)
215
501-
282304530487
383
Calendar year
1947194819491950
195119521953
Date
Sept. 20, 21Sept. 24Aug . 30Oct. 21
Nov . 21Mar. 30, 31Aug. 30
-
Gage height (feet)
4.023.893.973.71
3.723.224.08
Discharge (cfs)
530484508381
405207513
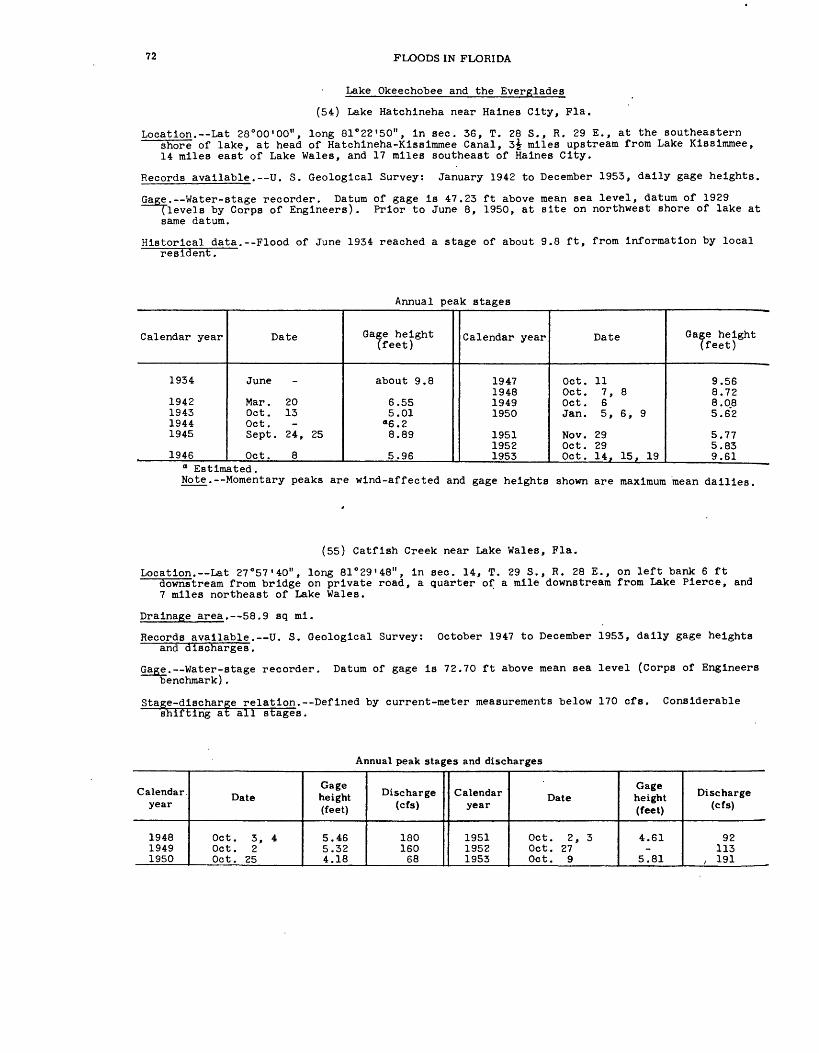
72 FLOODS IN FLORIDA
Lake Okeechobee and the Everglades
(54) Lake Hatchineha near Haines City, Fla.
Location. Lat 28°00'00", long 81°22'50", in sec. 36, T. 28 S., R. 29 E., at the southeastern shore of lake, at head of Hatchineha-Kissimmee Canal, 3£ miles upstream from Lake Kissimmee, 14 miles east of Lake Wales, and 17 miles southeast of Haines City.
Records available. U. S. Geological Survey: January 1942 to December 1953, daily gage heights.
Gage. Water-stage recorder. Datum of gage is 47.23 ft above mean sea level, datum of 1929(levels by Corps of Engineers). Prior to June 8, 1950, at site on northwest shore of lake at same datum.
Historical data.--Flood of June 1934 reached a stage of about 9.8 ft, from information by local resident.
Annual peak stages
Calendar year
1934
1942194319441945
1946
Date
June
Mar . 20Oct. 13Oct.Sept. 24, 25
Oct. 8
Gage height (feet)
about 9.8
6.555.01 6.28.89
5.96
Calendar year
1947194819491950
195119521953
Date
Oct. 11Oct. 7, 8Oct. 6Jan. 5, 6, 9
Nov. 29Oct. 29Oct. 14, 15, 19
Gage height (feet)
9.568.728.085.62
5.775.839.61
a Estimated.Note.--Momentary peaks are wind-affected and gage heights shown are maximum mean dailies,
(55) Catfish Creek near Lake Wales, Fla.
Location. Lat 27°57'40", long 81°29'48", in sec. 14, T. 29 S., R. 28 E., on left bank 6 ftdownstream from bridge on private road, a quarter of a mile downstream from Lake Pierce, and 7 miles northeast of Lake Wales.
Drainage area.-~58.9 sq mi.
Records available. U. S. Geological Survey: October 1947 to December 1953, daily gage heights and discharges.
Gage. Water-stage recorder. Datum of gage is 72.70 ft above mean sea level (Corps of Engineers benchmark).
Stage-discharge relation.--Defined by current-meter measurements below 170 cfs. Considerable shifting at all stages.
Annual peak stages and discharges
Calendar year
1948 1949 1950
Date
Oct. 3, 4 Oct. 2 Oct. 25
Gage height (feet)
5.46 5.32 4.18
Discharge (cfs)
180 160 68
Calendar year
1951 1952 1953
Date
Oct. 2, 3 Oct. 27 Oct. 9
Gage height (feet)
4.61
5.81
Discharge (cfs)
92 113
, 191

GAGING STATION R ECORDS 73
Lake Okeechobee and the Everglades
(56) Lake Kissimmee near Lake Wales, Fla.
Location. Lat 27°57'05", long 81°20'15", in NE£ sec. 34, T. 29 S., R. 30 E., at the northwestern shore of lake, 1 mile southeast of the outlet of Hatchineha-Kissimmee Canal, and 16 miles east of Lake Wales.
Records available. U. S. Geological Survey: March 1942 to December 1953, daily gage heights.
Gage.--Water-stage recorder. Datum of gage is 46.94 ft above mean sea level, datum of 1929 ^levels by Corps of Engineers). Prior to May 12, 1950, at site on southwest shore of lake
and same datum.
Annual peak stages
Calendar year
1942194319441945
19461947
Date
Mar . 30Oct. 14Nov. 11, 12Sept. 18-22
Oct. 13Sept.
Gage height (feet)
6.224.455.328.80
5.329.77
Calendar year
194819491950
195119521953
Date
Oct. 6-8Oct. 5-7Jan. 1
Dec. 8Nov. 1Oct. 12, 13
Gage height (feet)
8.787.704.95
4.835.709.70
Note. Momentary peaks are wind-affected and gage heights shown are maximum mean dailies except that for September 1947.
(57) Weohyakapka-Rosalie Canal near Lake Wales, Fla.
.Location. Lat 27°52', long 81°23', in sec. 14, T. 30 S., R. 29 E., near left bank at downstream side of bridge on State Highway 60, 11^ miles east of Lake Wales.
Records available. U. S. Geological Survey: August 1942 to August 1948, daily gage heights and periodic discharge measurements.
Gage. Water-stage recorder. Datum of gage is 55.23 ft above mean sea level (Corps of Engineers benchmark).
Stage-discharge relation.--Not defined; affected by backwater from Lake Rosalie.
Historical data. Flood of September 1933 reached a stage, of 7.6 ft, from floodmarks on piles and information by a local resident.
Annual peak stages
Calendar year
1933
1943 __ 1944
Date
Sept.
Oct. 11 Sept. 15, 18
Gage height (feet)
7.6
3.38 4.40
Calendar year
1945
1946 1947
Date
Sept. 18
Aug. 4-6 Sept. 24
Gage height (feet)
5.99
4.23 6.21

74 FLOODS IN FLORIDA
Lake Okeechobee and the Everglades
(58) Klsslmmee River below Lake Kissimmee, Fla.
Location.--Lat 27°46'13", long 81°10'45", In sec. 24, T. 31 S., R. 31 E., on right bank about 3 miles downstream from Lake Klsslmmee and bridge on State Highway 60, and 22 miles east of Frostproof.
Drainage area. 1,609 sq ml at State Highway 60 (includes areas drained by Lake Weohyakapka and Lake Marian).
Records available. Okeechobee Flood Control District: January 1930 to June 1931, dally gage heights. U. S. Geological Survey: June 1931 to December 1953, dally gage heights and discharges (records unpublished prior to October 1933).
Gage.--Water-stage recorder. Datum of gage Is 43.48 ft above mean sea level, datum of 1929(levels by Corps of Engineers). Prior to Mar. 21, 1934, staff gage at bridge 3 miles upstream at datum 44.73 ft lower. Mar. 21, 1934, to Sept. 30, 1950, water-stage recorder at present site at datum 45.00 ft lower than present datum. Since Mar. 21, 1934, gage at bridge 3 miles upstream used as supplemental gage. (All gage heights shown below have been reduced to mean sea level).
Stage-discharge relation. Defined by current-meter measurements. Considerable shifting at all stages caused by dikes and levees In the flood plain below the station.
Annual peak stages and discharges
Calendar year
1930
19311932193319341935
19361937193819391940
1941
Date
June, July -
Jan. 21Oct. 6Sept. 22-24June 24Oct. 25
Mar. 17Dec. 3, 6Aug. 10Sept. 29Mar. 8
Sept. 20
Gage height (feet)
55.45
52.9548.5454.5754.7450.11
52.4052.3549.8152.6651.00
52.61
Discharge (cfs)
8,750
2,230499
5.3507,150
849
1,9401,940
7682,2301,130
2,040
Calendar year
1942194319441945
19461947194819491950
1951
19521953
Date
July 22Oct. 17Nov . 21Sept. 20
Oct. 15Oct. 13Oct . 5 or 6Oct. 4, 7Nov. 25
Dec. 12Dec. 17Oct. 29Oct. 9
Gage height (feet)
52.7951.1351.9155.16
51.8856.1855.4054.1550.64
51.70-
52.5756.64
Discharge (cfs)
1,630962
1,1606,130
1,8106,8508,8205,1301,120
.1,6502,0107,170
(59) Klsslmmee River at Fort Klsslmmee, Fla.
Location.--Lat 27°35', long 81°09', In sec. 19, T. 33 S., R. 32 E., on right bank at Fort Klsslmmee, 21 miles east of Avon Park.
Records available. U. S. Geological Survey: December 1941 to December 1953, dally gage heights,
Gage. Water-stage recorder. Datum of gage Is 38.03 ft above mean sea level, datum of 1929 (levels by Corps of Engineers). Dec. 9, 1941, to Feb. 25, 1942, staff gage at site 500 ft downstream at different datum.
Stage-discharge relation. Not defined.

GAGING STATION RECORDS
Lake Okeechobee and the Everglades
(59) Klssimmee River at Fort Kissimmee, Fla. Continued
Annual peak stages
75
Calendar year
1942194319441945
19461947
Date
June 30Oct. 11, 12Oct. 25, 26Sept. 18
Sept. 22Sept. 23
Gage height (feet)
7.997.217.48
12.17
8.2911.84
Calendar year
19481949 .1950
195119521953
Date
Sept. 24Oct. 1Oct.
Nov. 20, 21Oct. 23Oct. 11
Gage height (feet)
11.97«10.247.4
7.269.07
12.89
* From fragmentary gage-height record; peak may have been slightly higher
(60) Reedy Lake Outlet near Frostproof, Fla.
Location. Lat 27°43'13", long 81°28'40", in NW£ sec. 1, T. 32 S., R. 28 E., on left bank 15 ft upstream from county road bridge, 100 ft downstream from Reedy Lake, and 3^ miles southeast of Frostproof.
Drainage area. 62.2 sq mi.
Records available. U. S. Geological Survey: October 1946 to December 1953, daily gage heights and discharges.
Gage.--Water-stage recorder and concrete control. Datum of gage is 76.05 ft above mean sea level, datum of 1929.
Stage-discharge relation. Defined by current-meter measurements. Considerable shifting as the result of changes in the elevation of the control and aquatic vegetation.
Annual peak stages and discharges
Calendar year
1947 1948 1949
_ 1950
Date
Sept. 29 Oct. 5 Oct. 2 Oct. 21-24
Gage height (feet)
4.00 4.37 3.49
Discharge (cfs)
141 166 107 54
Calendar year
1951 1952 1953
Date
Oct. 2 Oct. 21 Oct. 9
Gage height (feet)
2.85 2.48 4.09
Discharge (cfs)
57 40
116

76 FLOODS IN FLORIDA
Lake Okeechobee and the Everglades
(61) Lake Arbuckle near Avon Park, Fla.
Location. Lat 27°39'50", long 81°22'40", In SW£ sec. 25, T. 32 S., R. 29 E., on downstream side of bridge across Arbuckle Creek at south side of lake, and 9 miles northeast of Avon Park.
Records available. U. S. Geological Survey: December 1941 to December 1953, dally gage heights.
Gage. Staff gage read once daily. Datum of gage is 51.53 ft above mean sea level, datum of 1929.
Historical data. Hurricane floods of 1926 and 1928 reached a stage of 7.2 ft.
Annual peak stages
Calendar year
1926
1928
1942194319441945
1946
Date
.
-
Mar . 19Sept. 1, 2Oct. 27, 28Sept. 17
Sept. 21
Gage height (feet)
7.2
7.2
3.564.203.626.20
4.32
Calendar year
1947194819491950
195119521953
Date
Sept. 24Sept. 24
Aug. 30, Oct. 1Oct. 21, 22
Oct. 6Oct. 24, 25Oct. 10, 11
Gage height (feet)
6.146.75.805.00
4.505.006.20
(62) Arbuckle Creek near De Soto City, Fla.
Location. Lat 27°26'33", long 81°17'5l", in SE£ sec. 11, T. 35 S., R. 30 E., on right bank 20 ft downstream from bridge on State Highway 700, 1 mile upstream from Lake Istokpoga, and 7 miles east of De Soto City.
Drainage area. 385 sq mi (excludes area drained by Lake Weohyakapka and inclines area drained by Lake Sebring). ; ;
Records available. U. S. Geological Survey: June 1939 to December 1953, daily gage heights and discharges.
Gage.--Water-stage recorder. Datum of gage is 35.51 ft above mean sea level, datum of 1929. June 24, 1942, to Oct. 19, 1943, staff gage at same site and datum.
Stage-discharge relation. Poorly defined by current-meter measurements below 5,300 cfs; affected By backwater from Lake Istokpoga.
Remarks. Records Include flow through 2 overflow bridges, 1.9 and 2.1 miles west of main channel.

GAGING STATION RECORDS 77
Lake Okeechobee and the Everglades
(62) Arbuckle Creek near De Soto City, Fla. Continued
Annual peak stages and discharges
Calendar year
19391940
194119421943
19441945
Date
Sept. 1Sept. 11, 12
July 26, 27Feb . 26July 18-21,Oct. 7Oct. 7Aug . 17Sept. 17
Gage height (feet)
7.847.26
7.526.33
-6.786.228.47
Discharge (cfs)
3,2701,920
2,7101,030
1,290
1,0906,540
Calendar year
19461947194819491950
1951
19521953
Date
Sept. 23, 24Sept. 23Sept. 23Aug. 29Oct. 23
July 26Oct. 4Oct. 23Oct. 10
Gage height (feet)
_8.208.717.426.07
-6.116.808.16
Discharge (cfs)
7005,6107,3803,1801,380
1,720-
2,7205,490
(63) Josephine Creek near De Soto City, Fla.
Location. Lat 27°22'26", long 81°23'37", in SE£ sec. 2, T. 36 S., R. 29 E., on left bank 320 ft downstream from bridge on State Highway 17, 1 mile downstream from Jack Creek, and 4 miles south of De Soto City.
Drainage area. 109 sq mi (excludes area drained by Lake Sebring).
Records available. U. S. Geological Survey: October 1946 to December 1953, daily gage heights and discharges.
Gage. Water-stage recorder. Datum of gage is 52.99 ft above mean sea level, datum of 1929 (State Road Department benchmark). Prior to May 21, 1952, at site half a mile upstream at datum 0.89 ft higher.
Stage-discharge relation. Defined by current-meter measurements.
Annual peak stages and discharges
Calendar year
1947 1948 1949 1950
Date
Sept. 19 Sept. 23 Aug. 28 Oct. 18
Gage height (feet)
9.55 11.56 9.31 5.81
Discharge (cfs)
900 1,780
792 88
Calendar year
19511952 1953
Date
Oct. 2Oct. 21 Oct. 10
Gage height (feet)
8.305.55 7.97
Discharge (cfs)
487184
1,180

78 FLOODS IN FLORIDA
Lake Okeechobee and the Everglades
(64) Lake Istokpoga near De Soto City, Fla.
Location. Lat 27°26'05", long 81°17'05", in sec. 13, T. 35 S., R. 30 E., near north shore of lake, about 500 ft east of mouth of Arbuckle Creek, 1 mile southeast of bridge on U. S. Highway 98 crossing Arbuckle Creek, and 7 miles east of De Soto City.
Records available. Corps of Engineers: August 1936 to August 1942, daily gage heights. U. S, Geological Survey: August 1942 to December 1953, daily gage heights.
Gage. Water-stage recorder. Datum of gage is 34.07 ft above mean sea level, datum of 1929. Prior to Aug. 20, 1942, Corps of Engineers staff gage on west shore of lake was read once daily. Aug. 11, 1936, to May 18, 1937, datum of gage was 40.54 ft above mean sea level, datum of 1929, and May 19, 1937, to Aug. 19, 1942, datum was 38.54 ft above mean sea level, datum of 1929. (All gage heights shown below have been reduced to elevations above mean sea level).
Annual peak stages
Calendar year
1937193819391940
19411942194319441945
Date
Dec. 9-21Aug.Oct. 6, 7Sept. 29 toOct. 3
Aug. 2-9July 24-28Oct. 11Jan . 2Sept . -
Elevation,feet above
mean sea level
39.4(a)41.2
41.6
41.040.441.3839.1643.22
Calendar year
19461947194819491950
195119521953
Date
Jan. 6Sept. 23Sept. 24Oct. 11Jan. 4-6
Apr. 22Nov. 5, 6Oct. 12
Elevation,feet above
mean sea level
39.7942.4742.4440.6338.77
39.5139.5242.27
a No gage-height record.Note.--Momentary peaks a-re wind-affected and gage heights shown are maximum mean dailies
except that for September 1945.
(65) Istokpoga Canal near Cornwell, Fla.
Location. Lat 27°24'01", long 81°09'35", in sec. 30, T. 35 S., R. 32 E., on right bank 30 ft downstream from old highway bridge, a quarter of a mile downstream from Seaboard Air Line Railroad bridge, If miles upstream from Kissimmee River, and 4^ miles northwest of Cornwell Post Office.
Drainage area. 624 sq mi.
Records available. U. S. Geological Survey: and discharges.
March 1934 to December 1953, daily gage heights
Gage. Water-stage recorder. Datum of gage is 29.71 ft above mean sea level (levels by Corps of Engineers). May 15, 1942, to Aug. 19, 1949, staff gage at same site and datum.
Since June 3, 1953, auxiliary water-stage recorder, below control, 1-J miles upstream.
Stage-discharge relation. Defined by current-meter measurements; affected by backwater from Kissimmee River. Since June 1953, discharges computed by using fall as determined from auxiliary water-stage recorder, as a factor.
Historical data. Flood of September 1933 reached a stage of 10.1 ft.
Remarks. Some diversions at times during high water from Lake Istokpoga into Indian Prairie and Harney Pond Canals when levees on southeast shore of lake are overtopped or washed out.

GAGING STATION RECORDS 79
Lake Okeechobee and the Everglades
(65) Istokpoga Canal near Cornwell, Pla. Continued
Annual peak stages and discharges
Calendar year
19331934
1935
19361937
193819391940
19411942
19431944
Date
SeptemberJune 21June 22Oct. 14
Mar. 17Oct. 23Dec. 6Jan. 8Oct. 1, 2Oct. 5
July 30Mar . 23June 13Oct. 3Sept. 1Nov. 2-4
Gageheight (feet)
10.18.59-
6.47
7.028.00-
6.327.167.16
7.477.40-
7.28-
5.99
Discharge (cfs)
_-755860
899-714471912
1,030
948-763
1,100426-
Calendar year
1945
1946
19471948
1949
1950
1951
19521953
Date
Sept. 20
Oct. 8Nov. 2Sept. 24, 25Sept. 22Oct. 6Oct. 4Oct. 14, 15Oct. 24
Oct. 2Oct. 26Oct. 27Oct. 9Oct. 12
Gage height (feet)
9.67
6.32-
9.90-
10.628.46
-6.56.
-7.378.13
-11.41
Discharge (cfs)
1,640
-399
1,6102,040
--
1,280401
1,130-
1,0701,860
-
(66) Kissimmee River near Cornwell, Pla.
Location. Lat 27°21'44", long 81°03'03", In sec. 8, T. 36 S., R. 33 E., on right bank 1,000 ft downstream from new Pearce Bridge on U. S. Highway 98 and State Highway 700, 3 miles southeast of Cornwell Post Office, and loj miles downstream from Istokpoga Canal.
Drainage area. 2,703 sq ml.
Records available. Everglades Drainage District: August 1928 to December 1930, dally gage ~heights.Okeechobee Flood Control District: January to June 1931, dally gage heights.
U. S. Geological Survey: June 1931 to December 1953, dally gage heights. October 1948 toSeptember 1951, dally discharges.
Gage_. Staff gage read twice dally. Datum of gage Is 24.64 ft above mean s.ea level (Corps of Engineers benchmark). Prior to Feb. 14, 1934, at same site at datum 5.36 ft below mean sea level. (All gage heights shown below have been reduced to elevations above mean sea level).
Stage-discharge relation. Relation for use October 1948 to September 1951 was defined bycurrent-meter measurements below 8,500 cfs. Backwater effect and shifting channel preclude computation of discharge maxima for other years.

80 FLOODS IN FLORIDA
Lake Okeechobee and the Everglades
(66) Kisslmmee River near Cornwell, Fla. Continued
Annual peak stages and discharges
Calendar year
192819291930
19311932193319341935
19361937193819391940
Date
Aug. 11, 12Oct. 31June 23, 24
Mar. 11Sept. 14Sept. 5June 22Oct. 15, 16
Mar. 15-18Oct. 24Jan. 8Sept. 26Oct. 6, 7
Gage height (feet)
35.933.134.8
32.431.40
»33.6433.8831.92
32.1033.2631.2932.4031.84
Discharge (cfs)
_-
----_
-_---
Calendar year
19411942194319441945
19461947194819491950
195119521953
Date
Aug. 3Feb. 25, 26Oct. 5Nov. 5-7Sept. 22
Jan. 1, 2Sept. 24Oct. 6Oct. 5Oct. 26
Oct. 3Oct. 28Oct. 12, 13
Gage height (feet)
32.2632.3232.2230.6634.64
31.2234.9035.4533.2031.64
32.8032.7436.12
Discharge (cfs)
_----
--
16,8008,6004,000
---
« Gage washed out Sept. 6, 1933, to Feb. 13, 1934; may have been higher during this period,
(67) Klsslramee River near Okeechobee, Fla.
Location. Lat 27°14'18", long 80 058'57", In sec. 24, T. 37 S., R. 33 E., on downstream end of left pier of bridge on State Highway 70, 9.4 miles west of Okeechobee, and approximately 13 miles upstream from Lake Okeechobee.
Drainage area. 2,886 sq ml.
Records available. Everglades Drainage District: August 1928 to December 1930, dally gage heights.U. S. Geological Survey: January 1931 to December 1953, dally gage heights and discharges (records unpublished prior to October 1930).
Gage. Water-stage recorder. Datum of gage Is 1.37 ft below mean sea level, datum of 1929. Prior to Apr. 28, 1949, staff gage at same site and datum.
Stage-discharge relation. Defined by current-meter measurements below 14,000 cfs. Considerable shifting at all stages.
Annual peak stages and discharges
Calendar year
192819291930
19311932193319341935
19361937193819391940
Date
Aug.Oct. 2June 23, 24
Mar. 8-10Sept. 16Sept . 9June 24Oct. 13
Mar. 16, 17Oct. 27Jan. 9-13Sept. 27Oct. 8
Gageheight (feet)
30.3«27.0
28.7
26.225.7029.3227.7226.04
25.8426.9024.8826.5625.54
Discharge (cfs)
20,000 7,26013,000
3,9103,210
15,6009,0004,330
3,2706,0802,3205,1503,360
Calendar year
19411942194319441945
19461947194819491950
195119521953
Date
July 31 to Aug. 5Feb. 27, 28Oct. 7Nov. 10-14Sept. 22
Sept. 20Sept. 25Oct. 7Oct. 6Oct. 28
Oct. 4Oct. 29Oct. 14
Gage height (feet)
25.9826.2026.2823.8827.90
24.8828.4229.3426.8424.92
26.2525.7228.37
Discharge (cfs)
4,2804,6504,8401,840
11,700
2,97013,00017,4008,300
f 3,740
7,2805,750
17,800
B Result of discharge measurement; peak may have been slightly higher.Note. Gage heights shown have not been reduced to elevations above mean sea level.

GAGING STATION RECORDS 81
Lake Okeechobee and the Everglades
(68) St. Lucie Canal at Lake Okeechobee, Fla.
Location.--Lat 26°59', long 80°37', in sec. 22, T. 40 S., R. 37 E., on downstream side of left pier of bridge on State Highway 15 at Lake Okeechobee, and 23.9 miles upstream from lock near Stuart.
Records available. U. S. Geological Survey: and .discharges.
April 1931 to September 1952, daily gage heights
Gage. Water-stage recorder. Datum of gage is at mean sea level, datum of 1929 (Corps of Engineers benchmark). Prior to Jan. 17, 1934, staff gage at site a quarter of a mile downstream at datum 1.13 ft lower. Jan. 17, 1934, to Mar. 16, 1951, water-stage recorder at Florida East Coast Railway bridge, 0.7 mile downstream at datum 1.56 ft lower. (All gage heights tabulated below have been reduced to present datum, at mean sea level).
Since Jan. 17, 1934, auxiliary water-stage recorder 10.8 miles downstream.
Stage-discharge relation. Defined by current-meter measurements; affected by fall. Discharge computed by using fall, as determined by auxiliary water-stage recorder, as a factor.
Remarks. Prior to Mar. 1, 1942, flow regulated by lock 1. regulated by lock near Stuart.
Subsequent to Mar. 1, 1942, flow
Annual peak stages and discharges
Calendaryear
1931193219331934
1935
1936
1937
1938
1939
1940
1941
1942
Date
Sept. 29Oct. 25Oct. 4Oct. 8Oct. 15Oct. 29
Mar. 17July 13Dec . 4Dec . 6Jan. 2Jan. 16Oct. 7Nov. 8Apr. 8Oct. 1, 2
Sept. 29Oct. 23Mar. 3
Daily gageheight
(feet abovemean
sea level)
(a)-
14.93-
14.9114.44
-
_14.5114.74
--
14.19-
14.5014.58
-
_14.6014.55
Discharge(cfs)
(a)2,8204,7404,540
_-
4,500
5,020--
5,0704,690
-3,490
--
4,500
4,040-
4,170
Calendaryear
1943
1944
1945
1946
19471948
1949
1950
1951
1952
Date
Jan. 2Oct. 26,Nov. 29,Dec. 12Jan. 3Nov. 11Oct. 25, 26Dec. 31
Feb. 24Mar. 21Nov. 2, 3Oct. 18Oct. 22-24Sept. 2-5Nov. 25Jan. 3, 4
Oct. 15Nov. 2, 6
-
Daily gageheight
(feet abovemean
sea level)
_
13.7813.73
--
15.51
(b)-
18.0417.10
--
14.9914.99
15.73-
(a)
Discharge(cfs)
1,050
--591
6,120-
-4,8007,070
-6,1106,700
(c)
-7,470(a)
a Incomplete records for year.b No gage-height record.c Lock closed entire year; discharge less than 10 cfs

82 FIOODS IN FLORIDA
Lake Okeechobee and the Everglades
(69) West Palm Beach Canal at Canal Point, Fla.
Location.--Lat 26°52', long 80°38', in sec. 34, T. 41 S., R. 37 E., at upstream end of lock at right bank in Canal Point, 350 ft downstream from State Highway 15 and 550 ft downstream from outlet from Lake Okeechobee.
Records available. U. S. Geological Survey: and discharges.
November 1939 to December 1953, daily gage heights
Gage. Staff gage read three times a day. Datum of gage is at mean sea level, datum of 1929. Since May 1940, auxiliary water-stage recorder below lock and dam.
Stage-discharge relation. There is no definite relation between stage and discharge at this station due to manipulation of boards in the spillway dam and because of various amounts of submergence. Ratings are based on relations between velocity at a point and mean velocity and between stage and area as defined by current-meter measurements. Velocity at a point observed three times a day.
Remarks. Flow regulated at station by manipulation of stoplogs in lock and dam and hurricane gates. Flow occasionally reversed after periods of considerable rainfall owing to downstream natural drainage and to pumping from agricultural lands in Everglades.
Annual peak stages and discharges
Calendar year
1940
1941
1942
1943
1944
1945
1946
1947
1948
1949
1950
1951
1952
1953
Date
Mar.MayAug.
SeptOct.Nov.Mar.JuneAug.SeptNov.Dec.Jan.Oct.Dec.SeptNov.Nov.
Feb.SeptOct.Feb.JulyOct.Mar.SeptOct.Jan.MaySeptJan.Apr.Oct.
Apr .SeptOct.Apr.Oct.Oct.JuneAug.Oct.
817, 2329
. 292263
1511
. 910161824, 2511
. 164
29
24. 23
28, 29. 5212318
. 289, 101
25. 2
36, 15
26, 27
3. 5
10, 115
222911, 8
12
Daily gage height
(feet above mean
sea level)
15.74--
_15.23
-15.73
----
14.1414.01
---
15.98-
15.62----
18.54--
17.4115.60
--
15.11--
_-
16.15--
16.03--
17.07
Daily discharge (cfs)
From lake
_577-
_-
541--
534-
440-_-
450--
462
_-
581524--
817---
749--
644-
584--
583--
586--
To lake
-780
1,050--_
1,760-575---938-
1,210--
_724--
1,280--
1,360---
1,020--
1,130
_484--589--736-

GAGING STATION RECORDS 83
Lake Okeechobee and the Everglades
(70) West Palm Beach Canal at West Palm Beach, Fla.
Location.--Lat 26°38'40", long 80°03'24", in NE£ sec. 16, T. 44 S., R. 43 E., on left bank at upstream side of lock and dam 20 ft upstream from bridge on State Highway 805 on Poinsettia Avenue and 4.9 miles south of court house in West Palm Beach.
Records available. U. S. Geological Survey: and discharges.
November 1939 to December 1953, daily gage heights
Gage. Water-stage recorder. Datum of gage is at mean sea level (State Road Departmentbenchmark). Prior to Apr. 26, 1940, staff gage, and Apr. 26, 1940, to Dec. 19, 1949, water- stage recorder at same site at datum 0.25 ft higher. (All gage heights tabulated below have been reduced to present datum, at mean sea level).
Stage-discharge relation. Head-discharge relation for flow through 4 bays in spillway dam and stage-discharge relation for flow through lock chamber defined by current-meter measurements.
Historical data. Maximum stage known, 13.20 ft, present datum, Oct. 23, 24, 1924, from records by Everglades Drainage District (discharge, 8,570 cfs).
Remarks. Flow regulated by manipulation of stoplogs in dam and gates in lock chamber for irrigation and drainage purposes by Central and Southern Florida Flood Control District. Lock chamber not used for navigation.
Annual peak stages and discharges
Calendaryear
1924
1940
1941
19421943
1944
1945
Date
Oct. 23or 24
Sept. 9Oct. 25
June 14Sept. 24Apr . 18Oct. 3Nov. 1Oct. 16Oct. 18June 23Sept. 18
Gage height(feet above
mean sea level)
13.20
-9.54
9.33-
10.33-
9.739.93-
9.95-
Dailydischarge
(cfa)
8,570
3,780-
-4,2805,3202,060
--
3,040-
3,120
Calendaryear
1946
194719481949
1950
1951
1952
1953
Date
May 14, Nov. 29Sept. 22Oct. 13Oct. 7Dec . 26Dec. 31Oct." 19Nov. 27
Oct. 15Oct. 16Feb. 4Oct. 28June 6Oct. 10
Gage height(feet above
mean sea level)
9.79-
10.899.949.52--
9.27
9.86-
9.33-
9.36-
Dailydischarge
(cfs)
2,6805,2804,760
-3,1804,160
-
-4,060
-2,850
-4.150

84 FI OODS IN FLORIDA
Lake Okeechobee and the Everglades
(71) Hlllsboro Canal at Belle Glade, Fla.
Location.--Lat 26°41', long 80 C 40', in sec. 31, T. 43 S., R. 37 E., on southwest bank 20 ftnorthwest of bridge on State Highway 15 in Belle Glade, 3 miles southeast of Lake Okeechobee,
Records available. U. S. Geological Survey: January 1940 to October 1942, dally gage heights and discharges measured at semi-weekly to weekly Intervals; October 1942 to September 1950, daily gage heights and discharges.
Gage. Water-stage recorder. Datum of gage Is at mean sea level, datum of 1929. Prior to May II, 1940, staff gage at same site at datum 11.18 ft higher. May 11, 1940, to Mar. 14, 1944, water-stage recorder at same site at datum 1.69 ft lower than present datum. (All gage heights tabulated below have been reduced to present datum, at mean sea level).
Stage-discharge relation.--There Is no definite relation between stage and discharge at this station. Ratings are based on relations between velocity at a point and mean velocity and between stage and area as defined by current-meter measurements. Velocity at a point observed three times a day.
Remarks. Flow regulated by hurricane gates at Lake Okeechobee. Flow occasionally reversed after periods of considerable rainfall owing to downstream natural drainage and to pumping from agricultural lands In Everglades.
Annual peak stages and discharges
Calendar year
1940
1941
1942
1943
1944
1945
1946
1947
1948
1949
1950
Date
Feb.Sept.Sept.
Jan.JulyOct.Jan.JuneJuneSept.Oct.Nov.Oct.Oct.Dec.Jan.Sept.Oct.
Mar.Mar.Dec.Sept.Oct.Oct.Sept.Oct.Dec .Mar.Sept.Oct.Jan.Mar.Oct.
149
30
21121-24162328, 299
1711182422
163
19212
1515, 16272677
19919
3118
Dally gage height
(feet above mean
sea level)
-15.47
_-
15.19--
15.13-
13.79--
13.86---
15.41
15.13---
16.71--
16.13---
14.77--
«14.70
Dally discharge (cfs)
From lake
»481--
«301--
«215----
228--
261229--
_263-
222----
429424---
6319-
To -lake
.«289
-
-«195
--
«206-62--
241---
206-
_-
169--
250188---
224-
6173--
Maximum measured.fc For period January to September; may have been exceeded during
period October to December.e At site 6.0 miles downstream.

GAGING STATION RECORDS 85
Lake Okeechobee and the Everglades
(72) Hillsboro Canal at Shawano Plantation, Fla.
Location.--Lat 26°33', long 80°31', in sec. 14, T. 45 S., R. 38 E., on pier on right bank at office of Shawano Plantation at end of State Highway 827, 7 miles southeast of Junction with U. S. Highway 441 and 13-J miles southeast of Belle Glade.
Records available. Shawano Plantation, Inc.: Station established at some unknown date prior to January 1929. Prior records were lost in hurricane in 1928. January 1929 to September 1'940, daily gage heights. U. S. Geological Survey: September 1940 to July 1952, daily gage heights.
Gage. Staff gage read once daily. Datum of gage is 1.44 ft below mean sea level (levels by Soil Conservation Service, U. S. Department of Agriculture).
Stage-discharge relation. Not defined.
Annual peak stages
Calendar year
19291930
19311932193319341935
19361937
193819391940
Date
Oct. 14June 23, 24
Mar. 3Nov. 11Sept. 6, 7Sept. 25Oct. 16, 17
July 14, 15July 30,Oct. 23Aug. 1July 14Sept. 22, 23
Gage height (feet)
. 16.7317.63
14.9416.7017.2316.5717.19
17.29
16.3115.6016.0716.81
Calendar year
19411942194319441945
19461947194819491950
1951
Date
July 15, 16June 14Oct. 10Oct. 21Sept. 18
Sept. 22Oct. 12, 13Oct. 5Oct. 1Oct. 19
Oct. 4
Gage height (feet)
16.9117.0615.3015.7616.34
16.4817.8117.3816.2016.18
16.70
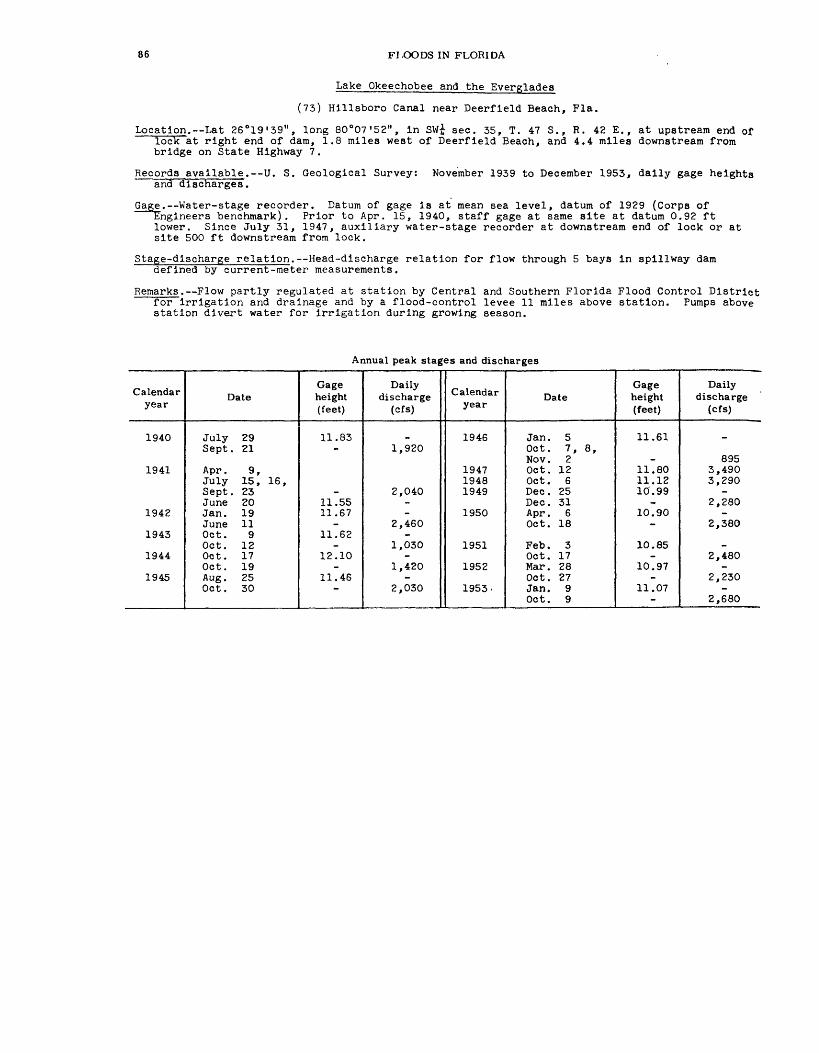
86 FIOODS IN FLORIDA
Lake Okeeehobee and the Everglades
(73) Hillsboro Canal near Deerfield Beach, Fla.
Location.--Lat 26°19'39", long 80°07'52", In SW£ sec. 35, T. 47 S., R. 42 E., at upstream end of lock at right end of dam, 1.8 miles west of Deerfield Beach, and 4.4 miles downstream from
bridge on State Highway 7.
Records available. U. S. Geological Survey: and discharges.
November 1939 to December 1953, daily gage heights
Gage. Water-stage recorder. Datum of gage is at mean sea level, datum of 1929 (Corps of Engineers benchmark). Prior to Apr. 15, 1940, staff gage at same site at datum 0.92 ft lower. Since July 31, 1947, auxiliary water-stage recorder at downstream end of lock or at site 500 ft downstream from lock.
Stage-discharge relation. Head-discharge relation for flow through 5 bays in spillway dam defined by current-meter measurements.
Remarks. Flow partly regulated at station by Central and Southern Florida Flood Control District for Irrigation and drainage and by a flood-control levee 11 miles above station. Pumps above station divert water for irrigation during growing season.
Annual peak stages and discharges
Calendar year
1940
1941
1942
1943
1944
1945
Date
July 29Sept. 21
Apr . 9 ,July 15, 16,Sept. 23June 20Jan. 19June 11Oct. 9Oct. 12Oct. 17Oct. 19Aug. 25Oct. 30
Gage height (feet)
11.83-
-11.5511.67
-11.62
-12.10
-11.46
-
Daily discharge
(cfs)
_1,920
2,040--
2,460-
1,030-
1,420-
2,030
Calendar year
1946
194719481949
1950
1951
1952
1953-
Date
Jan. 5Oct. 7, 8,Nov. 2Oct. 12Oct. 6Dec. 25Dec. 31Apr. 6Oct. 18
Feb. 3Oct. 17Mar. 28Oct. 27Jan. 9Oct. 9
Gage height (feet)
11.61
-11.8011.1210.99
-10.90
-
10.85-
10.97-
11.07-
Daily discharge
(cfs)
_
8953,4903,290
-2,280
-2,380
-2,480
-2,230
-2,680

GAGING STATION RECORDS 87
Lake Okeechobee and the Everglades
/ (74) North New River Canal at South Bay, Fla. I.
Location. Lat 26°40', long 80°43', in sec. 14, T. 44 S., R. 36 E., on right bank on downstream side of lock and dam in South Bay, 410 ft downstream from bridge on State Highway 80, and 2.5 miles south of Lake Okeechobee.
Records available. U. S. Geological Survey: November 1939 to March 1942, dally gage heights and weekly or twice weekly discharge measurements. April 1942 to December 1953, daily gage heights and discharges.
Gage. Staff gage read twice daily. Datum of gage is at mean sea level, datum of 1929.
Stage-discharge relation. There is no definite relation between stage and discharge at this station. Ratings are based on relations between velocity at a point and mean velocity and between stage and area as defined by current-meter measurements. Velocity at a point observed twice daily.
Historical data. Flood of July 27, 28, 1926, reached a stage of 20.56 ft, from records by Everglades Drainage District.
Remarks. Flow regulated by hurricane gates at Lake Okeechobee and by operation of drainage pumps.
Annual peak stages and discharges
Calendar year
1926
1940
1941
1942
1943
1944
1945
1946
1947
1948
1949
1950
1951
1952
1953
Date
July
MaySeptOct.
MayJulyJulyJuneJuneNov.Nov.Nov.Mar.Mar.Oct.Jan.Oct.
SeptDec.SeptOct.MayOct.Nov.Mar.Oct.Jan.Apr.Oct.
Oct.Nov.Dec.Jan.Oct.Nov.Apr.Oct.Dec .
27, 28
23. 24,28,2918
1220,251014261117-1991
192
17
. 2215
. 3015, 1619112211117
18
1026, 27157
2130201013
Daily gage height
(feet above mean
sea level)
20.56
_14.78
-
_14.97
--
14.62--
12.55-
13.17--
14.14
13.96--
16.38-
15.73--
14.4513.89
--
15.20---
15.35--
15.88-
Daily discharge (cfs)
From lake
-
°341--
«321----254312-325--241-
-365
1,040-506--742--602-
_-544677--642--
To lake
-
-
«15
-
«391404------27-~
------43---
379
-58---
137--
115
Result of discharge measurement.

88 FLOODS IN FLORIDA
Lake Okeechobee and the Everglades
(75) North New River Canal at 26-mile bend, near Fort Lauderdale, Fla.
Location. Lat 26°13'50", long 80°27'35", In NE£ sec. 32, T. 48 S., R. 39 E., on right bank 50 'f f upstream from control dam at 26-mile bend on U. S. Highway 27, 22 miles northwest of Fort Lauderdale.
Records available. U. S. Geological Survey: June 1942 to December 1952, dally gage heights and periodic discharge measurements.
Gage.--Water-stage recorder. Datum of gage Is at mean sea level (State Road Department bench mark) .
Stage-discharge relation. Not defined; stage Is affected by manipulation of stoplogs In the control.
Remarks.--Flow Is regulated by hurricane gates at Lake Okeechobee and manipulation of stoplogs In the control.
Annual peak stages
Calendar year
1943 1944 1945
1946 1947
Date
Nov. 19 Aug. 4 Jan. 10
Aug. 24 Oct. 12
Gage height (feet)
10.62 11.05 10.51
10.80 12.97
Calendar year
1948 1949 1950
1951 1952
Date
Oct. 5 Mar. 11 Oct. 20
Oct. 4 Nov. 6
Gage height (feet)
11.82 10.29 10.60
10.60 10.74

GAGING STATION RECORDS 89
Lake Okeechobee and the Everglades
(76) North New River Canal near Fort Lauderdale, Pla.
Location. Lat 26°05'39", long 80°13'48", in SW£ sec. 14, T. 50 S., R. 41 E., on right bank 20 ft upstream from lock and dam on State Highway 84, 6 miles southwest of Fort Lauderdale.
Records available. U. S. Geological Survey: November 1939 to December 1953, daily gage heights and discharges.
Gage. Water-stage recorder. Datum of gage is at mean sea level, datum of 1929 (Corps ofEngineers benchmark). Prior to Apr. 13, 1940, staff gage at same site and datum. Auxiliary water-stage recorder at downstream end of lock chamber. Aug. 1, 1947, to July 20, 1950, at site 500 ft downstream.
Stage-discharge relation. Head-discharge relation for flow through 8 bays in spillway dam defined by current-meter measurements.
Historical data. Maximum discharge known, 5,400 cfs Oct. 15, 1929 (gage height, 7.66 ft, present datum), from records by Everglades Drainage District.
Remarks. Flow regulated at and above station by dams for irrigation, drainage, and flood and fire control.
Annual peak stages and discharges
Calendar year
1929
1940
1941
1942
1943
1944
1945
1946_ ___
Date
Oct. 15
Sept. 12, 13,Oct. 11Oct. 24
June 20Aug. 8Mar. 3June 12July 10Sept. 13-15Aug. 2Oct. 23Oct. 1Nov. 13-15
Sept. 19Dec. 16
Gage height (feet)
7.66
-6.81
6.85-
6.18-
6.87-
6.78-
6.77-
_6.93
Daily discharge
(cfs)
°5,400
1,440-
-1,970
-1,820
-608-
1,070-
1,390
1,070-
Calendar year
1947
1948
1949
1950
1951
1952
1953
Date
X0ct. 17Nov. 19Oct. 5Oct. 9Mar. 7Oct. 1Oct. 19Nov. 27, 28
Jan. 5,7Oct. 23Jan. 29Oct. 29,Nov. 3Mar. 17Oct. 20
Gageheight (feet)
10.83--
9.396.46--
6.14
6.38-
6.35
-5.86
-
Daily discharge
(cfs)
_3,2802,800
--
2,1101,690
-
.1,460
-
1,860-
1,700
Peak discharge.

90 FT GODS IN FLORIDA
Lake Okeechobee and the Everglades
(77) Miami Canal at Pennsuco, near Miami, Fla.
Location. Lat 25°55", long 80°22", in sec. 30, T. 52 S., R. 40 E., on left bank at upstream side of road bridge in Pennsuco, 7.4 miles northwest of Miami water plant in Hialeah and 14.3 miles northwest of Miami Post Office.
Records available. Grahams Dairy: July 1926 to November 1939, daily gage heights. U. S. Geological Survey: November 1939 to December 1953, daily gage heights. November 1939 to July 1943, daily discharges.
Gage. Water-stage recorder. Datum of gage is at mean sea level, datum of 1929. Prior toSept. 28, 1940, staff gage. Nov. 12, 1939, to Mar. 25, 1953, datum was from 0.54 to 0.60 ft lower. Gage read by employees of Grahams Dairy was approximately at same datum as Geological Survey gage set on Nov. 3, 1939. (All gage heights shown below have been reduced to present datum, at mean sea level).
Stage-discharge relation. Not defined; affected by tide. Discharge record for period November 1939 to July 1943 based on current-meter measurements made at approximately weekly intervals.
Annual peak stages and discharges
Calendaryear
19261927192819291930
19311932193319341935
1936193719381939
1940
Date
Oct. 25Oct. 25Sept. 27Oct. 20Jan. 1
Sept. 28-30Nov. 9Oct. 27May 22, 23Nov. 8
July 14Oct. 18July 16Nov. 4Nov. 25-28Sept. 22, 23Nov . 25
Gage height(feet above
mean sea level)
«7.50«4.5*6.16«8.54«5.91
«5.44 6.06 6.16 5.15«5.74
«6.87«5.17«3.93«5.35
-5.89-
Dailydischarge
(cfs)
.----
-_---
---_
730-
956
Calendaryear
1941
1942
194319441945
19461947194819491950
195119521953
Date
Feb. 13, 14Oct. 6July 4Oct. 5Oct. 12, 13Oct. 25,26,27Nov. 18
Oct. 7Oct. 12Oct. 12Oct. 13Oct. 18
Oct. 18Oct. 28Oct. 9
Gage height(feet above
mean sea level)
.5.105.89-
5.645.145.17
4.889.006.835.524.35
4.315.765.93
_
Dailydischarge
(cfs)
848_-
774---
--_--
-__
Mean daily.

GAGING STATION RECORDS 91
Lake Okeechobee and the Everglades
' (78) Miami Canal at water plant, Hialeah, Fla.
Location. Lat 25°49'38", long 80°17'15", in SW£ sec. 18, T. 53 S., R. 41 E., on left bank at Miami water plant in Hlaleah, on U. S. Highway 27, half a mile upstream from 54th Street
bridge.
Records available. U. S. Geological Survey: January 1940 to December 1953, daily gage heights and discharges.
Gage.--Water-stage recorder. Datum of gage is 0.01 ft below mean sea level, datum of 1929(levels by Dade County). Nov. 8, 1940, to Sept. 30, 1946, water-stage recorder on Blscayne Bay at Coconut Grove was used as auxiliary gage for this station and since Oct. 1, 1946, at site 2 miles downstream from base gage.
Stage-discharge relation. Defined by current-meter measurements; affected by backwater from tides.Discharge computed by using gage heights and tide ranges at auxiliary gage as a factor.
Remarks. Some seepage losses above station into city of Miami well field for recharge of ground-water withdrawals.
Annual peak stages and discharges
Calendar year
1940
1941
1942
1943
1944
1945
1946.
Date
Oct. 1Nov. 8-10
Feb. 12-14Oct. 6Sept. 3, 5Sept. 4,Oct. 12Oct. 14Nov . 30Oct. 18Nov. 20-24Sept. 15Nov. 19-22
Oct. 8, 9, 13Oct. 7
Gage height (feet)
3.89-
-3.43-
3.183.26-
3.59-
4.42-
_3.40
Daily discharge
(cfs)
_1,670
1,330-
1,610
--823-684-
1,540
1,250-
Calendar year
19471948
1949
1950
1951
1952
1953
Date
Oct. 15Oct. 5Oct. 12Oct. 22Oct. 27Oct. 18Nov. 24, 25
Oct. 2Dec. 5Oct. 27Oct. 28Oct. 9Oct. 9, 10
Gage height (feet)
7.345.20-
3.91-
4.17-
3.25-
4.23-
4.11 .-
;DAily ' discharge
(cfs)
4,170"
2,530-
1,480-982
-878-
1,560-
1,600
(79) Tamiaml Canal outlets, Miami to Monroe, Fla.
Location. Lat 25°45'40", long 80°49'40", in NE£ sec. 21, T. 54 S.,. R. 35 E., at 40-mile bend on U. S. Highway 41, 38 miles west of Miami.
Records available. U. S. Geological Survey: November 1939 to December 1953, dally gage heights and discharges.
Gage?. Water-stage recorder. Datum of gage is at mean sea level, datum of 1929. Dec. 9, 1939, to Aug. 30, 1949, staff gage read once daily at same site at datum 0.87 ft lower. Aug. 31, 1949, to Dec. 28, 1951, staff gage at present site and datum. (All gage heights tabulated below have been reduced to present datum, at mean sea level).
Stage-discharge relation.--Prior to Oct. 1, 1949, nO stage-discharge relation was developed and daily discharges were estimated on basis of gage heights and interpolation between current- meter measurements. Since Oct. 1, 1949, daily discharges computed from very unstable stage- discharge realtlons. Considerable shifting occurs at all stages.
Remarks. Discharge consists of runoff from Everglades as represented by flow through all outlets "of Tamiaml Canal from Monroe, 55 miles west of Miami, to point 18 miles west of Miami where a
levee aids in diverting flow through 60 outlets to the area immediately south of canal.

92 FLOODS IN FLORIDA
Lake Okeechobee and the Everglades
(79) Tamiami Canal outlets, Miami to Monroe, Fla. Continued
Annual peak stages and discharges
Calendaryear
1940
1941
1942
1943
1944
1945
Date
Sept. 11, 12Sept. 13
Feb. 11July 17June 11-13June 12Sept. 14-16Sept. 15Aug. 7,Oct. 27, 28Oct. 22Sept. 18Sept. 22
40-mile bendgage height
(feet)
_8.75
-8.928.89-
8.93-
8.43--
8.95
Dallydischarge
(cfs)
1,670-
1,430--
1,730-
1,820
-541
2,140-
Calendaryear
1946
1947194819491950
19511952
1953
Date
Aug. 23Sept. 25Oct. 12Oct. 6Sept. 30Oct. 15
Oct. 10, 11Oct. 21Oct. 25Oct. 8Nov. 1, 2
40-mile bendgage height
(feet)
8.47-
a !0.310.039.068.92
8.448.97-
9.04-
Dailydischarge
(cfs)
_1,160
17,00012,9003,5002,610
1,210-
2,720-
4,450
a Aoproxlmate; water over gage,
(80) Lake Trafford near Immokalee, Fla.
Location.--Lat 26°26', long 81°29', in NW-J- sec. 35, T. 46 S., R. 28 E., on north shore of lake, 10 ft lakeward from dock at Pepper's Camp, 4^ miles west of Immokalee.
Records available. U. S. Geological Survey: March 1941 to December 1953, daily gage heights.
Gage. Staff gage read once daily. Datum of gage is'16.00 ft (+ 1.00 ft), above mean sea level (State Road Department benchmark which was reputed to be in error by one foot). Prior to Aug. 21, 1952, at various sites in same vicinity at same datum.
Annual peak stages
Calendar year
1941 1942 1943 1944 1945
1946 1947
Date
July 17 June 17-20,25,26 Oct. 3 Sept. 13 Sept. 19
Sept. 20 Sept. 18
Gage height (feet)
5.8 4.46 4.12 3.78 5.00
4.66 6.60
Calendar year
1948
1949 1950
1951 1952 1953
Date
Sept. 27-29, Oct. 2 Oct. 4 Jan. 1, 2
Oct. 3 Oct. 24, 25 Oct. 11
Gage height (feet)
4.70 4.82 3.34
5.82 4.60 5.12

GAGING STATION RECORDS 93
Lake Okeechobee and the Everglades
(81) Imperial River near Bonlta Springs, Fla. /
Location.--Lat 26°20 r , long 81°45 r , In sec. 36, T. 47 S., R. 25 E., on right bank l| miles east of Bonlta Springs.
Records available. U. S. Geological Survey: May 1940 to December 1953, dally gage heights and discharges.
Water-stage recorder. Datum of gage Is at mean sea level, datum of 1929. Prior to Sept. 10, 1941, staff gage at same site and datum.
Stage-discharge relation. Defined by current-meter measurements. Slight tide effect at low stages.
Historical data. Flood of June 15, 1936, reached a stage of 13.4 ft, from floodmarks.
Annual peak stages and discharges
Calendar year
1936
1940
19411942194319441945
Date
June 15
Sept. 12
Apr. 8Sept. 14June 28Oct. 19July 23
Gage height (feet)
13.4
12.45
7.895.737.477.519.58
Discharge (cfs)
_
2,890
550329520520
1,160
Calendar year
19461947194819491950
195119521953
Date
Aug. 2Sept. 23, 24Sept. 27Oct. 5Sept. 6
Oct. 2Oct. 20Sept. 21
Gage height (feet)
5.7112.049.588.788.53
12.747.728.93
Discharge (cfs)
3322,4001,240
972873
2,810591909
(82) Caloosahatchee Canal at Moore Haven, Fla.
Location.--Lat 26°50 r , long 81°05', In sec. 12, T. 42 S., R. 32 E., on right bank at Moore Haven, 0.5 mile downstream from hurricane gate and lock 1 at Lake Okeechobee Outlet and 15 miles upstream from lock 2.
Records available. U. S. Geological Survey: July 1938 to December 1953, dally gage heights and discharges.
Gag_e_. Water-stage recorder. Datum of gage Is at mean sea level, datum of 1929 (levels by Corps of Engineers). Prior to Jan. 17, 1952, at datum 1.44 ft lower. Auxiliary water-stage recorder a quarter of a mile upstream from Lake Hlcpochee and 2.5 miles downstream from base gage. (All gage heights tabulated below have been reduced to present datum, at mean sea level) .
Jitage-dlscharge relation.--Defined by current-meter measurements, affected by fall. Discharge computed by using fall as determined by auxiliary water-stage recorder, as a factor.
Remarks. Flow regulated by lock 1 at Lake Okeechobee. Since July 1951, records furnished by Corps of Engineers.
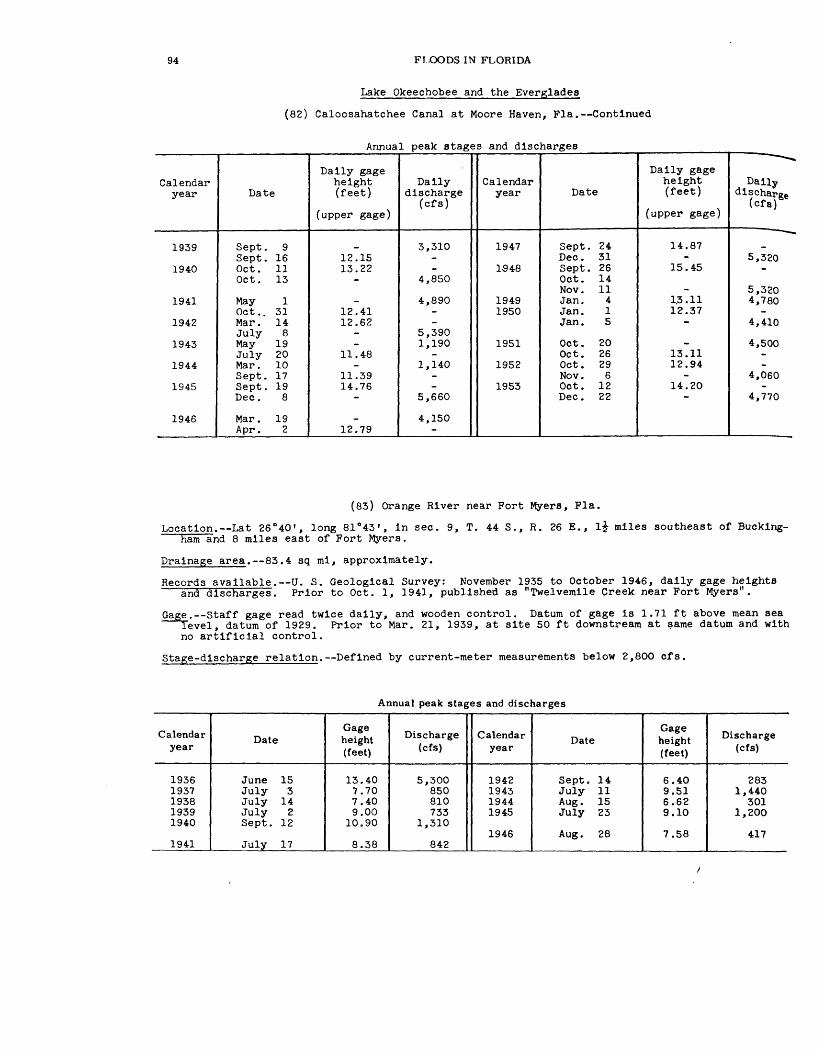
94 FLOODS IN FLORIDA
Lake Okeechobee and the Everglades
(82) Caloosahatchee Canal at Moore Haven, Fla. Continued
Annual peak stages and discharges
Calendar year
1939
1940
1941
1942
1943
1944
1945
1946
Date
Sept. 9Sept. 16Oct. 11Oct. 13
May 1Oct.. 31Mar. 14July 8May 19July 20Mar . 10Sept. 17Sept. 19Dec. 8
Mar . 19Apr. 2
Dally gageheight (feet)
(upper gage)
12.1513.22
-
-12.4112.62
--
11.48-
11.3914.76
-
_12.79
Dally discharge
(cfs)
3,310--
4,850
4,890--
5,3901,190
-1,140
--
5,660
4,150-
Calendar year
1947
1-948
19491950
1951
1952
1953
Date
Sept. 24Dec. 31Sept. 26Oct. 14Nov. 11Jan. 4Jan. 1Jan. 5
Oct . 20Oct. 26Oct. 29Nov. 6Oct. 12Dec. 22
Dally gageheight (feet)
(upper gage)
14.87-
15.45
-13.1112.37
-
-13.1112.94
-14.20
-
«*
Dally
(cf a)
.5,320
-
5,3204,780
-4,410
4,500--
4,060-
4,770
(83) Orange River near Fort Myers, Fla.
Location. Lat 26°40', long 81°43', In sec. 9, T. 44 S., R. 26 E., l| miles southeast of Bucking ham and 8 miles east of Fort Myers.
Drainage area. 83.4 sq ml, approximately.
Records available. U. S. Geological Survey: November 1935 to October 1946, dally gage heights and discharges. Prior to Oct. 1, 1941, published as "Twelvemlle Creek near Fort Myers".
Gage. Staff gage read twice dally, and wooden control. Datum of gage is 1.71 ft above mean sea level, datum of 1929. Prior to Mar. 21, 1939, at site 50 ft downstream at same datum and with no artificial control.
Stage-discharge relation. Defined by current-meter measurements below 2,800 cfs.
Annual peak stages and discharges
Calendar year
19361937193819391940
1941
Date
June 15July 3July 14July 2Sept. 12
July 17
Gage height (feet)
13.407.707.409.00
10.90
8.38
Discharge (cfs)
5,300850810733
1,310
842
Calendar year
1942194319441945
1946
Date
Sept. 14July 11Aug . 15July 23
Aug. 28
Gage height (feet)
6.409.516.629.10
7.58
Discharge (cfs)
2831,440
3011,200
417

GAGING STATION RECORDS 95
Peace River Basin
(84) Drainage Canal west of Dundee, Fla.
Location.--Lat 28°01', long 81°38', in sec. 29, T. 28 S., R. 27 E., on right bank at upstream side of bridge on State Highway 542, 1.2 miles west of Dundee, and 1.4 miles downstream from Lake Hamilton Outlet.
Drainage area. 50 sq ml, approximately.
Records available.--U. S. Geological Survey: December 1946 to December 1953, daily gage heights and discharges.
Gage. Water-stage recorder. Datum of gage is 114.08 ft above mean sea level, datum of 1929. Jan. 25, 1950, to July 26, 1951, at site 150 ft downstream at same datum.
Stage-discharge relation. Defined by current-meter measurements. Considerable shifting at all stages.
Annual peak stages and discharges
Calendar year
1947 1948 1949 1950
Date
Sept. 18 Sept. 22 Aug. 27 Oct. 18 or 19
Gage height (feet)
6.86 7.37 6.77 6.41
Discharge (cfs)
188 231 203 116
Calendar year
1951 1952 1953
Date
Nov. 17 Oct. 20 Oct. 4
Gage height (feet)
6.36 6.99 6.88
Discharge (cfs)
104 104 222
(85) Peace Creek Marsh outlet near Alturas, Fla.
Location.--Lat 27°55', long 81°43', In sec. 34, T. 29 S., R. 26 E., near left bank at upstream side of highway bridge half a mile north of State Highway 60, 3.5 miles north of Alturas, and 8-J- miles east of Bar tow.
Drainage area. 150 sq mi, approximately.
Records available.--U. S. Geological Survey: January 1947 to December 1953, daily gage heights and discharges.
Gage. Water-stage recorder. Datum of gage is 97.67 ft above mean sea level, datum of 1929 (State Road Department benchmark).
Stage-discharge relation. Defined by current-meter measurements below 1,600 cfs.
Historical data. Maximum stage known, 13.3 ft In 1928, from Information by local resident.
Annual peak stages and discharges
Calendar year
1928
194719481949
<^_1950
Date
Sept. 19Sept. 23Aug. 28Oct. 19
Gage height (feet)
13.3
10.8811.5111.679.71
Discharge (cfs)
2,540
1,3601,6401,740
975
Calendar year
1951
19521953
Date
July 30,Sept. 20Oct. 21Oct. 10
Gageheight (feet)
7.9310.149.90
Discharge (cfs)
5321,0901,020

96 FLOODS IN FLORIDA
Peace River Basin
(86) Lake Howard at Winter Haven, Fla.
Location. Lat 28°01', long 81°44', In NW£ sec. 29, T. 28 S., R. 26 E., on city dock and boat house near intersection of West Central Avenue and Lake Howard Drive In Winter Haven.
Records available.--U. S. Geological Survey: June 1945 to February 1946, gage heights read at periodic intervals; February 1946 to December 1953, daily gage heights.
Gage. W-ter-stage recorder. Datum of gage is 120.00 ft above mean sea level, datum of 1929. Prior to Feb. 13, 1946, staff gage at same site at datum 7.85 ft higher.
Annual peak stages
Calendar year
1945
1946 1947 1948 1949
Date
July 15
Aug. 3 Sept. 23 Sept. 28 Sept. 29
Gage height (feet)
a!2.66
12.01 12.46 12.77 12.57
Calendar year
1950
1951 1952 1953
Date
Oct. 18, 21
Oct. 2 Mar. 27 Oct. 9
Gage height (feet)
11.95
12.13 12.24 12.70
0 Present datum.
(87) Lulu Lake Outlet at Eloise, Fla.
Location.--Lat 27°59", long 81°43', in SE-J- sec. 5, T. 29 S., R. 26 E., on left downstreamabutment of culvert on State Highway 540-A at intersection with Rifle Range Road, 1,800 ft downstream from concrete control at outlet of Lulu Lake, and 0.8 mile southeast of Eloise.
Drainage area. 26 sq mi, approximately.
Records available. U. S. Geological Survey: February 1946 to December 1953, dally gage heights and discharges.
Gage. Water-stage recorder. Datum of gage is 120.00 ft above mean sea level, datum of 1929. 'Prior to Jan. 8, 1953, at site 1,500 ft upstream at same datum.
Stage-discharge relation.--Poorly defined by current-meter measurements. Considerable shifting at all stages and backwater effect from hyacinths and aquatic vegetation.
Remarks. Some regulation by Lulu Lake.
Annual peak stages and discharges
Calendar year
1946 1947 1948
1949
Date
Sept. 26 Sept. 19 Aug. 25 Sept. 24 Aug. 28, Sept. 29
Gage height (feet)
7.82 9.56
11.18
10.53
Discharge (cfs)
26 52
83
72
Calendar year
1950
1951 19521953
Date
Oct. 18 18
Sept. 20, 29, 30 Oct. 28Oct. 10
Gage height (feet)
8.93
10.10 9.40
10.33
Discharge (cfs)
23
35 2586
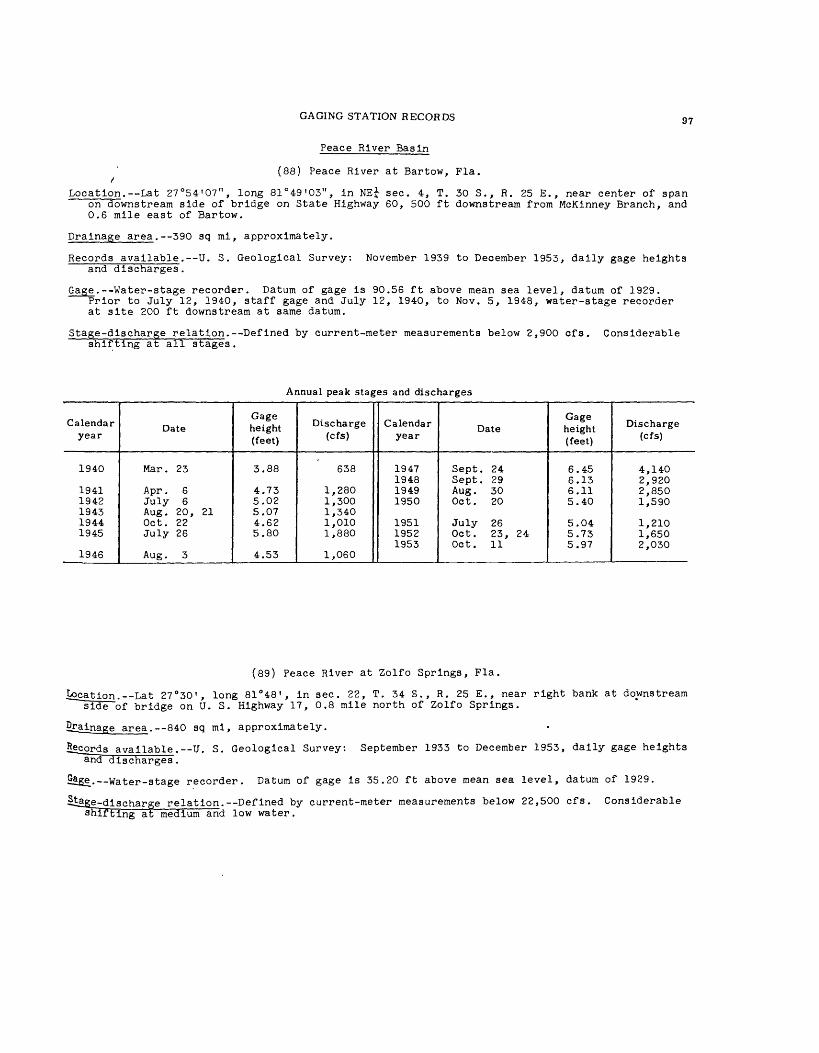
GAGING STATION RECORDS 97
Peace River Baain
(88) Peace River at Bartow, Fla.
Location. Lat 27°54'07", long 81°49'03", in NE£ sec. 4, T. 30 S., R. 25 E., near center of span on downstream side of bridge on State Highway 60, 500 ft downstream from McKinney Branch, and 0.6 mile east of Bartow.
Drainage area.--590 sq mi, approximately.
Records available. U. S. Geological Survey: November 1939 to December 1953, daily gage heights and discharges.
Gage.--Water-stage recorder. Datum of gage is 90.56 ft above mean sea level, datum of 1929. Prior to July 12, 1940, staff gage and July 12, 1940, to Nov. 5, 1948, water-stage recorder at site 200 ft downstream at same datum.
Stage-discharge relation.--Defined by current-meter measurements below 2,900 cfs. Considerable shifting at all stages.
Annual peak stages and discharges
Calendar year
1940
19411942194319441945
1946
Date
Mar. 23
Apr. 6July 6Aug. 20, 21Oct. 22July 26
Aug. 3
Gage height (feet)
3.88
4.735.025.074.625.80
4.53
Discharge (cfs)
638
1,2801,3001,3401,0101,880
1,060
Calendar year
1947194819491950
195119521953
Date
Sept. 24Sept. 29Aug . 30Oct. 20
July 26Oct. 23, 24Oct. 11
Gage height (feet)
6.456.136.115.40
5.045.735.97
Discharge (cfs)
4,1402,9202,8501,590
1,2101,6502,030
(89) Peace River at Zolfo Springs, Fla.
Rogation. --Lat 27°30', long 81 0 48', in sec. 22, T. 34 S., R. 25 E., near right bank at downstream side of bridge on U. S. Highway 17, 0.8 mile north of Zolfo Springs.
drainage area. 840 sq mi, approximately.
Records available. --U. S. Geological Survey: September 1933 to December 1953, daily gage heights and discharges.
Gage. Water-stage recorder. Datum of gage is 35.20 ft above mean sea level, datum of 1929.
-discharge relation. Defined by current-meter measurements below 22,500 cfs. Considerable shifting at medium and low water.

98 FLOODS IN FLORIDA
Peace River Basin
(89) Peace River at Zolfo Springs, Fla. Continued
Annual peak stages and discharges
Calendaryear
193319341935
19361937193819391940
194119421943
Date
Sept. 6June 22Sept. 7
Feb. 18July 3Oct. 17June 17July 7
July 17June 13Aug. 6
Gageheight(feet)
20.0515.513.20
11.829.89
15.1515.529.17
10.9810.7610.63
Discharge(cfs)
26,3009,8506,550
4,6803,4409,2009,8002,970
4,2404,1804,030
Calendaryear
19441945
19461947194819491950
195119521953
Date
Aug. 17June 25
Sept. 21Sept. 20Sept. 24Aug. 29Oct. 20
Oct. 4Oct. 22Aug. 30
Gage height(feet)
8.4816.63
9.1919.1516.5518.119.44
9.0-714.7015.39
Discharg(cfs)
2,60012,100
3,03021,30011,60015,9003,370
3,1508,6809,300
(90) Peace River at Arcadia, Fla.
Location.--Lat 27°13', long 81°52', in sec. 26, T. 37 S., R. 24 E., on left bank 75 ft upstream from bridge on State Highway 70, half a mile west of Arcadia, and about 5 miles upstream from Joshua Creek.
Drainage area. 1,370 sq mi, approximately.
Records available. U. S. Geological Survey: April 1931 to December 1953, daily gage heights and discharges.
Gage.--Wpter-stage recorder. Datum of gage is 8.25 ft above mean sea level, datum of 1929. Prior to July 19, 1931, staff gage at same site and datum.
Stage-discharge relation. Defined by current-meter measurements below 30,000 cfs.
Historical data. Maximum stage known, 18.3 ft in 1912, from information by county engineer.
Annual peak stages and discharges
Calendar year
1912
19311932193319341935
19361937193819391940
1941
Date
_
Apr . 20Sept. 16Sept. 9June 23Sept. 9
Feb. 19Apr. 9Oct. 21June 19Sept. 28
July 20
Gage height (feet)
18.3
9.689.98
17.6712.8012.42
12.489.20
12.7614.4710.00
9.25
Discharge (cfs)
43,000
5,9306,230
36 , 20010,4009,750
9,9205,130
10,40014,2006,300
5,380
Calendar year
1942194319441945
19461947194819491950
195119521953
Date
June 15July 29Aug. 18July 24
July 31Sept. 22Sept. 28Aug. 31Oct. 22
Oct. 3Oct. 25Oct. 1
Gage height (feet)
10.9410.607.55
12.45
9.5516.3415.0616.498.83
11.6813.5513.35
Discharge (cfs)
7,4607,0403,8809,750
5,84023,60016,20026,6005,210
8,62012,10011,700/
'

GAGING STATION RECORDS 99
Mlakka River Basin
(91) Mlakka River near Sarasota, Fla.
Location.--Lat 27°14'25", long 82°18'50", In sec. 21, T. 37 S., R. 20 E., on right bank, half a mile upstream from bridge on State Highway 72, 2 miles upstream from Lower Miakka Lake, and about 14 miles southeast of Sarasota.
Drainage area. 235 sq ml, approximately.
Records available. U. S. Geological Survey: August 1936 to December 1953, dally gage heights and discharges.
Gage.--Staff gage read once daily. Datum of gage is 7.92 ft above mean sea level, datum of 1929. Prior to Apr. 10, 1941, at highway bridge at same datum.
Stage-discharge relation. Defined by current-meter measurements below 6,600 cfs. Considerable shifting at all stages.
Annual peak stages and discharges
Calendar year
1937
1938
1939 1940
1941 1942 1943
1944
Date
Apr. 9, 10 Sept. 6 July 13 Oct. 15, 16 Aug. 15 Sept. 30
July 20 Feb. 28 June 30, July 1, 2 Aug. 8, 9
Gage height (feet)
7.65 8.80
8.52 7.02
7.04 7.12
9.00 6.16
Discharge (cfs)
1,340
3,870 4,040 1,350
1,020 1,190
3,850 268
Calendar year
1945
1946 1947 1948 1949 1950
1951 1952 1953
Date
Aug. 28
Aug. 5 Sept. 21 Sept. 30 Aug. 16 Sept-. 9
Oct. 4 Oct. 23, 24 Oct. 12
Gage height (feet)
8.68
7.44 10.78 9.92 8.54 8.38
9.24 9.11 8.67
Discharge (cfs)
3,360
1,010 6,620 4,800 3,160 3,000
3,440 3,630 2,520
Manatee River Basin
(92) Manatee River near Bradenton, Fla.
Location. Lat 27°28'30", long 82°18'05", in sec. 34, T. 34 S., R. 20 E., on left bank 20 ft downstream from bridge on State Highway 675, 800 ft upstream from Craig Branch, 6-J- miles northwest of Verna, and 17 miles east of Bradenton.
drainage area. 90 sq mi, approximately.
Records available. U. S. Geological Survey: April 1939 to December 1953, dally gage heights and discharges.
S^Si- Water-stage recorder. Datum of gage is 11.72 ft above mean sea level, datum of 1929.
S£g£e-discharge relation.--Defined by current-meter measurements below 3,400 cfs. Considerable shifting at medium and low water.

100 FLOODS IN FLORIDA
Manatee River Basin
(92) Manatee River near Bradenton, Fla. Continued
Annual peak stages and discharges
Calendar year
19391940
19411942194319441945
1946
Date
Aug. 12Aug. 7
July 15Feb. 25June 27Aug. 4Aug. 26
Aug. 3
Gage height (feet)
23.1717.41
13.5519.7024.1417.4522.80
18.74
Discharge (cfs)
4,6901,360
8681,7805,7101,3504,200
1,580
Calendar year
1947194819491950
195119521953
Date
Sept. 18Sept. 28Sept. 29Sept. 6
Oct. 2Oct. 21Sept. 28
Gage height (feet)
24.5122.2223.0519.70
19.5422.2822.02
Discharg (cfs)
6,1703,5004,4301,790
1,7503,6003,290
Little Manatee River Basin
(93) Little Manatee River near Wimauma, Fla.
Location.--Lat 27°40'15", long 82°21'10", In sec. 25, T. 32 S., R. 19 E., on left bank 25 ftdownstream from bridge on U. S. Highway 301, 1? miles upstream from Cypress Creek, and 4 miles southwest of Wimauma.
Drainage area. 145 sq mi, approximately.
Records available. U. S. Geological Survey: March 1939 to December 1953, daily gage heights and discharges.
^.--Water-stage recorder. Datum of gage is 2.17 ft above mean sea level, datum of 1929.
Stage-discharge relation.--Defined by current-meter measurements below 7,200 cfs.
Annual peak stages and discharges
Calendar year
19391940
19-11194219431944
1945
Date
Aug. 13Aug. 5
July 17Feb. 25June 28Aug. 1, Oct. 20Oct. 20June 24
Gage height (feet)
14.007.54
8.138.40
12.34-
7.6114.44
Discharge (cfs)
8,4101,310
1,6201,7404,8401,520
-9,450
Calendar year
19461947194819491950
195119521953
Date
July 2Sept. 19Sept. 29Aug. 28Sept. 6
Sept. 20Oct. 20Nov . 26
Gage height (feet)
13.1313.6910.0612.5211.37
9.5213.0512.50
Discharge (cfs)
6,1307,6302,8805,0703,870
2,5306,0205,070

GAGING STATION RECORDS 101
Alafla River Basin
(94) Alafia River at Lithia, Fla. X
Location. La t 27°52', long 82°12', in sec. 16, T. 30 S., R. 21 E., on left bank 11 ft downstream from Marvinia Bridge on highway, 1 mile northwest of Lithia, and l£ miles downstream from Little Alafia River.
Drainage area. 335 sq mi, approximately.
Records available. U. S. Geological Survey: January 1933 to December 1953, daily gage heights and discharges.
Gage.--Water-stage recorder. Datum of gage is 9.86 ft above mean sea level, datum of 1929. Prior to Aug. 8, 1939, staff gage at site 250 ft upstream at same datum.
Stage-discharge relation. Defined by current-meter measurements below 10,000 cfs. Considerable shifting in lower limits of rating curve.
Annual peak stages and discharges
Calendar year
193319341935
19361937193819391940
194119421943
Date
Sept. 7June 16Sept. 6
Feb. 11Apr. 7Oct. 17June 17Feb. 19
July 16Mar . 20June 28
Gage height (feet)
25.616.4018.08
11.809.60
16.8513.906.84
13.669.23
16.14
Discharge (cfs)
. 19,3006,4108,300
2,4201,7106,8703,7201,140
4,0501,7606,390
Calendar year
19441945
19461947194819491950
195119521953
Date
Oct. 20July 26
July 31Sept. 20Sept. 30Aug. 29Sept. 7
Oct. 2Oct. 21Nov. 25 or 26
Gage height (feet)
11.4516.83
10.6020.3815.5919.2815.04
8.4116.2714.38
Discharge (cfs)
2,5406,850
2,22011,1005,5909,7405,030
1,5506,2804,420
Hillsborough River Basin
(95) Hillsborough River near Zephyrhills, Fla.
Location. --La t 28°09', long 82°14', in sec. 8, T. 27 S., R. 21 E., on left bank 10 ft downstream from footbridge in Hillsborough River State Park, 2 miles downstream from Blackwater Creek, and 7 miles southwest of Zephyrhills.
area.--220 sq mi, approximately.
Records available. U. S. Geological Survey: November 1939 to December 1953, daily gage heights and discharges.
. Staff gage read once daily. Datum of gage is 33.28 ft above mean sea level (Corps of ngineers benchmark) .
^gge-dlscharge relation. --Defined by current-meter measurements.

102 FLOODS IN FLORIDA
Hlllsborough River Basin
(95) Hlllsborough River near Zephyrhllls, Fla. Continued
Annual peak stages and discharges
Calendar year
1940
19411942194319441945
1946
Date
Feb. 18
Apr. 4Mar. 3Aug. 31Oct. 20July 26
Aug. 2
Gage height (feet)
4.84
12.658.72
10.238.20
13.30
9.40
Discharge (cfs)
724
4,2301,7602,3501,5905,330
2,010
Calendar year
1947194819491950
195119521953
Date
Sept. 19Jan . 25Aug. 28Sept. 7
Sept. 19Mar. 27Sept. 28
Gage height (feet)
13.7112.0212.9013.80
6.187.60
12.66
Disch»ri% (cfs)
~" ^ 5,9203,6004,6205,890
1,0601,4204,310
(96) Hillsborough River near Tampa, Fla.
Location. Lat 28 e 01'25", long 82°25'40", in sec. 29, T. 28 S., R. 19 E.. on left bank Just upstream from spillway of Tampa reservoir dam, at Thirtieth Street, 5j miles northeast of Tampa.
Drainage area. 650 sq mi, approximately.
Records available. U. S. Geological Survey: October 1933 to December 1939, dally gage heights and discharges at former station upstream published as "Hillsborough River near Harney". October 1938 to December 1953, daily gage heights and discharges.
Page. Water-stage recorder. Datum of gage Is at mean sea level, datum of 1929 (olty of Tampa benchmark). Oct. 1, 1938, to Sept. 30, 1945, at Fortieth Street Bridge 1.4 miles upstream at datum 0.66 ft higher.
Oct. 17, 1933, to Dec. 31, 1939, staff gage at Fowler Street Bridge, 2f miles north of Harney, and about 8| miles upstream from present site. Datum of this gage was 19.14 ft above mean sea level (levels by Hllleborough County Engineering Department).
Stage-discharge relation. At sites prior to 1945 when the reservoir dam was completed, stage- discharge relations were defined by current-meter measurements below 16,400 ofs. Since 1945, head-discharge relation and rating of talntor gates and flashboards on crest of dam have been defined by current-meter measurements.
Historical data.--Maximum stage known, about 15,5 ft Sept. S, 1933. at site snd datum of Harney gage,'following failure of Tampa Power Dam about 8f miles downitream (diiohsrfe, 11,400 efs, from current-meter measurement near oregt),
Remarks. Flow regulated by Tampa reservoir dam Blnoe Got. 1, Il4i.
Annual peak stagee and dinehargei
Calendar your
1933 1934 1935
1936 1937 1§3§__1939 1940
1941 . 1942
Date
Sept. 9 June 20 Sept. 8
Feb. 19 Sept. 3, 4 Oo^ . ifJuly IE - Feb. 22
Apr. 8 Mar. S-10
Gage height (feet)
16. g 13.42 10.41
7.32 6.12 6.82~1T."74
8.46
12. @1 9,91
Discharge (efi)
16,400 11,700 6,§§0
3,530 1,960 2.740 z.W1,300
4,000 2,230
Calendar year
1944 194S
1946 1947 1948 1949 19§0
1961 1962 1963
Date
Qofc. 16 July 18, 19
Aug. i Sept, ii Jan. 21, 29 Oot. 3 Sept, 10
0§fe, 4 Apr. i Sept. SO
Following failure of power dam on Hept. 7. k Maximum flaily discharge (regulated) .
Qage height (feet)
1,13 10, Ii
Diieharge (ef§)
1,718 9, I9
»Mie *7,iio;MSO>I,§IO ' 1*1,990
il,i§0 61,900ti,iio

GAGING STATION RECORDS 103
Lake Tarpon Basin
(97) Brooker Creek near Odessa, Fla.
Location. Lat 28°08'05", long 82°35'40", in sec. 10, T. 27 S., R. 17 E., on left bank 20 ft upstream from bridge on State Highway 232, 30 ft downstream from outlet of Keystone Lake, and 3.2 miles south of Odessa.
Drainage area. 10 sq mi, approximately.
Records available.--U. S. Geological Survey: April 1946 to December 1953, dally gage heights and discharges.
Gage.--Water-stage recorder. Datum of gage Is 30.00 ft above mean sea level, datum of 1929.
Stage-discharge relation. Poorly defined by current-meter measurements below 124 cfs. Consider- able shifting at all stages.
Annual peak stages and discharges
Calendar year
19461947194819491950
Date
Oct. 11, 12Aug. 21Feb. 1Aug. 23Sept. 8
Gage height (feet)
11.8812.6211.6113.2012.87
Discharge (cfs)
336523
180130
Calendar year
19511952
1953
Date
Oct. 2, 3Apr. 1Oct. 26Oct. 1
Gage height (feet)
10.73-
11.4412.60
Discharge (cfs)
5.823-
73
Anclote River Basin
(98) Anclote River near Elfers, Fla.
Location. --Lat 28°12'50", long 82°40'00", in sec. 23. T. 26 S., R. 16 E., on left bank 40 ft 3ownstream from bridge on State Highway 54, and 3^ miles southeast of Elfers.
Drainage area. --67 sq ml, approximately.
Records available. U. S. Geological Survey: May 1946 to December 1953, dally gage heights and discharges .
2S££. Water-stage recorder. Datum of gage Is at mean sea level, datum of 1929.
§£g£e-discharge relation. Defined by current-meter measurements below 3,200 cfs. Slight shift In stage-discharge relation following channel changes and construction of new bridge in 1951.
data. Flood of Aug. 8 or 9, 1945, reached a stage of 27.7 ft, from Information by local residents and high-water marks (discharge, 5,000 cfs, from rating curve extended above 3,200 cfs).
Annual peak stages and discharges
C*lendar year
^-~ -.
1945
1946lOj-,
1 Q . _
Date
Aug. 8 or 9
' Oct. 10Sept. 20Jan. 26
__Aug. 22
Gage height (feet)
27.7
19.5521.7620.5423.02
Discharge (cfs)
5,000
8661,160
9741,550
Calendar year
1950
195119521953
Date
Sept. 6
July 30Mar . 28Apr. 14
Gage height (feet)
26.02
14.8119.3624.37
Discharge (cfs)
3,500
457881
2,340
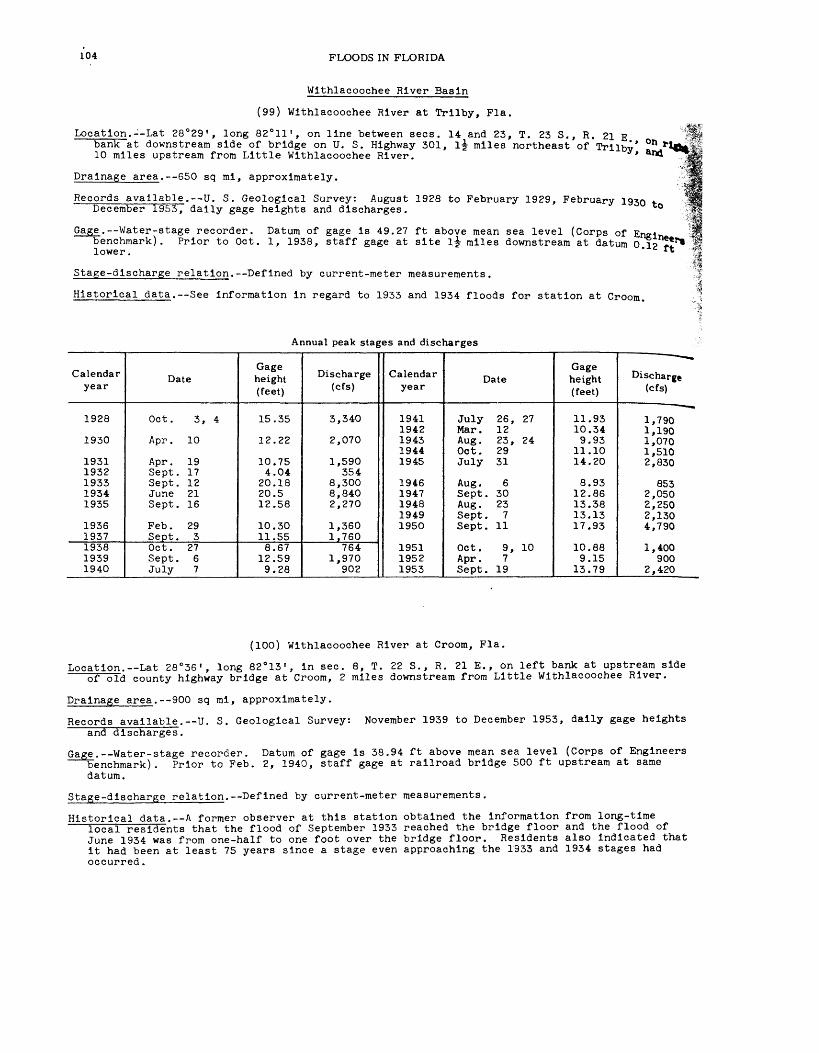
104 FLOODS IN FLORIDA
Withlacoochee River Basin
(99) Withlacoochee River at Trilby, Fla.
Location. Lat 28°29', long 82°11', on line between sees. 14 and 23, T. 23 S., R. 21 Ebank at downstream side of bridge on U. S. Highway 301, l£ miles northeast of Trilby* °n 10 miles upstream from Little Withlacoochee River.
Drainage area. 650 sq mi, approximately.
Records available.--U. S. Geological Survey: August 1928 to February 1929, February 1930 December 1953, dally gage heights and discharges.
Gage. Water-stage recorder. Datum of gage is 49.27 ft above mean sea level (Corps ofbenchmark). Prior to Oct. 1, 1938, staff gage at site l£ miles downstream at datum 0 T? lower.
Stage-discharge relation. Defined by current-meter measurements.
Historical data. See Information in regard to 1933 and 1934 floods for station at Croom.
Annual peak stages and discharges
Calendar year
1928
1930
19311932193319341935
19361937193819391940
Date
Oct. 3, 4
Apr . 10
Apr. 19Sept. 17Sept. 12June 21Sept. 16
Feb. 29Sept. 3Oct. 27Sept. 6July 7
Gage height (feet)
15.35
12.22
10.754.04
20.1820.512.58
10.3011.558.67
12.599.28
Discharge (cfs)
3,340
2,070
1,590354
8,3008,8402,270
1,3601^760
7641,970
902
Calendar year
19411942194319441945
19461947194819491950
195119521953
Date
July 26, 27Mar. 12Aug. 23, 24Oct. 29July 31
Aug. 6Sept. 30Aug. 23Sept. 7Sept. 11
Oct. 9, 10Apr. 7Sept. 19
Gage height (feet)
11.9310.349.93
11.1014.20
8.9312.8613.3813.1317.93
10.889.15
13.79
Discharge (cfs)
1,7901,1901,0701,5102,830
8532,0502,2502,1304,790
1,400900
2,420
(100) Withlacoochee River at Croom, Fla.
Location. Lat 28°36', long 82°13', in sec. 8, T. 22 S., R. 21 E., on left bank at upstream side of old county highway bridge at Croom, 2 miles downstream from Little Withlacoochee River.
November 1939 to December 1953, daily gage heights
Drainage area. 900 sq mi, approximately.
Records available.--U. S. Geological Survey: and discharges.
Gage. Water-stage recorder. Datum of gage is 38.94 ft above mean sea level (Corps of Engineers benchmark). Prior to Feb. 2, 1940, staff gage at railroad bridge 500 ft upstream at same
datum.
Stage-discharge relation. Defined by current-meter measurements.
Historical data. A former observer at this station obtained the information from long-time local residents that the flood of September 1933 reached the bridge floor and the flood of
June 1934 was from one-half to one foot over the bridge floor. Residents also indicated that it had been at least 75 years since a stage even approaching the 1333 and 1934 stages had occurred.

GAGING STATION RECORDS 105
Wlthlacoochee River Basin
(100) Wlthlacoochee River at Groom, Fla. Continued
Annual peak stages and discharges
Calendar year
1940
19411942194319441945
1946
Date
July 12
Apr. 12Mar. 18Aug. 25Oct. 29, 30July 29
Aug. 6
Gage height (feet)
7.45
8.627.927.908.56
10.44
7.58
Discharge (cfs)
1,080
2,0601,4001,4001,8004,290
1,180
Calendar year
1947194819491950
195119521953
Date
Sept. 28, 29Aug. 25Sept. 3Sept. 12
Oct. 11Apr. 7Sept. 22, 23
Gage height (feet)
9.679.629.97
12.71
8.007.39
10.12
Discharge (cfs)
3,1603,1003,3308,450
1,3901,0703,560
(101) Wlthlacoochee River near Holder, Pla.
Location. Lat 28°59'15", long 82°20'50", In sec. 19, T. 17 S., R. 20 E., on right bank, 100 ft downstream from bridge on State Highway 200, 4-g- miles northeast of Holder.
Drainage area. 1,710 sq ml, approximately.
Records available. U. S. Geological Survey: August 1928 to February 1929, August 1931 to becember 1953, dally gage heights and discharges.
5S£e. Water-stage recorder. Datum of gage Is 27.52 ft above mean sea level (levels by Corps of Engineers). Aug. 14, 1928, to Feb. 15, 1929, staff gage at bridge 100 ft upstream at datum 2.00 ft higher.
Stapje-dlscharge relation.--Defined by current-meter measurements.
Annual peak stages and discharges
Calendar year
1928
19311932193319341935
19361937 IQ*D* 3oa1939 1940
^1941
Date
Oct. 16
Sept. 19Sept. 9Sept. 26July 9, 10Sept. 30
Mar. 17Aug. 31Nov. 6Sept. 25Aug. 8, 9
Apr. 22
Gage height (feet)
11.26
4.36-
11.1711.63
8.86
7.668.465.487.944.76
5.90
Discharge (cfs)
5,830
1,210555
5,8606,7403,290
2,8003,0901,5602,7201,400
1,890
Calendar year
1942194319441945
19461947194819491950
195119521953
Date
Mar . 28Sept. 2Nov. 10Aug. 20
Oct. 12Oct. 16, 17Sept. 2Oct. 2Sept. 28
Oct. 23Mar. 30, 31Oct. 9
Gage height (feet)
6.137.866.36
10.54
7.558.739.49
10.3610.40
4.105.25
10/46
Discharge (cfs)
1,9002,7802,0605,330
2,7003,3203,9704,9304,980
1,2501,5505,050
present datum.

106 FLOODS IN FLORIDA
Waccasassa River Basin
(102) Waccasassa River near Otter Creek, Fla.
Location. Lat 29°22', long 82°44', in sec. 17, T* 13 S., R. 16 E., near right bank at upstr sTdlPof bridge on State Highway 24, 2.8 miles northeast of village of Otter Creek, and li ** miles upstream from Otter Creek.
\Records available.--U. S. Geological Survey: May 1945 to November 1953, daily gage heights *»-,
discharges for main channel only. ^*
Gage. Water-stage recorder. Datum of gage is 23.52 ft above mean sea level, datum of 1929,
Stage-discharge relation. Defined by current-meter measurements "below 1,200 cfs for main c only.Considerable shifting at all stages.
Remarks. Waccasassa River and Otter Creek are connected above State Highway 24 by swamps and numerous cross channels.
Annual peak stages and discharges
Calendar year
1945
1946 1947 1948 1949
Date
Aug . 20
July 30 Sept. 25, 26 Mar. 12 Aug. 13
Gage height (feet)
5.57
4.72 5.21 6.39 5.48
Discharge (cfs)
506
255 399 902 490
Calendar year
1950
1951 1952 1953
Date
Sept. 7
Nov. 17 Feb. 26 Aug . 25
Gage height (feet)
7.16
5.00 5.10 5.60
Discharge (cfs)
1,210
354 376 577
(103) Otter Creek at Otter Creek, Pla.
Location. Lat 29°19', long 82°46', in sec. 26, T. 13 S., R. 15 E., near right bank at upstream side of bridge on State Highway 24, 0.5 mile southwest of village of Otter Creek and about 7 miles upstream from mouth.
Records available. U. S. Geological Survey: May 1945 to November 1953, daily gage heights and discharges.
Gage. Water-stage recorder. Datum of gage is 13.35 ft above mean sea level, datum of 1929.
Stage-discharge relation.--Defined by current-meter measurements below 3,000 cfs.
Remarks. Records include flow in main channel and a relief channel 0.4 mile east of gage.Waccasassa River and Otter Creek are connected above State Highway 24 by swamps and numerous cross channels.
Annual peak stages and discharges
Calendar year
1945
1946194719481949
Date
Aug. 20
July 31Oct. 17Mar. 12Aug. 14
Gage height (feet)
5.91
4.995.386.185.60
Discharge (cfs)
560
322542
1,350788
Calendar year
1950
195119521953
Date
Sept. 6
Nov. 17Peb . 17Aug. 9
Gage height (feet)
7.93
5.085.055.00
/
Discharge (cfs)
3,000
509496474

GAGING STATION RECORDS 107
Suwannee River Basin
(104) Suwannee River at Fargo, Ga. /
Location.--Lat 30°41', long 82°34 ? , on downstream side of Southern Railway bridge at Fargo, Clinch County, 4 miles upstream from Suwanoochee Creek and 12 miles downstream from Mixons Ferry dam site.
Drainage area.--About 1,260 sq mi (includes part of watershed in Okefenokee Swamp which is indeterminate).
Records available. U. S. Geological Survey: January 1927 to December 1931, April 1937 to December 1953, daily gage heights and discharges.
Gage. Water-stage recorder. Datum of gage is 91.90 ft above mean sea level, datum of 1929, supplementary adjustment of 1936. January 1927 to December 1931 (incomplete) and April 1937 to June 10, 1938, staff gage at site 1,000 ft upstream at datum 1.00 ft higher. June 11, 1938, to Nov. 26, 1952, staff gage at site 1,000 ft upstream at present datum. (All gage readings listed below have been reduced to present datum).
Stage-discharge relation. Defined by current-meter measurements below 12,000 cfs; affected by backwater.
Annual peak stages and discharges
Calendar year
192819291930
193819391940
1941194219431944
Date
Oct. 1Oct. 3Oct. 3
Aug. 8, 9Aug. 29Feb. 21
Nov. 8-12Jan. 11Mar. 7Aug. 14-18
Gage height (feet)
19.519.611.4
8.211.611.0
7.815.93.8
12.8
Discharge (cfs)
13,80011,9002,460
1,3002,4902,060
8707,960
2584,280
Calendar year
1945
19461947194819491950
195119521953
Date
Aug. 22
Aug. 8, 9Oct. 29Apr. 4, 5Sept. 10Oct. 26-30
Dec. 31Mar. 4Oct. 6
Gage height (feet)
17.3
14.219.619.114.311.9
12.811.014.6
Discharge (cfs)
9,690
5,92011,90011,0005,9003,260
4,3002,3905,640
(105) Suwannee River at White Springs, Fla.
Location. --Lat 30°20', long 82°44', in sec. 8, T. 2 S., R. 16 E., on left bank at downstream side " of bridge on U. S. Highway 41, 1 mile southeast of White Springs.
Drainage area. 1,990 sq mi (includes part of watershed in Okefenokee Swamp which is indeter- minate) .
Records available. U. S. Geological Survey: May 1906 to December 1908, February 1927 to December 1953, daily gage heights and discharges.
. Water-stage recorder. Datum of gage is 48.54 ft above mean sea level (Corps of Engineers enchmark). May 28, 1906, to Dec. 31, 1908, chain gage, and Feb. 8, 1927, to July 31, 1932, staff gage at site 1 mile downstream at same datum.
££g£e-diacharge relation. Defined by current-meter measurements below 28,000 cfs.
. The flood of Apr. 5, 1948 was reported to be the highest known to residents of(since 1862). Flood of 1928 was reported to be highest known at that time.

108 FLOODS IN FLORIDA
Suwannee River Basin
(105) Suwannee River at White Springs, Fla. Continued
Annual peak stages and discharges
Calendar year
190619071908
19271928
19291930
19311932193319341935
19361937
Date
July 16Oct. 4Jan . 1,2
July 27Sept. 30,Oct. 1Oct. 5Mar. 30, 31,Apr. 1
Jan. 24, 25Sept. 22Feb. 17Aug. 13Sept. 22
Feb. 24Apr. 18
Gage height (feet)
23.213.020.9
9.8
33.933.5
30.4
15.029.2628.9710.1021.07
16.0029.54
Discharge (cfs)
7,4003,5406,520
2,610
20,60019,600
12,600
4.28010,10010,2002,2206,330
4,48011,100
Calendar year
193819391940
19411942194319441945
19461947194819491950
195119521953
Date
Aug. 8Aug. 28Feb. 20
Dec. 29Jan. 15Mar. 8Aug. 11, 12Aug. 26
Aug. 11Oct. 29Apr. 5Sept. 12Oct. 30
Nov. 17Jan. 5Oct. 10
Gage height (feet)
15.2319.0117.75
14.9030.224.74
24.3733.20
26.1135.4736.6524.9115.16
19.2919.3428.36
- ̂Discharge *
(cfs) -^
4,1505,6405,180
4,08011,700
5947,690
16,500
8,34023,70028,5007,8804,200
5,7605,780
10,100
(106) Alapaha River near Alapaha, Ga.
Location. Lat 31°23', long 83°10«, on downstream side of bridge on State Highway 50, 2 miles east of Alapaha, Berrien County, and 6 miles upstream from Willacoochee River.
Drainage area. 644 sq mi.
Records available. U. S. Geological Survey: April 1937 to December 1953, daily gage heights and discharges.
Gage. Water-stage recorder. Datum of gage is 209.34 ft above mean sea level, datum of 1929. Prior to Sept. 8, 1943, staff gage at same site and datum.
Stage-discharge relation.--Defined by current-meter measurements below 12,000 cfs.
Historical data.--Flood of 1928 reached a stage of 18.0 ft from information by Georgia Highway Department.
Annual peak stages and discharges
Calendar year
1928
193819391940
19411942194319441945
Date
Apr. 15Mar. 3Feb. 25
Mar. 25, 26Jan. 9Mar. 26, 27Apr. 21July 22
Gage height (feet)
18.0
8.615.310.8
9.512.911.315.011.5
Discharge (cfs)
16,000
1,0609,2202,290
1,4504,9602,7008,6202,920
Calendar year
19461947194819491950
195119521953
Date
Jan. 23Apr. 21Apr. 4Feb. 12Mar. 22
Dec. 25, 26Feb. 24Oct. 6
Gage height (feet)
11.613.716.811.58.9
10.910,810.9
Discharge (cfs)
3,0406,160
12,7002,9201,130
2,3002,2202,300

GAGING STATION RECORDS 109
Suwannee River Basin
(107) Alapaha River at Statenvllle, Ga.X
Location. Lat 30°40', long 83°01', at downstream side of left bank pier of bridge on State Highway 94, a quarter of a mile west of Statenvllle, Echols County.
December 1931 to December 1953, dally gage heights
Drainage area. 1,400 sq ml, approximately.
Records available.--U. S. Geological Survey: and discharges.
Gage. Water-stage recorder. Datum of gage Is 76.77 ft above mean sea level (levels by Georgia State Highway Department). Dec. 10, 1931, to July 9, 1935, chain gage, July 10, 1935, to Nov. 30, 1949, staff gage at site 200 ft upstream, Dec. 1, 1949, to Nov. 22, 1952, wire- weight gage at present datum.
Stage-discharge relation. Defined by current-meter measurements throughout range In stage.
Historical data. Flood of May 1, 1928, reached a stage of 28.5 ft, from Information furnished by local resident. Flood of April 1948 was the highest since 1862, from Information furnished by a local resident.
Remarks. Records for period from October 1928 to September 1931, obtained at Mayday, Georgia, 11 miles upstream from present site. Drainage area 1,300 sq mi, approximately.
Anqual peak stages and discharges
Calendar year
192819291930
19311932193319341935
19361937193819391940
Date
May 1Mar. 22Feb. 8
May 19Aug. 30Feb. 22June 4, 5, 7Sept. 6, 8
Feb. 19Apr. 14Sept. 30Mar. 9Feb. 28, 29
Gage height (feet)
28.5--
-11.621.810.814.6
18.522.86.4
26.411.7
Discharge (cfs)
' 17.40014,2004,730
3,3702,7406,1402,4203,440
4,9006,5601,130
10,5002,630
Calendar year
19411942194319441945
19461947194819491950
195119521953
Date
Mar. 31Mar. 23Apr. 3, 4Apr. 27Aug . 25
Jan . 30Apr . 28Apr. 6Sept. 5Apr. 5
Apr. 5Mar. 13Oct. 1
Gage height (feet)
9.422.312.226.822.8
17.222.429.818.58.7
14.914.516.9
Discharge (cfs)
1,9106,3702,700
11,1006,630
4,1605,990
27,3004,6201,740
3,4803,3604,100
(108) Little River near Adel, Ga.
location. Lat 31°09', long 83°33', on right bank 500 ft downstream from bridge on State Highway 37, half a mile downstream from Georgia and Florida Railroad bridge, 5^ miles upstream from Bear Creek, 6 miles downstream from Warrior Creek, and 7 miles west of Adel, Cook County.
Sgalnage area. 547 sq mi.
Records available . --U. S. Geological Survey: June 1940 to December 1953, daily gage heights and discharges.
£&££. Water-stage recorder. Datum of gage is 171.08 ft above mean sea level, datum of 1929.
-~£gge-dlscharge relation. Defined by current-meter measurements below 13,000 cfs and by contracted-opening determination for peak flow of Apr. 2, 1948.
data. --The flood of August 1928 reached a stage of 20.5 ft, from information byGeorgia Highway Department .
The flood of April 1948 was the highest known to local residents.

110 FLOODS IN FLORIDA
Suwannee River Basin
(108) Little River near Adel, Ga. Continued
Annual peak stages and discharges
Calendaryear
1928
19411942194319441945
1946
Date
Aug. -
Mar. 24Jan. 6May 26Mar. 8July 22
Jan. 25
Gageheight(feet)
20.5
11.516.715.618.715.3
14.6
Discharge(cfs)
32,500
1,5205,90O3,950
16,7003,670
2,920
Calendaryear
1947194819491950
195119521953
Date
Mar. 10Apr. 2Apr . 14July 15
Dec . 25Mar. 27Sept. 30
Gageheight(feet)
17.121.014.814.4
15.814.714.9
~^^
(cfs) **
7,58038,8003,2102,750
4,3603,0103,210
(109) WIthlacoochee River near Qultman, Ga.
Location. Lat 30°47', long 83°27", at bridge on U. S. Highway 84, 500 ft upstream from Tiger Creek, 800 ft downstream from Atlantic Coast Line Railroad bridge, a quarter of a mile east of Blue Springs, and 6 miles east of Qultman, Brooks County.
Drainage area.--1,560 sq ml, approximately.
Records available. U. S. Geological Survey: October 1920 to March 1921, September 1928 toDecember 1931, June 1937 to September 1948, dally gage heights and discharges. Since January 1953, annual flood peaks.
Gage. Non-recording gage. Datum of gage Is 84.30 ft above mean sea level, datum of 1929, supplementary adjustment of 1936. Gage used 1928-31 was at datum 5.0 ft lower. Since September 1948, crest-stage gage (too high to Indicate annual flood peaks prior to January 1953). All gage heights tabulated below have been reduced to present datum for this report.
Stage-discharge relation. Defined by current-meter measurements below 50,000 cfs.
Historical data.--At the time of the August 1928 flood, It was reported to be the highest known to the oldest residents of the area.
Annual peak stages and discharges
Calendar year
192819291930
1931
193819391940
1941
Date
Aug. 19Mar. 20Feb. 12
Aug. 21
Apr. 17Mar. 5Feb. 25
Mar. 29
Gage height (feet)
31.324.821.6
9.6
5.1322.611.0
8.3
Discharge (cfs)
62,00018,0006,250
2,760
95512,8003,450
2,320
Calendar year
1942194319441945
1946194719481949
1953
Date
Jan. 9Mar. 11Mar. 11July 27
Mar. 21Dec. 17Apr. 4Apr. 19
Oct. 1
Gageheight (feet)
22.012.525.521.4
18.225.531.716.6
18.0
Discharge (cfs)
11,6003,730
21,00010,600
6,86021,00066,0005,660
6,700

GAGING STATION RECORDS 111
Suwannee River Basin
(110) Withlacoochee River near Pinetta, Fla.
Location.--Lat 30°36', long 83°16 ! , on line between sees. 6 and 7, T.' 2 N., R. 11 E., on right bank 30 ft downstream from highway bridge a quarter of a mile west of Bellville, and 5 miles east of Pinetta.
Drainage area.--2,220 sq mi, approximately.
Records available.--U. S. Geological Survey: December 1931 to December 1953, daily gage heights and discharges.
Gage.--Water-stage recorder. Datum of gage is 47.21 ft above mean sea level (levels by Corps of Engineers). Prior to Jan. 27, 1939, chain gage and Jan. 27, 1939, to Dec. 2, 1941, wire-
weight gage at same site and datum.
Stage-discharge relation. Defined by current-meter measurements below 58,000 cfs. Slight shifting at medium and low stages.
Historical data. Flood of Apr. 5, 1948, is the maximum known. Flood of August 1928 reached a stage of 36.75 ft, from floodmarks, and was the highest known at that time, according to local residents.
Annual peak stages and discharges
Calendar year
1928
1932193319341935
19361937193819391940
__ 1941
Date
Aug.
June 18Feb. 24June 12Sept. 15
Feb. 15Apr. 14Mar. 24Mar. 8Feb. 20
Mar. 31
Gage height (feet)
36.75
14.4822.7911.9222.66
19.7228.329.27
22.8312.92
10.63
Discharge (cfs)
53,000
5,3809,8203,2709,770
8,24014,9001,450
10,8004,000
2,420
Calendar year
1942194319441945
19461947194819491950
195119521953
Date
Jan. 11Mar. 12Mar. 30July 29
Mar. 22Dec. 21Apr. 5Apr . 20Mar. 24
Apr. 7Mar. 5Apr. 20
Gage height (feet)
24.1414.8131.5726.92
23.5532.7038.6417.4711.66
15.4016.0318.01
Discharge (cfs)
11,3005,150
19,10013,600
11,00020,90079,4006,5902,970
5,2805,8707,180
(111) Suwannee River at Ellaville, Fla.
i2cation.--Lat 30°23', long 83°10', in sec. 24, T. 1 S. , R. 11 E. , on left bank at Ellaville, 200 ft upstream from Seaboard Air Line Railroad bridge, 200 ft downstream from Withlacoochee River, and a quarter of a mile upstream from bridge on U. S. Highway 90.
ffe area. 6,580 sq mi, approximately.
available. U. S. Geological Survey: January 1927 to December 1953, daily gage heights and discharges.
Water-stage recorder. Datum of gage is 27.82 ft above mean sea level, (levels by Corps of Engineers) . Prior to June 20, 1932, staff gage at same site and datum.
relation. Defined by current-meter measurements.
data. Flood of Apr. 7, 8, 1948, is the maximum known.

112 FLOODS IN FLORIDA
Suwannee River Basin
(111) Suwannee River at Ellaville, Fla. Continued
Annual peak stages and discharges
Calendar year
1927192819291930
19311932193319341935
19361937193819391940
Date
Aug. 28Aug. 20Oct. 12, 13Apr . 3,4
Jan. 25, 26Sept. 27Feb. 25, 26June 16Sept. 18
Feb. 27Apr. 17Aug. 13Mar. 13Feb. 28
Gage height (feet)
6.037.126.924.28
10.7015.6724.026.6
18.35
15.1623.665.61
15.1010.59
Discharge (cfs)
5,90073,00034,00029,200
9,73015,50026,4006,200
18,300
14,60025,2005,120
14,5009,670
Calendar year
19411942194319441945
19461947194819491950
195119521953
Date
July 29Mar . 26Mar. 14Apr. 9Aug. 28
Mar . 23Nov. 22, 23Apr. 7, 8Sept. 11Apr. 7
Apr. 9Mar. 7Oct. 9
Gage height (feet)
6.2424.907.43
23.5324.26
17.7130.5740.8816.106.82
10.9614.7618.80
Dischar|t 'fi«"> 1
5,710 -I27,200 i6,790 1
25,000 426,200 -
17,50039,80095,30015,7006,480
10,10014,30019,200
(112) Suwannee River at Luraville, Fla.
Location.--Lat 30°06', long 83°10', in sec. 30, T. 4 S., R. 12 E., near left bank on upstream side of county highway bridge, three miles upstream from Grants Ferry Shoals, and one mile south of Luraville.
Drainage area. 6,900 sq mi, approximately.
Records available. U. S. Geological Survey: February 1927 to December 1937, daily gage heights and discharges.
Gage.--Staff gage read once daily. Datum of gage was 16.49 ft above mean sea level (Corps of Engineers benchmark).
Stage-discharge relation. Defined by current-meter measurements below 33,000 cfs.
Historical data.--Maximum known flood of April 1948 reached a stage of about 37.0 ft, from information furnished by Corps of Engineers.
Annual peak stages and discharges
Calendar year
1927192819291930
193119321933
Date
Aug. 29Aug. 24Mar. 29, 30Apr. 7-10
Jan. 27Sept. 28-30Mar. 1
Gage height (feet)
5.833.722.521.6
9.8413.8020.28
Discharge (cfs)
6,09066,00027,20025,900
9,81014,80024,000
Calendar year
19341935
1936
1937
1948
Date
June 17Sept. 22, 23
Feb. 29,Mar. 1, 2Apr. 19
Apr.
Gage height (feet)
6.6715.80
13.1019.70
37.0
Discharge (cfs)
6,56017,500
13,90023,300
-

GAGING STATION RECORDS 113
Suwannee River Basin
(113) Suwannee River at Branford, Fla.
Location. Lat 29°57 r , long 82°56 r , in sec. 17 or 20, T. 6 S., R. 14 E.. near left bank on upstream side of bridge on U. S. Highways 27 and 129 at Branford, lo£ miles upstream from Santa Fe River.
Drainage area. 7,090 sq mi, approximately.
Records available.--U. S. Geological Survey: July 1931 to December 1953, daily gage heights and discharges.
Gage. Wire-weight gage read once daily. Datum of gage is 4.81 ft above mean sea level, datum of 1929. Prior to June 15, 1933, chain gage at same site and datum.
Stage-discharge relation. Defined by current-meter measurements.
Historical data.--Flood of Aug. 26, 1928, reached a stage of 32.0 ft, from floodmarks.
Annual peak stages and discharges
Calendar year
1928
1932193319341935
19361937193819391940
1941-
Date
Aug. 26
Sept. 30Mar. 1June 20Sept. 24
Mar. 1Apr. 20Aug. 14, 15Mar . 15Feb. 29
Apr . 1,3Aug. 1
Gage height (feet)
32.0
16.6621.9612.7619.08
16.1821.658.31
14.4812.08
-8.86
Discharge (cfs)
61,100
14,80024,1008,350
16,200
14,20022,7005,530
13,3008,900
5,790-
Calendar year
1942194319441945
19461947194819491950
195119521953
Date
Mar . 28Mar. 17Apr. 11Aug. 31
Aug. 13Nov. 24-26Apr. 11Sept. 13Oct. 28
Apr. 11Mar. 16-19Oct. 11
Gage height (feet)
23.709.20
21.4222.44
17.7726.9534.0718.1110.75
12.1916.4018.96
Discharge (cfs)
24,9006,730
21,70022,500
14,70032,50083,90015,6007,180
9,48013,70016,700
(114) Santa Fe River at Worthington, Fla.
. Lat 29°55', long 82°26', on line between sees. 32 and 33, T. 6 S., R. 19 E., near left bank on downstream side of bridge on State Highway 23, half a mile south of Worthington, and three-quarters of a mile downstream from New River.
area.--650 sq mi, approximately.
available. --U. S. Geological Survey: November 1931 to December 1953, daily gage heights and discharges.
Water-stage recorder. Datum of gage is 42.74 ft above mean sea level (levels by Corps of ngineers). Prior to Jan. 16, 1939, staff gage at site a quarter of a mile downstream at same
datum. Jan. 17, 1939, to July 23, 1953, wire-weight gage read once daily at same site and datum.
£e--dis charge relation. Defined by current-meter measurements; considerable shifting at all at;ages.
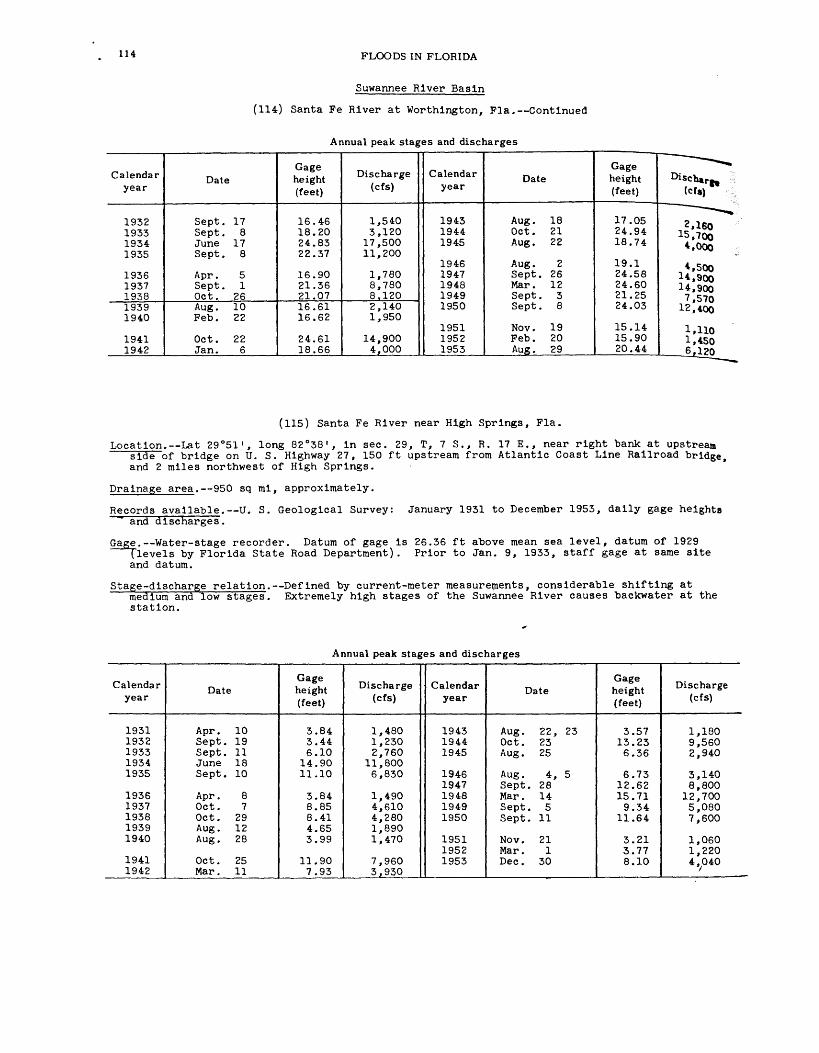
114 FLOODS IN FLORIDA
Suwannee River Basin
(114) Santa Fe River at Worthington, Pla. Continued
Annual peak stages and discharges
Calendar year
1932 1933 1934 1935
1936 1937 19381939 1940
1941 1942
Date
Sept. 17 Sept. 8 June 17 Sept. 8
Apr. 5 Sept. 1 Oct. 26Aug. 10 Feb. 22
Oct. 22 Jan. 6
Gage height (feet)
16.46 18.20 24.83 22.37
16.90 21.36 21.0716.61 16.62
24.61 18.66
Discharge (cfs)
1,540 3,120
17,500 11,200
1,780 8,780 8.1202,140 1,950
14,900 4,000
Calendar year
1943 1944 1945
1946 1947 1948 1949 1950
1951 1952 1953
Date
Aug. 18 Oct. 21 Aug. 22
Aug. 2 Sept. 26 Mar. 12 Sept. 3 Sept. 8
Nov. 19 Feb . 20 Aug. 29
Gage height (feet)
17.05 24.94 18.74
19.1 24.58 24.60 21.25 24.03
15.14 15.90 20.44
~~
Disch»rfc (cfs) "
2.160 iS. 700
*.ooo*.500
i*.9oo14,900 7.570
12,400
1,110 1,450
AtlZO
(115) Santa Fe River near High Springs, Fla.
Location. Lat 29°51', long 82°38', in sec. 29, T, 7 S., R. 17 E., near right bank at upstream side of bridge on U. S. Highway 27, 150 ft upstream from Atlantic Coast Line Railroad bridge, and 2 miles northwest of High Springs.
Drainage area. 950 sq mi, approximately.
Records available. U. S. Geological Survey: January 1931 to December 1953, daily gage heights ^ and discharges.
Gage. Water-stage recorder. Datum of gage is 26.36 ft above mean sea level, datum of 1929 (levels by Florida State Road Department). Prior to Jan. 9, 1933, staff gage at same site and datum.
Stage-discharge relation. Defined by current-meter measurements, considerable shifting at medium and low stages. Extremely high stages of the Suwannee River causes backwater at the station.
Annual peak stages and discharges
Calendar year
19311932193319341935
19361937193819391940
19411942
Date
Apr. 10Sept. 19Sept. 11June 18Sept. 10
Apr. 8Oct. 7Oct. 29Aug. 12Aug. 28
Oct. 25Mar. 11
Gage height (feet)
3.843.446.10
14.9011.10
3.848.858.414.653.99
11.907.93
Discharge (cfs)
1,4801,2302,760
11,8006,830
1,4904,6104,2801,8901,470
7,9603,930
Calendar year
194319441945
19461947194819491950
195119521953
Date
Aug. 22, 23Oct. 23Aug. 25
Aug. 4, 5Sept. 28Mar. 14Sept. 5Sept. 11
Nov. 21Mar. 1Dec . 30
Gage height (feet)
3.5713.236.36
6.7312.6215.719.34
11.64
3.213.778.10
Discharge (cfs)
1,1809,5602,940
3,1408,800
12,7005,0807,600
1,0601,2204,040'/

GAGING STATION RECORDS 115
Suwannee River Basin
(116) Santa Fe River near Fort White, Fla.
Location. £at 29°51', long 82°43', In sec. 28, T. 7 S., R. 16 E., on left bank 2 miles upstream from bridge on State Highway 47, 5 miles south of Fort White, and 15 miles upstream from mouth.
Drainage area.--1,080 sq mi, approximately.
Records available.--Mees and Mees, Inc.: July 1925 to September 1927, daily gage heights and discharges.U. S. Geological Survey: October 1927 to January 1930 and June 1932 to December
1953, daily gage heights and discharges.
Gage. Water-stage recorder. Datum of gage is 20.86 ft above mean sea level (levels by Corps of Engineers). Prior to June 4, 1932, staff gage at several sites within 200 ft of present site and at various daturas.
Oct. 1, 1947, to Feb. 10, 1949, auxiliary wire-weight gage and since Feb. 11, 1949, water- stage recorder at bridge on State Highway 49, 13.1 miles downstream. Datum of auxiliary gage is 3.5 ft above mean sea level, datum of 1929.
Stage-discharge relation. Defined by current-meter measurements; affected by backwater from Suwannee River.Discharge is computed using fall as a factor.
Annual peak stages and discharges
Calendar year
1926192719281929
1932193319341935
19361937193819391940
__ 1941
Date
Aug. 3-6Mar. 1-7Aug. 27-29Oct. 3-6
Sept. 20Apr . 20June 20Sept. 10
Feb. 13, 14Oct. 7, 8Oct. 30Aug. 12Aug. 28, 29
Oct. 26
Gage height (feet)
4.83.09.56.9
-4.19
11.048.26
2.466.005.512.842.16
8.14
Discharge (cfs)
4,1202,3704,7504,180
1,7402,810
11,4006,680
2,1404,7304,2502,4802,000
7,410
Calendar year
1942
194319441945
194619471948
19491950
195119521953
Date
Mar. 11-13Mar ; 23Aug. 23Oct. 24
. Aug. 26
Aug. 6Sept. 29Mar. 14Apr. 12Sept. 6Oct. 26
Nov. 23Mar. 4Dec. 31
Gage height (feet)
.6.581.959.484.82
4.798.73-
13.706.768.16
1.642.295.85
Discharge (cfs)
4,750-
1,7609,3003,650
3,8208,110
12,300-
5,5107,520
1,6702,0205,080
(117) Suwannee River near Bell, Fla.
location.- -La t 29°48', long 82°55', in sec. 16 or 17, T. 8 S., R. 14 E., on left bank at Rock uff Ferry, 4|- miles northwest of Bell and 10 miles downstream from Santa Fe River.
area. 9,260 sq mi, approximately.
available. --U. S. Geological Survey: June 1932 to December 1953, daily gage heights and discharges .
. Water-stage recorder. Datum of gage is 3.60 ft above mean sea level (levels by Corps of ngineers) .
-£S£§_-discharge relation. --Defined by current-meter measurements.
data. Flood of Aug. 28, 1928, reached stage of about 25.9 ft, from information by a resident .

116 FLOODS IN FLORIDA
Suwannee River Basin
(117) Suwannee River near Bell, Pla. Continued
Annual peak stages and discharges
Calendar year
1928
1932193319341935
19361937193819391940
1941
Date
Aug. 28
Sept. 30Mar. 2June 21Sept. 25
Mar. 2Apr . 22Aug . 15Mar. 16
Feb. 28-Mar. 1
Aug. 1
Gage height (feet)
25.9
12.2115.3611.3014.63
12.0915.536.40
10.288.88
7.14
Discharge (cfs)
_
16,10024,50014,80022,100
16,20024,8008,130
13,60011,700
9,110
Calendar year
1942194319441945
19461947194819491950
1951.19521953
Date
Mar . 28Mar . 18Apr. 12Sept. 3
Aug. 19Nov. 26, 27Apr. 13Sept. 12Oct. 28
Apr. 12Mar. 11Oct. 12
Gage height (feet)
17.286.37
15.2615.98
13.5919.5227.4314.009.56
8.8512.2514.33
Discharg, (cfs)
30,0008,270
2*. 00025,300
18,80038,40082,30018,80011,700
10,70015,90020,700
(118) Suwannee River near Wilcox, Pla.-
Location.--Lat 29°36', long 82°56', in sec. 29, T. 10 S., R. 14 E., on left bank about 400 ft downstream from Fort Fannin bridge on U. S. Highway 19, and 2 miles southwest of Wilcox.
Drainage area.--About 9,500 sq mi.
Records available. U. S. Geological Survey: September 1930 to September 1931 and March 1942 to December 1953, gage heights and discharges (fragmentary March 1942 to January 1951).
Gage. Water-stage recorder. Datum of gage is at mean sea level, datum of 1929. Prior to July 4, 1931, staff gage at site 400 ft upstream at same datum. July 4 to Sept. 30, 1931, and Mar. 26 to May 14, 1942, water-stage recorder at present site and datum. May 15, 1942, to Jan. 24, 1951, staff gage at present site and datum. Staff gage read once daily when stage exceeded 6.0 ft. Since Feb. 1, 1951, auxiliary water-stage recorder about 9 miles downstream.
Stage-discharge relation. Defined by current-meter measurements. Flow affected by tide fordischarges less than 12,000 cfs. Discharges computed using fall as a factor below 12,000 cfs.
Historical data. Flood of August 1928 reached stage of about 20.0 ft (source of information unknown).
Annual peak stages and discharges
Calendar year
1928
1931
1942
19441945
1946
Date
Aug. -
Feb. 1
Mar. 28-31
Apr . 13Sept. 3, 4
Aug. 19
Gage height (feet)
20.0
6.60
12.96
10.6811.40
9.27
Discharge (cfs)
_
14,500
29,200
22,30024,300
18,600
Calendar year
1947194819491950
195119521953
Date
Nov. 26-29Apr. 14Sept. 13-15Oct. 29
Apr. 14Mar. 11Oct. 13, 14
Gage height (feet)
15.1522.329.906.40
-8.439.87
Discharge (cfs)
37,80084,70020,10012,400
12,00016,70020,000
/

GAGING STATION RECORDS 117
Fenholloway River Basin
(119) Fenholloway River at Foley, Fla. /
Location. Lat 30°04', long 83°32', in sec. 9, T. 5 S., R. 8 E., on right bank at upstream side of highway bridge in Foley.
Drainage area.--180 sq mi, approximately.
Records available. U. S. Geological Survey: September 1946 to December 1953, daily gage heights and discharges.
Gage. Water-stage recorder. Datum of gage is 29.36 ft above mean sea level, datum of 1929. Prior to June 24, 1947, staff gage at same site and datum.
Stage-discharge relation. Defined by current-meter measurements. Considerable shifting at medium and low stages.
Annual peak stages and discharges
Calendar year
1947194819491950
Date
Nov. 12Mar. 10Feb. 8July 10
Gage height (feet)
14.4616.0313.8011.37
Discharge (cfs)
1,140. 2,640
826216
Calendar year
195119521953
Date
Nov. 18Feb. 18Sept. 28
Gage height (feet)
13.9213.6615.32
Discharge (cfs)
842725
1,860
Ochlockonee River Basin
(120) Ochlockonee River near Thomasville, Ga.
Location.--Lat 30°52', long 84°03', on downstream side of left bank pier of bridge on U. S.Highway 84, 2 miles upstream from Atlantic Coast Line Railroad bridge, 4 miles upstream from Barnetts Creek, 5 miles northwest of Thomasville, Thomas County, and 6 miles downstream from Little Ochlockonee River.
Drainage area.--550 sq mi, approximately.
Records available.--U. S. Geological Survey: August 1937 to December 1953, daily gage heights and discharges.
Gage. Water-stage recorder. Datum of gage is 133.6 ft above mean sea level, datum of 1929, supplementary adjustment of 1936. Prior to Jan. 7, 1947, wire-weight gage at same site and datum.
^age-discharge relation. Defined by current-meter measurements below 25,000 cfs and extended above by logarithmic plotting.
Historical data. Flood of April 1948 was reported to be the highest in the memory of residents of the area.
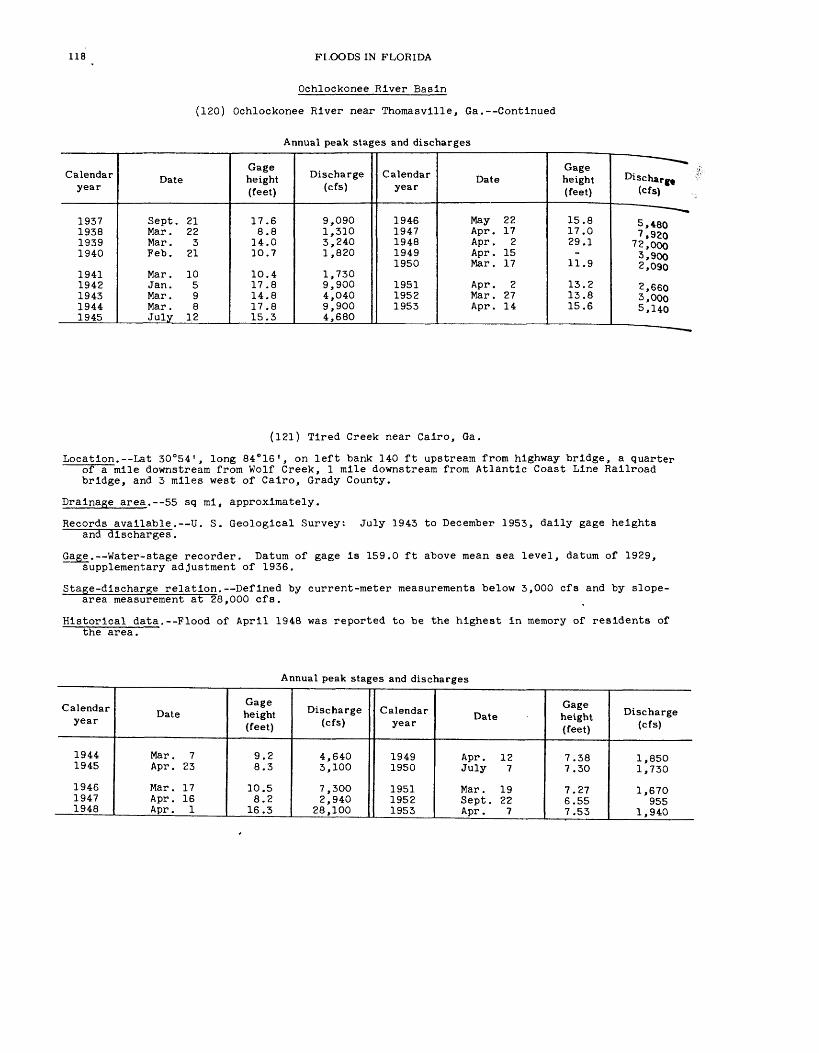
118 FLOODS IN FLORIDA
Ochlockonee River Basin
(120) Ochlockonee River near Thomasville, Ga.--Continued
Annual peak stages and discharges
Calendar year
1937193819391940
19411942194319441945
Date
Sept. 21Mar . 22Mar. 3Feb. 21
Mar . 10Jan. 5Mar. 9Mar. 8July 12
Gage height (feet)
17.68.8
14.010.7
10.417.814.817.815.3
Discharge (cfs)
9,0901,3103,2401,820
1,7309,9004,0409,9004,680
Calendar year
19461947194819491950
195119521953
Date
May 22Apr. 17Apr. 2Apr. 15Mar. 17
Apr. 2Mar. 27Apr. 14
Gage height (feet)
15.817.029.1-
11.9
13.213.815.6
-^
Discharg, (cfs)
-.
5,4807,920
72,0003,9002,090
2,6603,0005,140
(121) Tired Creek near Cairo, Ga.
Location. Lat 30°54', long 84°16', on left bank 140 ft upstream from highway bridge, a quarter of a mile downstream from Wolf Creek, 1 mile downstream from Atlantic Coast Line Railroad bridge, and 3 miles west of Cairo, Grady County.
Drainage area.--55 sq mi, approximately.
Records available. U. S. Geological Survey: July 1943 to December 1953, daily gage heights and discharges.
Gage. Water-stage recorder. Datum of gage is 159.0 ft above mean sea level, datum of 1929, supplementary adjustment of 1936.
Stage-discharge relation. Defined by current-meter measurements below 3,000 cfs and by slope- area measurement at 28,000 cfs.
Historical data.--Flood of April 1948 was reported to be the highest in memory of residents of the area.
Annual peak stages and discharges
Calendar year
1944 1945
1946 1947 1948
Date
Mar. 7 Apr. 23
Mar. 17 Apr. 16 Apr. 1
Gage height (feet)
9.2 8.3
10.5 8.2
16.3
Discharge (cfs)
4,640 3,100
7,300 2,940
28,100
Calendar year
1949 1950
1951 1952 1953
Date
Apr. 12 July 7
Mar. 19 Sept. 22 Apr. 7
Gage height (feet)
7.38 7.30
7.27 6.55 7.53
Discharge (cfs)
1,850 1,730
1,670 955
1,940
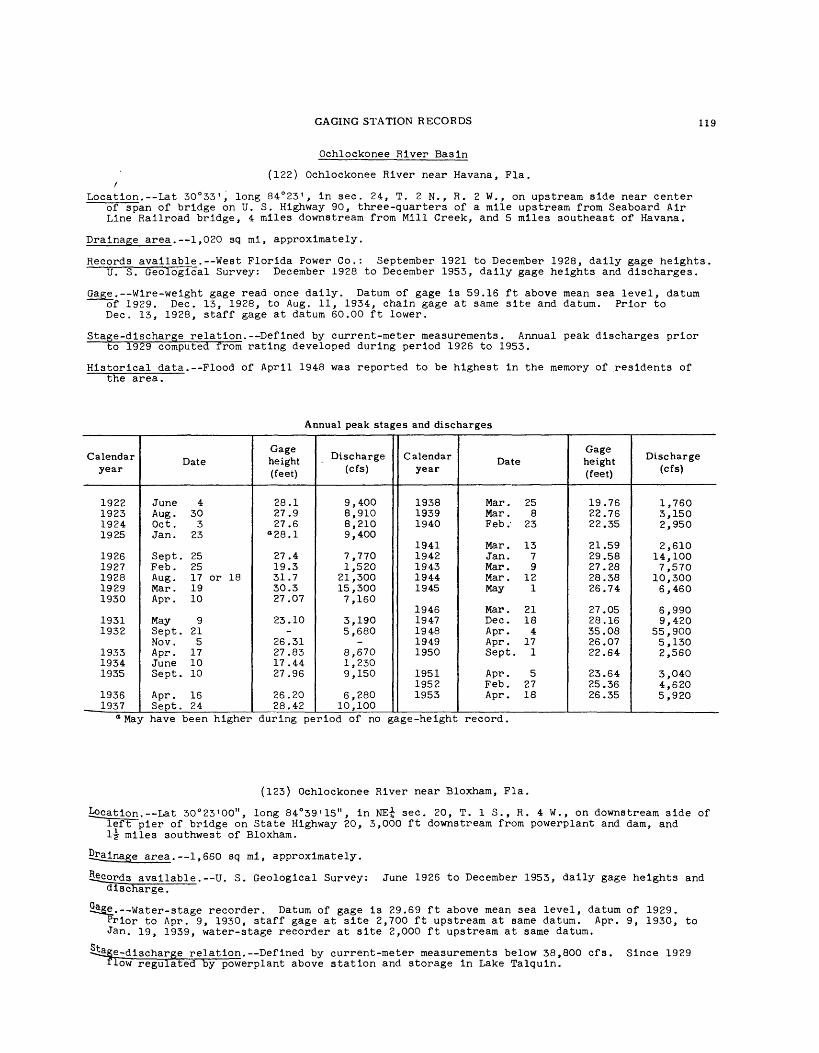
GAGING STATION RECORDS 119
Ochlockonee River Basin
(122) Ochlockonee River near Havana, Fla. /
Location.--Lat 30°33', long 84°23', in sec. 24, T. 2 N., R. 2 W., on upstream side near center of span of bridge on U. S. Highway 90, three-quarters of a mile upstream from Seaboard Air Line Railroad bridge, 4 miles downstream from Mill Creek, and 5 miles southeast of Havana.
Drainage area. 1,020 sq mi, approximately.
Records available.--West Florida Power Co.: September 1921 to December 1928, daily gage heights.U. S. Geological Survey: December 1928 to December 1953, daily gage heights and discharges.
Gage.--Wire-weight gage read once daily. Datum of gage is 59.16 ft above mean sea level, datum of 1929. Dec. 13, 1928, to Aug. 11, 1934, chain gage at same site and datum. Prior to Dec. 13, 1928, staff gage at datum 60.00 ft lower.
Stage-discharge relation.--Defined by current-meter measurements. Annual peak discharges prior to 1929 computed from rating developed during period 1926 to 1953.
Historical data.--Flood of April 1948 was reported to be highest in the memory of .residents of the area.
Annual peak stages and discharges
Calendar year
1922192319241925
19261927192819291930
19311932
193319341935
1936__ 1937
Date
June 4Aug. 30Oct. 3Jan . 23
Sept. 25Feb. 25Aug. 17 or 18Mar. 19Apr . 10
May 9Sept. 21Nov. 5Apr. 17June 10Sept. 10
Apr. 16Sept. 24
Gage height (feet)
28.127.927.6
°28.1
27.419.331.730.327.07
23.10-
26.3127.8317.4427.96
26.2028.42
Discharge (cfs)
9,4008,9108,2109,400
7,7701,520
21,30015,3007,160
3,1905,680
-8,6701,2309,150
6,28010,100
Calendar year
193819391940
19411942194319441945
19461947194819491950
195119521953
Date
Mar . 25Mar. 8Feb . 23
Mar. 13Jan. 7Mar. 9Mar. 12May 1
Mar . 21Dec. 18Apr. 4Apr . 17Sept. 1
Apr. 5Feb. 27Apr. 18
Gage height (feet)
19.7622.7622.35
21.5929.5827.2828.3826.74
27.0528.1635.0826.0722.64
23.6425.3626.35
Discharge (cfs)
1,7603,1502,950
2,61014,1007,570
10,3006,460
6,9909,420
55,9005,1302,560
3,0404,6205,920
May have been higher during period of no gage-height record.
(123) Ochlockonee River near Bloxham, Fla.
legation. Lat 30°23'00", long 84°39'15", in NE£ sec. 20, T. 1 S., R. 4 W., on downstream side of left pier of bridge on State Highway 20, 3,000 ft downstream from powerplant and dam, and l-g- miles southwest of Bloxham.
Sgg-inage area.--1,660 sq mi, approximately.
Sggords available. U. S. Geological Survey: June 1926 to December 1953, daily gage heights and discharge.
Water-stage recorder. Datum of gage is 29.69 ft above mean sea level, datum of 1929. ior to Apr. 9, 1930, staff gage at site 2,700 ft upstream at same datum. Apr. 9, 1930, to
Jan. 19, 1939, water-stage recorder at site 2,000 ft upstream at same datum.
St cggg-discharge relation. Defined by current-meter measurements below 38,800 cfs. Since 1929 ilow regulated by powerp]powerplant above station and storage in Lake Talquin.
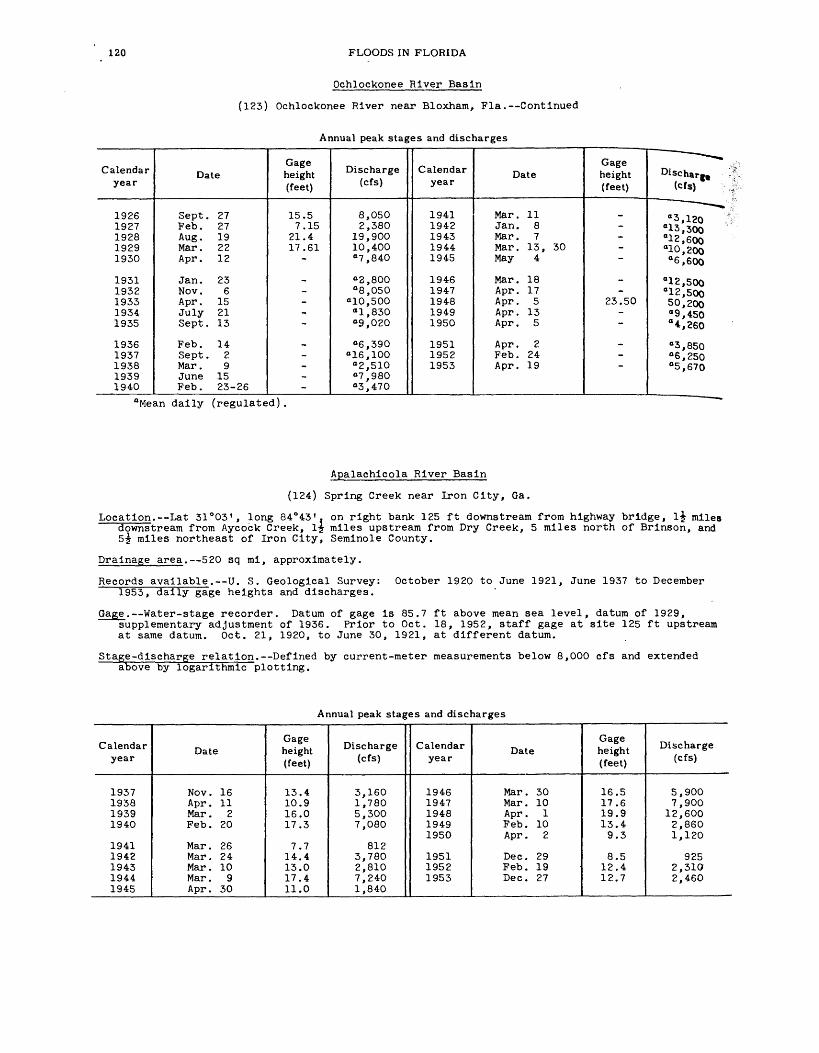
120 FLOODS IN FLORIDA
Ochlockonee River Basin
(123) Ochlockonee River near Bloxham, Fla. Continued
Annual peak stages and discharges
Calendar year
19261927192819291930
19311932193319341935
19361937193819391940
Date
Sept. 27Feb. 27Aug. 19Mar. 22Apr. 12
Jan. 23Nov. 6Apr. 15July 21Sept. 13
Feb. 14Sept. 2Mar. 9June 15Feb. 23-26
Gage height (feet)
15.57.15
21.417.61
-
-----
_----
Discharge (cfs)
8,0502,380
19,90010,400°7,840
°2,800°8,050
"10,500 1,830°9,020
°6,390°16,100°2,510°7,980°3,470
Calendar year
19411942194319441945
19461947194819491950
195119521953
Date
Mar. 11Jan. 8Mar. 7Mar. 13, 30May 4
Mar. 18Apr. 17Apr. 5Apr. 13Apr. 5
Apr. 2Feb. 24Apr. 19
Gage height (feet)
_----
--
23.50--
---
Discharg, (cfs)
"3,120"13,300°12,600°10,200°6,600
°12,500°12,50050,200°9,450"4,260
°3,850°6,250°5,670
aMean daily (regulated)
Apalachicola River Basin
(124) Spring Creek near Iron City, Ga.
Location. Lat 31°03', long 84°43'. on right bank 125 ft downstream from highway bridge, l£ miles downstream from Aycock Creek, 1? miles upstream from Dry Creek, 5 miles north of Brinson, and 5^ miles northeast of Iron City, Seminole County.
Drainage area. 520 sq mi, approximately.
Records available. U. S. Geological Survey: 1953, daily gage heights and discharges.
October 1920 to June 1921, June 1937 to December
Gage. Water-stage recorder. Datum of gage is 85.7 ft above mean sea level, datum of 1929,supplementary adjustment of 1936. Prior to Oct. 18, 1952, staff gage at site 125 ft upstreamat same datum. Oct. 21, 1920, to June 30, 1921, at different datum.
Stage-discharge relation. Defined by current-meter measurements below 8,000 cfs and extended above by logarithmic plotting.
Annual peak stages and discharges
Calendar year
1937193819391940
19411942194319441945
Date
Nov. 16Apr. 11Mar. 2Feb. 20
Mar. 26Mar. 24Mar. 10Mar. 9Apr . 30
Gage height (feet)
13.410.916.017.3
7.714.413.017.411.0
Discharge (cfs)
3,1601,7805,3007,080
8123,7802,8107,2401,840
Calendar year
19461947194819491950
195119521953
Date
Mar. 30Mar. 10Apr. 1Feb. 10Apr. 2
Dec. 29Feb. 19Dec. 27
Gage height (feet)
16.517.619.913.49.3
8.512.412.7
Discharge (cfs)
5,9007,900
12,6002,8601,120
9252,3102,460

GAGING STATION RECORDS 121
Apalachlcola River Basin
(125) Apalachlcola River at Chattahoochee, Fla.
Location.--Lat 30°42'03", long 84°51'33", In sec. 32, T. 4 N., R. 6 W., near center of span on downstream side of bridge on U. S. Highway 90, 0.8 mile downstream from confluence of Flint and Chattahoochee Rivers, and 1 mile west of Chattahoochee.
Drainage area. 17,100 sq ml, approximately.
Records available. U. S. Weather Bureau: October 1919 to December 1928, dally gage heights. U. S. Geological Survey: December 1928 to December 1953, dally gage heights and discharges. Records prior to October 1939, published as "near River Junction 1 .
Gage.--Wire-weight gage read twice dally. Datum of gage Is 45.58 ft above mean sea level, datum of 1929 (U. S. Weather Bureau benchmark). Prior to Dec. 11, 1928, U. S. Weather Bureau staff gage read once dally and Dec. 11, 1928, to Dec. 15, 1939, water-stage recorder at site seven- eighths of a mile downstream, at datum 0.73 ft lower. Dec. 16, 1939, to June 25, 1952, water- stage recorder at present site and datum.
Stage-discharge relation. Defined by current-meter measurements below 200,000 cfs. Maximumannual discharges prior to 1929 computed from average rating curve used during period 1929-39.
Annual peak stages and discharges
Calendar year
19191920
19211922192319241925
19261927192819291930
19311932193319341935
___1936
Date
Dec. 17Apr. 7
Feb. 15Mar. 15Mar. 22Jan. 28Jan. 24
Apr. 4Feb. 17Apr. 27Mar. 20Nov. 21
Apr. 7Feb. 25Mar. 24Mar. 8Mar. 10
Apr. 15
Gage height (feet)
24.723.4
18.823.821.416.032.1
20.812.026.634.7019.10
10.4014.3419.5317.5714.46
25.83
Discharge (cfs)
130,000114,000
72,000119,00093,00054,000
246,000
87,00038,000
157,000293,00071,500
32,90045,60073,90063,40046,800
145,000
Calendar year
1937193819391940
19411942194319441945
19461947194819491950
195119521953
Date
Apr. 12Apr. 13Mar. 5Feb. 21
Dec. 29Mar. 27Mar. 27Apr. 2Dec. 30
Apr. 2Mar. 11, 12Dec. 5May 4Mar. 18
Dec. 26Mar. 28May 7, 8
Gage height (feet)
19.2022.8822.3718.98
17.0222.4025.9325.7817.33
21.6219.3925.4220.9211.83
13.8921.0221.39
Discharge (cfs)
74,500108,000101.00070,700
58,80099,000
143,000142,00060,300
85,20072,800
137,00086,20037,100
44,00087,40091,300
(126) Mosquito Creek at Chattahoochee, Fla.
£o£atl.on.-- Lat 30°43', long 84°49', In sec. 34, T. 4 N. , R. 6 W., at Chattahoochee, 500 ftupstream from bridge on U. S. Highway 90, 600 ft downstream from pumping plant and dam, and 3 miles upstream from mouth.
area. 60 sq ml, approximately.
available. --U. S. Geological Survey: March 1936 to August 1942, dally gage heights and discharges .
Water-stage recorder. Datum of gage was not determined.
" £5£§rdlscharge relation. Defined by current-meter measurements below 600 cfs.
jarks_. About 3 cfs diverted by pumping from reservoir for Florida State Hospital. Some regulatlon from changes In reservoir pool.

122 FLOODS IN FLORIDA
Apalachlcola River Basin
(126) Mosquito Creek at Chattahoochee, Pla. Continued
Annual peak stages and discharges
Calendar year
1937 1938 1939
Date
Sept. 1 Mar. 18 June 1
Gage height (feet)
11.54 5.33 6.82
Discharge (cfs)
1,310 296 492
Calendar year
1940 1941 1942
Date
Feb. 18 Mar. 7 Jan. 4
Gage height (feet)
8.48 5.47
10.99
Discharge (cfs)
765320
1,200
(127) Apalachlcola River near Blountstown, Fla.
Location. Lat 30°25'25", long 85°01»55", in sec. 3, T. 1 S., R. 8 W., on right bank at old ferry landing near office and mill of Neal Lumber Co. at McNeal, half a mile upstream from Old River Cutoff, and about 1-J miles southeast of Blountstown.
Drainage area. 17,300 sq mi, approximately.
Records available. U. S. Weather Bureau: January 1920 to December 1953, daily gage heights.
Gage. Staff gage read once daily. Datum of gage is 26.96 ft above mean sea level, datum of 1929.
Stage-discharge relation. Not defined.
Historical data. Flood of July 1916 reached a stage of 23.8 ft, from Weather Bureau records.
Annual peak stages
Calendar year
1916
1920
19211922192319241925
19261927192819291930
19311932193319341935
Date
July -
Apr. 8
Feb. 15, 16Mar. 16Mar. 22Jan . 29Jan. 27
Apr. 5Feb. 19, 20Apr. 28Mar. 21Nov. 22
Apr. 8Feb. 26Mar. 25Mar. 9, 10Mar. 11, 17
Gage height (feet)
23.8
17.6
15.522.221.019.227.9
21.716.524.628.620.9
14.917.821.020.017.8
Calendar year
19361937193819391940
19411942194319441945
19461947194819491950
195119521953
Date
Apr. 15Apr. 13Apr. 14Mar. 6Feb. 22
Dec. 30Mar. 27, 28Mar. 27Apr. 3Dec. 31
Apr. 3Mar. 13, 18Dec. 6May 5Mar. 19
Dec. 28Mar. 29May 8
Gage height (feet)
23.620.722.222.120.9
19.422.123.523.620.0
21.720.723.521.516.3
17.821.521.9

GAGING STATION RECORDS 123
Apalachicola River Basin
(128) Chipola River near Altha, Fla.
Location. Lat 30°32'02", long 85°09'55", in NW£ sec. 32, T. 2 N., R. 9 W., on right bank ondownstream side of bridge on State Highway 274, 0.9 mile downstream from Holliman Branch, and 3-J miles southwest of Altha.
Drainage area. 781 sq mi.
Records available.--U. S. Geological Survey: November 1912 to December 1913, September 1921 to September 1927, August 1929 to September 1931, March 1943 to December 1953, dally gage heights and discharges.
Gage.--Water-stage recorder. Datum of gage is 19.95 ft above mean sea level (levels by Corps of Engineers). Prior to Jan. 13, 1950, staff, chain, or wire-weight gage at same site and datum.
Stage-discharge relation. Defined by current-meter measurements below 10,000 cfs and by slope- area measurement at 25,000 cfs.
Remarks.--Discharges for 1913, 1922-25 revised for this report.
Annual peak stages and discharges
Calendar year
1913
1922192319241925
1926
19291930
1931
Date
Mar. 22
June 2June 29Sept. 16Jan. 24
Sept. 20
Oct. 2Nov. 22
Aug. 17
Gage height (feet)
21.1
15.9820.717.623.7
33.55
25.2019.44
17.27
Discharge (cfs)
5,650
3,6205,4604,2007,010
25,000
7,9804,880
3,950
Calendar year
194319441945
19461947194819491950
195119521953
Date
Mar. 12Mar . 28Dec. 31
May 22Mar. 13Apr. 4, 5Feb. 7Sept. 1
Dec. 27Feb. 21Apr.. 13
Gage height (feet)
14.5819.1817.55
23.8526.4232.217.0222.5
12.2017.9319.12
Discharge (cfs)
2,9204,7804,040
7,0709,080
19,1003,8106,350
2,0604,1804,720

124 FTXDODS IN FLORIDA
Bear Creek Basin
(129) Econflna Creek near Bennett, Fla.
Location. Lat 30°23'04", long 85°33'24", In sec. 20, T. 1 S., R. 13 W., near left bank on downstream side of bridge on State Highway 388, 0.5 mile downstream from Old Mill Branch 1.6 miles southwest of Bennett. *
Drainage area. 182 sq mi.
Records available. U. S. Geological Survey: November 1935 to December 1953, dally gage and discharges.
Gage. Staff gage read once daily. Datum of gage is 1.03 ft above mean sea level, datum of
Stage-discharge relation.--Defined by current-meter measurements below 2,200 cfs.
Historical data. Maximum stage known, 15.0 ft, from floodmarks, either in September 1926 or April 1928 (based on a study of rainfall records) .
Annual peak stages and discharges
Calendar year
19361937193819391940
19411942194319441945
Date
Aug. 2Sept. 2July 28Aug. 15Feb. 18
Mar. 9Jan. 5May 26Sept. 12Sept. 15
Gage height (feet)
9.6011.006.84
10.508.46
8.298.167.80
10.609.22
Discharge (cfs)
1,3102,670
7082,2001,210
1,1501,1201,0002,2801,440
Calendar year
19461947194819491950
19511952
1953
Date
May 18Apr. 16Apr. 2Aug. 15Sept. 1
Mar . 20Feb. 18Sept. 22, 23Sept. 26
Gage height (feet)
9.969.44
12.4610.3010.34
6.907.44-
9.47
Discharge (cfs)
1,8201,5304,8602,0502,050
850-943
1,560
Choctawhatchee River Basin '
(130) Choctawhatchee River near New'ton, Ala.
Location.--Lat 31°21', long 85°37', in SE£ sec. 2, T. 4 N., R. 24 E., on left bank at downstream side of bridge on'U. S. Highway 231, 200 ft downstream from mill dam, 1,500 ft upstream from Hurricane Creek, 0.8 mile north of Newton, and 1 mile downstream from Atlantic Coast Line Railroad bridge.
Drainage area. 683 sq ml.
Records available. U. S. Geological Survey: June 1906 to August 1908, October 1911 to August 1912, dally gage heights. November 1921 to September 1927, May 1935 to December 1953, dally gage heights and discharges. U. S. Weather Bureau: January 1931 to December 1953, dally gage heights.
Gage_. Water-stage recorder. Datum of gage is 138.56 ft above mean sea level, datum of 1929, supplementary adjustment of 1943. Non-recording gage June 1906 to August 1908, October 1911 to August 1912, and recording gage from November 1921 to Sept. 30, 1927, at site 800 ft upstream, at different datum. Non-recording gage at present site from May 10, 1935, to Sept. 8, 1938, and recording gage thereafter.
Stage-discharge relation. Defined by current-meter measurements below 20,000 cfs.
Historical data. Flood of Mar. 15, 1929, reached a stage of 45 ft, from information by local residents.(This information is of doubtful accuracy and could not be substantiated in 1954),
Remarks. Gage-height records since 1931 are contained in reports of U. S. Weather Bureau, stage for Nov. 19, 1930, was computed on basis of U. S. Weather Bureau gage heights at Geneva and a stage-relation curve.
Peak
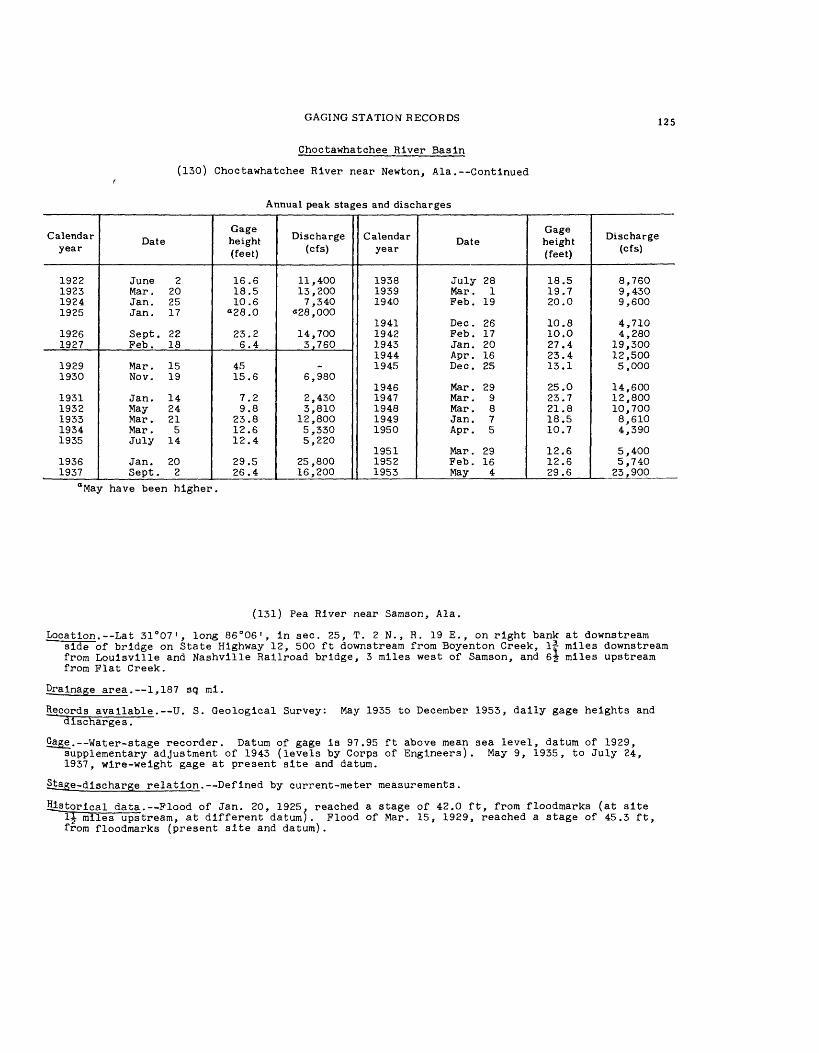
GAGING STATION RECORDS 125
Choctawhatchee River Basin
(130) Choctawhatchee River near Newton, Ala. Continued
Annual peak stages and discharges
Calendar year
1922192319241925
19261927
19291930
19311932193319341935
19361937
Date
June 2Mar . 20Jan . 25Jan. 17
Sept. 22Feb. 18
Mar . 15Nov. 19
Jan. 14May 24Mar . 21Mar. 5July 14
Jan. 20Sept. 2
Gage height (feet)
16.618.510.6
<>28.0
23.26.4
4515.6
7.29.8
23.812.612.4
29.526.4
Discharge (cfs)
11 , 40013,2007,340
a28,000
14,7003,760
-6,980
2,4303,810
12,8005,3305,220
25,80016,200
Calendar year
193819391940
19411942194319441945
19461947194819491950
195119521953
Date
July 28Mar. 1Feb. 19
Dec. 26Feb. 17Jan . 20Apr. 16Dec. 25
Mar. 29Mar. 9Mar. 8Jan. 7Apr. 5
Mar. 29Feb. 16May 4
Gage height (feet)
18.519.720.0
10.810.027.423.413.1
25.023.721.818.510.7
12.612.629.6
Discharge (cfs)
8,7609,4309,600
4,7104,280
19,30012,5005,000
14,60012,80010,7008,6104,390
5,4005,740
23,900
"May have been higher,
(131) Pea River near Samson, Ala.
Location. Lat 31°07', long 86°06', In sec. 25, T. 2 N., R. 19 E., on right bank at downstream side of bridge on State Highway 12, 500 ft downstream from Boyenton Creek, l£ miles downstream from Louisville and Nashville Railroad bridge, 3 miles west of Samson, and 6^ miles upstream from Flat Creek.
May 1935 to December 1953, dally gage heights and
Drainage area. 1,187 sq ml.
Records available. U. S. Geological Survey: discharges.
Gage. Water-stage recorder. Datum of gage la 97.95 ft above mean sea level, datum of 1929, supplementary adjustment of 1943 (levels by Corps of Engineers). May 9, 1935, to July 24, 1937, wire-weight gage at present site and datum.
Stage-discharge relation. Defined by current-meter measurements.
Historical data. Flood of Jan. 20, 1925. reached a stage of 42.0 ft, from floodmarks (at site ~l^ miles upstream, at different datum). Flood of Mar. 15, 1929, reached a stage of 45.3 ft, from floodmarks (present site and datum).

126 FLOODS IN FLORIDA
Choctawhatchee River Basin
(131) Pea River near Samson, Ala. Continued
Annual peak stages and discharges
Calendar year
1925
1929
19361937193819391940
194119421943
Date
Jan. 20
Mar. 15
Jan. 22Apr. 7Mar. 18Mar. 2Feb. 19
Dec. 29Apr. 11Jan. 21
Gage height (feet)
42.0
45.3
37.235.935.828.822.8
15.020.233.2
Discharge (cfs)
_
-
27,80023,40023,30014,2009,120
4,7907,460
19,200
Calendar year
19441945
19461947194819491950
195119521953
Date
Mar . 26Dec. 26
May 22Apr. 6Dec. 1May 3Sept. 2
Mar . 30Mar . 28Dec. 5
Gage height (feet)
33.422.5
30.526.729.924.019.5
19.524.731.7
- ̂
Discharge (cfs)
19,5008,920
16,00012,90015,70010,0007,100
7,10010,60017,400
(132) Choctawhatchee River at Caryvllle, Fla.
Location. Lat 30°46'32", long 85°49'40", in sec. 10, T. 4 N., R. 16 W., near right bank ondownstream side of bridge on U. S. Highway 90, 300 ft downstream from Louisville and Nashville Railroad bridge, three-quarters of a mile west of Caryville, and 1.8 miles downstream from Wrights Creek.
Drainage area, 3,499 sq ml.
Records available.--U. S. Weather Bureau: November 1928 to August 1929, dally gage heights. U. S. Geological Survey: August 1929 to December 1953, dally gage heights and discharges.
Gage. Wire-weight gage read twice dally. Datum of gage is 39.00 ft above mean sea level, datum of 1929. Prior to Oct. 12, 1929, staff gage and Oct. 12, 1929, to Sept. 11, 1951, water-stage recorder at same site and datum.
Stage-discharge relation. Defined by current-meter measurements below 50,000 cfs and by slope- area measurement at 206,000 cfs.
Historical data. Maximum stage known, 27.1 ft Mar. 17, 1929, from Weather Bureau records and floodmarks. Flood of Apr. 24, 1928, reached a stage of 21.6 ft, from Weather Bureau records.
Annual peak stages and discharges
Calendar year
192819291930
19311932193319341935
19361937193819391940
Date
Apr. 24Mar. 17Nov. 19
Jan. 21Jan. 16Mar . 24Mar. 8Mar. 12
Jan. 24Sept. 4Mar . 22Aug. 18Feb. 21, 22
Gage height (feet)
21.627.113.17
9.7812.1913.5812.2810.17
14.1615.5513.0314.8412.90
Discharge (cfs)
129,000206,00031,700
9,78023,40035,80024,00012,600
41,80056,60030,10045,80029,200
Calendar year
19411942194319441945
19461947194819491950
195119521953
Date
Dec. 29Jan. 5Jan. 24Mar. 28Dec. 29
Mar . 31Mar . 10Mar . 10Jan. 9Sept. 3
Apr. 2Feb. 19, 20Dec. 9
Gage height (feet)
10.4511.8613.4213.6012.22
14.0314.4614.4712.4612.44
11.1411.5215.50
Discharge (cfs)
13,70021,40033,80035,80023,300
39,80044,80044,80025,30025,100
16,50017,90054,800

GAGING STATION RECORDS 127
Choctawhatchee River Basin
/ (133) Choctawhatchee River near Bruce, Fla.
Location. Lat 30°27'03", long 85°53'54", in sec. 36, T. 1 N., R. 17 W., on downstream fender pile at center swing pier of bridge on State Highway 20, about 4 miles southeast of Bruce, and 5.8 miles downstream from Holmes Creek.
Drainage area. 4,384 sq mi.
Records available. U. S. Geological Survey: October 1930 to December 1953, dally gage heights and discharges.
Gage. Water-stage recorder. Datum of gage is 3.94 ft above mean sea level, datum of 1929. Prior to Apr. 6, 1934, staff gage at site 1 mile downstream at datum 0.25 ft lower.
Stage-discharge relation. Defined by current-meter measurements below 66,000 cfs and extended above on basis of records for station at Caryville.
Historical data. Maximum stage known about 25.0 ft, from floodmarks at former site and datum, in March 1929.
Annual peak stages and discharges
Calendar year
19291930
19311932193319341935
19361937193819391940
1941
Date
Mar.Nov. 22
Jan. 24Jan. 19Apr. 18Mar. 11Mar . 16
Jan. 10Sept. 6Mar. 24Aug. 19Feb. 23
Mar. 27
Gage height (feet)
25.012.25
7.8010.3012.4010.588.23
13.9616.0411.7816.6812.07
7.78
Discharge (cfs)
220,00039,100
12,10025,10040,70027.20013,600
49,50064,00030,90069,60033,000
12,400
Calendar year
1942194319441945
19461947194819491950
195119521953
Date
Jan. 5Jan. 26Mar . 30Dec. 31
Aug . 10Mar . 12Apr. 4May 6Sept. 5
Apr. 5Feb. 22Dec. 12
Gage height (feet)
12.4512.1312.9010.81
13.8814.7915.2210.9712.15
8.9310.1613.82
Discharge (cfs)
35 , 20033,00039,20024,500
47,20054,40057,60025,80033 , 400
15,90021,30046,600
Yellow River Basin
(134) Lightwood Knot Creek at Babble, Ala.
Location. Lat 31°16', long 86°19', in SW£ sec. 36, T. 4 N.. R. 17 E., on downstream side of right pier on U. S. Highway 84, 1 mile east of Babbie, l£ miles downstream from Poley Creek, 2 miles upstream from mouth, and 3-5 miles west of Opp.
Drainage area. 113 sq mi.
Records available. U. S. Geological Survey: February 1944 to April 1953, daily gage heights and discharges. Prior to October 1947, published as "Poley Creek".
_. Water-stage recorder. Prior to Dec. 30, 1947, wire-weight gage at same site and datum.
§tage-discharge relation. Defined by current-meter measurements below 9,000 cfs.

128. FLOODS IN FLORIDA
Yellow River Basin
(134) Lightwood Knot Creek at Babbie, Ala.--Continued
Annual peak stages and discharges
Calendar year
1944 1945
1946 1947 1948
Date
Sept. 11 Dec . 25
May 20 Apr. 16 Apr. 1
Gage height (feet)
11.9 7.8
8.6 7.5 7.6
Discharge (cfs)
12,100 3,500
5,100 3,260 3,440
Calendar year
1949 1950
1951 1952 1953
Date
Jan. 6 Apr. 5
Apr. 20 Mar. 24 May 6
Gage height (feet)
7.5 6.8
7.1 7.4 9.4
Discharge (cfs)
3,2602,000
1,6602,1006,700
(135) Yellow River at Milligan, Fla.
Location. Lat 30 0 45'10 n , long 86°37'45 n , in sec. 15, T. 3 N., R. 24 W., on right bank 10 ftdownstream from bridge on U. S. Highway 90, half a mile east of .Milligan, half a mile upstream from Trammel Creek, and 6£ miles upstream from Shoal River.
Drainage area. 624 sq mi.
Records available. U. S. Geological Survey: July 1938 to December 1953, daily gage heights and discharges.
Gage. Water-stage recorder. Datum of gage is 51.5S ft above mean sea level, datum of 1929. Prior to Dec. 6, 1939, staff gage at same site and datum.
Stage-discharge relation.--Defined by current-meter measurements below 24,000 cfs. Slight shifting at all stages.
Historical data. Floods of 1928 and 1929 reached stages of 20.2 f.t and 26.2 ft, respectively, from information by local residents.
Annual peak stages and discharges
Calendar year
19281929
19391940
19411942194319441945
Date
«.
Mar. -
Aug. 19July 8
Mar. 23, 24June 26Jan. 22Sept. 13Apr. 30
Gage height (feet)
20.226.2
12.4412.00
7.479.10
10.8013.298.84
Discharge (cfs)
-
14,70013,500
2,4304,8009,420
21,2004,140
Calendar year
19461947194819491950
195119521953
Date
Mar . 30Mar. 10Mar. 9May 3Sept. 2
Mar . 22Mar. 28Dec. 6
Gage height (feet)
11.1311.2011.239.129.67
8.038.85
15.13
Discharge (cfs)
11,30011,80011,8005,2607,000
2,9304,490
28,000

GAGING STATION RECORDS 129
Yellow River Basin
(136) Shoal River near Crestview, Fla. /
Location. --Lat 30°41'50", long 86°34'15", in sec. 5, T. 2 N., R. 23 W., on right bank on down stream side of bridge on State Highway 85, 3^ miles downstream from Titi Creek, 4-5- miles south of Crestview, and 7 miles upstream from mouth.
Drainage area. 474 sq mi.
Records available. U. S. Geological Survey: July 1938 to December 1953, daily gage heights and discharges.
Gage. Water-stage recorder. Datum of gage is 47.21 ft above mean sea level, datum of 1929. Prior to Feb. 12, 1939, staff gage at same site and datum.
Stage-discharge relation. Defined by current-meter measurements. Slight shifting at medium and low stages.
Historical data. Flood of March 1929 reached a stage of about 17 ft, from floodmarks.
Annual peak stages and discharges
Calendar year
1929
19391940
19411942194319441945
Date
Mar. -
Aug. 18July 7
July 7Jan. 3Mar. 8Sept. 12Jan. 8
Gage height (feet)
about 17
11.1814.26
7.268.337.15
11.057.67
Discharge (cfs)
_
13,40021,700
3,7005,9603,520
13,0004,560
Calendar year
19461947194819491950
195119521953
Date
Mar . 29Mar. 9Apr. 3Apr. 14Sept. 2
Mar . 20Feb. 16, 17Sept. 28
Gage height (feet)
9.2312.579.547.68
10.38
7.566.96
13.93
Discharge (cfs)
8,03017,1008,8704,650
11,200
4,3803,120
20,000
(137) Yellow River near Holt, Fla.
Location.--Lat 30°40'25", long 86°44'50", in sec. 16, T. 2 N., R. 25 W., at county highway bridge 2^- miles south of Holt.
Drainage area. 1,220 sq mi, approximately.
Records available.--U. S. Geological Surveys October 1933 to September 1941, daily gage heights and discharges.
. Staff gage read once daily. Datum of gage is 17.95 ft above mean sea level, datum of 1929.
Sta^e-discharge relation. Defined by current-meter measurements below 18,000 cfs. Considerable shifting at all stages.
Historical data.--Flood of March 1929 reached a stage of 25.4 ft, from information by local residents.

130 FLOODS IN FLORIDA
Yellow River Basin
(137) Yellow River near Holt, Fla.--Continued
Annual peak stages and discharges
Calendar year
1929
1934 1935
1936
Date
Mar. -
Oct. 9 Mar. 13
Jan. 22
Gage height (feet)
25.4
12.80 7.20
11.48
Discharge (cfs)
-
25,000 4,850
16,600
Calendar year
1937 19381939 1940
1941
Date
Apr. 9 Mar. 21Aug. 19 July 9
July 8
Gage height (feet)
11.02 8.50
13.90 15.62
7.76
Dischar,, (cfs)
16,300 7.900
27,800 35,100
Ii£20
Blackwater River Basin
(138) Coldwater Creek near Milton, Fla.
Location. Lat 30°42'30", long 86°58'20", In sec. 5, T. 2 N., R. 27 W., on right bank at down- stream side of bridge on State Highway 191, 2£ miles upstream from mouth and 6^ miles northeast of Milton.
Drainage area. 237 sq ml.
Records available. U. S. Geological Survey: November 1938 to December 1953, dally gage height* and discharges.
Gage. Water-stage recorder. Datum of gage Is 9.10 ft above mean sea level, datum of 1929. Prior to Dec. 2, 1938, staff gage at same site and datum.
Stage-discharge relation. Defined by current-meter measurements below 18,000 cfs.
Annual peak stages and discharges
Calendar year
19391940
19411942194319441945
1946
Date
Aug. 17July 6
Mar . 21Sept. 27Jan. 20Sept. 11Dec. 26
July 31
Gage height (feet)
17.3310.64
5.557.498.33
13.6110.23
9.64
Discharge (cfs)
23,1007,810
1,7903,7404,620
13,8007,120
6,260
Calendar year
1947194819491950
195119521953
Date
Mar. 8Mar. 7Apr . 30Sept. 1
Mar . 20Mar . 25Dec. 7
Gage height (feet)
11.909.596.868.32
8.716.528.85
Discharge (cfs)
10,4006,2603,0004,640
5,1002,6104,490
- »

GAGING STATION RECOKDS 131
Escambia River Basin
(139) Conecuh River near Andalusia, Ala.
Location. Lat 31°16', long 86°56', in NE-j sec. 1, T. 5 N., R. 14 E., on left bank on downstream side of Simmons Bridge on State Highway 83, ~l\ miles southwest of Andalusia, and 10-| miles downstream from Patsaliga Creek.
Drainage area.--1,545 sq mi.
Records available. U. S. Geological Survey: August 1904 to December 1919, September 1929 to December 1955, daily gage heights and discharges. Records published as "at Beck" 1904-19.
Gage. Water-stage recorder. Datum of gage is 106.77 ft above mean sea level, datum of 1929, supplementary adjustment of 1945 (levels by Corps of Engineers). Aug. 21, 1904, to Dec. 31, 1919, chain gage at same site and datum.
Stage-discharge relation. Defined by current-meter measurements below 57,000 cfs and by slope- area determination at 154,000 cfs.
Remarks. Annual floods listed for 1905-19 are mean daily discharges; peak discharges undeter mined but probably did not exceed the figures shown by more than 10 percent.
Annual peak stages and discharges
Calendar year
1905
19061907190819091910
19111912191319141915
1916191719181919
19291930
193119321933
Date
Feb. 18
Oct. 4Dec. 31Mar. 28June 7Apr. 22
Apr. 13Apr. 22Mar. 19Feb. 10Jan . 25
July 8Oct. 3Dec. 26Feb. 25
Mar. 15Nov. 20
Apr. 6Feb. 24Mar. 24
Gage height (feet)
24.1
17.625.131.925.316.0
14.231.639.27.7
15.5
29.929.134.531.5
47.626.1
17.715.929.6
Discharge (cfs)
11 , 400
7,90012,00019,00012,2007,100
6,10018,50042,0002,9006,800
16,00015,00024,60018,400
154,00012,900
6,8005,920
16,800
Calendar year
19341935
19361937193819391940
19411942194319441945
19461947194819491950
195119521953
Date
Mar. 9Mar. 11
Jan . 20Apr. 9Mar. 17Aug. 20Feb. 18
Dec. 30Jan. 2Mar. 24Mar. 25Apr. 29
May 22Apr. 6Nov. 30May 5Apr. 9
Apr. 21Mar. 29Dec. 8
Gage height (feet)
24.127.2
34.235.837.338.425.2
20.621.837.436.320.5
30.729.437.522.223.6
17.830.731.9
Discharge (cfs)
11,30013,900
24,80028,40030,90035,90011,400
8,6009,290
32,00029,8008,550
17,20015,30035 , 400
9,75010,300
7,30016,90019,000

132 FLOODS IN FLORIDA
Escambia River Basin
(140) Sepulga River near McKenzie, Ala.
Location.--Lat 31°27', long 86°47', in SE£ sec. 30, T. 6 N., R. 13 E., on left bank at uuwnstr side of Watt Bridge on U. S. Highway 31, three-eights of a mile upstream from Old Town Creek* 2-| miles upstream from Piney Woods Creek, 5^ miles downstream from Persimmon Creek, and 7 miles southwest of McKenzie.
Drainage area. 464 sq mi.
Records available. U. S. Geological Survey: October 1937 to December 1953, daily gage heights and discharges.
andGage. Water-stage recorder. Datum of gage is 155.96 ft above mean sea level, unadjusted
(levels by Corps of Engineers). Prior to Mar. 25, 1939, wire-weight gage at same site datum.
Stage-discharge relation. Defined by current-meter measurements below 25,000 cfs.
Historical data.--The flood of March 1929 reached a stage of about 33 ft, from Information by local residents.
Annual peak stages and discharges
Calendar year
1929
193819391940
19411942194319441945
Date
Mar.
Mar. 17Aug. 18Feb. 20
Dec. 26Mar. 24Mar. 23Mar. 31Dec. 27
Gage height (feet)
33
24.519.516.0
13.511.421.822.38.2
Discharge (cfs)
_
28,10013,4009,000
7,1005,750
19,10020,6003,290
Calendar year
19461947194819491950
195119521953
Date
Jan. 8Apr. 4Nov. 28May 4July 30
Apr. 21Mar. 25Dec. 8
Gage height (feet)
21.916.523.611.97.7
12.911.614.1
Discharge (cfs)
19,4009,470
21,2006,1202,950
6,9205,8807,940
(141) Pigeon Creek near Thad, Ala.
Location. Lat 31°29', long 86°39', in Nj sec. 21, T. 6 N., R. 14 E., on left bank neardownstream side of bridge on U. S. Highway 84, lj miles upstream from Louisville and Nashville Railroad bridge, 2 miles southeast of Thad, 3 miles upstream from Reedy Creek, and 5-| miles southeast of McKenzie.
Drainage area.--296 sq mi.
Records available. U. S. Geological Survey: October 1937 to December 1953, daily gage heights and discharges.
Gage. Water-stage recorder. Datum of gage is 172.58 ft above mean sea level, datum of 1929, supplementary adjustment of 1943. Prior to Oct. 24, 1938, wire-weight gage at same site and datum.
Stage-discharge relation.--Defined by current-meter measurements below 14,000 cfs.
Historical data.--The flood of March 1929 reached a stage of about 30 ft, from information by local residents.

GAGING STATION RECORDS 133
Escambia River Basin
(141) Pigeon Creek near Thad, Ala. Continued
Annual peak stages and discharges
Calendar year
1929
193819391940
19411942194319441945
Date
Mar.
Mar. 18Aug. 17, 18Feb. 18
Dec. 27Mar. 25Mar. 23Apr. 28Dec. 30
Gage height (feet)
30
26.125.317.6
20.615.925.225.013.1
Discharge (cfs)
14,40012,6003,740
5,7302,820
13,40012,8001,710
Calendar year
19461947194819491950
195119521953
Date
Jan. 8Apr. 5Nov. 29July 19July 29
Apr. 20Mar. 25Dec. 7
Gage height (feet)
25.118.527.116.510.1
14.916.620.6
Discharge (cfs)
12,6004,220
17,1003,2701,110
2,5203,3205,860
(142) Conecuh River near Brooklyn, Ala.
Location. Lat 31°10 ! , long 86°48 ! , in W^ sec. 6, T. 2 N., R. 13 E., on downstream side of right pier of bridge on U. S. Highway 29, 3 miles downstream from Sepulga River and 7 miles southwest of Brooklyn.
Drainage area. 2,460 sq mi.
Records available. U. S. Geological Survey: May 1935 to December 1953, daily gage heights and discharges.
Gage. Water-stage recorder. Datum of gage is 76.95 ft above mean sea level, datum of 1929, supplementary adjustment of 1943. Prior to Sept. 5, 1937, wire-weight gage at same site and datum.
Stage-discharge relation. Defined by current-meter measurements.
Historical data. The flood of March 1929 reached a stage of about 47 ft, from information by Alabama State Highway Department.
Annual peak stages and discharges
Calendar year
1929
19361937193819391940
1941194219431944
Date
Mar.
Jan. 22Apr. 9Mar. 20Aug. 21Feb. 22
Dec. 29Jan. 4Mar. 25Mar. 27
Gage height (feet)
47
34.436.638.037.828.0
23.323.337.837.1
Discharge (cfs)
-
39,00050,10060,70059,10021,300
14,40014,40059,10053,300
Calendar year
1945
19461947194819491950
195119521953
Date
Apr. 30
May 25Apr. 7Dec. 1May 5Apr . 10
Apr. 23Mar. 29Dec. 10
Gage height (feet)
21.8
31.430.138.623.418.8
23.727.230.7
Discharge (cfs)
14,300
29,90027,00067,30016,40010,800
16,80021,90028,300

134 FLOODS IN FLORIDA
Escambia River Basin
(143) Murder Creek near Evergreen, Ala.
Location. Lat 31°25', long 87°00', in NW-J- sec. 8, T. 5 N., R. 11 E., on left bank near upstream side of bridge on U. S. Highway 31, 1 mile upstream from Louisville and Nashville Railroad bridge and 2^ miles southwest of Evergreen.
Drainage area.--170 sq mi.
Records available. U. S. Geological Survey: October 1937 to December 1953, daily gage heights and discharges.
Gage. Water-stage recorder. Datum of gage is 178.29 ft above mean sea level, datum of 1929, supplementary adjustment of 1943 (levels by Corps of Engineers). Prior to Mar. 25, 1939, wire-weight gage at same site and datum.
Stage-discharge relation.--Defined by current-meter measurements below 10,000 cfs and extended above on basis of records for Sepulga River near Mc-Kenzie.
Historical data.--The flood of March 1929 reached a stage of 26.6 ft, from information by local residents.
Annual peak stages and discharges
Calendar year
1929
193819391940
19411942194319441945
Date
Mar. -
Mar. 16Mar. 30Dec. 17
Dec. 24Apr. 10Nov. 8Mar. 29Apr. 29
Gage height (feet)
26.6
16.612.311.0
11.510.212.812.610.3
Discharge (cfs)
_
20,0005,6103,010
3,9001,8706,8006,6602,090
Calendar year
19461947194819491950
195119521953
Date
Jan. 7Apr. 2Nov. 27May 2Apr. 5
Mar. 29Mar. 24Dec. 4
Gageheight (feet)
12.611.013.5
-8.9
10.010.210.9
Discharge (cfs)
6,9003,180
10,000 3,5001,190
2,2202,4002,840
*No gage-height record; peak discharge estimated on basis of records for Escambia River at Flomaton and Sepulga River near McKenzie.
(144) Escambia Creek at Flomaton, Ala.
Location. Lat 31°01', long 87°15', in NE£ sec. 33, T. 1 N., R. 8 E., on downstream side of left pier of bridge on U. S. Highway 31 at north edge of Flomaton, l£ miles upstream from Louis ville and Nashville Railroad bridge, if miles upstream from Alabama-Florida State line, and 4 miles upstream from mouth.
Drainage area. 323 sq mi.
Records available. U. S. Geological Survey: January 1939 to December 1951, daily gage heights and discharges. 1952, 1953, annual flood peaks. Prior to October 1949 published as "Escambia River".
Gage. Water-stage recorder. Datum of gage is 52.40 ft above mean sea level, datum of 1929.Prior to June 1, 1942, at site 400 ft upstream at same datum. Since January 1952, crest-stage gage..
Stage-discharge relation.--Defined by current-meter measurements below 10,000 cfs and by slope- area determination at 41,400 cfs.
Historical data. The flood of March 1929 reached a stage of 25.9 ft, from information furnished by Alabama State Highway Department. Flood of Mar. 17, 1938, reached a stage of 18.0 ft, from floodmarks.

GAGING STATION RECORDS 135
Escambia River Basin
(144) Escambia Creek at Plomaton, Ala. Continued
Annual peak stages and discharges
Calendar year
1929
193819391940
19411942194319441945
Date
Mar. -
Mar. 17Sept. 27May 1
Dec. 24Jan. 2Nov. 9Mar . 23Apr . 29
Gage height (feet)
25.9
18.019.310.4
8.011.910.812.29.6
Discharge (cfs)
_
33,00041 , 4006,250
3,8008,2507,4309,9905,850
Calendar year
19461947194819491950
195119521953
Date
Mar. 29Mar. 8Nov. 28May 2Apr . 5
Mar. 19Mar. 24Dec. 6
Gage height (feet)
10.611.114.510.68.9
10.39.0
11.8
Discharge (cfs)
7,0607,880
15,4006,8104,570
6,3304,6708,870
(145) Escambia River near Century, Fla.
Location. Lat 30°57'25", long 87°14'00", in sec. 10, T. 5 N., R. 30 W., on left bank 16 ft downstream from bridge on State Highway 4, 1.2 miles downstream from Escambia Creek, and 1^- miles east of Century.
Drainage area.--5,817 sq mi.
Records available. U. S. Geological Survey: October 1934 to December 1953, dally gage heights and discharges.
Gage. Water-stage recorder. Datum of gage is 28.34 ft above mean sea level (State Road Department benchmark). Prior to Jan. 13, 1940, wire-weight gage at same site and datum.
Stage-discharge relation. Defined by current-meter measurements below 72,000 cfs.
Historical data. Maximum stage known, 37.8 ft in March 1929, from information by local residents (affected by failure of a dam upstream).
Annual peak stages and discharges
Calendar year
1929
1935
19361937193819391940
194119421943
Date
Mar.
Mar. 9
Jan. 3Apr. 11Mar. 22Aug. 22July 11
Mar. 10Jan. 3Mar. 26, 27
Gage height (feet)
37.8
17.72
19.4020.0520.6620.1017.56
13.1117.4120.57
Discharge (cfs)
315,000
33,300
57,10064,40073,90069,80032,700
11,00030,30072,600
Calendar year
19441945
19461947194819491950
195119521953
Date
Mar. 30May 1
Mar. 29Apr. 17Dec. 2May 3Apr. 6
Apr. 24Mar. 26Dec. 7
Gage height (feet)
20.0016.57
17.6917.6820.4317.1315.38
16.4917.2518.59
Discharge (cfs)
64,40022,700
53 , 90033,90070,20027,70017,400
23,10028,80045,300

136' FLOODS IN FLORIDA
Perdldo River Basin
(146) Perdldo River at Barrlneau Park, Fla.
Location.--Lat 30°41'25", long 87°26'25", In sec. 15, T. 2 N., R. 32 W., on right bank 25 ft downstream from'highway bridge, 1,000 ft downstream from Alligator Creek, and half a mile southwest of Barrlneau Park.
Drainage area. 394 sq ml.
Records available. U. S. Geological Survey: June 1941 to December 1953, dally gage heights and discharges.
Gage. Water-stage recorder. Datum of gage Is 25.71 ft above mean sea level, datum of 1929. Prior to Aug. 22, 1949, staff gage at same site and datum.
Stage-discharge relation. Defined by current-meter measurements below 5,500 cfs. Sight shifting at all stages.
Historical data.--Maximum stage known, 25.7 ft Mar. 15, 1929, from information by local residents.
Annual peak stages and discharges
Calendar year
1929
1942194319441945
1946
Date
Mar. 15
Jan. 3Jan. 19Mar. 24Apr. 23
Mar. 29
Gage height (feet)
25.7
-12.0416.178.16
14.33
Discharge (cfs)
_
«9,2005,2609,3902,570
7,390
Calendar year
1947194819491950
195119521953
Date
Mar. 9Nov. 29Mar. 24Apr. 6
Mar. 21Feb. 17Dec. 6
Gage height (feet)
15.6213.514.3014.07
14.4JS9.40
^6.60
Discharge (cfs)
8,7406,6007,3906,800
7,1503,250
11,100Result of discharge measurement.
INT.-HUP. SXC.. (ASH.. D.C. 51SUK